Cities with the Lowest Percentage of Births to Unmarried Women over the Age of 35 in Arizona
RELATED REPORTS & OPTIONS
Lowest Illegitimacy | Women 35+
Arizona
Compare Cities
Map of Cities with the Lowest Percentage of Births to Unmarried Women over the Age of 35 in Arizona
100.0%
0.0%
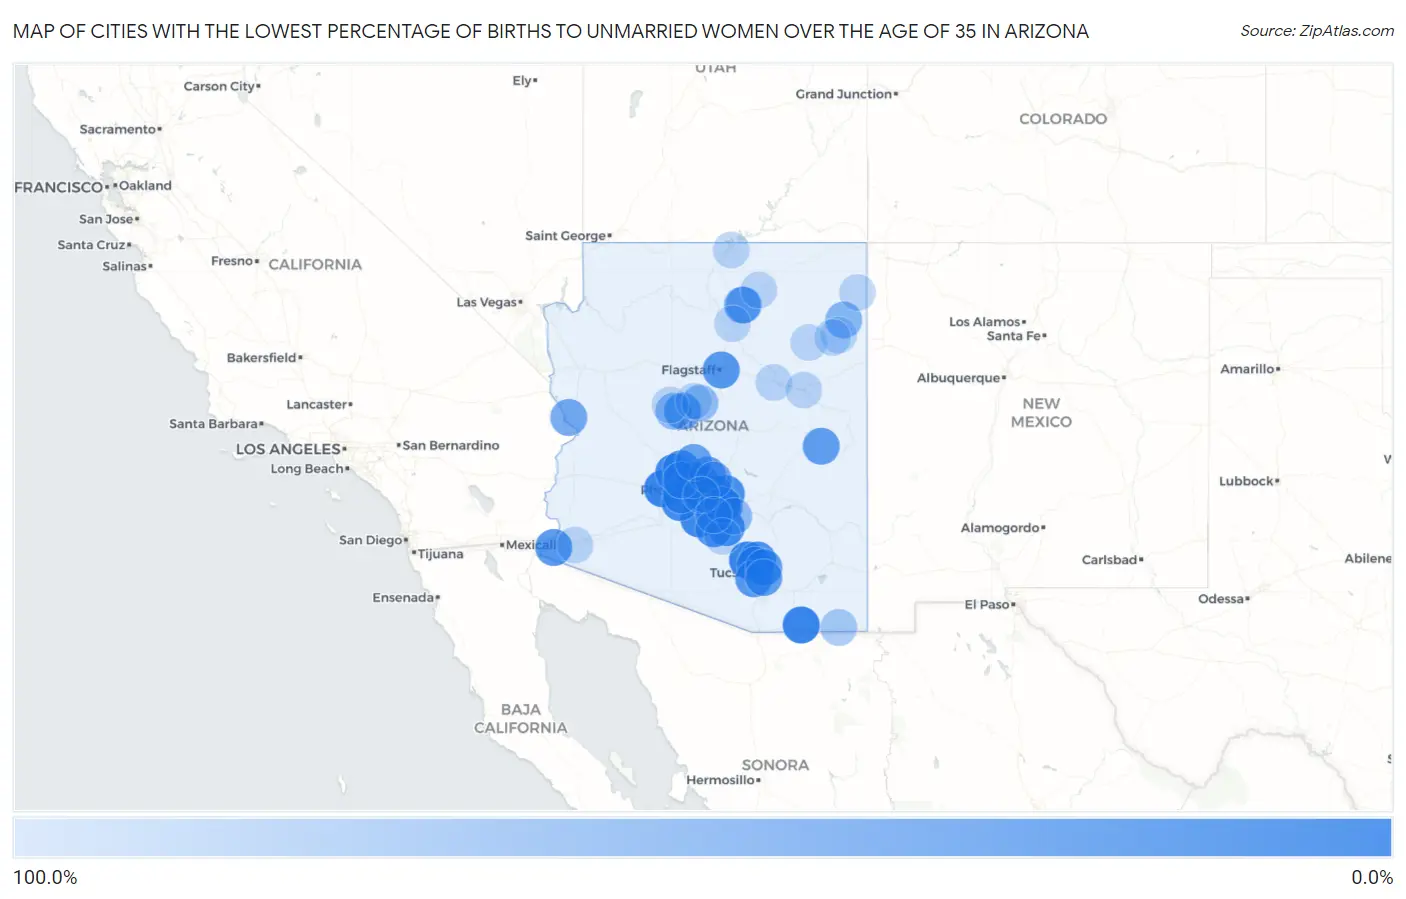
Cities with the Lowest Percentage of Births to Unmarried Women over the Age of 35 in Arizona
| City | % Unmarried | vs State | vs National | |
| 1. | Buckeye | 3.5% | 23.9%(-20.4)#1 | 20.1%(-16.6)#62 |
| 2. | Marana | 3.5% | 23.9%(-20.4)#2 | 20.1%(-16.6)#63 |
| 3. | Sierra Vista Southeast | 3.8% | 23.9%(-20.1)#3 | 20.1%(-16.3)#75 |
| 4. | San Tan Valley | 4.8% | 23.9%(-19.1)#4 | 20.1%(-15.3)#108 |
| 5. | Maricopa | 8.1% | 23.9%(-15.8)#5 | 20.1%(-12.0)#262 |
| 6. | Chandler | 9.5% | 23.9%(-14.4)#6 | 20.1%(-10.6)#320 |
| 7. | Surprise | 10.7% | 23.9%(-13.2)#7 | 20.1%(-9.40)#376 |
| 8. | Goodyear | 11.5% | 23.9%(-12.4)#8 | 20.1%(-8.60)#411 |
| 9. | Gilbert | 14.0% | 23.9%(-9.90)#9 | 20.1%(-6.10)#547 |
| 10. | Paradise Valley | 14.7% | 23.9%(-9.20)#10 | 20.1%(-5.40)#603 |
| 11. | Apache Junction | 17.3% | 23.9%(-6.60)#11 | 20.1%(-2.80)#742 |
| 12. | Tempe | 18.0% | 23.9%(-5.90)#12 | 20.1%(-2.10)#780 |
| 13. | Coolidge | 18.5% | 23.9%(-5.40)#13 | 20.1%(-1.60)#812 |
| 14. | Mesa | 18.6% | 23.9%(-5.30)#14 | 20.1%(-1.50)#814 |
| 15. | Glendale | 18.8% | 23.9%(-5.10)#15 | 20.1%(-1.30)#823 |
| 16. | Oro Valley | 19.1% | 23.9%(-4.80)#16 | 20.1%(-1.00)#837 |
| 17. | Peoria | 20.1% | 23.9%(-3.80)#17 | 20.1%(=0.000)#882 |
| 18. | Casa Grande | 20.2% | 23.9%(-3.70)#18 | 20.1%(+0.100)#889 |
| 19. | Casas Adobes | 23.2% | 23.9%(-0.700)#19 | 20.1%(+3.10)#1,028 |
| 20. | Flagstaff | 26.5% | 23.9%(+2.60)#20 | 20.1%(+6.40)#1,179 |
| 21. | Yuma | 27.4% | 23.9%(+3.50)#21 | 20.1%(+7.30)#1,223 |
| 22. | Drexel Heights | 28.2% | 23.9%(+4.30)#22 | 20.1%(+8.10)#1,259 |
| 23. | Avondale | 28.3% | 23.9%(+4.40)#23 | 20.1%(+8.20)#1,264 |
| 24. | Phoenix | 28.4% | 23.9%(+4.50)#24 | 20.1%(+8.30)#1,268 |
| 25. | El Mirage | 28.9% | 23.9%(+5.00)#25 | 20.1%(+8.80)#1,292 |
| 26. | Catalina Foothills | 29.2% | 23.9%(+5.30)#26 | 20.1%(+9.10)#1,304 |
| 27. | Scottsdale | 30.4% | 23.9%(+6.50)#27 | 20.1%(+10.3)#1,359 |
| 28. | Tuba City | 33.3% | 23.9%(+9.40)#28 | 20.1%(+13.2)#1,477 |
| 29. | Mcnary | 33.3% | 23.9%(+9.40)#29 | 20.1%(+13.2)#1,496 |
| 30. | Queen Creek | 34.7% | 23.9%(+10.8)#30 | 20.1%(+14.6)#1,546 |
| 31. | Tucson | 35.1% | 23.9%(+11.2)#31 | 20.1%(+15.0)#1,567 |
| 32. | Anthem | 40.0% | 23.9%(+16.1)#32 | 20.1%(+19.9)#1,735 |
| 33. | Prescott Valley | 42.3% | 23.9%(+18.4)#33 | 20.1%(+22.2)#1,817 |
| 34. | Lake Havasu City | 47.5% | 23.9%(+23.6)#34 | 20.1%(+27.4)#1,972 |
| 35. | Fountain Hills | 53.8% | 23.9%(+29.9)#35 | 20.1%(+33.7)#2,162 |
| 36. | Nazlini | 63.6% | 23.9%(+39.7)#36 | 20.1%(+43.5)#2,387 |
| 37. | Florence | 70.0% | 23.9%(+46.1)#37 | 20.1%(+49.9)#2,509 |
| 38. | Prescott | 71.0% | 23.9%(+47.1)#38 | 20.1%(+50.9)#2,516 |
| 39. | Douglas | 86.3% | 23.9%(+62.4)#39 | 20.1%(+66.2)#2,683 |
| 40. | Eloy | 100.0% | 23.9%(+76.1)#40 | 20.1%(+79.9)#2,808 |
| 41. | Cottonwood | 100.0% | 23.9%(+76.1)#41 | 20.1%(+79.9)#2,860 |
| 42. | Verde Village | 100.0% | 23.9%(+76.1)#42 | 20.1%(+79.9)#2,865 |
| 43. | Winslow | 100.0% | 23.9%(+76.1)#43 | 20.1%(+79.9)#2,952 |
| 44. | Williamson | 100.0% | 23.9%(+76.1)#44 | 20.1%(+79.9)#3,056 |
| 45. | Guadalupe | 100.0% | 23.9%(+76.1)#45 | 20.1%(+79.9)#3,102 |
| 46. | Holbrook | 100.0% | 23.9%(+76.1)#46 | 20.1%(+79.9)#3,128 |
| 47. | Sacaton | 100.0% | 23.9%(+76.1)#47 | 20.1%(+79.9)#3,325 |
| 48. | Wellton | 100.0% | 23.9%(+76.1)#48 | 20.1%(+79.9)#3,383 |
| 49. | Tsaile | 100.0% | 23.9%(+76.1)#49 | 20.1%(+79.9)#3,567 |
| 50. | Lechee | 100.0% | 23.9%(+76.1)#50 | 20.1%(+79.9)#3,578 |
| 51. | Moenkopi | 100.0% | 23.9%(+76.1)#51 | 20.1%(+79.9)#3,693 |
| 52. | Whitecone | 100.0% | 23.9%(+76.1)#52 | 20.1%(+79.9)#3,752 |
| 53. | Cameron | 100.0% | 23.9%(+76.1)#53 | 20.1%(+79.9)#3,799 |
| 54. | Ganado | 100.0% | 23.9%(+76.1)#54 | 20.1%(+79.9)#3,826 |
| 55. | Jerome | 100.0% | 23.9%(+76.1)#55 | 20.1%(+79.9)#4,018 |
| 56. | Cornfields | 100.0% | 23.9%(+76.1)#56 | 20.1%(+79.9)#4,065 |
| 57. | Tonalea | 100.0% | 23.9%(+76.1)#57 | 20.1%(+79.9)#4,143 |
Common Questions
What are the Top 10 Cities with the Lowest Percentage of Births to Unmarried Women over the Age of 35 in Arizona?
Top 10 Cities with the Lowest Percentage of Births to Unmarried Women over the Age of 35 in Arizona are:
#1
0.0%
#2
0.0%
#3
0.0%
#4
0.0%
#5
0.0%
#6
0.0%
#7
0.0%
#8
0.0%
#9
0.0%
#10
0.0%
What city has the Lowest Percentage of Births to Unmarried Women over the Age of 35 in Arizona?
Buckeye has the Lowest Percentage of Births to Unmarried Women over the Age of 35 in Arizona with 3.5%.
What is the Percentage of Births to Unmarried Women over the Age of 35 in the State of Arizona?
Percentage of Births to Unmarried Women over the Age of 35 in Arizona is 23.9%.
What is the Percentage of Births to Unmarried Women over the Age of 35 in the United States?
Percentage of Births to Unmarried Women over the Age of 35 in the United States is 20.1%.