Cities with the Lowest Percentage of Births to Unmarried Women over the Age of 35 in Indiana
RELATED REPORTS & OPTIONS
Lowest Illegitimacy | Women 35+
Indiana
Compare Cities
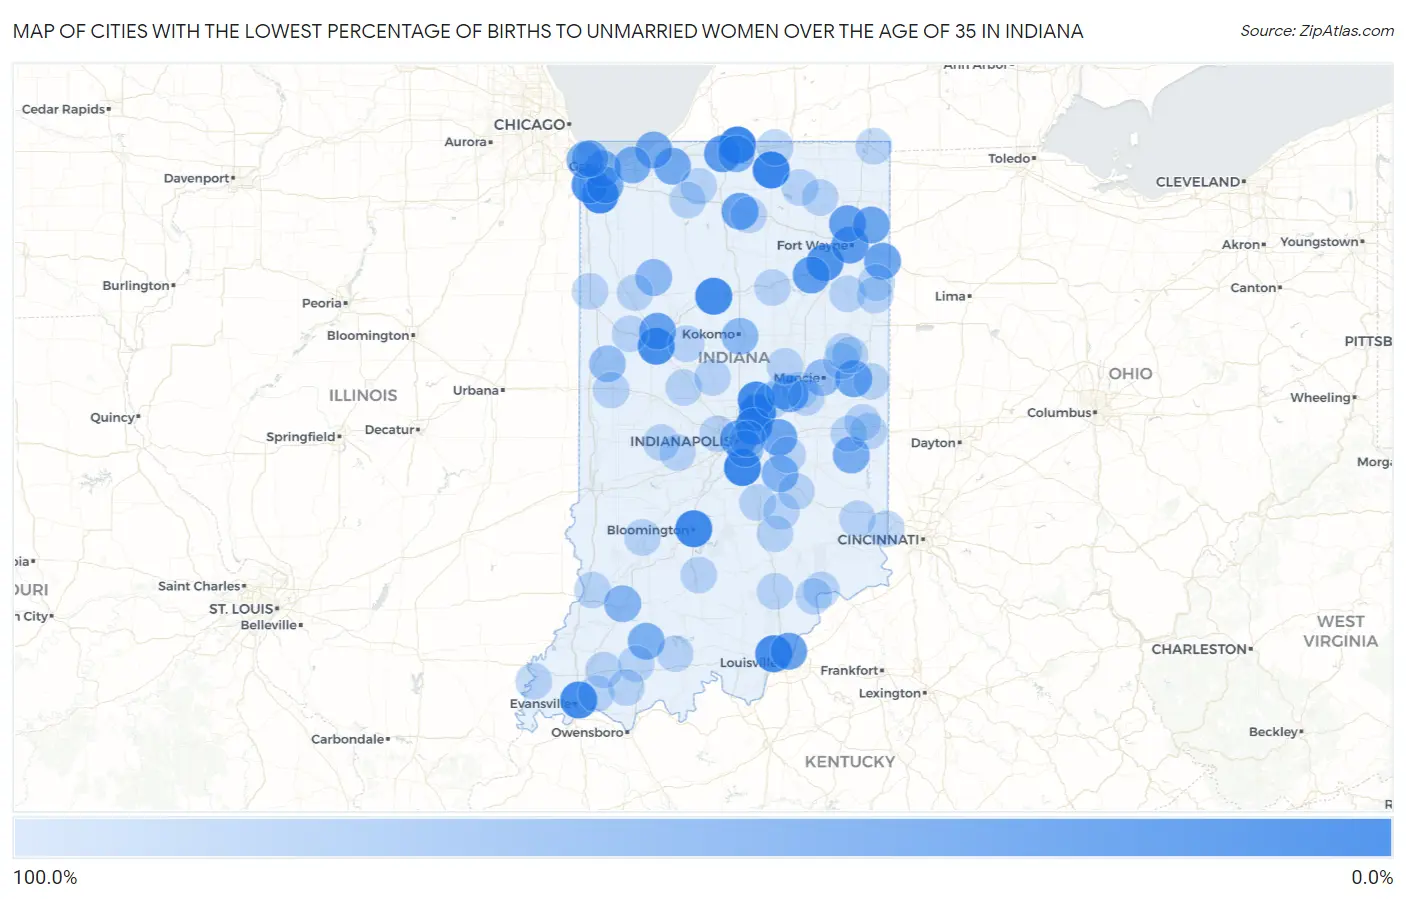
Map of Cities with the Lowest Percentage of Births to Unmarried Women over the Age of 35 in Indiana
100.0%
0.0%
Cities with the Lowest Percentage of Births to Unmarried Women over the Age of 35 in Indiana
| City | % Unmarried | vs State | vs National | |
| 1. | Goshen | 1.9% | 22.1%(-20.2)#1 | 20.1%(-18.2)#20 |
| 2. | Crown Point | 5.4% | 22.1%(-16.7)#2 | 20.1%(-14.7)#139 |
| 3. | Granger | 5.8% | 22.1%(-16.3)#3 | 20.1%(-14.3)#154 |
| 4. | Greenwood | 5.9% | 22.1%(-16.2)#4 | 20.1%(-14.2)#161 |
| 5. | Fishers | 6.2% | 22.1%(-15.9)#5 | 20.1%(-13.9)#170 |
| 6. | Bloomington | 8.7% | 22.1%(-13.4)#6 | 20.1%(-11.4)#285 |
| 7. | Evansville | 10.9% | 22.1%(-11.2)#7 | 20.1%(-9.20)#384 |
| 8. | Logansport | 11.3% | 22.1%(-10.8)#8 | 20.1%(-8.80)#400 |
| 9. | Noblesville | 12.6% | 22.1%(-9.50)#9 | 20.1%(-7.50)#467 |
| 10. | New Albany | 12.8% | 22.1%(-9.30)#10 | 20.1%(-7.30)#479 |
| 11. | Lawrence | 13.5% | 22.1%(-8.60)#11 | 20.1%(-6.60)#518 |
| 12. | Lafayette | 16.9% | 22.1%(-5.20)#12 | 20.1%(-3.20)#724 |
| 13. | Roanoke | 20.8% | 22.1%(-1.30)#13 | 20.1%(+0.700)#925 |
| 14. | Schererville | 22.0% | 22.1%(-0.100)#14 | 20.1%(+1.90)#981 |
| 15. | Fort Wayne | 29.3% | 22.1%(+7.20)#15 | 20.1%(+9.20)#1,312 |
| 16. | South Bend | 31.0% | 22.1%(+8.90)#16 | 20.1%(+10.9)#1,382 |
| 17. | Huntington | 33.9% | 22.1%(+11.8)#17 | 20.1%(+13.8)#1,520 |
| 18. | Anderson | 35.7% | 22.1%(+13.6)#18 | 20.1%(+15.6)#1,586 |
| 19. | Jeffersonville | 37.3% | 22.1%(+15.2)#19 | 20.1%(+17.2)#1,644 |
| 20. | Huntertown | 37.5% | 22.1%(+15.4)#20 | 20.1%(+17.4)#1,656 |
| 21. | Indianapolis | 39.4% | 22.1%(+17.3)#21 | 20.1%(+19.3)#1,722 |
| 22. | Battle Ground | 40.0% | 22.1%(+17.9)#22 | 20.1%(+19.9)#1,750 |
| 23. | Bourbon | 40.0% | 22.1%(+17.9)#23 | 20.1%(+19.9)#1,752 |
| 24. | Monroeville | 41.7% | 22.1%(+19.6)#24 | 20.1%(+21.6)#1,806 |
| 25. | Farmland | 42.9% | 22.1%(+20.8)#25 | 20.1%(+22.8)#1,842 |
| 26. | Greenfield | 43.8% | 22.1%(+21.7)#26 | 20.1%(+23.7)#1,862 |
| 27. | Grabill | 44.4% | 22.1%(+22.3)#27 | 20.1%(+24.3)#1,891 |
| 28. | La Porte | 47.5% | 22.1%(+25.4)#28 | 20.1%(+27.4)#1,973 |
| 29. | Gary | 49.4% | 22.1%(+27.3)#29 | 20.1%(+29.3)#2,017 |
| 30. | Merrillville | 50.9% | 22.1%(+28.8)#30 | 20.1%(+30.8)#2,092 |
| 31. | Michigan City | 50.9% | 22.1%(+28.8)#31 | 20.1%(+30.8)#2,094 |
| 32. | Connersville | 52.4% | 22.1%(+30.3)#32 | 20.1%(+32.3)#2,131 |
| 33. | Chesterton | 54.3% | 22.1%(+32.2)#33 | 20.1%(+34.2)#2,172 |
| 34. | Hammond | 54.7% | 22.1%(+32.6)#34 | 20.1%(+34.6)#2,184 |
| 35. | Jasper | 55.9% | 22.1%(+33.8)#35 | 20.1%(+35.8)#2,206 |
| 36. | Mishawaka | 56.0% | 22.1%(+33.9)#36 | 20.1%(+35.9)#2,208 |
| 37. | East Chicago | 57.1% | 22.1%(+35.0)#37 | 20.1%(+37.0)#2,225 |
| 38. | Shelbyville | 61.4% | 22.1%(+39.3)#38 | 20.1%(+41.3)#2,323 |
| 39. | Washington | 63.4% | 22.1%(+41.3)#39 | 20.1%(+43.3)#2,381 |
| 40. | Kokomo | 66.8% | 22.1%(+44.7)#40 | 20.1%(+46.7)#2,470 |
| 41. | Monon | 68.8% | 22.1%(+46.7)#41 | 20.1%(+48.7)#2,489 |
| 42. | Beech Grove | 69.8% | 22.1%(+47.7)#42 | 20.1%(+49.7)#2,508 |
| 43. | Muncie | 73.7% | 22.1%(+51.6)#43 | 20.1%(+53.6)#2,554 |
| 44. | Williamsport | 75.0% | 22.1%(+52.9)#44 | 20.1%(+54.9)#2,568 |
| 45. | Bedford | 100.0% | 22.1%(+77.9)#45 | 20.1%(+79.9)#2,839 |
| 46. | Madison | 100.0% | 22.1%(+77.9)#46 | 20.1%(+79.9)#2,861 |
| 47. | Bluffton | 100.0% | 22.1%(+77.9)#47 | 20.1%(+79.9)#2,906 |
| 48. | Wabash | 100.0% | 22.1%(+77.9)#48 | 20.1%(+79.9)#2,908 |
| 49. | Decatur | 100.0% | 22.1%(+77.9)#49 | 20.1%(+79.9)#2,931 |
| 50. | Hidden Valley | 100.0% | 22.1%(+77.9)#50 | 20.1%(+79.9)#3,086 |
| 51. | Winchester | 100.0% | 22.1%(+77.9)#51 | 20.1%(+79.9)#3,142 |
| 52. | Ligonier | 100.0% | 22.1%(+77.9)#52 | 20.1%(+79.9)#3,163 |
| 53. | Edinburgh | 100.0% | 22.1%(+77.9)#53 | 20.1%(+79.9)#3,181 |
| 54. | Chandler | 100.0% | 22.1%(+77.9)#54 | 20.1%(+79.9)#3,211 |
| 55. | Hanover | 100.0% | 22.1%(+77.9)#55 | 20.1%(+79.9)#3,218 |
| 56. | Austin | 100.0% | 22.1%(+77.9)#56 | 20.1%(+79.9)#3,222 |
| 57. | Albany | 100.0% | 22.1%(+77.9)#57 | 20.1%(+79.9)#3,296 |
| 58. | Albion | 100.0% | 22.1%(+77.9)#58 | 20.1%(+79.9)#3,298 |
| 59. | Centerville | 100.0% | 22.1%(+77.9)#59 | 20.1%(+79.9)#3,315 |
| 60. | Chesterfield | 100.0% | 22.1%(+77.9)#60 | 20.1%(+79.9)#3,352 |
| 61. | Lapel | 100.0% | 22.1%(+77.9)#61 | 20.1%(+79.9)#3,372 |
| 62. | Middletown | 100.0% | 22.1%(+77.9)#62 | 20.1%(+79.9)#3,405 |
| 63. | Fremont | 100.0% | 22.1%(+77.9)#63 | 20.1%(+79.9)#3,413 |
| 64. | Walkerton | 100.0% | 22.1%(+77.9)#64 | 20.1%(+79.9)#3,445 |
| 65. | Edgewood | 100.0% | 22.1%(+77.9)#65 | 20.1%(+79.9)#3,456 |
| 66. | Veedersburg | 100.0% | 22.1%(+77.9)#66 | 20.1%(+79.9)#3,459 |
| 67. | Hope | 100.0% | 22.1%(+77.9)#67 | 20.1%(+79.9)#3,466 |
| 68. | Bristol | 100.0% | 22.1%(+77.9)#68 | 20.1%(+79.9)#3,478 |
| 69. | Kentland | 100.0% | 22.1%(+77.9)#69 | 20.1%(+79.9)#3,492 |
| 70. | Dunkirk | 100.0% | 22.1%(+77.9)#70 | 20.1%(+79.9)#3,495 |
| 71. | Rossville | 100.0% | 22.1%(+77.9)#71 | 20.1%(+79.9)#3,506 |
| 72. | Worthington | 100.0% | 22.1%(+77.9)#72 | 20.1%(+79.9)#3,515 |
| 73. | Clermont | 100.0% | 22.1%(+77.9)#73 | 20.1%(+79.9)#3,533 |
| 74. | Redkey | 100.0% | 22.1%(+77.9)#74 | 20.1%(+79.9)#3,555 |
| 75. | Cambridge City | 100.0% | 22.1%(+77.9)#75 | 20.1%(+79.9)#3,569 |
| 76. | Warren Park | 100.0% | 22.1%(+77.9)#76 | 20.1%(+79.9)#3,570 |
| 77. | Sunman | 100.0% | 22.1%(+77.9)#77 | 20.1%(+79.9)#3,573 |
| 78. | Otterbein | 100.0% | 22.1%(+77.9)#78 | 20.1%(+79.9)#3,647 |
| 79. | Thorntown | 100.0% | 22.1%(+77.9)#79 | 20.1%(+79.9)#3,668 |
| 80. | Wolcott | 100.0% | 22.1%(+77.9)#80 | 20.1%(+79.9)#3,682 |
| 81. | Morristown | 100.0% | 22.1%(+77.9)#81 | 20.1%(+79.9)#3,684 |
| 82. | Enchanted Hills | 100.0% | 22.1%(+77.9)#82 | 20.1%(+79.9)#3,687 |
| 83. | Lynnville | 100.0% | 22.1%(+77.9)#83 | 20.1%(+79.9)#3,704 |
| 84. | St Paul | 100.0% | 22.1%(+77.9)#84 | 20.1%(+79.9)#3,735 |
| 85. | Kirklin | 100.0% | 22.1%(+77.9)#85 | 20.1%(+79.9)#3,769 |
| 86. | New Harmony | 100.0% | 22.1%(+77.9)#86 | 20.1%(+79.9)#3,789 |
| 87. | Hamlet | 100.0% | 22.1%(+77.9)#87 | 20.1%(+79.9)#3,803 |
| 88. | Monroe | 100.0% | 22.1%(+77.9)#88 | 20.1%(+79.9)#3,868 |
| 89. | Holland | 100.0% | 22.1%(+77.9)#89 | 20.1%(+79.9)#3,880 |
| 90. | Bainbridge | 100.0% | 22.1%(+77.9)#90 | 20.1%(+79.9)#3,888 |
| 91. | Greens Fork | 100.0% | 22.1%(+77.9)#91 | 20.1%(+79.9)#3,930 |
| 92. | Etna Green | 100.0% | 22.1%(+77.9)#92 | 20.1%(+79.9)#3,938 |
| 93. | Coatesville | 100.0% | 22.1%(+77.9)#93 | 20.1%(+79.9)#3,949 |
| 94. | Bruceville | 100.0% | 22.1%(+77.9)#94 | 20.1%(+79.9)#3,962 |
| 95. | Orestes | 100.0% | 22.1%(+77.9)#95 | 20.1%(+79.9)#4,010 |
| 96. | Birdseye | 100.0% | 22.1%(+77.9)#96 | 20.1%(+79.9)#4,029 |
| 97. | Elizabethtown | 100.0% | 22.1%(+77.9)#97 | 20.1%(+79.9)#4,043 |
| 98. | Tennyson | 100.0% | 22.1%(+77.9)#98 | 20.1%(+79.9)#4,140 |
Common Questions
What are the Top 10 Cities with the Lowest Percentage of Births to Unmarried Women over the Age of 35 in Indiana?
Top 10 Cities with the Lowest Percentage of Births to Unmarried Women over the Age of 35 in Indiana are:
#1
0.0%
#2
0.0%
#3
1.9%
#4
5.4%
#5
5.8%
#6
5.9%
#7
6.2%
#8
8.7%
#9
10.9%
#10
11.3%
What city has the Lowest Percentage of Births to Unmarried Women over the Age of 35 in Indiana?
Goshen has the Lowest Percentage of Births to Unmarried Women over the Age of 35 in Indiana with 1.9%.
What is the Percentage of Births to Unmarried Women over the Age of 35 in the State of Indiana?
Percentage of Births to Unmarried Women over the Age of 35 in Indiana is 22.1%.
What is the Percentage of Births to Unmarried Women over the Age of 35 in the United States?
Percentage of Births to Unmarried Women over the Age of 35 in the United States is 20.1%.