Thousand Oaks, CA Map & Demographics
Thousand Oaks Map
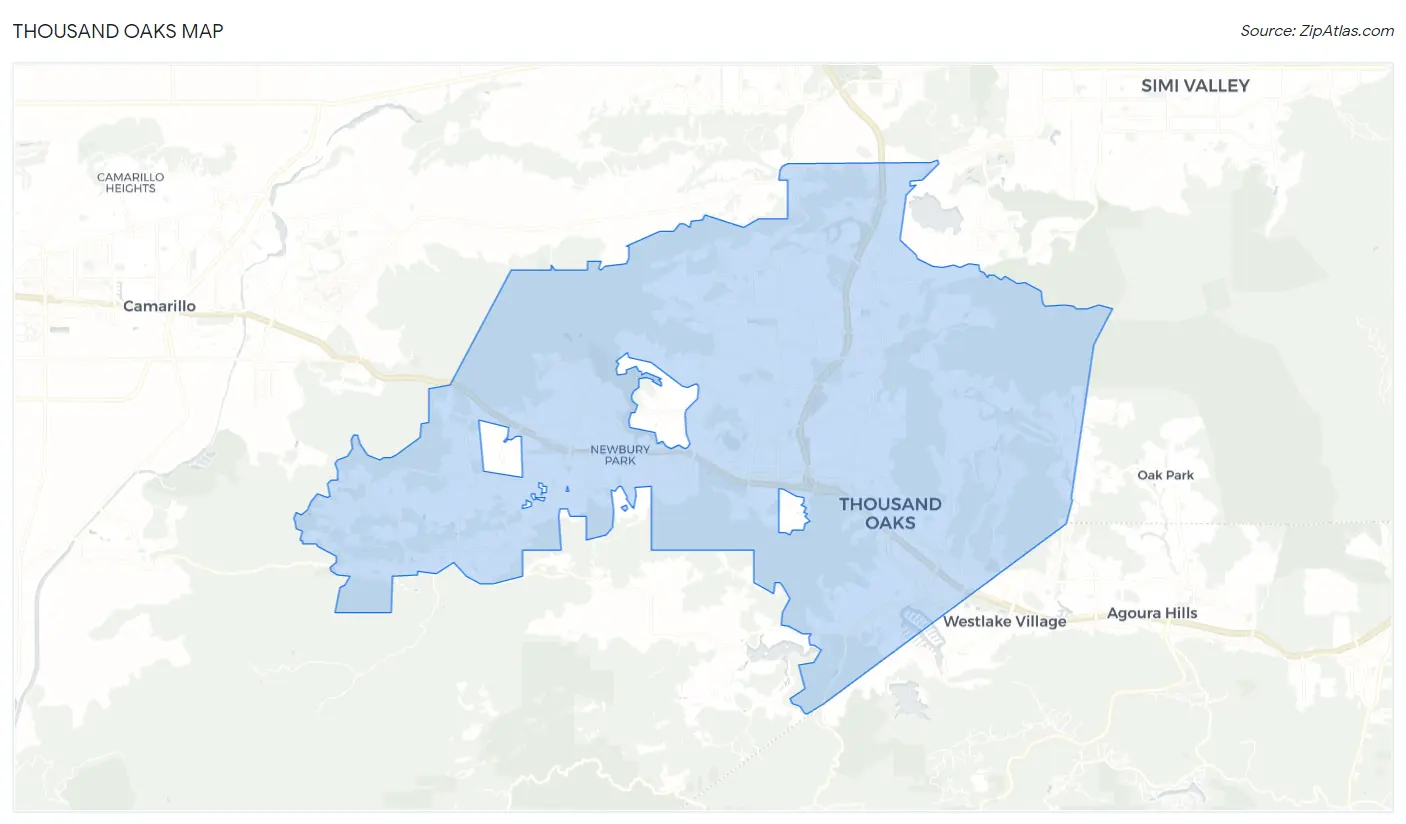
Thousand Oaks Overview
$61,458
PER CAPITA INCOME
$155,005
AVG FAMILY INCOME
$125,399
AVG HOUSEHOLD INCOME
42.5%
WAGE / INCOME GAP [ % ]
57.5¢/ $1
WAGE / INCOME GAP [ $ ]
$14,558
FAMILY INCOME DEFICIT
0.46
INEQUALITY / GINI INDEX
126,532
TOTAL POPULATION
62,770
MALE POPULATION
63,762
FEMALE POPULATION
98.44
MALES / 100 FEMALES
101.58
FEMALES / 100 MALES
44.4
MEDIAN AGE
3.2
AVG FAMILY SIZE
2.7
AVG HOUSEHOLD SIZE
65,141
LABOR FORCE [ PEOPLE ]
62.4%
PERCENT IN LABOR FORCE
4.8%
UNEMPLOYMENT RATE
Income in Thousand Oaks
Income Overview in Thousand Oaks
Per Capita Income in Thousand Oaks is $61,458, while median incomes of families and households are $155,005 and $125,399 respectively.
| Characteristic | Number | Measure |
| Per Capita Income | 126,532 | $61,458 |
| Median Family Income | 32,239 | $155,005 |
| Mean Family Income | 32,239 | $193,317 |
| Median Household Income | 46,143 | $125,399 |
| Mean Household Income | 46,143 | $164,430 |
| Income Deficit | 32,239 | $14,558 |
| Wage / Income Gap (%) | 126,532 | 42.47% |
| Wage / Income Gap ($) | 126,532 | 57.53¢ per $1 |
| Gini / Inequality Index | 126,532 | 0.46 |
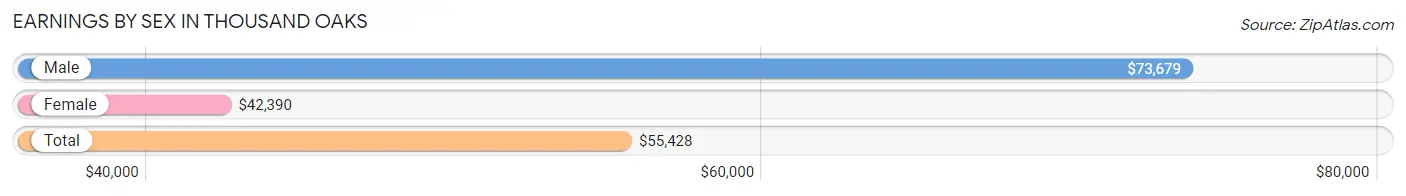
Earnings by Sex in Thousand Oaks
Average Earnings in Thousand Oaks are $55,428, $73,679 for men and $42,390 for women, a difference of 42.5%.
| Sex | Number | Average Earnings |
| Male | 35,990 (53.3%) | $73,679 |
| Female | 31,584 (46.7%) | $42,390 |
| Total | 67,574 (100.0%) | $55,428 |
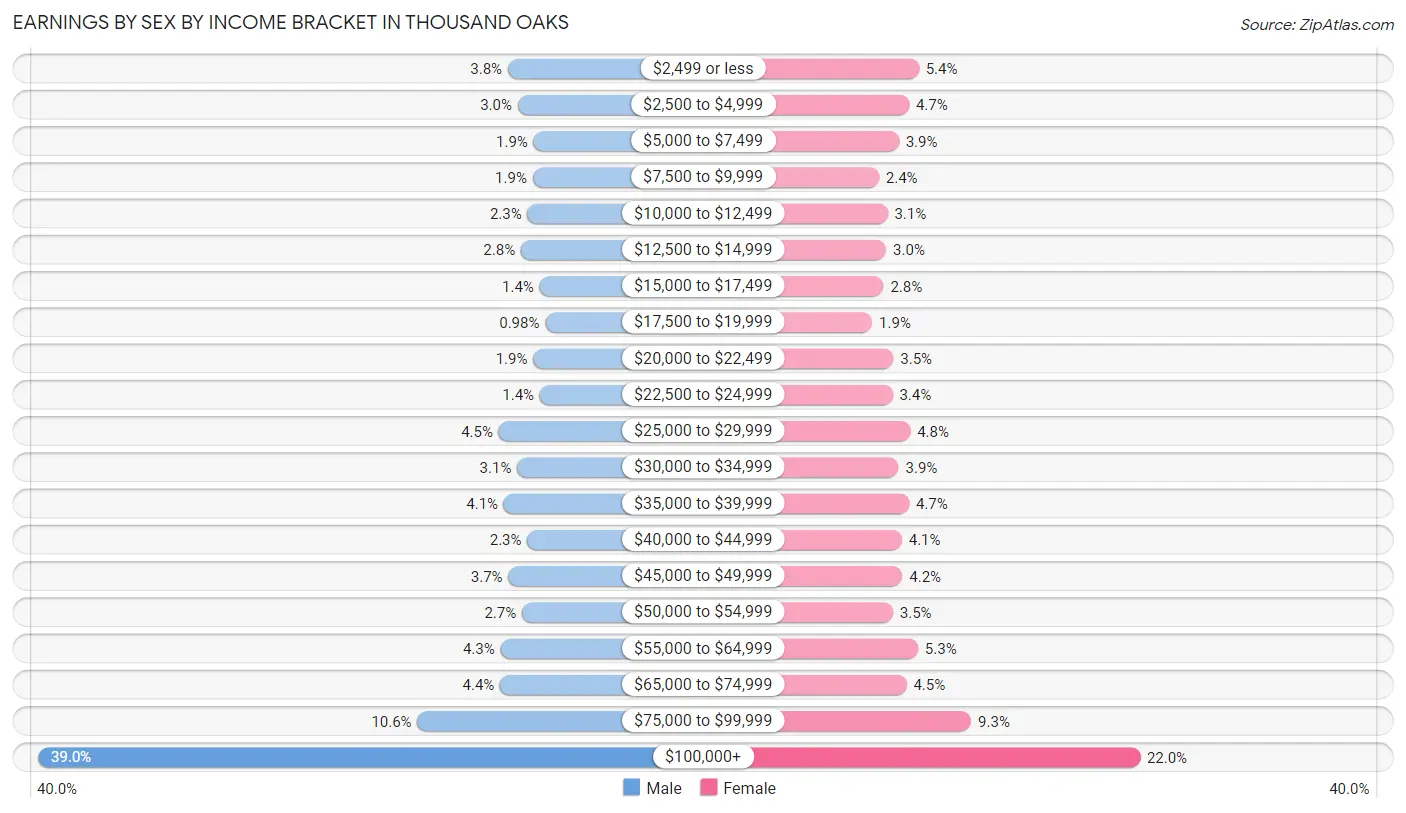
Earnings by Sex by Income Bracket in Thousand Oaks
The most common earnings brackets in Thousand Oaks are $100,000+ for men (14,036 | 39.0%) and $100,000+ for women (6,939 | 22.0%).
| Income | Male | Female |
| $2,499 or less | 1,362 (3.8%) | 1,701 (5.4%) |
| $2,500 to $4,999 | 1,094 (3.0%) | 1,471 (4.7%) |
| $5,000 to $7,499 | 666 (1.8%) | 1,229 (3.9%) |
| $7,500 to $9,999 | 691 (1.9%) | 758 (2.4%) |
| $10,000 to $12,499 | 832 (2.3%) | 962 (3.0%) |
| $12,500 to $14,999 | 1,008 (2.8%) | 933 (2.9%) |
| $15,000 to $17,499 | 505 (1.4%) | 870 (2.8%) |
| $17,500 to $19,999 | 352 (1.0%) | 601 (1.9%) |
| $20,000 to $22,499 | 678 (1.9%) | 1,102 (3.5%) |
| $22,500 to $24,999 | 495 (1.4%) | 1,080 (3.4%) |
| $25,000 to $29,999 | 1,606 (4.5%) | 1,501 (4.8%) |
| $30,000 to $34,999 | 1,110 (3.1%) | 1,224 (3.9%) |
| $35,000 to $39,999 | 1,470 (4.1%) | 1,471 (4.7%) |
| $40,000 to $44,999 | 835 (2.3%) | 1,300 (4.1%) |
| $45,000 to $49,999 | 1,345 (3.7%) | 1,315 (4.2%) |
| $50,000 to $54,999 | 978 (2.7%) | 1,090 (3.5%) |
| $55,000 to $64,999 | 1,557 (4.3%) | 1,682 (5.3%) |
| $65,000 to $74,999 | 1,570 (4.4%) | 1,411 (4.5%) |
| $75,000 to $99,999 | 3,800 (10.6%) | 2,944 (9.3%) |
| $100,000+ | 14,036 (39.0%) | 6,939 (22.0%) |
| Total | 35,990 (100.0%) | 31,584 (100.0%) |
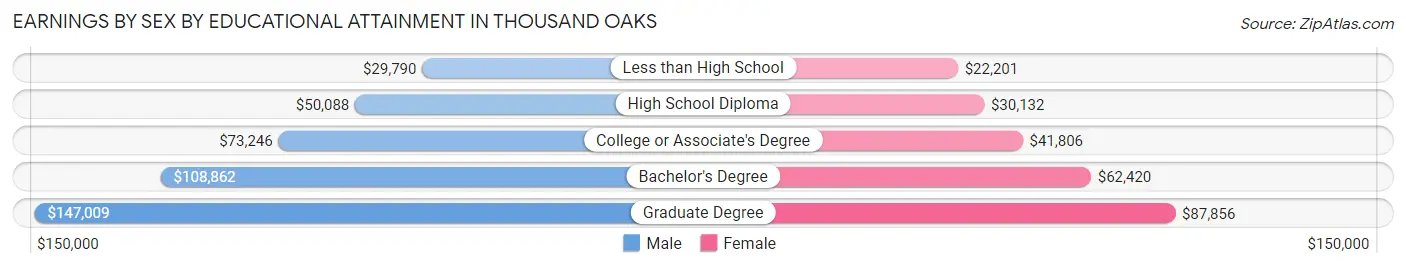
Earnings by Sex by Educational Attainment in Thousand Oaks
Average earnings in Thousand Oaks are $89,835 for men and $51,464 for women, a difference of 42.7%. Men with an educational attainment of graduate degree enjoy the highest average annual earnings of $147,009, while those with less than high school education earn the least with $29,790. Women with an educational attainment of graduate degree earn the most with the average annual earnings of $87,856, while those with less than high school education have the smallest earnings of $22,201.
| Educational Attainment | Male Income | Female Income |
| Less than High School | $29,790 | $22,201 |
| High School Diploma | $50,088 | $30,132 |
| College or Associate's Degree | $73,246 | $41,806 |
| Bachelor's Degree | $108,862 | $62,420 |
| Graduate Degree | $147,009 | $87,856 |
| Total | $89,835 | $51,464 |
Family Income in Thousand Oaks
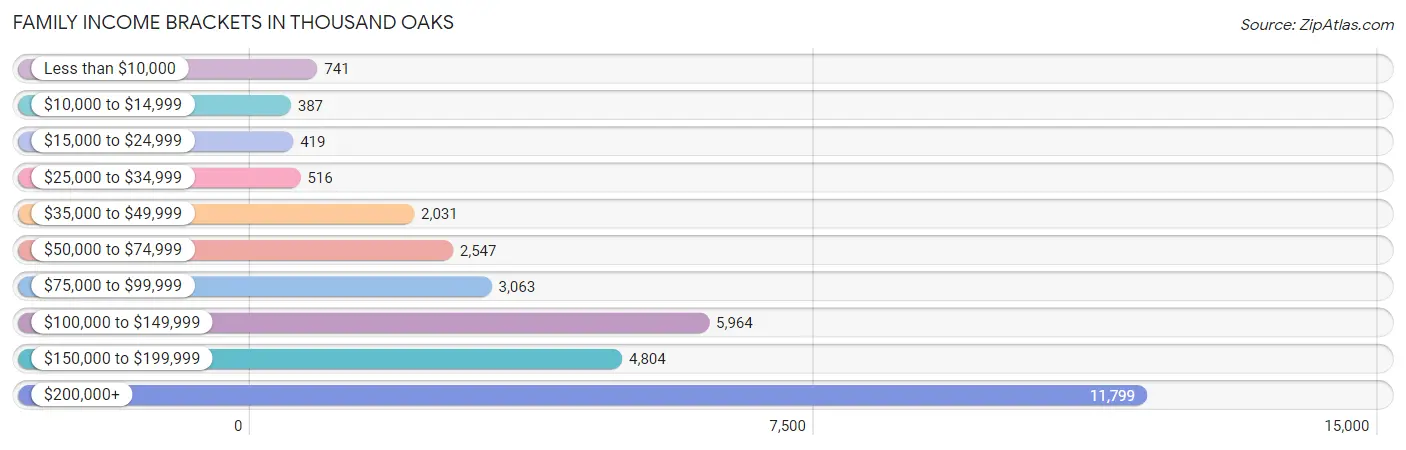
Family Income Brackets in Thousand Oaks
According to the Thousand Oaks family income data, there are 11,799 families falling into the $200,000+ income range, which is the most common income bracket and makes up 36.6% of all families. Conversely, the $10,000 to $14,999 income bracket is the least frequent group with only 387 families (1.2%) belonging to this category.
| Income Bracket | # Families | % Families |
| Less than $10,000 | 741 | 2.3% |
| $10,000 to $14,999 | 387 | 1.2% |
| $15,000 to $24,999 | 419 | 1.3% |
| $25,000 to $34,999 | 516 | 1.6% |
| $35,000 to $49,999 | 2,031 | 6.3% |
| $50,000 to $74,999 | 2,547 | 7.9% |
| $75,000 to $99,999 | 3,063 | 9.5% |
| $100,000 to $149,999 | 5,964 | 18.5% |
| $150,000 to $199,999 | 4,804 | 14.9% |
| $200,000+ | 11,799 | 36.6% |
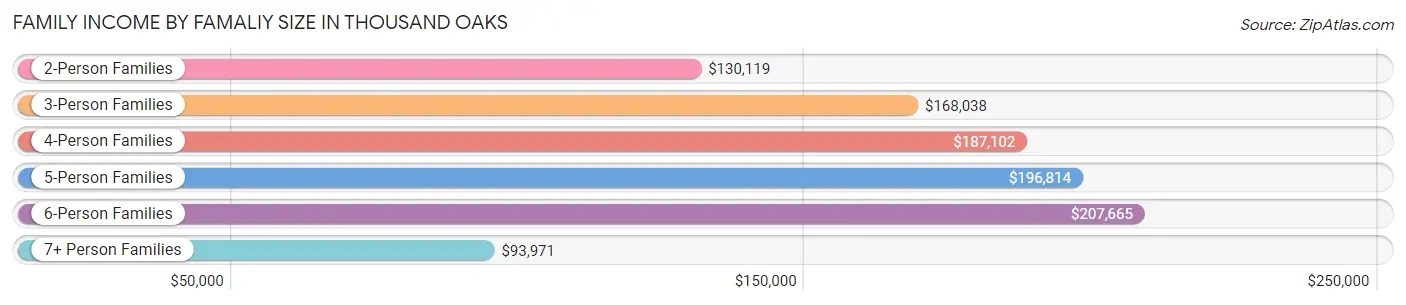
Family Income by Famaliy Size in Thousand Oaks
6-person families (611 | 1.9%) account for the highest median family income in Thousand Oaks with $207,665 per family, while 2-person families (14,303 | 44.4%) have the highest median income of $65,060 per family member.
| Income Bracket | # Families | Median Income |
| 2-Person Families | 14,303 (44.4%) | $130,119 |
| 3-Person Families | 7,928 (24.6%) | $168,038 |
| 4-Person Families | 6,569 (20.4%) | $187,102 |
| 5-Person Families | 2,420 (7.5%) | $196,814 |
| 6-Person Families | 611 (1.9%) | $207,665 |
| 7+ Person Families | 408 (1.3%) | $93,971 |
| Total | 32,239 (100.0%) | $155,005 |
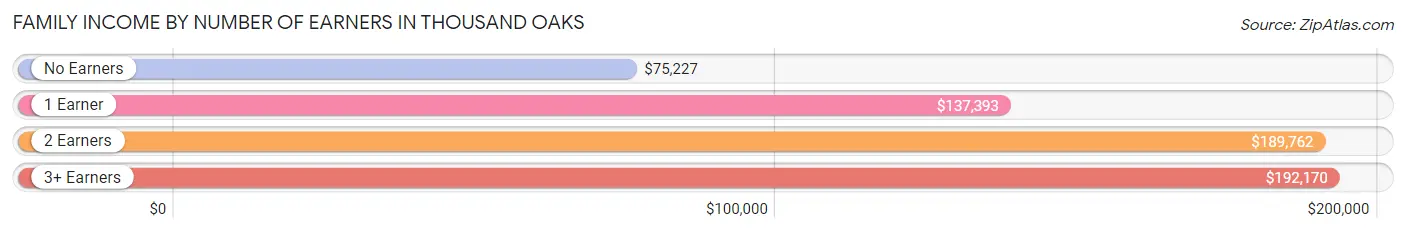
Family Income by Number of Earners in Thousand Oaks
The median family income in Thousand Oaks is $155,005, with families comprising 3+ earners (4,309) having the highest median family income of $192,170, while families with no earners (4,866) have the lowest median family income of $75,227, accounting for 13.4% and 15.1% of families, respectively.
| Number of Earners | # Families | Median Income |
| No Earners | 4,866 (15.1%) | $75,227 |
| 1 Earner | 9,417 (29.2%) | $137,393 |
| 2 Earners | 13,647 (42.3%) | $189,762 |
| 3+ Earners | 4,309 (13.4%) | $192,170 |
| Total | 32,239 (100.0%) | $155,005 |
Household Income in Thousand Oaks
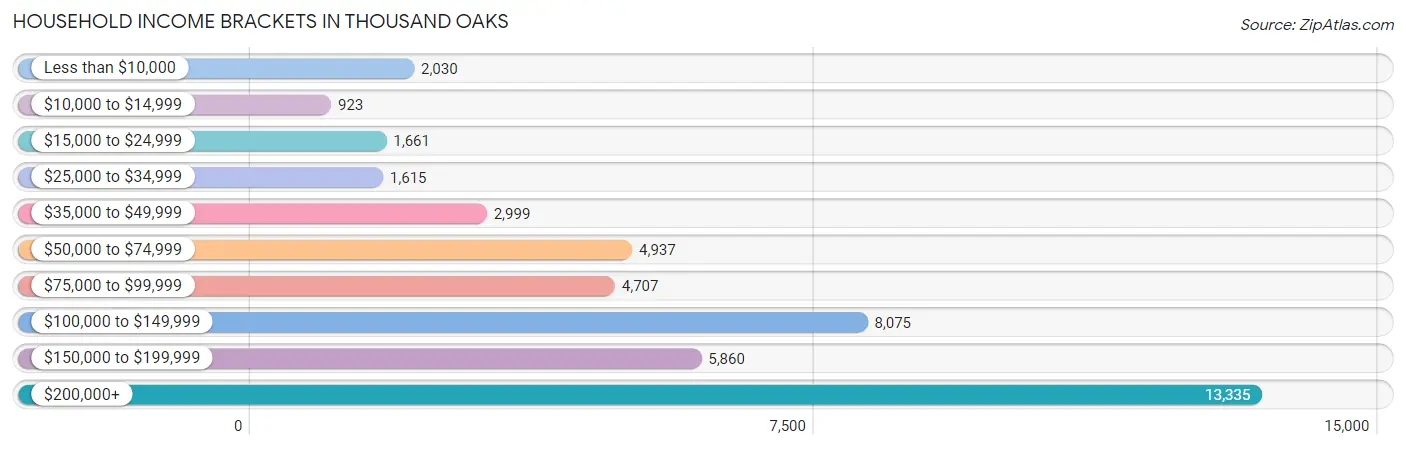
Household Income Brackets in Thousand Oaks
With 13,335 households falling in the category, the $200,000+ income range is the most frequent in Thousand Oaks, accounting for 28.9% of all households. In contrast, only 923 households (2.0%) fall into the $10,000 to $14,999 income bracket, making it the least populous group.
| Income Bracket | # Households | % Households |
| Less than $10,000 | 2,030 | 4.4% |
| $10,000 to $14,999 | 923 | 2.0% |
| $15,000 to $24,999 | 1,661 | 3.6% |
| $25,000 to $34,999 | 1,615 | 3.5% |
| $35,000 to $49,999 | 2,999 | 6.5% |
| $50,000 to $74,999 | 4,937 | 10.7% |
| $75,000 to $99,999 | 4,707 | 10.2% |
| $100,000 to $149,999 | 8,075 | 17.5% |
| $150,000 to $199,999 | 5,860 | 12.7% |
| $200,000+ | 13,335 | 28.9% |
Household Income by Householder Age in Thousand Oaks
The median household income in Thousand Oaks is $125,399, with the highest median household income of $145,399 found in the 25 to 44 years age bracket for the primary householder. A total of 10,369 households (22.5%) fall into this category. Meanwhile, the 15 to 24 years age bracket for the primary householder has the lowest median household income of $62,969, with 504 households (1.1%) in this group.
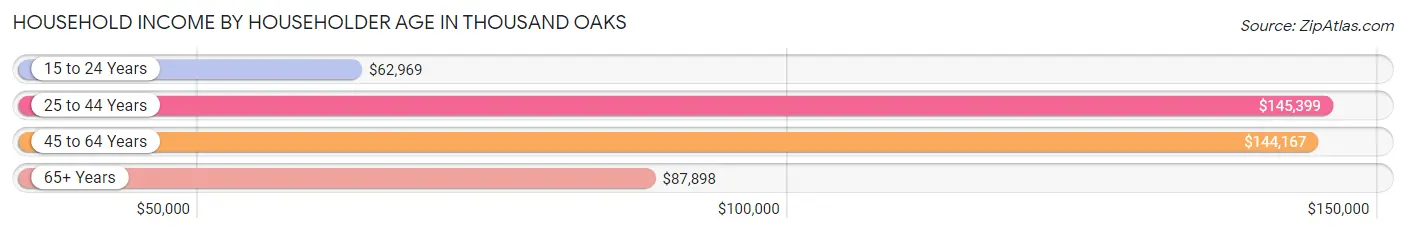
| Income Bracket | # Households | Median Income |
| 15 to 24 Years | 504 (1.1%) | $62,969 |
| 25 to 44 Years | 10,369 (22.5%) | $145,399 |
| 45 to 64 Years | 20,308 (44.0%) | $144,167 |
| 65+ Years | 14,962 (32.4%) | $87,898 |
| Total | 46,143 (100.0%) | $125,399 |
Poverty in Thousand Oaks
Income Below Poverty by Sex and Age in Thousand Oaks
With 8.2% poverty level for males and 7.5% for females among the residents of Thousand Oaks, 15 year old males and 75 year old and over females are the most vulnerable to poverty, with 164 males (25.2%) and 955 females (14.5%) in their respective age groups living below the poverty level.
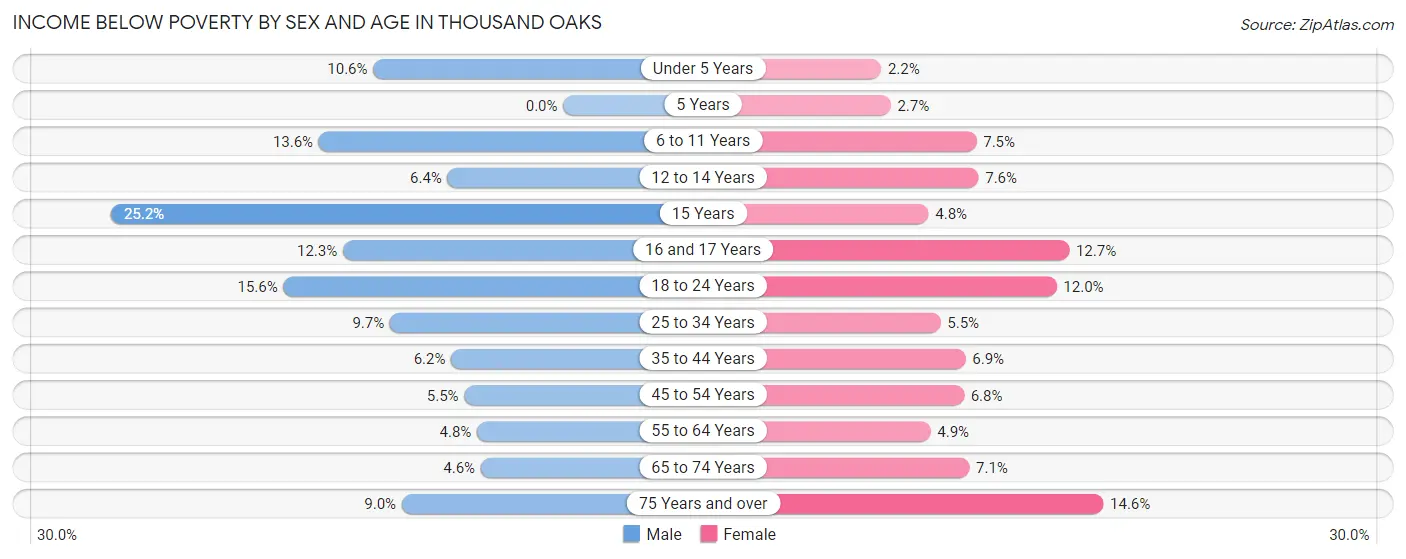
| Age Bracket | Male | Female |
| Under 5 Years | 348 (10.6%) | 67 (2.2%) |
| 5 Years | 0 (0.0%) | 11 (2.7%) |
| 6 to 11 Years | 635 (13.6%) | 288 (7.5%) |
| 12 to 14 Years | 165 (6.4%) | 170 (7.6%) |
| 15 Years | 164 (25.2%) | 26 (4.8%) |
| 16 and 17 Years | 258 (12.3%) | 183 (12.7%) |
| 18 to 24 Years | 791 (15.6%) | 580 (11.9%) |
| 25 to 34 Years | 605 (9.7%) | 361 (5.5%) |
| 35 to 44 Years | 454 (6.2%) | 481 (6.9%) |
| 45 to 54 Years | 496 (5.5%) | 607 (6.8%) |
| 55 to 64 Years | 441 (4.8%) | 501 (4.9%) |
| 65 to 74 Years | 295 (4.6%) | 502 (7.1%) |
| 75 Years and over | 421 (9.0%) | 955 (14.5%) |
| Total | 5,073 (8.2%) | 4,732 (7.5%) |
Income Above Poverty by Sex and Age in Thousand Oaks
According to the poverty statistics in Thousand Oaks, males aged 5 years and females aged under 5 years are the age groups that are most secure financially, with 100.0% of males and 97.8% of females in these age groups living above the poverty line.
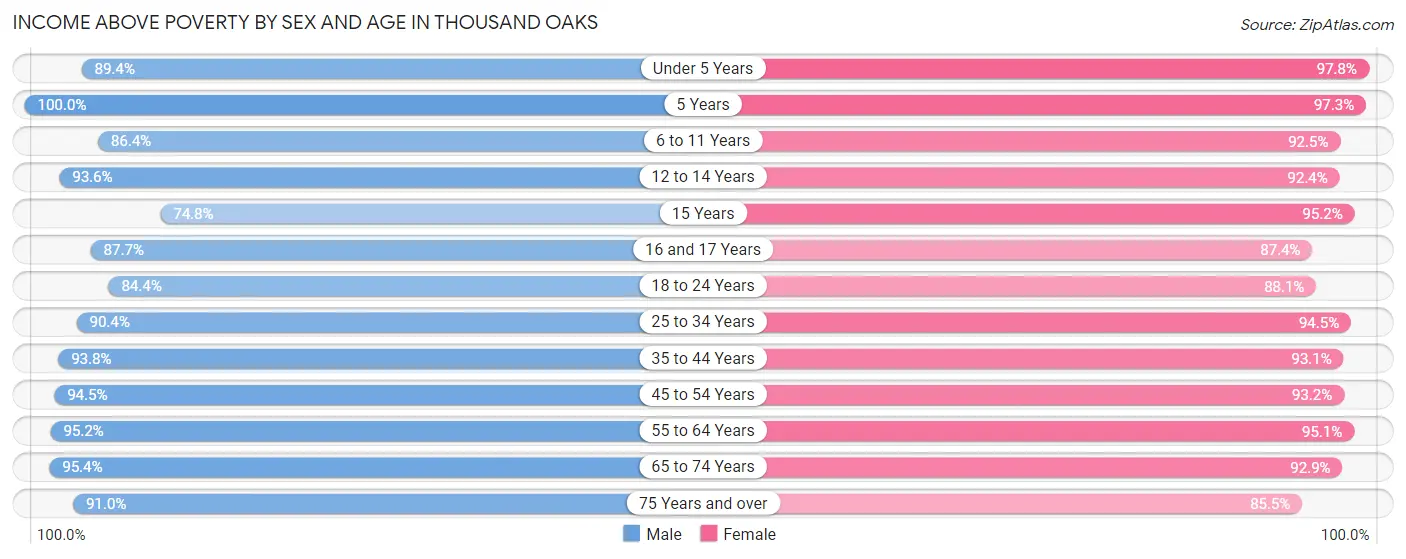
| Age Bracket | Male | Female |
| Under 5 Years | 2,940 (89.4%) | 3,012 (97.8%) |
| 5 Years | 709 (100.0%) | 395 (97.3%) |
| 6 to 11 Years | 4,031 (86.4%) | 3,559 (92.5%) |
| 12 to 14 Years | 2,398 (93.6%) | 2,068 (92.4%) |
| 15 Years | 487 (74.8%) | 513 (95.2%) |
| 16 and 17 Years | 1,845 (87.7%) | 1,264 (87.4%) |
| 18 to 24 Years | 4,285 (84.4%) | 4,272 (88.0%) |
| 25 to 34 Years | 5,665 (90.3%) | 6,209 (94.5%) |
| 35 to 44 Years | 6,825 (93.8%) | 6,515 (93.1%) |
| 45 to 54 Years | 8,508 (94.5%) | 8,337 (93.2%) |
| 55 to 64 Years | 8,742 (95.2%) | 9,652 (95.1%) |
| 65 to 74 Years | 6,132 (95.4%) | 6,583 (92.9%) |
| 75 Years and over | 4,263 (91.0%) | 5,610 (85.5%) |
| Total | 56,830 (91.8%) | 57,989 (92.5%) |
Income Below Poverty Among Married-Couple Families in Thousand Oaks
The poverty statistics for married-couple families in Thousand Oaks show that 2.9% or 765 of the total 26,460 families live below the poverty line. Families with 5 or more children have the highest poverty rate of 88.2%, comprising of 45 families. On the other hand, families with no children have the lowest poverty rate of 2.0%, which includes 314 families.
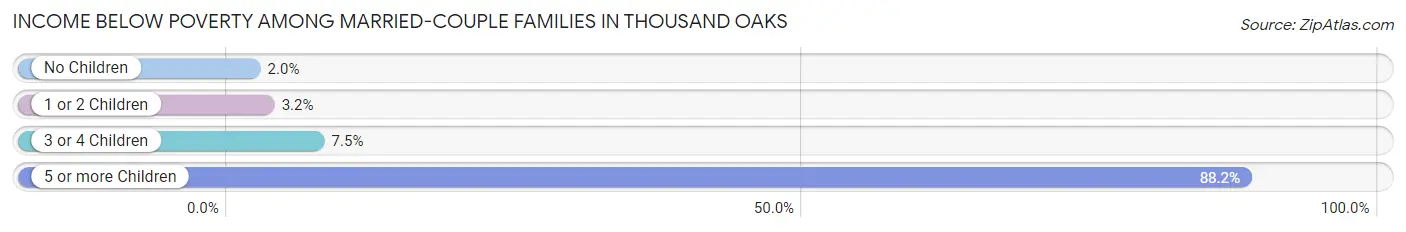
| Children | Above Poverty | Below Poverty |
| No Children | 15,611 (98.0%) | 314 (2.0%) |
| 1 or 2 Children | 8,557 (96.8%) | 282 (3.2%) |
| 3 or 4 Children | 1,521 (92.5%) | 124 (7.5%) |
| 5 or more Children | 6 (11.8%) | 45 (88.2%) |
| Total | 25,695 (97.1%) | 765 (2.9%) |
Income Below Poverty Among Single-Parent Households in Thousand Oaks
According to the poverty data in Thousand Oaks, 4.6% or 84 single-father households and 15.4% or 606 single-mother households are living below the poverty line. Among single-father households, those with 1 or 2 children have the highest poverty rate, with 65 households (11.2%) experiencing poverty. Likewise, among single-mother households, those with 3 or 4 children have the highest poverty rate, with 111 households (56.4%) falling below the poverty line.
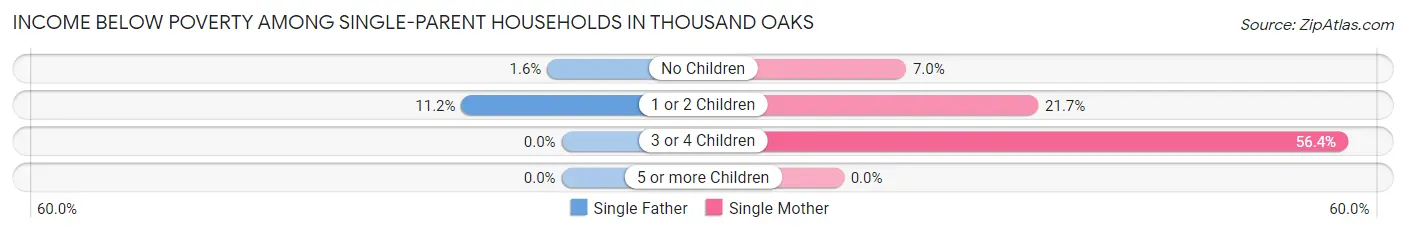
| Children | Single Father | Single Mother |
| No Children | 19 (1.6%) | 150 (7.0%) |
| 1 or 2 Children | 65 (11.2%) | 345 (21.7%) |
| 3 or 4 Children | 0 (0.0%) | 111 (56.4%) |
| 5 or more Children | 0 (0.0%) | 0 (0.0%) |
| Total | 84 (4.6%) | 606 (15.4%) |
Income Below Poverty Among Married-Couple vs Single-Parent Households in Thousand Oaks
The poverty data for Thousand Oaks shows that 765 of the married-couple family households (2.9%) and 690 of the single-parent households (11.9%) are living below the poverty level. Within the married-couple family households, those with 5 or more children have the highest poverty rate, with 45 households (88.2%) falling below the poverty line. Among the single-parent households, those with 3 or 4 children have the highest poverty rate, with 111 household (41.7%) living below poverty.
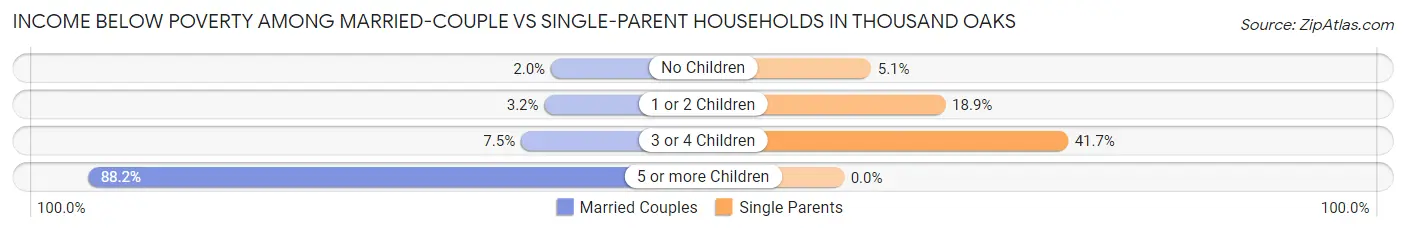
| Children | Married-Couple Families | Single-Parent Households |
| No Children | 314 (2.0%) | 169 (5.1%) |
| 1 or 2 Children | 282 (3.2%) | 410 (18.9%) |
| 3 or 4 Children | 124 (7.5%) | 111 (41.7%) |
| 5 or more Children | 45 (88.2%) | 0 (0.0%) |
| Total | 765 (2.9%) | 690 (11.9%) |
Race in Thousand Oaks
The most populous races in Thousand Oaks are White / Caucasian (92,052 | 72.8%), Hispanic or Latino (24,966 | 19.7%), and Two or more Races (14,625 | 11.6%).
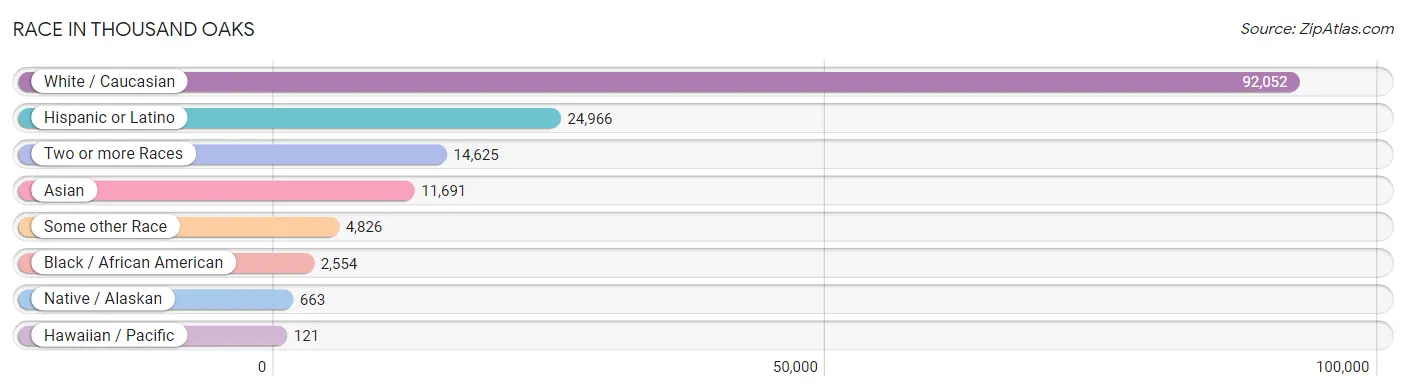
| Race | # Population | % Population |
| Asian | 11,691 | 9.2% |
| Black / African American | 2,554 | 2.0% |
| Hawaiian / Pacific | 121 | 0.1% |
| Hispanic or Latino | 24,966 | 19.7% |
| Native / Alaskan | 663 | 0.5% |
| White / Caucasian | 92,052 | 72.8% |
| Two or more Races | 14,625 | 11.6% |
| Some other Race | 4,826 | 3.8% |
| Total | 126,532 | 100.0% |
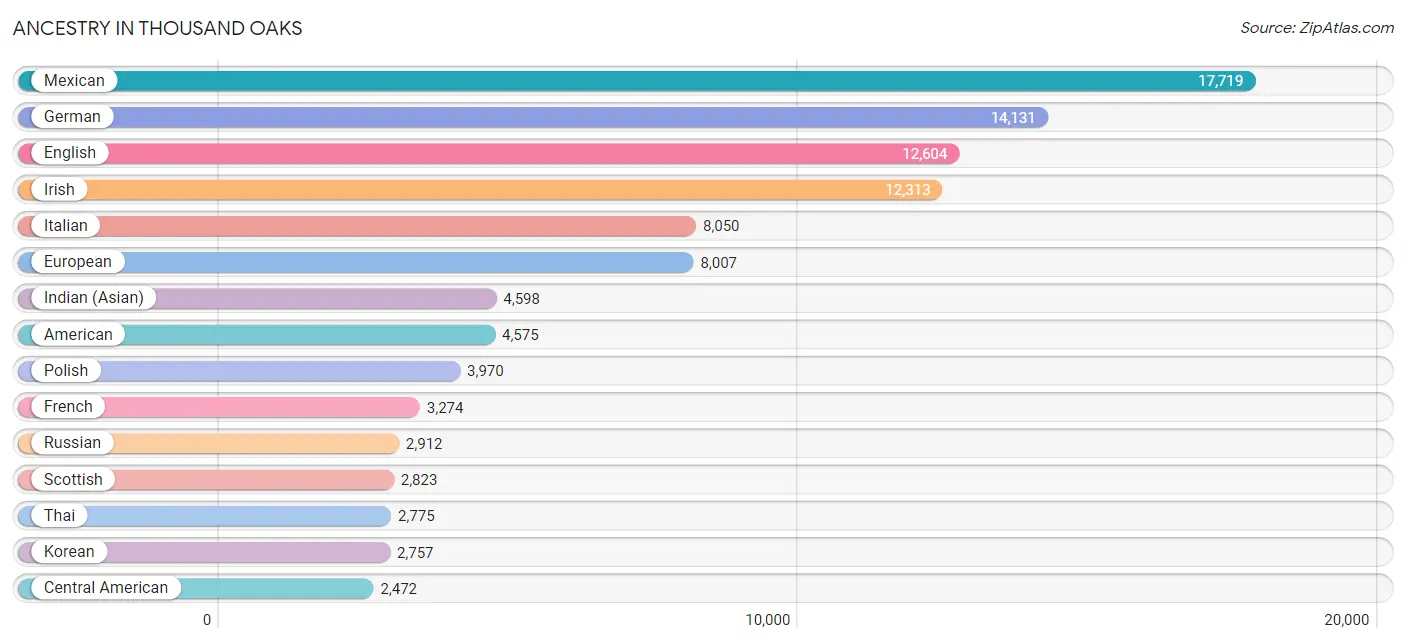
Ancestry in Thousand Oaks
The most populous ancestries reported in Thousand Oaks are Mexican (17,719 | 14.0%), German (14,131 | 11.2%), English (12,604 | 10.0%), Irish (12,313 | 9.7%), and Italian (8,050 | 6.4%), together accounting for 51.2% of all Thousand Oaks residents.
| Ancestry | # Population | % Population |
| Afghan | 36 | 0.0% |
| African | 233 | 0.2% |
| Albanian | 31 | 0.0% |
| Alsatian | 6 | 0.0% |
| American | 4,575 | 3.6% |
| Apache | 41 | 0.0% |
| Arab | 988 | 0.8% |
| Argentinean | 389 | 0.3% |
| Armenian | 504 | 0.4% |
| Assyrian / Chaldean / Syriac | 79 | 0.1% |
| Australian | 118 | 0.1% |
| Austrian | 717 | 0.6% |
| Bangladeshi | 12 | 0.0% |
| Basque | 39 | 0.0% |
| Belgian | 76 | 0.1% |
| Belizean | 135 | 0.1% |
| Bhutanese | 2,120 | 1.7% |
| Blackfeet | 75 | 0.1% |
| Bolivian | 6 | 0.0% |
| Brazilian | 175 | 0.1% |
| British | 1,428 | 1.1% |
| Bulgarian | 16 | 0.0% |
| Burmese | 1,325 | 1.1% |
| Canadian | 519 | 0.4% |
| Central American | 2,472 | 1.9% |
| Central American Indian | 467 | 0.4% |
| Cherokee | 244 | 0.2% |
| Chilean | 88 | 0.1% |
| Chinese | 34 | 0.0% |
| Choctaw | 136 | 0.1% |
| Colombian | 271 | 0.2% |
| Costa Rican | 85 | 0.1% |
| Croatian | 315 | 0.3% |
| Cuban | 431 | 0.3% |
| Cypriot | 5 | 0.0% |
| Czech | 638 | 0.5% |
| Czechoslovakian | 112 | 0.1% |
| Danish | 678 | 0.5% |
| Dominican | 28 | 0.0% |
| Dutch | 1,663 | 1.3% |
| Eastern European | 1,044 | 0.8% |
| Ecuadorian | 287 | 0.2% |
| Egyptian | 90 | 0.1% |
| English | 12,604 | 10.0% |
| Estonian | 37 | 0.0% |
| Ethiopian | 71 | 0.1% |
| European | 8,007 | 6.3% |
| Filipino | 529 | 0.4% |
| Finnish | 254 | 0.2% |
| French | 3,274 | 2.6% |
| French American Indian | 8 | 0.0% |
| French Canadian | 329 | 0.3% |
| German | 14,131 | 11.2% |
| Greek | 1,213 | 1.0% |
| Guamanian / Chamorro | 13 | 0.0% |
| Guatemalan | 831 | 0.7% |
| Haitian | 71 | 0.1% |
| Honduran | 41 | 0.0% |
| Hungarian | 972 | 0.8% |
| Indian (Asian) | 4,598 | 3.6% |
| Indonesian | 3 | 0.0% |
| Iranian | 1,853 | 1.5% |
| Irish | 12,313 | 9.7% |
| Iroquois | 10 | 0.0% |
| Israeli | 390 | 0.3% |
| Italian | 8,050 | 6.4% |
| Jamaican | 134 | 0.1% |
| Japanese | 237 | 0.2% |
| Korean | 2,757 | 2.2% |
| Laotian | 149 | 0.1% |
| Latvian | 52 | 0.0% |
| Lebanese | 286 | 0.2% |
| Lithuanian | 495 | 0.4% |
| Luxembourger | 19 | 0.0% |
| Macedonian | 39 | 0.0% |
| Maltese | 30 | 0.0% |
| Mexican | 17,719 | 14.0% |
| Mexican American Indian | 402 | 0.3% |
| Moroccan | 110 | 0.1% |
| Native Hawaiian | 492 | 0.4% |
| Navajo | 7 | 0.0% |
| New Zealander | 33 | 0.0% |
| Nicaraguan | 423 | 0.3% |
| Nigerian | 49 | 0.0% |
| Northern European | 354 | 0.3% |
| Norwegian | 1,890 | 1.5% |
| Pakistani | 140 | 0.1% |
| Palestinian | 69 | 0.1% |
| Panamanian | 36 | 0.0% |
| Pennsylvania German | 8 | 0.0% |
| Peruvian | 691 | 0.5% |
| Pima | 6 | 0.0% |
| Polish | 3,970 | 3.1% |
| Portuguese | 496 | 0.4% |
| Pueblo | 54 | 0.0% |
| Puerto Rican | 504 | 0.4% |
| Romanian | 371 | 0.3% |
| Russian | 2,912 | 2.3% |
| Salvadoran | 1,056 | 0.8% |
| Samoan | 47 | 0.0% |
| Scandinavian | 611 | 0.5% |
| Scotch-Irish | 1,036 | 0.8% |
| Scottish | 2,823 | 2.2% |
| Serbian | 44 | 0.0% |
| Slavic | 14 | 0.0% |
| Slovak | 108 | 0.1% |
| South African | 38 | 0.0% |
| South American | 1,809 | 1.4% |
| Spaniard | 732 | 0.6% |
| Spanish | 529 | 0.4% |
| Sri Lankan | 676 | 0.5% |
| Subsaharan African | 480 | 0.4% |
| Sudanese | 40 | 0.0% |
| Swedish | 1,937 | 1.5% |
| Swiss | 385 | 0.3% |
| Syrian | 103 | 0.1% |
| Thai | 2,775 | 2.2% |
| Tlingit-Haida | 50 | 0.0% |
| Tongan | 66 | 0.1% |
| Turkish | 147 | 0.1% |
| Ukrainian | 846 | 0.7% |
| Venezuelan | 77 | 0.1% |
| Welsh | 712 | 0.6% |
| West Indian | 57 | 0.1% |
| Yaqui | 118 | 0.1% |
| Yugoslavian | 16 | 0.0% | View All 126 Rows |
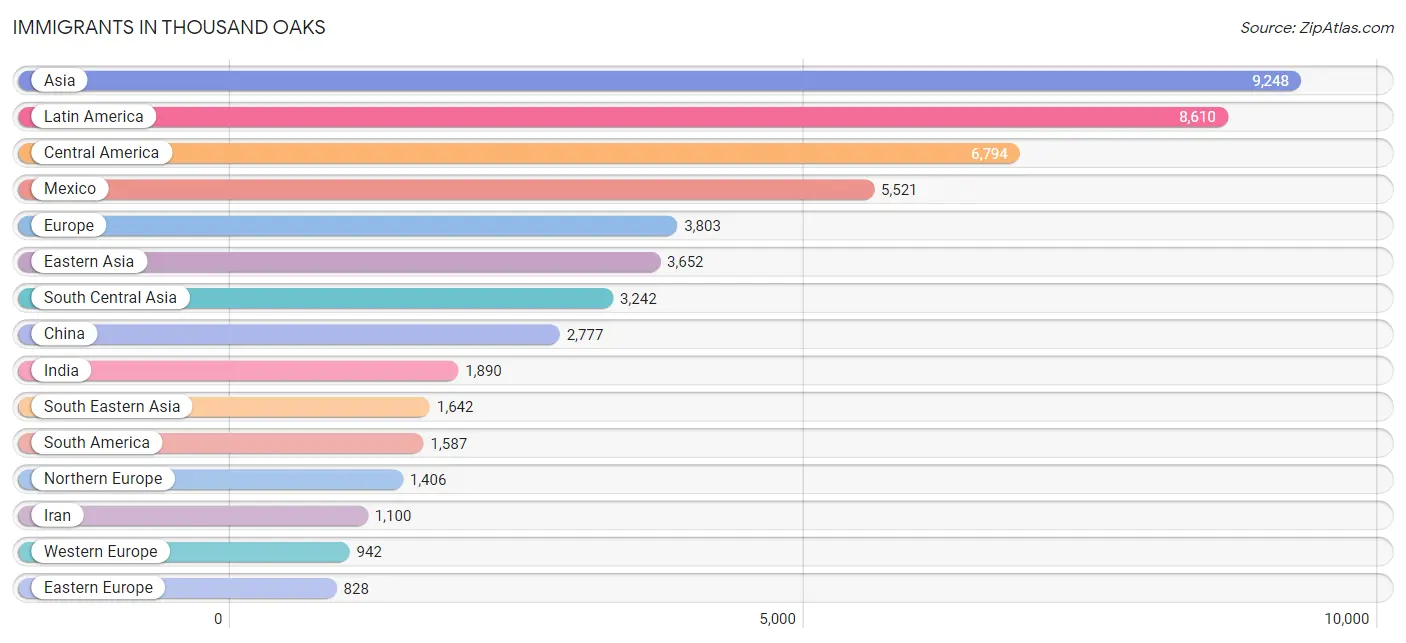
Immigrants in Thousand Oaks
The most numerous immigrant groups reported in Thousand Oaks came from Asia (9,248 | 7.3%), Latin America (8,610 | 6.8%), Central America (6,794 | 5.4%), Mexico (5,521 | 4.4%), and Europe (3,803 | 3.0%), together accounting for 26.9% of all Thousand Oaks residents.
| Immigration Origin | # Population | % Population |
| Afghanistan | 25 | 0.0% |
| Africa | 400 | 0.3% |
| Argentina | 267 | 0.2% |
| Armenia | 8 | 0.0% |
| Asia | 9,248 | 7.3% |
| Australia | 203 | 0.2% |
| Austria | 53 | 0.0% |
| Belarus | 13 | 0.0% |
| Belgium | 16 | 0.0% |
| Belize | 29 | 0.0% |
| Brazil | 246 | 0.2% |
| Cambodia | 198 | 0.2% |
| Canada | 779 | 0.6% |
| Caribbean | 229 | 0.2% |
| Central America | 6,794 | 5.4% |
| Chile | 52 | 0.0% |
| China | 2,777 | 2.2% |
| Colombia | 194 | 0.2% |
| Costa Rica | 24 | 0.0% |
| Croatia | 5 | 0.0% |
| Cuba | 122 | 0.1% |
| Czechoslovakia | 91 | 0.1% |
| Eastern Africa | 80 | 0.1% |
| Eastern Asia | 3,652 | 2.9% |
| Eastern Europe | 828 | 0.6% |
| Ecuador | 263 | 0.2% |
| Egypt | 76 | 0.1% |
| El Salvador | 486 | 0.4% |
| England | 515 | 0.4% |
| Eritrea | 11 | 0.0% |
| Ethiopia | 43 | 0.0% |
| Europe | 3,803 | 3.0% |
| France | 214 | 0.2% |
| Germany | 486 | 0.4% |
| Greece | 193 | 0.2% |
| Guatemala | 508 | 0.4% |
| Honduras | 63 | 0.1% |
| Hong Kong | 207 | 0.2% |
| Hungary | 100 | 0.1% |
| India | 1,890 | 1.5% |
| Indonesia | 93 | 0.1% |
| Iran | 1,100 | 0.9% |
| Iraq | 10 | 0.0% |
| Ireland | 131 | 0.1% |
| Israel | 205 | 0.2% |
| Italy | 335 | 0.3% |
| Jamaica | 97 | 0.1% |
| Japan | 264 | 0.2% |
| Jordan | 31 | 0.0% |
| Kazakhstan | 30 | 0.0% |
| Kenya | 26 | 0.0% |
| Korea | 611 | 0.5% |
| Laos | 23 | 0.0% |
| Latin America | 8,610 | 6.8% |
| Latvia | 35 | 0.0% |
| Lebanon | 127 | 0.1% |
| Liberia | 49 | 0.0% |
| Lithuania | 9 | 0.0% |
| Malaysia | 45 | 0.0% |
| Mexico | 5,521 | 4.4% |
| Morocco | 42 | 0.0% |
| Nepal | 22 | 0.0% |
| Netherlands | 129 | 0.1% |
| Nicaragua | 163 | 0.1% |
| Northern Africa | 175 | 0.1% |
| Northern Europe | 1,406 | 1.1% |
| Norway | 14 | 0.0% |
| Oceania | 281 | 0.2% |
| Pakistan | 152 | 0.1% |
| Peru | 508 | 0.4% |
| Philippines | 808 | 0.6% |
| Poland | 84 | 0.1% |
| Portugal | 65 | 0.1% |
| Romania | 69 | 0.1% |
| Russia | 239 | 0.2% |
| Saudi Arabia | 4 | 0.0% |
| Scotland | 152 | 0.1% |
| Serbia | 16 | 0.0% |
| South Africa | 96 | 0.1% |
| South America | 1,587 | 1.3% |
| South Central Asia | 3,242 | 2.6% |
| South Eastern Asia | 1,642 | 1.3% |
| Southern Europe | 627 | 0.5% |
| Spain | 34 | 0.0% |
| Sri Lanka | 23 | 0.0% |
| Sudan | 40 | 0.0% |
| Sweden | 132 | 0.1% |
| Switzerland | 36 | 0.0% |
| Syria | 107 | 0.1% |
| Taiwan | 624 | 0.5% |
| Thailand | 100 | 0.1% |
| Turkey | 66 | 0.1% |
| Ukraine | 80 | 0.1% |
| Venezuela | 57 | 0.1% |
| Vietnam | 361 | 0.3% |
| Western Africa | 49 | 0.0% |
| Western Asia | 684 | 0.5% |
| Western Europe | 942 | 0.7% | View All 98 Rows |
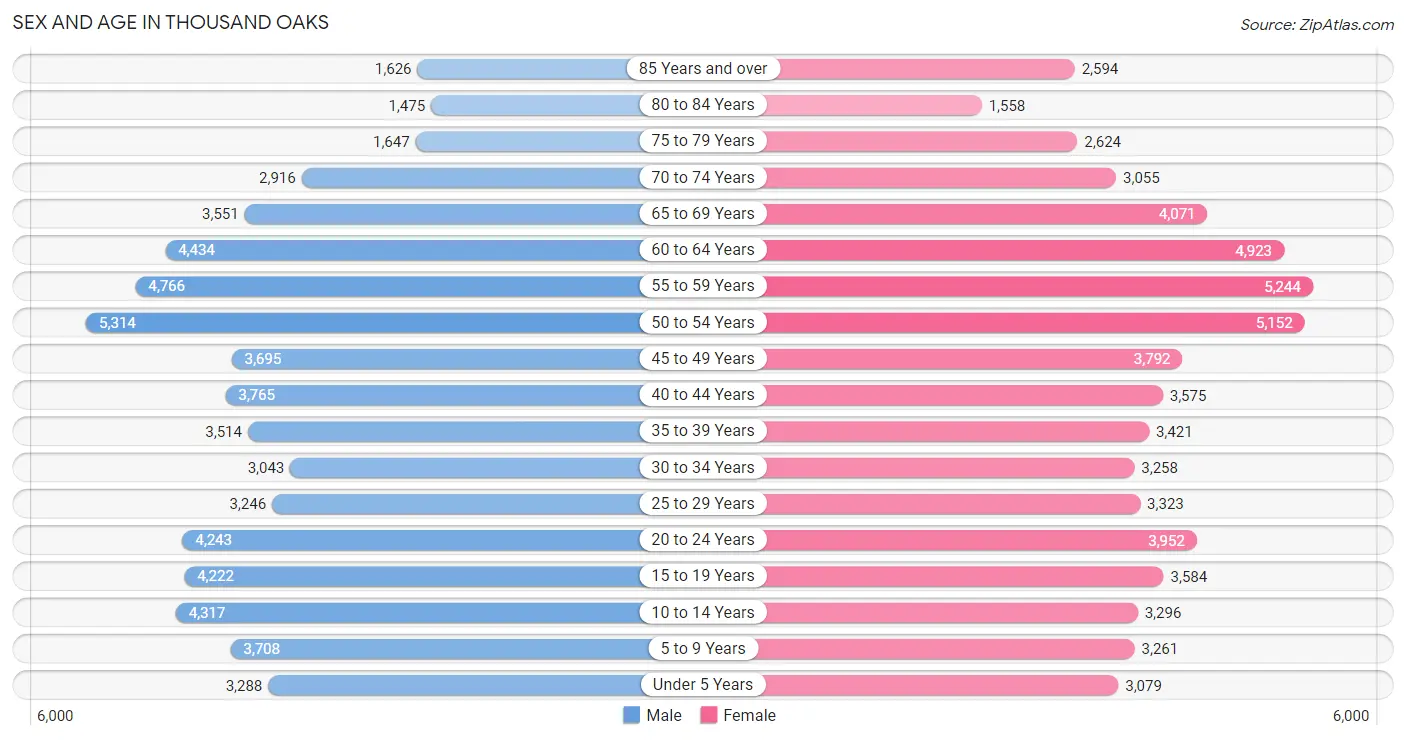
Sex and Age in Thousand Oaks
Sex and Age in Thousand Oaks
The most populous age groups in Thousand Oaks are 50 to 54 Years (5,314 | 8.5%) for men and 55 to 59 Years (5,244 | 8.2%) for women.
| Age Bracket | Male | Female |
| Under 5 Years | 3,288 (5.2%) | 3,079 (4.8%) |
| 5 to 9 Years | 3,708 (5.9%) | 3,261 (5.1%) |
| 10 to 14 Years | 4,317 (6.9%) | 3,296 (5.2%) |
| 15 to 19 Years | 4,222 (6.7%) | 3,584 (5.6%) |
| 20 to 24 Years | 4,243 (6.8%) | 3,952 (6.2%) |
| 25 to 29 Years | 3,246 (5.2%) | 3,323 (5.2%) |
| 30 to 34 Years | 3,043 (4.9%) | 3,258 (5.1%) |
| 35 to 39 Years | 3,514 (5.6%) | 3,421 (5.4%) |
| 40 to 44 Years | 3,765 (6.0%) | 3,575 (5.6%) |
| 45 to 49 Years | 3,695 (5.9%) | 3,792 (5.9%) |
| 50 to 54 Years | 5,314 (8.5%) | 5,152 (8.1%) |
| 55 to 59 Years | 4,766 (7.6%) | 5,244 (8.2%) |
| 60 to 64 Years | 4,434 (7.1%) | 4,923 (7.7%) |
| 65 to 69 Years | 3,551 (5.7%) | 4,071 (6.4%) |
| 70 to 74 Years | 2,916 (4.6%) | 3,055 (4.8%) |
| 75 to 79 Years | 1,647 (2.6%) | 2,624 (4.1%) |
| 80 to 84 Years | 1,475 (2.4%) | 1,558 (2.4%) |
| 85 Years and over | 1,626 (2.6%) | 2,594 (4.1%) |
| Total | 62,770 (100.0%) | 63,762 (100.0%) |
Families and Households in Thousand Oaks
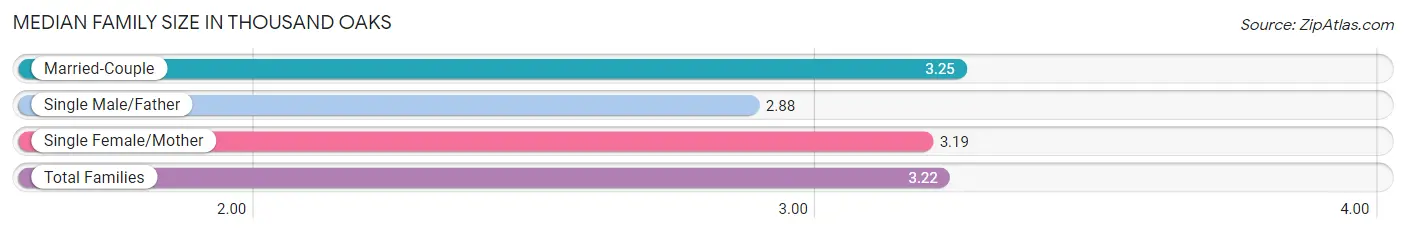
Median Family Size in Thousand Oaks
The median family size in Thousand Oaks is 3.22 persons per family, with married-couple families (26,460 | 82.1%) accounting for the largest median family size of 3.25 persons per family. On the other hand, single male/father families (1,839 | 5.7%) represent the smallest median family size with 2.88 persons per family.
| Family Type | # Families | Family Size |
| Married-Couple | 26,460 (82.1%) | 3.25 |
| Single Male/Father | 1,839 (5.7%) | 2.88 |
| Single Female/Mother | 3,940 (12.2%) | 3.19 |
| Total Families | 32,239 (100.0%) | 3.22 |
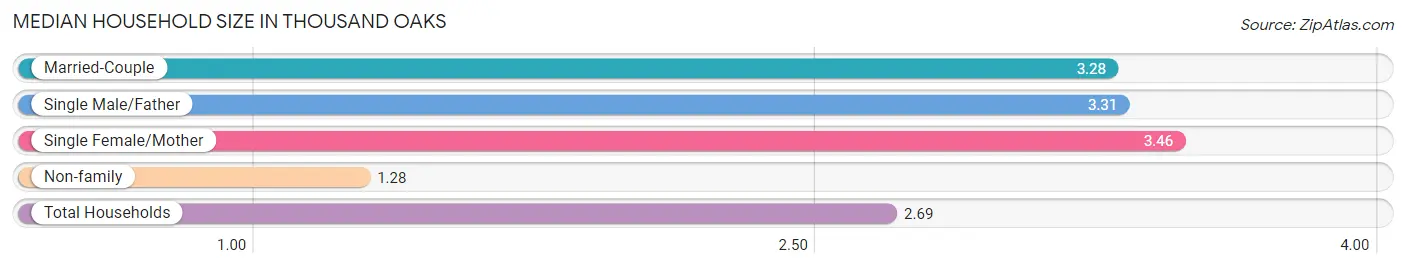
Median Household Size in Thousand Oaks
The median household size in Thousand Oaks is 2.69 persons per household, with single female/mother households (3,940 | 8.5%) accounting for the largest median household size of 3.46 persons per household. non-family households (13,904 | 30.1%) represent the smallest median household size with 1.28 persons per household.
| Household Type | # Households | Household Size |
| Married-Couple | 26,460 (57.3%) | 3.28 |
| Single Male/Father | 1,839 (4.0%) | 3.31 |
| Single Female/Mother | 3,940 (8.5%) | 3.46 |
| Non-family | 13,904 (30.1%) | 1.28 |
| Total Households | 46,143 (100.0%) | 2.69 |
Household Size by Marriage Status in Thousand Oaks
Out of a total of 46,143 households in Thousand Oaks, 32,239 (69.9%) are family households, while 13,904 (30.1%) are nonfamily households. The most numerous type of family households are 2-person households, comprising 13,579, and the most common type of nonfamily households are 1-person households, comprising 11,456.
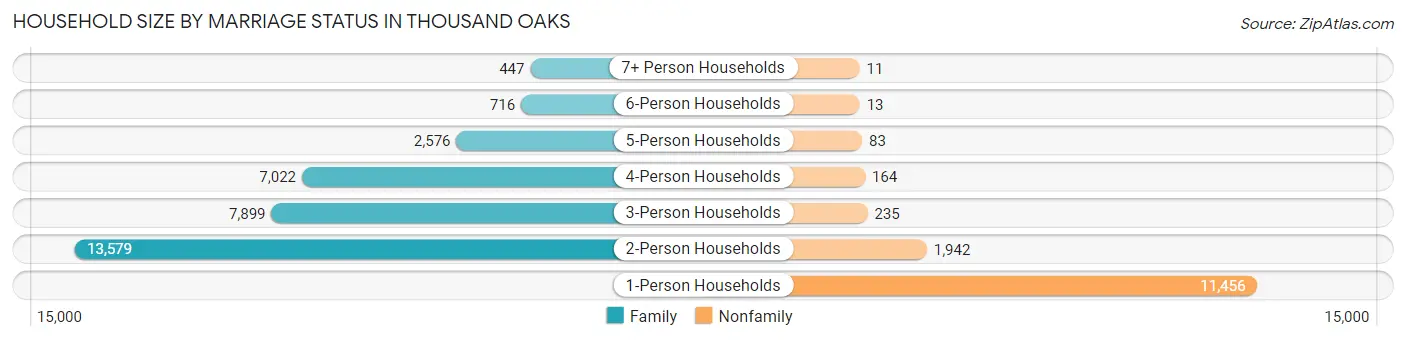
| Household Size | Family Households | Nonfamily Households |
| 1-Person Households | - | 11,456 (24.8%) |
| 2-Person Households | 13,579 (29.4%) | 1,942 (4.2%) |
| 3-Person Households | 7,899 (17.1%) | 235 (0.5%) |
| 4-Person Households | 7,022 (15.2%) | 164 (0.4%) |
| 5-Person Households | 2,576 (5.6%) | 83 (0.2%) |
| 6-Person Households | 716 (1.5%) | 13 (0.0%) |
| 7+ Person Households | 447 (1.0%) | 11 (0.0%) |
| Total | 32,239 (69.9%) | 13,904 (30.1%) |
Female Fertility in Thousand Oaks
Fertility by Age in Thousand Oaks
Average fertility rate in Thousand Oaks is 65.0 births per 1,000 women. Women in the age bracket of 20 to 34 years have the highest fertility rate with 96.0 births per 1,000 women. Women in the age bracket of 20 to 34 years acount for 59.7% of all women with births.
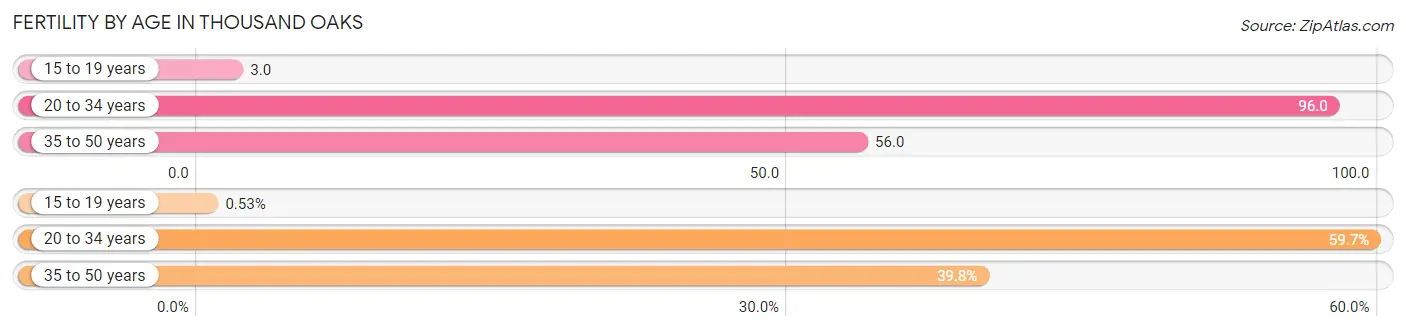
| Age Bracket | Women with Births | Births / 1,000 Women |
| 15 to 19 years | 9 (0.5%) | 3.0 |
| 20 to 34 years | 1,012 (59.7%) | 96.0 |
| 35 to 50 years | 674 (39.8%) | 56.0 |
| Total | 1,695 (100.0%) | 65.0 |
Fertility by Age by Marriage Status in Thousand Oaks
78.9% of women with births (1,695) in Thousand Oaks are married. The highest percentage of unmarried women with births falls into 20 to 34 years age bracket with 27.1% of them unmarried at the time of birth, while the lowest percentage of unmarried women with births belong to 15 to 19 years age bracket with 0.0% of them unmarried.
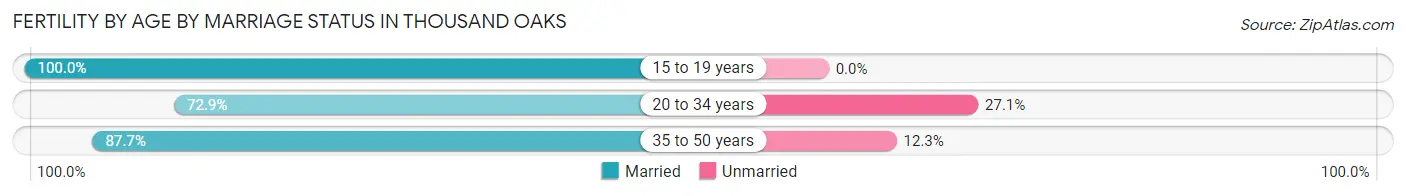
| Age Bracket | Married | Unmarried |
| 15 to 19 years | 9 (100.0%) | 0 (0.0%) |
| 20 to 34 years | 738 (72.9%) | 274 (27.1%) |
| 35 to 50 years | 591 (87.7%) | 83 (12.3%) |
| Total | 1,337 (78.9%) | 358 (21.1%) |
Fertility by Education in Thousand Oaks
Average fertility rate in Thousand Oaks is 65.0 births per 1,000 women. Women with the education attainment of bachelor's degree have the highest fertility rate of 97.0 births per 1,000 women, while women with the education attainment of less than high school have the lowest fertility at 14.0 births per 1,000 women. Women with the education attainment of bachelor's degree represent 41.6% of all women with births.
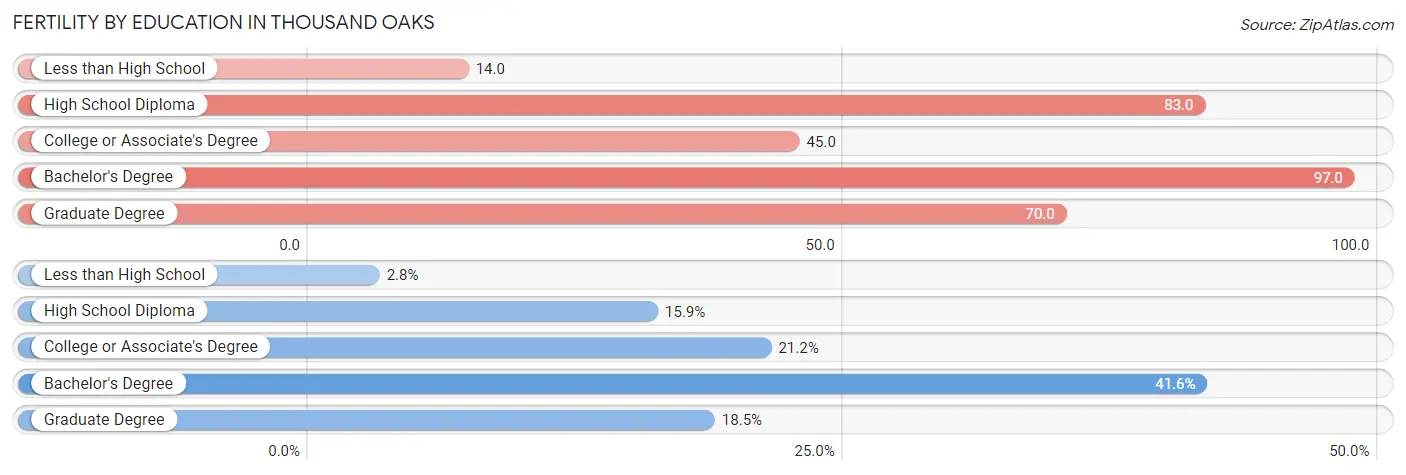
| Educational Attainment | Women with Births | Births / 1,000 Women |
| Less than High School | 48 (2.8%) | 14.0 |
| High School Diploma | 269 (15.9%) | 83.0 |
| College or Associate's Degree | 359 (21.2%) | 45.0 |
| Bachelor's Degree | 705 (41.6%) | 97.0 |
| Graduate Degree | 314 (18.5%) | 70.0 |
| Total | 1,695 (100.0%) | 65.0 |
Fertility by Education by Marriage Status in Thousand Oaks
21.1% of women with births in Thousand Oaks are unmarried. Women with the educational attainment of graduate degree are most likely to be married with 100.0% of them married at childbirth, while women with the educational attainment of less than high school are least likely to be married with 83.3% of them unmarried at childbirth.
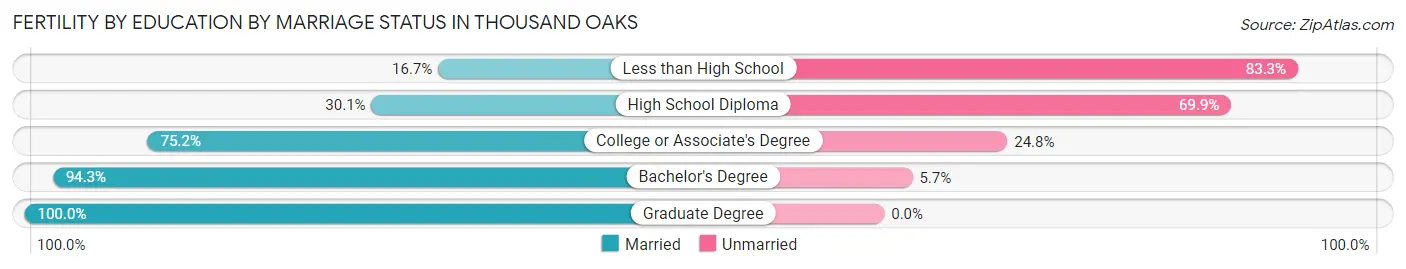
| Educational Attainment | Married | Unmarried |
| Less than High School | 8 (16.7%) | 40 (83.3%) |
| High School Diploma | 81 (30.1%) | 188 (69.9%) |
| College or Associate's Degree | 270 (75.2%) | 89 (24.8%) |
| Bachelor's Degree | 665 (94.3%) | 40 (5.7%) |
| Graduate Degree | 314 (100.0%) | 0 (0.0%) |
| Total | 1,337 (78.9%) | 358 (21.1%) |
Employment Characteristics in Thousand Oaks
Employment by Class of Employer in Thousand Oaks
Among the 60,297 employed individuals in Thousand Oaks, private company employees (41,609 | 69.0%), self-employed (not incorporated) (5,349 | 8.9%), and not-for-profit organizations (3,911 | 6.5%) make up the most common classes of employment.
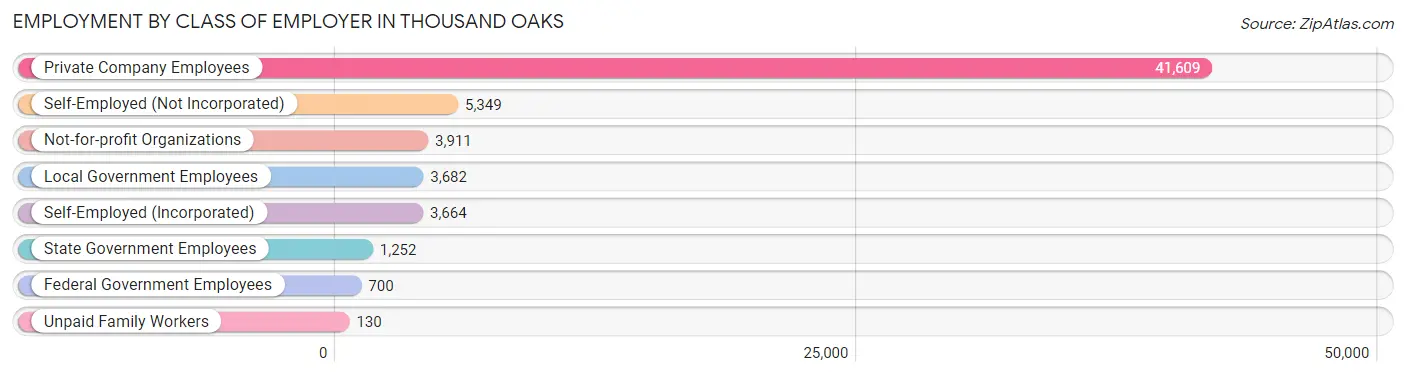
| Employer Class | # Employees | % Employees |
| Private Company Employees | 41,609 | 69.0% |
| Self-Employed (Incorporated) | 3,664 | 6.1% |
| Self-Employed (Not Incorporated) | 5,349 | 8.9% |
| Not-for-profit Organizations | 3,911 | 6.5% |
| Local Government Employees | 3,682 | 6.1% |
| State Government Employees | 1,252 | 2.1% |
| Federal Government Employees | 700 | 1.2% |
| Unpaid Family Workers | 130 | 0.2% |
| Total | 60,297 | 100.0% |
Employment Status by Age in Thousand Oaks
According to the labor force statistics for Thousand Oaks, out of the total population over 16 years of age (104,393), 62.4% or 65,141 individuals are in the labor force, with 4.8% or 3,127 of them unemployed. The age group with the highest labor force participation rate is 45 to 54 years, with 85.0% or 15,260 individuals in the labor force. Within the labor force, the 16 to 19 years age range has the highest percentage of unemployed individuals, with 9.9% or 255 of them being unemployed.
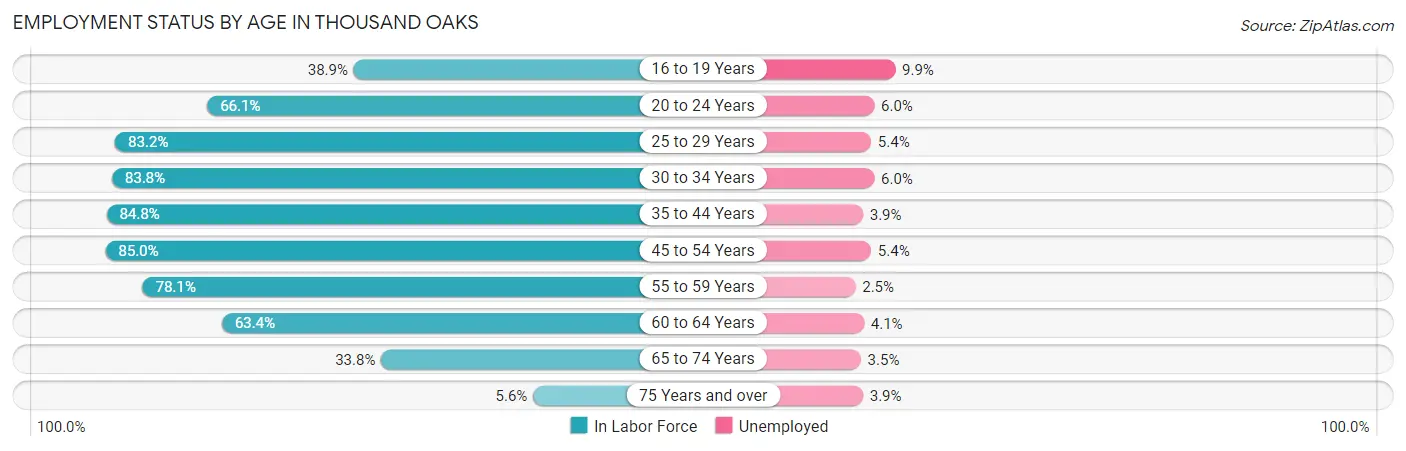
| Age Bracket | In Labor Force | Unemployed |
| 16 to 19 Years | 2,574 (38.9%) | 255 (9.9%) |
| 20 to 24 Years | 5,417 (66.1%) | 325 (6.0%) |
| 25 to 29 Years | 5,465 (83.2%) | 295 (5.4%) |
| 30 to 34 Years | 5,280 (83.8%) | 317 (6.0%) |
| 35 to 44 Years | 12,105 (84.8%) | 472 (3.9%) |
| 45 to 54 Years | 15,260 (85.0%) | 824 (5.4%) |
| 55 to 59 Years | 7,818 (78.1%) | 195 (2.5%) |
| 60 to 64 Years | 5,932 (63.4%) | 243 (4.1%) |
| 65 to 74 Years | 4,594 (33.8%) | 161 (3.5%) |
| 75 Years and over | 645 (5.6%) | 25 (3.9%) |
| Total | 65,141 (62.4%) | 3,127 (4.8%) |
Employment Status by Educational Attainment in Thousand Oaks
According to labor force statistics for Thousand Oaks, 80.4% of individuals (51,830) out of the total population between 25 and 64 years of age (64,465) are in the labor force, with 4.5% or 2,332 of them being unemployed. The group with the highest labor force participation rate are those with the educational attainment of bachelor's degree or higher, with 84.0% or 27,854 individuals in the labor force. Within the labor force, individuals with college / associate degree education have the highest percentage of unemployment, with 6.4% or 956 of them being unemployed.
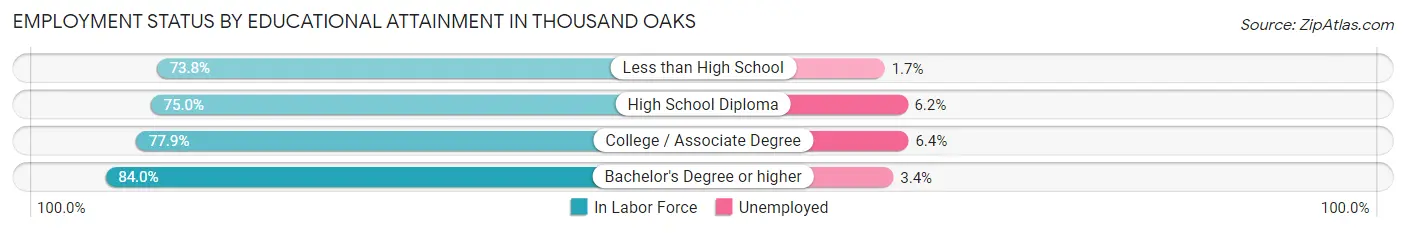
| Educational Attainment | In Labor Force | Unemployed |
| Less than High School | 2,672 (73.8%) | 62 (1.7%) |
| High School Diploma | 6,386 (75.0%) | 528 (6.2%) |
| College / Associate Degree | 14,933 (77.9%) | 1,227 (6.4%) |
| Bachelor's Degree or higher | 27,854 (84.0%) | 1,127 (3.4%) |
| Total | 51,830 (80.4%) | 2,901 (4.5%) |
Employment Occupations by Sex in Thousand Oaks
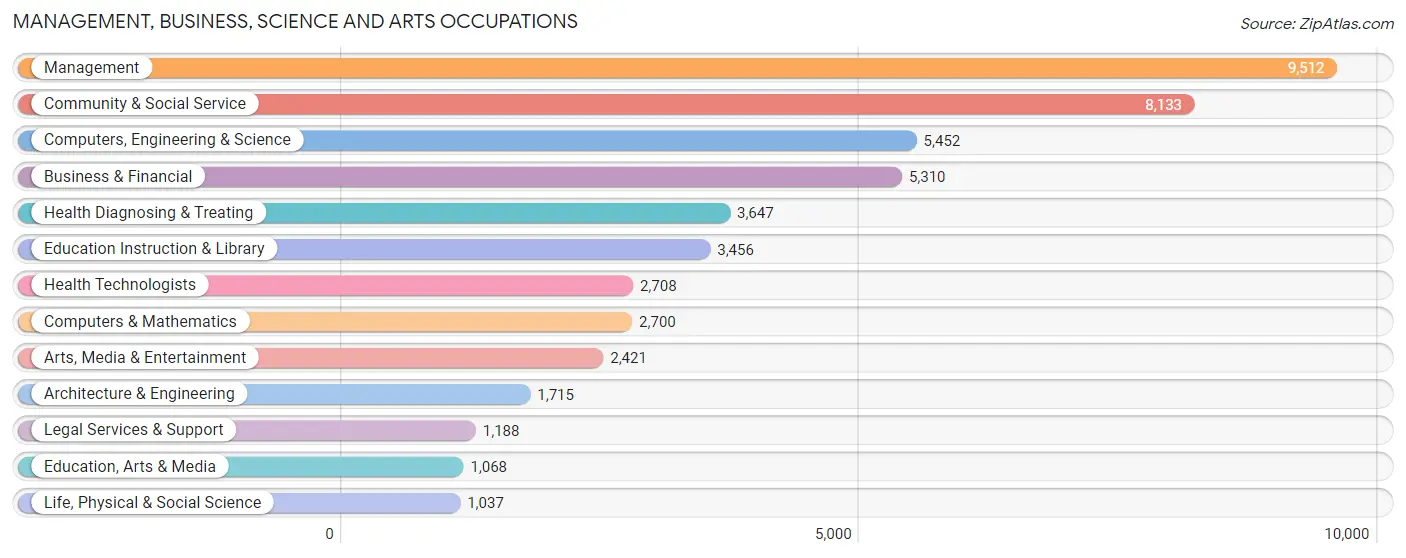
Management, Business, Science and Arts Occupations
The most common Management, Business, Science and Arts occupations in Thousand Oaks are Management (9,512 | 15.4%), Community & Social Service (8,133 | 13.2%), Computers, Engineering & Science (5,452 | 8.8%), Business & Financial (5,310 | 8.6%), and Health Diagnosing & Treating (3,647 | 5.9%).
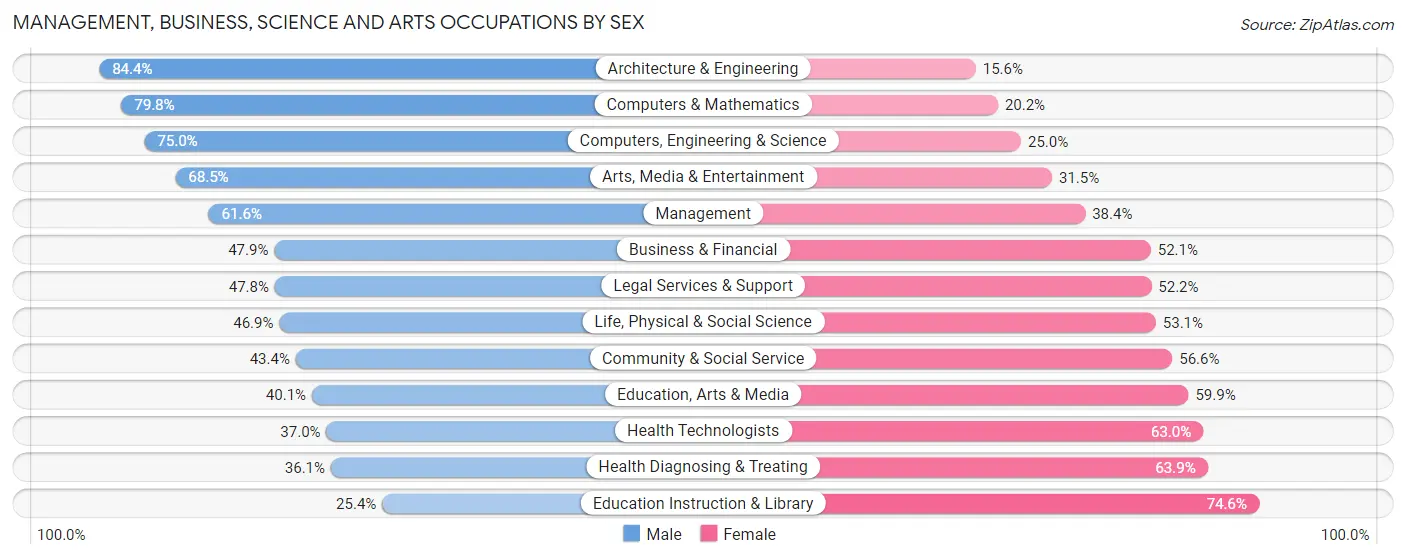
Management, Business, Science and Arts Occupations by Sex
Within the Management, Business, Science and Arts occupations in Thousand Oaks, the most male-oriented occupations are Architecture & Engineering (84.4%), Computers & Mathematics (79.8%), and Computers, Engineering & Science (75.0%), while the most female-oriented occupations are Education Instruction & Library (74.6%), Health Diagnosing & Treating (63.9%), and Health Technologists (63.0%).
| Occupation | Male | Female |
| Management | 5,859 (61.6%) | 3,653 (38.4%) |
| Business & Financial | 2,545 (47.9%) | 2,765 (52.1%) |
| Computers, Engineering & Science | 4,089 (75.0%) | 1,363 (25.0%) |
| Computers & Mathematics | 2,155 (79.8%) | 545 (20.2%) |
| Architecture & Engineering | 1,448 (84.4%) | 267 (15.6%) |
| Life, Physical & Social Science | 486 (46.9%) | 551 (53.1%) |
| Community & Social Service | 3,533 (43.4%) | 4,600 (56.6%) |
| Education, Arts & Media | 428 (40.1%) | 640 (59.9%) |
| Legal Services & Support | 568 (47.8%) | 620 (52.2%) |
| Education Instruction & Library | 878 (25.4%) | 2,578 (74.6%) |
| Arts, Media & Entertainment | 1,659 (68.5%) | 762 (31.5%) |
| Health Diagnosing & Treating | 1,317 (36.1%) | 2,330 (63.9%) |
| Health Technologists | 1,003 (37.0%) | 1,705 (63.0%) |
| Total (Category) | 17,343 (54.1%) | 14,711 (45.9%) |
| Total (Overall) | 33,094 (53.5%) | 28,758 (46.5%) |
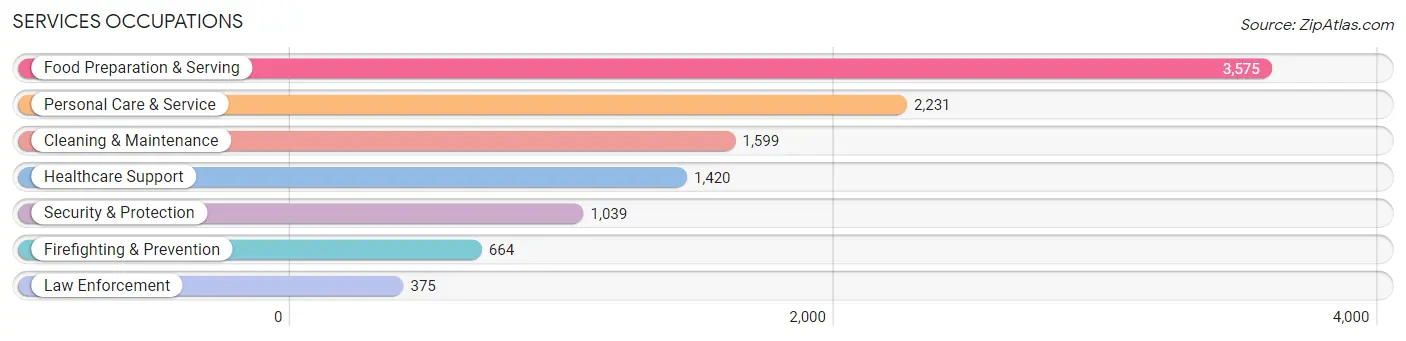
Services Occupations
The most common Services occupations in Thousand Oaks are Food Preparation & Serving (3,575 | 5.8%), Personal Care & Service (2,231 | 3.6%), Cleaning & Maintenance (1,599 | 2.6%), Healthcare Support (1,420 | 2.3%), and Security & Protection (1,039 | 1.7%).
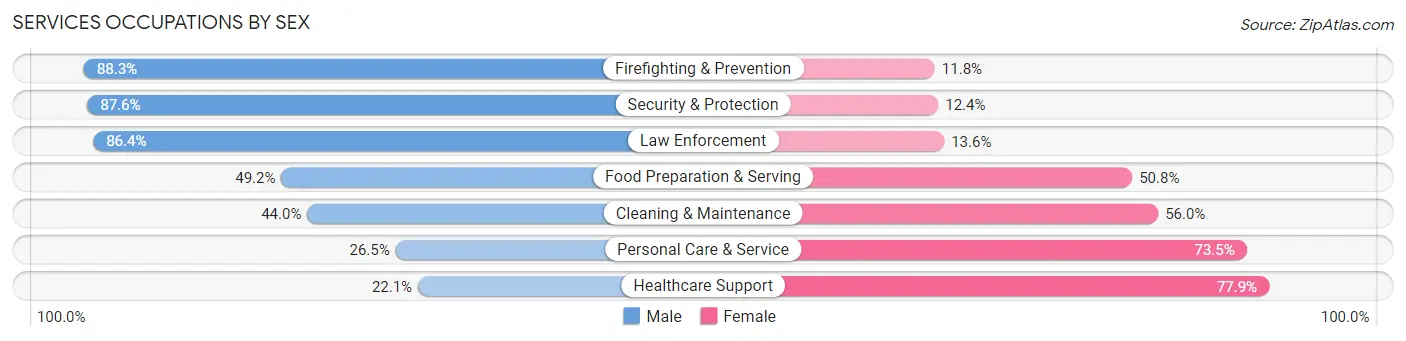
Services Occupations by Sex
Within the Services occupations in Thousand Oaks, the most male-oriented occupations are Firefighting & Prevention (88.2%), Security & Protection (87.6%), and Law Enforcement (86.4%), while the most female-oriented occupations are Healthcare Support (77.9%), Personal Care & Service (73.5%), and Cleaning & Maintenance (56.0%).
| Occupation | Male | Female |
| Healthcare Support | 314 (22.1%) | 1,106 (77.9%) |
| Security & Protection | 910 (87.6%) | 129 (12.4%) |
| Firefighting & Prevention | 586 (88.2%) | 78 (11.7%) |
| Law Enforcement | 324 (86.4%) | 51 (13.6%) |
| Food Preparation & Serving | 1,758 (49.2%) | 1,817 (50.8%) |
| Cleaning & Maintenance | 704 (44.0%) | 895 (56.0%) |
| Personal Care & Service | 592 (26.5%) | 1,639 (73.5%) |
| Total (Category) | 4,278 (43.4%) | 5,586 (56.6%) |
| Total (Overall) | 33,094 (53.5%) | 28,758 (46.5%) |
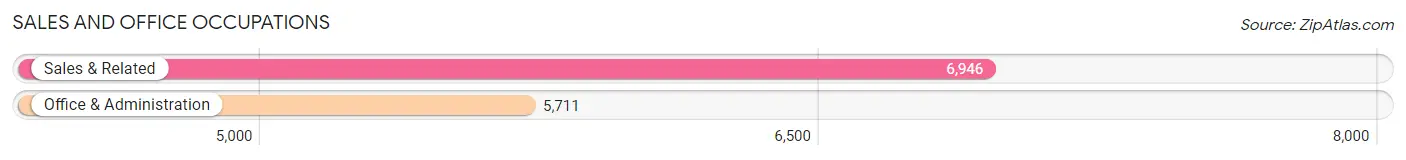
Sales and Office Occupations
The most common Sales and Office occupations in Thousand Oaks are Sales & Related (6,946 | 11.2%), and Office & Administration (5,711 | 9.2%).
Sales and Office Occupations by Sex
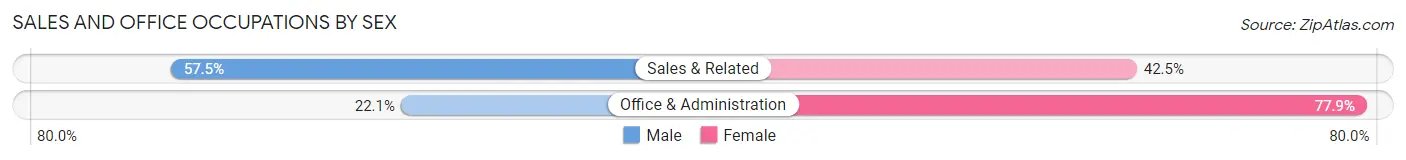
| Occupation | Male | Female |
| Sales & Related | 3,994 (57.5%) | 2,952 (42.5%) |
| Office & Administration | 1,263 (22.1%) | 4,448 (77.9%) |
| Total (Category) | 5,257 (41.5%) | 7,400 (58.5%) |
| Total (Overall) | 33,094 (53.5%) | 28,758 (46.5%) |
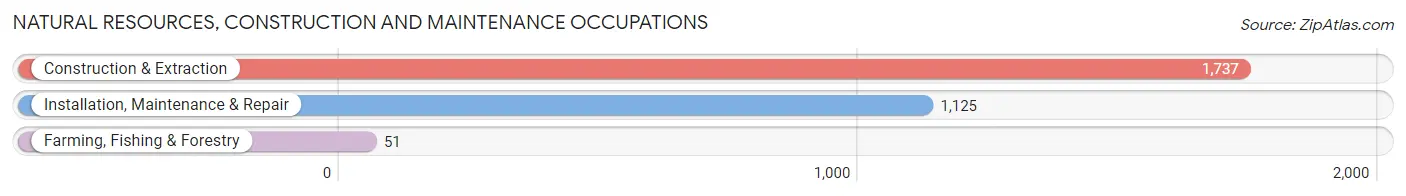
Natural Resources, Construction and Maintenance Occupations
The most common Natural Resources, Construction and Maintenance occupations in Thousand Oaks are Construction & Extraction (1,737 | 2.8%), Installation, Maintenance & Repair (1,125 | 1.8%), and Farming, Fishing & Forestry (51 | 0.1%).
Natural Resources, Construction and Maintenance Occupations by Sex
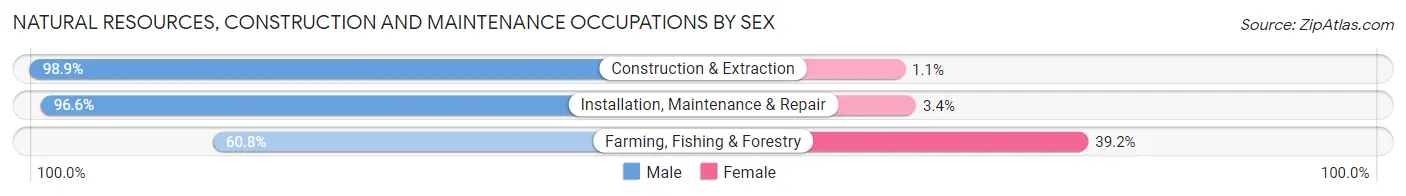
| Occupation | Male | Female |
| Farming, Fishing & Forestry | 31 (60.8%) | 20 (39.2%) |
| Construction & Extraction | 1,718 (98.9%) | 19 (1.1%) |
| Installation, Maintenance & Repair | 1,087 (96.6%) | 38 (3.4%) |
| Total (Category) | 2,836 (97.4%) | 77 (2.6%) |
| Total (Overall) | 33,094 (53.5%) | 28,758 (46.5%) |
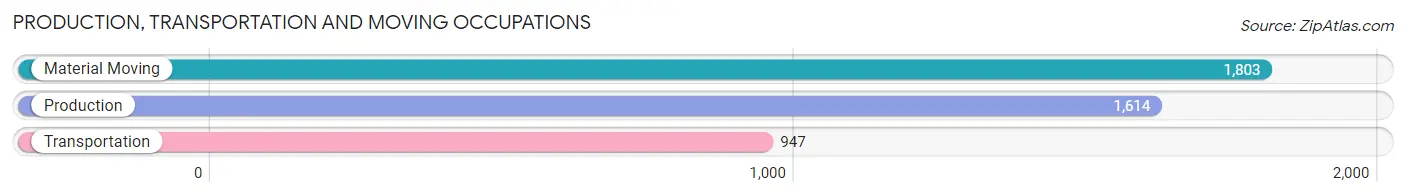
Production, Transportation and Moving Occupations
The most common Production, Transportation and Moving occupations in Thousand Oaks are Material Moving (1,803 | 2.9%), Production (1,614 | 2.6%), and Transportation (947 | 1.5%).
Production, Transportation and Moving Occupations by Sex
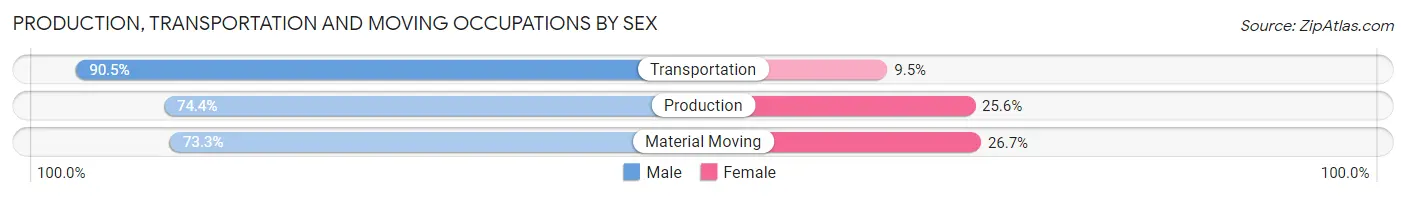
| Occupation | Male | Female |
| Production | 1,201 (74.4%) | 413 (25.6%) |
| Transportation | 857 (90.5%) | 90 (9.5%) |
| Material Moving | 1,322 (73.3%) | 481 (26.7%) |
| Total (Category) | 3,380 (77.4%) | 984 (22.6%) |
| Total (Overall) | 33,094 (53.5%) | 28,758 (46.5%) |
Employment Industries by Sex in Thousand Oaks
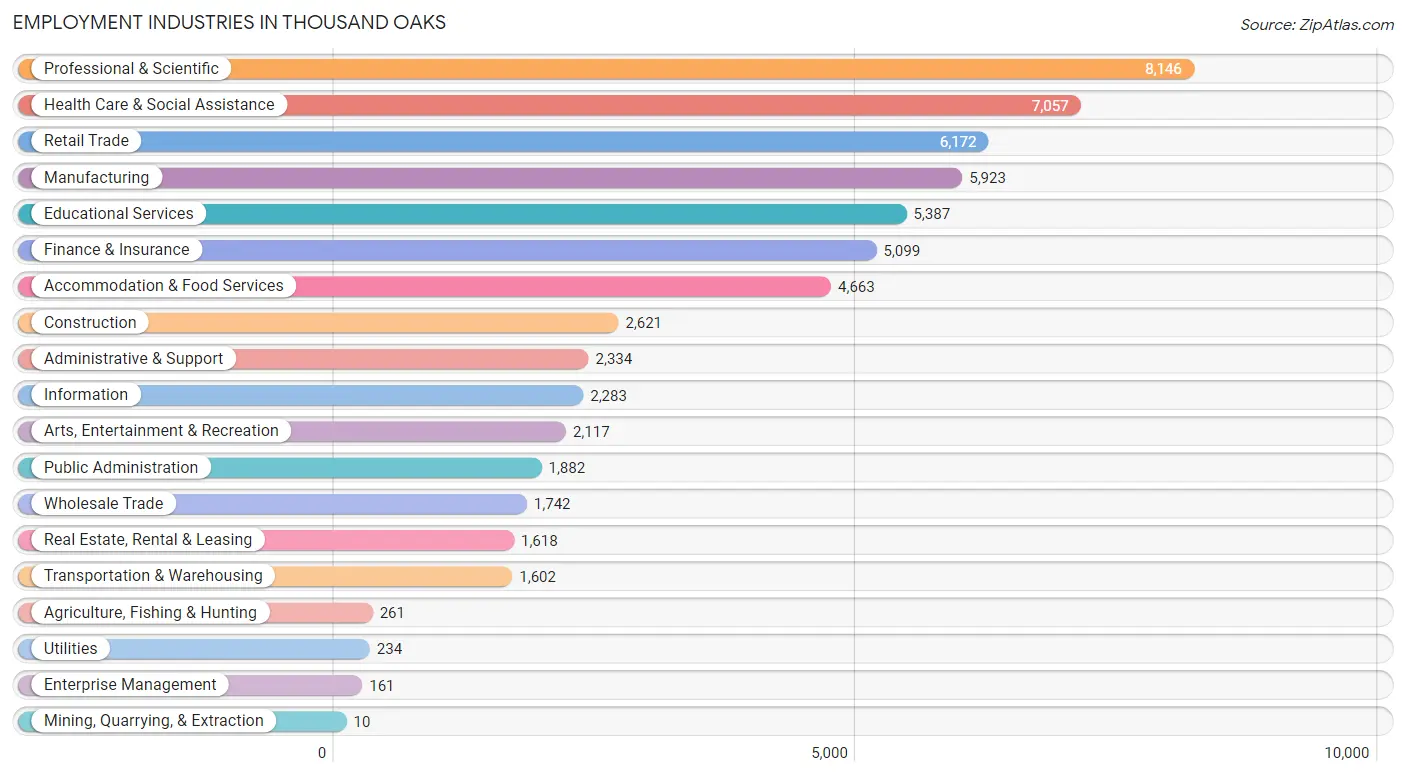
Employment Industries in Thousand Oaks
The major employment industries in Thousand Oaks include Professional & Scientific (8,146 | 13.2%), Health Care & Social Assistance (7,057 | 11.4%), Retail Trade (6,172 | 10.0%), Manufacturing (5,923 | 9.6%), and Educational Services (5,387 | 8.7%).
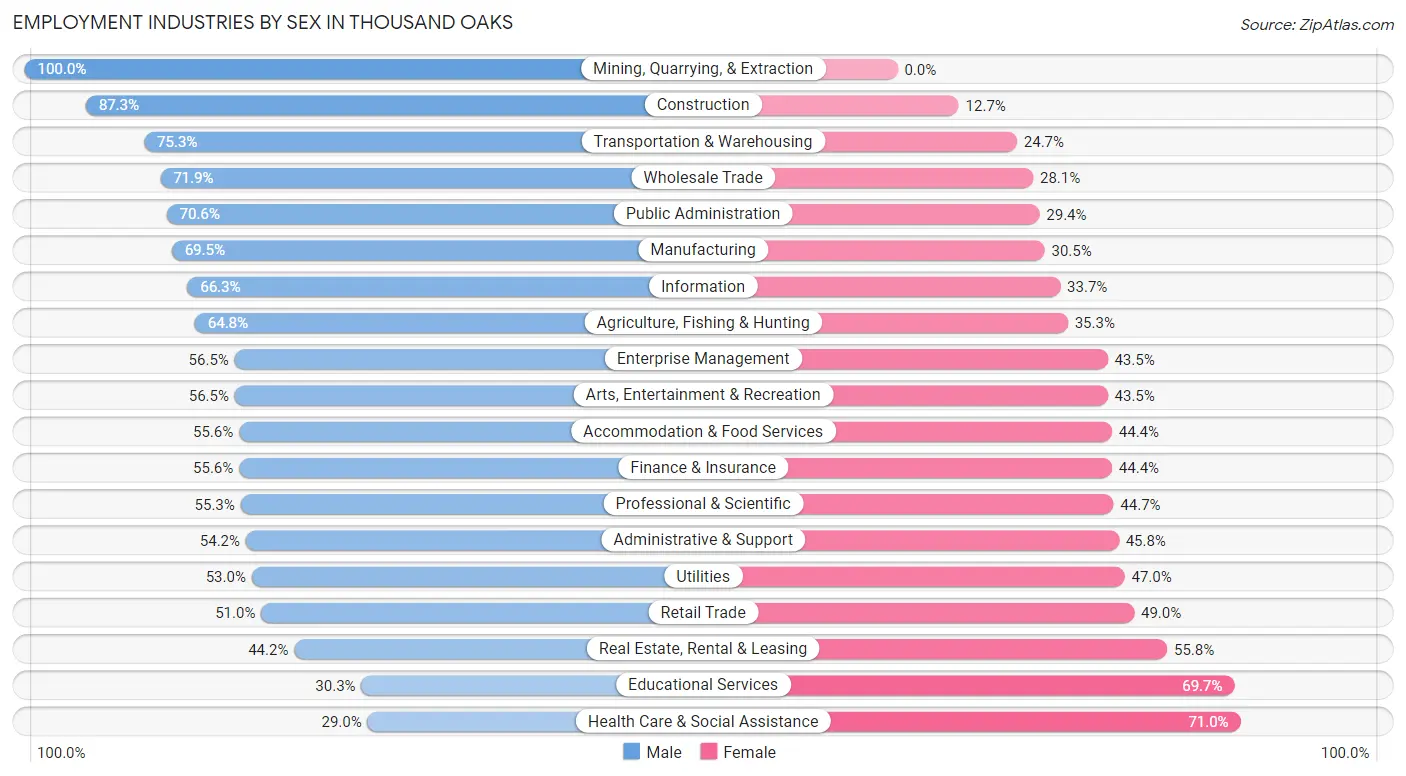
Employment Industries by Sex in Thousand Oaks
The Thousand Oaks industries that see more men than women are Mining, Quarrying, & Extraction (100.0%), Construction (87.3%), and Transportation & Warehousing (75.3%), whereas the industries that tend to have a higher number of women are Health Care & Social Assistance (71.0%), Educational Services (69.7%), and Real Estate, Rental & Leasing (55.8%).
| Industry | Male | Female |
| Agriculture, Fishing & Hunting | 169 (64.7%) | 92 (35.2%) |
| Mining, Quarrying, & Extraction | 10 (100.0%) | 0 (0.0%) |
| Construction | 2,289 (87.3%) | 332 (12.7%) |
| Manufacturing | 4,119 (69.5%) | 1,804 (30.5%) |
| Wholesale Trade | 1,253 (71.9%) | 489 (28.1%) |
| Retail Trade | 3,149 (51.0%) | 3,023 (49.0%) |
| Transportation & Warehousing | 1,206 (75.3%) | 396 (24.7%) |
| Utilities | 124 (53.0%) | 110 (47.0%) |
| Information | 1,514 (66.3%) | 769 (33.7%) |
| Finance & Insurance | 2,835 (55.6%) | 2,264 (44.4%) |
| Real Estate, Rental & Leasing | 715 (44.2%) | 903 (55.8%) |
| Professional & Scientific | 4,504 (55.3%) | 3,642 (44.7%) |
| Enterprise Management | 91 (56.5%) | 70 (43.5%) |
| Administrative & Support | 1,265 (54.2%) | 1,069 (45.8%) |
| Educational Services | 1,631 (30.3%) | 3,756 (69.7%) |
| Health Care & Social Assistance | 2,047 (29.0%) | 5,010 (71.0%) |
| Arts, Entertainment & Recreation | 1,196 (56.5%) | 921 (43.5%) |
| Accommodation & Food Services | 2,593 (55.6%) | 2,070 (44.4%) |
| Public Administration | 1,329 (70.6%) | 553 (29.4%) |
| Total | 33,094 (53.5%) | 28,758 (46.5%) |
Education in Thousand Oaks
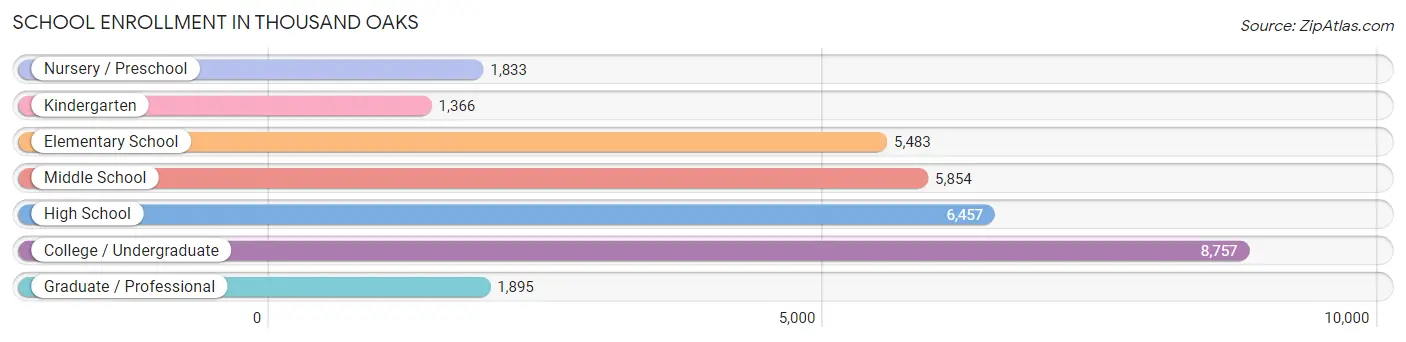
School Enrollment in Thousand Oaks
The most common levels of schooling among the 31,645 students in Thousand Oaks are college / undergraduate (8,757 | 27.7%), high school (6,457 | 20.4%), and middle school (5,854 | 18.5%).
| School Level | # Students | % Students |
| Nursery / Preschool | 1,833 | 5.8% |
| Kindergarten | 1,366 | 4.3% |
| Elementary School | 5,483 | 17.3% |
| Middle School | 5,854 | 18.5% |
| High School | 6,457 | 20.4% |
| College / Undergraduate | 8,757 | 27.7% |
| Graduate / Professional | 1,895 | 6.0% |
| Total | 31,645 | 100.0% |
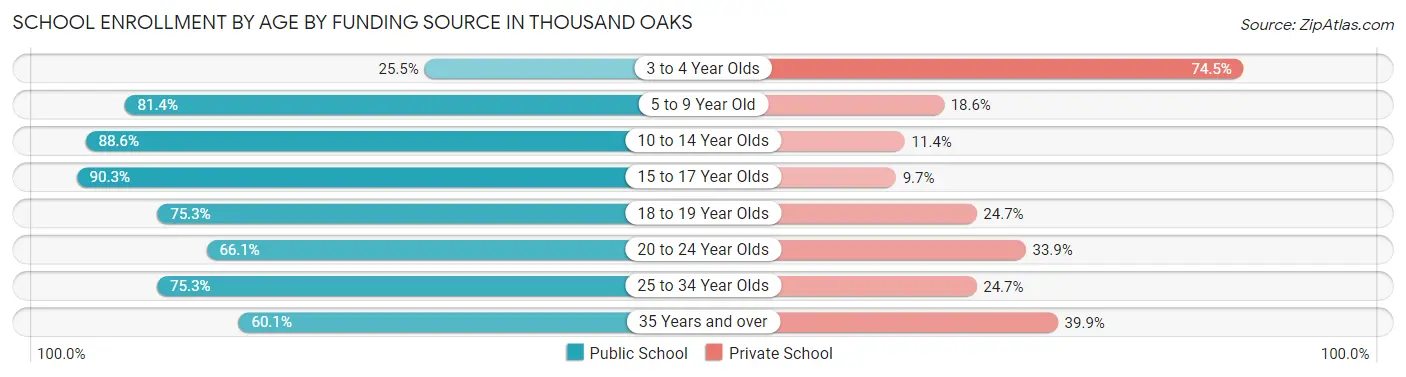
School Enrollment by Age by Funding Source in Thousand Oaks
Out of a total of 31,645 students who are enrolled in schools in Thousand Oaks, 7,152 (22.6%) attend a private institution, while the remaining 24,493 (77.4%) are enrolled in public schools. The age group of 3 to 4 year olds has the highest likelihood of being enrolled in private schools, with 1,087 (74.5% in the age bracket) enrolled. Conversely, the age group of 15 to 17 year olds has the lowest likelihood of being enrolled in a private school, with 4,238 (90.3% in the age bracket) attending a public institution.
| Age Bracket | Public School | Private School |
| 3 to 4 Year Olds | 372 (25.5%) | 1,087 (74.5%) |
| 5 to 9 Year Old | 5,364 (81.4%) | 1,228 (18.6%) |
| 10 to 14 Year Olds | 6,672 (88.6%) | 855 (11.4%) |
| 15 to 17 Year Olds | 4,238 (90.3%) | 455 (9.7%) |
| 18 to 19 Year Olds | 2,053 (75.3%) | 674 (24.7%) |
| 20 to 24 Year Olds | 3,275 (66.1%) | 1,678 (33.9%) |
| 25 to 34 Year Olds | 1,512 (75.3%) | 496 (24.7%) |
| 35 Years and over | 1,014 (60.1%) | 672 (39.9%) |
| Total | 24,493 (77.4%) | 7,152 (22.6%) |
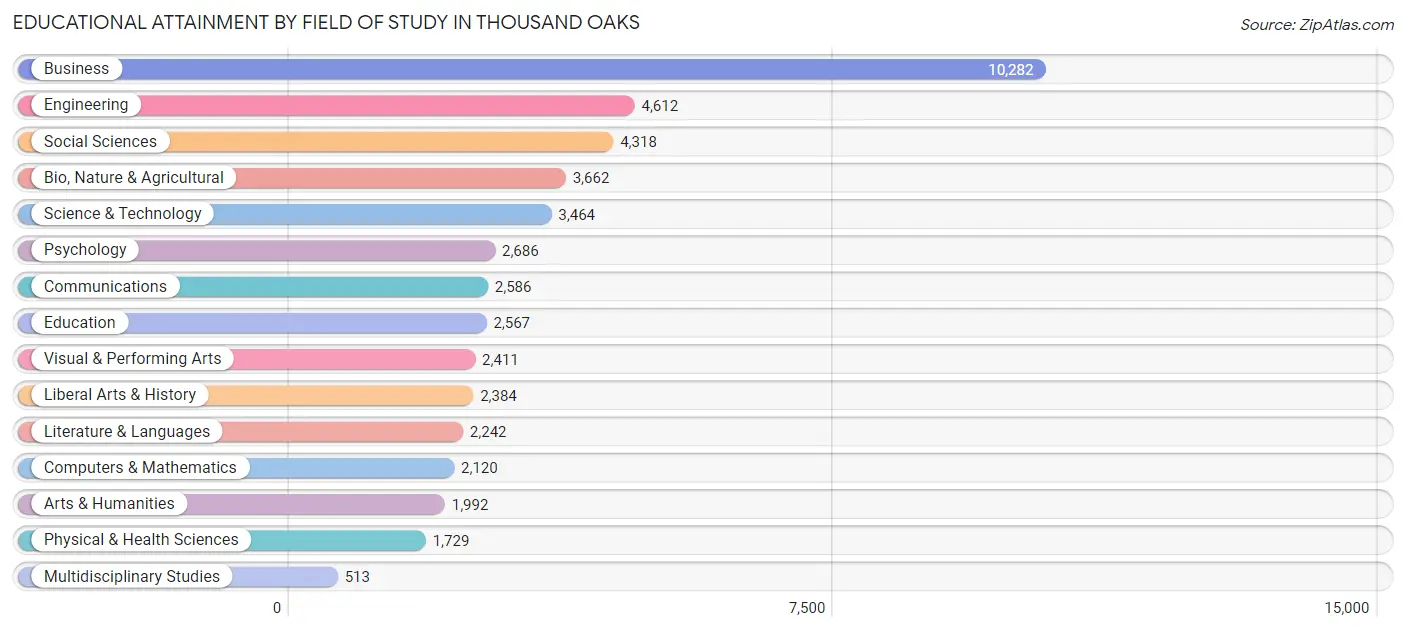
Educational Attainment by Field of Study in Thousand Oaks
Business (10,282 | 21.6%), engineering (4,612 | 9.7%), social sciences (4,318 | 9.1%), bio, nature & agricultural (3,662 | 7.7%), and science & technology (3,464 | 7.3%) are the most common fields of study among 47,568 individuals in Thousand Oaks who have obtained a bachelor's degree or higher.
| Field of Study | # Graduates | % Graduates |
| Computers & Mathematics | 2,120 | 4.5% |
| Bio, Nature & Agricultural | 3,662 | 7.7% |
| Physical & Health Sciences | 1,729 | 3.6% |
| Psychology | 2,686 | 5.7% |
| Social Sciences | 4,318 | 9.1% |
| Engineering | 4,612 | 9.7% |
| Multidisciplinary Studies | 513 | 1.1% |
| Science & Technology | 3,464 | 7.3% |
| Business | 10,282 | 21.6% |
| Education | 2,567 | 5.4% |
| Literature & Languages | 2,242 | 4.7% |
| Liberal Arts & History | 2,384 | 5.0% |
| Visual & Performing Arts | 2,411 | 5.1% |
| Communications | 2,586 | 5.4% |
| Arts & Humanities | 1,992 | 4.2% |
| Total | 47,568 | 100.0% |
Transportation & Commute in Thousand Oaks
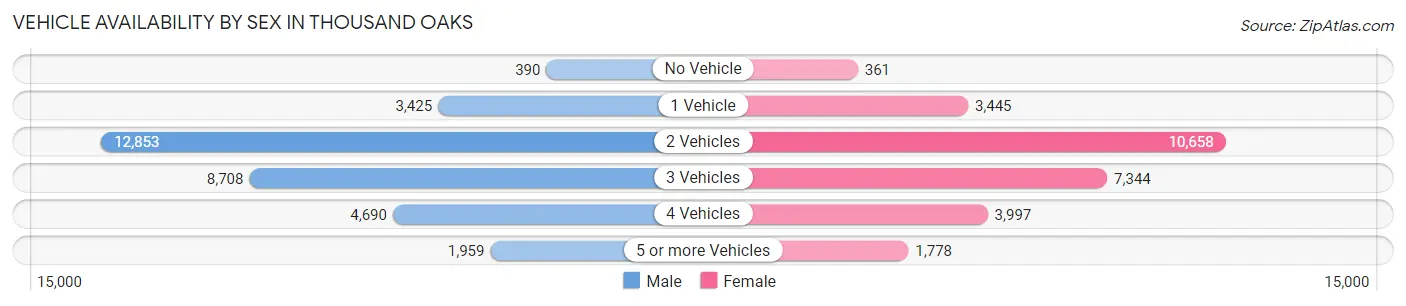
Vehicle Availability by Sex in Thousand Oaks
The most prevalent vehicle ownership categories in Thousand Oaks are males with 2 vehicles (12,853, accounting for 40.1%) and females with 2 vehicles (10,658, making up 46.6%).
| Vehicles Available | Male | Female |
| No Vehicle | 390 (1.2%) | 361 (1.3%) |
| 1 Vehicle | 3,425 (10.7%) | 3,445 (12.5%) |
| 2 Vehicles | 12,853 (40.1%) | 10,658 (38.6%) |
| 3 Vehicles | 8,708 (27.2%) | 7,344 (26.6%) |
| 4 Vehicles | 4,690 (14.6%) | 3,997 (14.5%) |
| 5 or more Vehicles | 1,959 (6.1%) | 1,778 (6.5%) |
| Total | 32,025 (100.0%) | 27,583 (100.0%) |
Commute Time in Thousand Oaks
The most frequently occuring commute durations in Thousand Oaks are 10 to 14 minutes (9,483 commuters, 19.3%), 15 to 19 minutes (9,449 commuters, 19.2%), and 20 to 24 minutes (6,094 commuters, 12.4%).
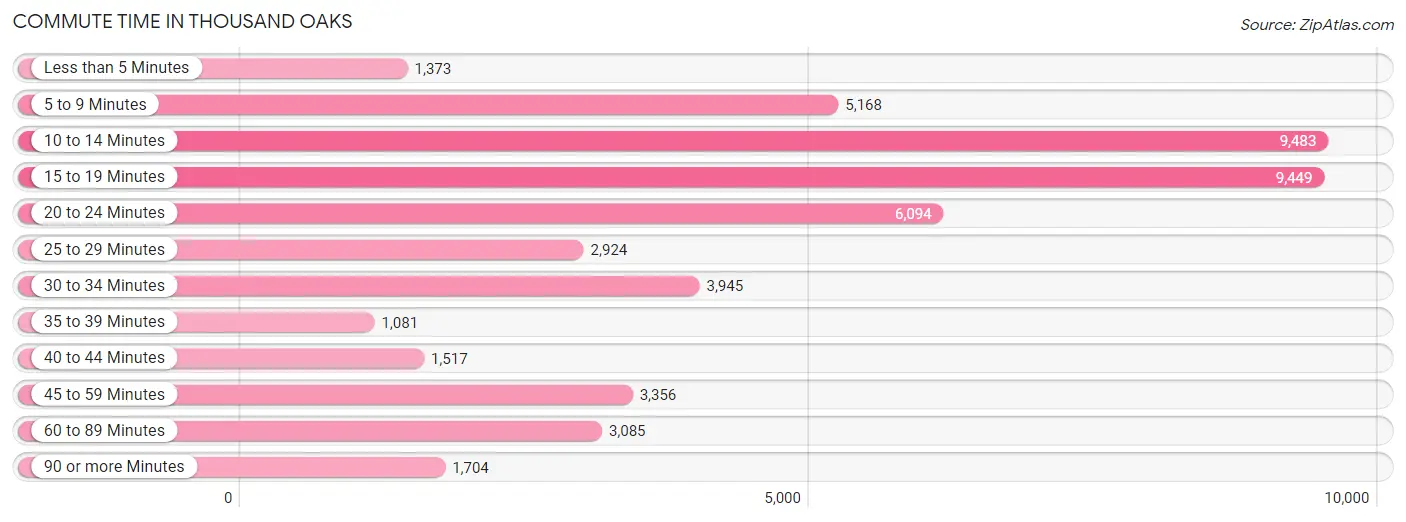
| Commute Time | # Commuters | % Commuters |
| Less than 5 Minutes | 1,373 | 2.8% |
| 5 to 9 Minutes | 5,168 | 10.5% |
| 10 to 14 Minutes | 9,483 | 19.3% |
| 15 to 19 Minutes | 9,449 | 19.2% |
| 20 to 24 Minutes | 6,094 | 12.4% |
| 25 to 29 Minutes | 2,924 | 5.9% |
| 30 to 34 Minutes | 3,945 | 8.0% |
| 35 to 39 Minutes | 1,081 | 2.2% |
| 40 to 44 Minutes | 1,517 | 3.1% |
| 45 to 59 Minutes | 3,356 | 6.8% |
| 60 to 89 Minutes | 3,085 | 6.3% |
| 90 or more Minutes | 1,704 | 3.5% |
Commute Time by Sex in Thousand Oaks
The most common commute times in Thousand Oaks are 15 to 19 minutes (4,988 commuters, 18.7%) for males and 10 to 14 minutes (5,218 commuters, 23.1%) for females.
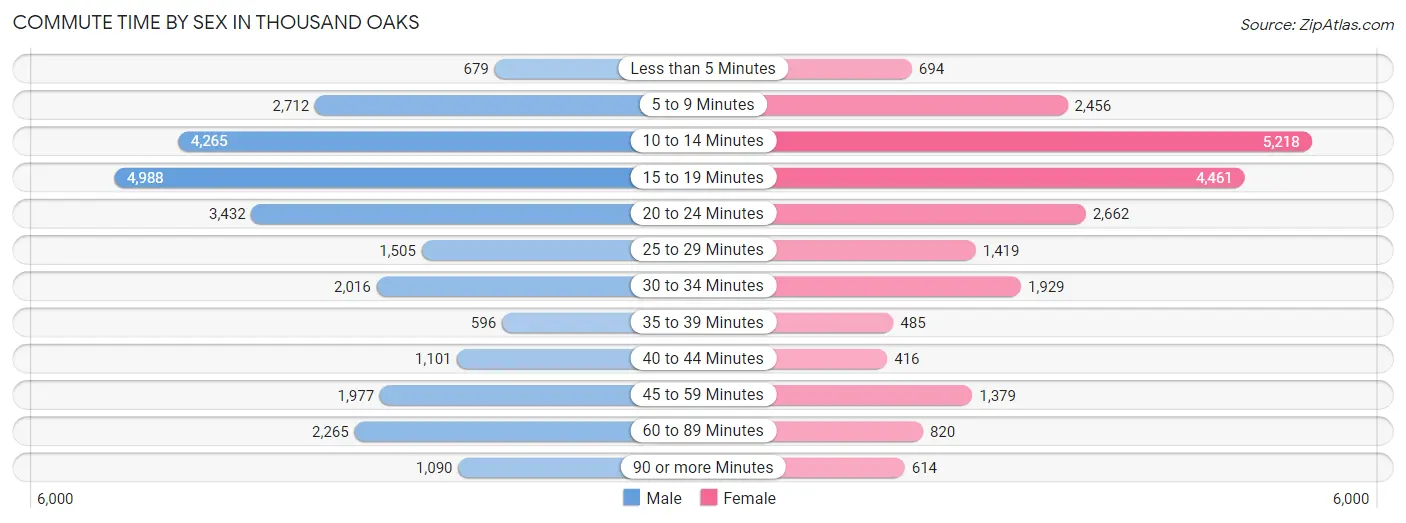
| Commute Time | Male | Female |
| Less than 5 Minutes | 679 (2.5%) | 694 (3.1%) |
| 5 to 9 Minutes | 2,712 (10.2%) | 2,456 (10.9%) |
| 10 to 14 Minutes | 4,265 (16.0%) | 5,218 (23.1%) |
| 15 to 19 Minutes | 4,988 (18.7%) | 4,461 (19.8%) |
| 20 to 24 Minutes | 3,432 (12.9%) | 2,662 (11.8%) |
| 25 to 29 Minutes | 1,505 (5.7%) | 1,419 (6.3%) |
| 30 to 34 Minutes | 2,016 (7.6%) | 1,929 (8.6%) |
| 35 to 39 Minutes | 596 (2.2%) | 485 (2.1%) |
| 40 to 44 Minutes | 1,101 (4.1%) | 416 (1.8%) |
| 45 to 59 Minutes | 1,977 (7.4%) | 1,379 (6.1%) |
| 60 to 89 Minutes | 2,265 (8.5%) | 820 (3.6%) |
| 90 or more Minutes | 1,090 (4.1%) | 614 (2.7%) |
Time of Departure to Work by Sex in Thousand Oaks
The most frequent times of departure to work in Thousand Oaks are 8:00 AM to 8:29 AM (3,605, 13.5%) for males and 8:00 AM to 8:29 AM (3,586, 15.9%) for females.
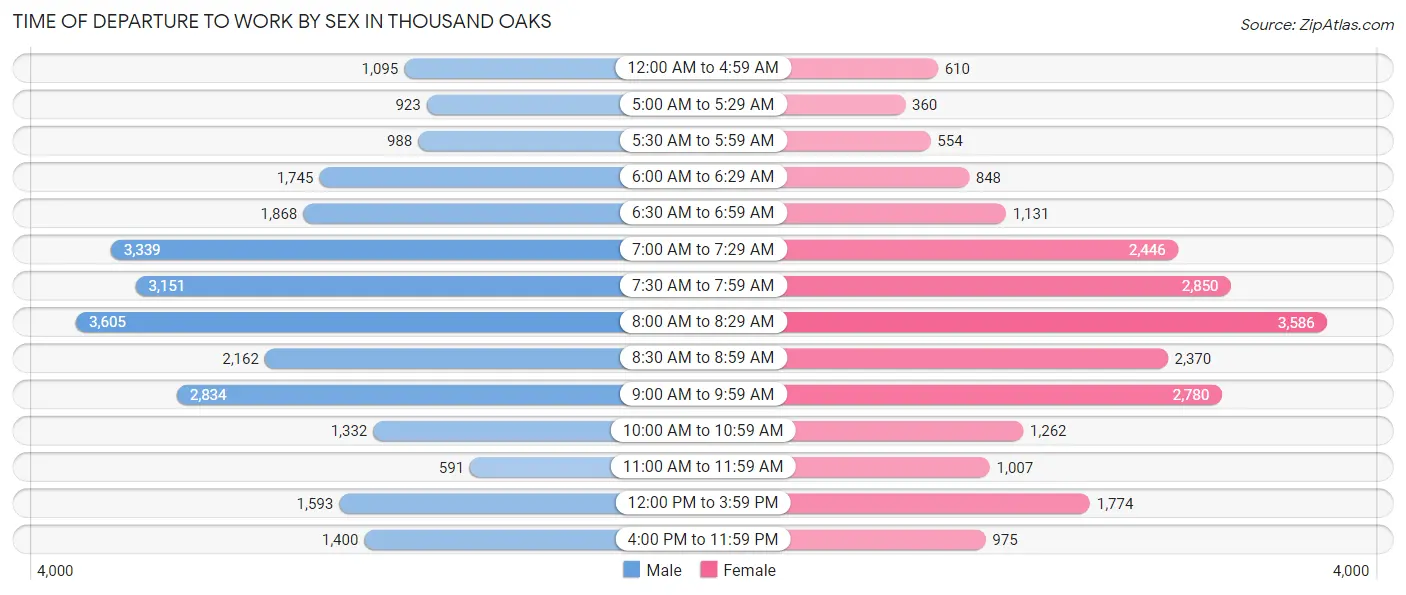
| Time of Departure | Male | Female |
| 12:00 AM to 4:59 AM | 1,095 (4.1%) | 610 (2.7%) |
| 5:00 AM to 5:29 AM | 923 (3.5%) | 360 (1.6%) |
| 5:30 AM to 5:59 AM | 988 (3.7%) | 554 (2.5%) |
| 6:00 AM to 6:29 AM | 1,745 (6.6%) | 848 (3.8%) |
| 6:30 AM to 6:59 AM | 1,868 (7.0%) | 1,131 (5.0%) |
| 7:00 AM to 7:29 AM | 3,339 (12.5%) | 2,446 (10.8%) |
| 7:30 AM to 7:59 AM | 3,151 (11.8%) | 2,850 (12.6%) |
| 8:00 AM to 8:29 AM | 3,605 (13.5%) | 3,586 (15.9%) |
| 8:30 AM to 8:59 AM | 2,162 (8.1%) | 2,370 (10.5%) |
| 9:00 AM to 9:59 AM | 2,834 (10.6%) | 2,780 (12.3%) |
| 10:00 AM to 10:59 AM | 1,332 (5.0%) | 1,262 (5.6%) |
| 11:00 AM to 11:59 AM | 591 (2.2%) | 1,007 (4.5%) |
| 12:00 PM to 3:59 PM | 1,593 (6.0%) | 1,774 (7.9%) |
| 4:00 PM to 11:59 PM | 1,400 (5.3%) | 975 (4.3%) |
| Total | 26,626 (100.0%) | 22,553 (100.0%) |
Housing Occupancy in Thousand Oaks
Occupancy by Ownership in Thousand Oaks
Of the total 46,143 dwellings in Thousand Oaks, owner-occupied units account for 31,952 (69.3%), while renter-occupied units make up 14,191 (30.7%).
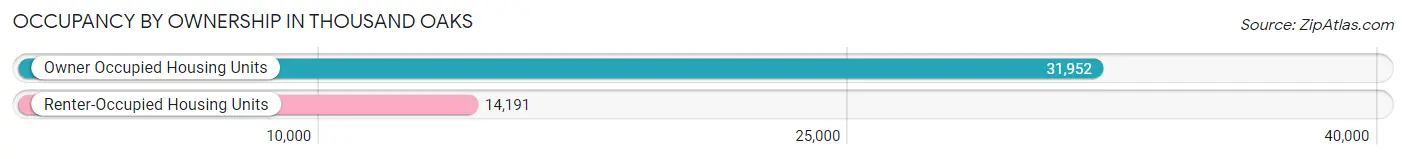
| Occupancy | # Housing Units | % Housing Units |
| Owner Occupied Housing Units | 31,952 | 69.3% |
| Renter-Occupied Housing Units | 14,191 | 30.7% |
| Total Occupied Housing Units | 46,143 | 100.0% |
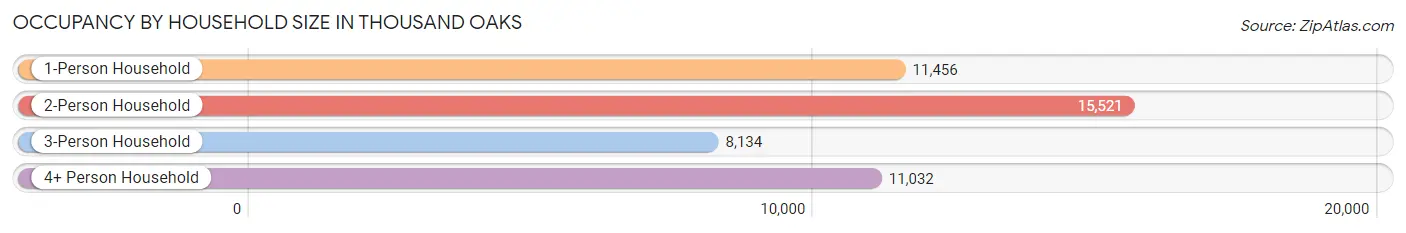
Occupancy by Household Size in Thousand Oaks
| Household Size | # Housing Units | % Housing Units |
| 1-Person Household | 11,456 | 24.8% |
| 2-Person Household | 15,521 | 33.6% |
| 3-Person Household | 8,134 | 17.6% |
| 4+ Person Household | 11,032 | 23.9% |
| Total Housing Units | 46,143 | 100.0% |
Occupancy by Ownership by Household Size in Thousand Oaks
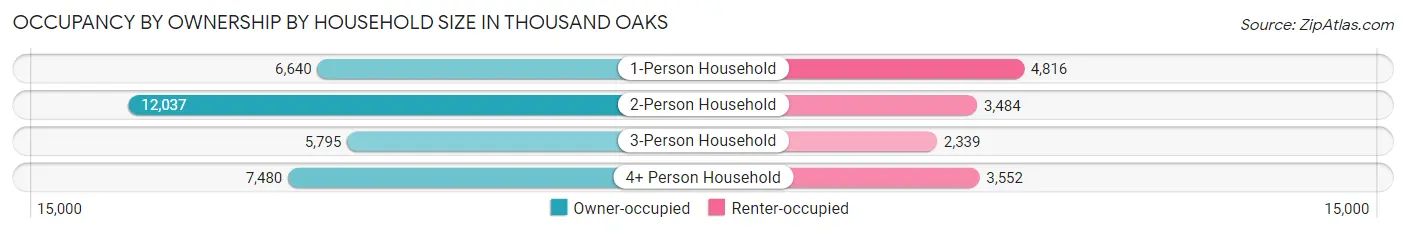
| Household Size | Owner-occupied | Renter-occupied |
| 1-Person Household | 6,640 (58.0%) | 4,816 (42.0%) |
| 2-Person Household | 12,037 (77.5%) | 3,484 (22.5%) |
| 3-Person Household | 5,795 (71.2%) | 2,339 (28.8%) |
| 4+ Person Household | 7,480 (67.8%) | 3,552 (32.2%) |
| Total Housing Units | 31,952 (69.3%) | 14,191 (30.7%) |
Occupancy by Educational Attainment in Thousand Oaks
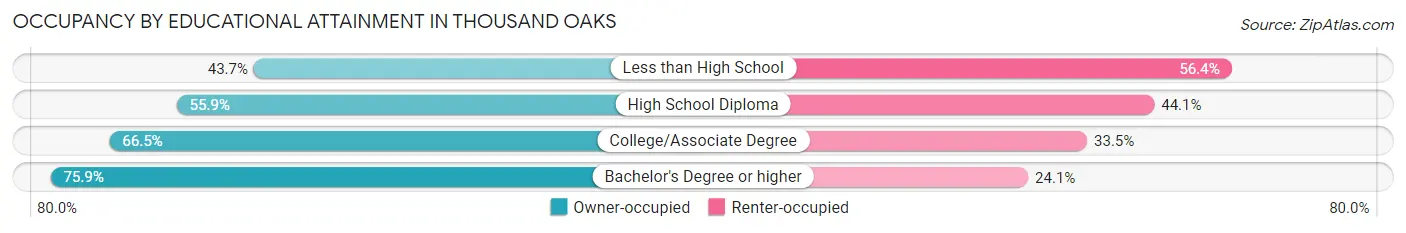
| Household Size | Owner-occupied | Renter-occupied |
| Less than High School | 915 (43.6%) | 1,181 (56.4%) |
| High School Diploma | 3,012 (55.9%) | 2,377 (44.1%) |
| College/Associate Degree | 9,332 (66.5%) | 4,693 (33.5%) |
| Bachelor's Degree or higher | 18,693 (75.9%) | 5,940 (24.1%) |
Occupancy by Age of Householder in Thousand Oaks
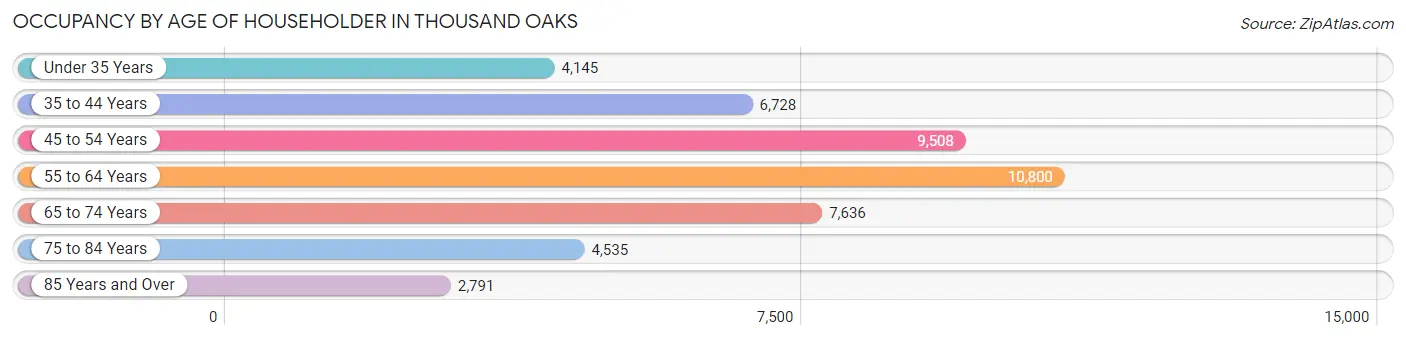
| Age Bracket | # Households | % Households |
| Under 35 Years | 4,145 | 9.0% |
| 35 to 44 Years | 6,728 | 14.6% |
| 45 to 54 Years | 9,508 | 20.6% |
| 55 to 64 Years | 10,800 | 23.4% |
| 65 to 74 Years | 7,636 | 16.6% |
| 75 to 84 Years | 4,535 | 9.8% |
| 85 Years and Over | 2,791 | 6.0% |
| Total | 46,143 | 100.0% |
Housing Finances in Thousand Oaks
Median Income by Occupancy in Thousand Oaks
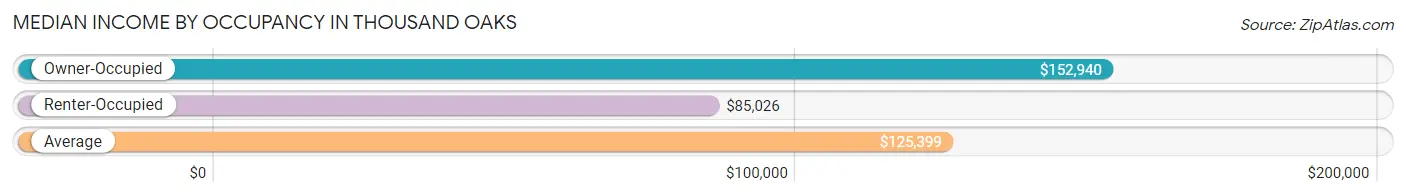
| Occupancy Type | # Households | Median Income |
| Owner-Occupied | 31,952 (69.3%) | $152,940 |
| Renter-Occupied | 14,191 (30.7%) | $85,026 |
| Average | 46,143 (100.0%) | $125,399 |
Occupancy by Householder Income Bracket in Thousand Oaks
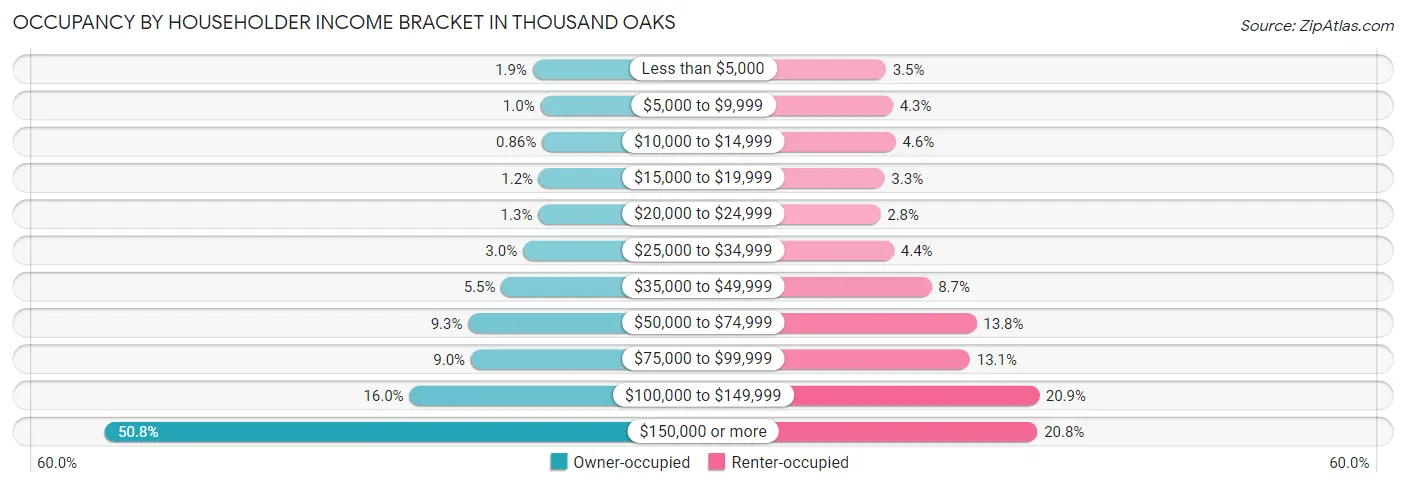
| Income Bracket | Owner-occupied | Renter-occupied |
| Less than $5,000 | 612 (1.9%) | 490 (3.5%) |
| $5,000 to $9,999 | 333 (1.0%) | 603 (4.3%) |
| $10,000 to $14,999 | 275 (0.9%) | 647 (4.6%) |
| $15,000 to $19,999 | 389 (1.2%) | 469 (3.3%) |
| $20,000 to $24,999 | 415 (1.3%) | 401 (2.8%) |
| $25,000 to $34,999 | 972 (3.0%) | 621 (4.4%) |
| $35,000 to $49,999 | 1,761 (5.5%) | 1,228 (8.6%) |
| $50,000 to $74,999 | 2,969 (9.3%) | 1,960 (13.8%) |
| $75,000 to $99,999 | 2,872 (9.0%) | 1,854 (13.1%) |
| $100,000 to $149,999 | 5,118 (16.0%) | 2,972 (20.9%) |
| $150,000 or more | 16,236 (50.8%) | 2,946 (20.8%) |
| Total | 31,952 (100.0%) | 14,191 (100.0%) |
Monthly Housing Cost Tiers in Thousand Oaks
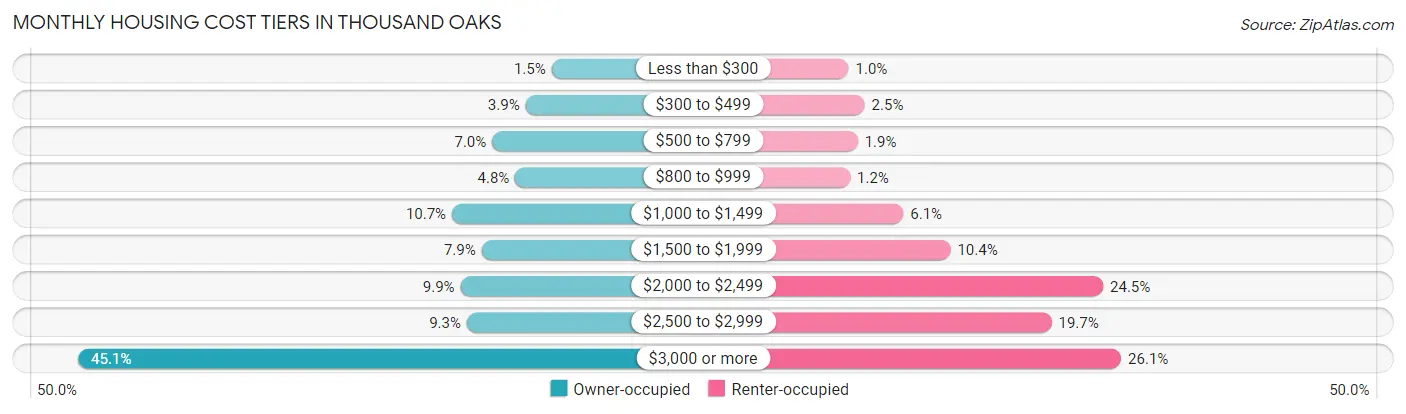
| Monthly Cost | Owner-occupied | Renter-occupied |
| Less than $300 | 476 (1.5%) | 146 (1.0%) |
| $300 to $499 | 1,242 (3.9%) | 356 (2.5%) |
| $500 to $799 | 2,225 (7.0%) | 266 (1.9%) |
| $800 to $999 | 1,546 (4.8%) | 166 (1.2%) |
| $1,000 to $1,499 | 3,406 (10.7%) | 862 (6.1%) |
| $1,500 to $1,999 | 2,534 (7.9%) | 1,477 (10.4%) |
| $2,000 to $2,499 | 3,156 (9.9%) | 3,471 (24.5%) |
| $2,500 to $2,999 | 2,967 (9.3%) | 2,797 (19.7%) |
| $3,000 or more | 14,400 (45.1%) | 3,707 (26.1%) |
| Total | 31,952 (100.0%) | 14,191 (100.0%) |
Physical Housing Characteristics in Thousand Oaks
Housing Structures in Thousand Oaks
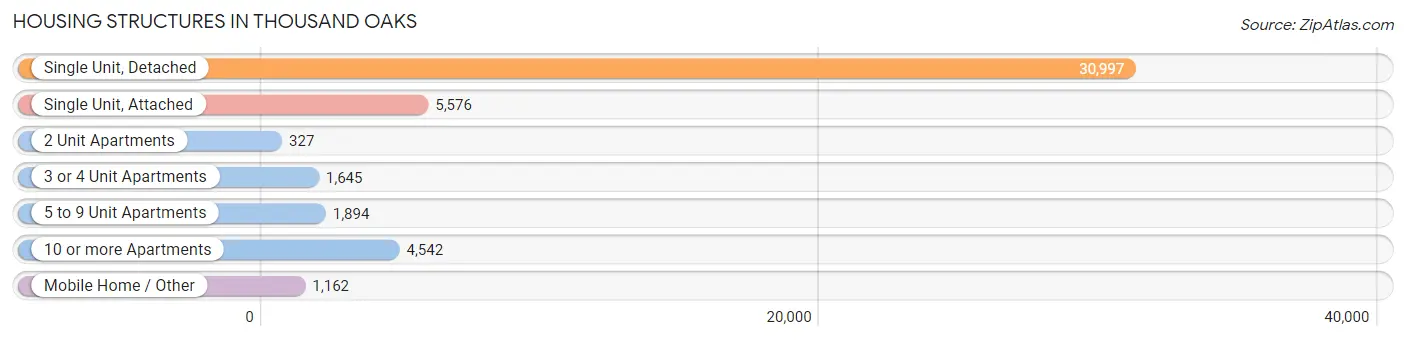
| Structure Type | # Housing Units | % Housing Units |
| Single Unit, Detached | 30,997 | 67.2% |
| Single Unit, Attached | 5,576 | 12.1% |
| 2 Unit Apartments | 327 | 0.7% |
| 3 or 4 Unit Apartments | 1,645 | 3.6% |
| 5 to 9 Unit Apartments | 1,894 | 4.1% |
| 10 or more Apartments | 4,542 | 9.8% |
| Mobile Home / Other | 1,162 | 2.5% |
| Total | 46,143 | 100.0% |
Housing Structures by Occupancy in Thousand Oaks
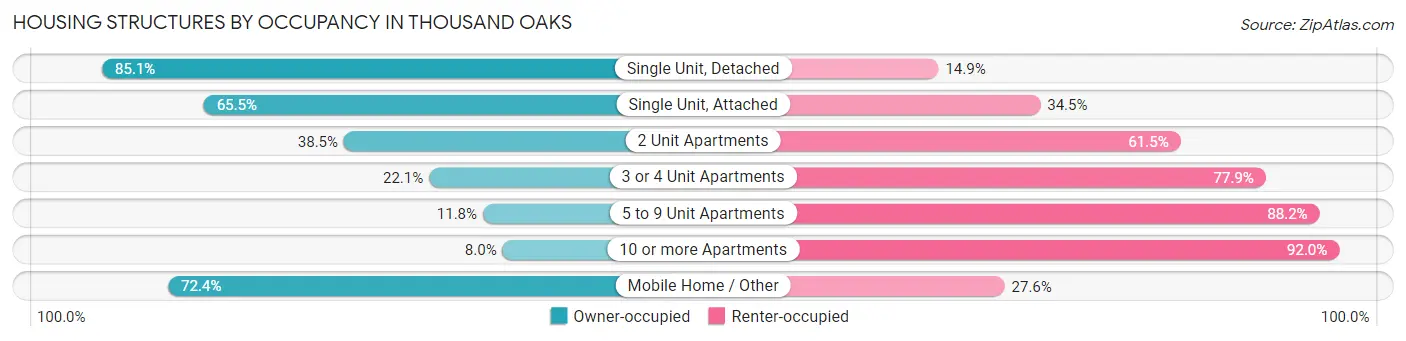
| Structure Type | Owner-occupied | Renter-occupied |
| Single Unit, Detached | 26,382 (85.1%) | 4,615 (14.9%) |
| Single Unit, Attached | 3,653 (65.5%) | 1,923 (34.5%) |
| 2 Unit Apartments | 126 (38.5%) | 201 (61.5%) |
| 3 or 4 Unit Apartments | 364 (22.1%) | 1,281 (77.9%) |
| 5 to 9 Unit Apartments | 223 (11.8%) | 1,671 (88.2%) |
| 10 or more Apartments | 363 (8.0%) | 4,179 (92.0%) |
| Mobile Home / Other | 841 (72.4%) | 321 (27.6%) |
| Total | 31,952 (69.3%) | 14,191 (30.7%) |
Housing Structures by Number of Rooms in Thousand Oaks
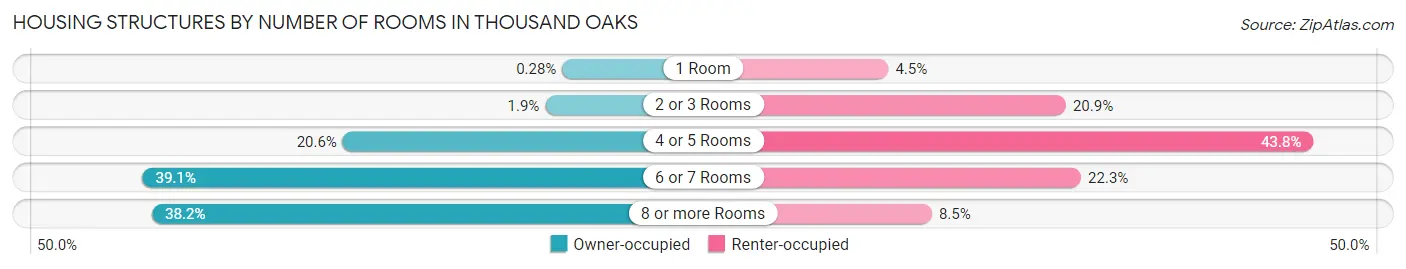
| Number of Rooms | Owner-occupied | Renter-occupied |
| 1 Room | 88 (0.3%) | 637 (4.5%) |
| 2 or 3 Rooms | 590 (1.8%) | 2,968 (20.9%) |
| 4 or 5 Rooms | 6,575 (20.6%) | 6,212 (43.8%) |
| 6 or 7 Rooms | 12,490 (39.1%) | 3,166 (22.3%) |
| 8 or more Rooms | 12,209 (38.2%) | 1,208 (8.5%) |
| Total | 31,952 (100.0%) | 14,191 (100.0%) |
Housing Structure by Heating Type in Thousand Oaks
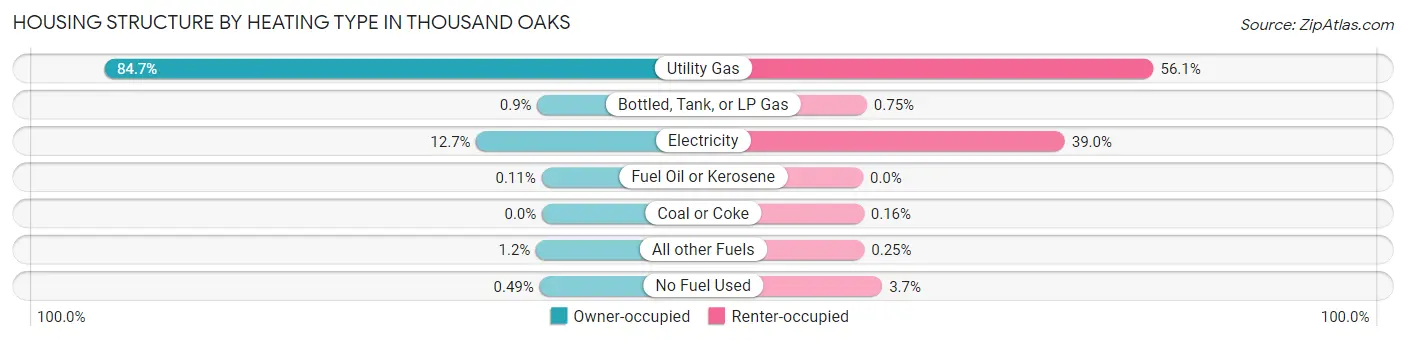
| Heating Type | Owner-occupied | Renter-occupied |
| Utility Gas | 27,049 (84.7%) | 7,967 (56.1%) |
| Bottled, Tank, or LP Gas | 286 (0.9%) | 107 (0.7%) |
| Electricity | 4,059 (12.7%) | 5,532 (39.0%) |
| Fuel Oil or Kerosene | 34 (0.1%) | 0 (0.0%) |
| Coal or Coke | 0 (0.0%) | 23 (0.2%) |
| All other Fuels | 368 (1.1%) | 35 (0.3%) |
| No Fuel Used | 156 (0.5%) | 527 (3.7%) |
| Total | 31,952 (100.0%) | 14,191 (100.0%) |
Household Vehicle Usage in Thousand Oaks
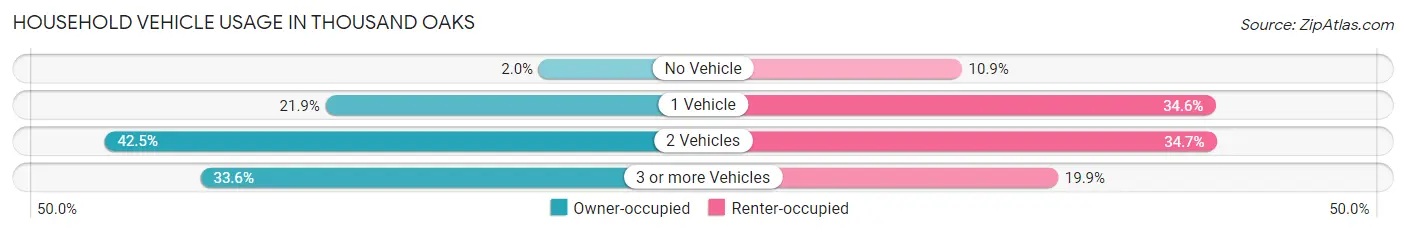
| Vehicles per Household | Owner-occupied | Renter-occupied |
| No Vehicle | 637 (2.0%) | 1,545 (10.9%) |
| 1 Vehicle | 6,996 (21.9%) | 4,905 (34.6%) |
| 2 Vehicles | 13,592 (42.5%) | 4,920 (34.7%) |
| 3 or more Vehicles | 10,727 (33.6%) | 2,821 (19.9%) |
| Total | 31,952 (100.0%) | 14,191 (100.0%) |
Real Estate & Mortgages in Thousand Oaks
Real Estate and Mortgage Overview in Thousand Oaks
| Characteristic | Without Mortgage | With Mortgage |
| Housing Units | 8,654 | 23,298 |
| Median Property Value | $878,400 | $908,400 |
| Median Household Income | $102,659 | $13,242 |
| Monthly Housing Costs | $876 | $14,183 |
| Real Estate Taxes | $4,574 | $313 |
Property Value by Mortgage Status in Thousand Oaks
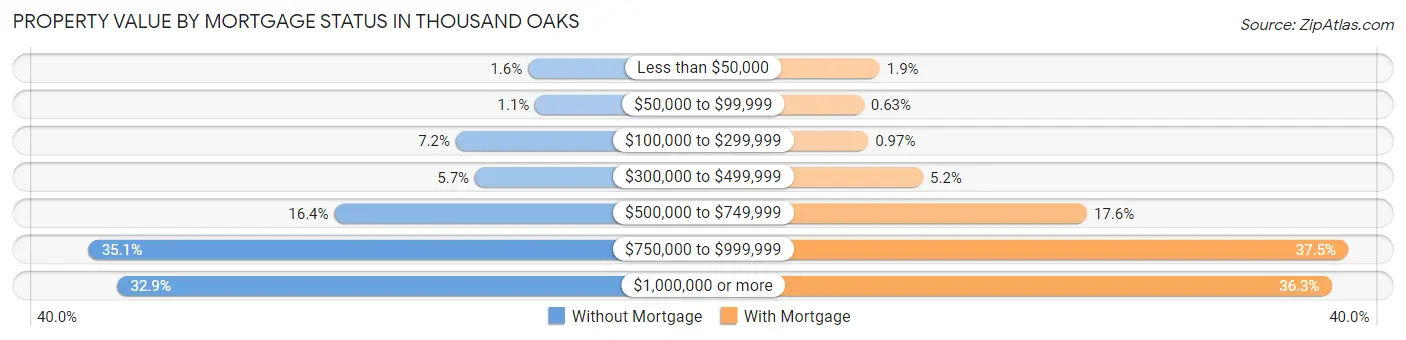
| Property Value | Without Mortgage | With Mortgage |
| Less than $50,000 | 142 (1.6%) | 430 (1.8%) |
| $50,000 to $99,999 | 95 (1.1%) | 147 (0.6%) |
| $100,000 to $299,999 | 619 (7.1%) | 226 (1.0%) |
| $300,000 to $499,999 | 492 (5.7%) | 1,200 (5.1%) |
| $500,000 to $749,999 | 1,419 (16.4%) | 4,110 (17.6%) |
| $750,000 to $999,999 | 3,038 (35.1%) | 8,739 (37.5%) |
| $1,000,000 or more | 2,849 (32.9%) | 8,446 (36.2%) |
| Total | 8,654 (100.0%) | 23,298 (100.0%) |
Household Income by Mortgage Status in Thousand Oaks
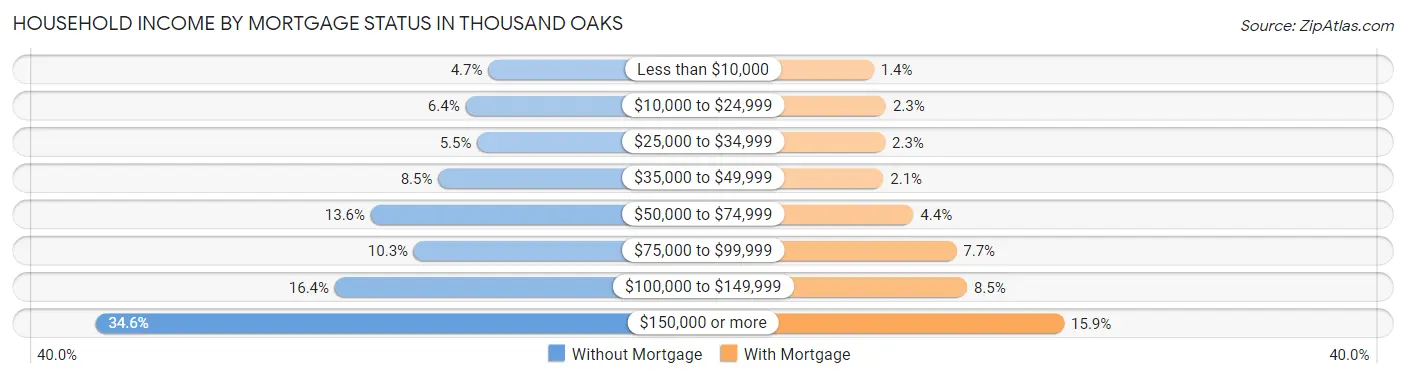
| Household Income | Without Mortgage | With Mortgage |
| Less than $10,000 | 404 (4.7%) | 324 (1.4%) |
| $10,000 to $24,999 | 555 (6.4%) | 541 (2.3%) |
| $25,000 to $34,999 | 477 (5.5%) | 524 (2.2%) |
| $35,000 to $49,999 | 734 (8.5%) | 495 (2.1%) |
| $50,000 to $74,999 | 1,179 (13.6%) | 1,027 (4.4%) |
| $75,000 to $99,999 | 895 (10.3%) | 1,790 (7.7%) |
| $100,000 to $149,999 | 1,416 (16.4%) | 1,977 (8.5%) |
| $150,000 or more | 2,994 (34.6%) | 3,702 (15.9%) |
| Total | 8,654 (100.0%) | 23,298 (100.0%) |
Property Value to Household Income Ratio in Thousand Oaks
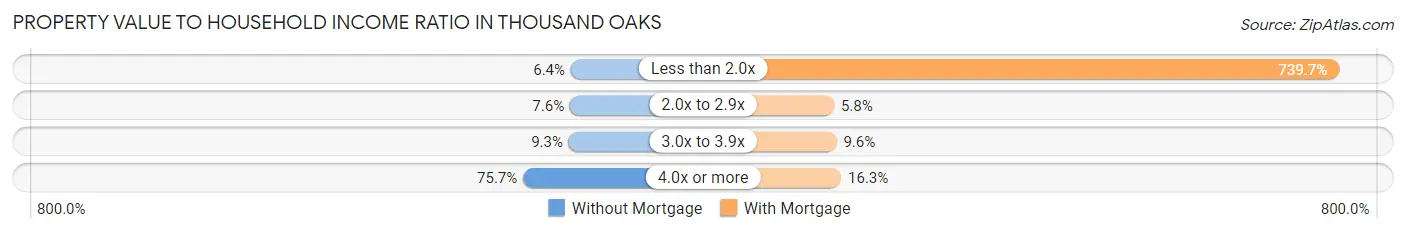
| Value-to-Income Ratio | Without Mortgage | With Mortgage |
| Less than 2.0x | 551 (6.4%) | 172,330 (739.7%) |
| 2.0x to 2.9x | 660 (7.6%) | 1,361 (5.8%) |
| 3.0x to 3.9x | 804 (9.3%) | 2,225 (9.6%) |
| 4.0x or more | 6,552 (75.7%) | 3,791 (16.3%) |
| Total | 8,654 (100.0%) | 23,298 (100.0%) |
Real Estate Taxes by Mortgage Status in Thousand Oaks
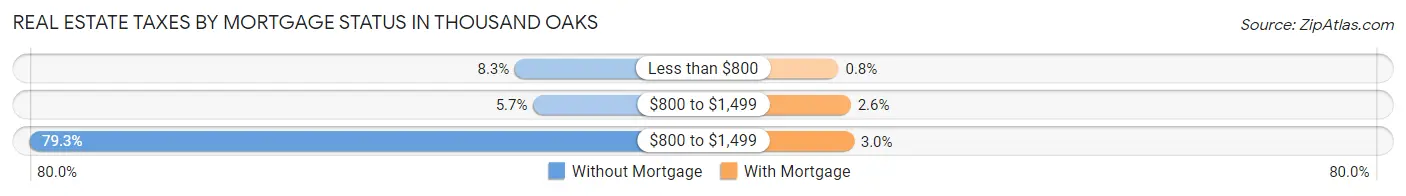
| Property Taxes | Without Mortgage | With Mortgage |
| Less than $800 | 721 (8.3%) | 186 (0.8%) |
| $800 to $1,499 | 491 (5.7%) | 601 (2.6%) |
| $800 to $1,499 | 6,866 (79.3%) | 705 (3.0%) |
| Total | 8,654 (100.0%) | 23,298 (100.0%) |
Health & Disability in Thousand Oaks
Health Insurance Coverage by Age in Thousand Oaks
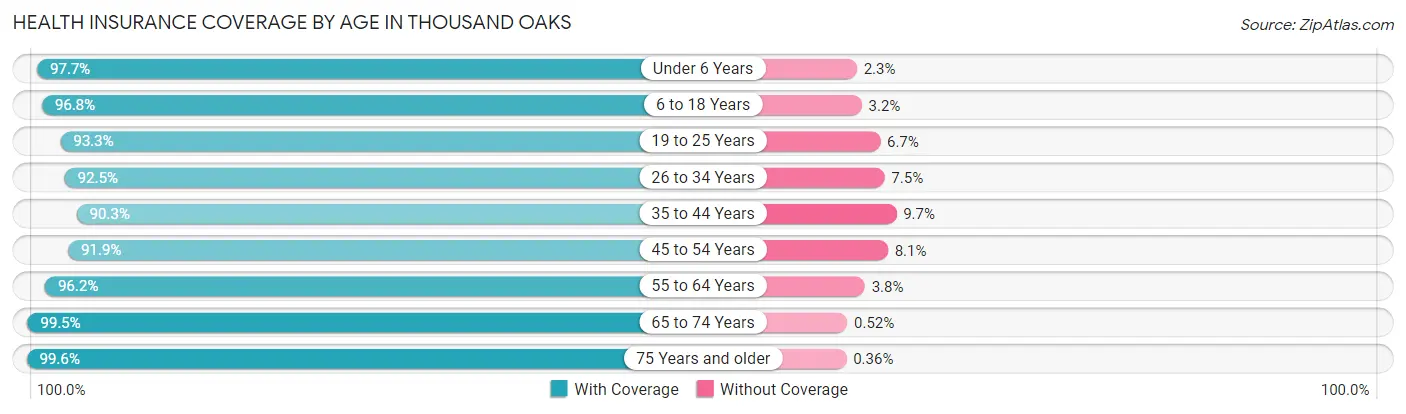
| Age Bracket | With Coverage | Without Coverage |
| Under 6 Years | 7,318 (97.7%) | 173 (2.3%) |
| 6 to 18 Years | 19,187 (96.8%) | 641 (3.2%) |
| 19 to 25 Years | 10,272 (93.3%) | 733 (6.7%) |
| 26 to 34 Years | 10,591 (92.5%) | 856 (7.5%) |
| 35 to 44 Years | 12,870 (90.3%) | 1,380 (9.7%) |
| 45 to 54 Years | 16,457 (91.9%) | 1,450 (8.1%) |
| 55 to 64 Years | 18,596 (96.2%) | 736 (3.8%) |
| 65 to 74 Years | 13,442 (99.5%) | 70 (0.5%) |
| 75 Years and older | 11,209 (99.6%) | 40 (0.4%) |
| Total | 119,942 (95.2%) | 6,079 (4.8%) |
Health Insurance Coverage by Citizenship Status in Thousand Oaks
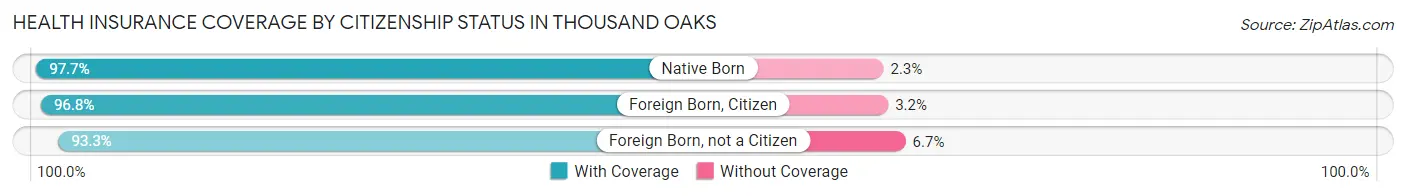
| Citizenship Status | With Coverage | Without Coverage |
| Native Born | 7,318 (97.7%) | 173 (2.3%) |
| Foreign Born, Citizen | 19,187 (96.8%) | 641 (3.2%) |
| Foreign Born, not a Citizen | 10,272 (93.3%) | 733 (6.7%) |
Health Insurance Coverage by Household Income in Thousand Oaks
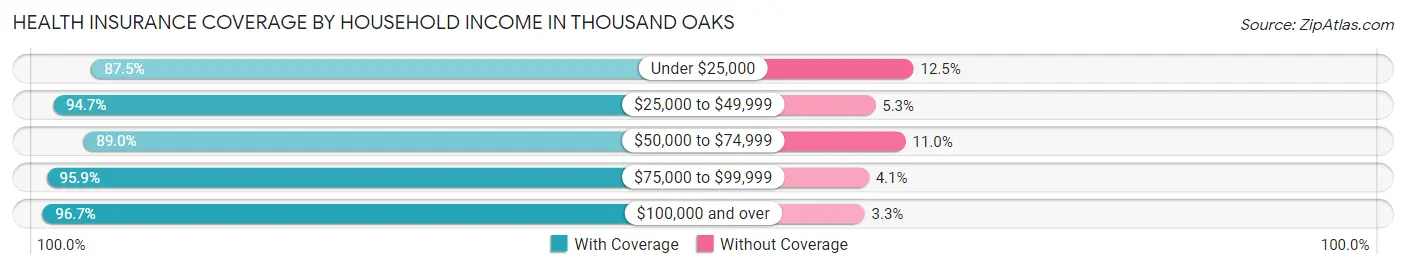
| Household Income | With Coverage | Without Coverage |
| Under $25,000 | 6,727 (87.5%) | 961 (12.5%) |
| $25,000 to $49,999 | 9,040 (94.7%) | 510 (5.3%) |
| $50,000 to $74,999 | 9,461 (89.0%) | 1,170 (11.0%) |
| $75,000 to $99,999 | 11,091 (95.9%) | 475 (4.1%) |
| $100,000 and over | 81,813 (96.7%) | 2,823 (3.3%) |
Public vs Private Health Insurance Coverage by Age in Thousand Oaks
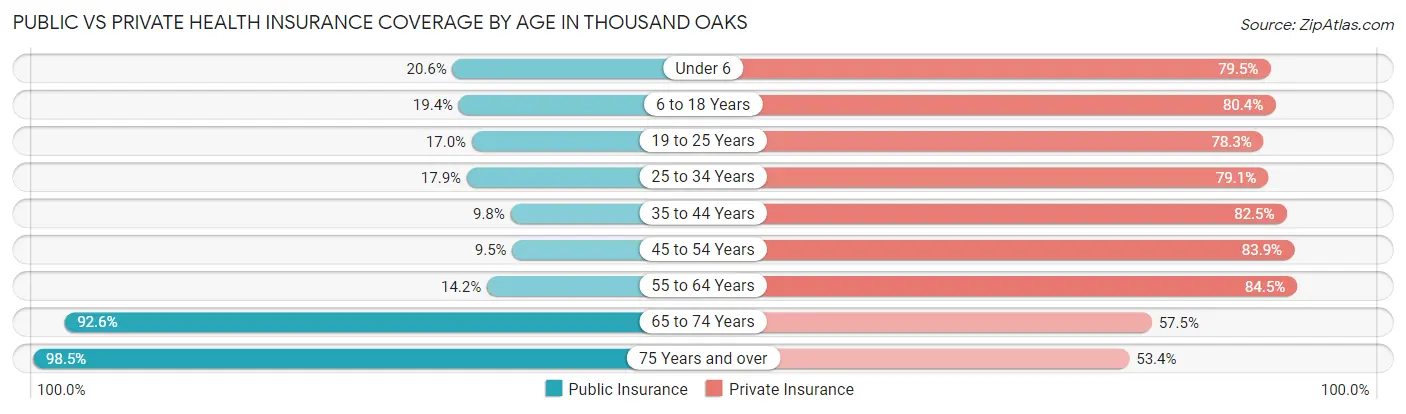
| Age Bracket | Public Insurance | Private Insurance |
| Under 6 | 1,541 (20.6%) | 5,956 (79.5%) |
| 6 to 18 Years | 3,844 (19.4%) | 15,944 (80.4%) |
| 19 to 25 Years | 1,867 (17.0%) | 8,617 (78.3%) |
| 25 to 34 Years | 2,049 (17.9%) | 9,055 (79.1%) |
| 35 to 44 Years | 1,395 (9.8%) | 11,757 (82.5%) |
| 45 to 54 Years | 1,693 (9.5%) | 15,026 (83.9%) |
| 55 to 64 Years | 2,739 (14.2%) | 16,340 (84.5%) |
| 65 to 74 Years | 12,517 (92.6%) | 7,774 (57.5%) |
| 75 Years and over | 11,075 (98.5%) | 6,003 (53.4%) |
| Total | 38,720 (30.7%) | 96,472 (76.5%) |
Disability Status by Sex by Age in Thousand Oaks
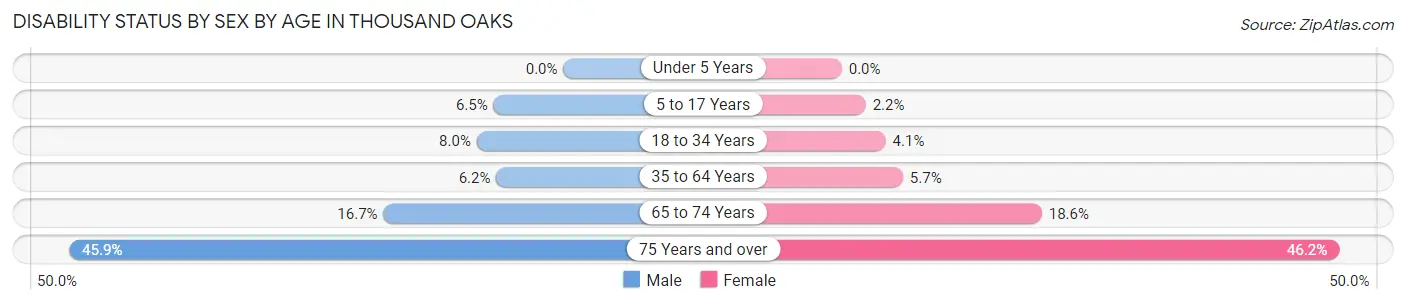
| Age Bracket | Male | Female |
| Under 5 Years | 0 (0.0%) | 0 (0.0%) |
| 5 to 17 Years | 698 (6.5%) | 190 (2.2%) |
| 18 to 34 Years | 961 (8.0%) | 493 (4.1%) |
| 35 to 64 Years | 1,580 (6.2%) | 1,479 (5.7%) |
| 65 to 74 Years | 1,073 (16.7%) | 1,315 (18.6%) |
| 75 Years and over | 2,148 (45.9%) | 3,030 (46.2%) |
Disability Class by Sex by Age in Thousand Oaks
Disability Class: Hearing Difficulty
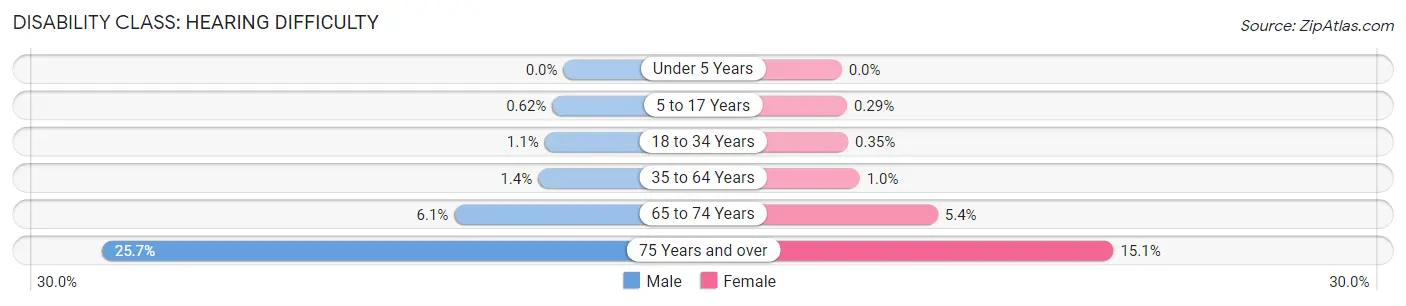
| Age Bracket | Male | Female |
| Under 5 Years | 0 (0.0%) | 0 (0.0%) |
| 5 to 17 Years | 67 (0.6%) | 25 (0.3%) |
| 18 to 34 Years | 125 (1.1%) | 43 (0.4%) |
| 35 to 64 Years | 358 (1.4%) | 261 (1.0%) |
| 65 to 74 Years | 391 (6.1%) | 379 (5.3%) |
| 75 Years and over | 1,204 (25.7%) | 993 (15.1%) |
Disability Class: Vision Difficulty
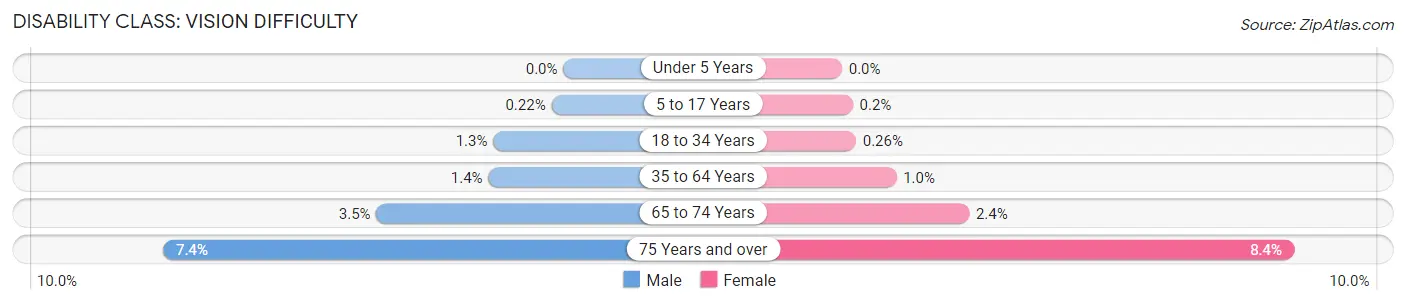
| Age Bracket | Male | Female |
| Under 5 Years | 0 (0.0%) | 0 (0.0%) |
| 5 to 17 Years | 24 (0.2%) | 17 (0.2%) |
| 18 to 34 Years | 155 (1.3%) | 32 (0.3%) |
| 35 to 64 Years | 352 (1.4%) | 264 (1.0%) |
| 65 to 74 Years | 223 (3.5%) | 167 (2.4%) |
| 75 Years and over | 348 (7.4%) | 551 (8.4%) |
Disability Class: Cognitive Difficulty
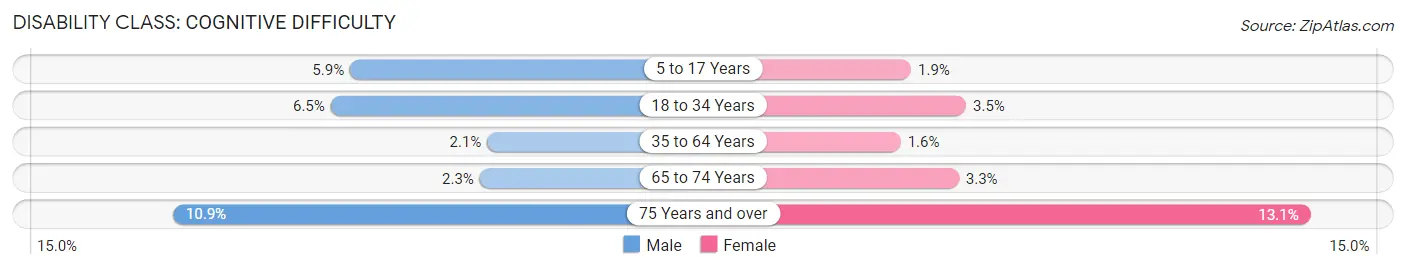
| Age Bracket | Male | Female |
| 5 to 17 Years | 640 (5.9%) | 165 (1.9%) |
| 18 to 34 Years | 774 (6.5%) | 419 (3.5%) |
| 35 to 64 Years | 539 (2.1%) | 427 (1.6%) |
| 65 to 74 Years | 150 (2.3%) | 231 (3.3%) |
| 75 Years and over | 509 (10.9%) | 857 (13.1%) |
Disability Class: Ambulatory Difficulty
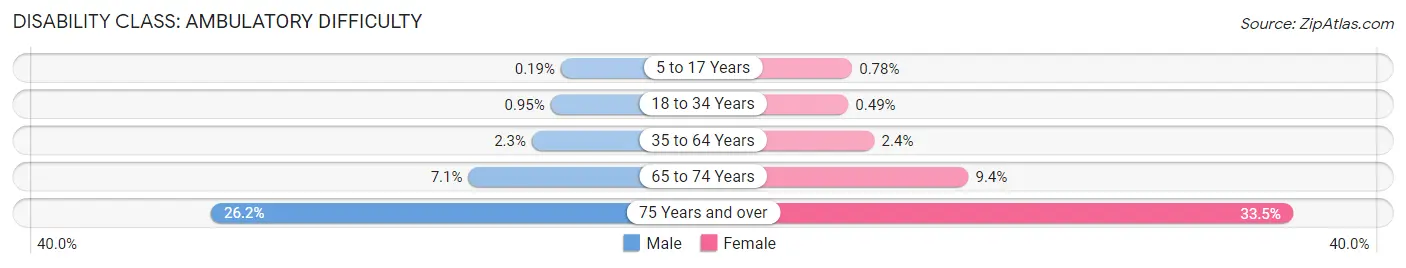
| Age Bracket | Male | Female |
| 5 to 17 Years | 20 (0.2%) | 67 (0.8%) |
| 18 to 34 Years | 114 (0.9%) | 59 (0.5%) |
| 35 to 64 Years | 594 (2.3%) | 636 (2.4%) |
| 65 to 74 Years | 454 (7.1%) | 667 (9.4%) |
| 75 Years and over | 1,225 (26.2%) | 2,197 (33.5%) |
Disability Class: Self-Care Difficulty
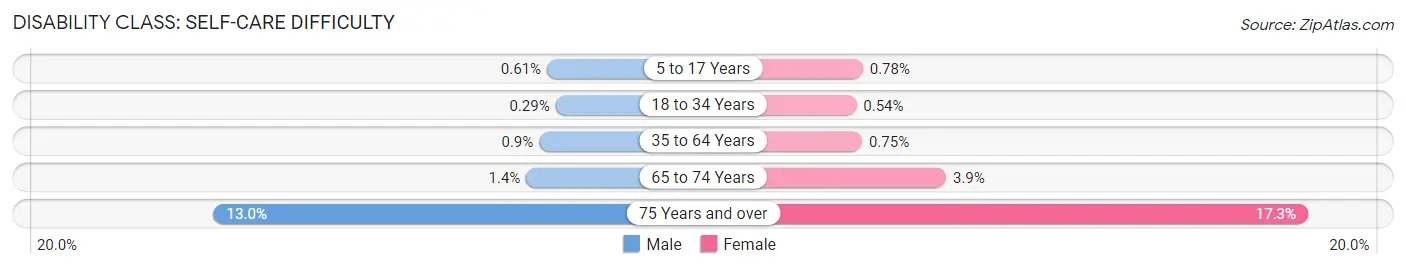
| Age Bracket | Male | Female |
| 5 to 17 Years | 66 (0.6%) | 67 (0.8%) |
| 18 to 34 Years | 35 (0.3%) | 66 (0.5%) |
| 35 to 64 Years | 229 (0.9%) | 195 (0.7%) |
| 65 to 74 Years | 89 (1.4%) | 274 (3.9%) |
| 75 Years and over | 608 (13.0%) | 1,136 (17.3%) |
Technology Access in Thousand Oaks
Computing Device Access in Thousand Oaks
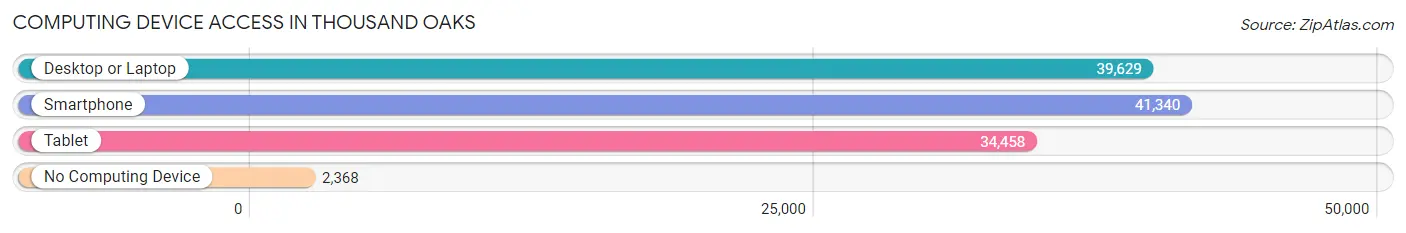
| Device Type | # Households | % Households |
| Desktop or Laptop | 39,629 | 85.9% |
| Smartphone | 41,340 | 89.6% |
| Tablet | 34,458 | 74.7% |
| No Computing Device | 2,368 | 5.1% |
| Total | 46,143 | 100.0% |
Internet Access in Thousand Oaks
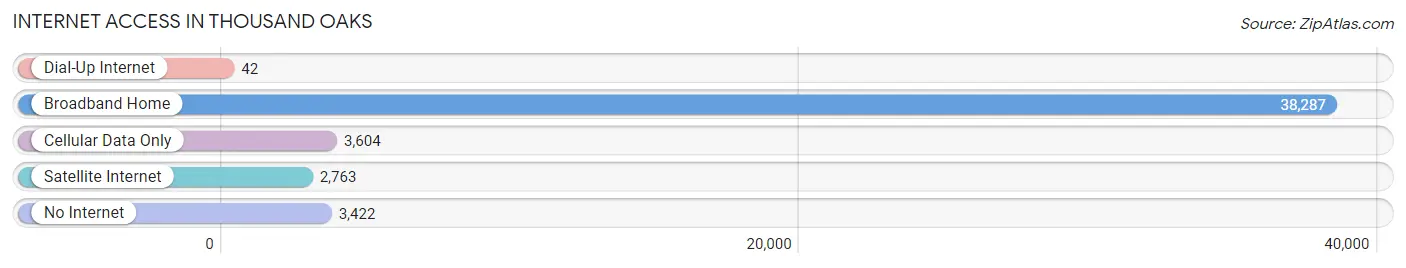
| Internet Type | # Households | % Households |
| Dial-Up Internet | 42 | 0.1% |
| Broadband Home | 38,287 | 83.0% |
| Cellular Data Only | 3,604 | 7.8% |
| Satellite Internet | 2,763 | 6.0% |
| No Internet | 3,422 | 7.4% |
| Total | 46,143 | 100.0% |
Thousand Oaks Summary
Thousand Oaks is a city located in the southeastern corner of Ventura County, California, United States. It is approximately 40 miles northwest of downtown Los Angeles and is part of the Greater Los Angeles Area. The city is bordered by the Santa Monica Mountains to the south, Simi Hills to the northwest, and the Santa Susana Mountains to the north. Thousand Oaks is the second-largest city in Ventura County and the 23rd largest city in California.
History
The area that is now Thousand Oaks was originally inhabited by the Chumash Native American tribe. The first Europeans to explore the area were members of the Spanish Portola expedition in 1769. The area was later part of the Rancho El Conejo land grant in 1803. The land was used for cattle grazing and farming until the mid-20th century.
In the 1950s, the area began to experience rapid growth as Los Angeles residents moved to the area in search of more affordable housing. The city of Thousand Oaks was officially incorporated in 1964.
Geography
Thousand Oaks is located in southeastern Ventura County, California. It is bordered by the Santa Monica Mountains to the south, Simi Hills to the northwest, and the Santa Susana Mountains to the north. The city covers an area of approximately 32 square miles and has an elevation of 830 feet.
The city is divided into several distinct neighborhoods, including Wildwood, Westlake Village, and Newbury Park. Thousand Oaks is also home to several parks, including Wildwood Regional Park, Conejo Valley Botanic Garden, and Los Robles Open Space.
Economy
Thousand Oaks is home to a diverse economy. The city is home to several major employers, including Amgen, Baxter International, and Teledyne Technologies. The city is also home to several shopping centers, including The Oaks Mall and The Promenade at Westlake.
The city is also home to several educational institutions, including California Lutheran University, Pepperdine University, and Moorpark College.
Demographics
As of the 2010 census, Thousand Oaks had a population of 126,683. The racial makeup of the city was 79.2% White, 4.2% African American, 0.7% Native American, 8.7% Asian, 0.2% Pacific Islander, 3.3% from other races, and 3.7% from two or more races. Hispanic or Latino of any race were 11.2% of the population.
The median household income in Thousand Oaks was $97,837 in 2019. The median age of the city was 42.7 years. The city had a poverty rate of 4.2%.
Thousand Oaks is a relatively affluent city with a high quality of life. The city is home to several parks and recreational facilities, as well as a variety of cultural attractions. The city is also home to several educational institutions, making it an attractive destination for families.
Common Questions
What is Per Capita Income in Thousand Oaks?
Per Capita income in Thousand Oaks is $61,458.
What is the Median Family Income in Thousand Oaks?
Median Family Income in Thousand Oaks is $155,005.
What is the Median Household income in Thousand Oaks?
Median Household Income in Thousand Oaks is $125,399.
What is Income or Wage Gap in Thousand Oaks?
Income or Wage Gap in Thousand Oaks is 42.5%.
Women in Thousand Oaks earn 57.5 cents for every dollar earned by a man.
What is Family Income Deficit in Thousand Oaks?
Family Income Deficit in Thousand Oaks is $14,558.
Families that are below poverty line in Thousand Oaks earn $14,558 less on average than the poverty threshold level.
What is Inequality or Gini Index in Thousand Oaks?
Inequality or Gini Index in Thousand Oaks is 0.46.
What is the Total Population of Thousand Oaks?
Total Population of Thousand Oaks is 126,532.
What is the Total Male Population of Thousand Oaks?
Total Male Population of Thousand Oaks is 62,770.
What is the Total Female Population of Thousand Oaks?
Total Female Population of Thousand Oaks is 63,762.
What is the Ratio of Males per 100 Females in Thousand Oaks?
There are 98.44 Males per 100 Females in Thousand Oaks.
What is the Ratio of Females per 100 Males in Thousand Oaks?
There are 101.58 Females per 100 Males in Thousand Oaks.
What is the Median Population Age in Thousand Oaks?
Median Population Age in Thousand Oaks is 44.4 Years.
What is the Average Family Size in Thousand Oaks
Average Family Size in Thousand Oaks is 3.2 People.
What is the Average Household Size in Thousand Oaks
Average Household Size in Thousand Oaks is 2.7 People.
How Large is the Labor Force in Thousand Oaks?
There are 65,141 People in the Labor Forcein in Thousand Oaks.
What is the Percentage of People in the Labor Force in Thousand Oaks?
62.4% of People are in the Labor Force in Thousand Oaks.
What is the Unemployment Rate in Thousand Oaks?
Unemployment Rate in Thousand Oaks is 4.8%.