Benicia, CA Map & Demographics
Benicia Map
Benicia Overview
$61,021
PER CAPITA INCOME
$153,172
AVG FAMILY INCOME
$124,375
AVG HOUSEHOLD INCOME
26.5%
WAGE / INCOME GAP [ % ]
73.5¢/ $1
WAGE / INCOME GAP [ $ ]
$9,895
FAMILY INCOME DEFICIT
0.42
INEQUALITY / GINI INDEX
27,040
TOTAL POPULATION
13,110
MALE POPULATION
13,930
FEMALE POPULATION
94.11
MALES / 100 FEMALES
106.25
FEMALES / 100 MALES
45.3
MEDIAN AGE
3.2
AVG FAMILY SIZE
2.5
AVG HOUSEHOLD SIZE
14,229
LABOR FORCE [ PEOPLE ]
63.9%
PERCENT IN LABOR FORCE
4.1%
UNEMPLOYMENT RATE
Benicia Zip Codes
Benicia Area Codes
Income in Benicia
Income Overview in Benicia
Per Capita Income in Benicia is $61,021, while median incomes of families and households are $153,172 and $124,375 respectively.
| Characteristic | Number | Measure |
| Per Capita Income | 27,040 | $61,021 |
| Median Family Income | 6,874 | $153,172 |
| Mean Family Income | 6,874 | $179,019 |
| Median Household Income | 10,873 | $124,375 |
| Mean Household Income | 10,873 | $148,740 |
| Income Deficit | 6,874 | $9,895 |
| Wage / Income Gap (%) | 27,040 | 26.49% |
| Wage / Income Gap ($) | 27,040 | 73.51¢ per $1 |
| Gini / Inequality Index | 27,040 | 0.42 |
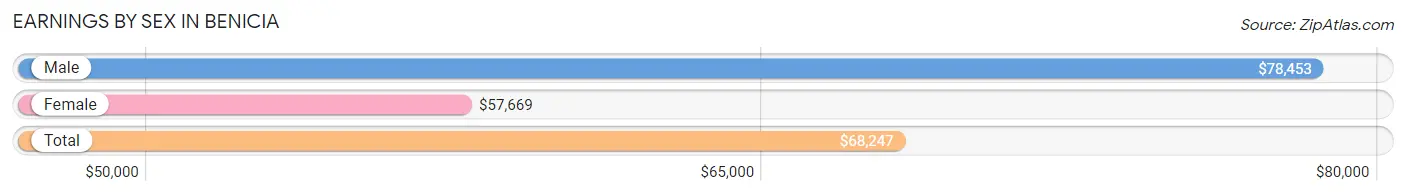
Earnings by Sex in Benicia
Average Earnings in Benicia are $68,247, $78,453 for men and $57,669 for women, a difference of 26.5%.
| Sex | Number | Average Earnings |
| Male | 7,407 (50.6%) | $78,453 |
| Female | 7,216 (49.3%) | $57,669 |
| Total | 14,623 (100.0%) | $68,247 |
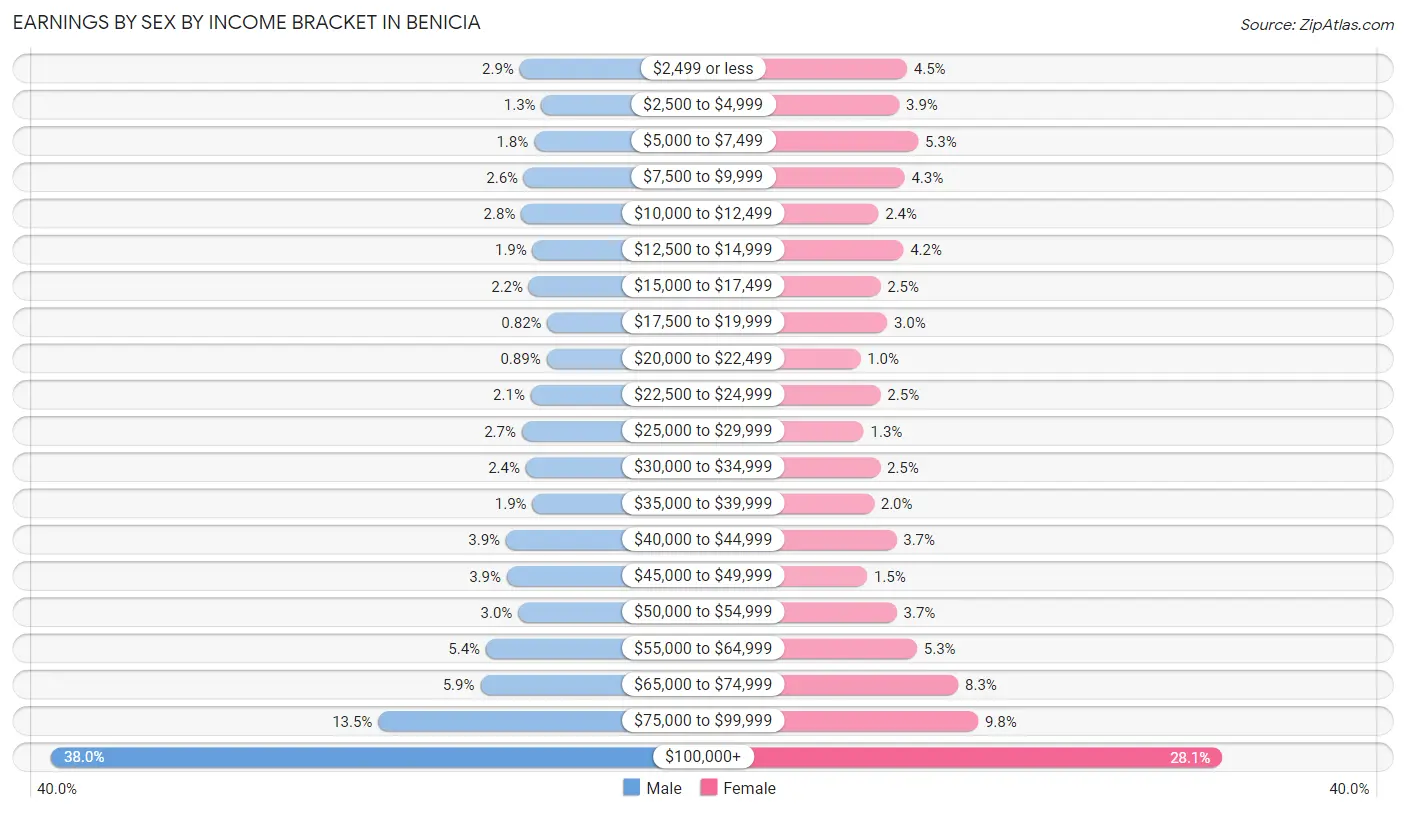
Earnings by Sex by Income Bracket in Benicia
The most common earnings brackets in Benicia are $100,000+ for men (2,816 | 38.0%) and $100,000+ for women (2,030 | 28.1%).
| Income | Male | Female |
| $2,499 or less | 215 (2.9%) | 325 (4.5%) |
| $2,500 to $4,999 | 94 (1.3%) | 283 (3.9%) |
| $5,000 to $7,499 | 135 (1.8%) | 385 (5.3%) |
| $7,500 to $9,999 | 191 (2.6%) | 312 (4.3%) |
| $10,000 to $12,499 | 206 (2.8%) | 170 (2.4%) |
| $12,500 to $14,999 | 143 (1.9%) | 305 (4.2%) |
| $15,000 to $17,499 | 164 (2.2%) | 181 (2.5%) |
| $17,500 to $19,999 | 61 (0.8%) | 217 (3.0%) |
| $20,000 to $22,499 | 66 (0.9%) | 73 (1.0%) |
| $22,500 to $24,999 | 153 (2.1%) | 182 (2.5%) |
| $25,000 to $29,999 | 203 (2.7%) | 91 (1.3%) |
| $30,000 to $34,999 | 181 (2.4%) | 180 (2.5%) |
| $35,000 to $39,999 | 144 (1.9%) | 146 (2.0%) |
| $40,000 to $44,999 | 291 (3.9%) | 268 (3.7%) |
| $45,000 to $49,999 | 286 (3.9%) | 109 (1.5%) |
| $50,000 to $54,999 | 223 (3.0%) | 269 (3.7%) |
| $55,000 to $64,999 | 402 (5.4%) | 379 (5.2%) |
| $65,000 to $74,999 | 433 (5.9%) | 602 (8.3%) |
| $75,000 to $99,999 | 1,000 (13.5%) | 709 (9.8%) |
| $100,000+ | 2,816 (38.0%) | 2,030 (28.1%) |
| Total | 7,407 (100.0%) | 7,216 (100.0%) |
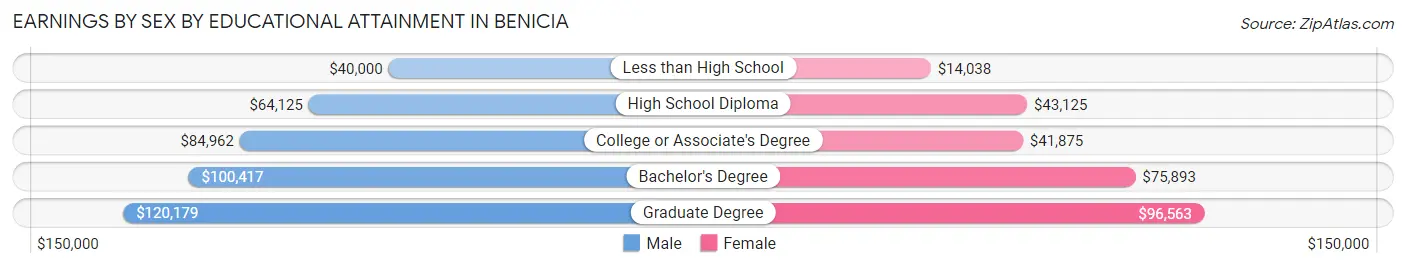
Earnings by Sex by Educational Attainment in Benicia
Average earnings in Benicia are $86,320 for men and $67,849 for women, a difference of 21.4%. Men with an educational attainment of graduate degree enjoy the highest average annual earnings of $120,179, while those with less than high school education earn the least with $40,000. Women with an educational attainment of graduate degree earn the most with the average annual earnings of $96,563, while those with less than high school education have the smallest earnings of $14,038.
| Educational Attainment | Male Income | Female Income |
| Less than High School | $40,000 | $14,038 |
| High School Diploma | $64,125 | $43,125 |
| College or Associate's Degree | $84,962 | $41,875 |
| Bachelor's Degree | $100,417 | $75,893 |
| Graduate Degree | $120,179 | $96,563 |
| Total | $86,320 | $67,849 |
Family Income in Benicia
Family Income Brackets in Benicia
According to the Benicia family income data, there are 2,427 families falling into the $200,000+ income range, which is the most common income bracket and makes up 35.3% of all families. Conversely, the $10,000 to $14,999 income bracket is the least frequent group with only 62 families (0.9%) belonging to this category.
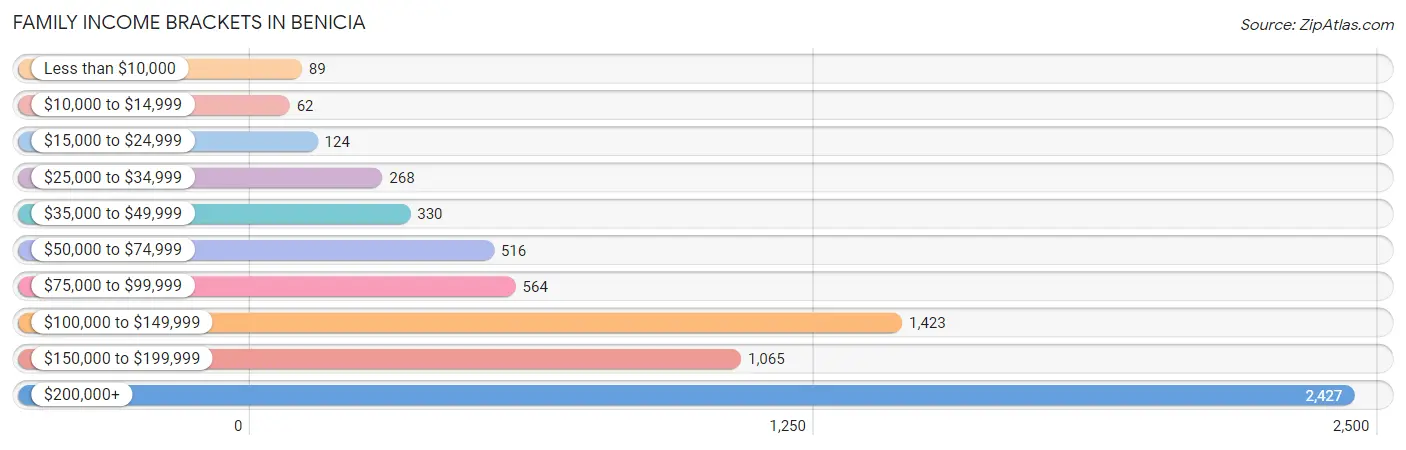
| Income Bracket | # Families | % Families |
| Less than $10,000 | 89 | 1.3% |
| $10,000 to $14,999 | 62 | 0.9% |
| $15,000 to $24,999 | 124 | 1.8% |
| $25,000 to $34,999 | 268 | 3.9% |
| $35,000 to $49,999 | 330 | 4.8% |
| $50,000 to $74,999 | 516 | 7.5% |
| $75,000 to $99,999 | 564 | 8.2% |
| $100,000 to $149,999 | 1,423 | 20.7% |
| $150,000 to $199,999 | 1,065 | 15.5% |
| $200,000+ | 2,427 | 35.3% |
Family Income by Famaliy Size in Benicia
4-person families (1,325 | 19.3%) account for the highest median family income in Benicia with $202,960 per family, while 2-person families (3,056 | 44.5%) have the highest median income of $64,198 per family member.
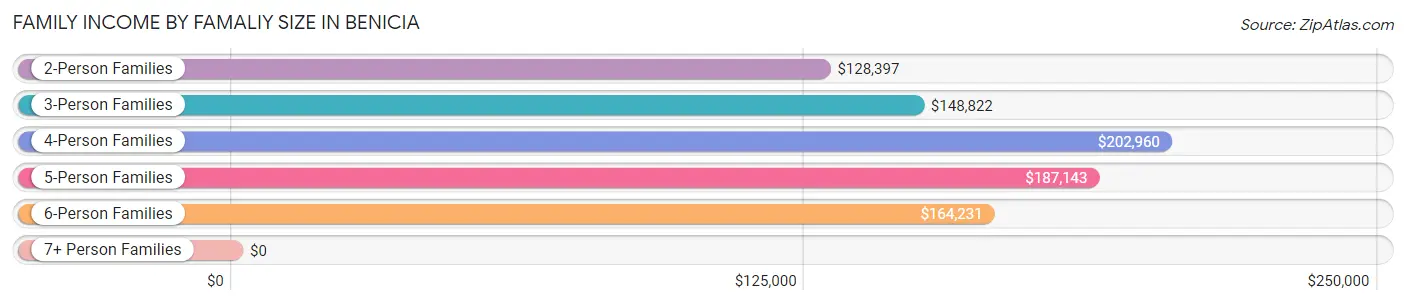
| Income Bracket | # Families | Median Income |
| 2-Person Families | 3,056 (44.5%) | $128,397 |
| 3-Person Families | 1,785 (26.0%) | $148,822 |
| 4-Person Families | 1,325 (19.3%) | $202,960 |
| 5-Person Families | 494 (7.2%) | $187,143 |
| 6-Person Families | 200 (2.9%) | $164,231 |
| 7+ Person Families | 14 (0.2%) | $0 |
| Total | 6,874 (100.0%) | $153,172 |
Family Income by Number of Earners in Benicia
The median family income in Benicia is $153,172, with families comprising 3+ earners (707) having the highest median family income of $221,417, while families with no earners (966) have the lowest median family income of $100,833, accounting for 10.3% and 14.1% of families, respectively.
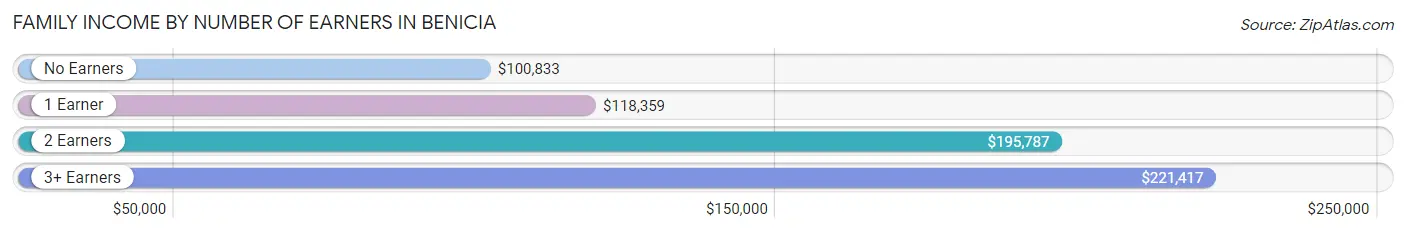
| Number of Earners | # Families | Median Income |
| No Earners | 966 (14.1%) | $100,833 |
| 1 Earner | 2,216 (32.2%) | $118,359 |
| 2 Earners | 2,985 (43.4%) | $195,787 |
| 3+ Earners | 707 (10.3%) | $221,417 |
| Total | 6,874 (100.0%) | $153,172 |
Household Income in Benicia
Household Income Brackets in Benicia
With 2,849 households falling in the category, the $200,000+ income range is the most frequent in Benicia, accounting for 26.2% of all households. In contrast, only 163 households (1.5%) fall into the $10,000 to $14,999 income bracket, making it the least populous group.
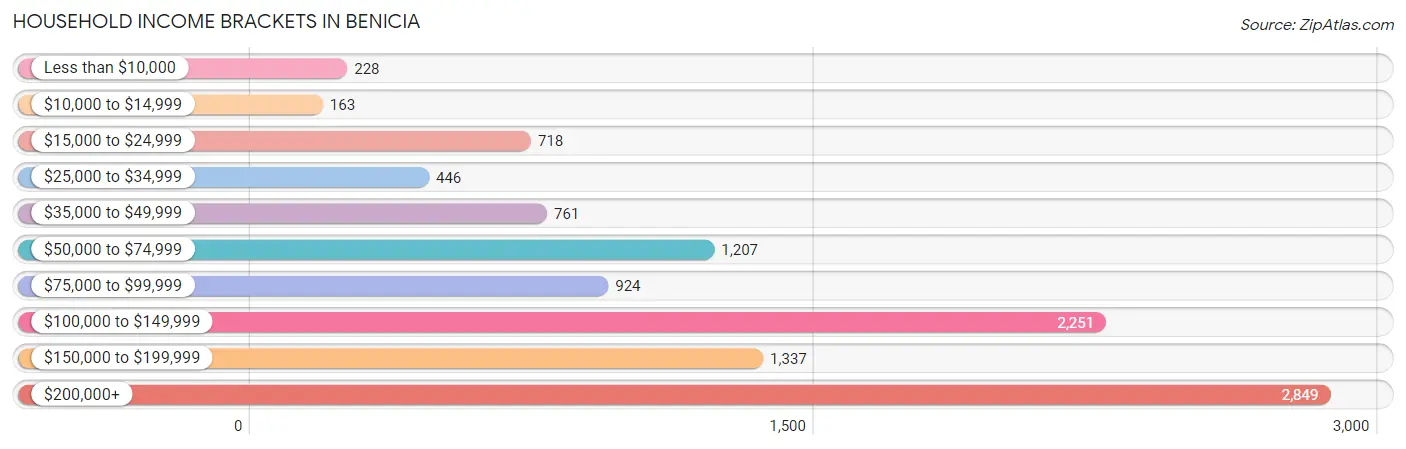
| Income Bracket | # Households | % Households |
| Less than $10,000 | 228 | 2.1% |
| $10,000 to $14,999 | 163 | 1.5% |
| $15,000 to $24,999 | 718 | 6.6% |
| $25,000 to $34,999 | 446 | 4.1% |
| $35,000 to $49,999 | 761 | 7.0% |
| $50,000 to $74,999 | 1,207 | 11.1% |
| $75,000 to $99,999 | 924 | 8.5% |
| $100,000 to $149,999 | 2,251 | 20.7% |
| $150,000 to $199,999 | 1,337 | 12.3% |
| $200,000+ | 2,849 | 26.2% |
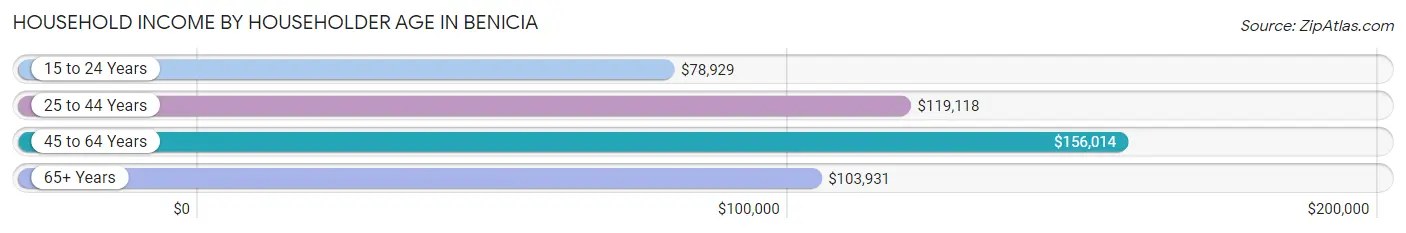
Household Income by Householder Age in Benicia
The median household income in Benicia is $124,375, with the highest median household income of $156,014 found in the 45 to 64 years age bracket for the primary householder. A total of 4,412 households (40.6%) fall into this category. Meanwhile, the 15 to 24 years age bracket for the primary householder has the lowest median household income of $78,929, with 78 households (0.7%) in this group.
| Income Bracket | # Households | Median Income |
| 15 to 24 Years | 78 (0.7%) | $78,929 |
| 25 to 44 Years | 2,660 (24.5%) | $119,118 |
| 45 to 64 Years | 4,412 (40.6%) | $156,014 |
| 65+ Years | 3,723 (34.2%) | $103,931 |
| Total | 10,873 (100.0%) | $124,375 |
Poverty in Benicia
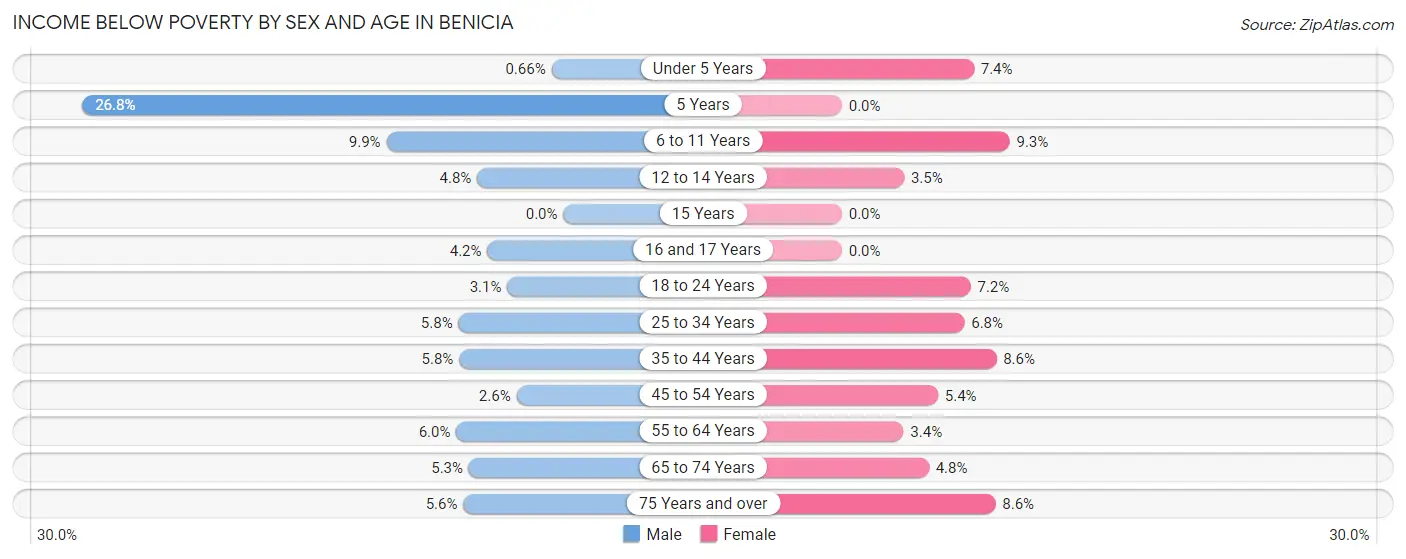
Income Below Poverty by Sex and Age in Benicia
With 5.2% poverty level for males and 6.0% for females among the residents of Benicia, 5 year old males and 6 to 11 year old females are the most vulnerable to poverty, with 30 males (26.8%) and 94 females (9.3%) in their respective age groups living below the poverty level.
| Age Bracket | Male | Female |
| Under 5 Years | 5 (0.7%) | 41 (7.3%) |
| 5 Years | 30 (26.8%) | 0 (0.0%) |
| 6 to 11 Years | 98 (9.9%) | 94 (9.3%) |
| 12 to 14 Years | 27 (4.8%) | 13 (3.5%) |
| 15 Years | 0 (0.0%) | 0 (0.0%) |
| 16 and 17 Years | 16 (4.2%) | 0 (0.0%) |
| 18 to 24 Years | 25 (3.1%) | 57 (7.2%) |
| 25 to 34 Years | 89 (5.8%) | 100 (6.8%) |
| 35 to 44 Years | 105 (5.8%) | 135 (8.6%) |
| 45 to 54 Years | 43 (2.6%) | 107 (5.3%) |
| 55 to 64 Years | 119 (6.0%) | 72 (3.4%) |
| 65 to 74 Years | 83 (5.3%) | 109 (4.8%) |
| 75 Years and over | 45 (5.6%) | 103 (8.6%) |
| Total | 685 (5.2%) | 831 (6.0%) |
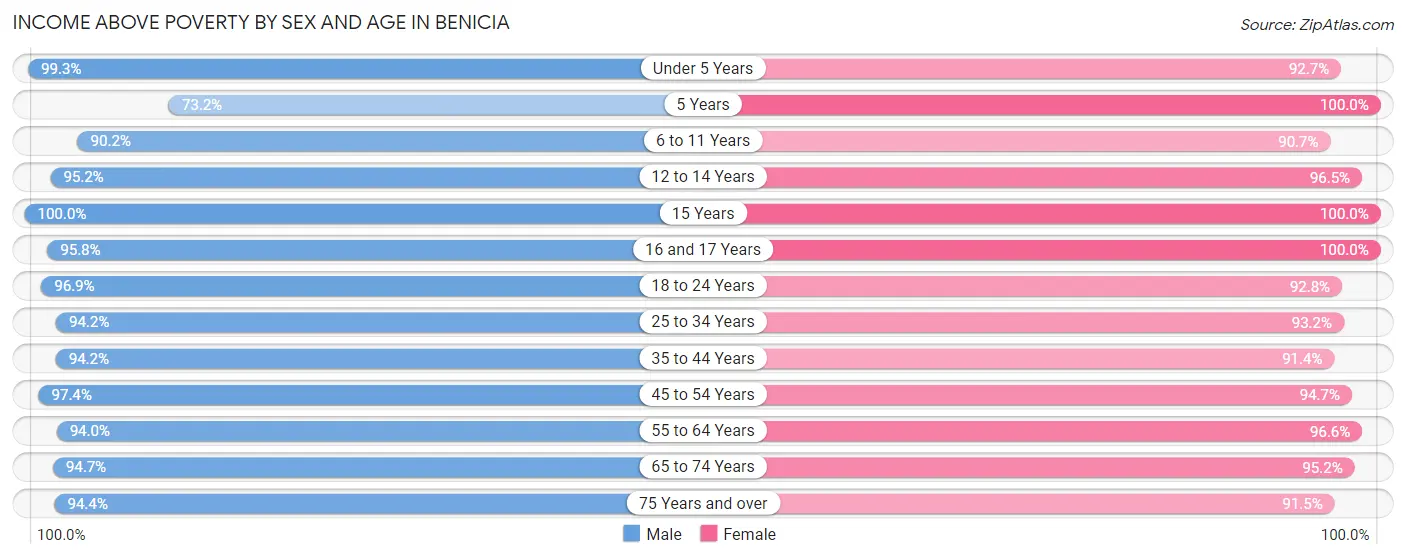
Income Above Poverty by Sex and Age in Benicia
According to the poverty statistics in Benicia, males aged 15 years and females aged 5 years are the age groups that are most secure financially, with 100.0% of males and 100.0% of females in these age groups living above the poverty line.
| Age Bracket | Male | Female |
| Under 5 Years | 755 (99.3%) | 517 (92.6%) |
| 5 Years | 82 (73.2%) | 54 (100.0%) |
| 6 to 11 Years | 897 (90.1%) | 912 (90.7%) |
| 12 to 14 Years | 536 (95.2%) | 363 (96.5%) |
| 15 Years | 133 (100.0%) | 212 (100.0%) |
| 16 and 17 Years | 362 (95.8%) | 343 (100.0%) |
| 18 to 24 Years | 775 (96.9%) | 738 (92.8%) |
| 25 to 34 Years | 1,435 (94.2%) | 1,366 (93.2%) |
| 35 to 44 Years | 1,704 (94.2%) | 1,434 (91.4%) |
| 45 to 54 Years | 1,607 (97.4%) | 1,893 (94.7%) |
| 55 to 64 Years | 1,877 (94.0%) | 2,025 (96.6%) |
| 65 to 74 Years | 1,495 (94.7%) | 2,141 (95.2%) |
| 75 Years and over | 763 (94.4%) | 1,101 (91.4%) |
| Total | 12,421 (94.8%) | 13,099 (94.0%) |
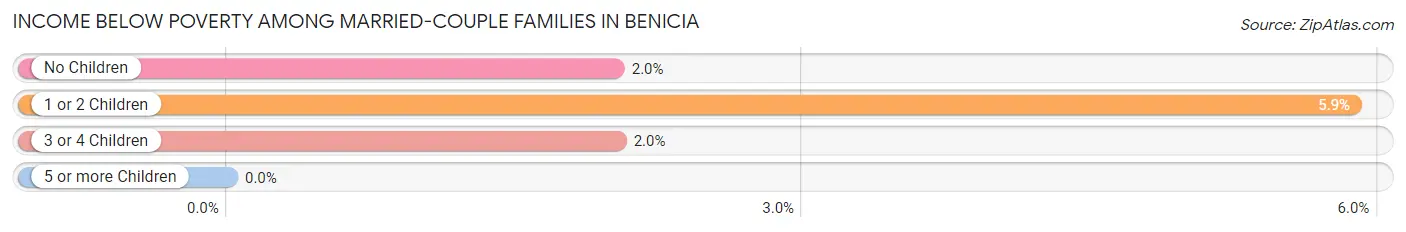
Income Below Poverty Among Married-Couple Families in Benicia
The poverty statistics for married-couple families in Benicia show that 3.3% or 183 of the total 5,516 families live below the poverty line. Families with 1 or 2 children have the highest poverty rate of 5.9%, comprising of 109 families. On the other hand, families with no children have the lowest poverty rate of 2.0%, which includes 68 families.
| Children | Above Poverty | Below Poverty |
| No Children | 3,295 (98.0%) | 68 (2.0%) |
| 1 or 2 Children | 1,748 (94.1%) | 109 (5.9%) |
| 3 or 4 Children | 290 (98.0%) | 6 (2.0%) |
| 5 or more Children | 0 (0.0%) | 0 (0.0%) |
| Total | 5,333 (96.7%) | 183 (3.3%) |
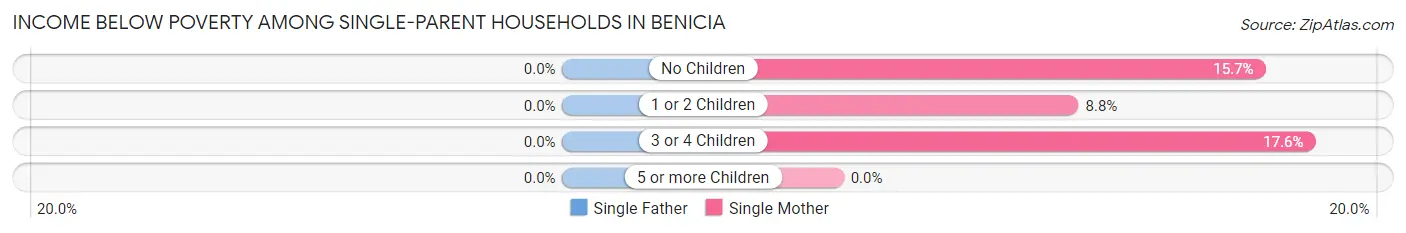
Income Below Poverty Among Single-Parent Households in Benicia
| Children | Single Father | Single Mother |
| No Children | 0 (0.0%) | 60 (15.7%) |
| 1 or 2 Children | 0 (0.0%) | 40 (8.7%) |
| 3 or 4 Children | 0 (0.0%) | 13 (17.6%) |
| 5 or more Children | 0 (0.0%) | 0 (0.0%) |
| Total | 0 (0.0%) | 113 (12.4%) |
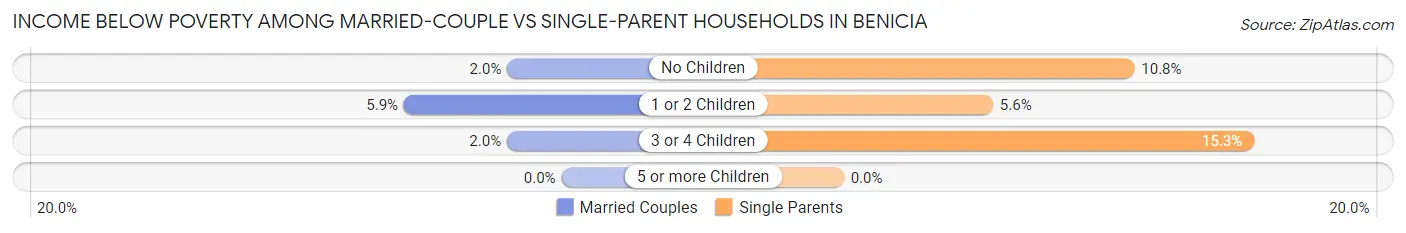
Income Below Poverty Among Married-Couple vs Single-Parent Households in Benicia
The poverty data for Benicia shows that 183 of the married-couple family households (3.3%) and 113 of the single-parent households (8.3%) are living below the poverty level. Within the married-couple family households, those with 1 or 2 children have the highest poverty rate, with 109 households (5.9%) falling below the poverty line. Among the single-parent households, those with 3 or 4 children have the highest poverty rate, with 13 household (15.3%) living below poverty.
| Children | Married-Couple Families | Single-Parent Households |
| No Children | 68 (2.0%) | 60 (10.8%) |
| 1 or 2 Children | 109 (5.9%) | 40 (5.6%) |
| 3 or 4 Children | 6 (2.0%) | 13 (15.3%) |
| 5 or more Children | 0 (0.0%) | 0 (0.0%) |
| Total | 183 (3.3%) | 113 (8.3%) |
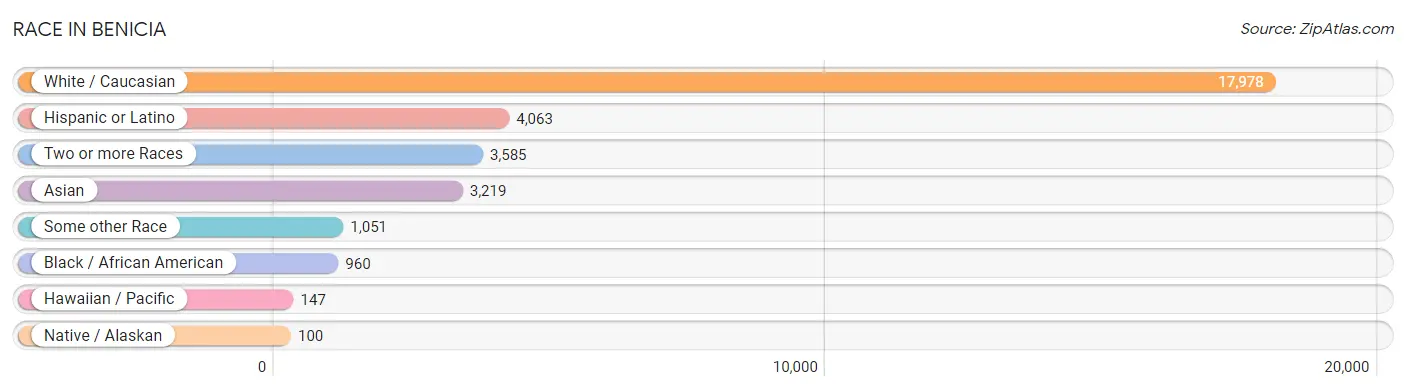
Race in Benicia
The most populous races in Benicia are White / Caucasian (17,978 | 66.5%), Hispanic or Latino (4,063 | 15.0%), and Two or more Races (3,585 | 13.3%).
| Race | # Population | % Population |
| Asian | 3,219 | 11.9% |
| Black / African American | 960 | 3.5% |
| Hawaiian / Pacific | 147 | 0.5% |
| Hispanic or Latino | 4,063 | 15.0% |
| Native / Alaskan | 100 | 0.4% |
| White / Caucasian | 17,978 | 66.5% |
| Two or more Races | 3,585 | 13.3% |
| Some other Race | 1,051 | 3.9% |
| Total | 27,040 | 100.0% |
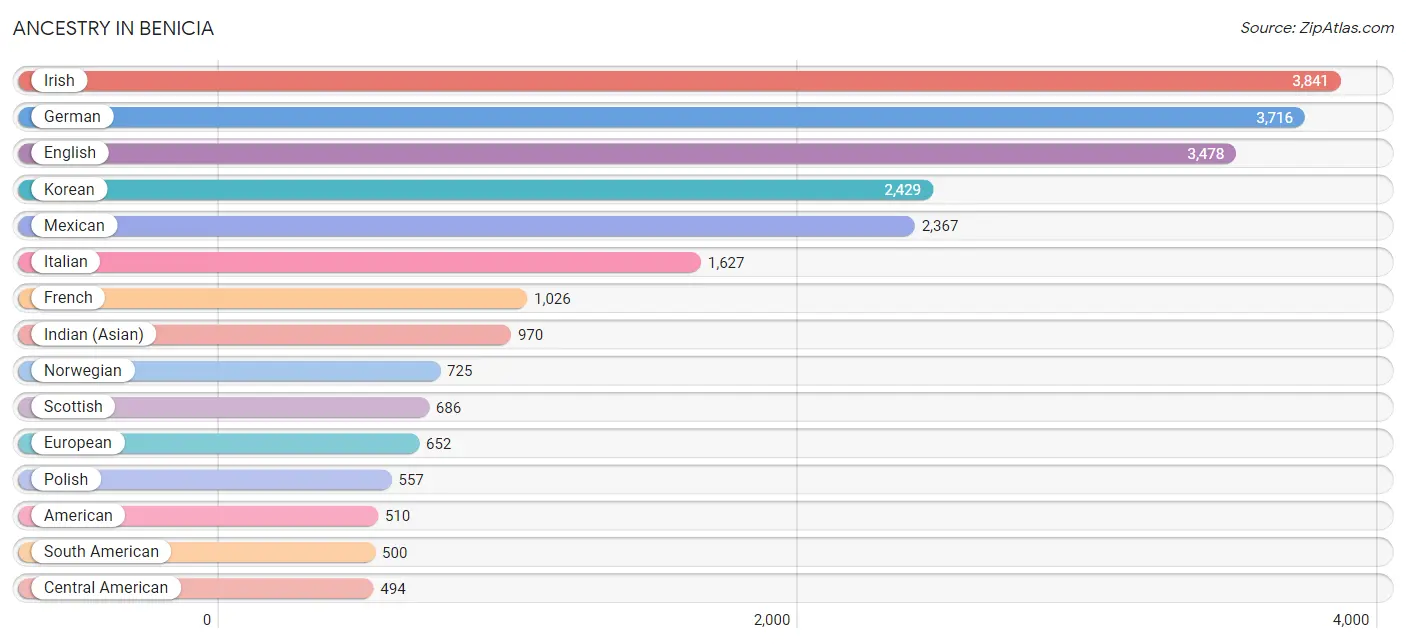
Ancestry in Benicia
The most populous ancestries reported in Benicia are Irish (3,841 | 14.2%), German (3,716 | 13.7%), English (3,478 | 12.9%), Korean (2,429 | 9.0%), and Mexican (2,367 | 8.7%), together accounting for 58.5% of all Benicia residents.
| Ancestry | # Population | % Population |
| African | 51 | 0.2% |
| American | 510 | 1.9% |
| Apache | 58 | 0.2% |
| Arab | 154 | 0.6% |
| Argentinean | 24 | 0.1% |
| Armenian | 76 | 0.3% |
| Austrian | 168 | 0.6% |
| Bangladeshi | 26 | 0.1% |
| Basque | 28 | 0.1% |
| Belgian | 6 | 0.0% |
| Bhutanese | 266 | 1.0% |
| Blackfeet | 11 | 0.0% |
| Brazilian | 133 | 0.5% |
| British | 386 | 1.4% |
| Burmese | 165 | 0.6% |
| Canadian | 150 | 0.5% |
| Cape Verdean | 28 | 0.1% |
| Central American | 494 | 1.8% |
| Central American Indian | 22 | 0.1% |
| Cherokee | 74 | 0.3% |
| Chickasaw | 14 | 0.1% |
| Chilean | 8 | 0.0% |
| Colombian | 145 | 0.5% |
| Croatian | 93 | 0.3% |
| Crow | 15 | 0.1% |
| Cuban | 34 | 0.1% |
| Czech | 41 | 0.2% |
| Danish | 350 | 1.3% |
| Dominican | 10 | 0.0% |
| Dutch | 142 | 0.5% |
| Eastern European | 110 | 0.4% |
| Egyptian | 7 | 0.0% |
| English | 3,478 | 12.9% |
| European | 652 | 2.4% |
| Finnish | 29 | 0.1% |
| French | 1,026 | 3.8% |
| French Canadian | 134 | 0.5% |
| German | 3,716 | 13.7% |
| Greek | 151 | 0.6% |
| Guamanian / Chamorro | 418 | 1.5% |
| Guatemalan | 20 | 0.1% |
| Honduran | 43 | 0.2% |
| Hungarian | 122 | 0.4% |
| Icelander | 21 | 0.1% |
| Indian (Asian) | 970 | 3.6% |
| Iranian | 92 | 0.3% |
| Irish | 3,841 | 14.2% |
| Israeli | 18 | 0.1% |
| Italian | 1,627 | 6.0% |
| Jamaican | 329 | 1.2% |
| Korean | 2,429 | 9.0% |
| Latvian | 18 | 0.1% |
| Lebanese | 117 | 0.4% |
| Lithuanian | 74 | 0.3% |
| Macedonian | 31 | 0.1% |
| Malaysian | 205 | 0.8% |
| Maltese | 22 | 0.1% |
| Mexican | 2,367 | 8.7% |
| Mongolian | 8 | 0.0% |
| Native Hawaiian | 129 | 0.5% |
| Nicaraguan | 198 | 0.7% |
| Northern European | 136 | 0.5% |
| Norwegian | 725 | 2.7% |
| Pakistani | 149 | 0.5% |
| Palestinian | 47 | 0.2% |
| Peruvian | 262 | 1.0% |
| Polish | 557 | 2.1% |
| Portuguese | 487 | 1.8% |
| Pueblo | 75 | 0.3% |
| Puerto Rican | 183 | 0.7% |
| Romanian | 52 | 0.2% |
| Russian | 343 | 1.3% |
| Salvadoran | 233 | 0.9% |
| Scandinavian | 244 | 0.9% |
| Scotch-Irish | 300 | 1.1% |
| Scottish | 686 | 2.5% |
| Serbian | 20 | 0.1% |
| Slavic | 6 | 0.0% |
| Slovak | 18 | 0.1% |
| Slovene | 31 | 0.1% |
| South American | 500 | 1.8% |
| South American Indian | 25 | 0.1% |
| Spaniard | 163 | 0.6% |
| Spanish | 174 | 0.6% |
| Spanish American | 13 | 0.1% |
| Sri Lankan | 211 | 0.8% |
| Subsaharan African | 79 | 0.3% |
| Swedish | 451 | 1.7% |
| Swiss | 172 | 0.6% |
| Thai | 222 | 0.8% |
| Tongan | 48 | 0.2% |
| Trinidadian and Tobagonian | 8 | 0.0% |
| Venezuelan | 31 | 0.1% |
| Welsh | 230 | 0.9% |
| Yugoslavian | 111 | 0.4% | View All 95 Rows |
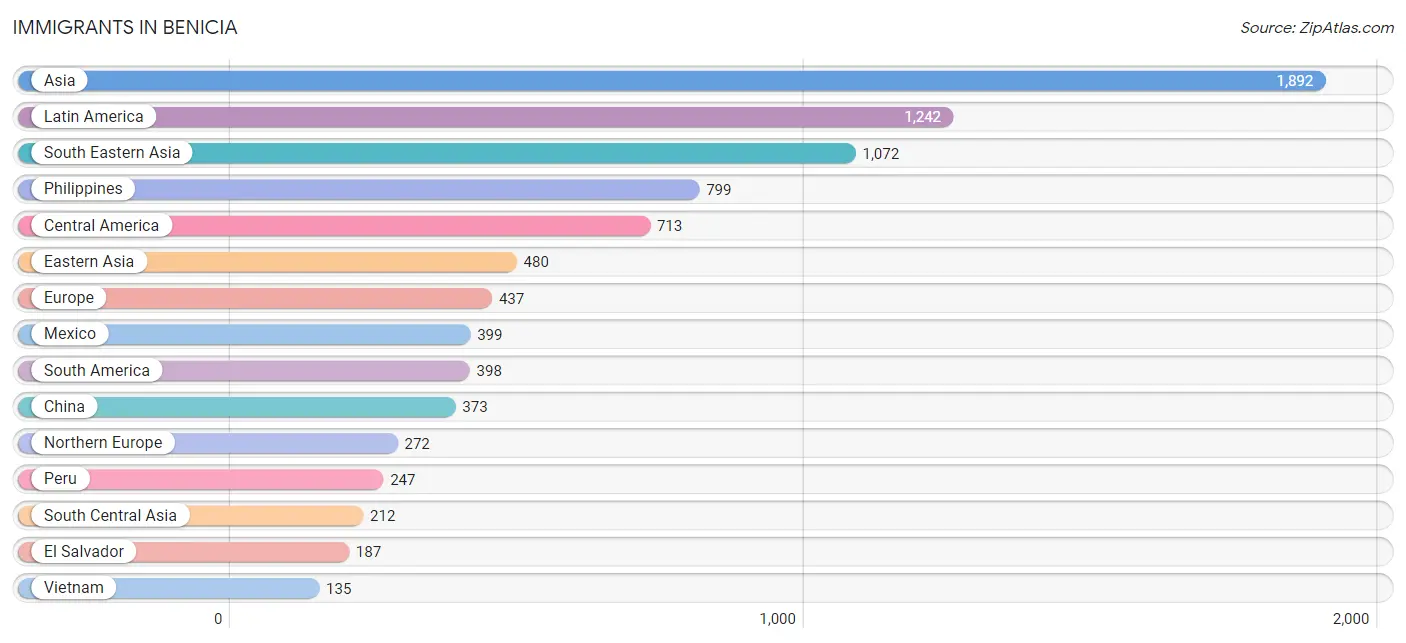
Immigrants in Benicia
The most numerous immigrant groups reported in Benicia came from Asia (1,892 | 7.0%), Latin America (1,242 | 4.6%), South Eastern Asia (1,072 | 4.0%), Philippines (799 | 2.9%), and Central America (713 | 2.6%), together accounting for 21.1% of all Benicia residents.
| Immigration Origin | # Population | % Population |
| Africa | 20 | 0.1% |
| Argentina | 15 | 0.1% |
| Asia | 1,892 | 7.0% |
| Australia | 9 | 0.0% |
| Azores | 8 | 0.0% |
| Brazil | 36 | 0.1% |
| Canada | 134 | 0.5% |
| Caribbean | 131 | 0.5% |
| Central America | 713 | 2.6% |
| Chile | 8 | 0.0% |
| China | 373 | 1.4% |
| Colombia | 69 | 0.3% |
| Cuba | 40 | 0.2% |
| Eastern Africa | 3 | 0.0% |
| Eastern Asia | 480 | 1.8% |
| Eastern Europe | 79 | 0.3% |
| Egypt | 7 | 0.0% |
| El Salvador | 187 | 0.7% |
| England | 76 | 0.3% |
| Europe | 437 | 1.6% |
| Fiji | 7 | 0.0% |
| France | 5 | 0.0% |
| Germany | 14 | 0.1% |
| Guatemala | 11 | 0.0% |
| Honduras | 53 | 0.2% |
| Hong Kong | 69 | 0.3% |
| Hungary | 34 | 0.1% |
| India | 116 | 0.4% |
| Iran | 7 | 0.0% |
| Iraq | 13 | 0.1% |
| Ireland | 45 | 0.2% |
| Israel | 15 | 0.1% |
| Italy | 26 | 0.1% |
| Jamaica | 91 | 0.3% |
| Japan | 27 | 0.1% |
| Korea | 80 | 0.3% |
| Laos | 65 | 0.2% |
| Latin America | 1,242 | 4.6% |
| Lebanon | 89 | 0.3% |
| Malaysia | 22 | 0.1% |
| Mexico | 399 | 1.5% |
| Nepal | 47 | 0.2% |
| Netherlands | 17 | 0.1% |
| Nicaragua | 63 | 0.2% |
| Nigeria | 10 | 0.0% |
| Northern Africa | 7 | 0.0% |
| Northern Europe | 272 | 1.0% |
| Oceania | 16 | 0.1% |
| Peru | 247 | 0.9% |
| Philippines | 799 | 2.9% |
| Portugal | 24 | 0.1% |
| Russia | 26 | 0.1% |
| Scotland | 40 | 0.2% |
| South America | 398 | 1.5% |
| South Central Asia | 212 | 0.8% |
| South Eastern Asia | 1,072 | 4.0% |
| Southern Europe | 50 | 0.2% |
| Thailand | 51 | 0.2% |
| Turkey | 11 | 0.0% |
| Ukraine | 19 | 0.1% |
| Uzbekistan | 42 | 0.2% |
| Venezuela | 11 | 0.0% |
| Vietnam | 135 | 0.5% |
| Western Africa | 10 | 0.0% |
| Western Asia | 128 | 0.5% |
| Western Europe | 36 | 0.1% | View All 66 Rows |
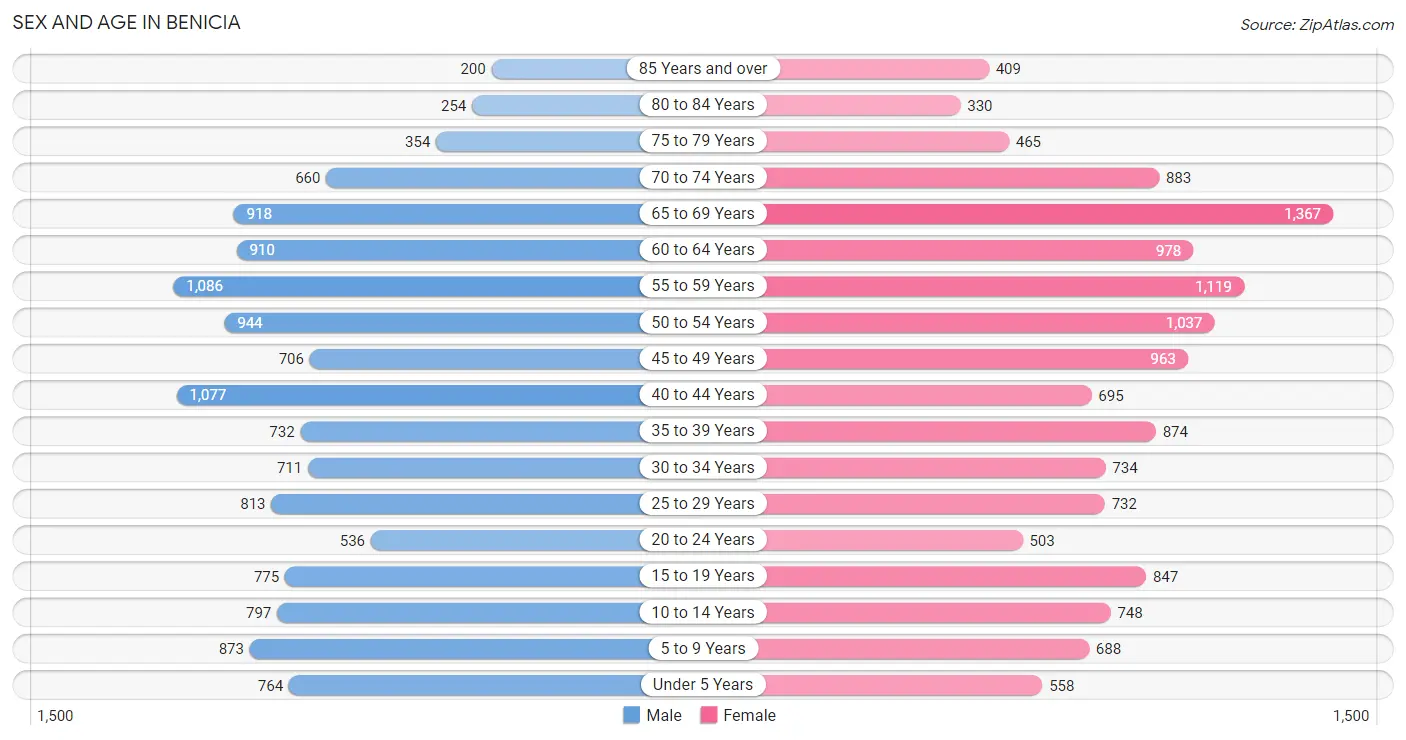
Sex and Age in Benicia
Sex and Age in Benicia
The most populous age groups in Benicia are 55 to 59 Years (1,086 | 8.3%) for men and 65 to 69 Years (1,367 | 9.8%) for women.
| Age Bracket | Male | Female |
| Under 5 Years | 764 (5.8%) | 558 (4.0%) |
| 5 to 9 Years | 873 (6.7%) | 688 (4.9%) |
| 10 to 14 Years | 797 (6.1%) | 748 (5.4%) |
| 15 to 19 Years | 775 (5.9%) | 847 (6.1%) |
| 20 to 24 Years | 536 (4.1%) | 503 (3.6%) |
| 25 to 29 Years | 813 (6.2%) | 732 (5.2%) |
| 30 to 34 Years | 711 (5.4%) | 734 (5.3%) |
| 35 to 39 Years | 732 (5.6%) | 874 (6.3%) |
| 40 to 44 Years | 1,077 (8.2%) | 695 (5.0%) |
| 45 to 49 Years | 706 (5.4%) | 963 (6.9%) |
| 50 to 54 Years | 944 (7.2%) | 1,037 (7.4%) |
| 55 to 59 Years | 1,086 (8.3%) | 1,119 (8.0%) |
| 60 to 64 Years | 910 (6.9%) | 978 (7.0%) |
| 65 to 69 Years | 918 (7.0%) | 1,367 (9.8%) |
| 70 to 74 Years | 660 (5.0%) | 883 (6.3%) |
| 75 to 79 Years | 354 (2.7%) | 465 (3.3%) |
| 80 to 84 Years | 254 (1.9%) | 330 (2.4%) |
| 85 Years and over | 200 (1.5%) | 409 (2.9%) |
| Total | 13,110 (100.0%) | 13,930 (100.0%) |
Families and Households in Benicia
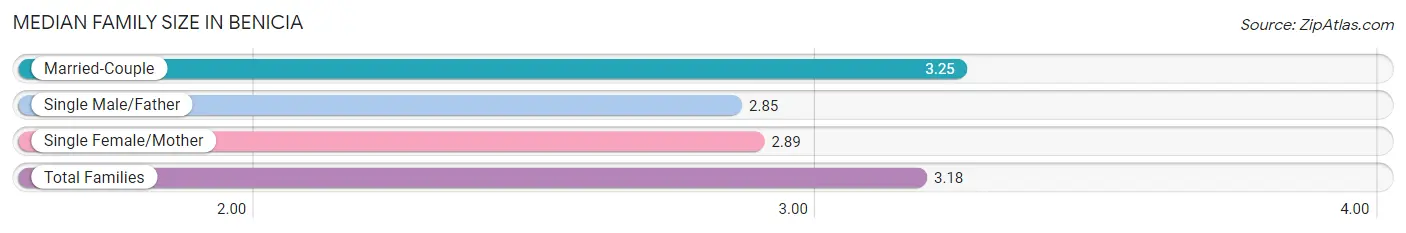
Median Family Size in Benicia
The median family size in Benicia is 3.18 persons per family, with married-couple families (5,516 | 80.2%) accounting for the largest median family size of 3.25 persons per family. On the other hand, single male/father families (445 | 6.5%) represent the smallest median family size with 2.85 persons per family.
| Family Type | # Families | Family Size |
| Married-Couple | 5,516 (80.2%) | 3.25 |
| Single Male/Father | 445 (6.5%) | 2.85 |
| Single Female/Mother | 913 (13.3%) | 2.89 |
| Total Families | 6,874 (100.0%) | 3.18 |
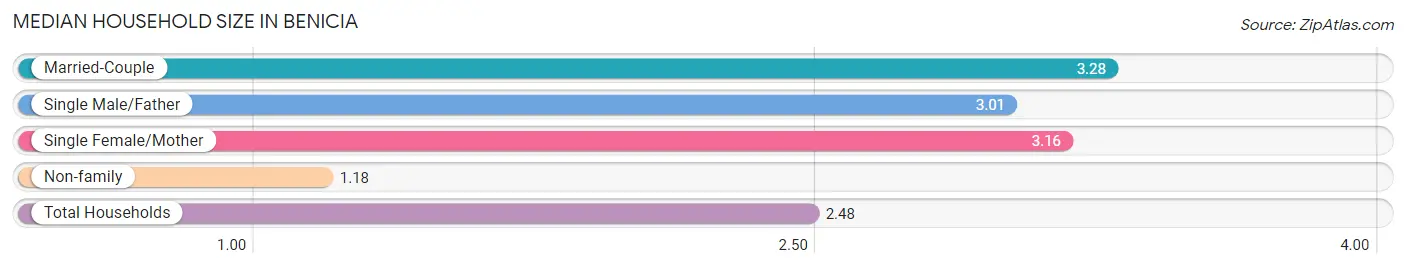
Median Household Size in Benicia
The median household size in Benicia is 2.48 persons per household, with married-couple households (5,516 | 50.7%) accounting for the largest median household size of 3.28 persons per household. non-family households (3,999 | 36.8%) represent the smallest median household size with 1.18 persons per household.
| Household Type | # Households | Household Size |
| Married-Couple | 5,516 (50.7%) | 3.28 |
| Single Male/Father | 445 (4.1%) | 3.01 |
| Single Female/Mother | 913 (8.4%) | 3.16 |
| Non-family | 3,999 (36.8%) | 1.18 |
| Total Households | 10,873 (100.0%) | 2.48 |
Household Size by Marriage Status in Benicia
Out of a total of 10,873 households in Benicia, 6,874 (63.2%) are family households, while 3,999 (36.8%) are nonfamily households. The most numerous type of family households are 2-person households, comprising 2,932, and the most common type of nonfamily households are 1-person households, comprising 3,352.
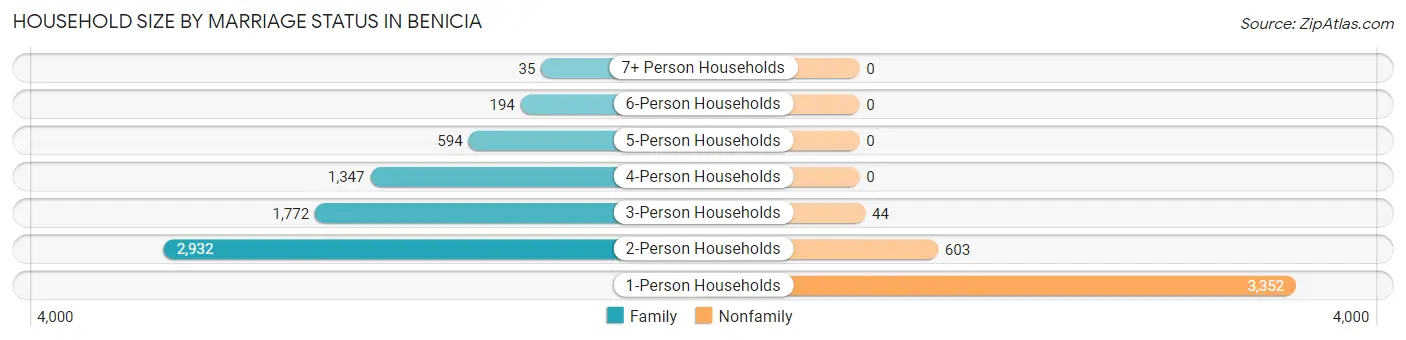
| Household Size | Family Households | Nonfamily Households |
| 1-Person Households | - | 3,352 (30.8%) |
| 2-Person Households | 2,932 (27.0%) | 603 (5.6%) |
| 3-Person Households | 1,772 (16.3%) | 44 (0.4%) |
| 4-Person Households | 1,347 (12.4%) | 0 (0.0%) |
| 5-Person Households | 594 (5.5%) | 0 (0.0%) |
| 6-Person Households | 194 (1.8%) | 0 (0.0%) |
| 7+ Person Households | 35 (0.3%) | 0 (0.0%) |
| Total | 6,874 (63.2%) | 3,999 (36.8%) |
Female Fertility in Benicia
Fertility by Age in Benicia
Average fertility rate in Benicia is 38.0 births per 1,000 women. Women in the age bracket of 35 to 50 years have the highest fertility rate with 49.0 births per 1,000 women. Women in the age bracket of 35 to 50 years acount for 63.8% of all women with births.
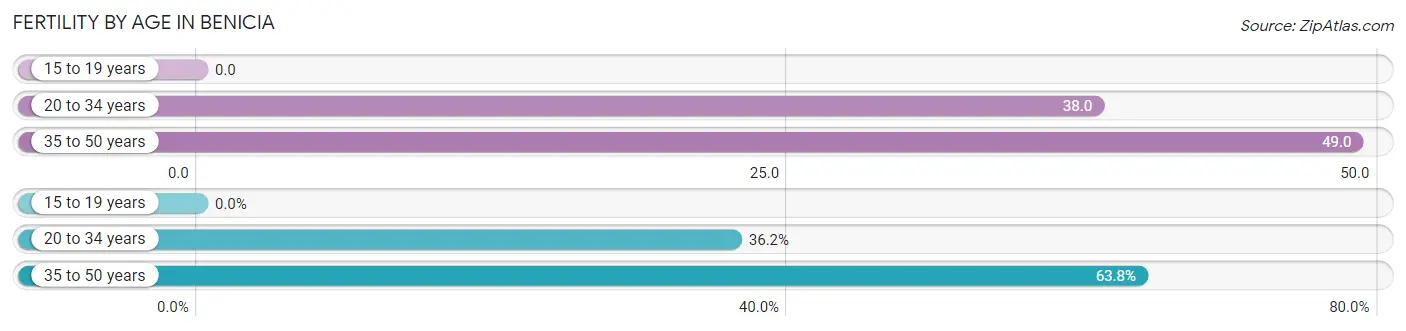
| Age Bracket | Women with Births | Births / 1,000 Women |
| 15 to 19 years | 0 (0.0%) | 0.0 |
| 20 to 34 years | 75 (36.2%) | 38.0 |
| 35 to 50 years | 132 (63.8%) | 49.0 |
| Total | 207 (100.0%) | 38.0 |
Fertility by Age by Marriage Status in Benicia
91.3% of women with births (207) in Benicia are married. The highest percentage of unmarried women with births falls into 35 to 50 years age bracket with 13.6% of them unmarried at the time of birth, while the lowest percentage of unmarried women with births belong to 20 to 34 years age bracket with 0.0% of them unmarried.
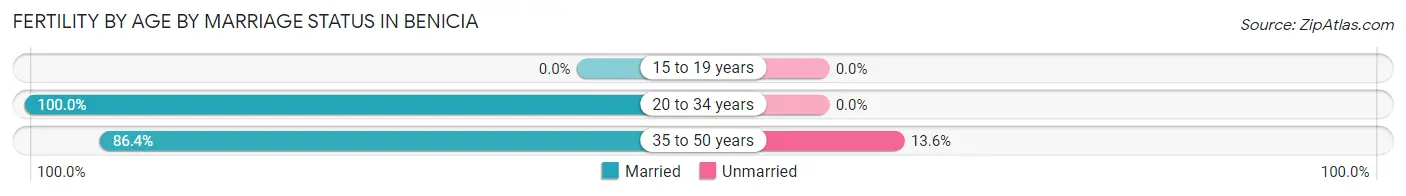
| Age Bracket | Married | Unmarried |
| 15 to 19 years | 0 (0.0%) | 0 (0.0%) |
| 20 to 34 years | 75 (100.0%) | 0 (0.0%) |
| 35 to 50 years | 114 (86.4%) | 18 (13.6%) |
| Total | 189 (91.3%) | 18 (8.7%) |
Fertility by Education in Benicia
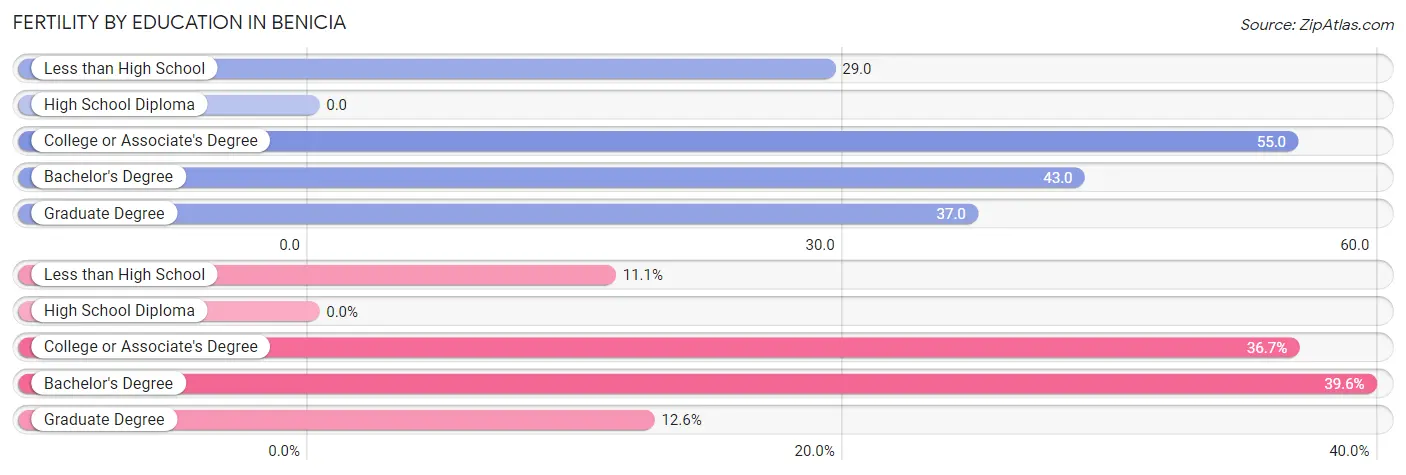
| Educational Attainment | Women with Births | Births / 1,000 Women |
| Less than High School | 23 (11.1%) | 29.0 |
| High School Diploma | 0 (0.0%) | 0.0 |
| College or Associate's Degree | 76 (36.7%) | 55.0 |
| Bachelor's Degree | 82 (39.6%) | 43.0 |
| Graduate Degree | 26 (12.6%) | 37.0 |
| Total | 207 (100.0%) | 38.0 |
Fertility by Education by Marriage Status in Benicia
8.7% of women with births in Benicia are unmarried. Women with the educational attainment of less than high school are most likely to be married with 100.0% of them married at childbirth, while women with the educational attainment of college or associate's degree are least likely to be married with 23.7% of them unmarried at childbirth.
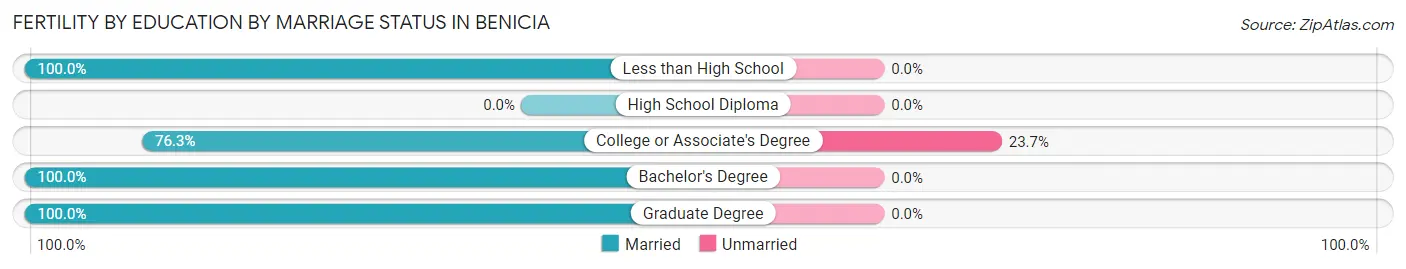
| Educational Attainment | Married | Unmarried |
| Less than High School | 23 (100.0%) | 0 (0.0%) |
| High School Diploma | 0 (0.0%) | 0 (0.0%) |
| College or Associate's Degree | 58 (76.3%) | 18 (23.7%) |
| Bachelor's Degree | 82 (100.0%) | 0 (0.0%) |
| Graduate Degree | 26 (100.0%) | 0 (0.0%) |
| Total | 189 (91.3%) | 18 (8.7%) |
Employment Characteristics in Benicia
Employment by Class of Employer in Benicia
Among the 13,337 employed individuals in Benicia, private company employees (8,250 | 61.9%), local government employees (1,516 | 11.4%), and not-for-profit organizations (1,189 | 8.9%) make up the most common classes of employment.
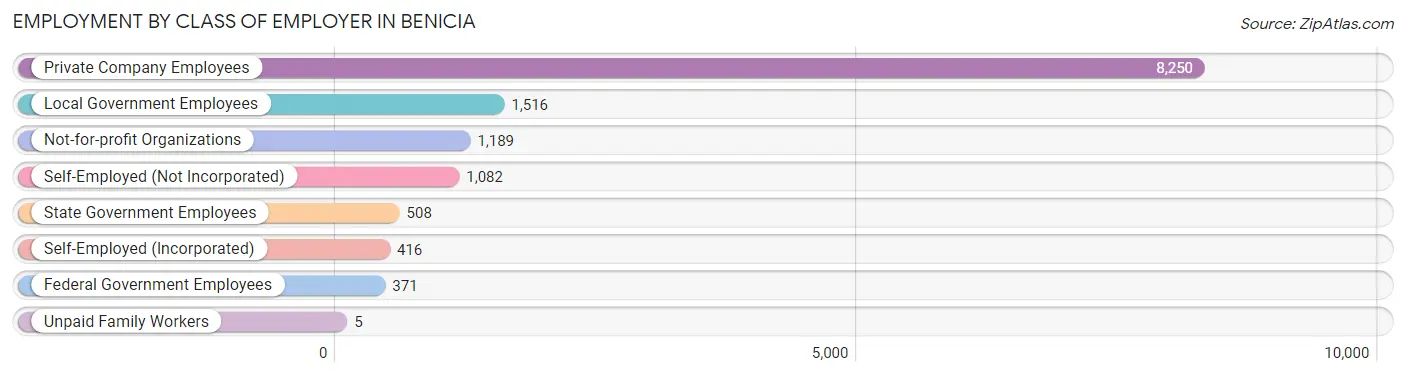
| Employer Class | # Employees | % Employees |
| Private Company Employees | 8,250 | 61.9% |
| Self-Employed (Incorporated) | 416 | 3.1% |
| Self-Employed (Not Incorporated) | 1,082 | 8.1% |
| Not-for-profit Organizations | 1,189 | 8.9% |
| Local Government Employees | 1,516 | 11.4% |
| State Government Employees | 508 | 3.8% |
| Federal Government Employees | 371 | 2.8% |
| Unpaid Family Workers | 5 | 0.0% |
| Total | 13,337 | 100.0% |
Employment Status by Age in Benicia
According to the labor force statistics for Benicia, out of the total population over 16 years of age (22,267), 63.9% or 14,229 individuals are in the labor force, with 4.1% or 583 of them unemployed. The age group with the highest labor force participation rate is 25 to 29 years, with 94.7% or 1,463 individuals in the labor force. Within the labor force, the 75 years and over age range has the highest percentage of unemployed individuals, with 20.1% or 27 of them being unemployed.
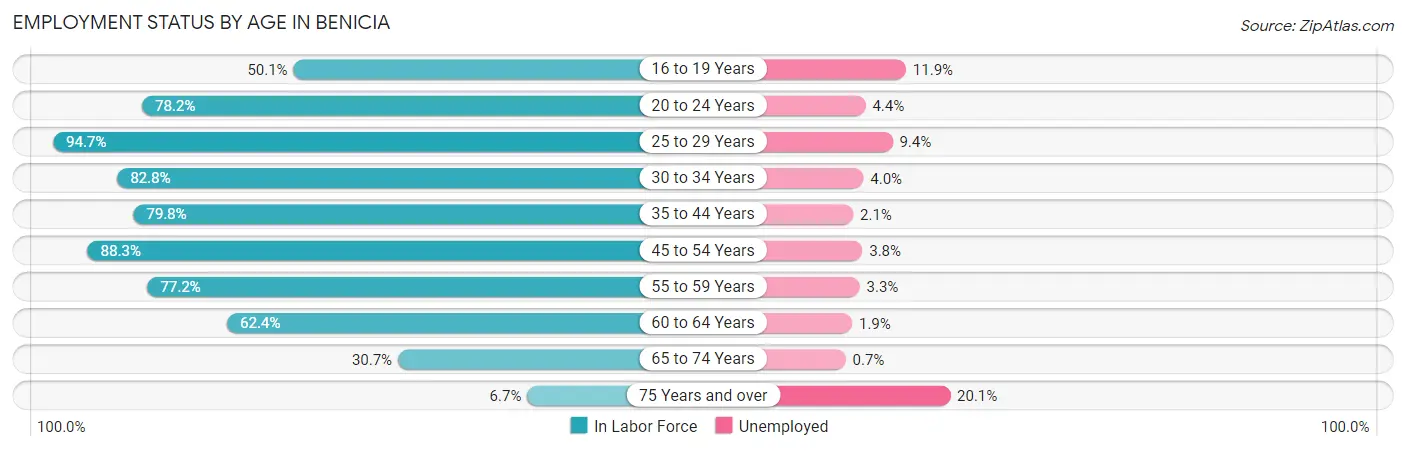
| Age Bracket | In Labor Force | Unemployed |
| 16 to 19 Years | 640 (50.1%) | 76 (11.9%) |
| 20 to 24 Years | 812 (78.2%) | 36 (4.4%) |
| 25 to 29 Years | 1,463 (94.7%) | 138 (9.4%) |
| 30 to 34 Years | 1,196 (82.8%) | 48 (4.0%) |
| 35 to 44 Years | 2,696 (79.8%) | 57 (2.1%) |
| 45 to 54 Years | 3,223 (88.3%) | 122 (3.8%) |
| 55 to 59 Years | 1,702 (77.2%) | 56 (3.3%) |
| 60 to 64 Years | 1,178 (62.4%) | 22 (1.9%) |
| 65 to 74 Years | 1,175 (30.7%) | 8 (0.7%) |
| 75 Years and over | 135 (6.7%) | 27 (20.1%) |
| Total | 14,229 (63.9%) | 583 (4.1%) |
Employment Status by Educational Attainment in Benicia
According to labor force statistics for Benicia, 81.2% of individuals (11,458) out of the total population between 25 and 64 years of age (14,111) are in the labor force, with 3.9% or 447 of them being unemployed. The group with the highest labor force participation rate are those with the educational attainment of bachelor's degree or higher, with 87.8% or 5,948 individuals in the labor force. Within the labor force, individuals with less than high school education have the highest percentage of unemployment, with 29.8% or 104 of them being unemployed.
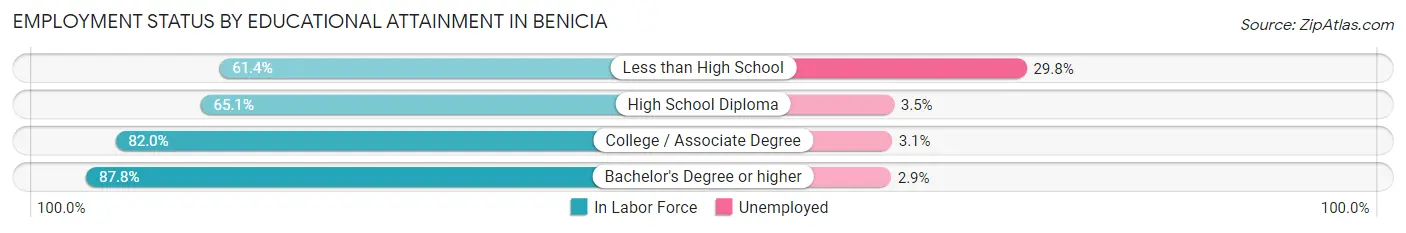
| Educational Attainment | In Labor Force | Unemployed |
| Less than High School | 349 (61.4%) | 169 (29.8%) |
| High School Diploma | 1,491 (65.1%) | 80 (3.5%) |
| College / Associate Degree | 3,672 (82.0%) | 139 (3.1%) |
| Bachelor's Degree or higher | 5,948 (87.8%) | 196 (2.9%) |
| Total | 11,458 (81.2%) | 550 (3.9%) |
Employment Occupations by Sex in Benicia
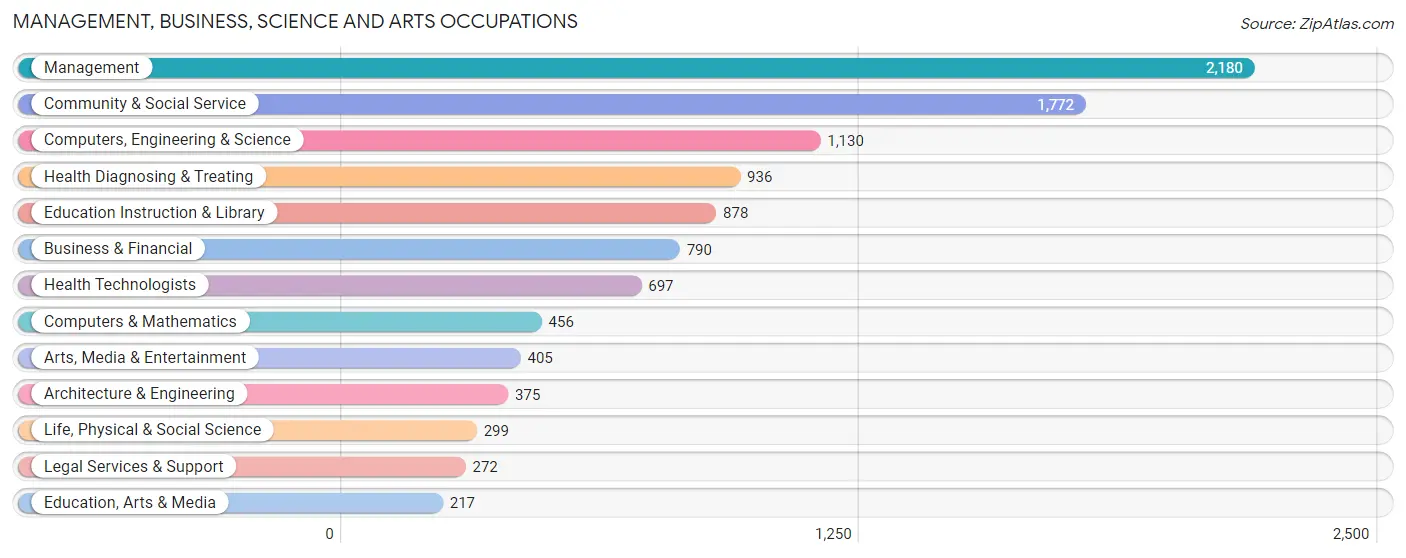
Management, Business, Science and Arts Occupations
The most common Management, Business, Science and Arts occupations in Benicia are Management (2,180 | 16.1%), Community & Social Service (1,772 | 13.1%), Computers, Engineering & Science (1,130 | 8.3%), Health Diagnosing & Treating (936 | 6.9%), and Education Instruction & Library (878 | 6.5%).
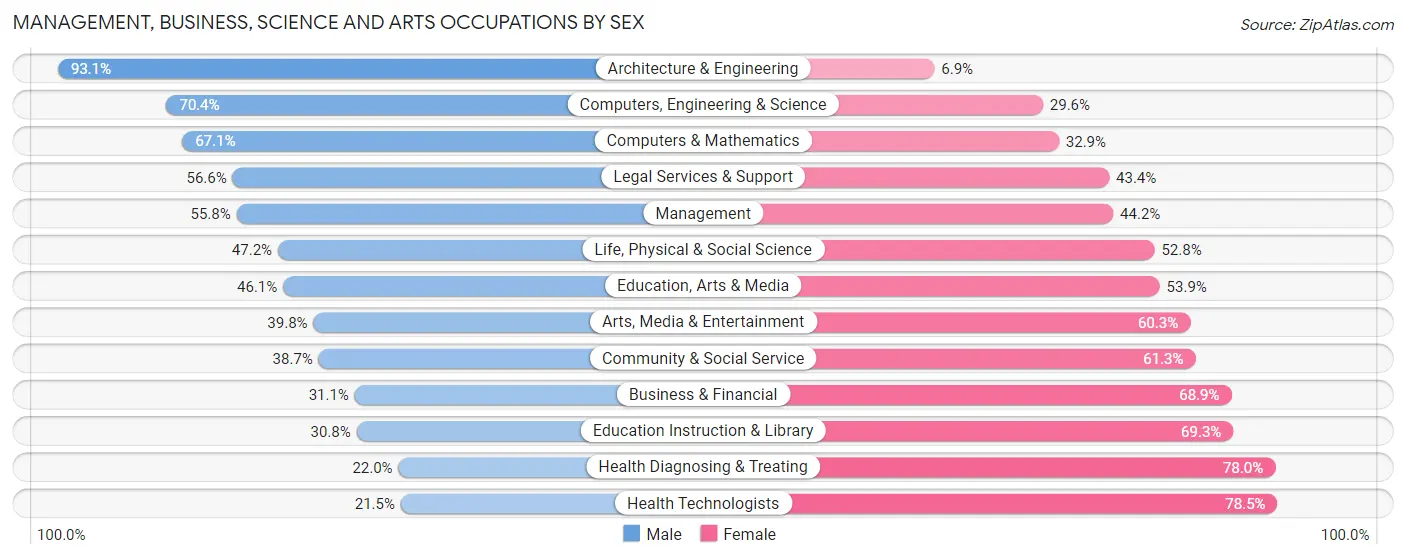
Management, Business, Science and Arts Occupations by Sex
Within the Management, Business, Science and Arts occupations in Benicia, the most male-oriented occupations are Architecture & Engineering (93.1%), Computers, Engineering & Science (70.4%), and Computers & Mathematics (67.1%), while the most female-oriented occupations are Health Technologists (78.5%), Health Diagnosing & Treating (78.0%), and Education Instruction & Library (69.3%).
| Occupation | Male | Female |
| Management | 1,216 (55.8%) | 964 (44.2%) |
| Business & Financial | 246 (31.1%) | 544 (68.9%) |
| Computers, Engineering & Science | 796 (70.4%) | 334 (29.6%) |
| Computers & Mathematics | 306 (67.1%) | 150 (32.9%) |
| Architecture & Engineering | 349 (93.1%) | 26 (6.9%) |
| Life, Physical & Social Science | 141 (47.2%) | 158 (52.8%) |
| Community & Social Service | 685 (38.7%) | 1,087 (61.3%) |
| Education, Arts & Media | 100 (46.1%) | 117 (53.9%) |
| Legal Services & Support | 154 (56.6%) | 118 (43.4%) |
| Education Instruction & Library | 270 (30.7%) | 608 (69.3%) |
| Arts, Media & Entertainment | 161 (39.8%) | 244 (60.3%) |
| Health Diagnosing & Treating | 206 (22.0%) | 730 (78.0%) |
| Health Technologists | 150 (21.5%) | 547 (78.5%) |
| Total (Category) | 3,149 (46.3%) | 3,659 (53.7%) |
| Total (Overall) | 6,890 (50.7%) | 6,693 (49.3%) |
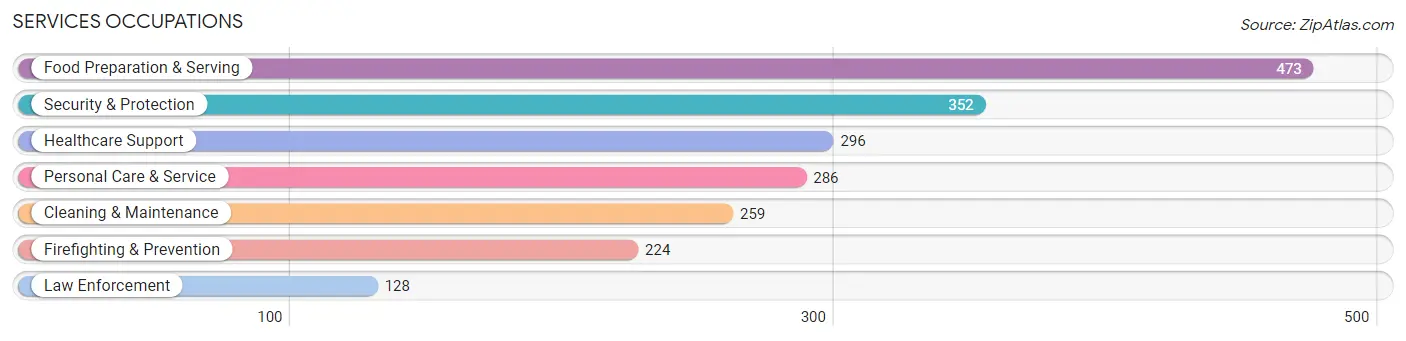
Services Occupations
The most common Services occupations in Benicia are Food Preparation & Serving (473 | 3.5%), Security & Protection (352 | 2.6%), Healthcare Support (296 | 2.2%), Personal Care & Service (286 | 2.1%), and Cleaning & Maintenance (259 | 1.9%).
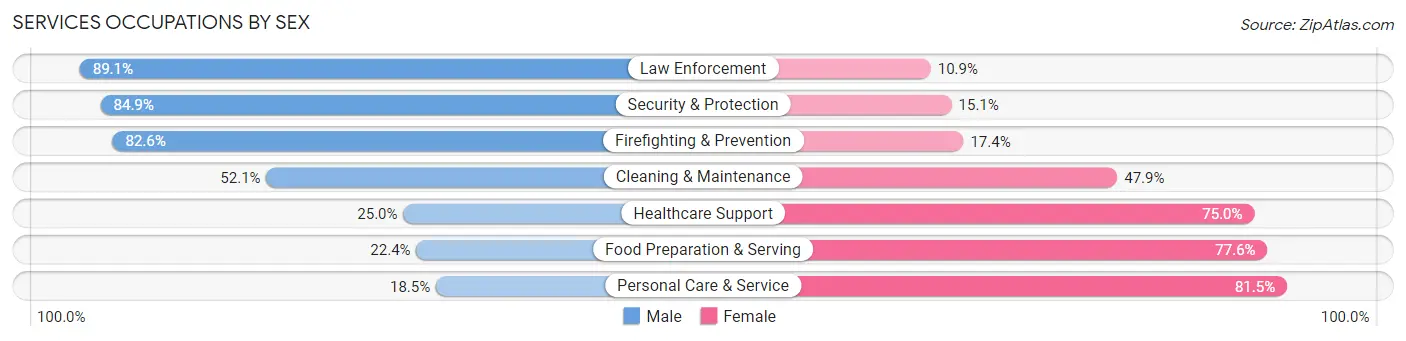
Services Occupations by Sex
Within the Services occupations in Benicia, the most male-oriented occupations are Law Enforcement (89.1%), Security & Protection (84.9%), and Firefighting & Prevention (82.6%), while the most female-oriented occupations are Personal Care & Service (81.5%), Food Preparation & Serving (77.6%), and Healthcare Support (75.0%).
| Occupation | Male | Female |
| Healthcare Support | 74 (25.0%) | 222 (75.0%) |
| Security & Protection | 299 (84.9%) | 53 (15.1%) |
| Firefighting & Prevention | 185 (82.6%) | 39 (17.4%) |
| Law Enforcement | 114 (89.1%) | 14 (10.9%) |
| Food Preparation & Serving | 106 (22.4%) | 367 (77.6%) |
| Cleaning & Maintenance | 135 (52.1%) | 124 (47.9%) |
| Personal Care & Service | 53 (18.5%) | 233 (81.5%) |
| Total (Category) | 667 (40.0%) | 999 (60.0%) |
| Total (Overall) | 6,890 (50.7%) | 6,693 (49.3%) |
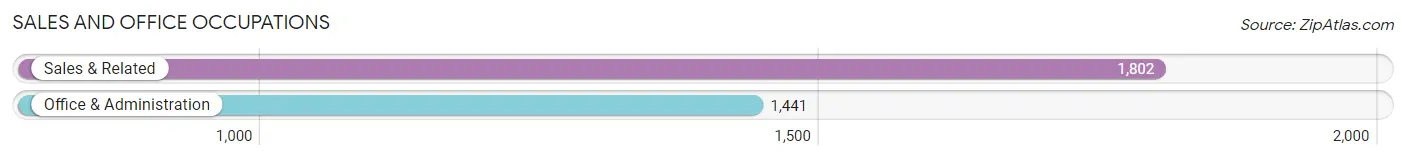
Sales and Office Occupations
The most common Sales and Office occupations in Benicia are Sales & Related (1,802 | 13.3%), and Office & Administration (1,441 | 10.6%).
Sales and Office Occupations by Sex
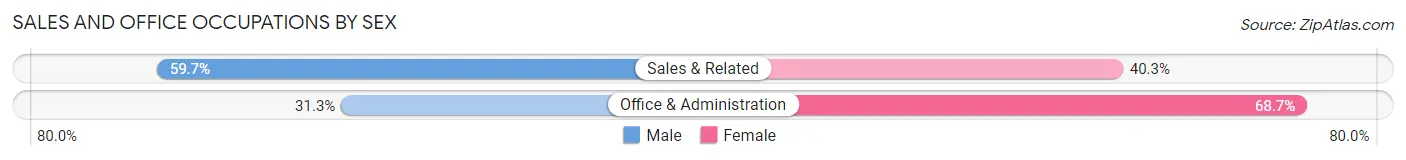
| Occupation | Male | Female |
| Sales & Related | 1,075 (59.7%) | 727 (40.3%) |
| Office & Administration | 451 (31.3%) | 990 (68.7%) |
| Total (Category) | 1,526 (47.1%) | 1,717 (52.9%) |
| Total (Overall) | 6,890 (50.7%) | 6,693 (49.3%) |
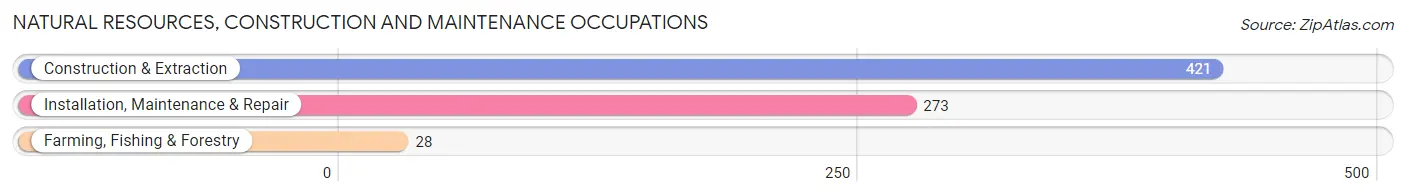
Natural Resources, Construction and Maintenance Occupations
The most common Natural Resources, Construction and Maintenance occupations in Benicia are Construction & Extraction (421 | 3.1%), Installation, Maintenance & Repair (273 | 2.0%), and Farming, Fishing & Forestry (28 | 0.2%).
Natural Resources, Construction and Maintenance Occupations by Sex
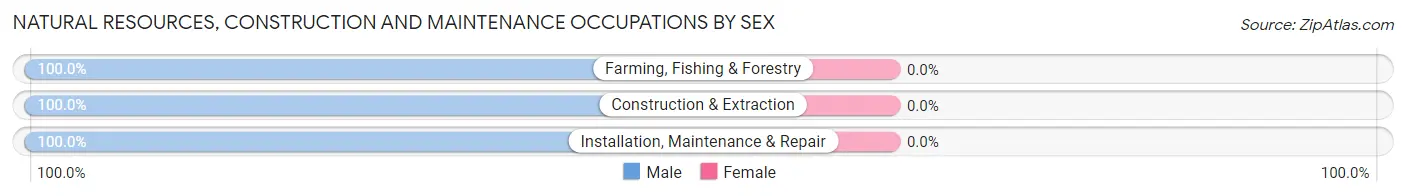
| Occupation | Male | Female |
| Farming, Fishing & Forestry | 28 (100.0%) | 0 (0.0%) |
| Construction & Extraction | 421 (100.0%) | 0 (0.0%) |
| Installation, Maintenance & Repair | 273 (100.0%) | 0 (0.0%) |
| Total (Category) | 722 (100.0%) | 0 (0.0%) |
| Total (Overall) | 6,890 (50.7%) | 6,693 (49.3%) |
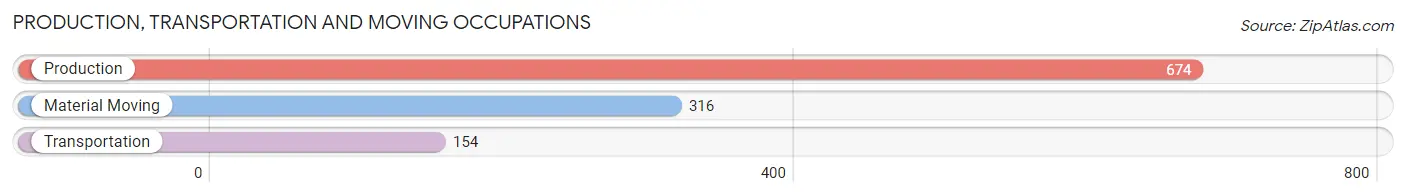
Production, Transportation and Moving Occupations
The most common Production, Transportation and Moving occupations in Benicia are Production (674 | 5.0%), Material Moving (316 | 2.3%), and Transportation (154 | 1.1%).
Production, Transportation and Moving Occupations by Sex
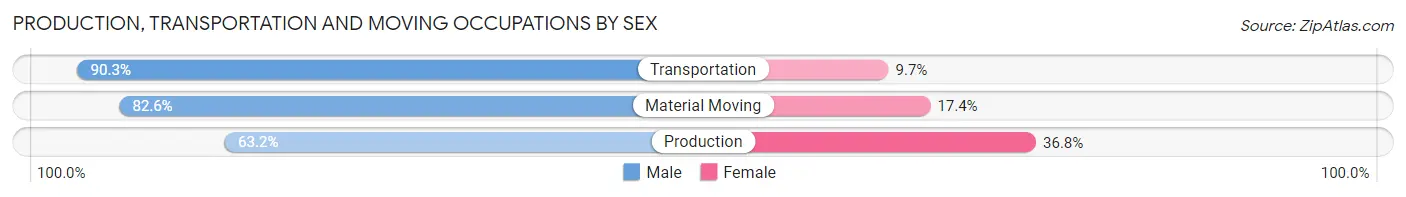
| Occupation | Male | Female |
| Production | 426 (63.2%) | 248 (36.8%) |
| Transportation | 139 (90.3%) | 15 (9.7%) |
| Material Moving | 261 (82.6%) | 55 (17.4%) |
| Total (Category) | 826 (72.2%) | 318 (27.8%) |
| Total (Overall) | 6,890 (50.7%) | 6,693 (49.3%) |
Employment Industries by Sex in Benicia
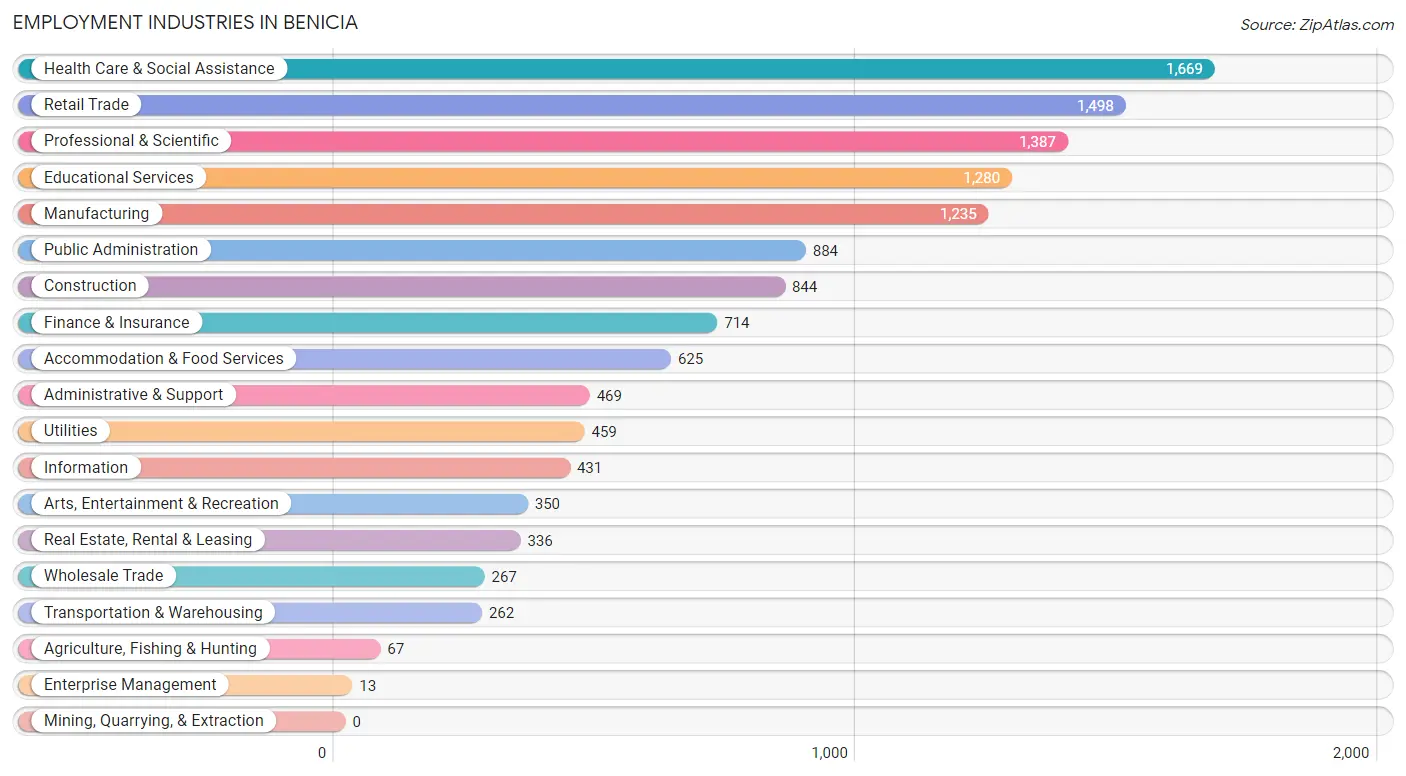
Employment Industries in Benicia
The major employment industries in Benicia include Health Care & Social Assistance (1,669 | 12.3%), Retail Trade (1,498 | 11.0%), Professional & Scientific (1,387 | 10.2%), Educational Services (1,280 | 9.4%), and Manufacturing (1,235 | 9.1%).
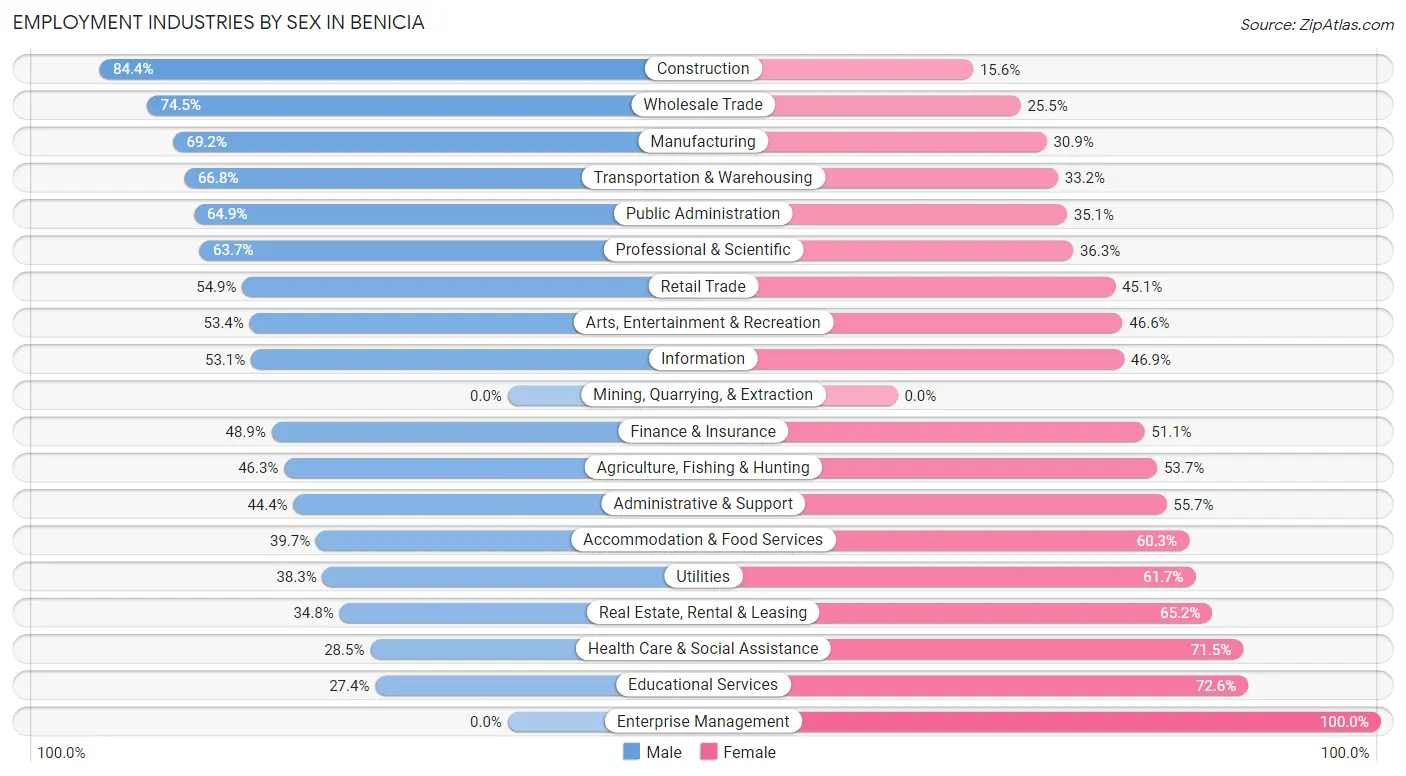
Employment Industries by Sex in Benicia
The Benicia industries that see more men than women are Construction (84.4%), Wholesale Trade (74.5%), and Manufacturing (69.2%), whereas the industries that tend to have a higher number of women are Enterprise Management (100.0%), Educational Services (72.6%), and Health Care & Social Assistance (71.5%).
| Industry | Male | Female |
| Agriculture, Fishing & Hunting | 31 (46.3%) | 36 (53.7%) |
| Mining, Quarrying, & Extraction | 0 (0.0%) | 0 (0.0%) |
| Construction | 712 (84.4%) | 132 (15.6%) |
| Manufacturing | 854 (69.2%) | 381 (30.8%) |
| Wholesale Trade | 199 (74.5%) | 68 (25.5%) |
| Retail Trade | 823 (54.9%) | 675 (45.1%) |
| Transportation & Warehousing | 175 (66.8%) | 87 (33.2%) |
| Utilities | 176 (38.3%) | 283 (61.7%) |
| Information | 229 (53.1%) | 202 (46.9%) |
| Finance & Insurance | 349 (48.9%) | 365 (51.1%) |
| Real Estate, Rental & Leasing | 117 (34.8%) | 219 (65.2%) |
| Professional & Scientific | 883 (63.7%) | 504 (36.3%) |
| Enterprise Management | 0 (0.0%) | 13 (100.0%) |
| Administrative & Support | 208 (44.4%) | 261 (55.6%) |
| Educational Services | 351 (27.4%) | 929 (72.6%) |
| Health Care & Social Assistance | 475 (28.5%) | 1,194 (71.5%) |
| Arts, Entertainment & Recreation | 187 (53.4%) | 163 (46.6%) |
| Accommodation & Food Services | 248 (39.7%) | 377 (60.3%) |
| Public Administration | 574 (64.9%) | 310 (35.1%) |
| Total | 6,890 (50.7%) | 6,693 (49.3%) |
Education in Benicia
School Enrollment in Benicia
The most common levels of schooling among the 5,783 students in Benicia are high school (1,385 | 23.9%), elementary school (1,348 | 23.3%), and middle school (1,314 | 22.7%).
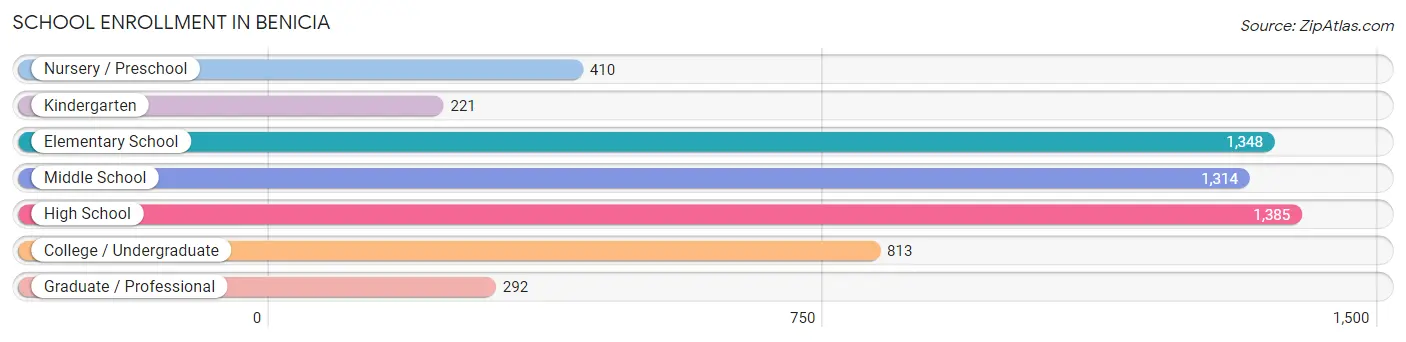
| School Level | # Students | % Students |
| Nursery / Preschool | 410 | 7.1% |
| Kindergarten | 221 | 3.8% |
| Elementary School | 1,348 | 23.3% |
| Middle School | 1,314 | 22.7% |
| High School | 1,385 | 23.9% |
| College / Undergraduate | 813 | 14.1% |
| Graduate / Professional | 292 | 5.1% |
| Total | 5,783 | 100.0% |
School Enrollment by Age by Funding Source in Benicia
Out of a total of 5,783 students who are enrolled in schools in Benicia, 873 (15.1%) attend a private institution, while the remaining 4,910 (84.9%) are enrolled in public schools. The age group of 25 to 34 year olds has the highest likelihood of being enrolled in private schools, with 138 (53.1% in the age bracket) enrolled. Conversely, the age group of 10 to 14 year olds has the lowest likelihood of being enrolled in a private school, with 1,435 (93.3% in the age bracket) attending a public institution.
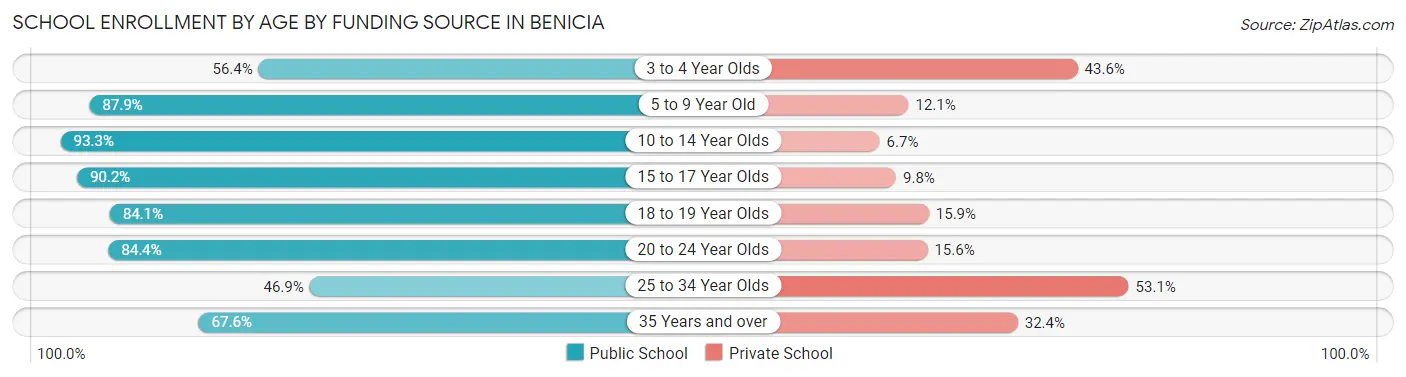
| Age Bracket | Public School | Private School |
| 3 to 4 Year Olds | 189 (56.4%) | 146 (43.6%) |
| 5 to 9 Year Old | 1,361 (87.9%) | 187 (12.1%) |
| 10 to 14 Year Olds | 1,435 (93.3%) | 103 (6.7%) |
| 15 to 17 Year Olds | 962 (90.2%) | 104 (9.8%) |
| 18 to 19 Year Olds | 371 (84.1%) | 70 (15.9%) |
| 20 to 24 Year Olds | 346 (84.4%) | 64 (15.6%) |
| 25 to 34 Year Olds | 122 (46.9%) | 138 (53.1%) |
| 35 Years and over | 125 (67.6%) | 60 (32.4%) |
| Total | 4,910 (84.9%) | 873 (15.1%) |
Educational Attainment by Field of Study in Benicia
Business (1,455 | 14.7%), social sciences (1,097 | 11.1%), science & technology (1,057 | 10.7%), engineering (901 | 9.1%), and bio, nature & agricultural (778 | 7.9%) are the most common fields of study among 9,907 individuals in Benicia who have obtained a bachelor's degree or higher.
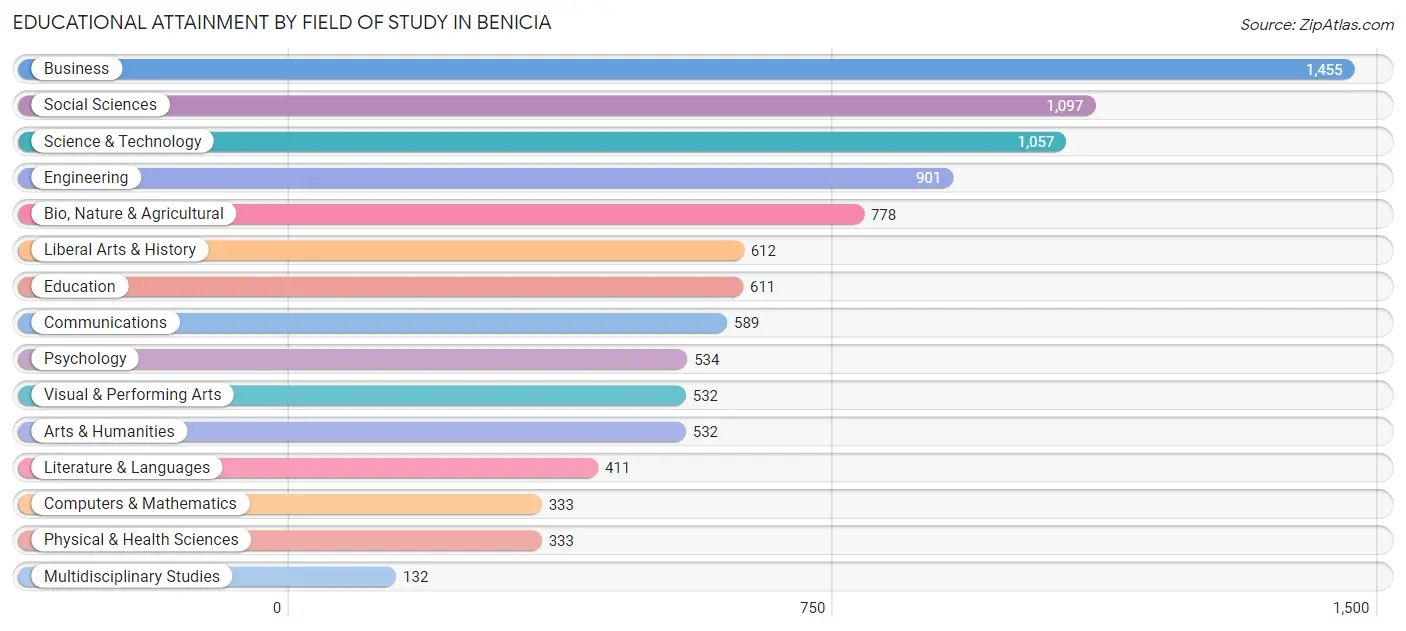
| Field of Study | # Graduates | % Graduates |
| Computers & Mathematics | 333 | 3.4% |
| Bio, Nature & Agricultural | 778 | 7.9% |
| Physical & Health Sciences | 333 | 3.4% |
| Psychology | 534 | 5.4% |
| Social Sciences | 1,097 | 11.1% |
| Engineering | 901 | 9.1% |
| Multidisciplinary Studies | 132 | 1.3% |
| Science & Technology | 1,057 | 10.7% |
| Business | 1,455 | 14.7% |
| Education | 611 | 6.2% |
| Literature & Languages | 411 | 4.2% |
| Liberal Arts & History | 612 | 6.2% |
| Visual & Performing Arts | 532 | 5.4% |
| Communications | 589 | 5.9% |
| Arts & Humanities | 532 | 5.4% |
| Total | 9,907 | 100.0% |
Transportation & Commute in Benicia
Vehicle Availability by Sex in Benicia
The most prevalent vehicle ownership categories in Benicia are males with 2 vehicles (2,512, accounting for 36.8%) and females with 2 vehicles (2,242, making up 38.6%).
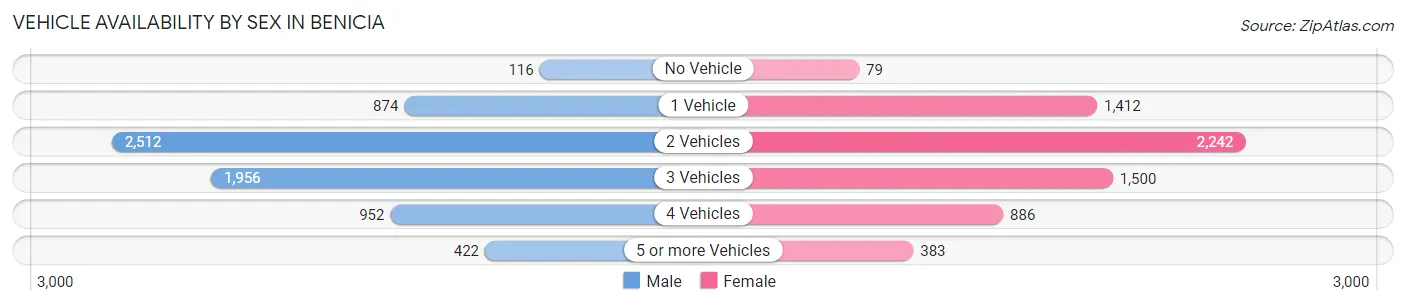
| Vehicles Available | Male | Female |
| No Vehicle | 116 (1.7%) | 79 (1.2%) |
| 1 Vehicle | 874 (12.8%) | 1,412 (21.7%) |
| 2 Vehicles | 2,512 (36.8%) | 2,242 (34.5%) |
| 3 Vehicles | 1,956 (28.6%) | 1,500 (23.1%) |
| 4 Vehicles | 952 (13.9%) | 886 (13.6%) |
| 5 or more Vehicles | 422 (6.2%) | 383 (5.9%) |
| Total | 6,832 (100.0%) | 6,502 (100.0%) |
Commute Time in Benicia
The most frequently occuring commute durations in Benicia are 20 to 24 minutes (1,410 commuters, 12.9%), 10 to 14 minutes (1,407 commuters, 12.9%), and 60 to 89 minutes (1,356 commuters, 12.4%).
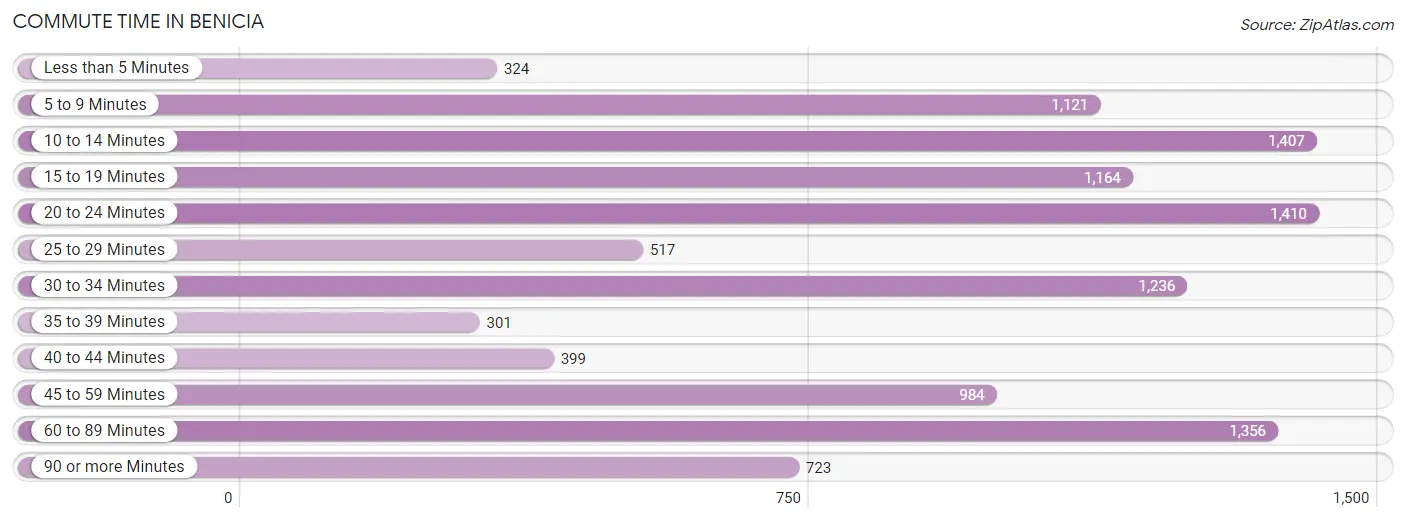
| Commute Time | # Commuters | % Commuters |
| Less than 5 Minutes | 324 | 3.0% |
| 5 to 9 Minutes | 1,121 | 10.2% |
| 10 to 14 Minutes | 1,407 | 12.9% |
| 15 to 19 Minutes | 1,164 | 10.6% |
| 20 to 24 Minutes | 1,410 | 12.9% |
| 25 to 29 Minutes | 517 | 4.7% |
| 30 to 34 Minutes | 1,236 | 11.3% |
| 35 to 39 Minutes | 301 | 2.8% |
| 40 to 44 Minutes | 399 | 3.6% |
| 45 to 59 Minutes | 984 | 9.0% |
| 60 to 89 Minutes | 1,356 | 12.4% |
| 90 or more Minutes | 723 | 6.6% |
Commute Time by Sex in Benicia
The most common commute times in Benicia are 60 to 89 minutes (954 commuters, 16.2%) for males and 10 to 14 minutes (651 commuters, 12.9%) for females.
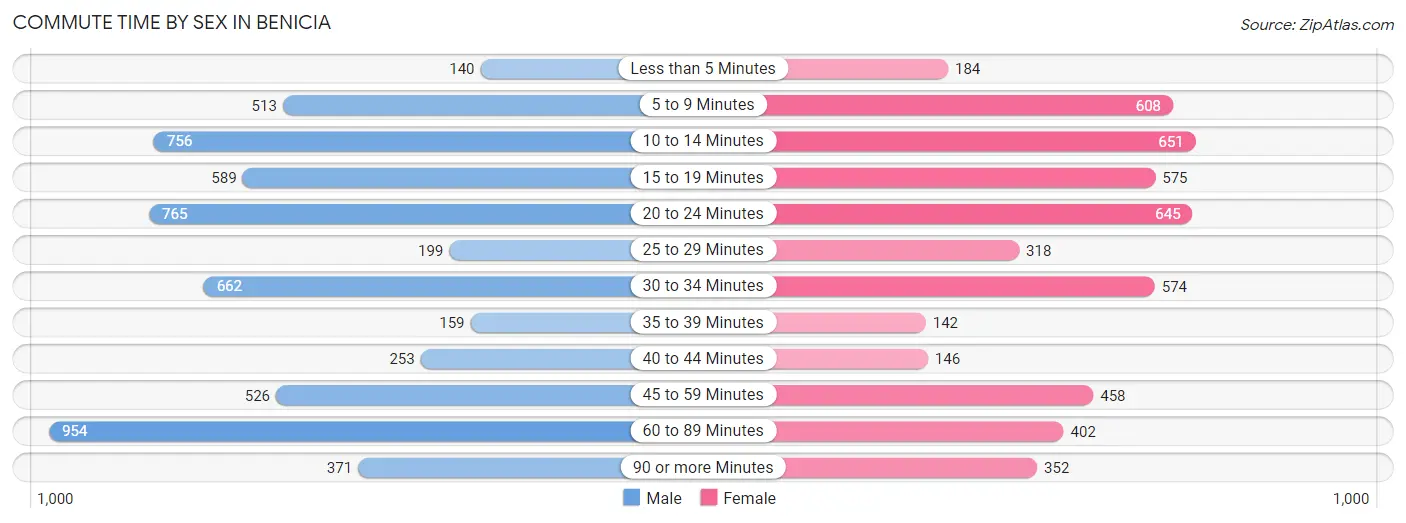
| Commute Time | Male | Female |
| Less than 5 Minutes | 140 (2.4%) | 184 (3.6%) |
| 5 to 9 Minutes | 513 (8.7%) | 608 (12.0%) |
| 10 to 14 Minutes | 756 (12.8%) | 651 (12.9%) |
| 15 to 19 Minutes | 589 (10.0%) | 575 (11.4%) |
| 20 to 24 Minutes | 765 (13.0%) | 645 (12.8%) |
| 25 to 29 Minutes | 199 (3.4%) | 318 (6.3%) |
| 30 to 34 Minutes | 662 (11.3%) | 574 (11.4%) |
| 35 to 39 Minutes | 159 (2.7%) | 142 (2.8%) |
| 40 to 44 Minutes | 253 (4.3%) | 146 (2.9%) |
| 45 to 59 Minutes | 526 (8.9%) | 458 (9.1%) |
| 60 to 89 Minutes | 954 (16.2%) | 402 (8.0%) |
| 90 or more Minutes | 371 (6.3%) | 352 (7.0%) |
Time of Departure to Work by Sex in Benicia
The most frequent times of departure to work in Benicia are 7:00 AM to 7:29 AM (788, 13.4%) for males and 7:30 AM to 7:59 AM (939, 18.6%) for females.
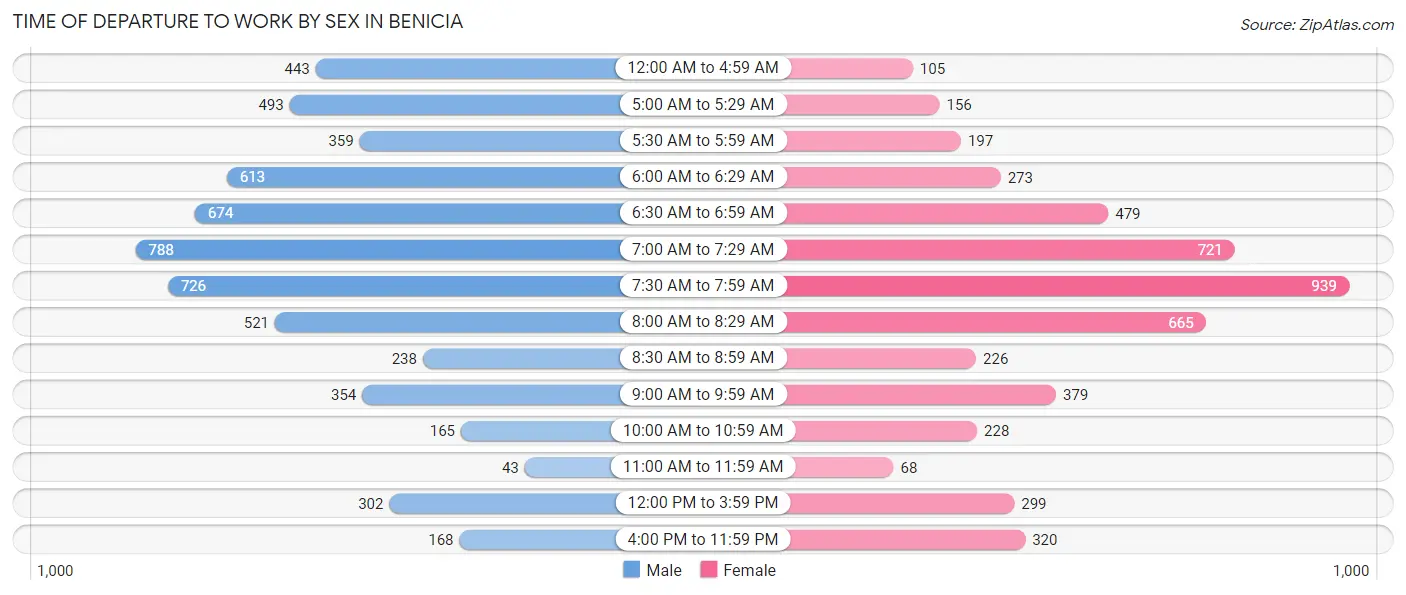
| Time of Departure | Male | Female |
| 12:00 AM to 4:59 AM | 443 (7.5%) | 105 (2.1%) |
| 5:00 AM to 5:29 AM | 493 (8.4%) | 156 (3.1%) |
| 5:30 AM to 5:59 AM | 359 (6.1%) | 197 (3.9%) |
| 6:00 AM to 6:29 AM | 613 (10.4%) | 273 (5.4%) |
| 6:30 AM to 6:59 AM | 674 (11.5%) | 479 (9.5%) |
| 7:00 AM to 7:29 AM | 788 (13.4%) | 721 (14.3%) |
| 7:30 AM to 7:59 AM | 726 (12.3%) | 939 (18.6%) |
| 8:00 AM to 8:29 AM | 521 (8.8%) | 665 (13.2%) |
| 8:30 AM to 8:59 AM | 238 (4.0%) | 226 (4.5%) |
| 9:00 AM to 9:59 AM | 354 (6.0%) | 379 (7.5%) |
| 10:00 AM to 10:59 AM | 165 (2.8%) | 228 (4.5%) |
| 11:00 AM to 11:59 AM | 43 (0.7%) | 68 (1.3%) |
| 12:00 PM to 3:59 PM | 302 (5.1%) | 299 (5.9%) |
| 4:00 PM to 11:59 PM | 168 (2.9%) | 320 (6.3%) |
| Total | 5,887 (100.0%) | 5,055 (100.0%) |
Housing Occupancy in Benicia
Occupancy by Ownership in Benicia
Of the total 10,873 dwellings in Benicia, owner-occupied units account for 7,613 (70.0%), while renter-occupied units make up 3,260 (30.0%).
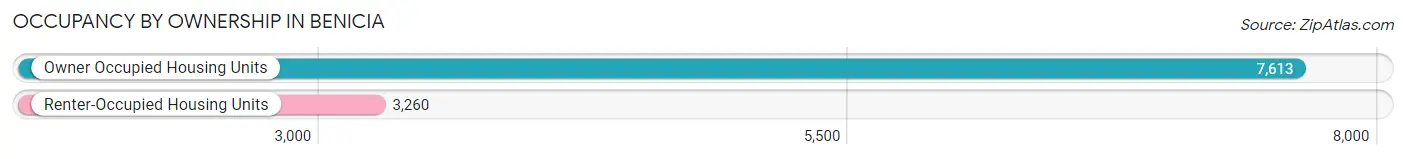
| Occupancy | # Housing Units | % Housing Units |
| Owner Occupied Housing Units | 7,613 | 70.0% |
| Renter-Occupied Housing Units | 3,260 | 30.0% |
| Total Occupied Housing Units | 10,873 | 100.0% |
Occupancy by Household Size in Benicia
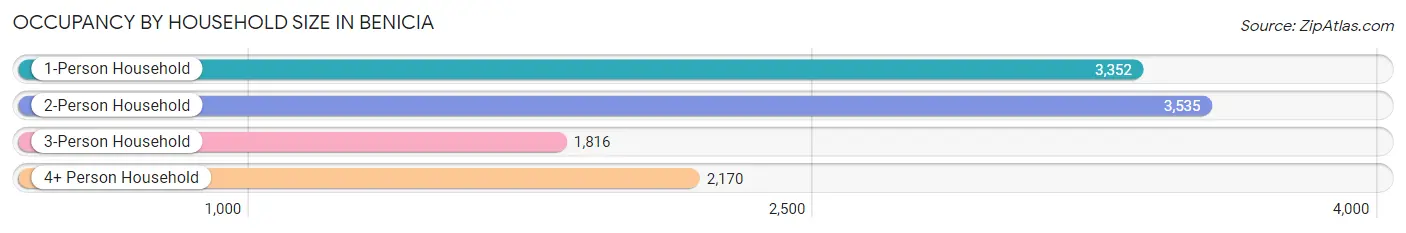
| Household Size | # Housing Units | % Housing Units |
| 1-Person Household | 3,352 | 30.8% |
| 2-Person Household | 3,535 | 32.5% |
| 3-Person Household | 1,816 | 16.7% |
| 4+ Person Household | 2,170 | 20.0% |
| Total Housing Units | 10,873 | 100.0% |
Occupancy by Ownership by Household Size in Benicia
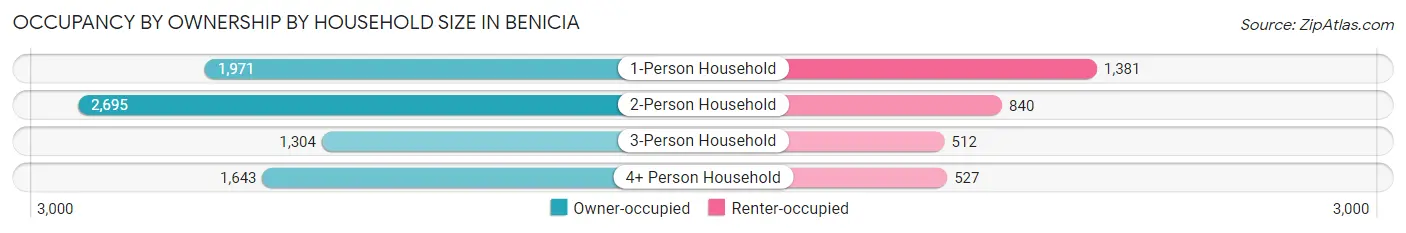
| Household Size | Owner-occupied | Renter-occupied |
| 1-Person Household | 1,971 (58.8%) | 1,381 (41.2%) |
| 2-Person Household | 2,695 (76.2%) | 840 (23.8%) |
| 3-Person Household | 1,304 (71.8%) | 512 (28.2%) |
| 4+ Person Household | 1,643 (75.7%) | 527 (24.3%) |
| Total Housing Units | 7,613 (70.0%) | 3,260 (30.0%) |
Occupancy by Educational Attainment in Benicia
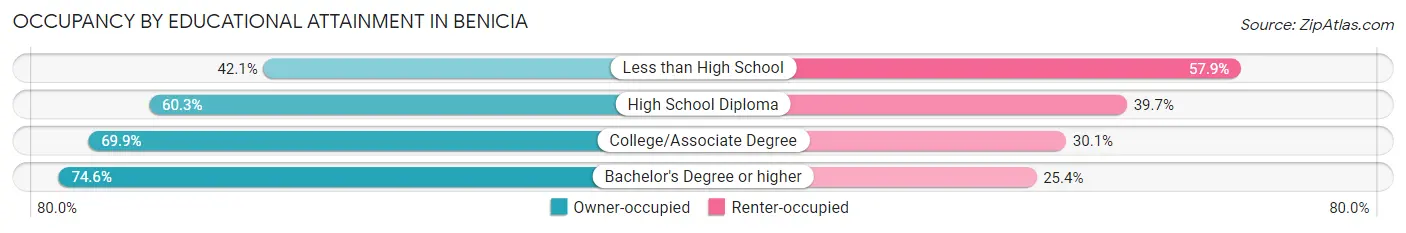
| Household Size | Owner-occupied | Renter-occupied |
| Less than High School | 120 (42.1%) | 165 (57.9%) |
| High School Diploma | 1,019 (60.3%) | 672 (39.7%) |
| College/Associate Degree | 2,442 (69.9%) | 1,051 (30.1%) |
| Bachelor's Degree or higher | 4,032 (74.6%) | 1,372 (25.4%) |
Occupancy by Age of Householder in Benicia
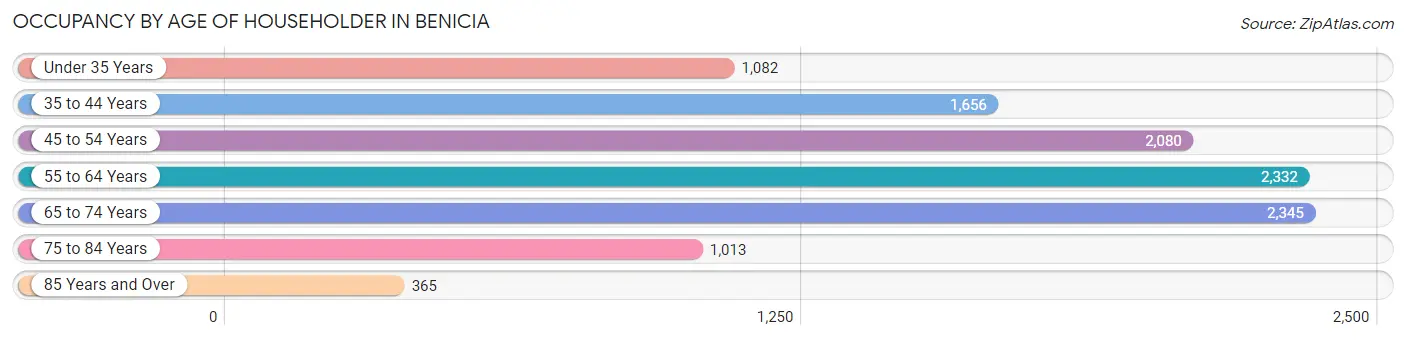
| Age Bracket | # Households | % Households |
| Under 35 Years | 1,082 | 10.0% |
| 35 to 44 Years | 1,656 | 15.2% |
| 45 to 54 Years | 2,080 | 19.1% |
| 55 to 64 Years | 2,332 | 21.4% |
| 65 to 74 Years | 2,345 | 21.6% |
| 75 to 84 Years | 1,013 | 9.3% |
| 85 Years and Over | 365 | 3.4% |
| Total | 10,873 | 100.0% |
Housing Finances in Benicia
Median Income by Occupancy in Benicia
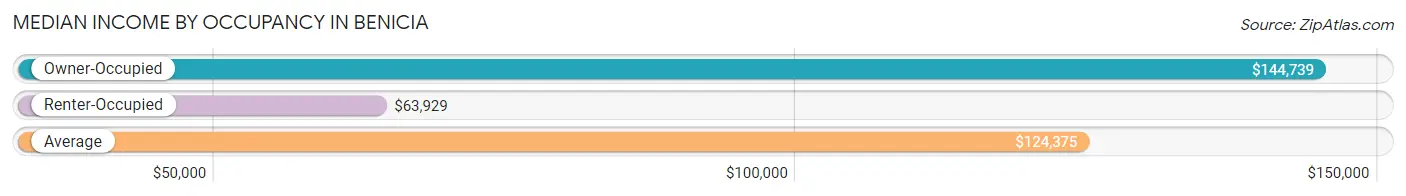
| Occupancy Type | # Households | Median Income |
| Owner-Occupied | 7,613 (70.0%) | $144,739 |
| Renter-Occupied | 3,260 (30.0%) | $63,929 |
| Average | 10,873 (100.0%) | $124,375 |
Occupancy by Householder Income Bracket in Benicia
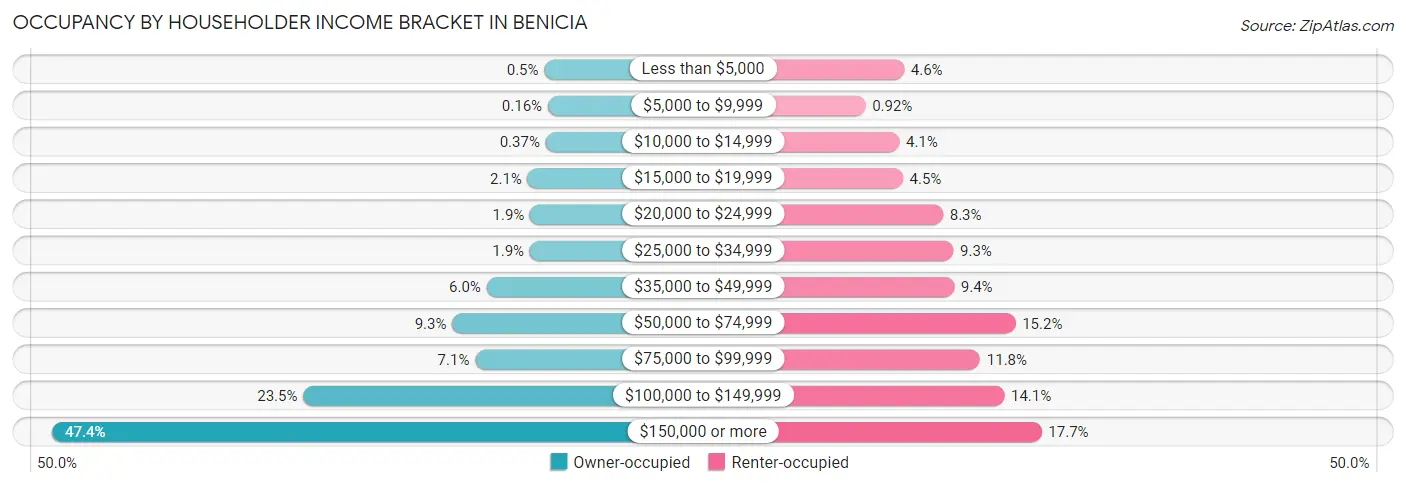
| Income Bracket | Owner-occupied | Renter-occupied |
| Less than $5,000 | 38 (0.5%) | 150 (4.6%) |
| $5,000 to $9,999 | 12 (0.2%) | 30 (0.9%) |
| $10,000 to $14,999 | 28 (0.4%) | 135 (4.1%) |
| $15,000 to $19,999 | 159 (2.1%) | 146 (4.5%) |
| $20,000 to $24,999 | 141 (1.8%) | 271 (8.3%) |
| $25,000 to $34,999 | 142 (1.9%) | 303 (9.3%) |
| $35,000 to $49,999 | 456 (6.0%) | 305 (9.4%) |
| $50,000 to $74,999 | 706 (9.3%) | 496 (15.2%) |
| $75,000 to $99,999 | 539 (7.1%) | 386 (11.8%) |
| $100,000 to $149,999 | 1,786 (23.5%) | 461 (14.1%) |
| $150,000 or more | 3,606 (47.4%) | 577 (17.7%) |
| Total | 7,613 (100.0%) | 3,260 (100.0%) |
Monthly Housing Cost Tiers in Benicia
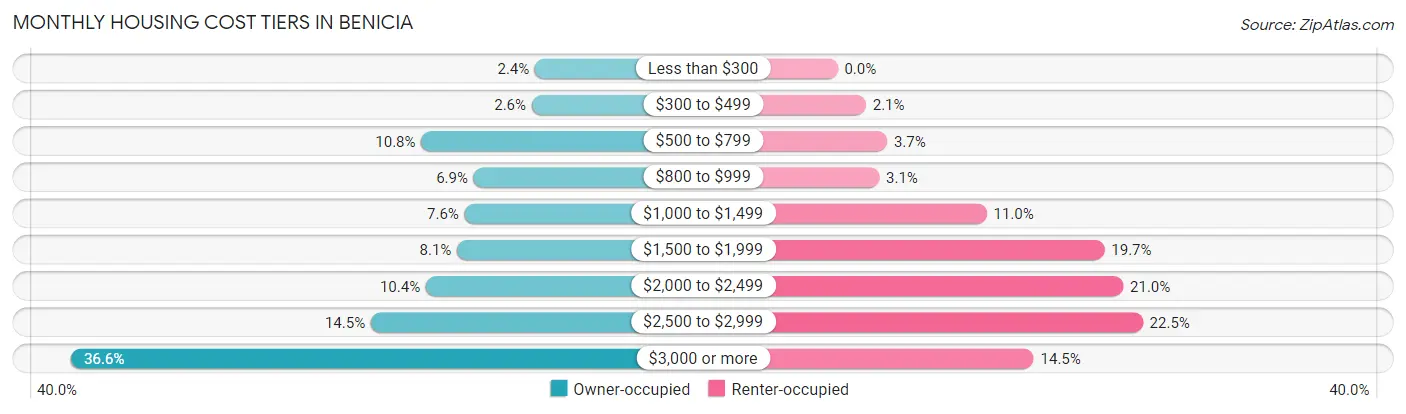
| Monthly Cost | Owner-occupied | Renter-occupied |
| Less than $300 | 183 (2.4%) | 0 (0.0%) |
| $300 to $499 | 201 (2.6%) | 68 (2.1%) |
| $500 to $799 | 821 (10.8%) | 119 (3.6%) |
| $800 to $999 | 527 (6.9%) | 100 (3.1%) |
| $1,000 to $1,499 | 578 (7.6%) | 358 (11.0%) |
| $1,500 to $1,999 | 620 (8.1%) | 641 (19.7%) |
| $2,000 to $2,499 | 795 (10.4%) | 686 (21.0%) |
| $2,500 to $2,999 | 1,103 (14.5%) | 733 (22.5%) |
| $3,000 or more | 2,785 (36.6%) | 471 (14.4%) |
| Total | 7,613 (100.0%) | 3,260 (100.0%) |
Physical Housing Characteristics in Benicia
Housing Structures in Benicia
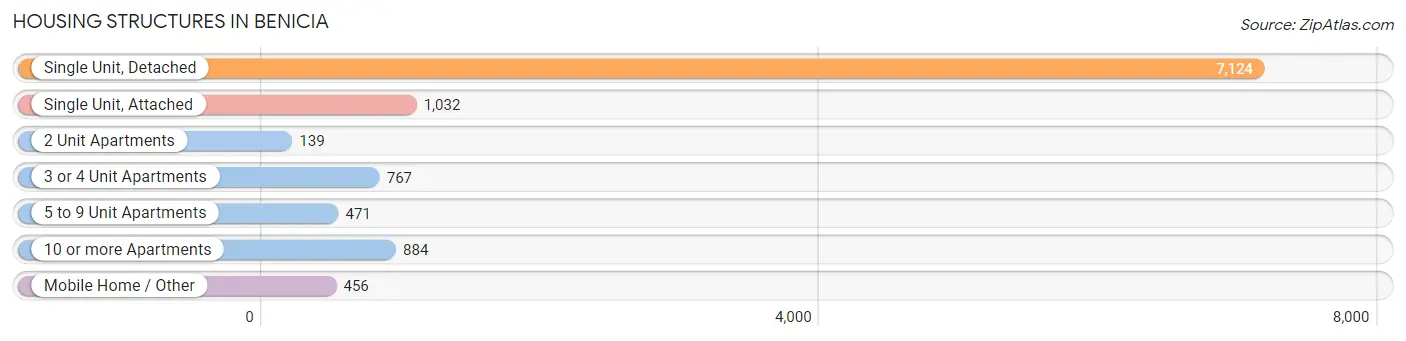
| Structure Type | # Housing Units | % Housing Units |
| Single Unit, Detached | 7,124 | 65.5% |
| Single Unit, Attached | 1,032 | 9.5% |
| 2 Unit Apartments | 139 | 1.3% |
| 3 or 4 Unit Apartments | 767 | 7.0% |
| 5 to 9 Unit Apartments | 471 | 4.3% |
| 10 or more Apartments | 884 | 8.1% |
| Mobile Home / Other | 456 | 4.2% |
| Total | 10,873 | 100.0% |
Housing Structures by Occupancy in Benicia
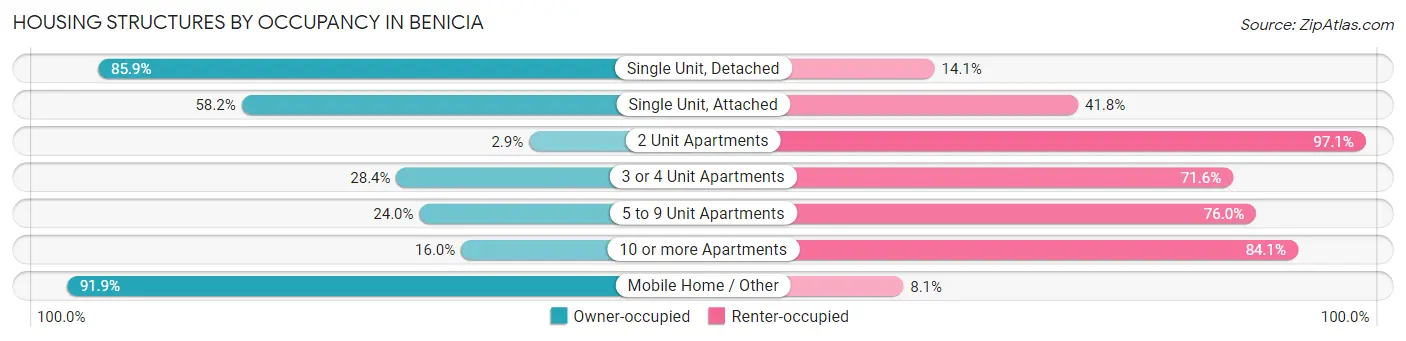
| Structure Type | Owner-occupied | Renter-occupied |
| Single Unit, Detached | 6,117 (85.9%) | 1,007 (14.1%) |
| Single Unit, Attached | 601 (58.2%) | 431 (41.8%) |
| 2 Unit Apartments | 4 (2.9%) | 135 (97.1%) |
| 3 or 4 Unit Apartments | 218 (28.4%) | 549 (71.6%) |
| 5 to 9 Unit Apartments | 113 (24.0%) | 358 (76.0%) |
| 10 or more Apartments | 141 (16.0%) | 743 (84.1%) |
| Mobile Home / Other | 419 (91.9%) | 37 (8.1%) |
| Total | 7,613 (70.0%) | 3,260 (30.0%) |
Housing Structures by Number of Rooms in Benicia
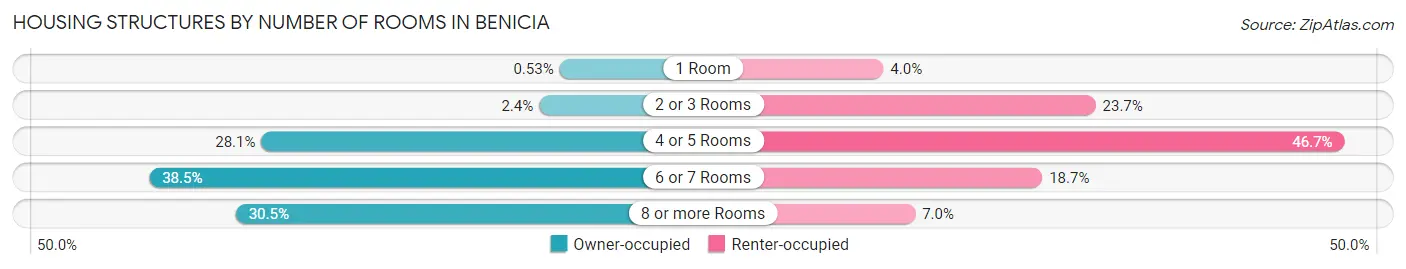
| Number of Rooms | Owner-occupied | Renter-occupied |
| 1 Room | 40 (0.5%) | 131 (4.0%) |
| 2 or 3 Rooms | 184 (2.4%) | 771 (23.6%) |
| 4 or 5 Rooms | 2,140 (28.1%) | 1,521 (46.7%) |
| 6 or 7 Rooms | 2,929 (38.5%) | 610 (18.7%) |
| 8 or more Rooms | 2,320 (30.5%) | 227 (7.0%) |
| Total | 7,613 (100.0%) | 3,260 (100.0%) |
Housing Structure by Heating Type in Benicia
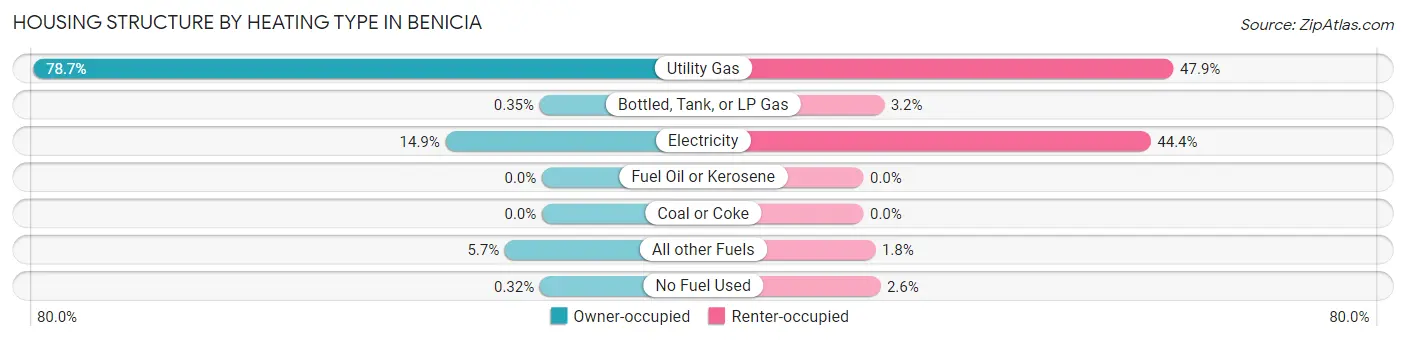
| Heating Type | Owner-occupied | Renter-occupied |
| Utility Gas | 5,990 (78.7%) | 1,563 (47.9%) |
| Bottled, Tank, or LP Gas | 27 (0.4%) | 104 (3.2%) |
| Electricity | 1,136 (14.9%) | 1,448 (44.4%) |
| Fuel Oil or Kerosene | 0 (0.0%) | 0 (0.0%) |
| Coal or Coke | 0 (0.0%) | 0 (0.0%) |
| All other Fuels | 436 (5.7%) | 60 (1.8%) |
| No Fuel Used | 24 (0.3%) | 85 (2.6%) |
| Total | 7,613 (100.0%) | 3,260 (100.0%) |
Household Vehicle Usage in Benicia
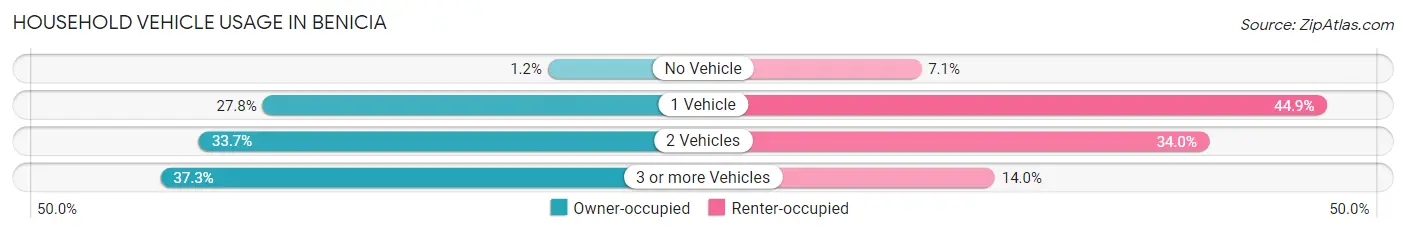
| Vehicles per Household | Owner-occupied | Renter-occupied |
| No Vehicle | 88 (1.2%) | 232 (7.1%) |
| 1 Vehicle | 2,116 (27.8%) | 1,465 (44.9%) |
| 2 Vehicles | 2,568 (33.7%) | 1,107 (34.0%) |
| 3 or more Vehicles | 2,841 (37.3%) | 456 (14.0%) |
| Total | 7,613 (100.0%) | 3,260 (100.0%) |
Real Estate & Mortgages in Benicia
Real Estate and Mortgage Overview in Benicia
| Characteristic | Without Mortgage | With Mortgage |
| Housing Units | 1,835 | 5,778 |
| Median Property Value | $686,800 | $752,100 |
| Median Household Income | $90,972 | $3,088 |
| Monthly Housing Costs | $747 | $2,763 |
| Real Estate Taxes | $3,208 | $139 |
Property Value by Mortgage Status in Benicia
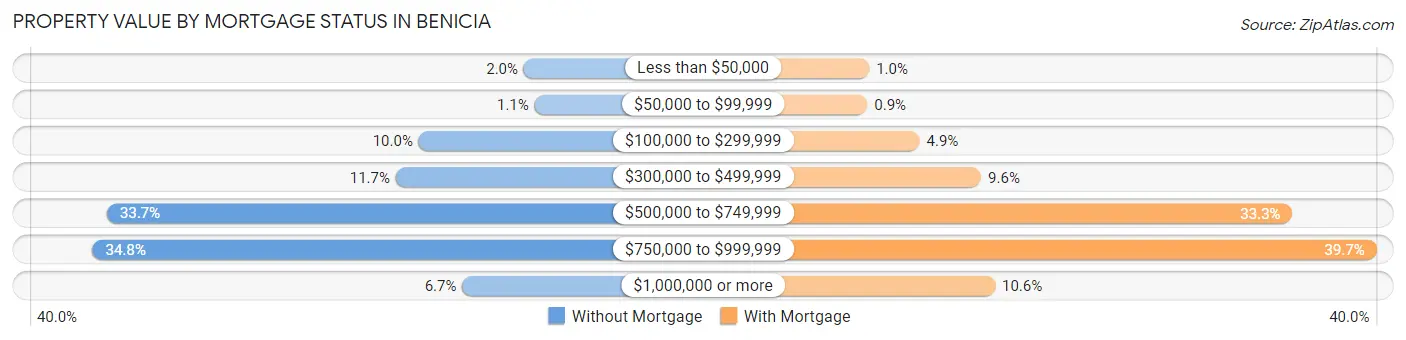
| Property Value | Without Mortgage | With Mortgage |
| Less than $50,000 | 36 (2.0%) | 60 (1.0%) |
| $50,000 to $99,999 | 21 (1.1%) | 52 (0.9%) |
| $100,000 to $299,999 | 183 (10.0%) | 282 (4.9%) |
| $300,000 to $499,999 | 215 (11.7%) | 553 (9.6%) |
| $500,000 to $749,999 | 619 (33.7%) | 1,923 (33.3%) |
| $750,000 to $999,999 | 639 (34.8%) | 2,294 (39.7%) |
| $1,000,000 or more | 122 (6.7%) | 614 (10.6%) |
| Total | 1,835 (100.0%) | 5,778 (100.0%) |
Household Income by Mortgage Status in Benicia
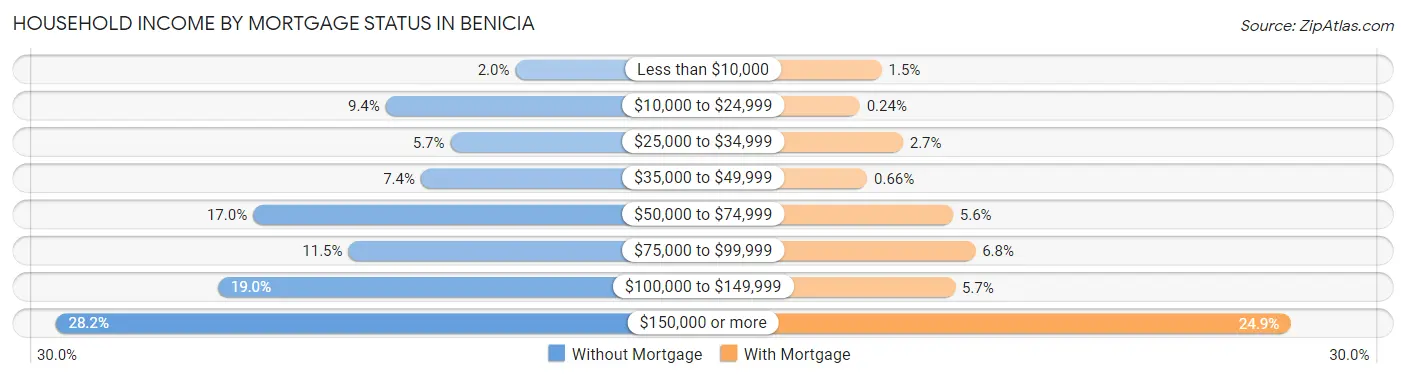
| Household Income | Without Mortgage | With Mortgage |
| Less than $10,000 | 36 (2.0%) | 86 (1.5%) |
| $10,000 to $24,999 | 172 (9.4%) | 14 (0.2%) |
| $25,000 to $34,999 | 104 (5.7%) | 156 (2.7%) |
| $35,000 to $49,999 | 135 (7.4%) | 38 (0.7%) |
| $50,000 to $74,999 | 311 (17.0%) | 321 (5.6%) |
| $75,000 to $99,999 | 211 (11.5%) | 395 (6.8%) |
| $100,000 to $149,999 | 348 (19.0%) | 328 (5.7%) |
| $150,000 or more | 518 (28.2%) | 1,438 (24.9%) |
| Total | 1,835 (100.0%) | 5,778 (100.0%) |
Property Value to Household Income Ratio in Benicia
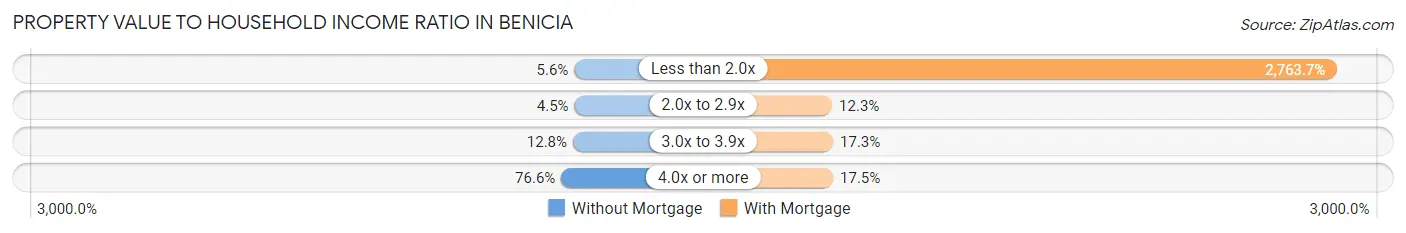
| Value-to-Income Ratio | Without Mortgage | With Mortgage |
| Less than 2.0x | 103 (5.6%) | 159,688 (2,763.7%) |
| 2.0x to 2.9x | 82 (4.5%) | 708 (12.2%) |
| 3.0x to 3.9x | 235 (12.8%) | 1,001 (17.3%) |
| 4.0x or more | 1,406 (76.6%) | 1,011 (17.5%) |
| Total | 1,835 (100.0%) | 5,778 (100.0%) |
Real Estate Taxes by Mortgage Status in Benicia
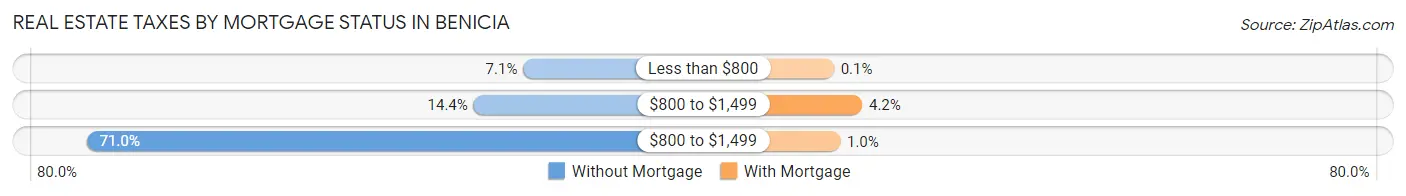
| Property Taxes | Without Mortgage | With Mortgage |
| Less than $800 | 131 (7.1%) | 6 (0.1%) |
| $800 to $1,499 | 264 (14.4%) | 245 (4.2%) |
| $800 to $1,499 | 1,302 (71.0%) | 59 (1.0%) |
| Total | 1,835 (100.0%) | 5,778 (100.0%) |
Health & Disability in Benicia
Health Insurance Coverage by Age in Benicia
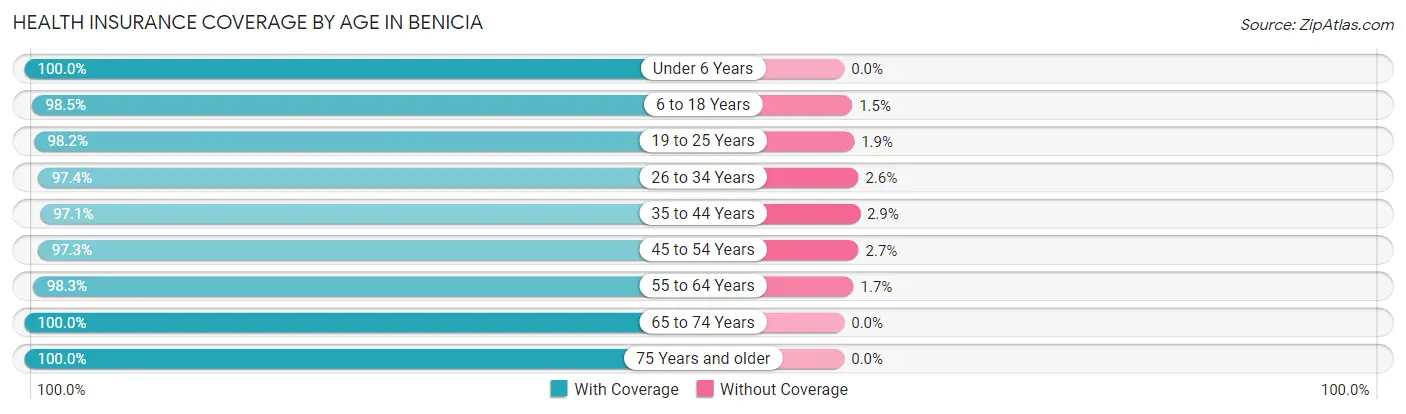
| Age Bracket | With Coverage | Without Coverage |
| Under 6 Years | 1,488 (100.0%) | 0 (0.0%) |
| 6 to 18 Years | 4,325 (98.5%) | 65 (1.5%) |
| 19 to 25 Years | 1,379 (98.2%) | 26 (1.8%) |
| 26 to 34 Years | 2,689 (97.4%) | 73 (2.6%) |
| 35 to 44 Years | 3,263 (97.1%) | 98 (2.9%) |
| 45 to 54 Years | 3,553 (97.3%) | 97 (2.7%) |
| 55 to 64 Years | 4,022 (98.3%) | 71 (1.7%) |
| 65 to 74 Years | 3,828 (100.0%) | 0 (0.0%) |
| 75 Years and older | 2,012 (100.0%) | 0 (0.0%) |
| Total | 26,559 (98.4%) | 430 (1.6%) |
Health Insurance Coverage by Citizenship Status in Benicia
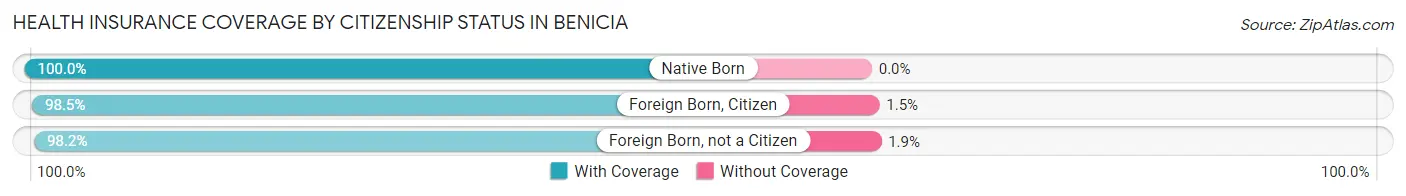
| Citizenship Status | With Coverage | Without Coverage |
| Native Born | 1,488 (100.0%) | 0 (0.0%) |
| Foreign Born, Citizen | 4,325 (98.5%) | 65 (1.5%) |
| Foreign Born, not a Citizen | 1,379 (98.2%) | 26 (1.8%) |
Health Insurance Coverage by Household Income in Benicia
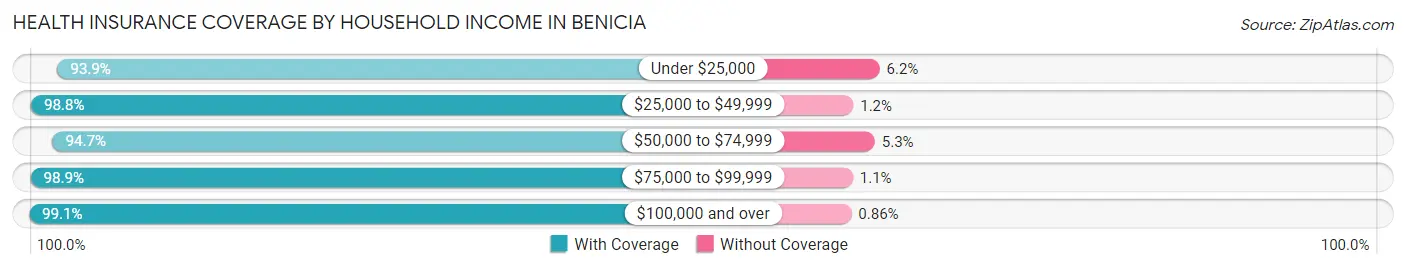
| Household Income | With Coverage | Without Coverage |
| Under $25,000 | 1,663 (93.9%) | 109 (6.1%) |
| $25,000 to $49,999 | 2,178 (98.8%) | 27 (1.2%) |
| $50,000 to $74,999 | 1,962 (94.7%) | 109 (5.3%) |
| $75,000 to $99,999 | 1,906 (98.9%) | 22 (1.1%) |
| $100,000 and over | 18,811 (99.1%) | 163 (0.9%) |
Public vs Private Health Insurance Coverage by Age in Benicia
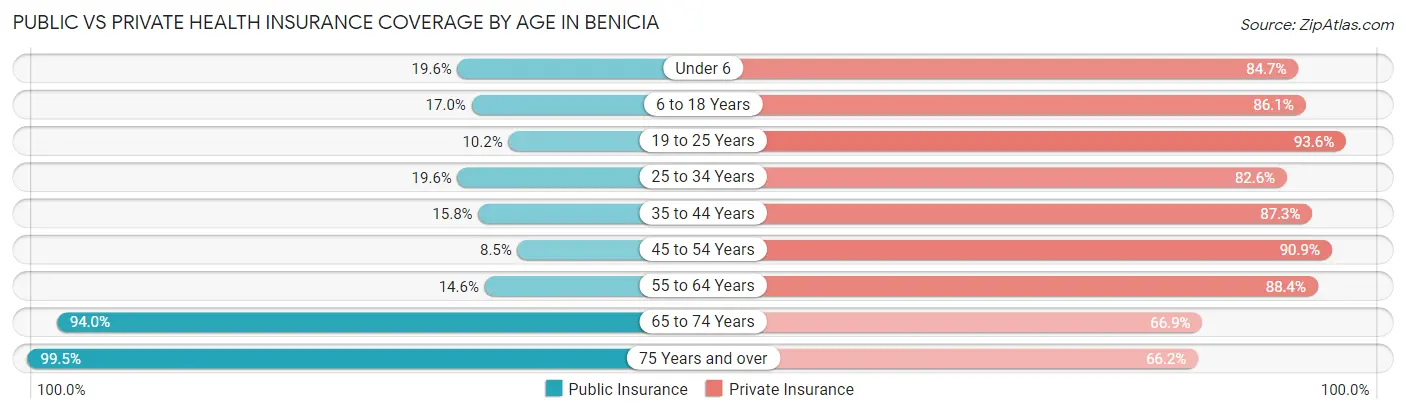
| Age Bracket | Public Insurance | Private Insurance |
| Under 6 | 292 (19.6%) | 1,261 (84.7%) |
| 6 to 18 Years | 747 (17.0%) | 3,778 (86.1%) |
| 19 to 25 Years | 143 (10.2%) | 1,315 (93.6%) |
| 25 to 34 Years | 542 (19.6%) | 2,282 (82.6%) |
| 35 to 44 Years | 530 (15.8%) | 2,935 (87.3%) |
| 45 to 54 Years | 310 (8.5%) | 3,319 (90.9%) |
| 55 to 64 Years | 597 (14.6%) | 3,616 (88.3%) |
| 65 to 74 Years | 3,599 (94.0%) | 2,562 (66.9%) |
| 75 Years and over | 2,001 (99.5%) | 1,331 (66.1%) |
| Total | 8,761 (32.5%) | 22,399 (83.0%) |
Disability Status by Sex by Age in Benicia
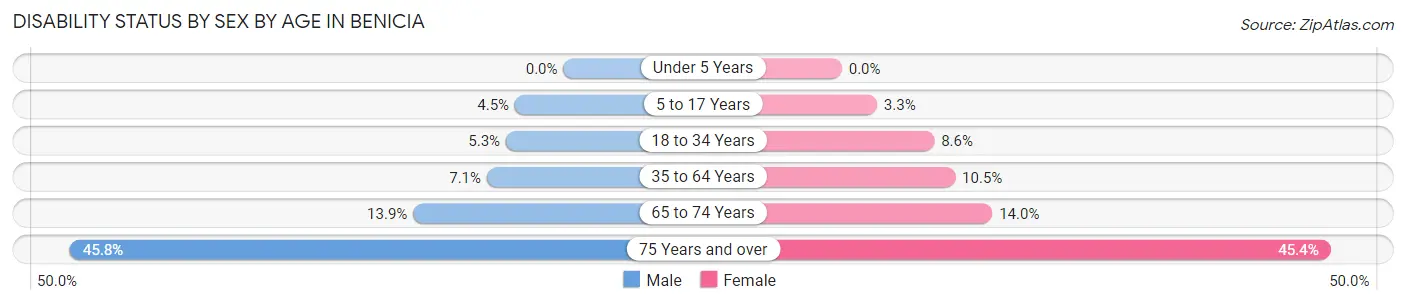
| Age Bracket | Male | Female |
| Under 5 Years | 0 (0.0%) | 0 (0.0%) |
| 5 to 17 Years | 98 (4.5%) | 65 (3.3%) |
| 18 to 34 Years | 122 (5.3%) | 194 (8.6%) |
| 35 to 64 Years | 386 (7.1%) | 596 (10.5%) |
| 65 to 74 Years | 220 (13.9%) | 314 (14.0%) |
| 75 Years and over | 370 (45.8%) | 546 (45.4%) |
Disability Class by Sex by Age in Benicia
Disability Class: Hearing Difficulty
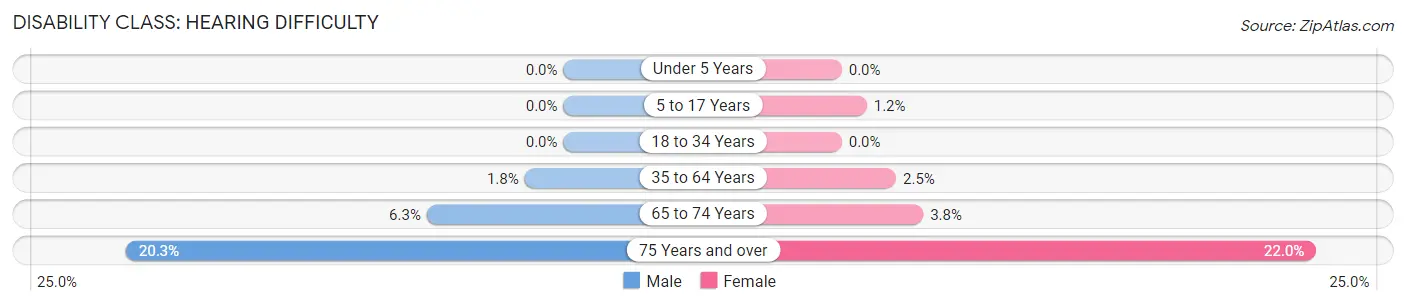
| Age Bracket | Male | Female |
| Under 5 Years | 0 (0.0%) | 0 (0.0%) |
| 5 to 17 Years | 0 (0.0%) | 23 (1.2%) |
| 18 to 34 Years | 0 (0.0%) | 0 (0.0%) |
| 35 to 64 Years | 98 (1.8%) | 143 (2.5%) |
| 65 to 74 Years | 100 (6.3%) | 85 (3.8%) |
| 75 Years and over | 164 (20.3%) | 265 (22.0%) |
Disability Class: Vision Difficulty
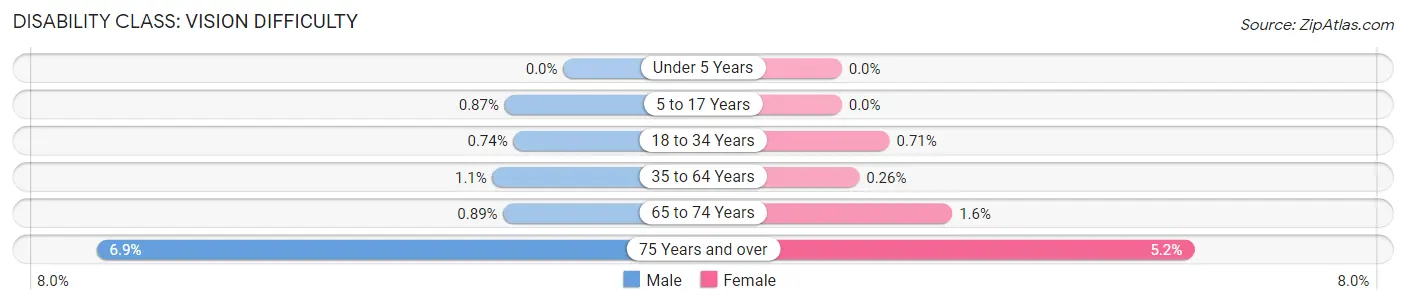
| Age Bracket | Male | Female |
| Under 5 Years | 0 (0.0%) | 0 (0.0%) |
| 5 to 17 Years | 19 (0.9%) | 0 (0.0%) |
| 18 to 34 Years | 17 (0.7%) | 16 (0.7%) |
| 35 to 64 Years | 57 (1.1%) | 15 (0.3%) |
| 65 to 74 Years | 14 (0.9%) | 37 (1.6%) |
| 75 Years and over | 56 (6.9%) | 63 (5.2%) |
Disability Class: Cognitive Difficulty
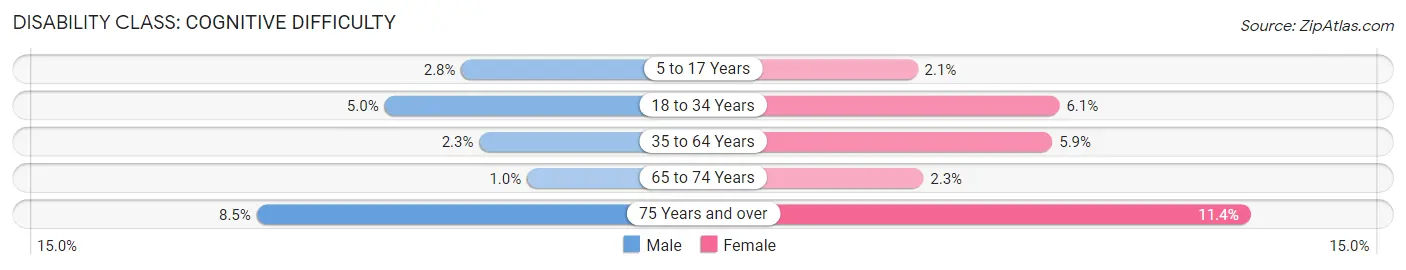
| Age Bracket | Male | Female |
| 5 to 17 Years | 62 (2.8%) | 42 (2.1%) |
| 18 to 34 Years | 114 (5.0%) | 137 (6.1%) |
| 35 to 64 Years | 127 (2.3%) | 332 (5.9%) |
| 65 to 74 Years | 16 (1.0%) | 51 (2.3%) |
| 75 Years and over | 69 (8.5%) | 137 (11.4%) |
Disability Class: Ambulatory Difficulty
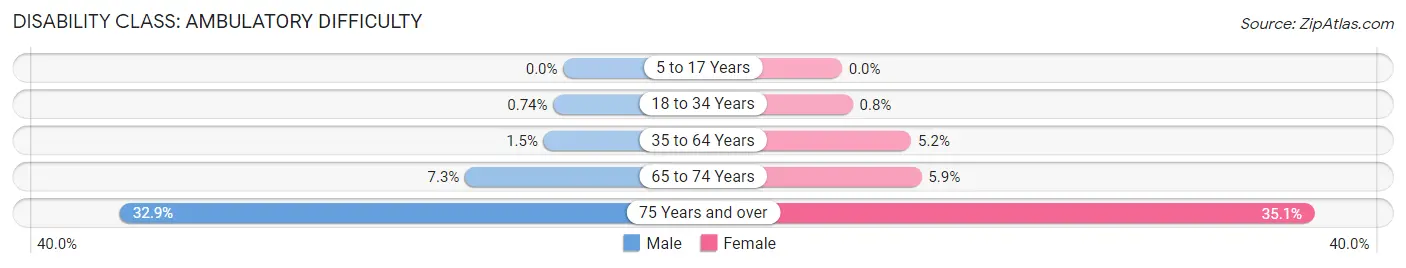
| Age Bracket | Male | Female |
| 5 to 17 Years | 0 (0.0%) | 0 (0.0%) |
| 18 to 34 Years | 17 (0.7%) | 18 (0.8%) |
| 35 to 64 Years | 79 (1.5%) | 292 (5.1%) |
| 65 to 74 Years | 115 (7.3%) | 133 (5.9%) |
| 75 Years and over | 266 (32.9%) | 422 (35.0%) |
Disability Class: Self-Care Difficulty
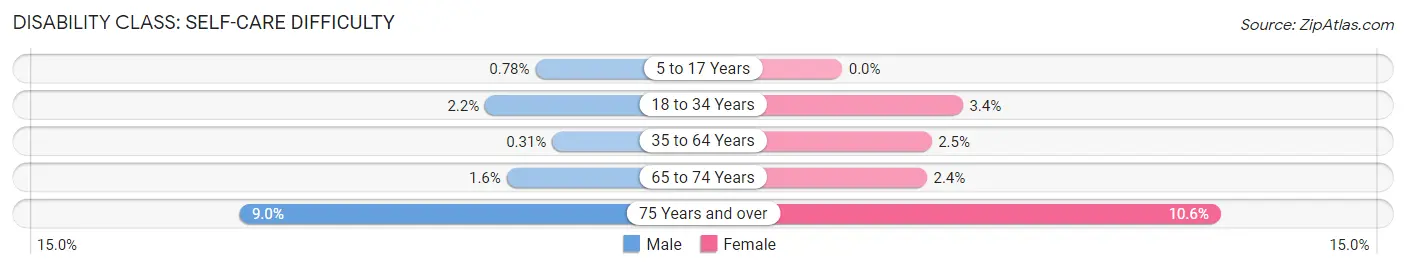
| Age Bracket | Male | Female |
| 5 to 17 Years | 17 (0.8%) | 0 (0.0%) |
| 18 to 34 Years | 50 (2.2%) | 76 (3.4%) |
| 35 to 64 Years | 17 (0.3%) | 141 (2.5%) |
| 65 to 74 Years | 25 (1.6%) | 53 (2.4%) |
| 75 Years and over | 73 (9.0%) | 127 (10.5%) |
Technology Access in Benicia
Computing Device Access in Benicia
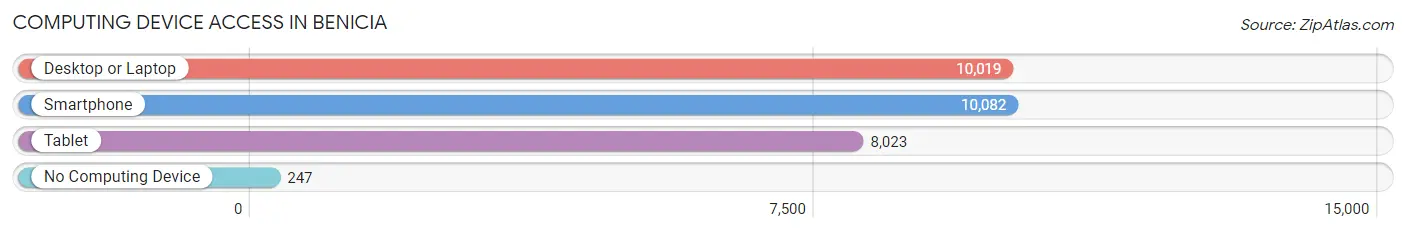
| Device Type | # Households | % Households |
| Desktop or Laptop | 10,019 | 92.1% |
| Smartphone | 10,082 | 92.7% |
| Tablet | 8,023 | 73.8% |
| No Computing Device | 247 | 2.3% |
| Total | 10,873 | 100.0% |
Internet Access in Benicia
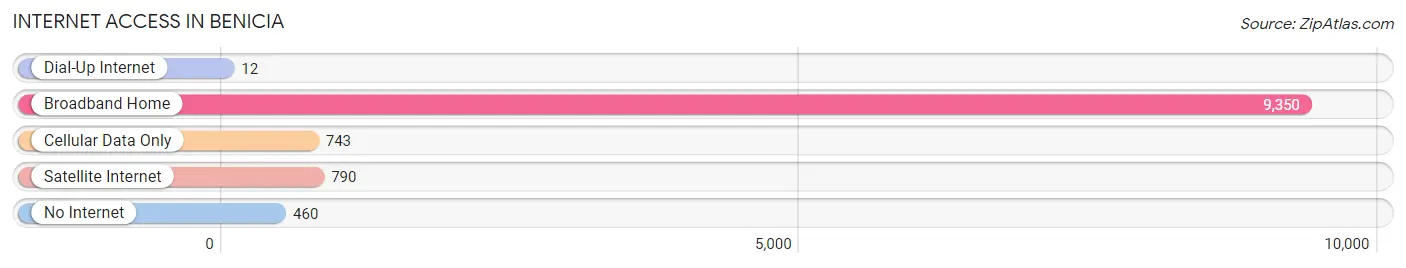
| Internet Type | # Households | % Households |
| Dial-Up Internet | 12 | 0.1% |
| Broadband Home | 9,350 | 86.0% |
| Cellular Data Only | 743 | 6.8% |
| Satellite Internet | 790 | 7.3% |
| No Internet | 460 | 4.2% |
| Total | 10,873 | 100.0% |
Benicia Summary
Benicia, California is a city located in the San Francisco Bay Area in Solano County. It is situated on the north side of the Carquinez Strait, which is the northernmost part of the San Francisco Bay. Benicia is the third-largest city in Solano County, with a population of 26,997 as of the 2010 census.
History
Benicia was founded in 1847 by General Mariano Vallejo, who was the Mexican Commandant of the Northern Frontier. Vallejo named the city after his wife, Francisca Benicia Carrillo de Vallejo. The city was incorporated in 1851 and was the third city to be incorporated in California.
Benicia was an important port city during the California Gold Rush, as it was the closest port to the gold fields. It was also the site of the first state capital of California, from 1853 to 1854. During the Civil War, Benicia was a major shipbuilding center, and the Union Army established a major arsenal in the city.
Geography
Benicia is located in the San Francisco Bay Area in Solano County, California. It is situated on the north side of the Carquinez Strait, which is the northernmost part of the San Francisco Bay. The city is bordered by the cities of Vallejo to the east, Martinez to the south, and Crockett to the west.
The city has a total area of 5.2 square miles, of which 4.9 square miles is land and 0.3 square miles is water. The city is located at an elevation of 30 feet above sea level.
Economy
Benicia is a major industrial center in the San Francisco Bay Area. The city is home to several large industrial companies, including Valero Energy Corporation, the world’s largest independent petroleum refiner, and the Benicia Arsenal, a major military installation.
The city is also home to several small businesses, including restaurants, retail stores, and professional services. The city’s economy is also supported by tourism, as Benicia is a popular destination for visitors to the San Francisco Bay Area.
Demographics
As of the 2010 census, Benicia had a population of 26,997. The racial makeup of the city was 68.2% White, 11.3% African American, 0.7% Native American, 8.2% Asian, 0.2% Pacific Islander, 6.3% from other races, and 5.3% from two or more races. Hispanic or Latino of any race were 16.7% of the population.
The median income for a household in Benicia was $68,845, and the median income for a family was $77,845. The per capita income for the city was $31,945. About 8.2% of families and 10.3% of the population were below the poverty line, including 14.2% of those under age 18 and 6.2% of those age 65 or over.
Common Questions
What is Per Capita Income in Benicia?
Per Capita income in Benicia is $61,021.
What is the Median Family Income in Benicia?
Median Family Income in Benicia is $153,172.
What is the Median Household income in Benicia?
Median Household Income in Benicia is $124,375.
What is Income or Wage Gap in Benicia?
Income or Wage Gap in Benicia is 26.5%.
Women in Benicia earn 73.5 cents for every dollar earned by a man.
What is Family Income Deficit in Benicia?
Family Income Deficit in Benicia is $9,895.
Families that are below poverty line in Benicia earn $9,895 less on average than the poverty threshold level.
What is Inequality or Gini Index in Benicia?
Inequality or Gini Index in Benicia is 0.42.
What is the Total Population of Benicia?
Total Population of Benicia is 27,040.
What is the Total Male Population of Benicia?
Total Male Population of Benicia is 13,110.
What is the Total Female Population of Benicia?
Total Female Population of Benicia is 13,930.
What is the Ratio of Males per 100 Females in Benicia?
There are 94.11 Males per 100 Females in Benicia.
What is the Ratio of Females per 100 Males in Benicia?
There are 106.25 Females per 100 Males in Benicia.
What is the Median Population Age in Benicia?
Median Population Age in Benicia is 45.3 Years.
What is the Average Family Size in Benicia
Average Family Size in Benicia is 3.2 People.
What is the Average Household Size in Benicia
Average Household Size in Benicia is 2.5 People.
How Large is the Labor Force in Benicia?
There are 14,229 People in the Labor Forcein in Benicia.
What is the Percentage of People in the Labor Force in Benicia?
63.9% of People are in the Labor Force in Benicia.
What is the Unemployment Rate in Benicia?
Unemployment Rate in Benicia is 4.1%.