Arcadia, CA Map & Demographics
Arcadia Map
Arcadia Overview
$53,959
PER CAPITA INCOME
$118,817
AVG FAMILY INCOME
$108,214
AVG HOUSEHOLD INCOME
28.8%
WAGE / INCOME GAP [ % ]
71.2¢/ $1
WAGE / INCOME GAP [ $ ]
$12,992
FAMILY INCOME DEFICIT
0.49
INEQUALITY / GINI INDEX
56,181
TOTAL POPULATION
27,247
MALE POPULATION
28,934
FEMALE POPULATION
94.17
MALES / 100 FEMALES
106.19
FEMALES / 100 MALES
44.1
MEDIAN AGE
3.2
AVG FAMILY SIZE
2.9
AVG HOUSEHOLD SIZE
26,996
LABOR FORCE [ PEOPLE ]
59.0%
PERCENT IN LABOR FORCE
5.4%
UNEMPLOYMENT RATE
Arcadia Area Codes
Income in Arcadia
Income Overview in Arcadia
Per Capita Income in Arcadia is $53,959, while median incomes of families and households are $118,817 and $108,214 respectively.
| Characteristic | Number | Measure |
| Per Capita Income | 56,181 | $53,959 |
| Median Family Income | 15,179 | $118,817 |
| Mean Family Income | 15,179 | $168,832 |
| Median Household Income | 19,412 | $108,214 |
| Mean Household Income | 19,412 | $151,787 |
| Income Deficit | 15,179 | $12,992 |
| Wage / Income Gap (%) | 56,181 | 28.81% |
| Wage / Income Gap ($) | 56,181 | 71.19¢ per $1 |
| Gini / Inequality Index | 56,181 | 0.49 |
Earnings by Sex in Arcadia
Average Earnings in Arcadia are $56,143, $65,699 for men and $46,769 for women, a difference of 28.8%.
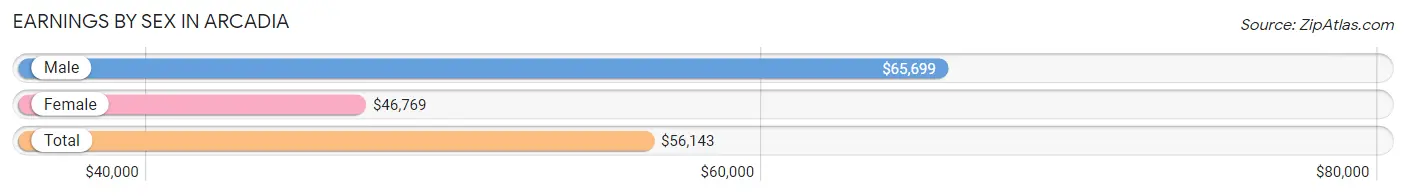
| Sex | Number | Average Earnings |
| Male | 14,744 (52.6%) | $65,699 |
| Female | 13,285 (47.4%) | $46,769 |
| Total | 28,029 (100.0%) | $56,143 |
Earnings by Sex by Income Bracket in Arcadia
The most common earnings brackets in Arcadia are $100,000+ for men (4,482 | 30.4%) and $100,000+ for women (2,789 | 21.0%).
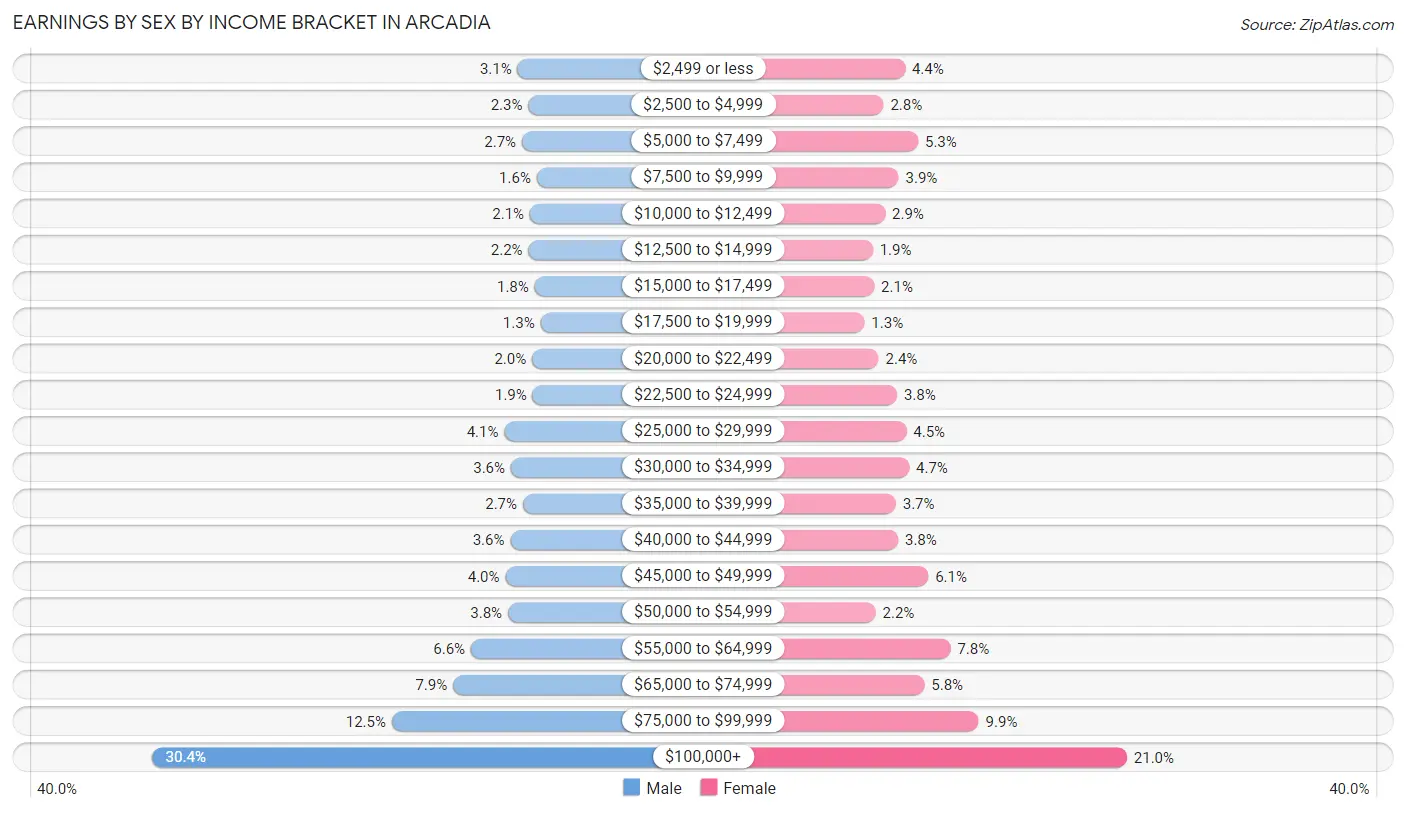
| Income | Male | Female |
| $2,499 or less | 451 (3.1%) | 579 (4.4%) |
| $2,500 to $4,999 | 332 (2.2%) | 366 (2.8%) |
| $5,000 to $7,499 | 402 (2.7%) | 710 (5.3%) |
| $7,500 to $9,999 | 239 (1.6%) | 516 (3.9%) |
| $10,000 to $12,499 | 314 (2.1%) | 381 (2.9%) |
| $12,500 to $14,999 | 331 (2.2%) | 258 (1.9%) |
| $15,000 to $17,499 | 263 (1.8%) | 273 (2.1%) |
| $17,500 to $19,999 | 198 (1.3%) | 175 (1.3%) |
| $20,000 to $22,499 | 291 (2.0%) | 316 (2.4%) |
| $22,500 to $24,999 | 285 (1.9%) | 500 (3.8%) |
| $25,000 to $29,999 | 597 (4.1%) | 592 (4.5%) |
| $30,000 to $34,999 | 525 (3.6%) | 620 (4.7%) |
| $35,000 to $39,999 | 392 (2.7%) | 487 (3.7%) |
| $40,000 to $44,999 | 531 (3.6%) | 510 (3.8%) |
| $45,000 to $49,999 | 585 (4.0%) | 810 (6.1%) |
| $50,000 to $54,999 | 558 (3.8%) | 287 (2.2%) |
| $55,000 to $64,999 | 965 (6.6%) | 1,032 (7.8%) |
| $65,000 to $74,999 | 1,163 (7.9%) | 772 (5.8%) |
| $75,000 to $99,999 | 1,840 (12.5%) | 1,312 (9.9%) |
| $100,000+ | 4,482 (30.4%) | 2,789 (21.0%) |
| Total | 14,744 (100.0%) | 13,285 (100.0%) |
Earnings by Sex by Educational Attainment in Arcadia
Average earnings in Arcadia are $68,628 for men and $51,153 for women, a difference of 25.5%. Men with an educational attainment of graduate degree enjoy the highest average annual earnings of $112,500, while those with less than high school education earn the least with $30,795. Women with an educational attainment of graduate degree earn the most with the average annual earnings of $92,122, while those with less than high school education have the smallest earnings of $21,203.
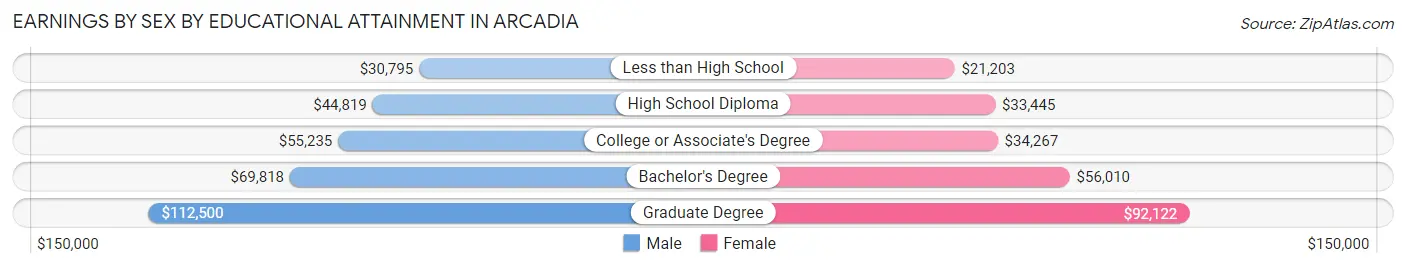
| Educational Attainment | Male Income | Female Income |
| Less than High School | $30,795 | $21,203 |
| High School Diploma | $44,819 | $33,445 |
| College or Associate's Degree | $55,235 | $34,267 |
| Bachelor's Degree | $69,818 | $56,010 |
| Graduate Degree | $112,500 | $92,122 |
| Total | $68,628 | $51,153 |
Family Income in Arcadia
Family Income Brackets in Arcadia
According to the Arcadia family income data, there are 4,114 families falling into the $200,000+ income range, which is the most common income bracket and makes up 27.1% of all families. Conversely, the $10,000 to $14,999 income bracket is the least frequent group with only 121 families (0.8%) belonging to this category.
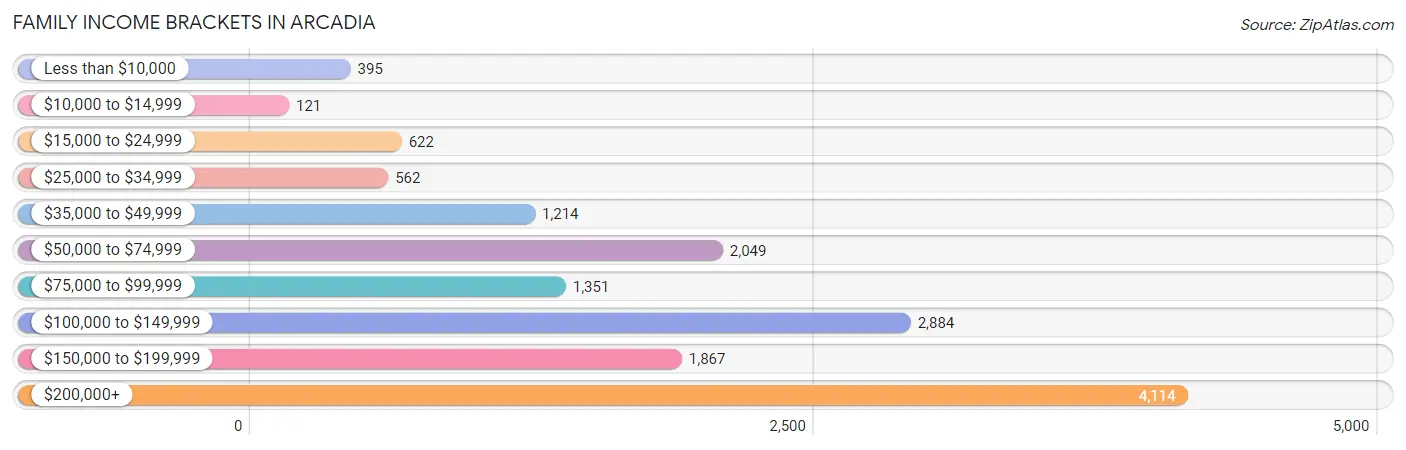
| Income Bracket | # Families | % Families |
| Less than $10,000 | 395 | 2.6% |
| $10,000 to $14,999 | 121 | 0.8% |
| $15,000 to $24,999 | 622 | 4.1% |
| $25,000 to $34,999 | 562 | 3.7% |
| $35,000 to $49,999 | 1,214 | 8.0% |
| $50,000 to $74,999 | 2,049 | 13.5% |
| $75,000 to $99,999 | 1,351 | 8.9% |
| $100,000 to $149,999 | 2,884 | 19.0% |
| $150,000 to $199,999 | 1,867 | 12.3% |
| $200,000+ | 4,114 | 27.1% |
Family Income by Famaliy Size in Arcadia
4-person families (3,376 | 22.2%) account for the highest median family income in Arcadia with $153,314 per family, while 2-person families (6,219 | 41.0%) have the highest median income of $50,505 per family member.
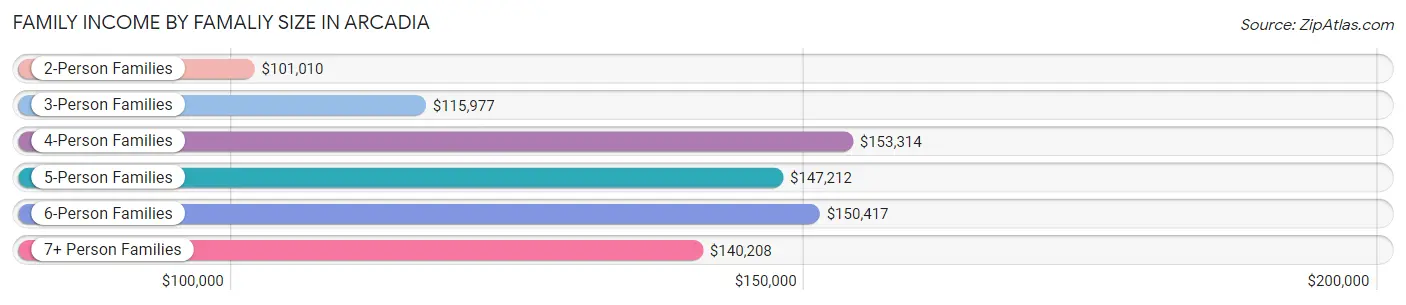
| Income Bracket | # Families | Median Income |
| 2-Person Families | 6,219 (41.0%) | $101,010 |
| 3-Person Families | 4,159 (27.4%) | $115,977 |
| 4-Person Families | 3,376 (22.2%) | $153,314 |
| 5-Person Families | 885 (5.8%) | $147,212 |
| 6-Person Families | 248 (1.6%) | $150,417 |
| 7+ Person Families | 292 (1.9%) | $140,208 |
| Total | 15,179 (100.0%) | $118,817 |
Family Income by Number of Earners in Arcadia
The median family income in Arcadia is $118,817, with families comprising 2 earners (6,349) having the highest median family income of $157,075, while families with no earners (2,085) have the lowest median family income of $57,316, accounting for 41.8% and 13.7% of families, respectively.
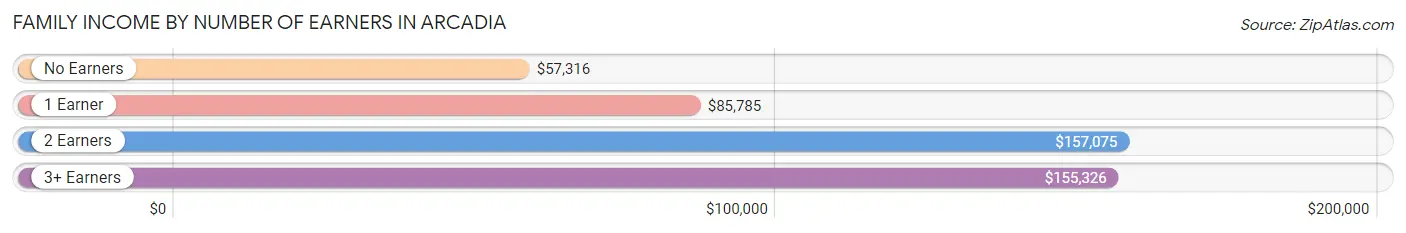
| Number of Earners | # Families | Median Income |
| No Earners | 2,085 (13.7%) | $57,316 |
| 1 Earner | 5,055 (33.3%) | $85,785 |
| 2 Earners | 6,349 (41.8%) | $157,075 |
| 3+ Earners | 1,690 (11.1%) | $155,326 |
| Total | 15,179 (100.0%) | $118,817 |
Household Income in Arcadia
Household Income Brackets in Arcadia
With 4,407 households falling in the category, the $200,000+ income range is the most frequent in Arcadia, accounting for 22.7% of all households. In contrast, only 427 households (2.2%) fall into the $10,000 to $14,999 income bracket, making it the least populous group.
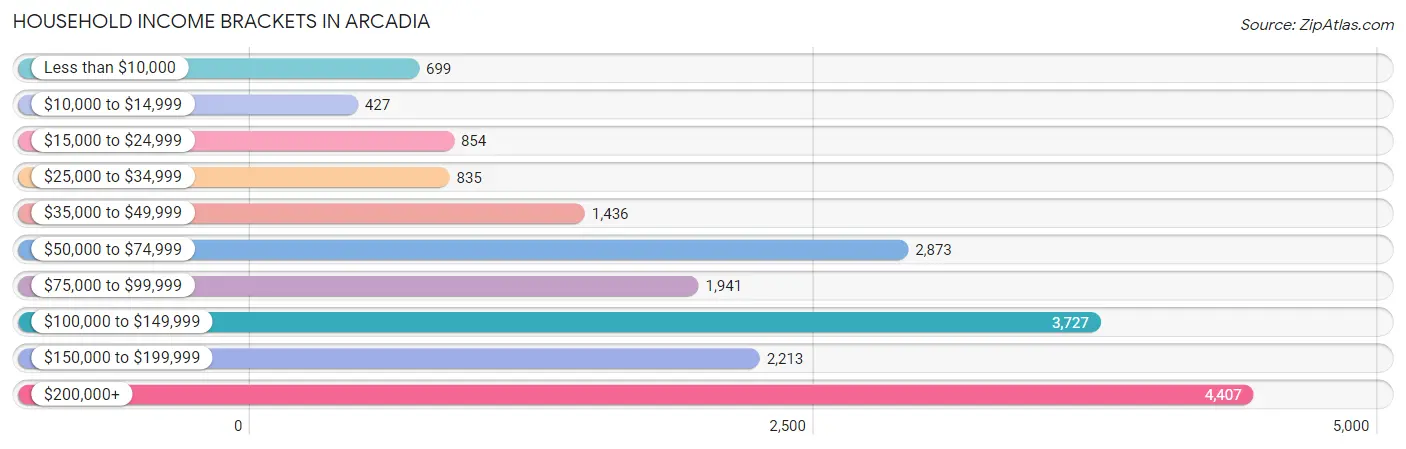
| Income Bracket | # Households | % Households |
| Less than $10,000 | 699 | 3.6% |
| $10,000 to $14,999 | 427 | 2.2% |
| $15,000 to $24,999 | 854 | 4.4% |
| $25,000 to $34,999 | 835 | 4.3% |
| $35,000 to $49,999 | 1,436 | 7.4% |
| $50,000 to $74,999 | 2,873 | 14.8% |
| $75,000 to $99,999 | 1,941 | 10.0% |
| $100,000 to $149,999 | 3,727 | 19.2% |
| $150,000 to $199,999 | 2,213 | 11.4% |
| $200,000+ | 4,407 | 22.7% |
Household Income by Householder Age in Arcadia
The median household income in Arcadia is $108,214, with the highest median household income of $130,027 found in the 45 to 64 years age bracket for the primary householder. A total of 8,587 households (44.2%) fall into this category. Meanwhile, the 15 to 24 years age bracket for the primary householder has the lowest median household income of $0, with 137 households (0.7%) in this group.
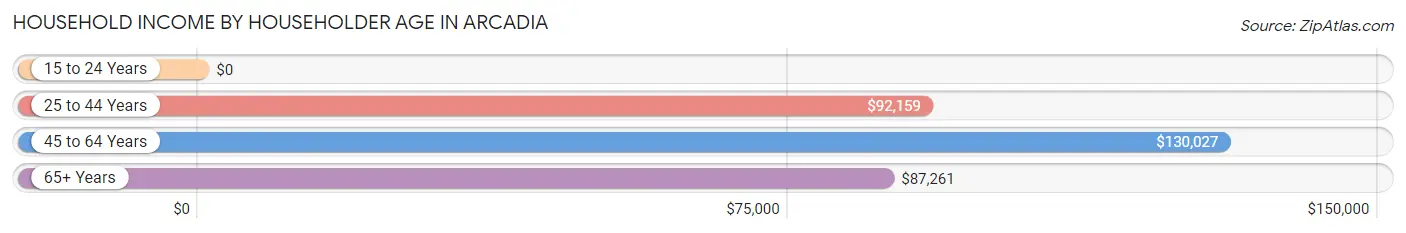
| Income Bracket | # Households | Median Income |
| 15 to 24 Years | 137 (0.7%) | $0 |
| 25 to 44 Years | 5,197 (26.8%) | $92,159 |
| 45 to 64 Years | 8,587 (44.2%) | $130,027 |
| 65+ Years | 5,491 (28.3%) | $87,261 |
| Total | 19,412 (100.0%) | $108,214 |
Poverty in Arcadia
Income Below Poverty by Sex and Age in Arcadia
With 9.0% poverty level for males and 8.9% for females among the residents of Arcadia, 16 and 17 year old males and 6 to 11 year old females are the most vulnerable to poverty, with 150 males (21.1%) and 330 females (15.3%) in their respective age groups living below the poverty level.
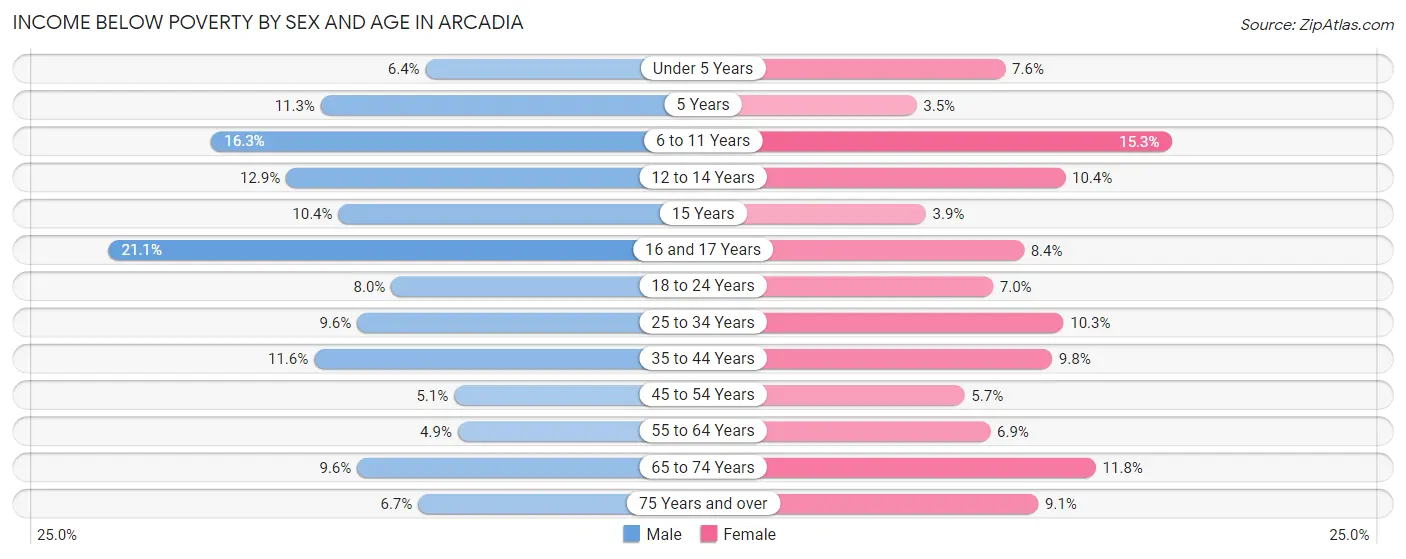
| Age Bracket | Male | Female |
| Under 5 Years | 65 (6.4%) | 99 (7.6%) |
| 5 Years | 26 (11.3%) | 10 (3.5%) |
| 6 to 11 Years | 343 (16.3%) | 330 (15.3%) |
| 12 to 14 Years | 155 (12.9%) | 153 (10.4%) |
| 15 Years | 26 (10.4%) | 13 (3.9%) |
| 16 and 17 Years | 150 (21.1%) | 55 (8.4%) |
| 18 to 24 Years | 167 (8.0%) | 133 (7.0%) |
| 25 to 34 Years | 339 (9.6%) | 257 (10.3%) |
| 35 to 44 Years | 342 (11.6%) | 382 (9.8%) |
| 45 to 54 Years | 218 (5.1%) | 246 (5.7%) |
| 55 to 64 Years | 173 (4.9%) | 293 (6.9%) |
| 65 to 74 Years | 274 (9.6%) | 331 (11.8%) |
| 75 Years and over | 156 (6.7%) | 244 (9.1%) |
| Total | 2,434 (9.0%) | 2,546 (8.9%) |
Income Above Poverty by Sex and Age in Arcadia
According to the poverty statistics in Arcadia, males aged 55 to 64 years and females aged 5 years are the age groups that are most secure financially, with 95.1% of males and 96.5% of females in these age groups living above the poverty line.
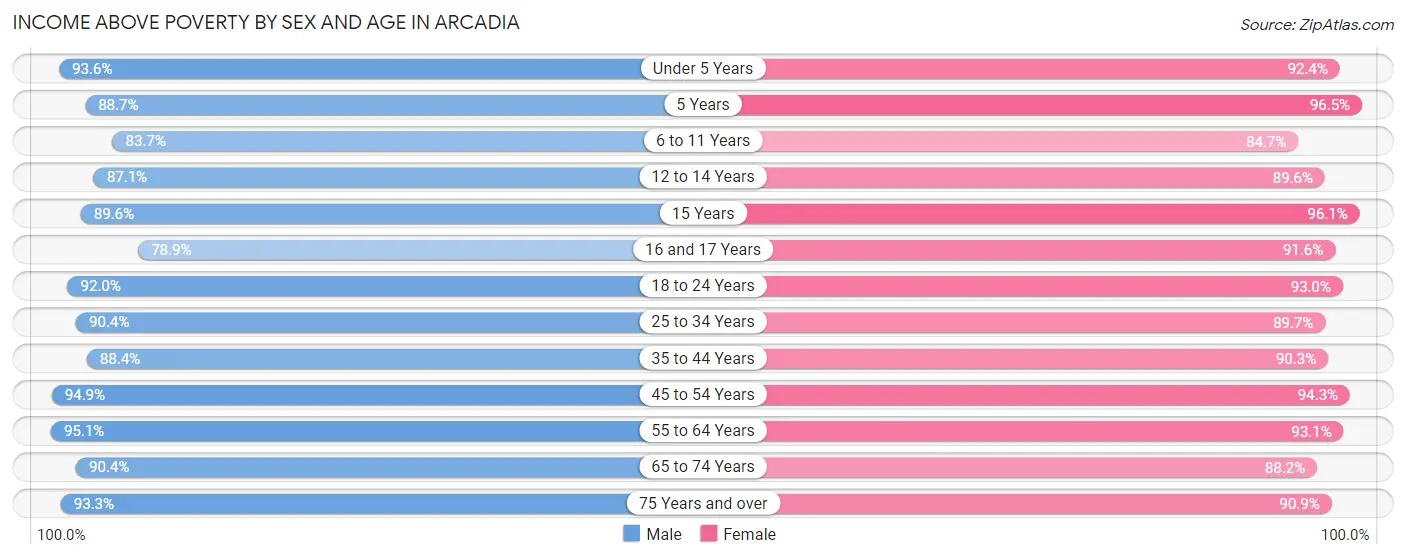
| Age Bracket | Male | Female |
| Under 5 Years | 950 (93.6%) | 1,207 (92.4%) |
| 5 Years | 205 (88.7%) | 279 (96.5%) |
| 6 to 11 Years | 1,758 (83.7%) | 1,828 (84.7%) |
| 12 to 14 Years | 1,049 (87.1%) | 1,324 (89.6%) |
| 15 Years | 223 (89.6%) | 321 (96.1%) |
| 16 and 17 Years | 561 (78.9%) | 597 (91.6%) |
| 18 to 24 Years | 1,924 (92.0%) | 1,764 (93.0%) |
| 25 to 34 Years | 3,202 (90.4%) | 2,242 (89.7%) |
| 35 to 44 Years | 2,614 (88.4%) | 3,536 (90.2%) |
| 45 to 54 Years | 4,082 (94.9%) | 4,077 (94.3%) |
| 55 to 64 Years | 3,361 (95.1%) | 3,963 (93.1%) |
| 65 to 74 Years | 2,588 (90.4%) | 2,479 (88.2%) |
| 75 Years and over | 2,160 (93.3%) | 2,435 (90.9%) |
| Total | 24,677 (91.0%) | 26,052 (91.1%) |
Income Below Poverty Among Married-Couple Families in Arcadia
The poverty statistics for married-couple families in Arcadia show that 4.1% or 446 of the total 10,923 families live below the poverty line. Families with 3 or 4 children have the highest poverty rate of 30.0%, comprising of 157 families. On the other hand, families with 5 or more children have the lowest poverty rate of 0.0%, which includes 0 families.
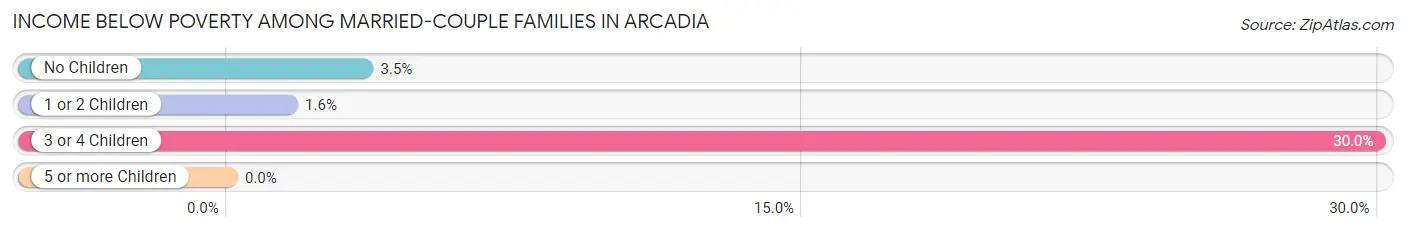
| Children | Above Poverty | Below Poverty |
| No Children | 6,185 (96.5%) | 227 (3.5%) |
| 1 or 2 Children | 3,899 (98.4%) | 62 (1.6%) |
| 3 or 4 Children | 367 (70.0%) | 157 (30.0%) |
| 5 or more Children | 26 (100.0%) | 0 (0.0%) |
| Total | 10,477 (95.9%) | 446 (4.1%) |
Income Below Poverty Among Single-Parent Households in Arcadia
According to the poverty data in Arcadia, 4.1% or 47 single-father households and 13.5% or 419 single-mother households are living below the poverty line. Among single-father households, those with 3 or 4 children have the highest poverty rate, with 11 households (52.4%) experiencing poverty. Likewise, among single-mother households, those with 5 or more children have the highest poverty rate, with 17 households (100.0%) falling below the poverty line.
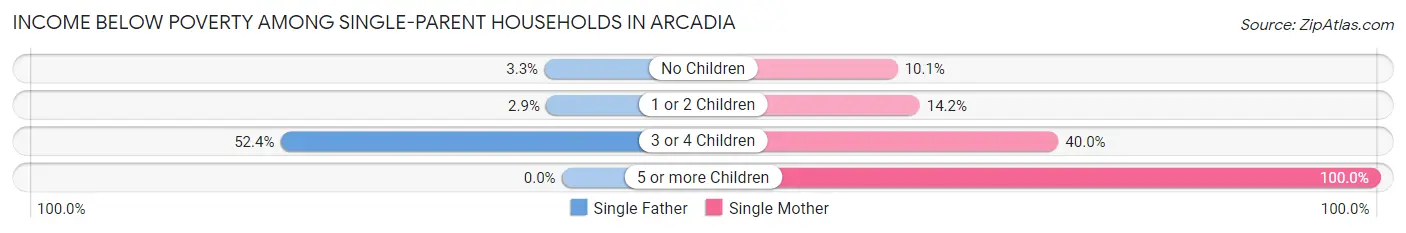
| Children | Single Father | Single Mother |
| No Children | 27 (3.3%) | 177 (10.1%) |
| 1 or 2 Children | 9 (2.9%) | 167 (14.2%) |
| 3 or 4 Children | 11 (52.4%) | 58 (40.0%) |
| 5 or more Children | 0 (0.0%) | 17 (100.0%) |
| Total | 47 (4.1%) | 419 (13.5%) |
Income Below Poverty Among Married-Couple vs Single-Parent Households in Arcadia
The poverty data for Arcadia shows that 446 of the married-couple family households (4.1%) and 466 of the single-parent households (11.0%) are living below the poverty level. Within the married-couple family households, those with 3 or 4 children have the highest poverty rate, with 157 households (30.0%) falling below the poverty line. Among the single-parent households, those with 5 or more children have the highest poverty rate, with 17 household (100.0%) living below poverty.
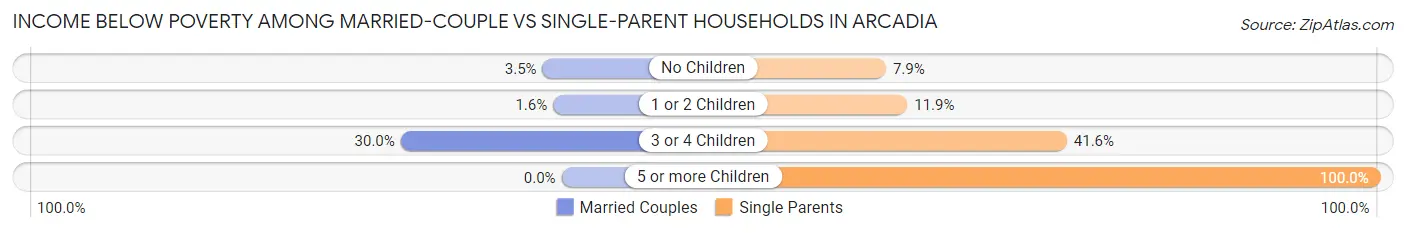
| Children | Married-Couple Families | Single-Parent Households |
| No Children | 227 (3.5%) | 204 (7.9%) |
| 1 or 2 Children | 62 (1.6%) | 176 (11.8%) |
| 3 or 4 Children | 157 (30.0%) | 69 (41.6%) |
| 5 or more Children | 0 (0.0%) | 17 (100.0%) |
| Total | 446 (4.1%) | 466 (11.0%) |
Race in Arcadia
The most populous races in Arcadia are Asian (32,107 | 57.2%), White / Caucasian (15,238 | 27.1%), and Hispanic or Latino (9,152 | 16.3%).
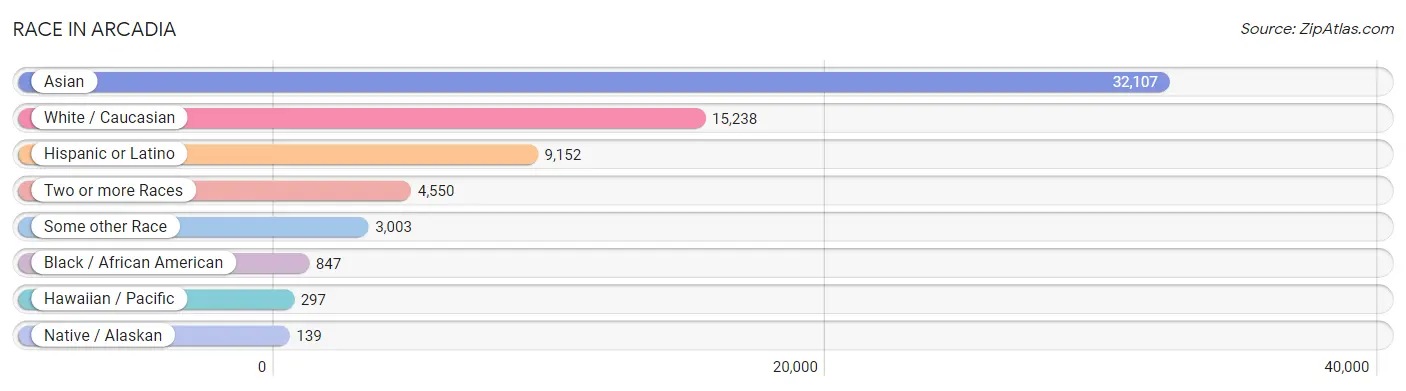
| Race | # Population | % Population |
| Asian | 32,107 | 57.2% |
| Black / African American | 847 | 1.5% |
| Hawaiian / Pacific | 297 | 0.5% |
| Hispanic or Latino | 9,152 | 16.3% |
| Native / Alaskan | 139 | 0.3% |
| White / Caucasian | 15,238 | 27.1% |
| Two or more Races | 4,550 | 8.1% |
| Some other Race | 3,003 | 5.3% |
| Total | 56,181 | 100.0% |
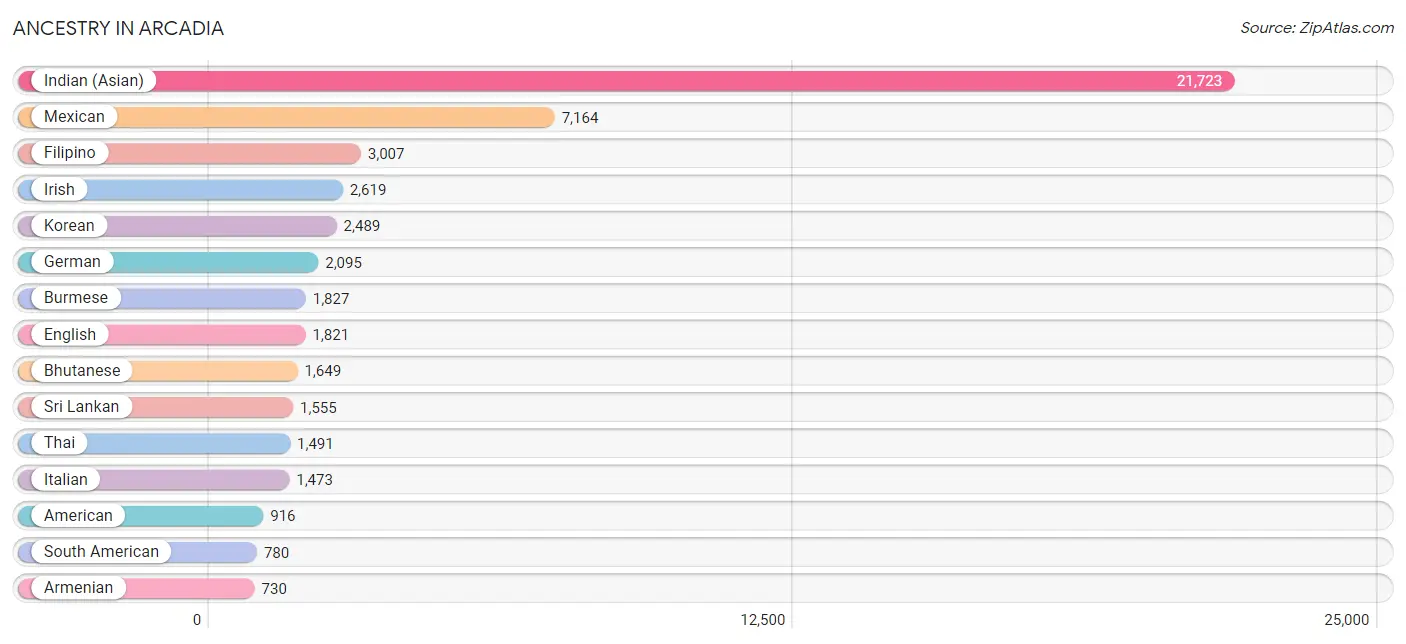
Ancestry in Arcadia
The most populous ancestries reported in Arcadia are Indian (Asian) (21,723 | 38.7%), Mexican (7,164 | 12.8%), Filipino (3,007 | 5.3%), Irish (2,619 | 4.7%), and Korean (2,489 | 4.4%), together accounting for 65.9% of all Arcadia residents.
| Ancestry | # Population | % Population |
| African | 126 | 0.2% |
| American | 916 | 1.6% |
| Arab | 446 | 0.8% |
| Argentinean | 78 | 0.1% |
| Armenian | 730 | 1.3% |
| Assyrian / Chaldean / Syriac | 13 | 0.0% |
| Austrian | 37 | 0.1% |
| Bangladeshi | 73 | 0.1% |
| Basque | 12 | 0.0% |
| Bhutanese | 1,649 | 2.9% |
| Blackfeet | 64 | 0.1% |
| Brazilian | 113 | 0.2% |
| British | 294 | 0.5% |
| Bulgarian | 101 | 0.2% |
| Burmese | 1,827 | 3.3% |
| Cambodian | 11 | 0.0% |
| Canadian | 61 | 0.1% |
| Central American | 565 | 1.0% |
| Cherokee | 133 | 0.2% |
| Choctaw | 34 | 0.1% |
| Colombian | 501 | 0.9% |
| Costa Rican | 17 | 0.0% |
| Creek | 24 | 0.0% |
| Croatian | 56 | 0.1% |
| Cuban | 254 | 0.4% |
| Czech | 136 | 0.2% |
| Danish | 84 | 0.2% |
| Dominican | 9 | 0.0% |
| Dutch | 131 | 0.2% |
| Eastern European | 68 | 0.1% |
| Ecuadorian | 11 | 0.0% |
| Egyptian | 78 | 0.1% |
| English | 1,821 | 3.2% |
| European | 591 | 1.1% |
| Filipino | 3,007 | 5.3% |
| Finnish | 27 | 0.1% |
| French | 624 | 1.1% |
| French Canadian | 159 | 0.3% |
| German | 2,095 | 3.7% |
| Greek | 234 | 0.4% |
| Guatemalan | 40 | 0.1% |
| Hungarian | 104 | 0.2% |
| Indian (Asian) | 21,723 | 38.7% |
| Indonesian | 113 | 0.2% |
| Iranian | 259 | 0.5% |
| Irish | 2,619 | 4.7% |
| Iroquois | 10 | 0.0% |
| Italian | 1,473 | 2.6% |
| Jamaican | 35 | 0.1% |
| Japanese | 72 | 0.1% |
| Korean | 2,489 | 4.4% |
| Laotian | 466 | 0.8% |
| Lebanese | 124 | 0.2% |
| Lithuanian | 10 | 0.0% |
| Malaysian | 9 | 0.0% |
| Mexican | 7,164 | 12.8% |
| Mexican American Indian | 46 | 0.1% |
| Mongolian | 10 | 0.0% |
| Native Hawaiian | 40 | 0.1% |
| Nicaraguan | 55 | 0.1% |
| Nigerian | 12 | 0.0% |
| Northern European | 21 | 0.0% |
| Norwegian | 226 | 0.4% |
| Okinawan | 41 | 0.1% |
| Pakistani | 523 | 0.9% |
| Palestinian | 26 | 0.1% |
| Peruvian | 190 | 0.3% |
| Polish | 436 | 0.8% |
| Portuguese | 62 | 0.1% |
| Puerto Rican | 153 | 0.3% |
| Romanian | 64 | 0.1% |
| Russian | 409 | 0.7% |
| Salvadoran | 426 | 0.8% |
| Samoan | 36 | 0.1% |
| Scandinavian | 131 | 0.2% |
| Scotch-Irish | 199 | 0.4% |
| Scottish | 358 | 0.6% |
| Slovene | 10 | 0.0% |
| South American | 780 | 1.4% |
| Spaniard | 54 | 0.1% |
| Spanish | 56 | 0.1% |
| Sri Lankan | 1,555 | 2.8% |
| Subsaharan African | 171 | 0.3% |
| Swedish | 250 | 0.4% |
| Swiss | 57 | 0.1% |
| Syrian | 161 | 0.3% |
| Thai | 1,491 | 2.6% |
| Turkish | 44 | 0.1% |
| Ugandan | 33 | 0.1% |
| Ukrainian | 35 | 0.1% |
| Welsh | 24 | 0.0% |
| West Indian | 45 | 0.1% |
| Yaqui | 17 | 0.0% |
| Yugoslavian | 17 | 0.0% | View All 94 Rows |
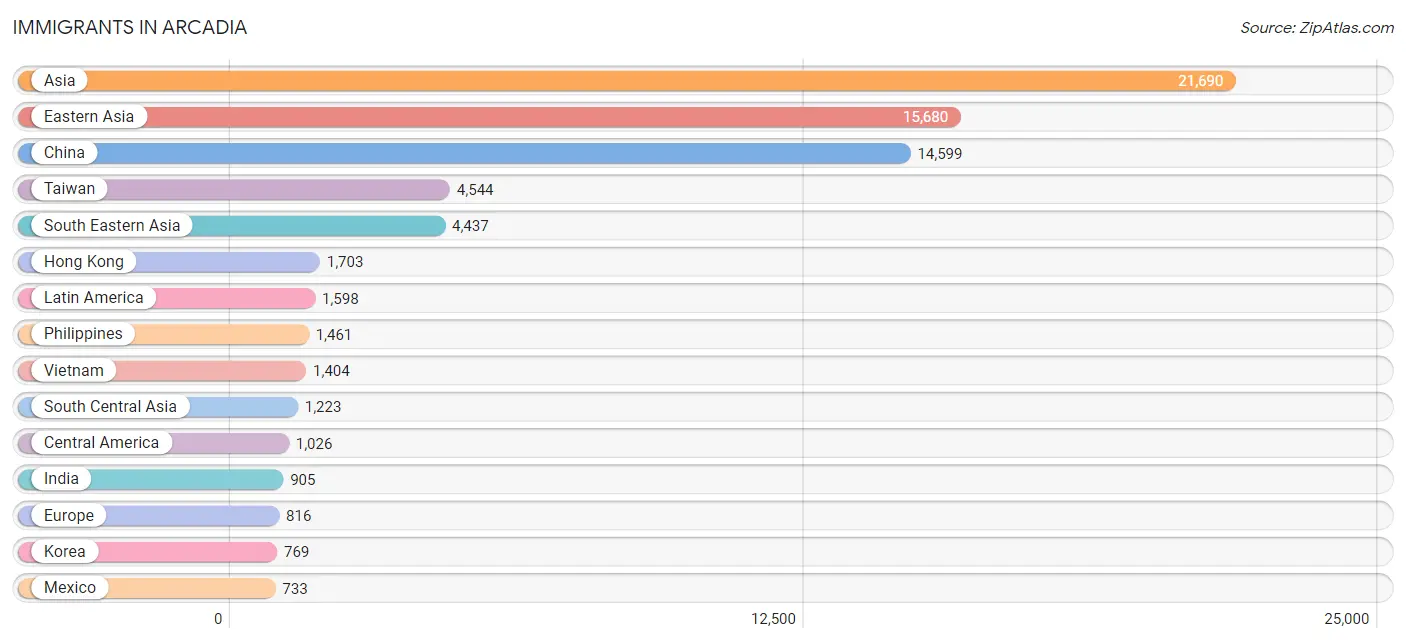
Immigrants in Arcadia
The most numerous immigrant groups reported in Arcadia came from Asia (21,690 | 38.6%), Eastern Asia (15,680 | 27.9%), China (14,599 | 26.0%), Taiwan (4,544 | 8.1%), and South Eastern Asia (4,437 | 7.9%), together accounting for 108.5% of all Arcadia residents.
| Immigration Origin | # Population | % Population |
| Africa | 95 | 0.2% |
| Argentina | 87 | 0.2% |
| Armenia | 78 | 0.1% |
| Asia | 21,690 | 38.6% |
| Australia | 10 | 0.0% |
| Austria | 34 | 0.1% |
| Belarus | 32 | 0.1% |
| Brazil | 137 | 0.2% |
| Bulgaria | 101 | 0.2% |
| Cambodia | 80 | 0.1% |
| Canada | 132 | 0.2% |
| Caribbean | 36 | 0.1% |
| Central America | 1,026 | 1.8% |
| China | 14,599 | 26.0% |
| Colombia | 76 | 0.1% |
| Croatia | 9 | 0.0% |
| Cuba | 27 | 0.1% |
| Denmark | 13 | 0.0% |
| Eastern Africa | 33 | 0.1% |
| Eastern Asia | 15,680 | 27.9% |
| Eastern Europe | 253 | 0.4% |
| Ecuador | 34 | 0.1% |
| Egypt | 52 | 0.1% |
| El Salvador | 209 | 0.4% |
| England | 47 | 0.1% |
| Europe | 816 | 1.5% |
| France | 81 | 0.1% |
| Germany | 38 | 0.1% |
| Ghana | 9 | 0.0% |
| Greece | 66 | 0.1% |
| Guatemala | 36 | 0.1% |
| Hong Kong | 1,703 | 3.0% |
| Hungary | 28 | 0.1% |
| India | 905 | 1.6% |
| Indonesia | 353 | 0.6% |
| Iran | 228 | 0.4% |
| Iraq | 2 | 0.0% |
| Ireland | 58 | 0.1% |
| Italy | 75 | 0.1% |
| Jamaica | 9 | 0.0% |
| Japan | 306 | 0.5% |
| Korea | 769 | 1.4% |
| Kuwait | 16 | 0.0% |
| Laos | 53 | 0.1% |
| Latin America | 1,598 | 2.8% |
| Lebanon | 134 | 0.2% |
| Malaysia | 219 | 0.4% |
| Mexico | 733 | 1.3% |
| Micronesia | 143 | 0.3% |
| Moldova | 12 | 0.0% |
| Nepal | 1 | 0.0% |
| Netherlands | 30 | 0.1% |
| Nicaragua | 48 | 0.1% |
| Northern Africa | 53 | 0.1% |
| Northern Europe | 174 | 0.3% |
| Oceania | 153 | 0.3% |
| Pakistan | 89 | 0.2% |
| Peru | 190 | 0.3% |
| Philippines | 1,461 | 2.6% |
| Romania | 10 | 0.0% |
| Russia | 44 | 0.1% |
| Singapore | 99 | 0.2% |
| South America | 536 | 0.9% |
| South Central Asia | 1,223 | 2.2% |
| South Eastern Asia | 4,437 | 7.9% |
| Southern Europe | 206 | 0.4% |
| Spain | 65 | 0.1% |
| Sudan | 1 | 0.0% |
| Sweden | 9 | 0.0% |
| Syria | 94 | 0.2% |
| Taiwan | 4,544 | 8.1% |
| Thailand | 343 | 0.6% |
| Uganda | 33 | 0.1% |
| Vietnam | 1,404 | 2.5% |
| Western Africa | 9 | 0.0% |
| Western Asia | 340 | 0.6% |
| Western Europe | 183 | 0.3% | View All 77 Rows |
Sex and Age in Arcadia
Sex and Age in Arcadia
The most populous age groups in Arcadia are 50 to 54 Years (2,315 | 8.5%) for men and 10 to 14 Years (2,346 | 8.1%) for women.
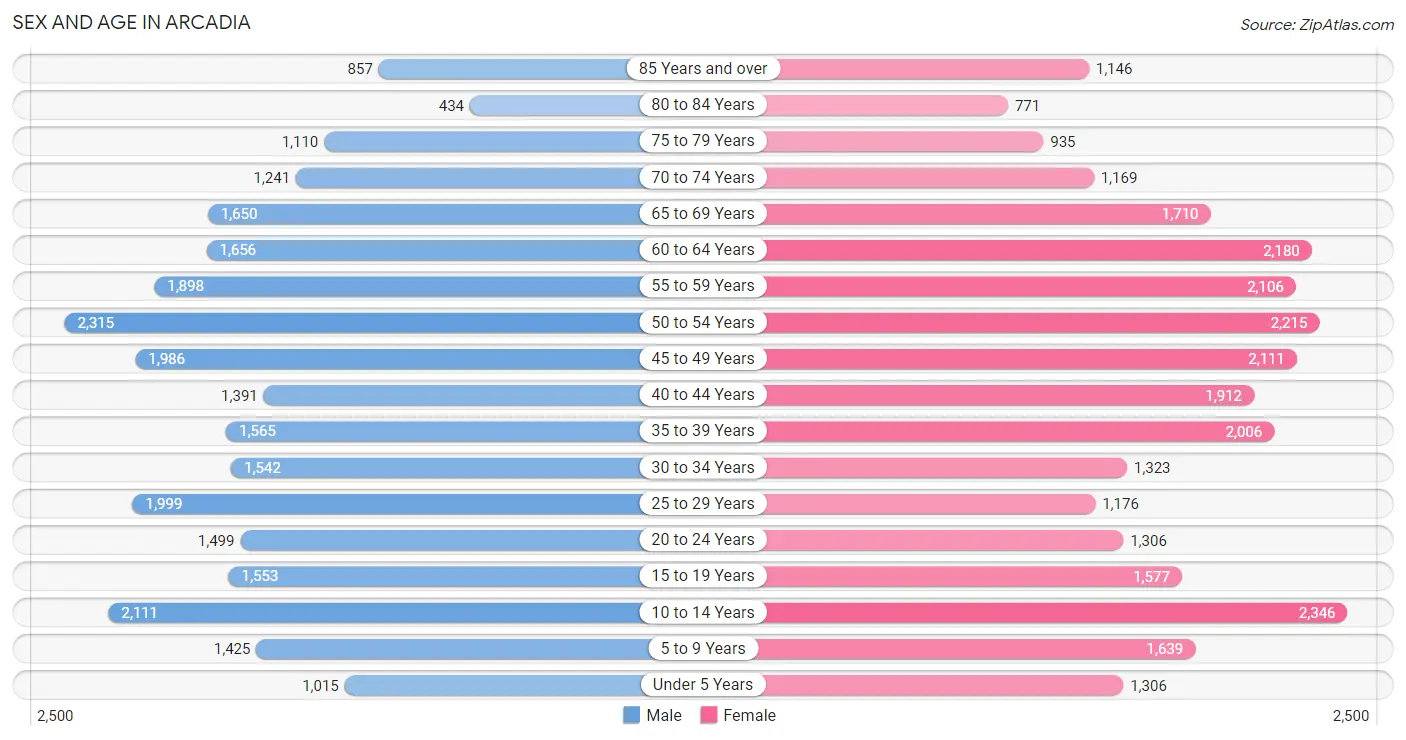
| Age Bracket | Male | Female |
| Under 5 Years | 1,015 (3.7%) | 1,306 (4.5%) |
| 5 to 9 Years | 1,425 (5.2%) | 1,639 (5.7%) |
| 10 to 14 Years | 2,111 (7.7%) | 2,346 (8.1%) |
| 15 to 19 Years | 1,553 (5.7%) | 1,577 (5.4%) |
| 20 to 24 Years | 1,499 (5.5%) | 1,306 (4.5%) |
| 25 to 29 Years | 1,999 (7.3%) | 1,176 (4.1%) |
| 30 to 34 Years | 1,542 (5.7%) | 1,323 (4.6%) |
| 35 to 39 Years | 1,565 (5.7%) | 2,006 (6.9%) |
| 40 to 44 Years | 1,391 (5.1%) | 1,912 (6.6%) |
| 45 to 49 Years | 1,986 (7.3%) | 2,111 (7.3%) |
| 50 to 54 Years | 2,315 (8.5%) | 2,215 (7.7%) |
| 55 to 59 Years | 1,898 (7.0%) | 2,106 (7.3%) |
| 60 to 64 Years | 1,656 (6.1%) | 2,180 (7.5%) |
| 65 to 69 Years | 1,650 (6.1%) | 1,710 (5.9%) |
| 70 to 74 Years | 1,241 (4.5%) | 1,169 (4.0%) |
| 75 to 79 Years | 1,110 (4.1%) | 935 (3.2%) |
| 80 to 84 Years | 434 (1.6%) | 771 (2.7%) |
| 85 Years and over | 857 (3.2%) | 1,146 (4.0%) |
| Total | 27,247 (100.0%) | 28,934 (100.0%) |
Families and Households in Arcadia
Median Family Size in Arcadia
The median family size in Arcadia is 3.22 persons per family, with married-couple families (10,923 | 72.0%) accounting for the largest median family size of 3.33 persons per family. On the other hand, single male/father families (1,156 | 7.6%) represent the smallest median family size with 2.71 persons per family.
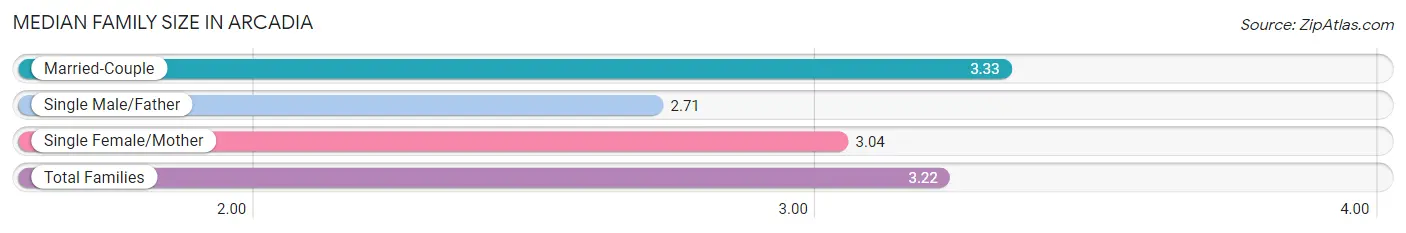
| Family Type | # Families | Family Size |
| Married-Couple | 10,923 (72.0%) | 3.33 |
| Single Male/Father | 1,156 (7.6%) | 2.71 |
| Single Female/Mother | 3,100 (20.4%) | 3.04 |
| Total Families | 15,179 (100.0%) | 3.22 |
Median Household Size in Arcadia
The median household size in Arcadia is 2.85 persons per household, with married-couple households (10,923 | 56.3%) accounting for the largest median household size of 3.35 persons per household. non-family households (4,233 | 21.8%) represent the smallest median household size with 1.28 persons per household.
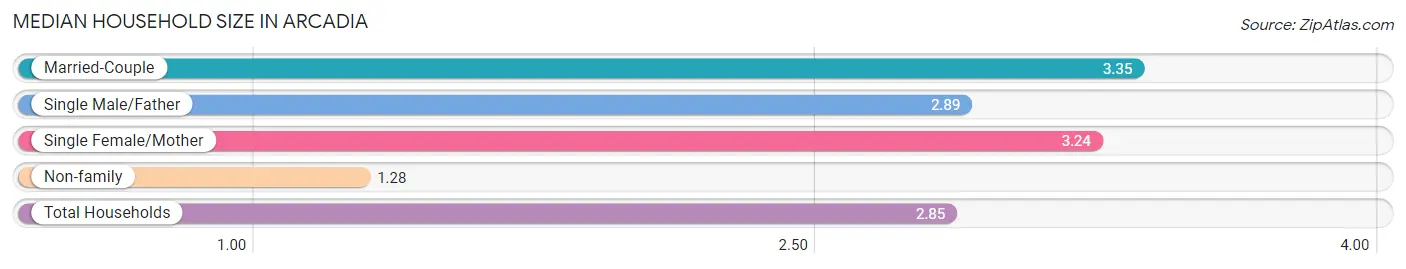
| Household Type | # Households | Household Size |
| Married-Couple | 10,923 (56.3%) | 3.35 |
| Single Male/Father | 1,156 (6.0%) | 2.89 |
| Single Female/Mother | 3,100 (16.0%) | 3.24 |
| Non-family | 4,233 (21.8%) | 1.28 |
| Total Households | 19,412 (100.0%) | 2.85 |
Household Size by Marriage Status in Arcadia
Out of a total of 19,412 households in Arcadia, 15,179 (78.2%) are family households, while 4,233 (21.8%) are nonfamily households. The most numerous type of family households are 2-person households, comprising 5,860, and the most common type of nonfamily households are 1-person households, comprising 3,355.
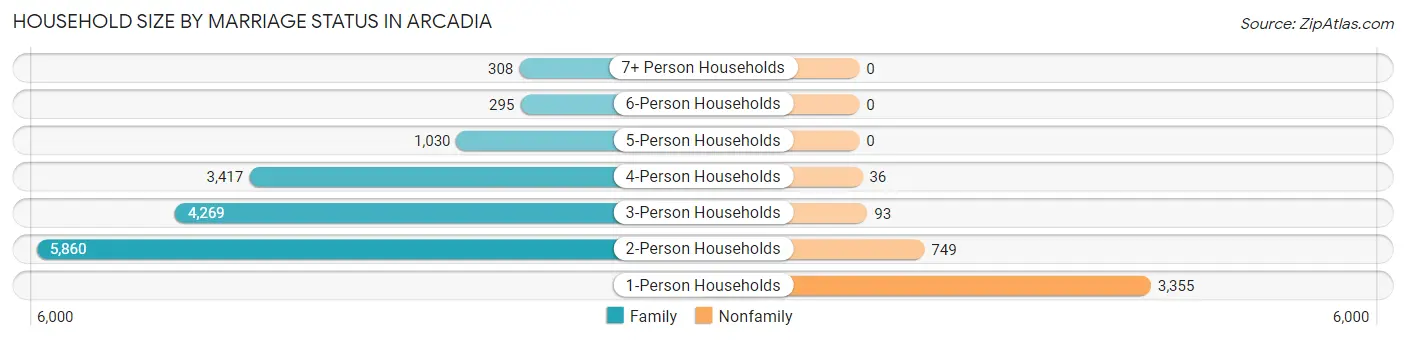
| Household Size | Family Households | Nonfamily Households |
| 1-Person Households | - | 3,355 (17.3%) |
| 2-Person Households | 5,860 (30.2%) | 749 (3.9%) |
| 3-Person Households | 4,269 (22.0%) | 93 (0.5%) |
| 4-Person Households | 3,417 (17.6%) | 36 (0.2%) |
| 5-Person Households | 1,030 (5.3%) | 0 (0.0%) |
| 6-Person Households | 295 (1.5%) | 0 (0.0%) |
| 7+ Person Households | 308 (1.6%) | 0 (0.0%) |
| Total | 15,179 (78.2%) | 4,233 (21.8%) |
Female Fertility in Arcadia
Fertility by Age in Arcadia
Average fertility rate in Arcadia is 39.0 births per 1,000 women. Women in the age bracket of 35 to 50 years have the highest fertility rate with 52.0 births per 1,000 women. Women in the age bracket of 35 to 50 years acount for 72.8% of all women with births.
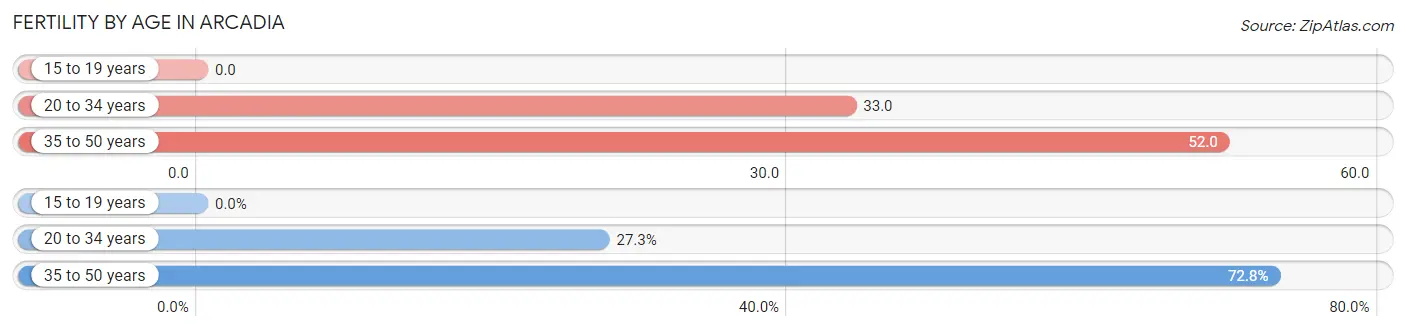
| Age Bracket | Women with Births | Births / 1,000 Women |
| 15 to 19 years | 0 (0.0%) | 0.0 |
| 20 to 34 years | 127 (27.3%) | 33.0 |
| 35 to 50 years | 339 (72.8%) | 52.0 |
| Total | 466 (100.0%) | 39.0 |
Fertility by Age by Marriage Status in Arcadia
92.7% of women with births (466) in Arcadia are married. The highest percentage of unmarried women with births falls into 20 to 34 years age bracket with 13.4% of them unmarried at the time of birth, while the lowest percentage of unmarried women with births belong to 35 to 50 years age bracket with 5.0% of them unmarried.
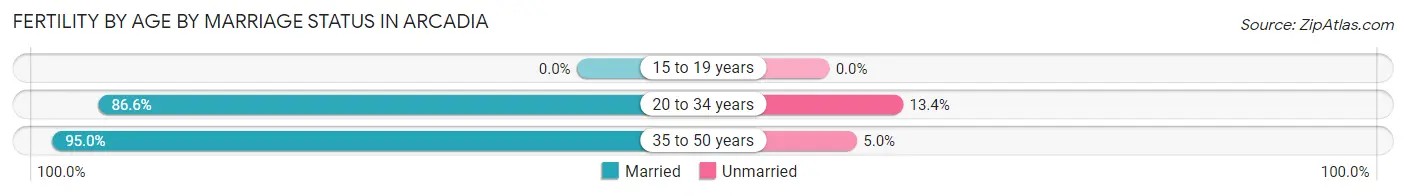
| Age Bracket | Married | Unmarried |
| 15 to 19 years | 0 (0.0%) | 0 (0.0%) |
| 20 to 34 years | 110 (86.6%) | 17 (13.4%) |
| 35 to 50 years | 322 (95.0%) | 17 (5.0%) |
| Total | 432 (92.7%) | 34 (7.3%) |
Fertility by Education in Arcadia
Average fertility rate in Arcadia is 39.0 births per 1,000 women. Women with the education attainment of graduate degree have the highest fertility rate of 104.0 births per 1,000 women, while women with the education attainment of less than high school have the lowest fertility at 7.0 births per 1,000 women. Women with the education attainment of graduate degree represent 50.0% of all women with births.
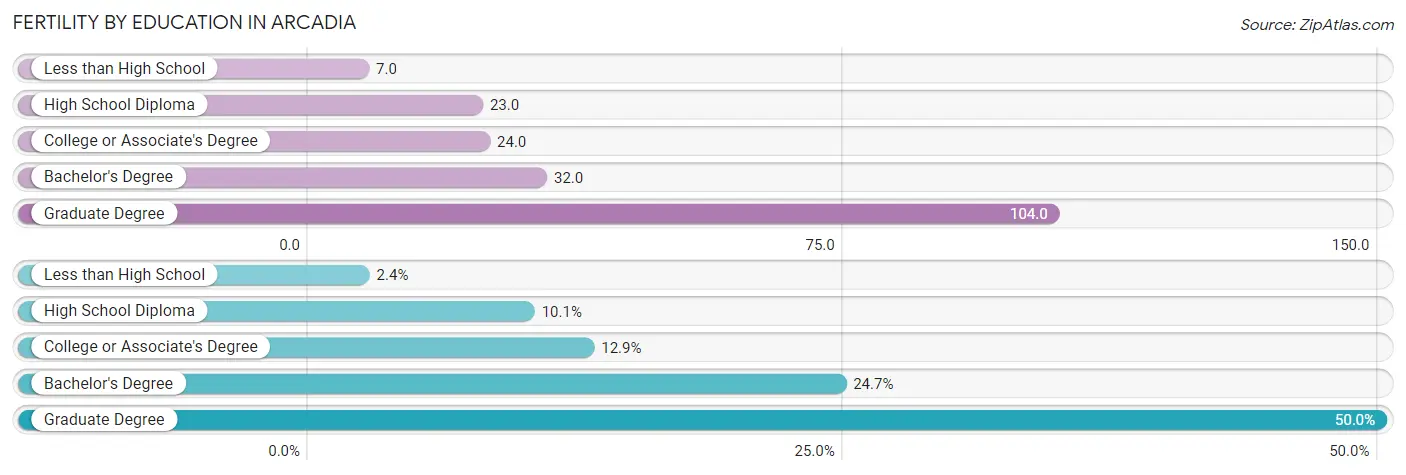
| Educational Attainment | Women with Births | Births / 1,000 Women |
| Less than High School | 11 (2.4%) | 7.0 |
| High School Diploma | 47 (10.1%) | 23.0 |
| College or Associate's Degree | 60 (12.9%) | 24.0 |
| Bachelor's Degree | 115 (24.7%) | 32.0 |
| Graduate Degree | 233 (50.0%) | 104.0 |
| Total | 466 (100.0%) | 39.0 |
Fertility by Education by Marriage Status in Arcadia
7.3% of women with births in Arcadia are unmarried. Women with the educational attainment of less than high school are most likely to be married with 100.0% of them married at childbirth, while women with the educational attainment of high school diploma are least likely to be married with 36.2% of them unmarried at childbirth.
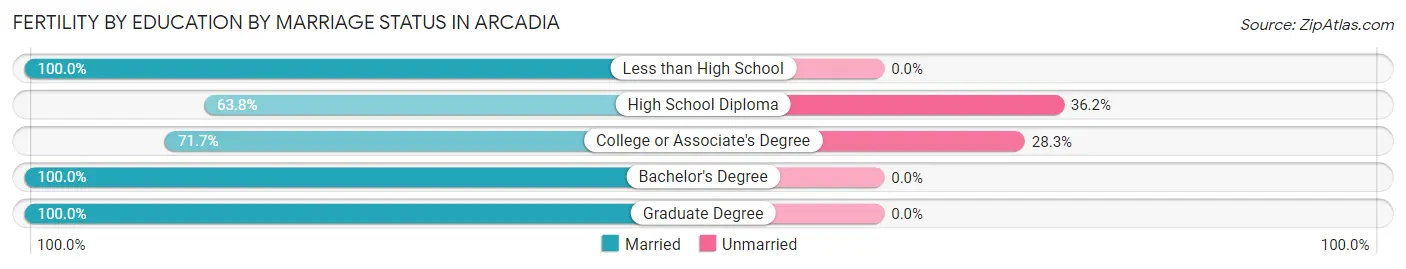
| Educational Attainment | Married | Unmarried |
| Less than High School | 11 (100.0%) | 0 (0.0%) |
| High School Diploma | 30 (63.8%) | 17 (36.2%) |
| College or Associate's Degree | 43 (71.7%) | 17 (28.3%) |
| Bachelor's Degree | 115 (100.0%) | 0 (0.0%) |
| Graduate Degree | 233 (100.0%) | 0 (0.0%) |
| Total | 432 (92.7%) | 34 (7.3%) |
Employment Characteristics in Arcadia
Employment by Class of Employer in Arcadia
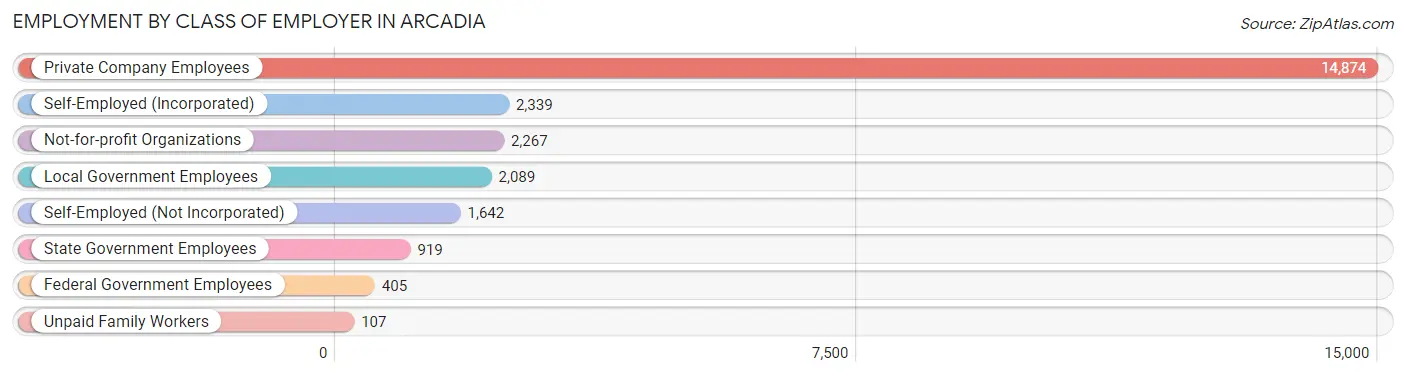
Among the 24,642 employed individuals in Arcadia, private company employees (14,874 | 60.4%), self-employed (incorporated) (2,339 | 9.5%), and not-for-profit organizations (2,267 | 9.2%) make up the most common classes of employment.
| Employer Class | # Employees | % Employees |
| Private Company Employees | 14,874 | 60.4% |
| Self-Employed (Incorporated) | 2,339 | 9.5% |
| Self-Employed (Not Incorporated) | 1,642 | 6.7% |
| Not-for-profit Organizations | 2,267 | 9.2% |
| Local Government Employees | 2,089 | 8.5% |
| State Government Employees | 919 | 3.7% |
| Federal Government Employees | 405 | 1.6% |
| Unpaid Family Workers | 107 | 0.4% |
| Total | 24,642 | 100.0% |
Employment Status by Age in Arcadia
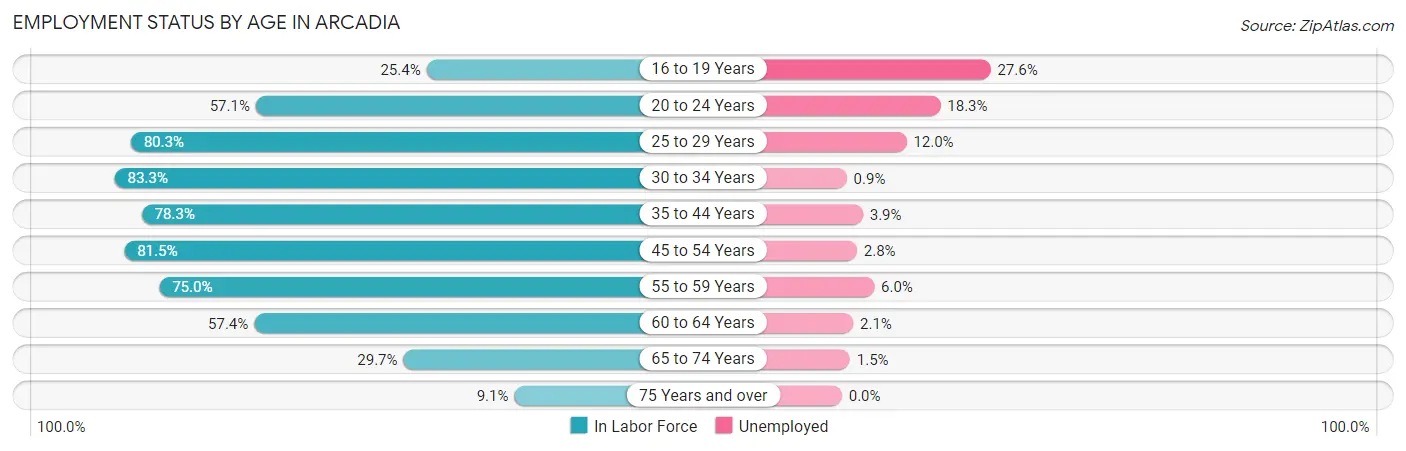
According to the labor force statistics for Arcadia, out of the total population over 16 years of age (45,756), 59.0% or 26,996 individuals are in the labor force, with 5.4% or 1,458 of them unemployed. The age group with the highest labor force participation rate is 30 to 34 years, with 83.3% or 2,387 individuals in the labor force. Within the labor force, the 16 to 19 years age range has the highest percentage of unemployed individuals, with 27.6% or 179 of them being unemployed.
| Age Bracket | In Labor Force | Unemployed |
| 16 to 19 Years | 647 (25.4%) | 179 (27.6%) |
| 20 to 24 Years | 1,602 (57.1%) | 293 (18.3%) |
| 25 to 29 Years | 2,550 (80.3%) | 306 (12.0%) |
| 30 to 34 Years | 2,387 (83.3%) | 21 (0.9%) |
| 35 to 44 Years | 5,382 (78.3%) | 210 (3.9%) |
| 45 to 54 Years | 7,031 (81.5%) | 197 (2.8%) |
| 55 to 59 Years | 3,003 (75.0%) | 180 (6.0%) |
| 60 to 64 Years | 2,202 (57.4%) | 46 (2.1%) |
| 65 to 74 Years | 1,714 (29.7%) | 26 (1.5%) |
| 75 Years and over | 478 (9.1%) | 0 (0.0%) |
| Total | 26,996 (59.0%) | 1,458 (5.4%) |
Employment Status by Educational Attainment in Arcadia
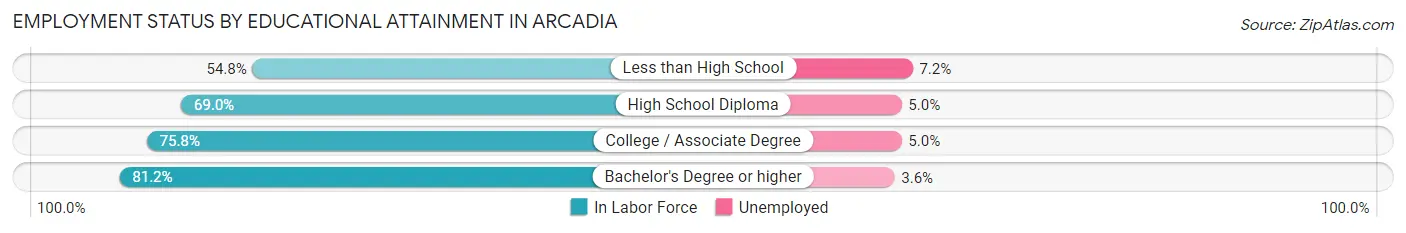
According to labor force statistics for Arcadia, 76.8% of individuals (22,565) out of the total population between 25 and 64 years of age (29,381) are in the labor force, with 4.2% or 948 of them being unemployed. The group with the highest labor force participation rate are those with the educational attainment of bachelor's degree or higher, with 81.2% or 13,867 individuals in the labor force. Within the labor force, individuals with less than high school education have the highest percentage of unemployment, with 7.2% or 59 of them being unemployed.
| Educational Attainment | In Labor Force | Unemployed |
| Less than High School | 819 (54.8%) | 108 (7.2%) |
| High School Diploma | 3,369 (69.0%) | 244 (5.0%) |
| College / Associate Degree | 4,491 (75.8%) | 296 (5.0%) |
| Bachelor's Degree or higher | 13,867 (81.2%) | 615 (3.6%) |
| Total | 22,565 (76.8%) | 1,234 (4.2%) |
Employment Occupations by Sex in Arcadia
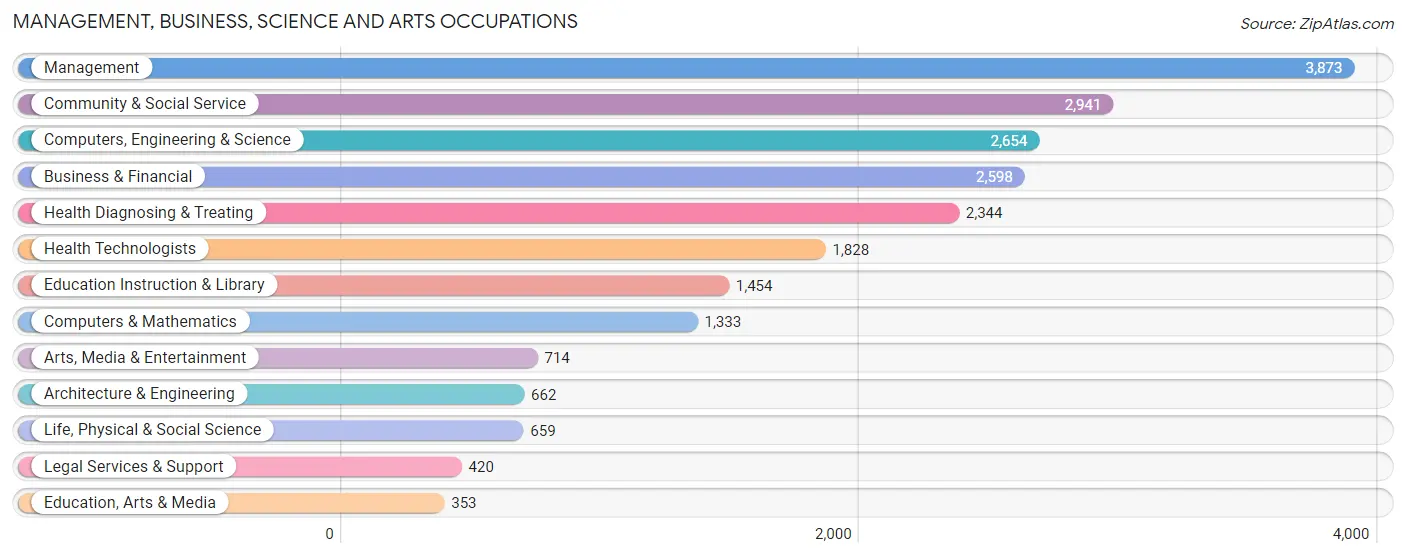
Management, Business, Science and Arts Occupations
The most common Management, Business, Science and Arts occupations in Arcadia are Management (3,873 | 15.2%), Community & Social Service (2,941 | 11.5%), Computers, Engineering & Science (2,654 | 10.4%), Business & Financial (2,598 | 10.2%), and Health Diagnosing & Treating (2,344 | 9.2%).
Management, Business, Science and Arts Occupations by Sex
Within the Management, Business, Science and Arts occupations in Arcadia, the most male-oriented occupations are Architecture & Engineering (85.5%), Legal Services & Support (77.4%), and Computers, Engineering & Science (69.6%), while the most female-oriented occupations are Education Instruction & Library (72.6%), Health Diagnosing & Treating (56.4%), and Community & Social Service (54.8%).
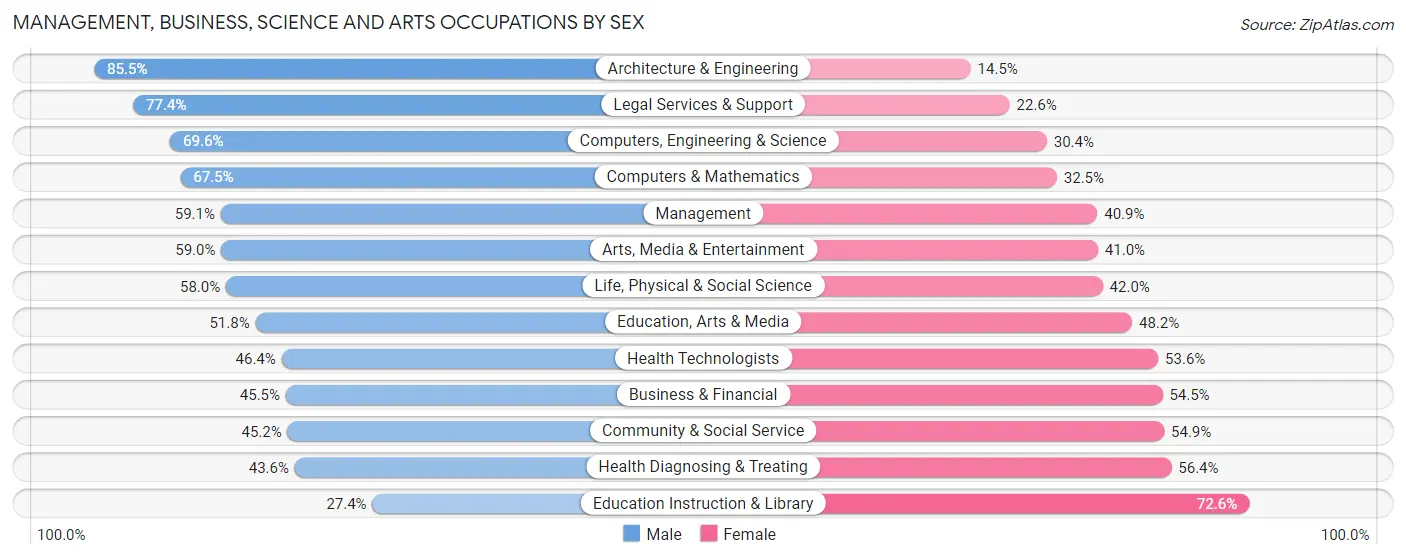
| Occupation | Male | Female |
| Management | 2,288 (59.1%) | 1,585 (40.9%) |
| Business & Financial | 1,182 (45.5%) | 1,416 (54.5%) |
| Computers, Engineering & Science | 1,848 (69.6%) | 806 (30.4%) |
| Computers & Mathematics | 900 (67.5%) | 433 (32.5%) |
| Architecture & Engineering | 566 (85.5%) | 96 (14.5%) |
| Life, Physical & Social Science | 382 (58.0%) | 277 (42.0%) |
| Community & Social Service | 1,328 (45.2%) | 1,613 (54.8%) |
| Education, Arts & Media | 183 (51.8%) | 170 (48.2%) |
| Legal Services & Support | 325 (77.4%) | 95 (22.6%) |
| Education Instruction & Library | 399 (27.4%) | 1,055 (72.6%) |
| Arts, Media & Entertainment | 421 (59.0%) | 293 (41.0%) |
| Health Diagnosing & Treating | 1,023 (43.6%) | 1,321 (56.4%) |
| Health Technologists | 848 (46.4%) | 980 (53.6%) |
| Total (Category) | 7,669 (53.2%) | 6,741 (46.8%) |
| Total (Overall) | 13,599 (53.2%) | 11,940 (46.8%) |
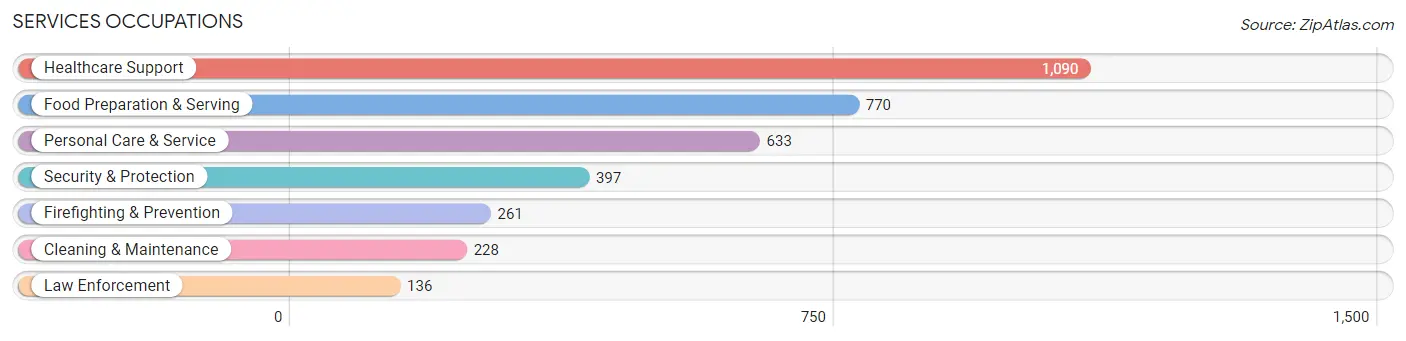
Services Occupations
The most common Services occupations in Arcadia are Healthcare Support (1,090 | 4.3%), Food Preparation & Serving (770 | 3.0%), Personal Care & Service (633 | 2.5%), Security & Protection (397 | 1.5%), and Firefighting & Prevention (261 | 1.0%).
Services Occupations by Sex
Within the Services occupations in Arcadia, the most male-oriented occupations are Law Enforcement (100.0%), Security & Protection (87.2%), and Cleaning & Maintenance (86.8%), while the most female-oriented occupations are Personal Care & Service (74.6%), Healthcare Support (62.7%), and Food Preparation & Serving (41.8%).
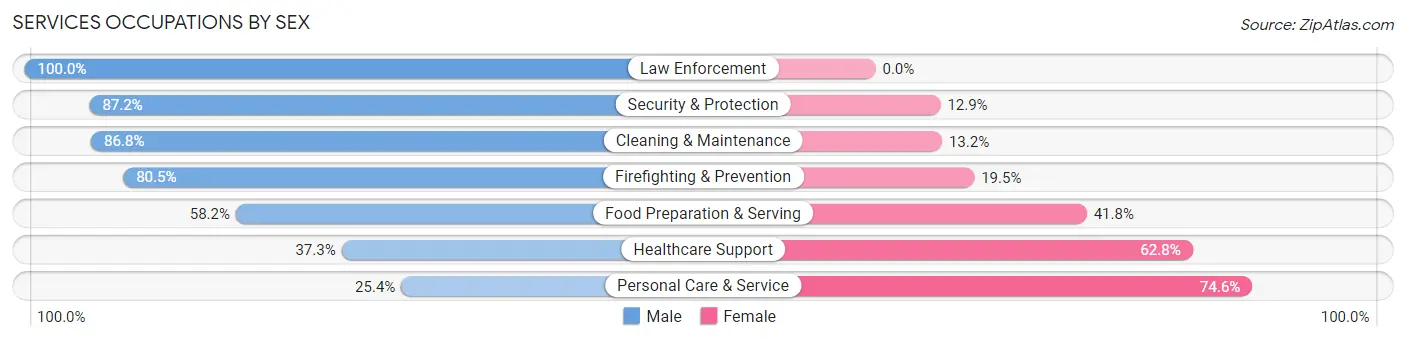
| Occupation | Male | Female |
| Healthcare Support | 406 (37.2%) | 684 (62.7%) |
| Security & Protection | 346 (87.2%) | 51 (12.9%) |
| Firefighting & Prevention | 210 (80.5%) | 51 (19.5%) |
| Law Enforcement | 136 (100.0%) | 0 (0.0%) |
| Food Preparation & Serving | 448 (58.2%) | 322 (41.8%) |
| Cleaning & Maintenance | 198 (86.8%) | 30 (13.2%) |
| Personal Care & Service | 161 (25.4%) | 472 (74.6%) |
| Total (Category) | 1,559 (50.0%) | 1,559 (50.0%) |
| Total (Overall) | 13,599 (53.2%) | 11,940 (46.8%) |
Sales and Office Occupations
The most common Sales and Office occupations in Arcadia are Office & Administration (3,049 | 11.9%), and Sales & Related (2,423 | 9.5%).

Sales and Office Occupations by Sex

| Occupation | Male | Female |
| Sales & Related | 1,426 (58.9%) | 997 (41.1%) |
| Office & Administration | 941 (30.9%) | 2,108 (69.1%) |
| Total (Category) | 2,367 (43.3%) | 3,105 (56.7%) |
| Total (Overall) | 13,599 (53.2%) | 11,940 (46.8%) |
Natural Resources, Construction and Maintenance Occupations
The most common Natural Resources, Construction and Maintenance occupations in Arcadia are Construction & Extraction (405 | 1.6%), Installation, Maintenance & Repair (298 | 1.2%), and Farming, Fishing & Forestry (2 | 0.0%).

Natural Resources, Construction and Maintenance Occupations by Sex

| Occupation | Male | Female |
| Farming, Fishing & Forestry | 2 (100.0%) | 0 (0.0%) |
| Construction & Extraction | 378 (93.3%) | 27 (6.7%) |
| Installation, Maintenance & Repair | 298 (100.0%) | 0 (0.0%) |
| Total (Category) | 678 (96.2%) | 27 (3.8%) |
| Total (Overall) | 13,599 (53.2%) | 11,940 (46.8%) |
Production, Transportation and Moving Occupations
The most common Production, Transportation and Moving occupations in Arcadia are Transportation (695 | 2.7%), Production (642 | 2.5%), and Material Moving (497 | 1.9%).
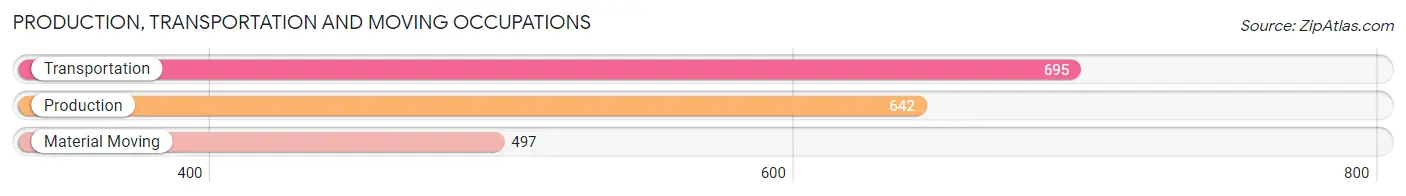
Production, Transportation and Moving Occupations by Sex
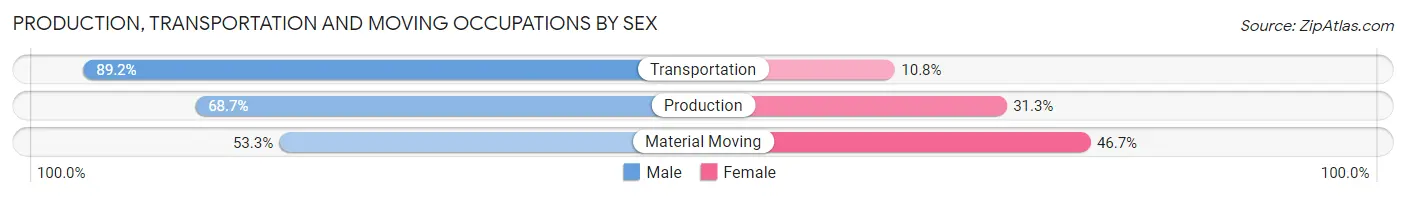
| Occupation | Male | Female |
| Production | 441 (68.7%) | 201 (31.3%) |
| Transportation | 620 (89.2%) | 75 (10.8%) |
| Material Moving | 265 (53.3%) | 232 (46.7%) |
| Total (Category) | 1,326 (72.3%) | 508 (27.7%) |
| Total (Overall) | 13,599 (53.2%) | 11,940 (46.8%) |
Employment Industries by Sex in Arcadia
Employment Industries in Arcadia
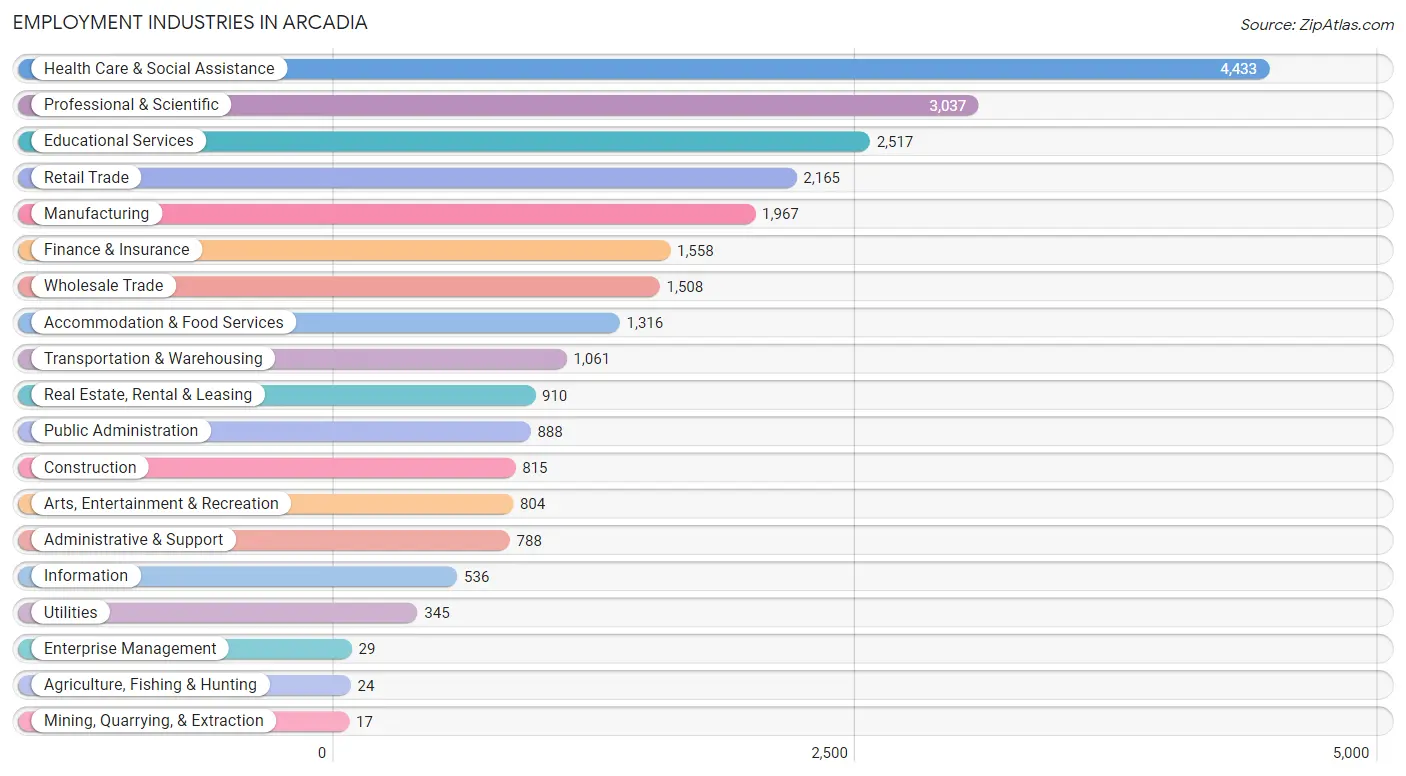
The major employment industries in Arcadia include Health Care & Social Assistance (4,433 | 17.4%), Professional & Scientific (3,037 | 11.9%), Educational Services (2,517 | 9.9%), Retail Trade (2,165 | 8.5%), and Manufacturing (1,967 | 7.7%).
Employment Industries by Sex in Arcadia
The Arcadia industries that see more men than women are Mining, Quarrying, & Extraction (100.0%), Construction (84.8%), and Administrative & Support (75.5%), whereas the industries that tend to have a higher number of women are Enterprise Management (69.0%), Educational Services (65.6%), and Utilities (63.8%).
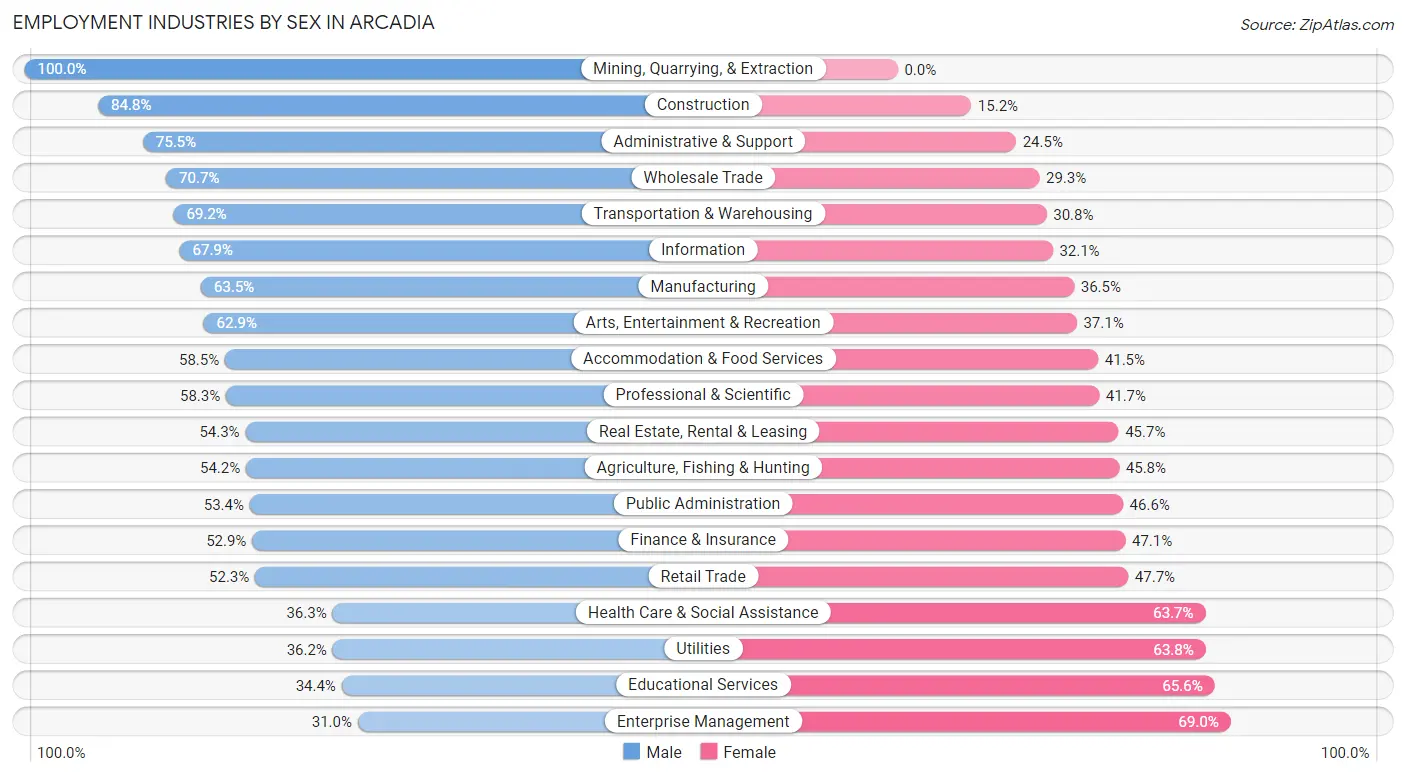
| Industry | Male | Female |
| Agriculture, Fishing & Hunting | 13 (54.2%) | 11 (45.8%) |
| Mining, Quarrying, & Extraction | 17 (100.0%) | 0 (0.0%) |
| Construction | 691 (84.8%) | 124 (15.2%) |
| Manufacturing | 1,249 (63.5%) | 718 (36.5%) |
| Wholesale Trade | 1,066 (70.7%) | 442 (29.3%) |
| Retail Trade | 1,132 (52.3%) | 1,033 (47.7%) |
| Transportation & Warehousing | 734 (69.2%) | 327 (30.8%) |
| Utilities | 125 (36.2%) | 220 (63.8%) |
| Information | 364 (67.9%) | 172 (32.1%) |
| Finance & Insurance | 824 (52.9%) | 734 (47.1%) |
| Real Estate, Rental & Leasing | 494 (54.3%) | 416 (45.7%) |
| Professional & Scientific | 1,771 (58.3%) | 1,266 (41.7%) |
| Enterprise Management | 9 (31.0%) | 20 (69.0%) |
| Administrative & Support | 595 (75.5%) | 193 (24.5%) |
| Educational Services | 865 (34.4%) | 1,652 (65.6%) |
| Health Care & Social Assistance | 1,608 (36.3%) | 2,825 (63.7%) |
| Arts, Entertainment & Recreation | 506 (62.9%) | 298 (37.1%) |
| Accommodation & Food Services | 770 (58.5%) | 546 (41.5%) |
| Public Administration | 474 (53.4%) | 414 (46.6%) |
| Total | 13,599 (53.2%) | 11,940 (46.8%) |
Education in Arcadia
School Enrollment in Arcadia
The most common levels of schooling among the 14,846 students in Arcadia are college / undergraduate (3,812 | 25.7%), middle school (3,519 | 23.7%), and high school (2,762 | 18.6%).
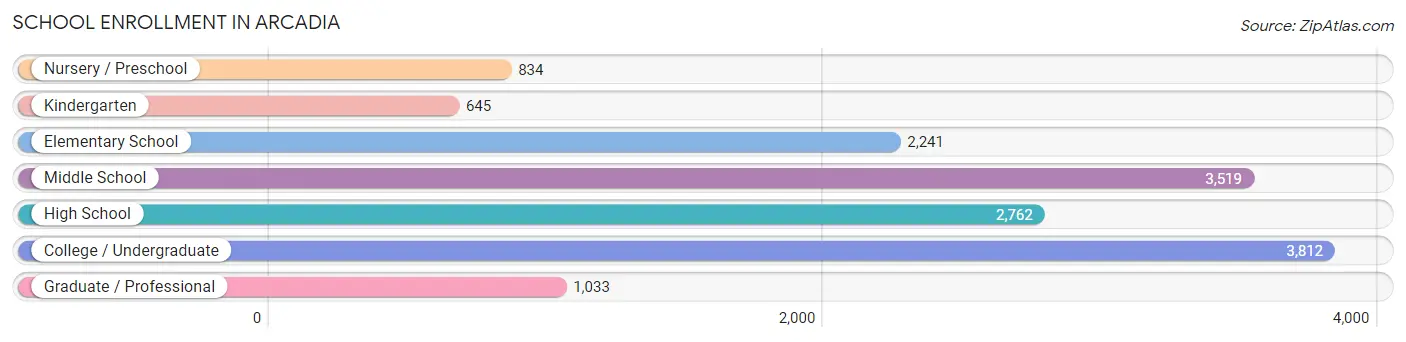
| School Level | # Students | % Students |
| Nursery / Preschool | 834 | 5.6% |
| Kindergarten | 645 | 4.3% |
| Elementary School | 2,241 | 15.1% |
| Middle School | 3,519 | 23.7% |
| High School | 2,762 | 18.6% |
| College / Undergraduate | 3,812 | 25.7% |
| Graduate / Professional | 1,033 | 7.0% |
| Total | 14,846 | 100.0% |
School Enrollment by Age by Funding Source in Arcadia
Out of a total of 14,846 students who are enrolled in schools in Arcadia, 2,776 (18.7%) attend a private institution, while the remaining 12,070 (81.3%) are enrolled in public schools. The age group of 3 to 4 year olds has the highest likelihood of being enrolled in private schools, with 530 (75.5% in the age bracket) enrolled. Conversely, the age group of 10 to 14 year olds has the lowest likelihood of being enrolled in a private school, with 4,092 (93.0% in the age bracket) attending a public institution.
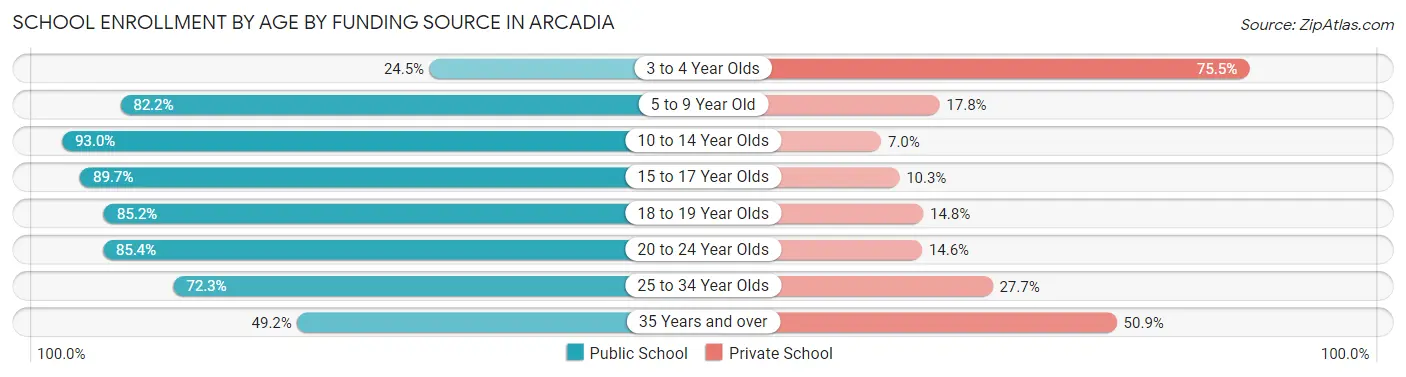
| Age Bracket | Public School | Private School |
| 3 to 4 Year Olds | 172 (24.5%) | 530 (75.5%) |
| 5 to 9 Year Old | 2,276 (82.2%) | 494 (17.8%) |
| 10 to 14 Year Olds | 4,092 (93.0%) | 306 (7.0%) |
| 15 to 17 Year Olds | 1,716 (89.7%) | 198 (10.3%) |
| 18 to 19 Year Olds | 951 (85.2%) | 165 (14.8%) |
| 20 to 24 Year Olds | 1,600 (85.4%) | 273 (14.6%) |
| 25 to 34 Year Olds | 772 (72.3%) | 296 (27.7%) |
| 35 Years and over | 494 (49.1%) | 511 (50.8%) |
| Total | 12,070 (81.3%) | 2,776 (18.7%) |
Educational Attainment by Field of Study in Arcadia
Business (5,880 | 24.9%), engineering (2,599 | 11.0%), social sciences (2,301 | 9.8%), science & technology (1,768 | 7.5%), and bio, nature & agricultural (1,641 | 7.0%) are the most common fields of study among 23,592 individuals in Arcadia who have obtained a bachelor's degree or higher.
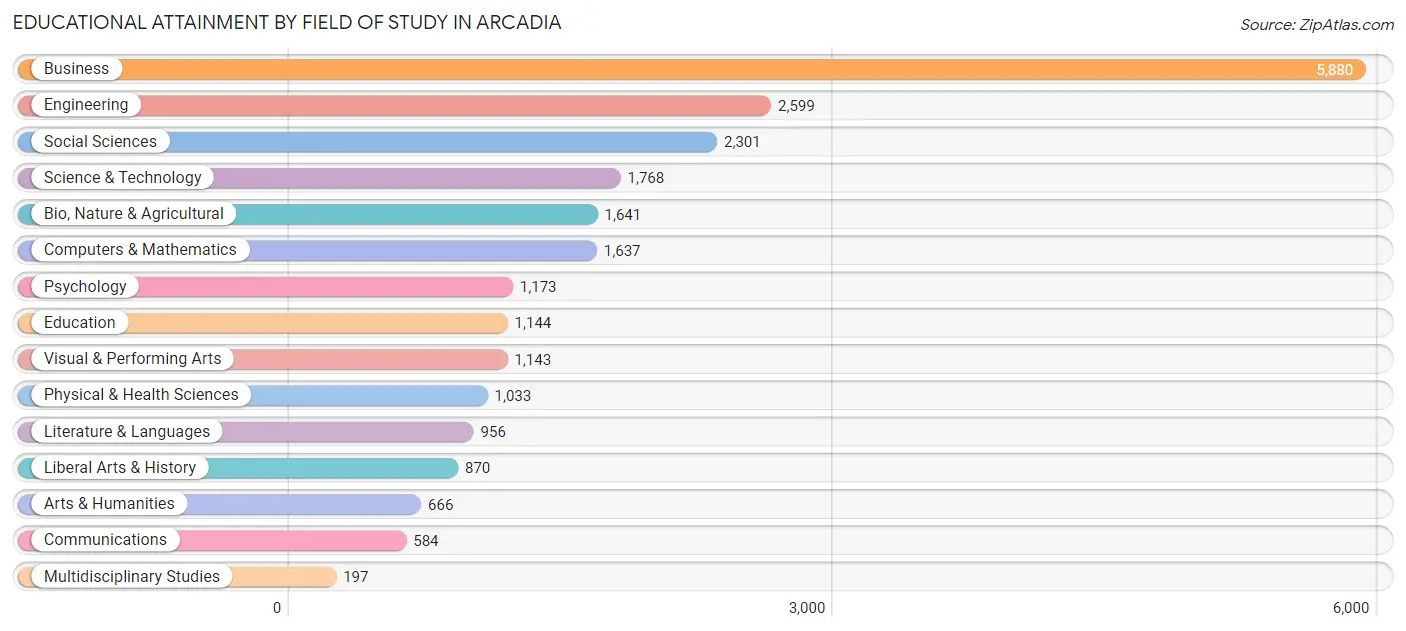
| Field of Study | # Graduates | % Graduates |
| Computers & Mathematics | 1,637 | 6.9% |
| Bio, Nature & Agricultural | 1,641 | 7.0% |
| Physical & Health Sciences | 1,033 | 4.4% |
| Psychology | 1,173 | 5.0% |
| Social Sciences | 2,301 | 9.8% |
| Engineering | 2,599 | 11.0% |
| Multidisciplinary Studies | 197 | 0.8% |
| Science & Technology | 1,768 | 7.5% |
| Business | 5,880 | 24.9% |
| Education | 1,144 | 4.9% |
| Literature & Languages | 956 | 4.1% |
| Liberal Arts & History | 870 | 3.7% |
| Visual & Performing Arts | 1,143 | 4.8% |
| Communications | 584 | 2.5% |
| Arts & Humanities | 666 | 2.8% |
| Total | 23,592 | 100.0% |
Transportation & Commute in Arcadia
Vehicle Availability by Sex in Arcadia
The most prevalent vehicle ownership categories in Arcadia are males with 2 vehicles (5,740, accounting for 43.4%) and females with 2 vehicles (4,696, making up 50.5%).
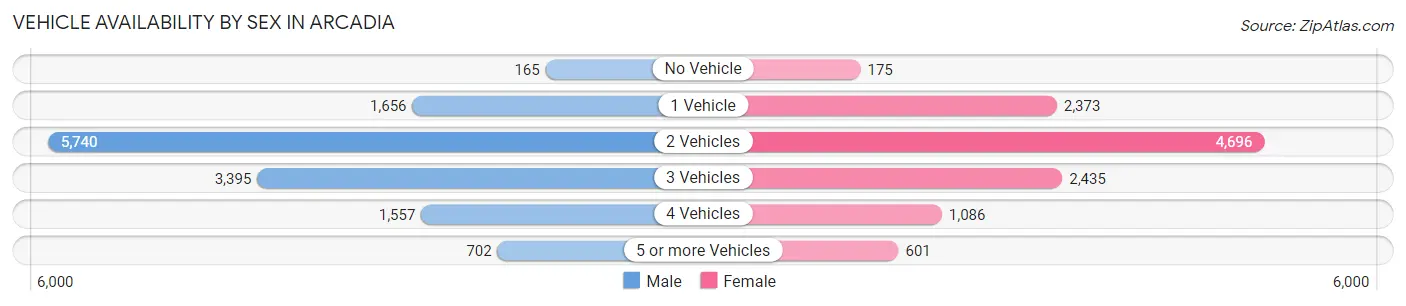
| Vehicles Available | Male | Female |
| No Vehicle | 165 (1.3%) | 175 (1.5%) |
| 1 Vehicle | 1,656 (12.5%) | 2,373 (20.9%) |
| 2 Vehicles | 5,740 (43.4%) | 4,696 (41.3%) |
| 3 Vehicles | 3,395 (25.7%) | 2,435 (21.4%) |
| 4 Vehicles | 1,557 (11.8%) | 1,086 (9.6%) |
| 5 or more Vehicles | 702 (5.3%) | 601 (5.3%) |
| Total | 13,215 (100.0%) | 11,366 (100.0%) |
Commute Time in Arcadia
The most frequently occuring commute durations in Arcadia are 30 to 34 minutes (3,273 commuters, 16.3%), 20 to 24 minutes (3,159 commuters, 15.7%), and 10 to 14 minutes (2,492 commuters, 12.4%).
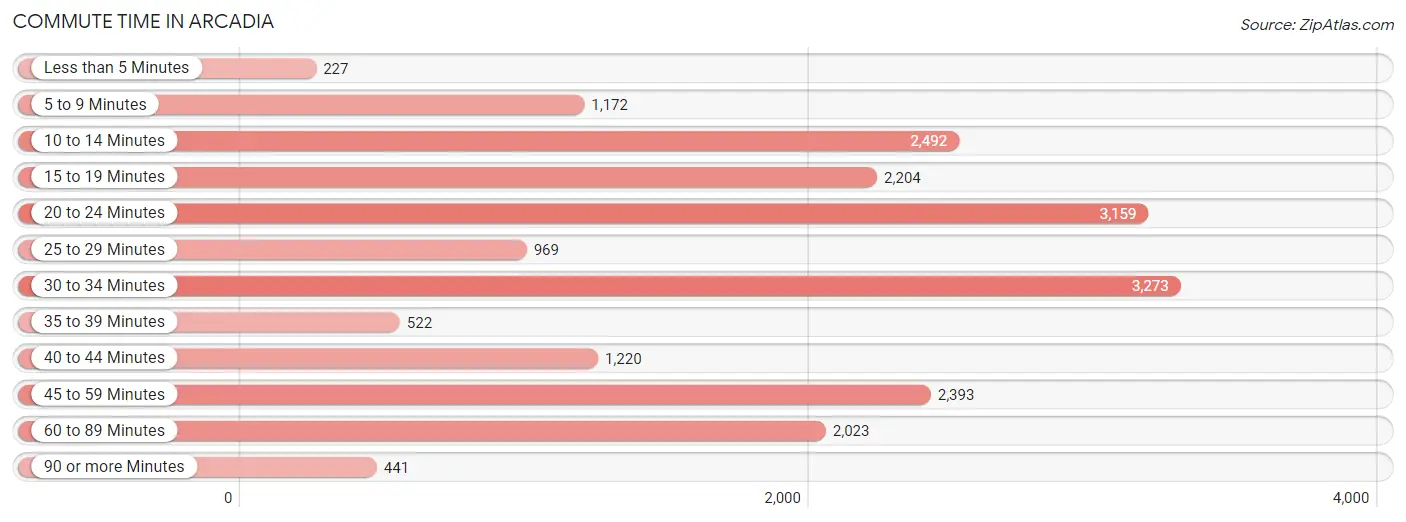
| Commute Time | # Commuters | % Commuters |
| Less than 5 Minutes | 227 | 1.1% |
| 5 to 9 Minutes | 1,172 | 5.8% |
| 10 to 14 Minutes | 2,492 | 12.4% |
| 15 to 19 Minutes | 2,204 | 11.0% |
| 20 to 24 Minutes | 3,159 | 15.7% |
| 25 to 29 Minutes | 969 | 4.8% |
| 30 to 34 Minutes | 3,273 | 16.3% |
| 35 to 39 Minutes | 522 | 2.6% |
| 40 to 44 Minutes | 1,220 | 6.1% |
| 45 to 59 Minutes | 2,393 | 11.9% |
| 60 to 89 Minutes | 2,023 | 10.1% |
| 90 or more Minutes | 441 | 2.2% |
Commute Time by Sex in Arcadia
The most common commute times in Arcadia are 30 to 34 minutes (1,822 commuters, 16.8%) for males and 10 to 14 minutes (1,565 commuters, 16.9%) for females.
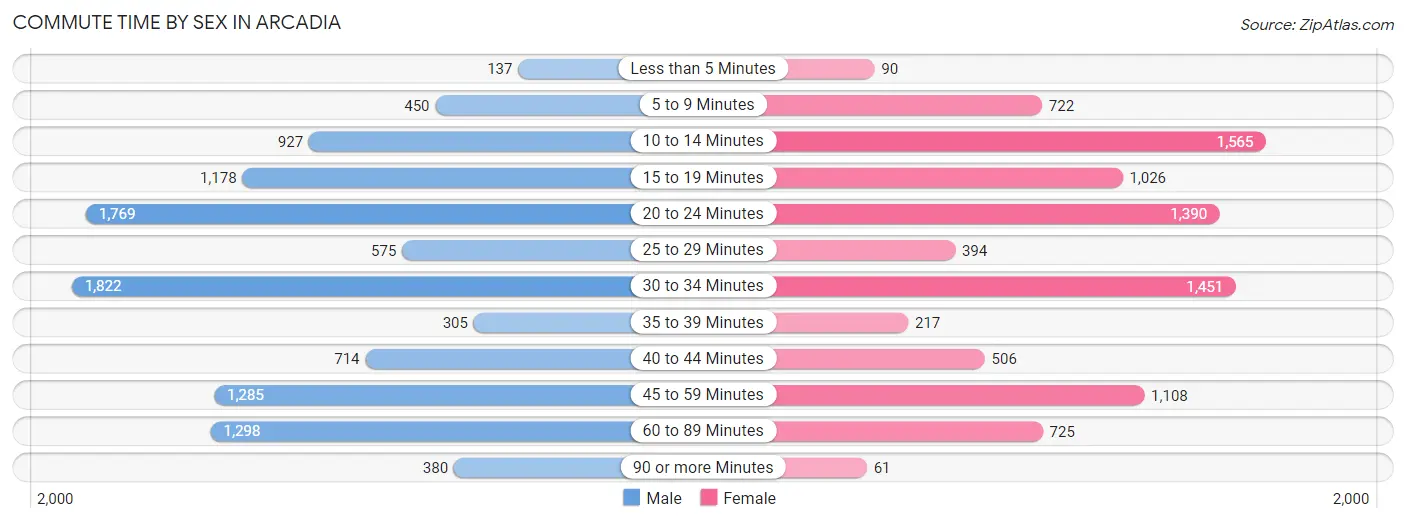
| Commute Time | Male | Female |
| Less than 5 Minutes | 137 (1.3%) | 90 (1.0%) |
| 5 to 9 Minutes | 450 (4.2%) | 722 (7.8%) |
| 10 to 14 Minutes | 927 (8.6%) | 1,565 (16.9%) |
| 15 to 19 Minutes | 1,178 (10.9%) | 1,026 (11.1%) |
| 20 to 24 Minutes | 1,769 (16.3%) | 1,390 (15.0%) |
| 25 to 29 Minutes | 575 (5.3%) | 394 (4.3%) |
| 30 to 34 Minutes | 1,822 (16.8%) | 1,451 (15.7%) |
| 35 to 39 Minutes | 305 (2.8%) | 217 (2.3%) |
| 40 to 44 Minutes | 714 (6.6%) | 506 (5.5%) |
| 45 to 59 Minutes | 1,285 (11.8%) | 1,108 (12.0%) |
| 60 to 89 Minutes | 1,298 (12.0%) | 725 (7.8%) |
| 90 or more Minutes | 380 (3.5%) | 61 (0.7%) |
Time of Departure to Work by Sex in Arcadia
The most frequent times of departure to work in Arcadia are 8:00 AM to 8:29 AM (1,953, 18.0%) for males and 8:00 AM to 8:29 AM (1,770, 19.1%) for females.
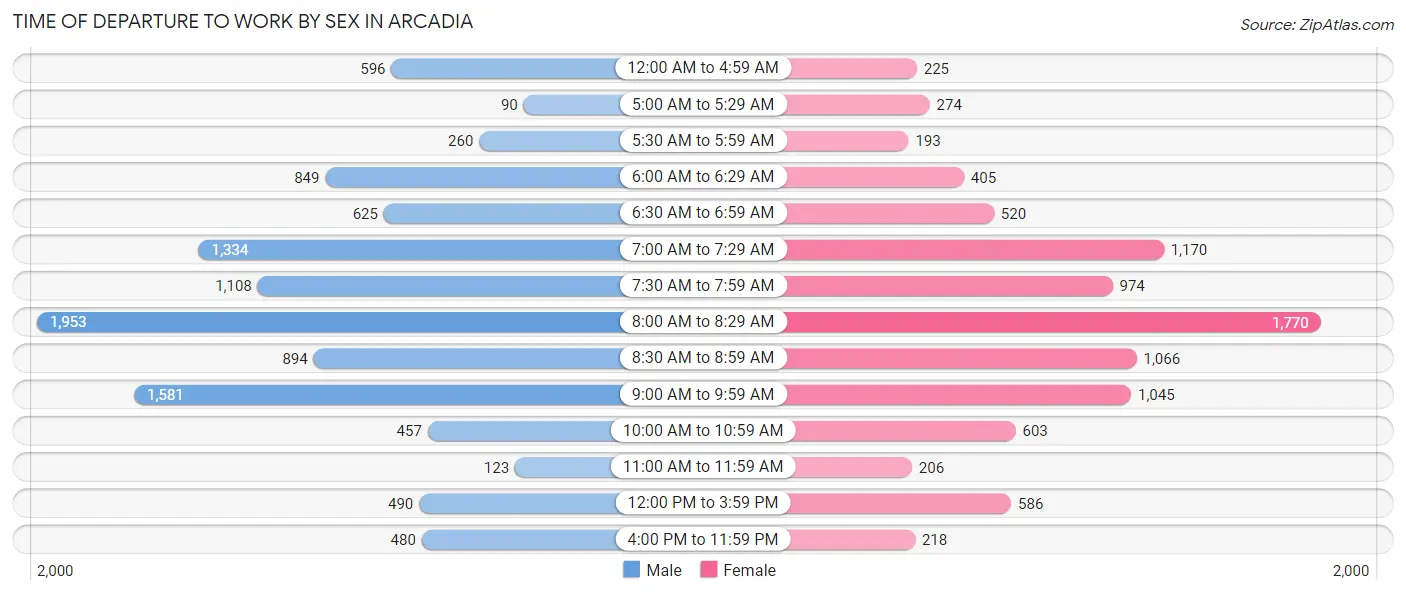
| Time of Departure | Male | Female |
| 12:00 AM to 4:59 AM | 596 (5.5%) | 225 (2.4%) |
| 5:00 AM to 5:29 AM | 90 (0.8%) | 274 (3.0%) |
| 5:30 AM to 5:59 AM | 260 (2.4%) | 193 (2.1%) |
| 6:00 AM to 6:29 AM | 849 (7.8%) | 405 (4.4%) |
| 6:30 AM to 6:59 AM | 625 (5.8%) | 520 (5.6%) |
| 7:00 AM to 7:29 AM | 1,334 (12.3%) | 1,170 (12.6%) |
| 7:30 AM to 7:59 AM | 1,108 (10.2%) | 974 (10.5%) |
| 8:00 AM to 8:29 AM | 1,953 (18.0%) | 1,770 (19.1%) |
| 8:30 AM to 8:59 AM | 894 (8.3%) | 1,066 (11.5%) |
| 9:00 AM to 9:59 AM | 1,581 (14.6%) | 1,045 (11.3%) |
| 10:00 AM to 10:59 AM | 457 (4.2%) | 603 (6.5%) |
| 11:00 AM to 11:59 AM | 123 (1.1%) | 206 (2.2%) |
| 12:00 PM to 3:59 PM | 490 (4.5%) | 586 (6.3%) |
| 4:00 PM to 11:59 PM | 480 (4.4%) | 218 (2.4%) |
| Total | 10,840 (100.0%) | 9,255 (100.0%) |
Housing Occupancy in Arcadia
Occupancy by Ownership in Arcadia
Of the total 19,412 dwellings in Arcadia, owner-occupied units account for 11,345 (58.4%), while renter-occupied units make up 8,067 (41.6%).
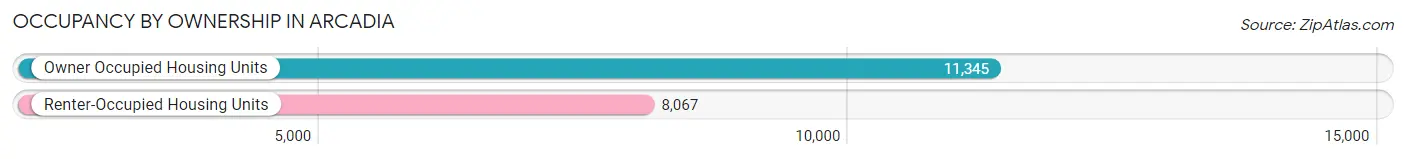
| Occupancy | # Housing Units | % Housing Units |
| Owner Occupied Housing Units | 11,345 | 58.4% |
| Renter-Occupied Housing Units | 8,067 | 41.6% |
| Total Occupied Housing Units | 19,412 | 100.0% |
Occupancy by Household Size in Arcadia
| Household Size | # Housing Units | % Housing Units |
| 1-Person Household | 3,355 | 17.3% |
| 2-Person Household | 6,609 | 34.1% |
| 3-Person Household | 4,362 | 22.5% |
| 4+ Person Household | 5,086 | 26.2% |
| Total Housing Units | 19,412 | 100.0% |
Occupancy by Ownership by Household Size in Arcadia
| Household Size | Owner-occupied | Renter-occupied |
| 1-Person Household | 1,345 (40.1%) | 2,010 (59.9%) |
| 2-Person Household | 4,073 (61.6%) | 2,536 (38.4%) |
| 3-Person Household | 2,613 (59.9%) | 1,749 (40.1%) |
| 4+ Person Household | 3,314 (65.2%) | 1,772 (34.8%) |
| Total Housing Units | 11,345 (58.4%) | 8,067 (41.6%) |
Occupancy by Educational Attainment in Arcadia
| Household Size | Owner-occupied | Renter-occupied |
| Less than High School | 260 (30.3%) | 597 (69.7%) |
| High School Diploma | 852 (30.1%) | 1,975 (69.9%) |
| College/Associate Degree | 1,974 (53.5%) | 1,714 (46.5%) |
| Bachelor's Degree or higher | 8,259 (68.6%) | 3,781 (31.4%) |
Occupancy by Age of Householder in Arcadia
| Age Bracket | # Households | % Households |
| Under 35 Years | 1,917 | 9.9% |
| 35 to 44 Years | 3,417 | 17.6% |
| 45 to 54 Years | 4,616 | 23.8% |
| 55 to 64 Years | 3,971 | 20.5% |
| 65 to 74 Years | 2,932 | 15.1% |
| 75 to 84 Years | 1,540 | 7.9% |
| 85 Years and Over | 1,019 | 5.2% |
| Total | 19,412 | 100.0% |
Housing Finances in Arcadia
Median Income by Occupancy in Arcadia
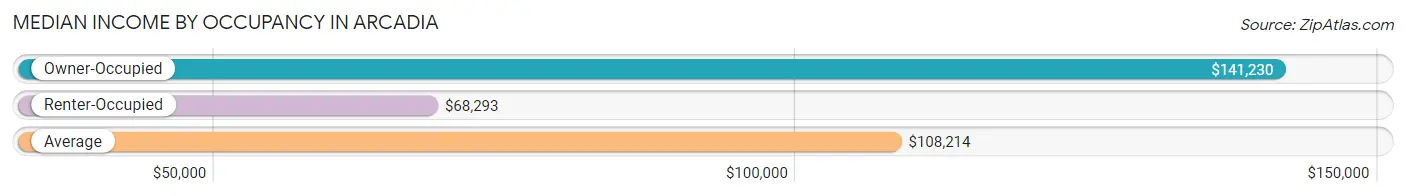
| Occupancy Type | # Households | Median Income |
| Owner-Occupied | 11,345 (58.4%) | $141,230 |
| Renter-Occupied | 8,067 (41.6%) | $68,293 |
| Average | 19,412 (100.0%) | $108,214 |
Occupancy by Householder Income Bracket in Arcadia
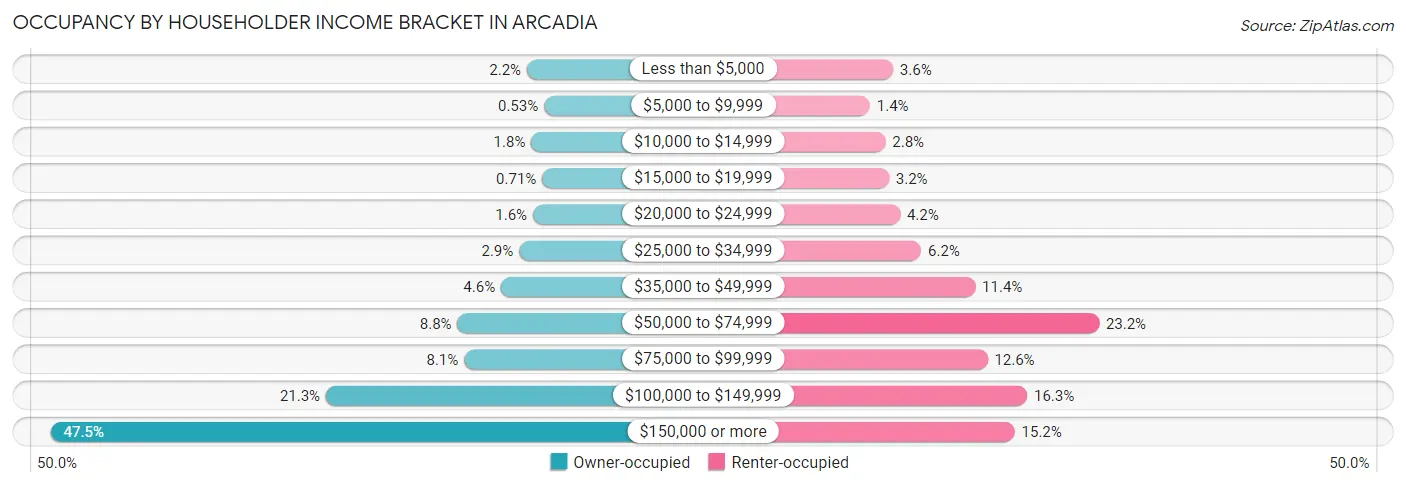
| Income Bracket | Owner-occupied | Renter-occupied |
| Less than $5,000 | 245 (2.2%) | 287 (3.6%) |
| $5,000 to $9,999 | 60 (0.5%) | 110 (1.4%) |
| $10,000 to $14,999 | 199 (1.8%) | 229 (2.8%) |
| $15,000 to $19,999 | 81 (0.7%) | 256 (3.2%) |
| $20,000 to $24,999 | 180 (1.6%) | 341 (4.2%) |
| $25,000 to $34,999 | 329 (2.9%) | 503 (6.2%) |
| $35,000 to $49,999 | 525 (4.6%) | 919 (11.4%) |
| $50,000 to $74,999 | 996 (8.8%) | 1,870 (23.2%) |
| $75,000 to $99,999 | 923 (8.1%) | 1,013 (12.6%) |
| $100,000 to $149,999 | 2,416 (21.3%) | 1,317 (16.3%) |
| $150,000 or more | 5,391 (47.5%) | 1,222 (15.1%) |
| Total | 11,345 (100.0%) | 8,067 (100.0%) |
Monthly Housing Cost Tiers in Arcadia
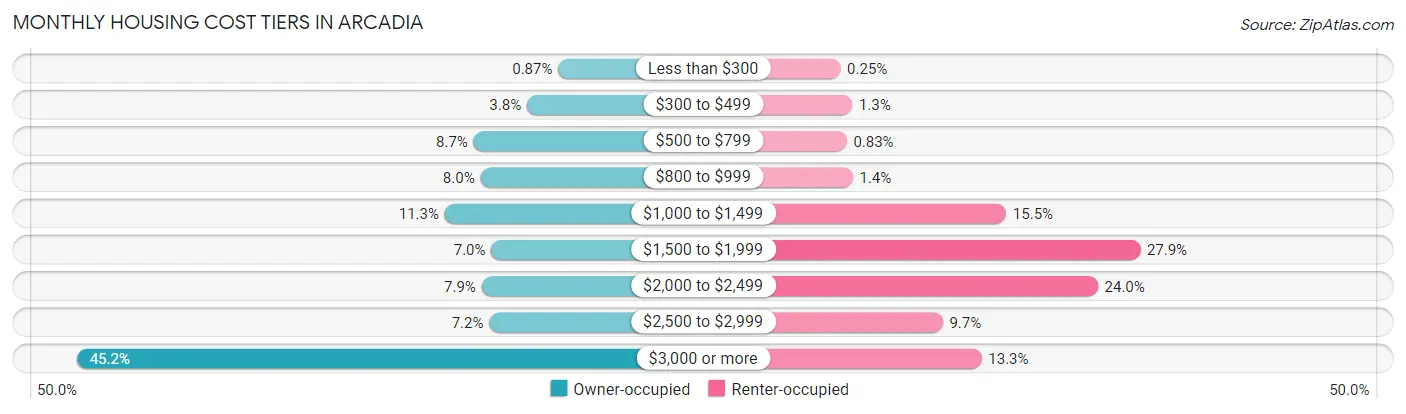
| Monthly Cost | Owner-occupied | Renter-occupied |
| Less than $300 | 99 (0.9%) | 20 (0.3%) |
| $300 to $499 | 426 (3.7%) | 108 (1.3%) |
| $500 to $799 | 982 (8.7%) | 67 (0.8%) |
| $800 to $999 | 911 (8.0%) | 112 (1.4%) |
| $1,000 to $1,499 | 1,284 (11.3%) | 1,251 (15.5%) |
| $1,500 to $1,999 | 798 (7.0%) | 2,247 (27.9%) |
| $2,000 to $2,499 | 898 (7.9%) | 1,932 (23.9%) |
| $2,500 to $2,999 | 819 (7.2%) | 780 (9.7%) |
| $3,000 or more | 5,128 (45.2%) | 1,069 (13.3%) |
| Total | 11,345 (100.0%) | 8,067 (100.0%) |
Physical Housing Characteristics in Arcadia
Housing Structures in Arcadia
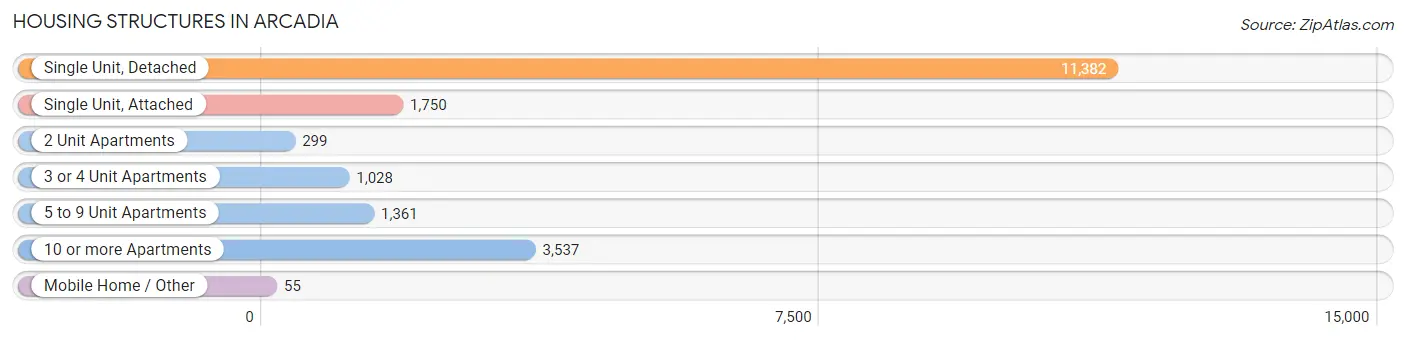
| Structure Type | # Housing Units | % Housing Units |
| Single Unit, Detached | 11,382 | 58.6% |
| Single Unit, Attached | 1,750 | 9.0% |
| 2 Unit Apartments | 299 | 1.5% |
| 3 or 4 Unit Apartments | 1,028 | 5.3% |
| 5 to 9 Unit Apartments | 1,361 | 7.0% |
| 10 or more Apartments | 3,537 | 18.2% |
| Mobile Home / Other | 55 | 0.3% |
| Total | 19,412 | 100.0% |
Housing Structures by Occupancy in Arcadia
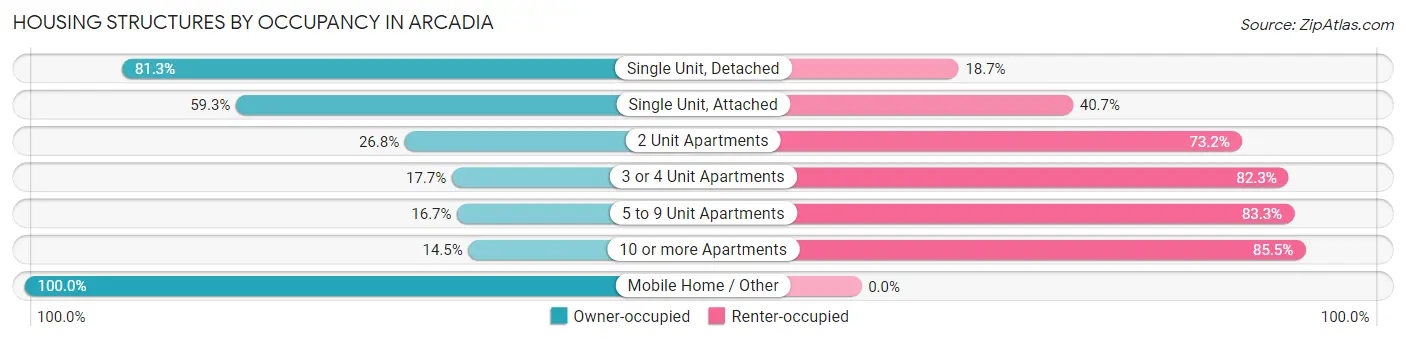
| Structure Type | Owner-occupied | Renter-occupied |
| Single Unit, Detached | 9,250 (81.3%) | 2,132 (18.7%) |
| Single Unit, Attached | 1,037 (59.3%) | 713 (40.7%) |
| 2 Unit Apartments | 80 (26.8%) | 219 (73.2%) |
| 3 or 4 Unit Apartments | 182 (17.7%) | 846 (82.3%) |
| 5 to 9 Unit Apartments | 227 (16.7%) | 1,134 (83.3%) |
| 10 or more Apartments | 514 (14.5%) | 3,023 (85.5%) |
| Mobile Home / Other | 55 (100.0%) | 0 (0.0%) |
| Total | 11,345 (58.4%) | 8,067 (41.6%) |
Housing Structures by Number of Rooms in Arcadia
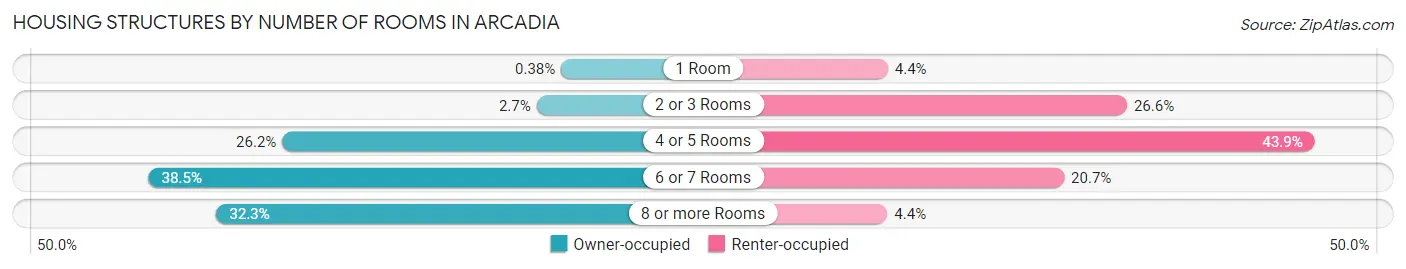
| Number of Rooms | Owner-occupied | Renter-occupied |
| 1 Room | 43 (0.4%) | 357 (4.4%) |
| 2 or 3 Rooms | 301 (2.6%) | 2,142 (26.6%) |
| 4 or 5 Rooms | 2,970 (26.2%) | 3,541 (43.9%) |
| 6 or 7 Rooms | 4,371 (38.5%) | 1,673 (20.7%) |
| 8 or more Rooms | 3,660 (32.3%) | 354 (4.4%) |
| Total | 11,345 (100.0%) | 8,067 (100.0%) |
Housing Structure by Heating Type in Arcadia
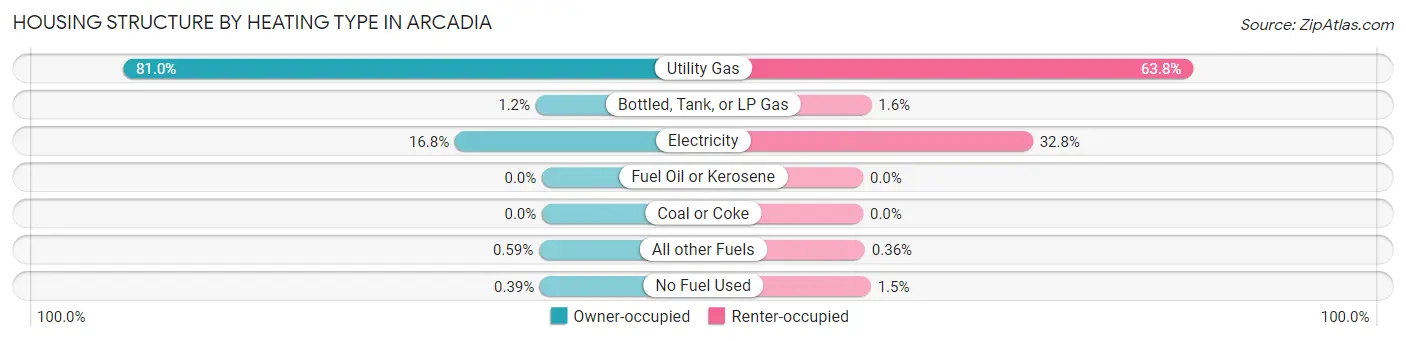
| Heating Type | Owner-occupied | Renter-occupied |
| Utility Gas | 9,188 (81.0%) | 5,145 (63.8%) |
| Bottled, Tank, or LP Gas | 137 (1.2%) | 130 (1.6%) |
| Electricity | 1,909 (16.8%) | 2,644 (32.8%) |
| Fuel Oil or Kerosene | 0 (0.0%) | 0 (0.0%) |
| Coal or Coke | 0 (0.0%) | 0 (0.0%) |
| All other Fuels | 67 (0.6%) | 29 (0.4%) |
| No Fuel Used | 44 (0.4%) | 119 (1.5%) |
| Total | 11,345 (100.0%) | 8,067 (100.0%) |
Household Vehicle Usage in Arcadia
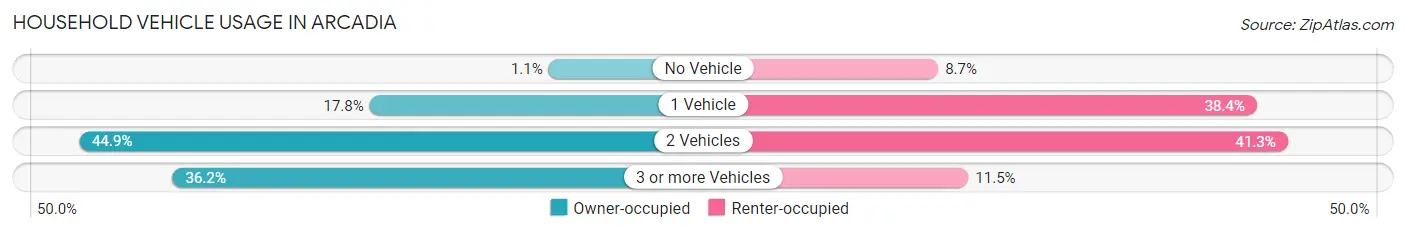
| Vehicles per Household | Owner-occupied | Renter-occupied |
| No Vehicle | 124 (1.1%) | 703 (8.7%) |
| 1 Vehicle | 2,019 (17.8%) | 3,101 (38.4%) |
| 2 Vehicles | 5,096 (44.9%) | 3,333 (41.3%) |
| 3 or more Vehicles | 4,106 (36.2%) | 930 (11.5%) |
| Total | 11,345 (100.0%) | 8,067 (100.0%) |
Real Estate & Mortgages in Arcadia
Real Estate and Mortgage Overview in Arcadia
| Characteristic | Without Mortgage | With Mortgage |
| Housing Units | 5,084 | 6,261 |
| Median Property Value | $1,308,200 | $1,305,500 |
| Median Household Income | $117,014 | $3,462 |
| Monthly Housing Costs | $1,098 | $4,671 |
| Real Estate Taxes | $7,782 | $101 |
Property Value by Mortgage Status in Arcadia
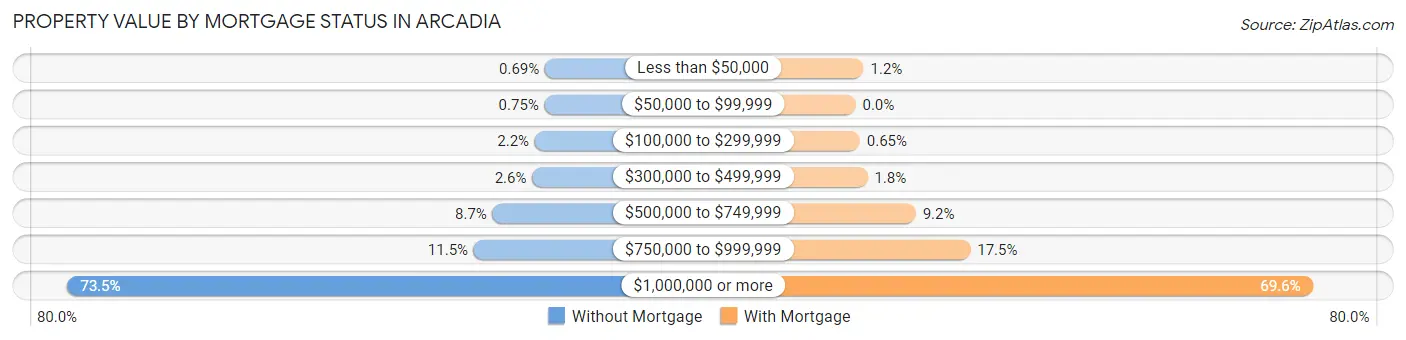
| Property Value | Without Mortgage | With Mortgage |
| Less than $50,000 | 35 (0.7%) | 77 (1.2%) |
| $50,000 to $99,999 | 38 (0.7%) | 0 (0.0%) |
| $100,000 to $299,999 | 114 (2.2%) | 41 (0.6%) |
| $300,000 to $499,999 | 134 (2.6%) | 114 (1.8%) |
| $500,000 to $749,999 | 441 (8.7%) | 574 (9.2%) |
| $750,000 to $999,999 | 586 (11.5%) | 1,095 (17.5%) |
| $1,000,000 or more | 3,736 (73.5%) | 4,360 (69.6%) |
| Total | 5,084 (100.0%) | 6,261 (100.0%) |
Household Income by Mortgage Status in Arcadia
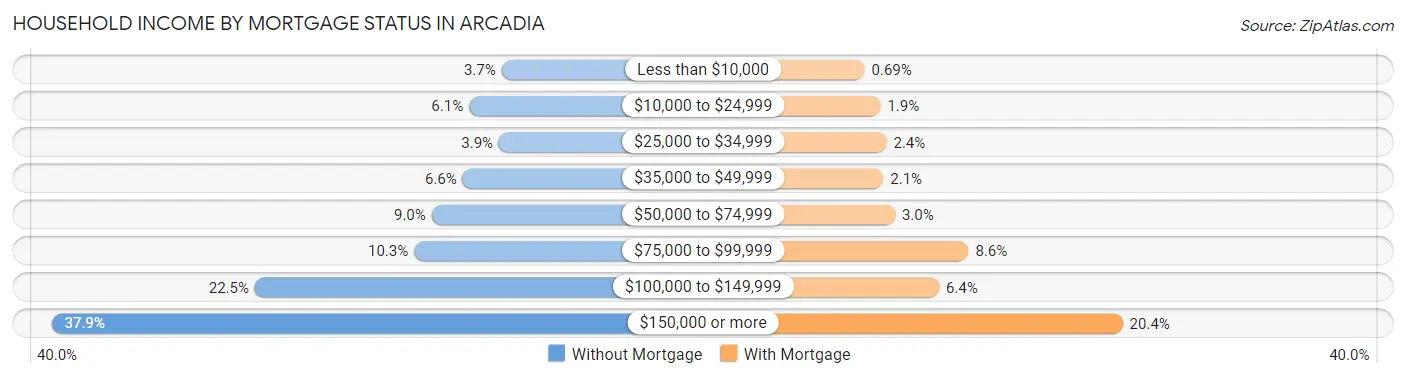
| Household Income | Without Mortgage | With Mortgage |
| Less than $10,000 | 186 (3.7%) | 43 (0.7%) |
| $10,000 to $24,999 | 312 (6.1%) | 119 (1.9%) |
| $25,000 to $34,999 | 196 (3.9%) | 148 (2.4%) |
| $35,000 to $49,999 | 337 (6.6%) | 133 (2.1%) |
| $50,000 to $74,999 | 457 (9.0%) | 188 (3.0%) |
| $75,000 to $99,999 | 525 (10.3%) | 539 (8.6%) |
| $100,000 to $149,999 | 1,142 (22.5%) | 398 (6.4%) |
| $150,000 or more | 1,929 (37.9%) | 1,274 (20.3%) |
| Total | 5,084 (100.0%) | 6,261 (100.0%) |
Property Value to Household Income Ratio in Arcadia
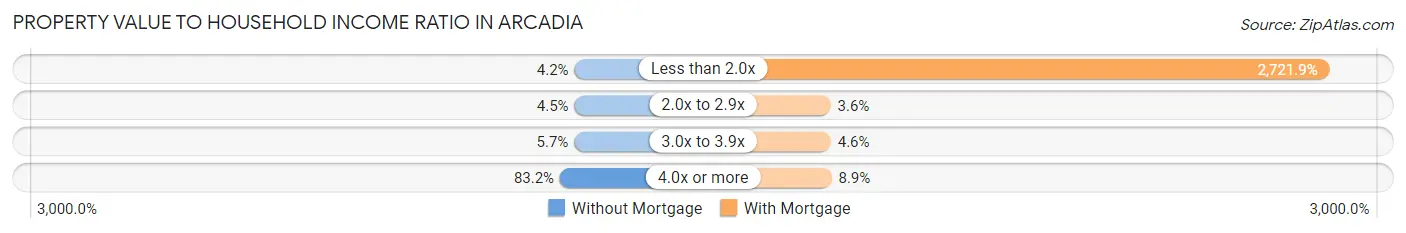
| Value-to-Income Ratio | Without Mortgage | With Mortgage |
| Less than 2.0x | 215 (4.2%) | 170,417 (2,721.9%) |
| 2.0x to 2.9x | 231 (4.5%) | 223 (3.6%) |
| 3.0x to 3.9x | 287 (5.7%) | 289 (4.6%) |
| 4.0x or more | 4,232 (83.2%) | 559 (8.9%) |
| Total | 5,084 (100.0%) | 6,261 (100.0%) |
Real Estate Taxes by Mortgage Status in Arcadia
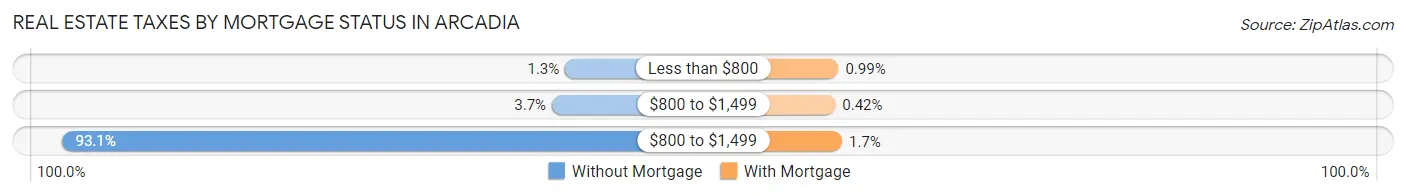
| Property Taxes | Without Mortgage | With Mortgage |
| Less than $800 | 65 (1.3%) | 62 (1.0%) |
| $800 to $1,499 | 187 (3.7%) | 26 (0.4%) |
| $800 to $1,499 | 4,731 (93.1%) | 103 (1.7%) |
| Total | 5,084 (100.0%) | 6,261 (100.0%) |
Health & Disability in Arcadia
Health Insurance Coverage by Age in Arcadia
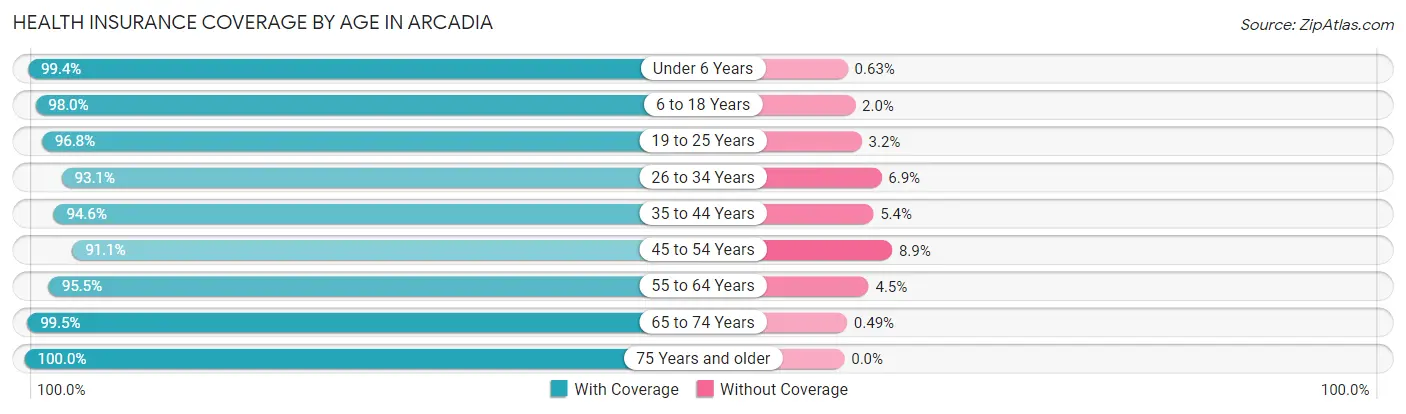
| Age Bracket | With Coverage | Without Coverage |
| Under 6 Years | 2,823 (99.4%) | 18 (0.6%) |
| 6 to 18 Years | 9,474 (98.0%) | 194 (2.0%) |
| 19 to 25 Years | 3,598 (96.8%) | 120 (3.2%) |
| 26 to 34 Years | 5,203 (93.1%) | 386 (6.9%) |
| 35 to 44 Years | 6,503 (94.6%) | 371 (5.4%) |
| 45 to 54 Years | 7,856 (91.1%) | 767 (8.9%) |
| 55 to 64 Years | 7,438 (95.5%) | 352 (4.5%) |
| 65 to 74 Years | 5,644 (99.5%) | 28 (0.5%) |
| 75 Years and older | 4,995 (100.0%) | 0 (0.0%) |
| Total | 53,534 (96.0%) | 2,236 (4.0%) |
Health Insurance Coverage by Citizenship Status in Arcadia

| Citizenship Status | With Coverage | Without Coverage |
| Native Born | 2,823 (99.4%) | 18 (0.6%) |
| Foreign Born, Citizen | 9,474 (98.0%) | 194 (2.0%) |
| Foreign Born, not a Citizen | 3,598 (96.8%) | 120 (3.2%) |
Health Insurance Coverage by Household Income in Arcadia
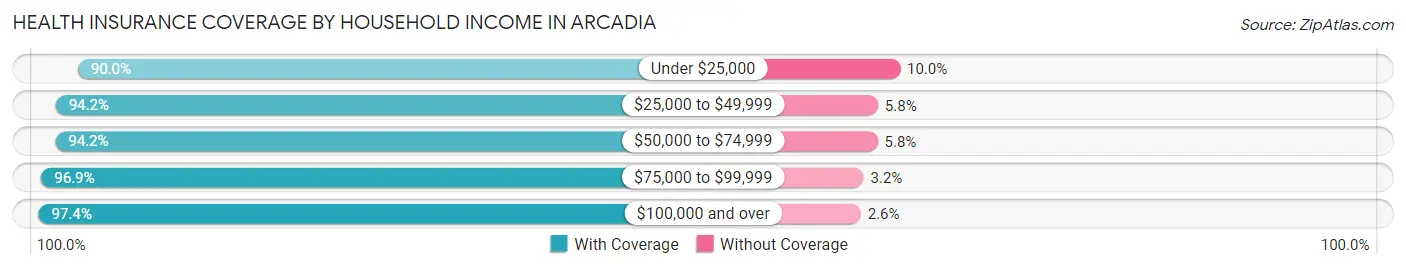
| Household Income | With Coverage | Without Coverage |
| Under $25,000 | 3,847 (90.0%) | 426 (10.0%) |
| $25,000 to $49,999 | 5,269 (94.2%) | 326 (5.8%) |
| $50,000 to $74,999 | 7,072 (94.2%) | 433 (5.8%) |
| $75,000 to $99,999 | 4,514 (96.9%) | 147 (3.2%) |
| $100,000 and over | 32,437 (97.4%) | 874 (2.6%) |
Public vs Private Health Insurance Coverage by Age in Arcadia
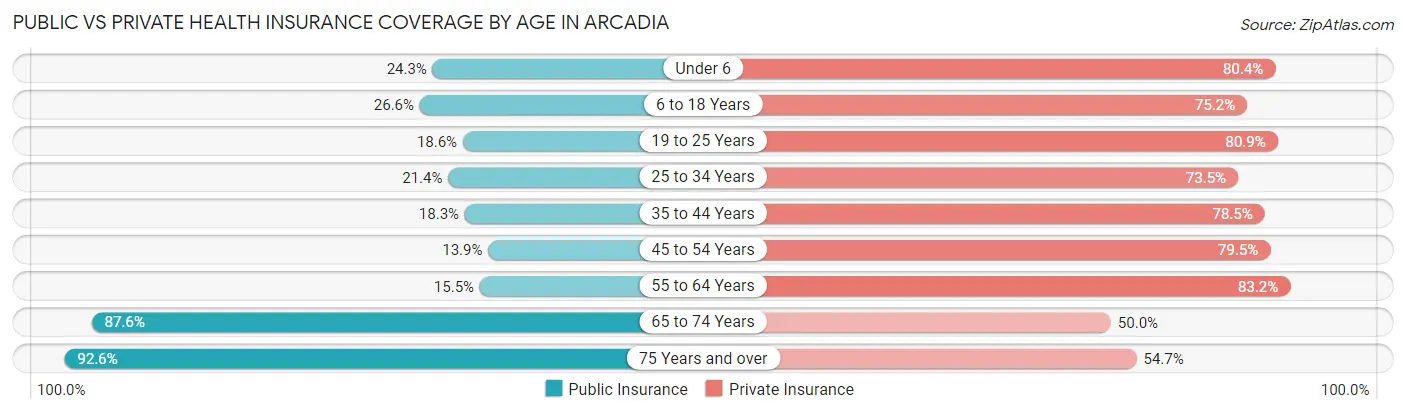
| Age Bracket | Public Insurance | Private Insurance |
| Under 6 | 689 (24.2%) | 2,285 (80.4%) |
| 6 to 18 Years | 2,575 (26.6%) | 7,273 (75.2%) |
| 19 to 25 Years | 693 (18.6%) | 3,007 (80.9%) |
| 25 to 34 Years | 1,194 (21.4%) | 4,109 (73.5%) |
| 35 to 44 Years | 1,256 (18.3%) | 5,395 (78.5%) |
| 45 to 54 Years | 1,201 (13.9%) | 6,855 (79.5%) |
| 55 to 64 Years | 1,207 (15.5%) | 6,482 (83.2%) |
| 65 to 74 Years | 4,967 (87.6%) | 2,833 (49.9%) |
| 75 Years and over | 4,626 (92.6%) | 2,733 (54.7%) |
| Total | 18,408 (33.0%) | 40,972 (73.5%) |
Disability Status by Sex by Age in Arcadia
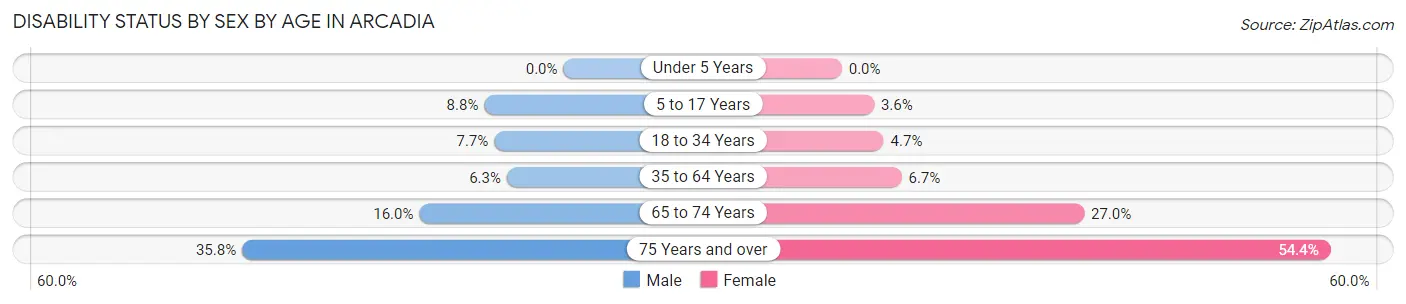
| Age Bracket | Male | Female |
| Under 5 Years | 0 (0.0%) | 0 (0.0%) |
| 5 to 17 Years | 396 (8.8%) | 178 (3.6%) |
| 18 to 34 Years | 434 (7.7%) | 205 (4.7%) |
| 35 to 64 Years | 680 (6.3%) | 831 (6.7%) |
| 65 to 74 Years | 459 (16.0%) | 758 (27.0%) |
| 75 Years and over | 829 (35.8%) | 1,458 (54.4%) |
Disability Class by Sex by Age in Arcadia
Disability Class: Hearing Difficulty
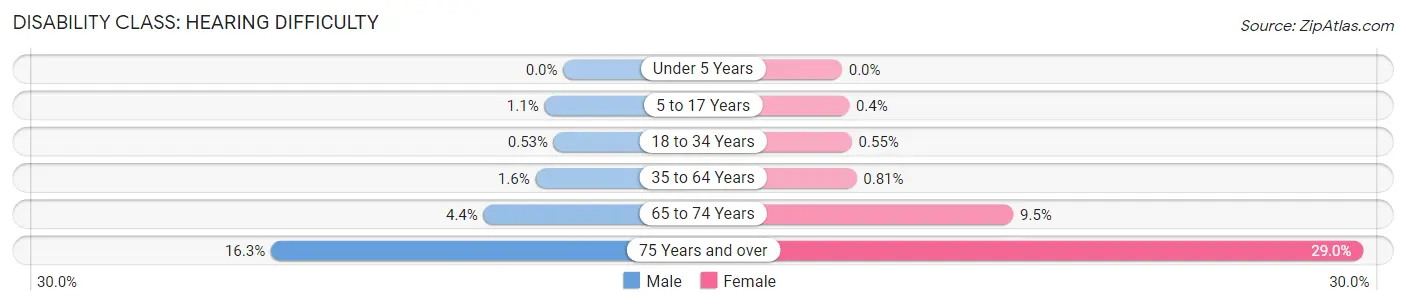
| Age Bracket | Male | Female |
| Under 5 Years | 0 (0.0%) | 0 (0.0%) |
| 5 to 17 Years | 47 (1.1%) | 20 (0.4%) |
| 18 to 34 Years | 30 (0.5%) | 24 (0.5%) |
| 35 to 64 Years | 167 (1.5%) | 101 (0.8%) |
| 65 to 74 Years | 127 (4.4%) | 268 (9.5%) |
| 75 Years and over | 377 (16.3%) | 778 (29.0%) |
Disability Class: Vision Difficulty
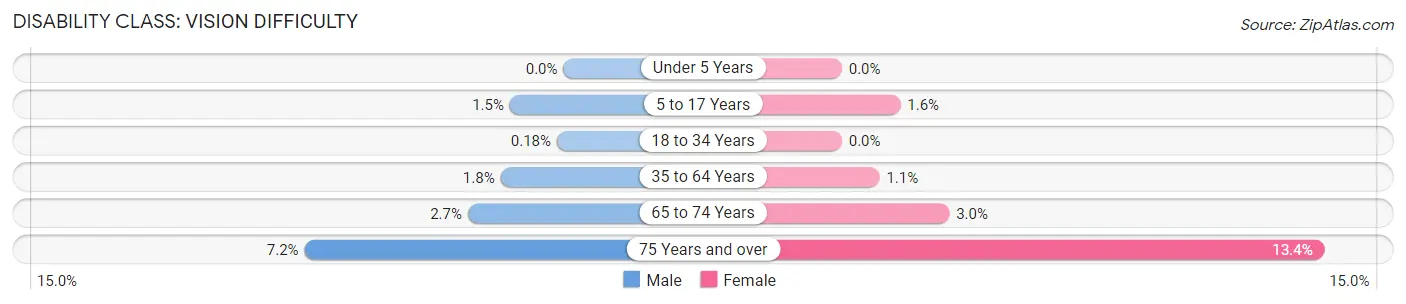
| Age Bracket | Male | Female |
| Under 5 Years | 0 (0.0%) | 0 (0.0%) |
| 5 to 17 Years | 67 (1.5%) | 81 (1.6%) |
| 18 to 34 Years | 10 (0.2%) | 0 (0.0%) |
| 35 to 64 Years | 189 (1.8%) | 131 (1.1%) |
| 65 to 74 Years | 76 (2.7%) | 84 (3.0%) |
| 75 Years and over | 167 (7.2%) | 360 (13.4%) |
Disability Class: Cognitive Difficulty
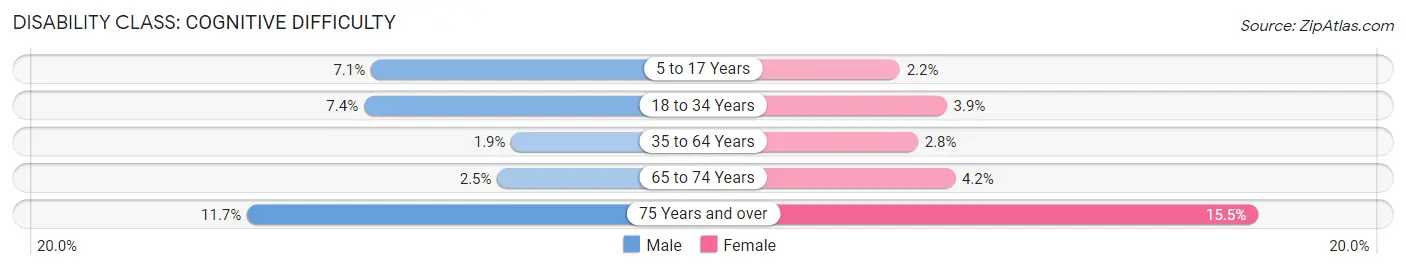
| Age Bracket | Male | Female |
| 5 to 17 Years | 321 (7.1%) | 107 (2.1%) |
| 18 to 34 Years | 417 (7.4%) | 171 (3.9%) |
| 35 to 64 Years | 208 (1.9%) | 352 (2.8%) |
| 65 to 74 Years | 70 (2.5%) | 118 (4.2%) |
| 75 Years and over | 272 (11.7%) | 414 (15.4%) |
Disability Class: Ambulatory Difficulty
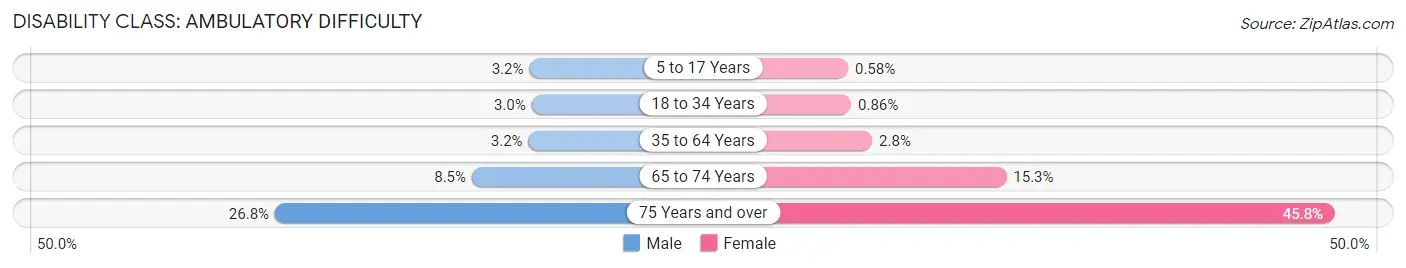
| Age Bracket | Male | Female |
| 5 to 17 Years | 142 (3.2%) | 29 (0.6%) |
| 18 to 34 Years | 166 (2.9%) | 38 (0.9%) |
| 35 to 64 Years | 350 (3.2%) | 352 (2.8%) |
| 65 to 74 Years | 243 (8.5%) | 429 (15.3%) |
| 75 Years and over | 620 (26.8%) | 1,226 (45.8%) |
Disability Class: Self-Care Difficulty
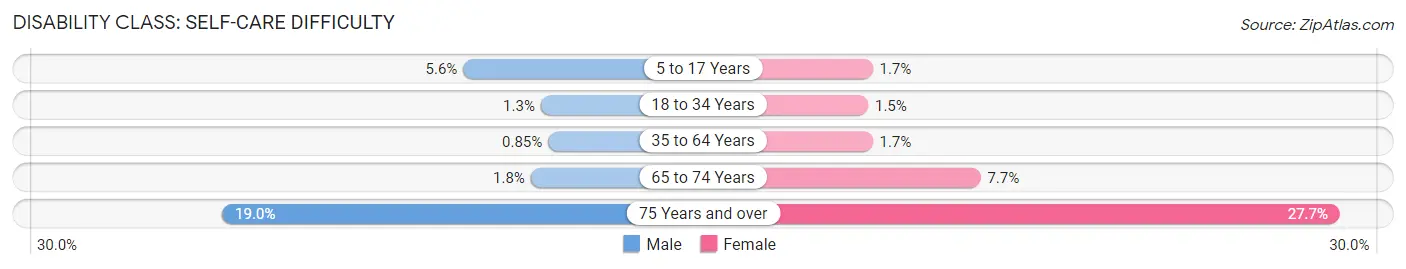
| Age Bracket | Male | Female |
| 5 to 17 Years | 251 (5.6%) | 85 (1.7%) |
| 18 to 34 Years | 71 (1.3%) | 64 (1.5%) |
| 35 to 64 Years | 92 (0.9%) | 214 (1.7%) |
| 65 to 74 Years | 52 (1.8%) | 217 (7.7%) |
| 75 Years and over | 440 (19.0%) | 743 (27.7%) |
Technology Access in Arcadia
Computing Device Access in Arcadia
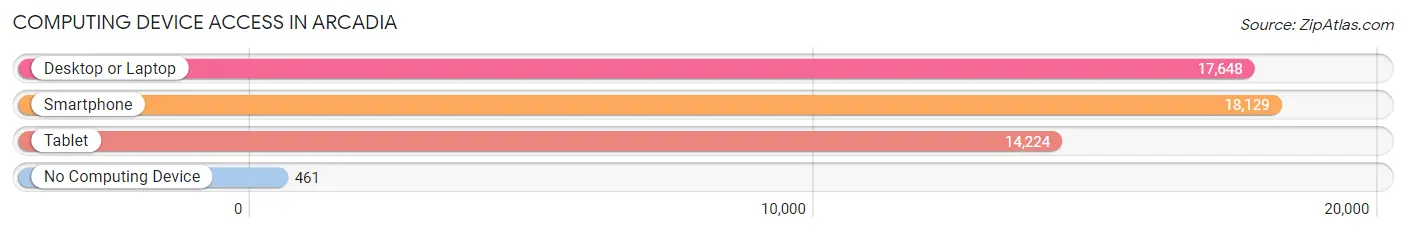
| Device Type | # Households | % Households |
| Desktop or Laptop | 17,648 | 90.9% |
| Smartphone | 18,129 | 93.4% |
| Tablet | 14,224 | 73.3% |
| No Computing Device | 461 | 2.4% |
| Total | 19,412 | 100.0% |
Internet Access in Arcadia
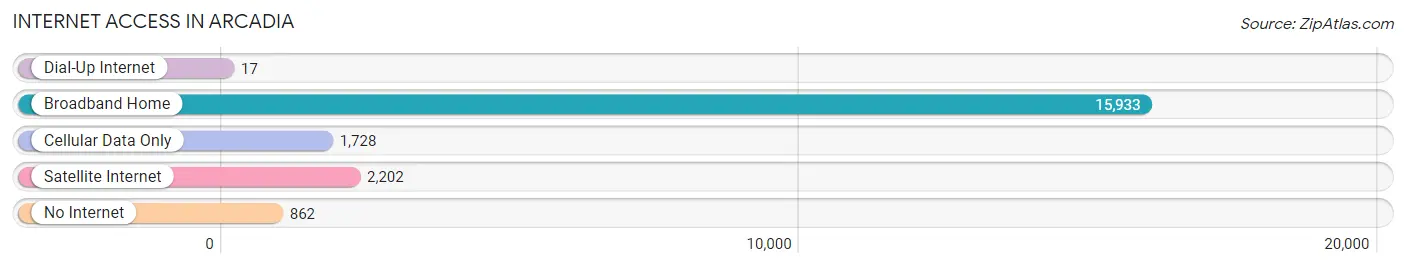
| Internet Type | # Households | % Households |
| Dial-Up Internet | 17 | 0.1% |
| Broadband Home | 15,933 | 82.1% |
| Cellular Data Only | 1,728 | 8.9% |
| Satellite Internet | 2,202 | 11.3% |
| No Internet | 862 | 4.4% |
| Total | 19,412 | 100.0% |
Arcadia Summary
Arcadia is a city located in Los Angeles County, California, United States. It is located about 13 miles northeast of downtown Los Angeles and is part of the San Gabriel Valley. The city has a population of approximately 57,000 people and is known for its tree-lined streets, historic homes, and high-end shopping.
History
Arcadia was founded in 1903 by Elias Jackson "Lucky" Baldwin, a wealthy real estate developer from San Francisco. Baldwin purchased over 8,000 acres of land in the San Gabriel Valley and named the area after the Greek city of Arcadia. He built a racetrack, a hotel, and a number of homes in the area. The city was incorporated in 1903 and has since grown to become one of the most affluent cities in Los Angeles County.
Geography
Arcadia is located in the San Gabriel Valley, about 13 miles northeast of downtown Los Angeles. The city is bordered by the cities of Pasadena, Sierra Madre, and Monrovia. The city has a total area of 11.2 square miles, of which 11.1 square miles is land and 0.1 square miles is water. The city is located at the base of the San Gabriel Mountains and is home to the Los Angeles County Arboretum and Botanic Garden.
Economy
Arcadia is a major economic center in the San Gabriel Valley. The city is home to a number of corporate headquarters, including the headquarters of the Santa Anita Racetrack, the Los Angeles County Arboretum and Botanic Garden, and the Arcadia Chamber of Commerce. The city is also home to a number of shopping centers, including the Westfield Santa Anita Mall and the Arcadia Shopping Center.
Demographics
As of the 2010 census, Arcadia had a population of 57,364 people. The racial makeup of the city was 57.2% White, 1.2% African American, 0.3% Native American, 33.2% Asian, 0.1% Pacific Islander, 4.7% from other races, and 3.3% from two or more races. The median household income in Arcadia was $87,821, and the median family income was $101,964. The per capita income in Arcadia was $41,818.
Arcadia is a diverse city with a variety of cultures and backgrounds. The city is home to a large Chinese-American population, as well as a large Korean-American population. The city is also home to a large Filipino-American population, as well as a large Japanese-American population. The city is also home to a large number of immigrants from other countries, including India, Vietnam, and Mexico.
Common Questions
What is Per Capita Income in Arcadia?
Per Capita income in Arcadia is $53,959.
What is the Median Family Income in Arcadia?
Median Family Income in Arcadia is $118,817.
What is the Median Household income in Arcadia?
Median Household Income in Arcadia is $108,214.
What is Income or Wage Gap in Arcadia?
Income or Wage Gap in Arcadia is 28.8%.
Women in Arcadia earn 71.2 cents for every dollar earned by a man.
What is Family Income Deficit in Arcadia?
Family Income Deficit in Arcadia is $12,992.
Families that are below poverty line in Arcadia earn $12,992 less on average than the poverty threshold level.
What is Inequality or Gini Index in Arcadia?
Inequality or Gini Index in Arcadia is 0.49.
What is the Total Population of Arcadia?
Total Population of Arcadia is 56,181.
What is the Total Male Population of Arcadia?
Total Male Population of Arcadia is 27,247.
What is the Total Female Population of Arcadia?
Total Female Population of Arcadia is 28,934.
What is the Ratio of Males per 100 Females in Arcadia?
There are 94.17 Males per 100 Females in Arcadia.
What is the Ratio of Females per 100 Males in Arcadia?
There are 106.19 Females per 100 Males in Arcadia.
What is the Median Population Age in Arcadia?
Median Population Age in Arcadia is 44.1 Years.
What is the Average Family Size in Arcadia
Average Family Size in Arcadia is 3.2 People.
What is the Average Household Size in Arcadia
Average Household Size in Arcadia is 2.9 People.
How Large is the Labor Force in Arcadia?
There are 26,996 People in the Labor Forcein in Arcadia.
What is the Percentage of People in the Labor Force in Arcadia?
59.0% of People are in the Labor Force in Arcadia.
What is the Unemployment Rate in Arcadia?
Unemployment Rate in Arcadia is 5.4%.