Cities with the Lowest Percentage of Births to Unmarried Women over the Age of 35 in Texas
RELATED REPORTS & OPTIONS
Lowest Illegitimacy | Women 35+
Texas
Compare Cities
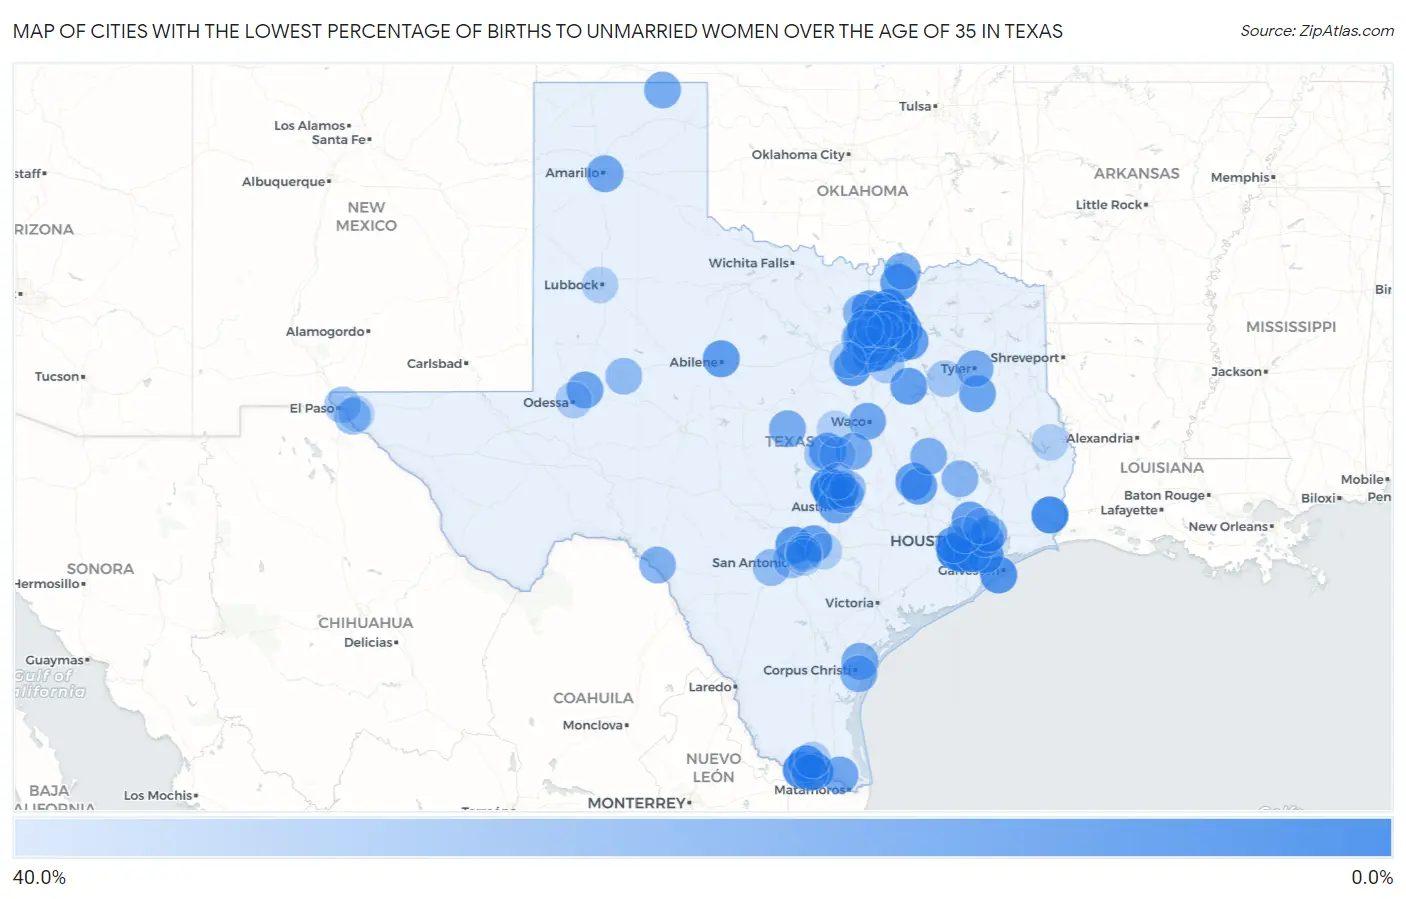
Map of Cities with the Lowest Percentage of Births to Unmarried Women over the Age of 35 in Texas
40.0%
0.0%
Cities with the Lowest Percentage of Births to Unmarried Women over the Age of 35 in Texas
| City | % Unmarried | vs State | vs National | |
| 1. | Sugar Land | 0.20% | 19.4%(-19.2)#1 | 20.1%(-19.9)#1 |
| 2. | Missouri City | 1.1% | 19.4%(-18.3)#2 | 20.1%(-19.0)#6 |
| 3. | Frisco | 3.2% | 19.4%(-16.2)#3 | 20.1%(-16.9)#50 |
| 4. | Richardson | 3.4% | 19.4%(-16.0)#4 | 20.1%(-16.7)#55 |
| 5. | Leander | 3.4% | 19.4%(-16.0)#5 | 20.1%(-16.7)#57 |
| 6. | Vidor | 3.6% | 19.4%(-15.8)#6 | 20.1%(-16.5)#69 |
| 7. | Mansfield | 4.4% | 19.4%(-15.0)#7 | 20.1%(-15.7)#87 |
| 8. | Allen | 4.8% | 19.4%(-14.6)#8 | 20.1%(-15.3)#106 |
| 9. | Mission | 5.0% | 19.4%(-14.4)#9 | 20.1%(-15.1)#117 |
| 10. | Cedar Park | 5.1% | 19.4%(-14.3)#10 | 20.1%(-15.0)#123 |
| 11. | Alamo | 5.3% | 19.4%(-14.1)#11 | 20.1%(-14.8)#133 |
| 12. | Prosper | 7.0% | 19.4%(-12.4)#12 | 20.1%(-13.1)#208 |
| 13. | Galveston | 7.8% | 19.4%(-11.6)#13 | 20.1%(-12.3)#244 |
| 14. | Webster | 7.8% | 19.4%(-11.6)#14 | 20.1%(-12.3)#247 |
| 15. | Round Rock | 8.2% | 19.4%(-11.2)#15 | 20.1%(-11.9)#265 |
| 16. | Carrollton | 8.8% | 19.4%(-10.6)#16 | 20.1%(-11.3)#294 |
| 17. | Mcallen | 9.1% | 19.4%(-10.3)#17 | 20.1%(-11.0)#303 |
| 18. | Pearland | 9.4% | 19.4%(-10.00)#18 | 20.1%(-10.7)#317 |
| 19. | Denton | 9.7% | 19.4%(-9.70)#19 | 20.1%(-10.4)#330 |
| 20. | Channelview | 10.0% | 19.4%(-9.40)#20 | 20.1%(-10.1)#346 |
| 21. | Cleburne | 10.0% | 19.4%(-9.40)#21 | 20.1%(-10.1)#347 |
| 22. | Timberwood Park | 10.1% | 19.4%(-9.30)#22 | 20.1%(-10.0)#354 |
| 23. | Rowlett | 10.5% | 19.4%(-8.90)#23 | 20.1%(-9.60)#368 |
| 24. | North Richland Hills | 10.7% | 19.4%(-8.70)#24 | 20.1%(-9.40)#378 |
| 25. | Abilene | 11.4% | 19.4%(-8.00)#25 | 20.1%(-8.70)#404 |
| 26. | Flower Mound | 11.5% | 19.4%(-7.90)#26 | 20.1%(-8.60)#413 |
| 27. | Balch Springs | 11.9% | 19.4%(-7.50)#27 | 20.1%(-8.20)#428 |
| 28. | Corsicana | 12.0% | 19.4%(-7.40)#28 | 20.1%(-8.10)#434 |
| 29. | Sherman | 12.2% | 19.4%(-7.20)#29 | 20.1%(-7.90)#443 |
| 30. | Mission Bend | 12.4% | 19.4%(-7.00)#30 | 20.1%(-7.70)#456 |
| 31. | Murphy | 12.7% | 19.4%(-6.70)#31 | 20.1%(-7.40)#473 |
| 32. | The Colony | 12.8% | 19.4%(-6.60)#32 | 20.1%(-7.30)#478 |
| 33. | Bryan | 12.9% | 19.4%(-6.50)#33 | 20.1%(-7.20)#485 |
| 34. | New Braunfels | 13.1% | 19.4%(-6.30)#34 | 20.1%(-7.00)#494 |
| 35. | Forney | 13.1% | 19.4%(-6.30)#35 | 20.1%(-7.00)#499 |
| 36. | Spring | 13.5% | 19.4%(-5.90)#36 | 20.1%(-6.60)#517 |
| 37. | Hurst | 13.6% | 19.4%(-5.80)#37 | 20.1%(-6.50)#525 |
| 38. | Bedford | 14.0% | 19.4%(-5.40)#38 | 20.1%(-6.10)#549 |
| 39. | College Station | 14.2% | 19.4%(-5.20)#39 | 20.1%(-5.90)#560 |
| 40. | Copperas Cove | 14.2% | 19.4%(-5.20)#40 | 20.1%(-5.90)#563 |
| 41. | Cedar Hill | 14.6% | 19.4%(-4.80)#41 | 20.1%(-5.50)#587 |
| 42. | Jacksonville | 15.0% | 19.4%(-4.40)#42 | 20.1%(-5.10)#616 |
| 43. | Austin | 15.1% | 19.4%(-4.30)#43 | 20.1%(-5.00)#617 |
| 44. | Midland | 15.3% | 19.4%(-4.10)#44 | 20.1%(-4.80)#633 |
| 45. | San Benito | 15.8% | 19.4%(-3.60)#45 | 20.1%(-4.30)#664 |
| 46. | Amarillo | 15.9% | 19.4%(-3.50)#46 | 20.1%(-4.20)#667 |
| 47. | Waco | 16.1% | 19.4%(-3.30)#47 | 20.1%(-4.00)#676 |
| 48. | Garland | 16.6% | 19.4%(-2.80)#48 | 20.1%(-3.50)#703 |
| 49. | Denison | 17.3% | 19.4%(-2.10)#49 | 20.1%(-2.80)#745 |
| 50. | Tyler | 17.4% | 19.4%(-2.00)#50 | 20.1%(-2.70)#751 |
| 51. | Temple | 17.9% | 19.4%(-1.50)#51 | 20.1%(-2.20)#770 |
| 52. | Portland | 17.9% | 19.4%(-1.50)#52 | 20.1%(-2.20)#772 |
| 53. | Pharr | 18.0% | 19.4%(-1.40)#53 | 20.1%(-2.10)#783 |
| 54. | Perryton | 18.2% | 19.4%(-1.20)#54 | 20.1%(-1.90)#795 |
| 55. | Goldthwaite | 18.2% | 19.4%(-1.20)#55 | 20.1%(-1.90)#798 |
| 56. | Corpus Christi | 19.3% | 19.4%(-0.100)#56 | 20.1%(-0.800)#841 |
| 57. | Dallas | 19.5% | 19.4%(+0.100)#57 | 20.1%(-0.600)#848 |
| 58. | Lewisville | 19.7% | 19.4%(+0.300)#58 | 20.1%(-0.400)#862 |
| 59. | Normangee | 20.0% | 19.4%(+0.600)#59 | 20.1%(-0.100)#877 |
| 60. | Pflugerville | 20.5% | 19.4%(+1.10)#60 | 20.1%(+0.400)#902 |
| 61. | Del Rio | 20.8% | 19.4%(+1.40)#61 | 20.1%(+0.700)#919 |
| 62. | Barrett | 21.1% | 19.4%(+1.70)#62 | 20.1%(+1.00)#939 |
| 63. | Grand Prairie | 21.3% | 19.4%(+1.90)#63 | 20.1%(+1.20)#942 |
| 64. | Haltom City | 22.2% | 19.4%(+2.80)#64 | 20.1%(+2.10)#988 |
| 65. | Ponder | 22.2% | 19.4%(+2.80)#65 | 20.1%(+2.10)#995 |
| 66. | Huntsville | 22.4% | 19.4%(+3.00)#66 | 20.1%(+2.30)#1,002 |
| 67. | Fort Worth | 23.1% | 19.4%(+3.70)#67 | 20.1%(+3.00)#1,022 |
| 68. | Euless | 23.7% | 19.4%(+4.30)#68 | 20.1%(+3.60)#1,058 |
| 69. | Burleson | 24.5% | 19.4%(+5.10)#69 | 20.1%(+4.40)#1,083 |
| 70. | Little Elm | 25.0% | 19.4%(+5.60)#70 | 20.1%(+4.90)#1,101 |
| 71. | Castroville | 25.0% | 19.4%(+5.60)#71 | 20.1%(+4.90)#1,110 |
| 72. | Big Spring | 25.4% | 19.4%(+6.00)#72 | 20.1%(+5.30)#1,128 |
| 73. | Irving | 25.7% | 19.4%(+6.30)#73 | 20.1%(+5.60)#1,138 |
| 74. | Socorro | 25.8% | 19.4%(+6.40)#74 | 20.1%(+5.70)#1,143 |
| 75. | Plano | 25.9% | 19.4%(+6.50)#75 | 20.1%(+5.80)#1,147 |
| 76. | Hutto | 26.8% | 19.4%(+7.40)#76 | 20.1%(+6.70)#1,191 |
| 77. | Arlington | 26.9% | 19.4%(+7.50)#77 | 20.1%(+6.80)#1,194 |
| 78. | San Antonio | 27.4% | 19.4%(+8.00)#78 | 20.1%(+7.30)#1,221 |
| 79. | Houston | 28.0% | 19.4%(+8.60)#79 | 20.1%(+7.90)#1,243 |
| 80. | El Paso | 28.1% | 19.4%(+8.70)#80 | 20.1%(+8.00)#1,247 |
| 81. | Grapevine | 28.1% | 19.4%(+8.70)#81 | 20.1%(+8.00)#1,251 |
| 82. | Kempner | 28.6% | 19.4%(+9.20)#82 | 20.1%(+8.50)#1,284 |
| 83. | Atascocita | 28.7% | 19.4%(+9.30)#83 | 20.1%(+8.60)#1,288 |
| 84. | Athens | 29.2% | 19.4%(+9.80)#84 | 20.1%(+9.10)#1,305 |
| 85. | Waxahachie | 30.5% | 19.4%(+11.1)#85 | 20.1%(+10.4)#1,364 |
| 86. | Farmers Branch | 30.9% | 19.4%(+11.5)#86 | 20.1%(+10.8)#1,378 |
| 87. | Killeen | 31.0% | 19.4%(+11.6)#87 | 20.1%(+10.9)#1,381 |
| 88. | Keller | 31.2% | 19.4%(+11.8)#88 | 20.1%(+11.1)#1,389 |
| 89. | Edinburg | 31.5% | 19.4%(+12.1)#89 | 20.1%(+11.4)#1,398 |
| 90. | Odessa | 31.8% | 19.4%(+12.4)#90 | 20.1%(+11.7)#1,410 |
| 91. | Selma | 31.8% | 19.4%(+12.4)#91 | 20.1%(+11.7)#1,412 |
| 92. | Seguin | 32.8% | 19.4%(+13.4)#92 | 20.1%(+12.7)#1,446 |
| 93. | Lubbock | 33.0% | 19.4%(+13.6)#93 | 20.1%(+12.9)#1,449 |
| 94. | Converse | 33.3% | 19.4%(+13.9)#94 | 20.1%(+13.2)#1,461 |
| 95. | Godley | 33.3% | 19.4%(+13.9)#95 | 20.1%(+13.2)#1,492 |
| 96. | Pineland | 33.3% | 19.4%(+13.9)#96 | 20.1%(+13.2)#1,494 |
| 97. | Georgetown | 33.8% | 19.4%(+14.4)#97 | 20.1%(+13.7)#1,517 |
| 98. | Gatesville | 34.0% | 19.4%(+14.6)#98 | 20.1%(+13.9)#1,521 |
| 99. | Universal City | 34.3% | 19.4%(+14.9)#99 | 20.1%(+14.2)#1,535 |
| 100. | Horizon City | 35.1% | 19.4%(+15.7)#100 | 20.1%(+15.0)#1,571 |
Common Questions
What are the Top 10 Cities with the Lowest Percentage of Births to Unmarried Women over the Age of 35 in Texas?
Top 10 Cities with the Lowest Percentage of Births to Unmarried Women over the Age of 35 in Texas are:
#1
0.20%
#2
1.1%
#3
3.2%
#4
3.4%
#5
3.4%
#6
3.6%
#7
4.4%
#8
4.8%
#9
5.0%
#10
5.1%
What city has the Lowest Percentage of Births to Unmarried Women over the Age of 35 in Texas?
Sugar Land has the Lowest Percentage of Births to Unmarried Women over the Age of 35 in Texas with 0.20%.
What is the Percentage of Births to Unmarried Women over the Age of 35 in the State of Texas?
Percentage of Births to Unmarried Women over the Age of 35 in Texas is 19.4%.
What is the Percentage of Births to Unmarried Women over the Age of 35 in the United States?
Percentage of Births to Unmarried Women over the Age of 35 in the United States is 20.1%.