Cities with the Lowest Percentage of Births to Unmarried Women over the Age of 35 in Georgia
RELATED REPORTS & OPTIONS
Lowest Illegitimacy | Women 35+
Georgia
Compare Cities
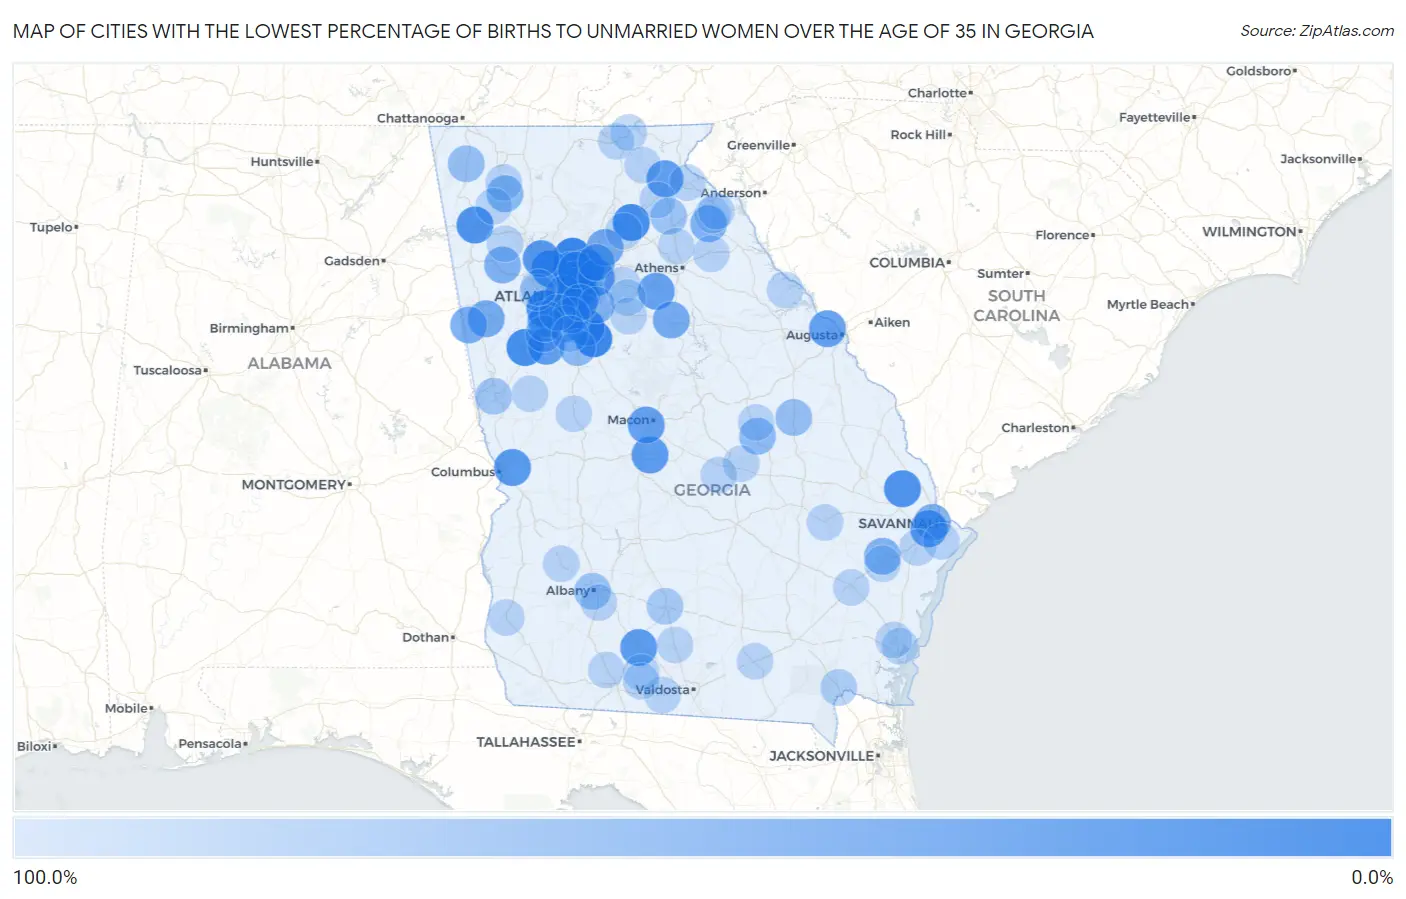
Map of Cities with the Lowest Percentage of Births to Unmarried Women over the Age of 35 in Georgia
100.0%
0.0%
Cities with the Lowest Percentage of Births to Unmarried Women over the Age of 35 in Georgia
| City | % Unmarried | vs State | vs National | |
| 1. | Roswell | 1.7% | 22.7%(-21.0)#1 | 20.1%(-18.4)#14 |
| 2. | Sandy Springs | 2.8% | 22.7%(-19.9)#2 | 20.1%(-17.3)#46 |
| 3. | Mcdonough | 4.5% | 22.7%(-18.2)#3 | 20.1%(-15.6)#93 |
| 4. | South Fulton | 5.2% | 22.7%(-17.5)#4 | 20.1%(-14.9)#126 |
| 5. | Peachtree Corners | 7.2% | 22.7%(-15.5)#5 | 20.1%(-12.9)#218 |
| 6. | Athens-Clarke County Unified Government (Balance) | 8.0% | 22.7%(-14.7)#6 | 20.1%(-12.1)#258 |
| 7. | Chamblee | 9.2% | 22.7%(-13.5)#7 | 20.1%(-10.9)#312 |
| 8. | Brookhaven | 10.2% | 22.7%(-12.5)#8 | 20.1%(-9.90)#357 |
| 9. | North Decatur | 10.6% | 22.7%(-12.1)#9 | 20.1%(-9.50)#373 |
| 10. | Newnan | 12.1% | 22.7%(-10.6)#10 | 20.1%(-8.00)#438 |
| 11. | Gainesville | 13.4% | 22.7%(-9.30)#11 | 20.1%(-6.70)#510 |
| 12. | Stockbridge | 16.8% | 22.7%(-5.90)#12 | 20.1%(-3.30)#722 |
| 13. | Marietta | 18.2% | 22.7%(-4.50)#13 | 20.1%(-1.90)#791 |
| 14. | Guyton | 20.0% | 22.7%(-2.70)#14 | 20.1%(-0.100)#875 |
| 15. | Rome | 20.4% | 22.7%(-2.30)#15 | 20.1%(+0.300)#896 |
| 16. | North Druid Hills | 23.2% | 22.7%(+0.500)#16 | 20.1%(+3.10)#1,031 |
| 17. | Belvedere Park | 24.0% | 22.7%(+1.30)#17 | 20.1%(+3.90)#1,066 |
| 18. | Lake City | 25.0% | 22.7%(+2.30)#18 | 20.1%(+4.90)#1,111 |
| 19. | Kennesaw | 26.2% | 22.7%(+3.50)#19 | 20.1%(+6.10)#1,165 |
| 20. | Savannah | 27.4% | 22.7%(+4.70)#20 | 20.1%(+7.30)#1,222 |
| 21. | Atlanta | 27.9% | 22.7%(+5.20)#21 | 20.1%(+7.80)#1,240 |
| 22. | Columbus | 28.6% | 22.7%(+5.90)#22 | 20.1%(+8.50)#1,275 |
| 23. | Dunwoody | 29.2% | 22.7%(+6.50)#23 | 20.1%(+9.10)#1,303 |
| 24. | Warner Robins | 29.4% | 22.7%(+6.70)#24 | 20.1%(+9.30)#1,315 |
| 25. | Moultrie | 30.0% | 22.7%(+7.30)#25 | 20.1%(+9.90)#1,343 |
| 26. | Lilburn | 30.7% | 22.7%(+8.00)#26 | 20.1%(+10.6)#1,369 |
| 27. | Peachtree City | 32.2% | 22.7%(+9.50)#27 | 20.1%(+12.1)#1,428 |
| 28. | Clarkesville | 33.3% | 22.7%(+10.6)#28 | 20.1%(+13.2)#1,491 |
| 29. | Martinez | 35.7% | 22.7%(+13.0)#29 | 20.1%(+15.6)#1,588 |
| 30. | Macon Bibb County | 35.9% | 22.7%(+13.2)#30 | 20.1%(+15.8)#1,597 |
| 31. | Good Hope | 37.5% | 22.7%(+14.8)#31 | 20.1%(+17.4)#1,662 |
| 32. | Union City | 42.9% | 22.7%(+20.2)#32 | 20.1%(+22.8)#1,826 |
| 33. | Augusta-Richmond County Consolidated Government (Balance) | 45.5% | 22.7%(+22.8)#33 | 20.1%(+25.4)#1,912 |
| 34. | Carrollton | 48.9% | 22.7%(+26.2)#34 | 20.1%(+28.8)#2,008 |
| 35. | Sugar Hill | 50.0% | 22.7%(+27.3)#35 | 20.1%(+29.9)#2,029 |
| 36. | Madison | 50.0% | 22.7%(+27.3)#36 | 20.1%(+29.9)#2,046 |
| 37. | Bowdon | 51.1% | 22.7%(+28.4)#37 | 20.1%(+31.0)#2,097 |
| 38. | Riverdale | 52.0% | 22.7%(+29.3)#38 | 20.1%(+31.9)#2,119 |
| 39. | Duluth | 52.2% | 22.7%(+29.5)#39 | 20.1%(+32.1)#2,123 |
| 40. | Garden City | 56.7% | 22.7%(+34.0)#40 | 20.1%(+36.6)#2,218 |
| 41. | Franklin Springs | 57.1% | 22.7%(+34.4)#41 | 20.1%(+37.0)#2,236 |
| 42. | Braswell | 57.1% | 22.7%(+34.4)#42 | 20.1%(+37.0)#2,241 |
| 43. | Stonecrest | 58.1% | 22.7%(+35.4)#43 | 20.1%(+38.0)#2,259 |
| 44. | Hinesville | 61.5% | 22.7%(+38.8)#44 | 20.1%(+41.4)#2,328 |
| 45. | Calhoun | 65.8% | 22.7%(+43.1)#45 | 20.1%(+45.7)#2,434 |
| 46. | Hampton | 66.7% | 22.7%(+44.0)#46 | 20.1%(+46.6)#2,447 |
| 47. | Tyrone | 68.4% | 22.7%(+45.7)#47 | 20.1%(+48.3)#2,483 |
| 48. | Wrightsville | 69.0% | 22.7%(+46.3)#48 | 20.1%(+48.9)#2,493 |
| 49. | Wadley | 75.0% | 22.7%(+52.3)#49 | 20.1%(+54.9)#2,567 |
| 50. | Lafayette | 75.4% | 22.7%(+52.7)#50 | 20.1%(+55.3)#2,578 |
| 51. | Albany | 78.3% | 22.7%(+55.6)#51 | 20.1%(+58.2)#2,611 |
| 52. | Homer | 80.0% | 22.7%(+57.3)#52 | 20.1%(+59.9)#2,628 |
| 53. | Lagrange | 83.0% | 22.7%(+60.3)#53 | 20.1%(+62.9)#2,652 |
| 54. | Tifton | 88.0% | 22.7%(+65.3)#54 | 20.1%(+67.9)#2,691 |
| 55. | Folkston | 93.3% | 22.7%(+70.6)#55 | 20.1%(+73.2)#2,720 |
| 56. | Forest Park | 100.0% | 22.7%(+77.3)#56 | 20.1%(+79.9)#2,780 |
| 57. | Richmond Hill | 100.0% | 22.7%(+77.3)#57 | 20.1%(+79.9)#2,799 |
| 58. | Fairburn | 100.0% | 22.7%(+77.3)#58 | 20.1%(+79.9)#2,804 |
| 59. | Lithia Springs | 100.0% | 22.7%(+77.3)#59 | 20.1%(+79.9)#2,810 |
| 60. | Brunswick | 100.0% | 22.7%(+77.3)#60 | 20.1%(+79.9)#2,819 |
| 61. | Loganville | 100.0% | 22.7%(+77.3)#61 | 20.1%(+79.9)#2,826 |
| 62. | Covington | 100.0% | 22.7%(+77.3)#62 | 20.1%(+79.9)#2,830 |
| 63. | College Park | 100.0% | 22.7%(+77.3)#63 | 20.1%(+79.9)#2,832 |
| 64. | Jesup | 100.0% | 22.7%(+77.3)#64 | 20.1%(+79.9)#2,926 |
| 65. | Thomaston | 100.0% | 22.7%(+77.3)#65 | 20.1%(+79.9)#2,930 |
| 66. | Panthersville | 100.0% | 22.7%(+77.3)#66 | 20.1%(+79.9)#2,944 |
| 67. | Toccoa | 100.0% | 22.7%(+77.3)#67 | 20.1%(+79.9)#2,949 |
| 68. | Irondale | 100.0% | 22.7%(+77.3)#68 | 20.1%(+79.9)#2,968 |
| 69. | Dock Junction | 100.0% | 22.7%(+77.3)#69 | 20.1%(+79.9)#2,972 |
| 70. | Austell | 100.0% | 22.7%(+77.3)#70 | 20.1%(+79.9)#2,978 |
| 71. | Blakely | 100.0% | 22.7%(+77.3)#71 | 20.1%(+79.9)#3,105 |
| 72. | Oakwood | 100.0% | 22.7%(+77.3)#72 | 20.1%(+79.9)#3,113 |
| 73. | Montgomery | 100.0% | 22.7%(+77.3)#73 | 20.1%(+79.9)#3,146 |
| 74. | Dawson | 100.0% | 22.7%(+77.3)#74 | 20.1%(+79.9)#3,166 |
| 75. | Euharlee | 100.0% | 22.7%(+77.3)#75 | 20.1%(+79.9)#3,173 |
| 76. | Quitman | 100.0% | 22.7%(+77.3)#76 | 20.1%(+79.9)#3,192 |
| 77. | Walthourville | 100.0% | 22.7%(+77.3)#77 | 20.1%(+79.9)#3,212 |
| 78. | Putney | 100.0% | 22.7%(+77.3)#78 | 20.1%(+79.9)#3,246 |
| 79. | East Dublin | 100.0% | 22.7%(+77.3)#79 | 20.1%(+79.9)#3,294 |
| 80. | Reidsville | 100.0% | 22.7%(+77.3)#80 | 20.1%(+79.9)#3,365 |
| 81. | Raoul | 100.0% | 22.7%(+77.3)#81 | 20.1%(+79.9)#3,367 |
| 82. | Sparks | 100.0% | 22.7%(+77.3)#82 | 20.1%(+79.9)#3,382 |
| 83. | Nicholson | 100.0% | 22.7%(+77.3)#83 | 20.1%(+79.9)#3,436 |
| 84. | Homerville | 100.0% | 22.7%(+77.3)#84 | 20.1%(+79.9)#3,438 |
| 85. | Lincolnton | 100.0% | 22.7%(+77.3)#85 | 20.1%(+79.9)#3,473 |
| 86. | Comer | 100.0% | 22.7%(+77.3)#86 | 20.1%(+79.9)#3,491 |
| 87. | Walnut Grove | 100.0% | 22.7%(+77.3)#87 | 20.1%(+79.9)#3,535 |
| 88. | Resaca | 100.0% | 22.7%(+77.3)#88 | 20.1%(+79.9)#3,597 |
| 89. | Greenville | 100.0% | 22.7%(+77.3)#89 | 20.1%(+79.9)#3,680 |
| 90. | Young Harris | 100.0% | 22.7%(+77.3)#90 | 20.1%(+79.9)#3,690 |
| 91. | Dexter | 100.0% | 22.7%(+77.3)#91 | 20.1%(+79.9)#3,700 |
| 92. | Canon | 100.0% | 22.7%(+77.3)#92 | 20.1%(+79.9)#3,744 |
| 93. | Blairsville | 100.0% | 22.7%(+77.3)#93 | 20.1%(+79.9)#3,827 |
| 94. | Pavo | 100.0% | 22.7%(+77.3)#94 | 20.1%(+79.9)#3,841 |
| 95. | Ochlocknee | 100.0% | 22.7%(+77.3)#95 | 20.1%(+79.9)#3,857 |
| 96. | Helen | 100.0% | 22.7%(+77.3)#96 | 20.1%(+79.9)#3,947 |
| 97. | Bowersville | 100.0% | 22.7%(+77.3)#97 | 20.1%(+79.9)#3,967 |
| 98. | Harrison | 100.0% | 22.7%(+77.3)#98 | 20.1%(+79.9)#4,026 |
| 99. | Barwick | 100.0% | 22.7%(+77.3)#99 | 20.1%(+79.9)#4,039 |
| 100. | Plainville | 100.0% | 22.7%(+77.3)#100 | 20.1%(+79.9)#4,041 |
Common Questions
What are the Top 10 Cities with the Lowest Percentage of Births to Unmarried Women over the Age of 35 in Georgia?
Top 10 Cities with the Lowest Percentage of Births to Unmarried Women over the Age of 35 in Georgia are:
#1
1.7%
#2
2.8%
#3
4.5%
#4
5.2%
#5
7.2%
#6
9.2%
#7
10.2%
#8
10.6%
#9
12.1%
#10
13.4%
What city has the Lowest Percentage of Births to Unmarried Women over the Age of 35 in Georgia?
Roswell has the Lowest Percentage of Births to Unmarried Women over the Age of 35 in Georgia with 1.7%.
What is the Percentage of Births to Unmarried Women over the Age of 35 in the State of Georgia?
Percentage of Births to Unmarried Women over the Age of 35 in Georgia is 22.7%.
What is the Percentage of Births to Unmarried Women over the Age of 35 in the United States?
Percentage of Births to Unmarried Women over the Age of 35 in the United States is 20.1%.