San Bruno, CA Map & Demographics
San Bruno Map
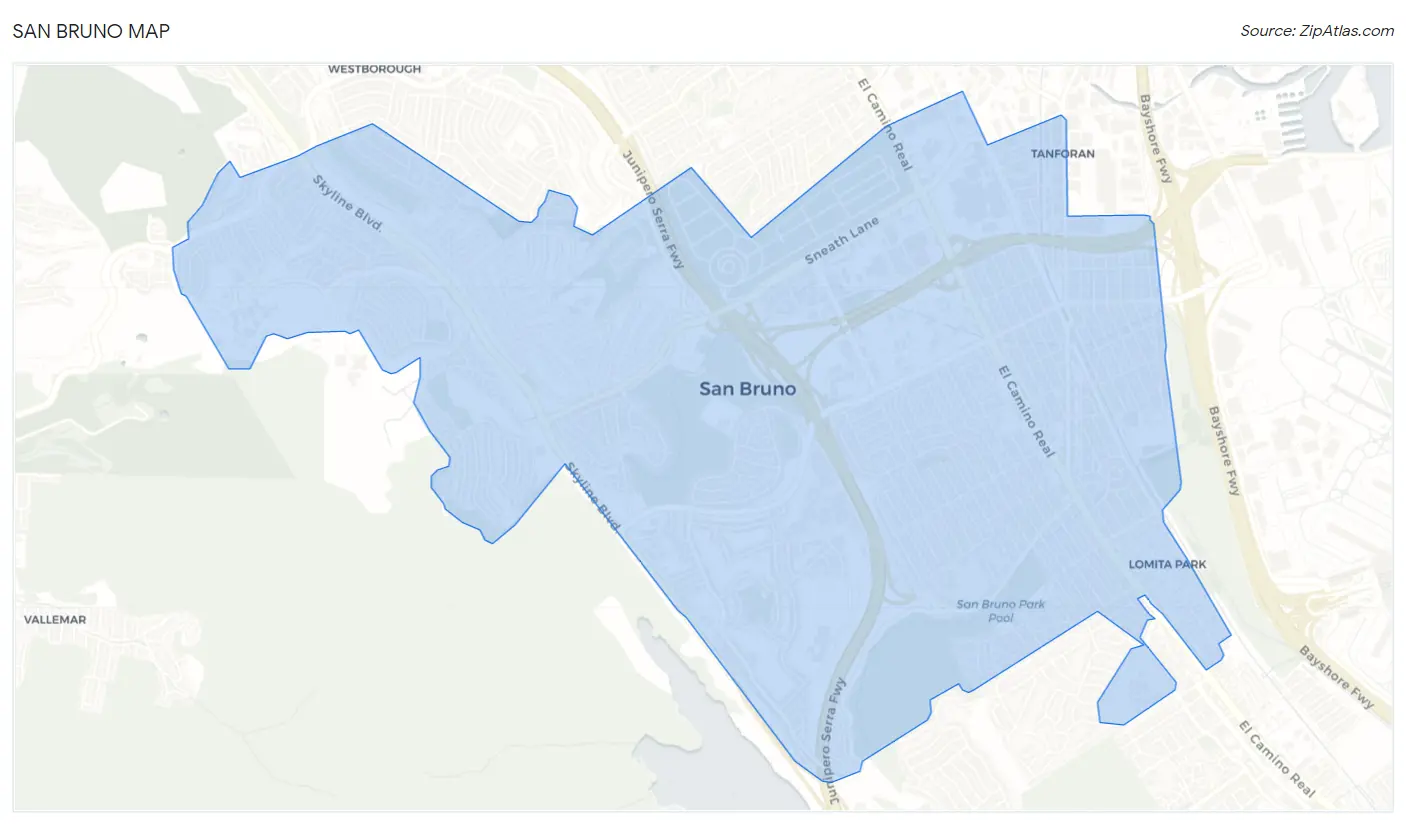
San Bruno Overview
$57,984
PER CAPITA INCOME
$152,290
AVG FAMILY INCOME
$131,669
AVG HOUSEHOLD INCOME
15.6%
WAGE / INCOME GAP [ % ]
84.4¢/ $1
WAGE / INCOME GAP [ $ ]
$11,455
FAMILY INCOME DEFICIT
0.42
INEQUALITY / GINI INDEX
43,218
TOTAL POPULATION
21,820
MALE POPULATION
21,398
FEMALE POPULATION
101.97
MALES / 100 FEMALES
98.07
FEMALES / 100 MALES
39.0
MEDIAN AGE
3.4
AVG FAMILY SIZE
2.8
AVG HOUSEHOLD SIZE
25,124
LABOR FORCE [ PEOPLE ]
70.0%
PERCENT IN LABOR FORCE
4.6%
UNEMPLOYMENT RATE
San Bruno Zip Codes
San Bruno Area Codes
Income in San Bruno
Income Overview in San Bruno
Per Capita Income in San Bruno is $57,984, while median incomes of families and households are $152,290 and $131,669 respectively.
| Characteristic | Number | Measure |
| Per Capita Income | 43,218 | $57,984 |
| Median Family Income | 10,259 | $152,290 |
| Mean Family Income | 10,259 | $183,550 |
| Median Household Income | 15,169 | $131,669 |
| Mean Household Income | 15,169 | $161,826 |
| Income Deficit | 10,259 | $11,455 |
| Wage / Income Gap (%) | 43,218 | 15.63% |
| Wage / Income Gap ($) | 43,218 | 84.37¢ per $1 |
| Gini / Inequality Index | 43,218 | 0.42 |
Earnings by Sex in San Bruno
Average Earnings in San Bruno are $62,261, $67,882 for men and $57,273 for women, a difference of 15.6%.
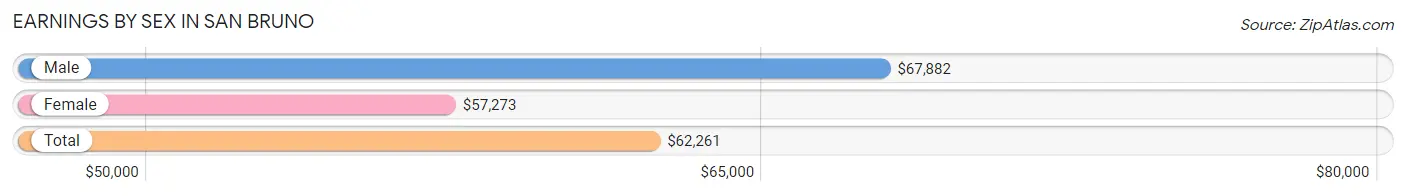
| Sex | Number | Average Earnings |
| Male | 13,461 (52.7%) | $67,882 |
| Female | 12,064 (47.3%) | $57,273 |
| Total | 25,525 (100.0%) | $62,261 |
Earnings by Sex by Income Bracket in San Bruno
The most common earnings brackets in San Bruno are $100,000+ for men (4,122 | 30.6%) and $100,000+ for women (3,246 | 26.9%).
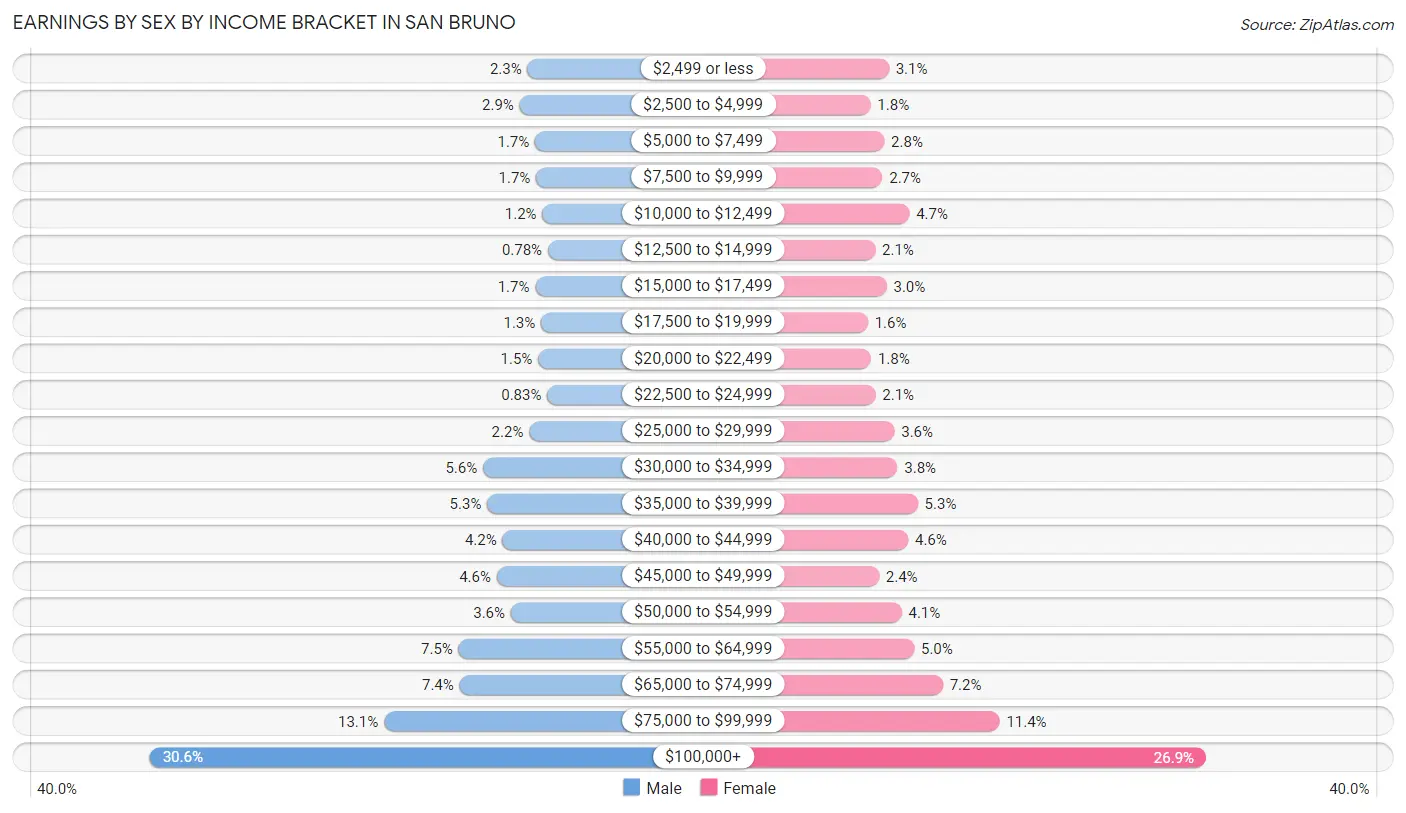
| Income | Male | Female |
| $2,499 or less | 311 (2.3%) | 379 (3.1%) |
| $2,500 to $4,999 | 391 (2.9%) | 213 (1.8%) |
| $5,000 to $7,499 | 234 (1.7%) | 338 (2.8%) |
| $7,500 to $9,999 | 223 (1.7%) | 321 (2.7%) |
| $10,000 to $12,499 | 160 (1.2%) | 564 (4.7%) |
| $12,500 to $14,999 | 105 (0.8%) | 256 (2.1%) |
| $15,000 to $17,499 | 233 (1.7%) | 359 (3.0%) |
| $17,500 to $19,999 | 174 (1.3%) | 190 (1.6%) |
| $20,000 to $22,499 | 203 (1.5%) | 218 (1.8%) |
| $22,500 to $24,999 | 112 (0.8%) | 258 (2.1%) |
| $25,000 to $29,999 | 294 (2.2%) | 430 (3.6%) |
| $30,000 to $34,999 | 759 (5.6%) | 457 (3.8%) |
| $35,000 to $39,999 | 718 (5.3%) | 640 (5.3%) |
| $40,000 to $44,999 | 562 (4.2%) | 554 (4.6%) |
| $45,000 to $49,999 | 621 (4.6%) | 290 (2.4%) |
| $50,000 to $54,999 | 479 (3.6%) | 495 (4.1%) |
| $55,000 to $64,999 | 1,006 (7.5%) | 608 (5.0%) |
| $65,000 to $74,999 | 996 (7.4%) | 868 (7.2%) |
| $75,000 to $99,999 | 1,758 (13.1%) | 1,380 (11.4%) |
| $100,000+ | 4,122 (30.6%) | 3,246 (26.9%) |
| Total | 13,461 (100.0%) | 12,064 (100.0%) |
Earnings by Sex by Educational Attainment in San Bruno
Average earnings in San Bruno are $73,892 for men and $63,177 for women, a difference of 14.5%. Men with an educational attainment of graduate degree enjoy the highest average annual earnings of $123,077, while those with less than high school education earn the least with $47,428. Women with an educational attainment of graduate degree earn the most with the average annual earnings of $116,920, while those with less than high school education have the smallest earnings of $21,331.
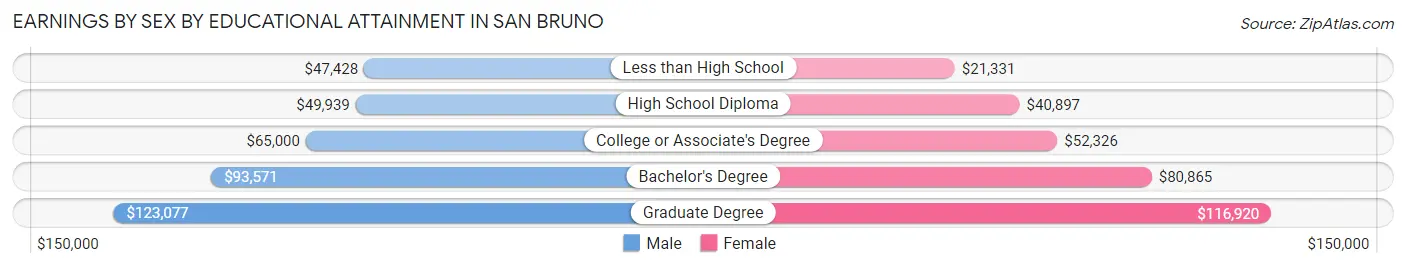
| Educational Attainment | Male Income | Female Income |
| Less than High School | $47,428 | $21,331 |
| High School Diploma | $49,939 | $40,897 |
| College or Associate's Degree | $65,000 | $52,326 |
| Bachelor's Degree | $93,571 | $80,865 |
| Graduate Degree | $123,077 | $116,920 |
| Total | $73,892 | $63,177 |
Family Income in San Bruno
Family Income Brackets in San Bruno
According to the San Bruno family income data, there are 3,509 families falling into the $200,000+ income range, which is the most common income bracket and makes up 34.2% of all families. Conversely, the $15,000 to $24,999 income bracket is the least frequent group with only 92 families (0.9%) belonging to this category.
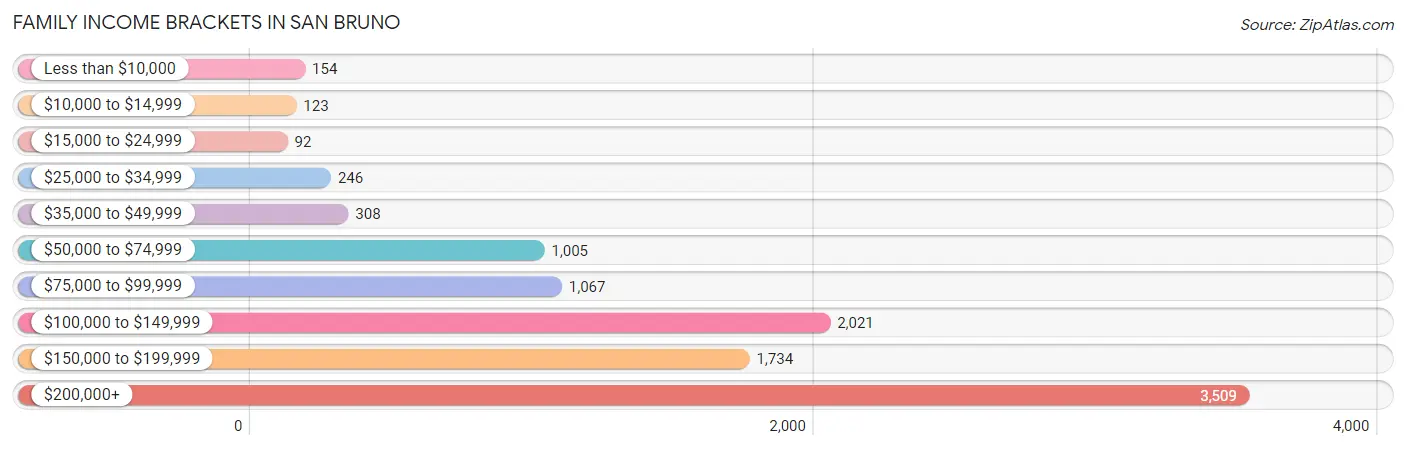
| Income Bracket | # Families | % Families |
| Less than $10,000 | 154 | 1.5% |
| $10,000 to $14,999 | 123 | 1.2% |
| $15,000 to $24,999 | 92 | 0.9% |
| $25,000 to $34,999 | 246 | 2.4% |
| $35,000 to $49,999 | 308 | 3.0% |
| $50,000 to $74,999 | 1,005 | 9.8% |
| $75,000 to $99,999 | 1,067 | 10.4% |
| $100,000 to $149,999 | 2,021 | 19.7% |
| $150,000 to $199,999 | 1,734 | 16.9% |
| $200,000+ | 3,509 | 34.2% |
Family Income by Famaliy Size in San Bruno
6-person families (312 | 3.0%) account for the highest median family income in San Bruno with $250,001 per family, while 2-person families (4,241 | 41.3%) have the highest median income of $61,022 per family member.
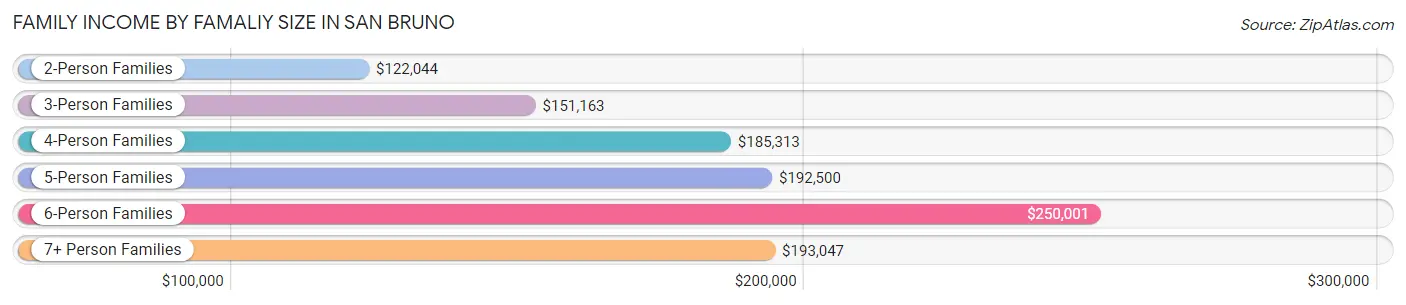
| Income Bracket | # Families | Median Income |
| 2-Person Families | 4,241 (41.3%) | $122,044 |
| 3-Person Families | 2,573 (25.1%) | $151,163 |
| 4-Person Families | 1,947 (19.0%) | $185,313 |
| 5-Person Families | 914 (8.9%) | $192,500 |
| 6-Person Families | 312 (3.0%) | $250,001 |
| 7+ Person Families | 272 (2.6%) | $193,047 |
| Total | 10,259 (100.0%) | $152,290 |
Family Income by Number of Earners in San Bruno
The median family income in San Bruno is $152,290, with families comprising 3+ earners (1,786) having the highest median family income of $207,500, while families with no earners (1,236) have the lowest median family income of $79,477, accounting for 17.4% and 12.0% of families, respectively.
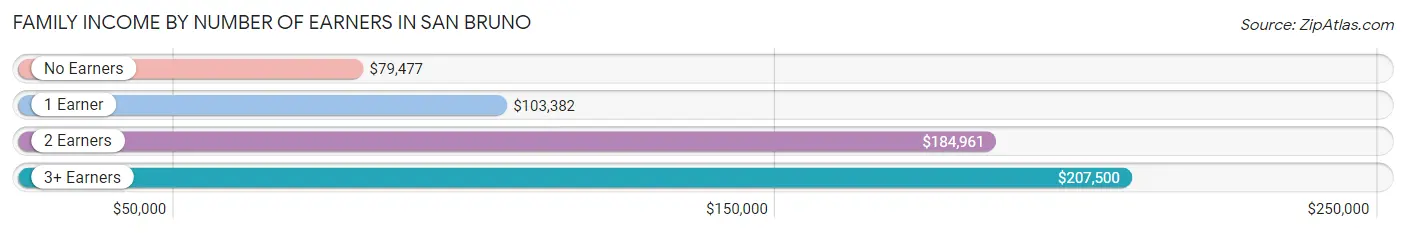
| Number of Earners | # Families | Median Income |
| No Earners | 1,236 (12.0%) | $79,477 |
| 1 Earner | 2,598 (25.3%) | $103,382 |
| 2 Earners | 4,639 (45.2%) | $184,961 |
| 3+ Earners | 1,786 (17.4%) | $207,500 |
| Total | 10,259 (100.0%) | $152,290 |
Household Income in San Bruno
Household Income Brackets in San Bruno
With 4,262 households falling in the category, the $200,000+ income range is the most frequent in San Bruno, accounting for 28.1% of all households. In contrast, only 228 households (1.5%) fall into the $10,000 to $14,999 income bracket, making it the least populous group.
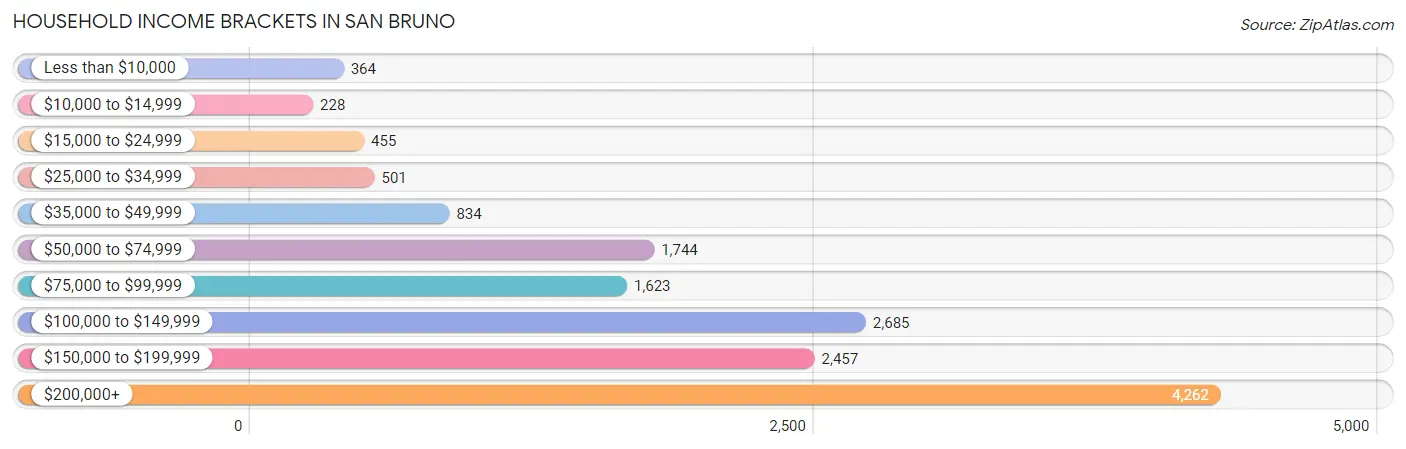
| Income Bracket | # Households | % Households |
| Less than $10,000 | 364 | 2.4% |
| $10,000 to $14,999 | 228 | 1.5% |
| $15,000 to $24,999 | 455 | 3.0% |
| $25,000 to $34,999 | 501 | 3.3% |
| $35,000 to $49,999 | 834 | 5.5% |
| $50,000 to $74,999 | 1,744 | 11.5% |
| $75,000 to $99,999 | 1,623 | 10.7% |
| $100,000 to $149,999 | 2,685 | 17.7% |
| $150,000 to $199,999 | 2,457 | 16.2% |
| $200,000+ | 4,262 | 28.1% |
Household Income by Householder Age in San Bruno
The median household income in San Bruno is $131,669, with the highest median household income of $163,277 found in the 25 to 44 years age bracket for the primary householder. A total of 5,528 households (36.4%) fall into this category. Meanwhile, the 15 to 24 years age bracket for the primary householder has the lowest median household income of $0, with 360 households (2.4%) in this group.
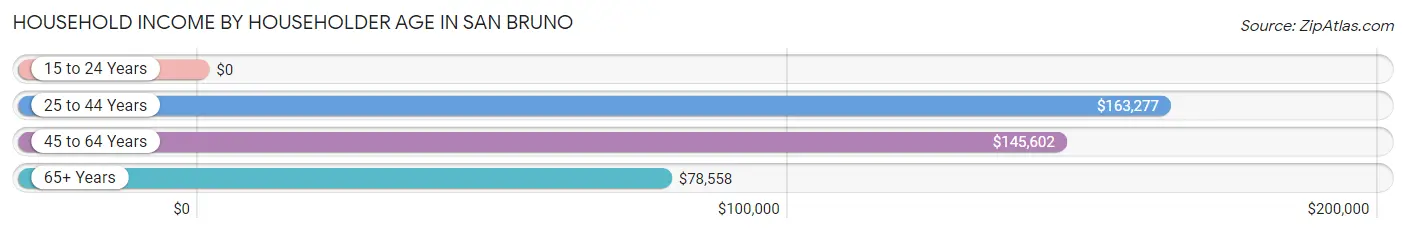
| Income Bracket | # Households | Median Income |
| 15 to 24 Years | 360 (2.4%) | $0 |
| 25 to 44 Years | 5,528 (36.4%) | $163,277 |
| 45 to 64 Years | 5,582 (36.8%) | $145,602 |
| 65+ Years | 3,699 (24.4%) | $78,558 |
| Total | 15,169 (100.0%) | $131,669 |
Poverty in San Bruno
Income Below Poverty by Sex and Age in San Bruno
With 5.1% poverty level for males and 6.2% for females among the residents of San Bruno, 16 and 17 year old males and 15 year old females are the most vulnerable to poverty, with 99 males (24.6%) and 84 females (46.9%) in their respective age groups living below the poverty level.
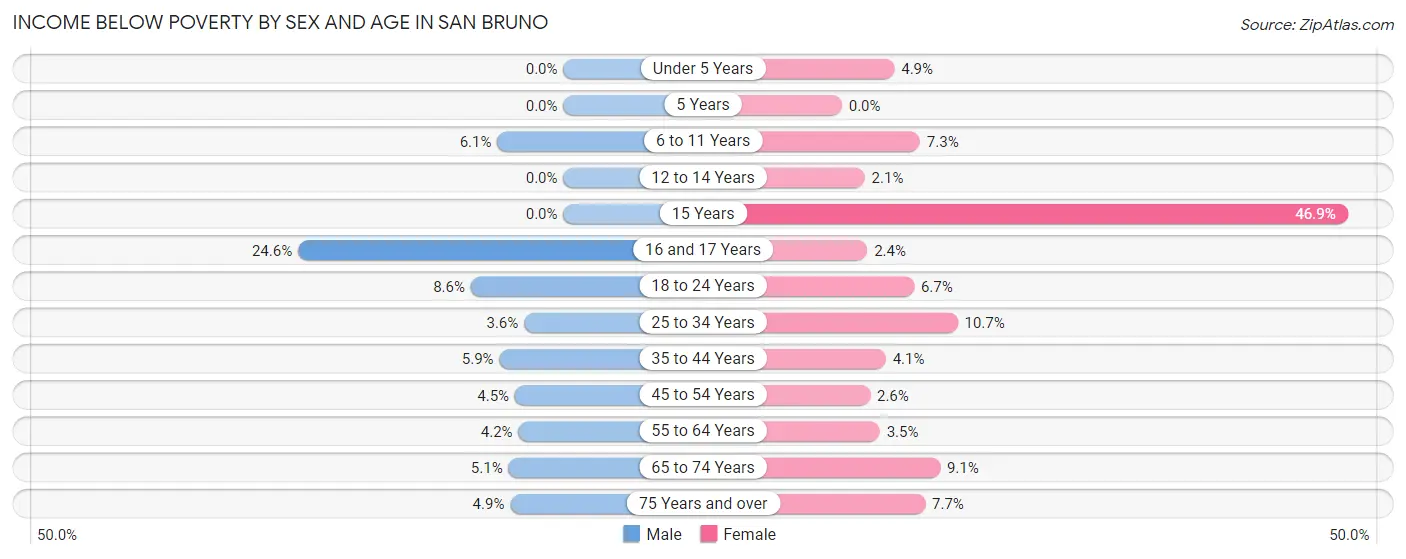
| Age Bracket | Male | Female |
| Under 5 Years | 0 (0.0%) | 48 (4.9%) |
| 5 Years | 0 (0.0%) | 0 (0.0%) |
| 6 to 11 Years | 105 (6.1%) | 84 (7.2%) |
| 12 to 14 Years | 0 (0.0%) | 16 (2.1%) |
| 15 Years | 0 (0.0%) | 84 (46.9%) |
| 16 and 17 Years | 99 (24.6%) | 9 (2.4%) |
| 18 to 24 Years | 184 (8.6%) | 85 (6.7%) |
| 25 to 34 Years | 136 (3.6%) | 350 (10.7%) |
| 35 to 44 Years | 215 (5.9%) | 138 (4.1%) |
| 45 to 54 Years | 111 (4.5%) | 74 (2.6%) |
| 55 to 64 Years | 105 (4.2%) | 104 (3.5%) |
| 65 to 74 Years | 98 (5.1%) | 199 (9.1%) |
| 75 Years and over | 53 (4.9%) | 129 (7.7%) |
| Total | 1,106 (5.1%) | 1,320 (6.2%) |
Income Above Poverty by Sex and Age in San Bruno
According to the poverty statistics in San Bruno, males aged under 5 years and females aged 5 years are the age groups that are most secure financially, with 100.0% of males and 100.0% of females in these age groups living above the poverty line.
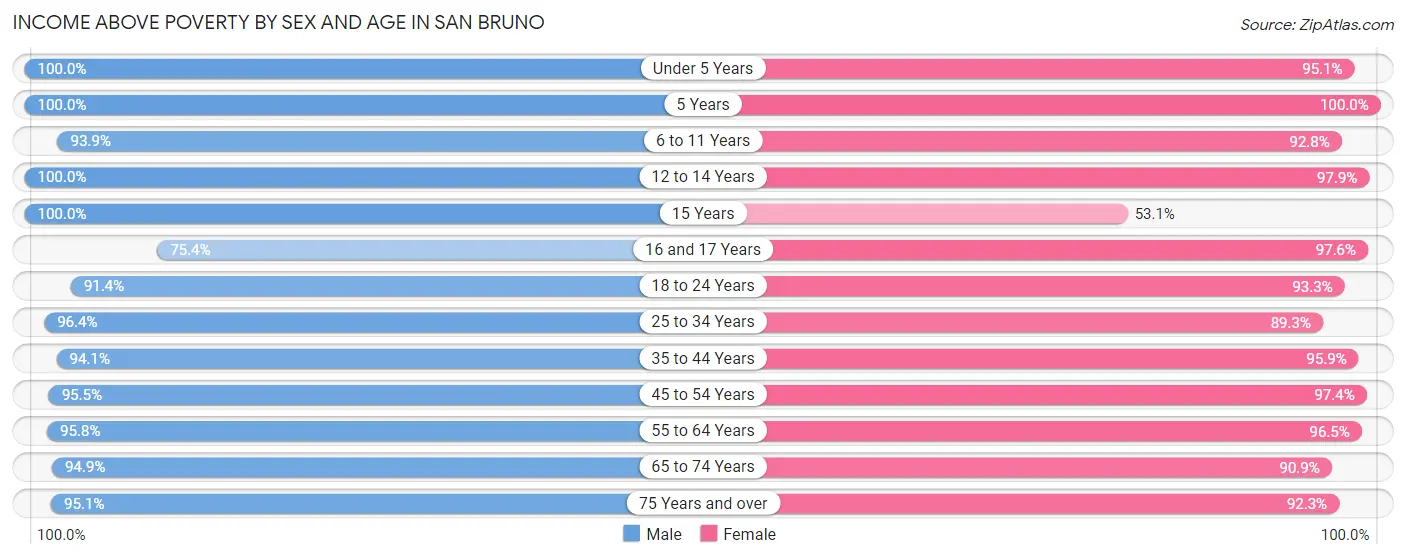
| Age Bracket | Male | Female |
| Under 5 Years | 1,062 (100.0%) | 938 (95.1%) |
| 5 Years | 245 (100.0%) | 304 (100.0%) |
| 6 to 11 Years | 1,609 (93.9%) | 1,075 (92.7%) |
| 12 to 14 Years | 647 (100.0%) | 737 (97.9%) |
| 15 Years | 222 (100.0%) | 95 (53.1%) |
| 16 and 17 Years | 303 (75.4%) | 373 (97.6%) |
| 18 to 24 Years | 1,957 (91.4%) | 1,184 (93.3%) |
| 25 to 34 Years | 3,601 (96.4%) | 2,909 (89.3%) |
| 35 to 44 Years | 3,409 (94.1%) | 3,246 (95.9%) |
| 45 to 54 Years | 2,360 (95.5%) | 2,752 (97.4%) |
| 55 to 64 Years | 2,411 (95.8%) | 2,849 (96.5%) |
| 65 to 74 Years | 1,826 (94.9%) | 1,986 (90.9%) |
| 75 Years and over | 1,023 (95.1%) | 1,539 (92.3%) |
| Total | 20,675 (94.9%) | 19,987 (93.8%) |
Income Below Poverty Among Married-Couple Families in San Bruno
The poverty statistics for married-couple families in San Bruno show that 2.2% or 175 of the total 7,946 families live below the poverty line. Families with 3 or 4 children have the highest poverty rate of 2.8%, comprising of 9 families. On the other hand, families with 5 or more children have the lowest poverty rate of 0.0%, which includes 0 families.
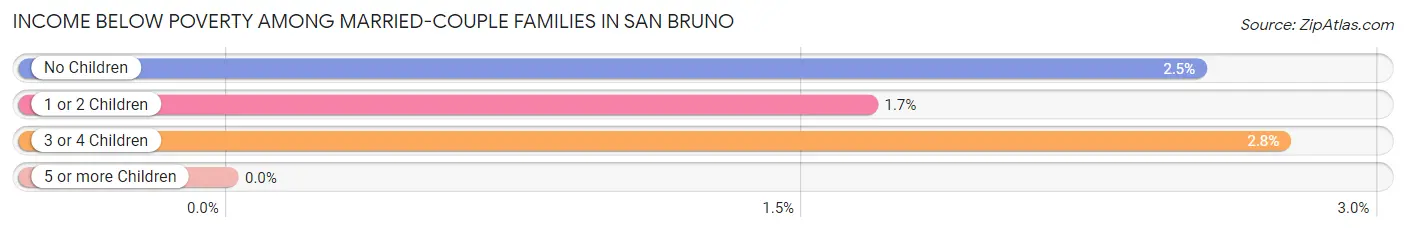
| Children | Above Poverty | Below Poverty |
| No Children | 4,426 (97.5%) | 115 (2.5%) |
| 1 or 2 Children | 3,005 (98.3%) | 51 (1.7%) |
| 3 or 4 Children | 318 (97.3%) | 9 (2.8%) |
| 5 or more Children | 22 (100.0%) | 0 (0.0%) |
| Total | 7,771 (97.8%) | 175 (2.2%) |
Income Below Poverty Among Single-Parent Households in San Bruno
According to the poverty data in San Bruno, 4.3% or 35 single-father households and 9.7% or 144 single-mother households are living below the poverty line. Among single-father households, those with no children have the highest poverty rate, with 23 households (5.0%) experiencing poverty. Likewise, among single-mother households, those with 5 or more children have the highest poverty rate, with 7 households (28.0%) falling below the poverty line.
| Children | Single Father | Single Mother |
| No Children | 23 (5.0%) | 0 (0.0%) |
| 1 or 2 Children | 12 (3.6%) | 137 (16.6%) |
| 3 or 4 Children | 0 (0.0%) | 0 (0.0%) |
| 5 or more Children | 0 (0.0%) | 7 (28.0%) |
| Total | 35 (4.3%) | 144 (9.7%) |
Income Below Poverty Among Married-Couple vs Single-Parent Households in San Bruno
The poverty data for San Bruno shows that 175 of the married-couple family households (2.2%) and 179 of the single-parent households (7.7%) are living below the poverty level. Within the married-couple family households, those with 3 or 4 children have the highest poverty rate, with 9 households (2.8%) falling below the poverty line. Among the single-parent households, those with 5 or more children have the highest poverty rate, with 7 household (28.0%) living below poverty.
| Children | Married-Couple Families | Single-Parent Households |
| No Children | 115 (2.5%) | 23 (2.2%) |
| 1 or 2 Children | 51 (1.7%) | 149 (12.9%) |
| 3 or 4 Children | 9 (2.8%) | 0 (0.0%) |
| 5 or more Children | 0 (0.0%) | 7 (28.0%) |
| Total | 175 (2.2%) | 179 (7.7%) |
Race in San Bruno
The most populous races in San Bruno are White / Caucasian (16,090 | 37.2%), Asian (14,002 | 32.4%), and Hispanic or Latino (12,747 | 29.5%).
| Race | # Population | % Population |
| Asian | 14,002 | 32.4% |
| Black / African American | 450 | 1.0% |
| Hawaiian / Pacific | 1,341 | 3.1% |
| Hispanic or Latino | 12,747 | 29.5% |
| Native / Alaskan | 61 | 0.1% |
| White / Caucasian | 16,090 | 37.2% |
| Two or more Races | 4,745 | 11.0% |
| Some other Race | 6,529 | 15.1% |
| Total | 43,218 | 100.0% |
Ancestry in San Bruno
The most populous ancestries reported in San Bruno are Indian (Asian) (6,961 | 16.1%), Mexican (6,481 | 15.0%), Korean (5,619 | 13.0%), Central American (4,023 | 9.3%), and Salvadoran (2,660 | 6.1%), together accounting for 59.6% of all San Bruno residents.
| Ancestry | # Population | % Population |
| African | 15 | 0.0% |
| Alaska Native | 19 | 0.0% |
| American | 1,365 | 3.2% |
| Apache | 22 | 0.1% |
| Arab | 230 | 0.5% |
| Argentinean | 82 | 0.2% |
| Armenian | 43 | 0.1% |
| Australian | 25 | 0.1% |
| Austrian | 33 | 0.1% |
| Bangladeshi | 35 | 0.1% |
| Basque | 95 | 0.2% |
| Belgian | 9 | 0.0% |
| Bhutanese | 564 | 1.3% |
| Blackfeet | 7 | 0.0% |
| Brazilian | 293 | 0.7% |
| British | 248 | 0.6% |
| Burmese | 489 | 1.1% |
| Canadian | 37 | 0.1% |
| Central American | 4,023 | 9.3% |
| Central American Indian | 14 | 0.0% |
| Chilean | 26 | 0.1% |
| Choctaw | 23 | 0.1% |
| Colombian | 84 | 0.2% |
| Croatian | 33 | 0.1% |
| Cuban | 54 | 0.1% |
| Czechoslovakian | 25 | 0.1% |
| Danish | 61 | 0.1% |
| Dominican | 7 | 0.0% |
| Dutch | 206 | 0.5% |
| Eastern European | 143 | 0.3% |
| Ecuadorian | 123 | 0.3% |
| Egyptian | 39 | 0.1% |
| English | 1,559 | 3.6% |
| European | 850 | 2.0% |
| Filipino | 127 | 0.3% |
| Finnish | 23 | 0.1% |
| French | 765 | 1.8% |
| French Canadian | 97 | 0.2% |
| German | 2,326 | 5.4% |
| Greek | 744 | 1.7% |
| Guamanian / Chamorro | 53 | 0.1% |
| Guatemalan | 401 | 0.9% |
| Honduran | 45 | 0.1% |
| Hungarian | 69 | 0.2% |
| Indian (Asian) | 6,961 | 16.1% |
| Indonesian | 75 | 0.2% |
| Iranian | 74 | 0.2% |
| Irish | 2,493 | 5.8% |
| Israeli | 30 | 0.1% |
| Italian | 2,364 | 5.5% |
| Japanese | 34 | 0.1% |
| Jordanian | 27 | 0.1% |
| Korean | 5,619 | 13.0% |
| Laotian | 69 | 0.2% |
| Latvian | 10 | 0.0% |
| Lebanese | 37 | 0.1% |
| Lithuanian | 55 | 0.1% |
| Macedonian | 48 | 0.1% |
| Maltese | 243 | 0.6% |
| Mexican | 6,481 | 15.0% |
| Mexican American Indian | 7 | 0.0% |
| Native Hawaiian | 236 | 0.5% |
| Navajo | 8 | 0.0% |
| Nicaraguan | 790 | 1.8% |
| Northern European | 41 | 0.1% |
| Norwegian | 392 | 0.9% |
| Pakistani | 187 | 0.4% |
| Palestinian | 105 | 0.2% |
| Panamanian | 63 | 0.2% |
| Peruvian | 336 | 0.8% |
| Polish | 348 | 0.8% |
| Portuguese | 255 | 0.6% |
| Puerto Rican | 337 | 0.8% |
| Russian | 660 | 1.5% |
| Salvadoran | 2,660 | 6.1% |
| Samoan | 19 | 0.0% |
| Scandinavian | 29 | 0.1% |
| Scotch-Irish | 67 | 0.2% |
| Scottish | 195 | 0.4% |
| Sioux | 24 | 0.1% |
| Slavic | 7 | 0.0% |
| South American | 727 | 1.7% |
| Spaniard | 328 | 0.8% |
| Spanish | 134 | 0.3% |
| Sri Lankan | 563 | 1.3% |
| Subsaharan African | 15 | 0.0% |
| Swedish | 269 | 0.6% |
| Swiss | 72 | 0.2% |
| Thai | 1,376 | 3.2% |
| Tongan | 924 | 2.1% |
| Turkish | 86 | 0.2% |
| Ukrainian | 114 | 0.3% |
| Venezuelan | 76 | 0.2% |
| Welsh | 69 | 0.2% |
| Yugoslavian | 35 | 0.1% | View All 95 Rows |
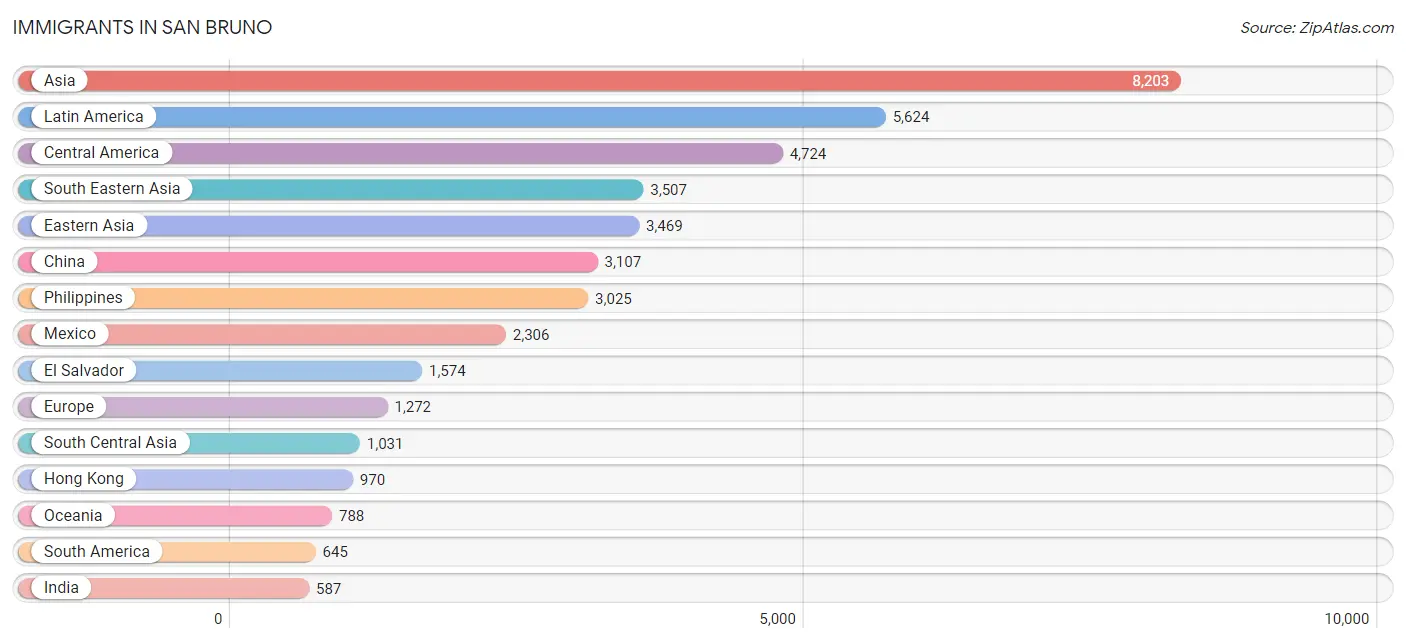
Immigrants in San Bruno
The most numerous immigrant groups reported in San Bruno came from Asia (8,203 | 19.0%), Latin America (5,624 | 13.0%), Central America (4,724 | 10.9%), South Eastern Asia (3,507 | 8.1%), and Eastern Asia (3,469 | 8.0%), together accounting for 59.1% of all San Bruno residents.
| Immigration Origin | # Population | % Population |
| Africa | 32 | 0.1% |
| Argentina | 46 | 0.1% |
| Armenia | 1 | 0.0% |
| Asia | 8,203 | 19.0% |
| Austria | 36 | 0.1% |
| Bangladesh | 20 | 0.1% |
| Bolivia | 8 | 0.0% |
| Brazil | 326 | 0.7% |
| Cambodia | 13 | 0.0% |
| Canada | 160 | 0.4% |
| Caribbean | 255 | 0.6% |
| Central America | 4,724 | 10.9% |
| Chile | 19 | 0.0% |
| China | 3,107 | 7.2% |
| Colombia | 48 | 0.1% |
| Croatia | 9 | 0.0% |
| Cuba | 24 | 0.1% |
| Dominican Republic | 7 | 0.0% |
| Eastern Asia | 3,469 | 8.0% |
| Eastern Europe | 405 | 0.9% |
| El Salvador | 1,574 | 3.6% |
| England | 45 | 0.1% |
| Europe | 1,272 | 2.9% |
| Fiji | 360 | 0.8% |
| France | 87 | 0.2% |
| Germany | 151 | 0.4% |
| Greece | 98 | 0.2% |
| Guatemala | 204 | 0.5% |
| Honduras | 45 | 0.1% |
| Hong Kong | 970 | 2.2% |
| Hungary | 15 | 0.0% |
| India | 587 | 1.4% |
| Indonesia | 85 | 0.2% |
| Iran | 92 | 0.2% |
| Ireland | 60 | 0.1% |
| Israel | 9 | 0.0% |
| Italy | 116 | 0.3% |
| Jamaica | 224 | 0.5% |
| Japan | 104 | 0.2% |
| Jordan | 28 | 0.1% |
| Korea | 258 | 0.6% |
| Laos | 10 | 0.0% |
| Latin America | 5,624 | 13.0% |
| Latvia | 12 | 0.0% |
| Lebanon | 14 | 0.0% |
| Malaysia | 19 | 0.0% |
| Mexico | 2,306 | 5.3% |
| Moldova | 13 | 0.0% |
| Netherlands | 8 | 0.0% |
| Nicaragua | 565 | 1.3% |
| Northern Europe | 247 | 0.6% |
| Oceania | 788 | 1.8% |
| Pakistan | 324 | 0.7% |
| Peru | 107 | 0.3% |
| Philippines | 3,025 | 7.0% |
| Poland | 30 | 0.1% |
| Russia | 198 | 0.5% |
| South Africa | 32 | 0.1% |
| South America | 645 | 1.5% |
| South Central Asia | 1,031 | 2.4% |
| South Eastern Asia | 3,507 | 8.1% |
| Southern Europe | 338 | 0.8% |
| Spain | 49 | 0.1% |
| Sri Lanka | 8 | 0.0% |
| Taiwan | 321 | 0.7% |
| Thailand | 118 | 0.3% |
| Turkey | 80 | 0.2% |
| Ukraine | 128 | 0.3% |
| Venezuela | 59 | 0.1% |
| Vietnam | 164 | 0.4% |
| Western Asia | 155 | 0.4% |
| Western Europe | 282 | 0.6% | View All 72 Rows |
Sex and Age in San Bruno
Sex and Age in San Bruno
The most populous age groups in San Bruno are 35 to 39 Years (2,290 | 10.5%) for men and 35 to 39 Years (1,862 | 8.7%) for women.
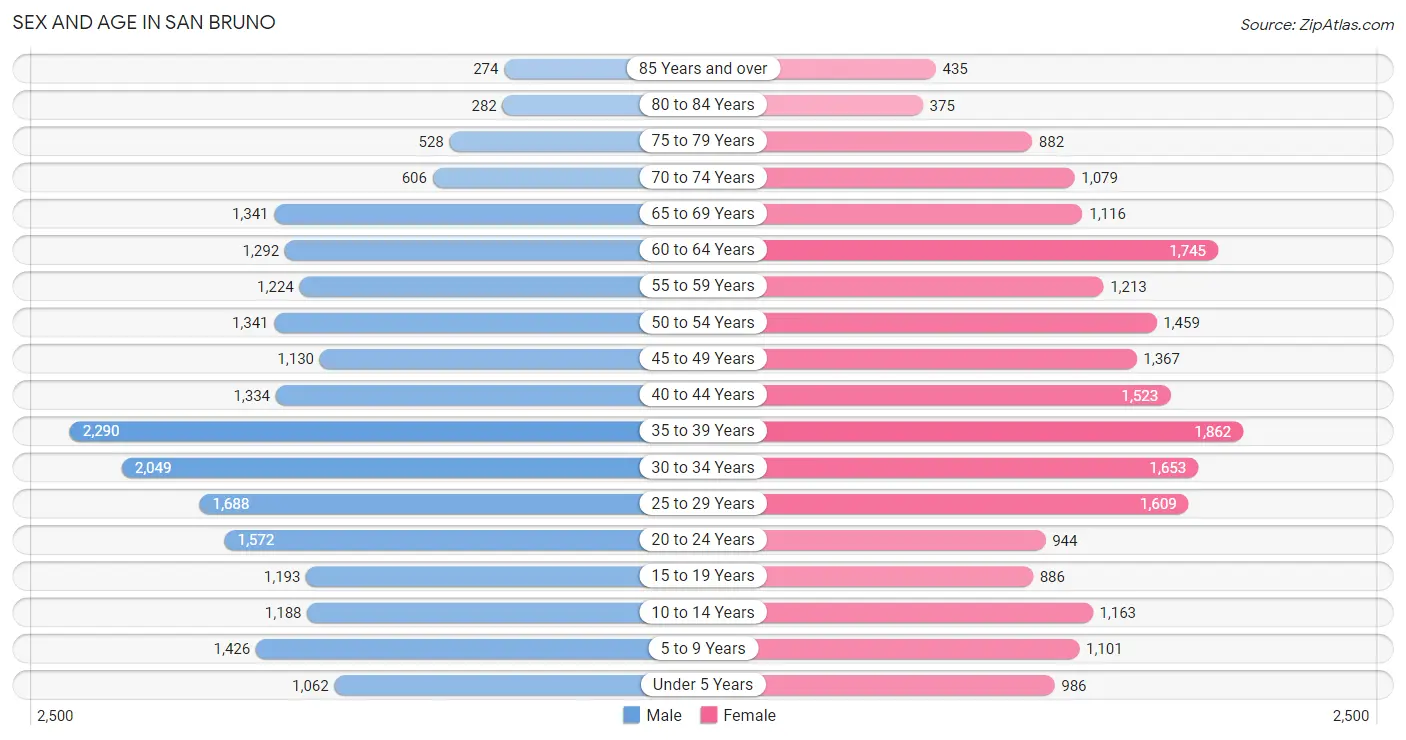
| Age Bracket | Male | Female |
| Under 5 Years | 1,062 (4.9%) | 986 (4.6%) |
| 5 to 9 Years | 1,426 (6.5%) | 1,101 (5.1%) |
| 10 to 14 Years | 1,188 (5.4%) | 1,163 (5.4%) |
| 15 to 19 Years | 1,193 (5.5%) | 886 (4.1%) |
| 20 to 24 Years | 1,572 (7.2%) | 944 (4.4%) |
| 25 to 29 Years | 1,688 (7.7%) | 1,609 (7.5%) |
| 30 to 34 Years | 2,049 (9.4%) | 1,653 (7.7%) |
| 35 to 39 Years | 2,290 (10.5%) | 1,862 (8.7%) |
| 40 to 44 Years | 1,334 (6.1%) | 1,523 (7.1%) |
| 45 to 49 Years | 1,130 (5.2%) | 1,367 (6.4%) |
| 50 to 54 Years | 1,341 (6.1%) | 1,459 (6.8%) |
| 55 to 59 Years | 1,224 (5.6%) | 1,213 (5.7%) |
| 60 to 64 Years | 1,292 (5.9%) | 1,745 (8.2%) |
| 65 to 69 Years | 1,341 (6.1%) | 1,116 (5.2%) |
| 70 to 74 Years | 606 (2.8%) | 1,079 (5.0%) |
| 75 to 79 Years | 528 (2.4%) | 882 (4.1%) |
| 80 to 84 Years | 282 (1.3%) | 375 (1.8%) |
| 85 Years and over | 274 (1.3%) | 435 (2.0%) |
| Total | 21,820 (100.0%) | 21,398 (100.0%) |
Families and Households in San Bruno
Median Family Size in San Bruno
The median family size in San Bruno is 3.35 persons per family, with single female/mother families (1,490 | 14.5%) accounting for the largest median family size of 3.56 persons per family. On the other hand, single male/father families (823 | 8.0%) represent the smallest median family size with 3.04 persons per family.
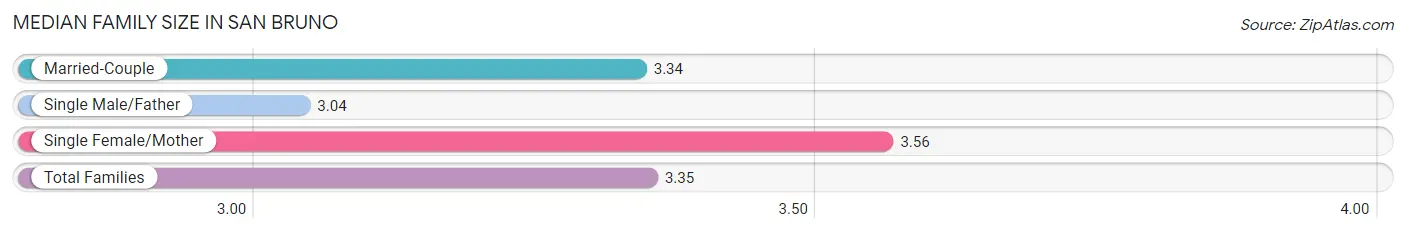
| Family Type | # Families | Family Size |
| Married-Couple | 7,946 (77.4%) | 3.34 |
| Single Male/Father | 823 (8.0%) | 3.04 |
| Single Female/Mother | 1,490 (14.5%) | 3.56 |
| Total Families | 10,259 (100.0%) | 3.35 |
Median Household Size in San Bruno
The median household size in San Bruno is 2.81 persons per household, with single female/mother households (1,490 | 9.8%) accounting for the largest median household size of 3.73 persons per household. non-family households (4,910 | 32.4%) represent the smallest median household size with 1.49 persons per household.
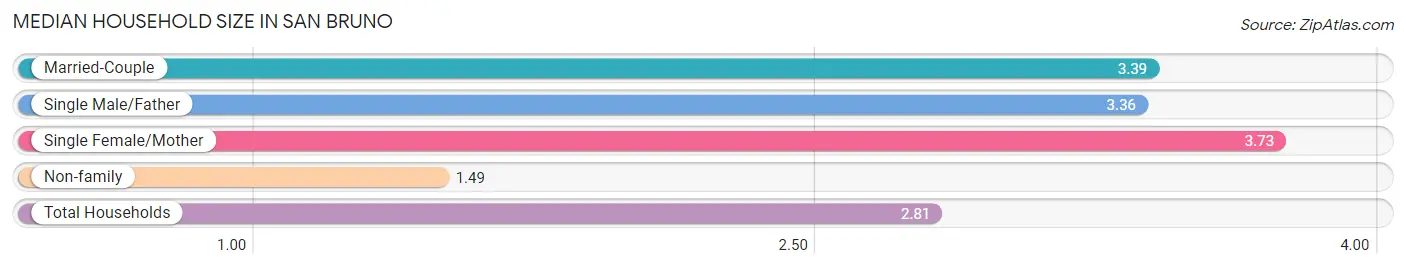
| Household Type | # Households | Household Size |
| Married-Couple | 7,946 (52.4%) | 3.39 |
| Single Male/Father | 823 (5.4%) | 3.36 |
| Single Female/Mother | 1,490 (9.8%) | 3.73 |
| Non-family | 4,910 (32.4%) | 1.49 |
| Total Households | 15,169 (100.0%) | 2.81 |
Household Size by Marriage Status in San Bruno
Out of a total of 15,169 households in San Bruno, 10,259 (67.6%) are family households, while 4,910 (32.4%) are nonfamily households. The most numerous type of family households are 2-person households, comprising 3,924, and the most common type of nonfamily households are 1-person households, comprising 3,687.
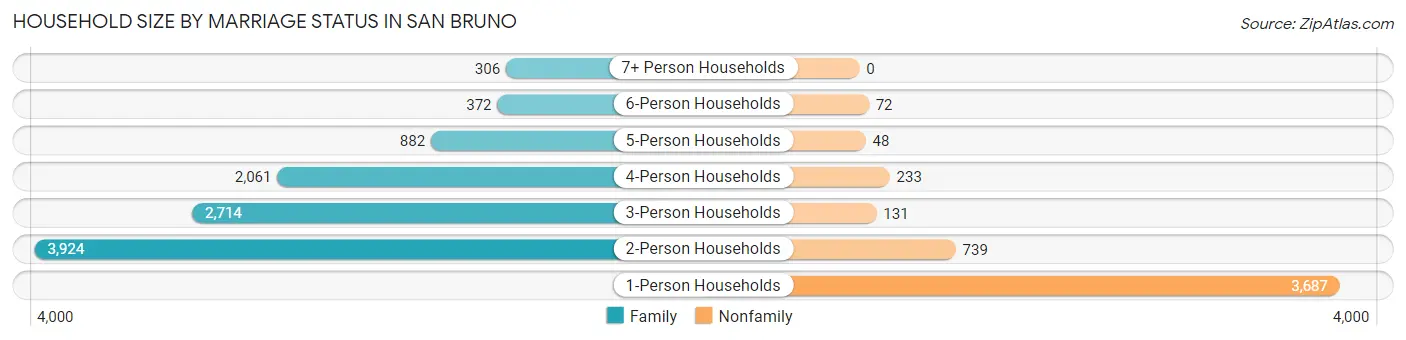
| Household Size | Family Households | Nonfamily Households |
| 1-Person Households | - | 3,687 (24.3%) |
| 2-Person Households | 3,924 (25.9%) | 739 (4.9%) |
| 3-Person Households | 2,714 (17.9%) | 131 (0.9%) |
| 4-Person Households | 2,061 (13.6%) | 233 (1.5%) |
| 5-Person Households | 882 (5.8%) | 48 (0.3%) |
| 6-Person Households | 372 (2.5%) | 72 (0.5%) |
| 7+ Person Households | 306 (2.0%) | 0 (0.0%) |
| Total | 10,259 (67.6%) | 4,910 (32.4%) |
Female Fertility in San Bruno
Fertility by Age in San Bruno
Average fertility rate in San Bruno is 41.0 births per 1,000 women. Women in the age bracket of 35 to 50 years have the highest fertility rate with 53.0 births per 1,000 women. Women in the age bracket of 35 to 50 years acount for 64.8% of all women with births.
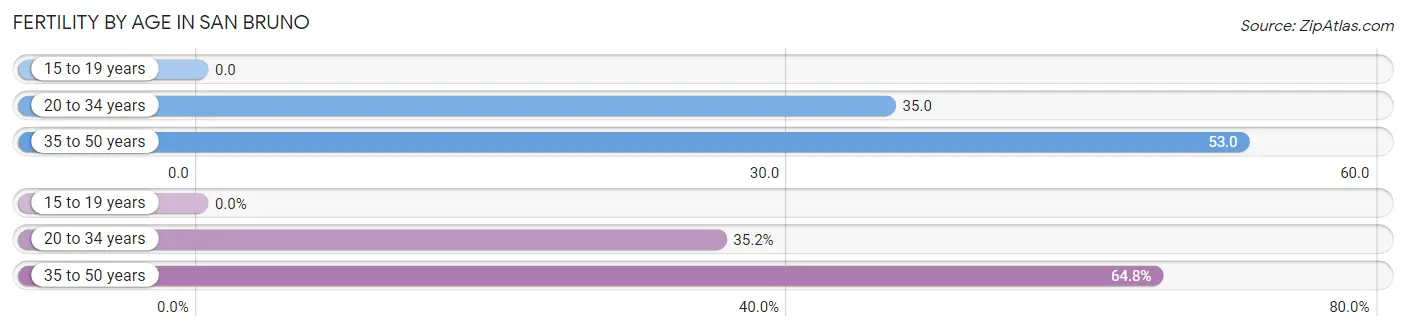
| Age Bracket | Women with Births | Births / 1,000 Women |
| 15 to 19 years | 0 (0.0%) | 0.0 |
| 20 to 34 years | 146 (35.2%) | 35.0 |
| 35 to 50 years | 269 (64.8%) | 53.0 |
| Total | 415 (100.0%) | 41.0 |
Fertility by Age by Marriage Status in San Bruno
91.8% of women with births (415) in San Bruno are married. The highest percentage of unmarried women with births falls into 20 to 34 years age bracket with 8.9% of them unmarried at the time of birth, while the lowest percentage of unmarried women with births belong to 35 to 50 years age bracket with 7.8% of them unmarried.
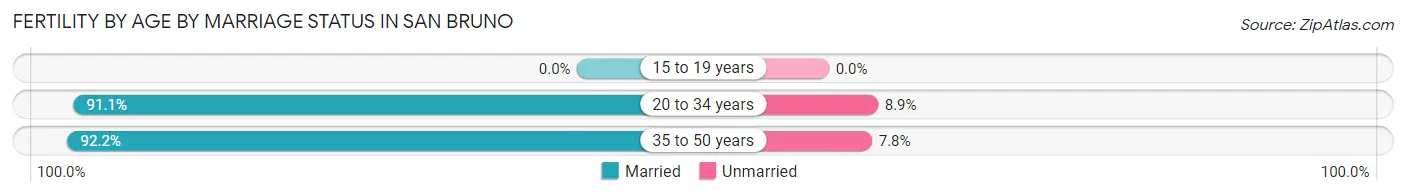
| Age Bracket | Married | Unmarried |
| 15 to 19 years | 0 (0.0%) | 0 (0.0%) |
| 20 to 34 years | 133 (91.1%) | 13 (8.9%) |
| 35 to 50 years | 248 (92.2%) | 21 (7.8%) |
| Total | 381 (91.8%) | 34 (8.2%) |
Fertility by Education in San Bruno
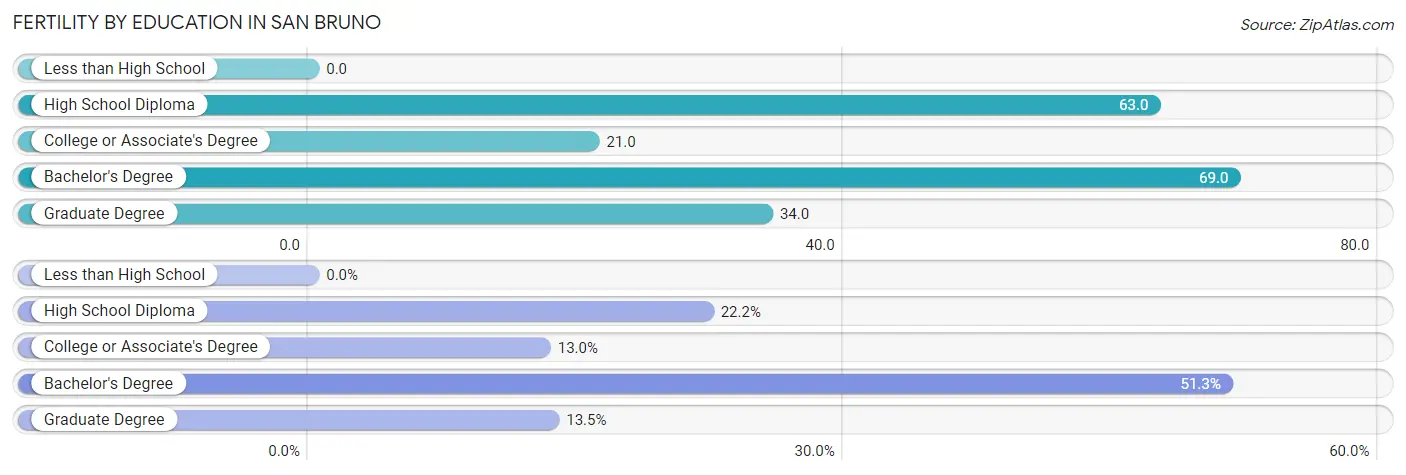
| Educational Attainment | Women with Births | Births / 1,000 Women |
| Less than High School | 0 (0.0%) | 0.0 |
| High School Diploma | 92 (22.2%) | 63.0 |
| College or Associate's Degree | 54 (13.0%) | 21.0 |
| Bachelor's Degree | 213 (51.3%) | 69.0 |
| Graduate Degree | 56 (13.5%) | 34.0 |
| Total | 415 (100.0%) | 41.0 |
Fertility by Education by Marriage Status in San Bruno
8.2% of women with births in San Bruno are unmarried. Women with the educational attainment of graduate degree are most likely to be married with 100.0% of them married at childbirth, while women with the educational attainment of college or associate's degree are least likely to be married with 22.2% of them unmarried at childbirth.
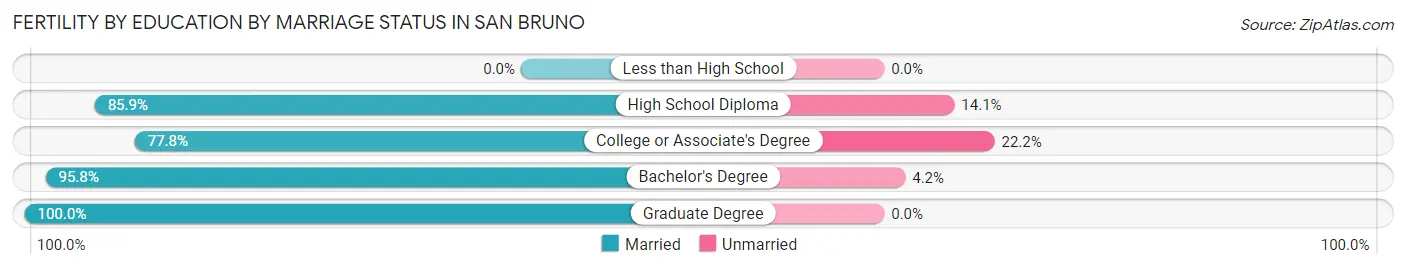
| Educational Attainment | Married | Unmarried |
| Less than High School | 0 (0.0%) | 0 (0.0%) |
| High School Diploma | 79 (85.9%) | 13 (14.1%) |
| College or Associate's Degree | 42 (77.8%) | 12 (22.2%) |
| Bachelor's Degree | 204 (95.8%) | 9 (4.2%) |
| Graduate Degree | 56 (100.0%) | 0 (0.0%) |
| Total | 381 (91.8%) | 34 (8.2%) |
Employment Characteristics in San Bruno
Employment by Class of Employer in San Bruno
Among the 23,292 employed individuals in San Bruno, private company employees (16,283 | 69.9%), local government employees (2,264 | 9.7%), and not-for-profit organizations (1,541 | 6.6%) make up the most common classes of employment.
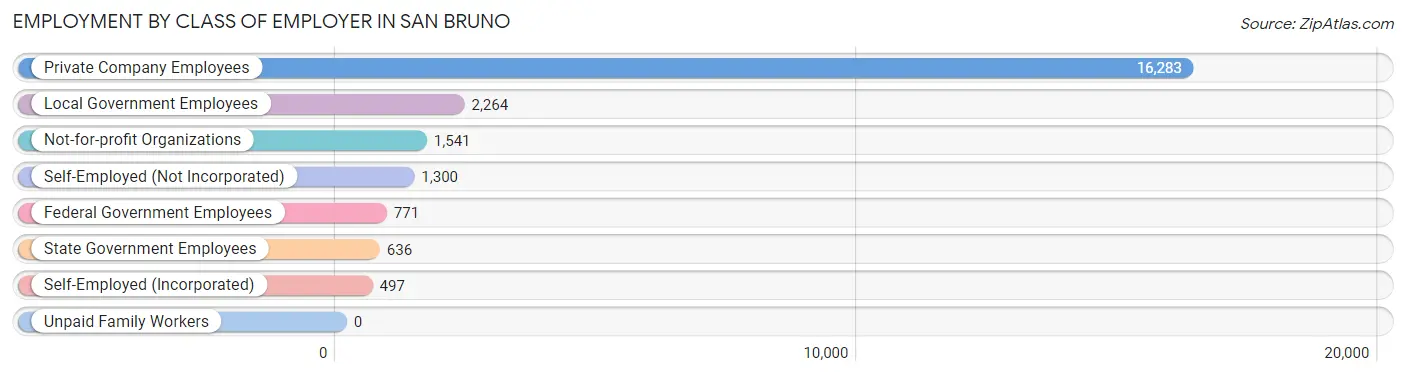
| Employer Class | # Employees | % Employees |
| Private Company Employees | 16,283 | 69.9% |
| Self-Employed (Incorporated) | 497 | 2.1% |
| Self-Employed (Not Incorporated) | 1,300 | 5.6% |
| Not-for-profit Organizations | 1,541 | 6.6% |
| Local Government Employees | 2,264 | 9.7% |
| State Government Employees | 636 | 2.7% |
| Federal Government Employees | 771 | 3.3% |
| Unpaid Family Workers | 0 | 0.0% |
| Total | 23,292 | 100.0% |
Employment Status by Age in San Bruno
According to the labor force statistics for San Bruno, out of the total population over 16 years of age (35,891), 70.0% or 25,124 individuals are in the labor force, with 4.6% or 1,156 of them unemployed. The age group with the highest labor force participation rate is 35 to 44 years, with 91.2% or 6,392 individuals in the labor force. Within the labor force, the 16 to 19 years age range has the highest percentage of unemployed individuals, with 8.9% or 48 of them being unemployed.
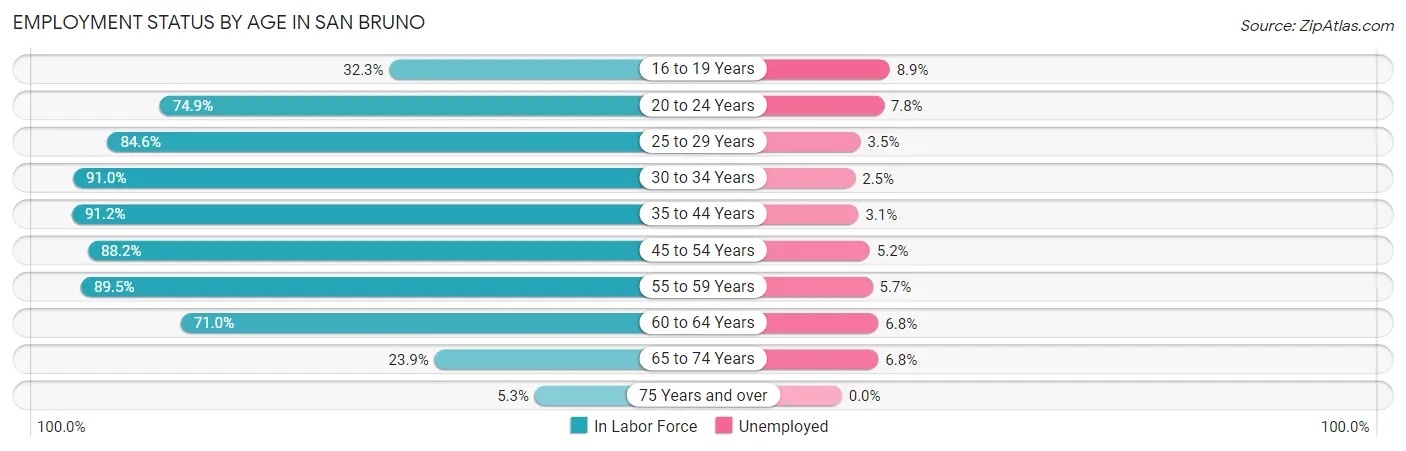
| Age Bracket | In Labor Force | Unemployed |
| 16 to 19 Years | 542 (32.3%) | 48 (8.9%) |
| 20 to 24 Years | 1,884 (74.9%) | 147 (7.8%) |
| 25 to 29 Years | 2,789 (84.6%) | 98 (3.5%) |
| 30 to 34 Years | 3,369 (91.0%) | 84 (2.5%) |
| 35 to 44 Years | 6,392 (91.2%) | 198 (3.1%) |
| 45 to 54 Years | 4,672 (88.2%) | 243 (5.2%) |
| 55 to 59 Years | 2,181 (89.5%) | 124 (5.7%) |
| 60 to 64 Years | 2,156 (71.0%) | 147 (6.8%) |
| 65 to 74 Years | 990 (23.9%) | 67 (6.8%) |
| 75 Years and over | 147 (5.3%) | 0 (0.0%) |
| Total | 25,124 (70.0%) | 1,156 (4.6%) |
Employment Status by Educational Attainment in San Bruno
According to labor force statistics for San Bruno, 87.0% of individuals (21,558) out of the total population between 25 and 64 years of age (24,779) are in the labor force, with 4.1% or 884 of them being unemployed. The group with the highest labor force participation rate are those with the educational attainment of bachelor's degree or higher, with 90.6% or 10,649 individuals in the labor force. Within the labor force, individuals with college / associate degree education have the highest percentage of unemployment, with 4.4% or 240 of them being unemployed.
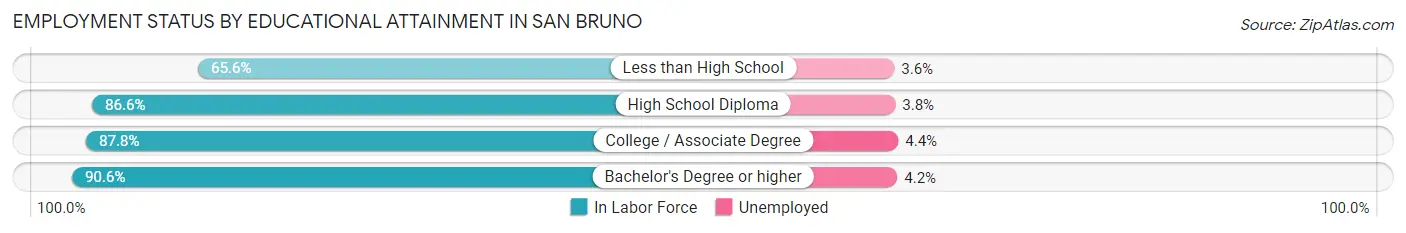
| Educational Attainment | In Labor Force | Unemployed |
| Less than High School | 1,401 (65.6%) | 77 (3.6%) |
| High School Diploma | 4,044 (86.6%) | 177 (3.8%) |
| College / Associate Degree | 5,461 (87.8%) | 274 (4.4%) |
| Bachelor's Degree or higher | 10,649 (90.6%) | 494 (4.2%) |
| Total | 21,558 (87.0%) | 1,016 (4.1%) |
Employment Occupations by Sex in San Bruno
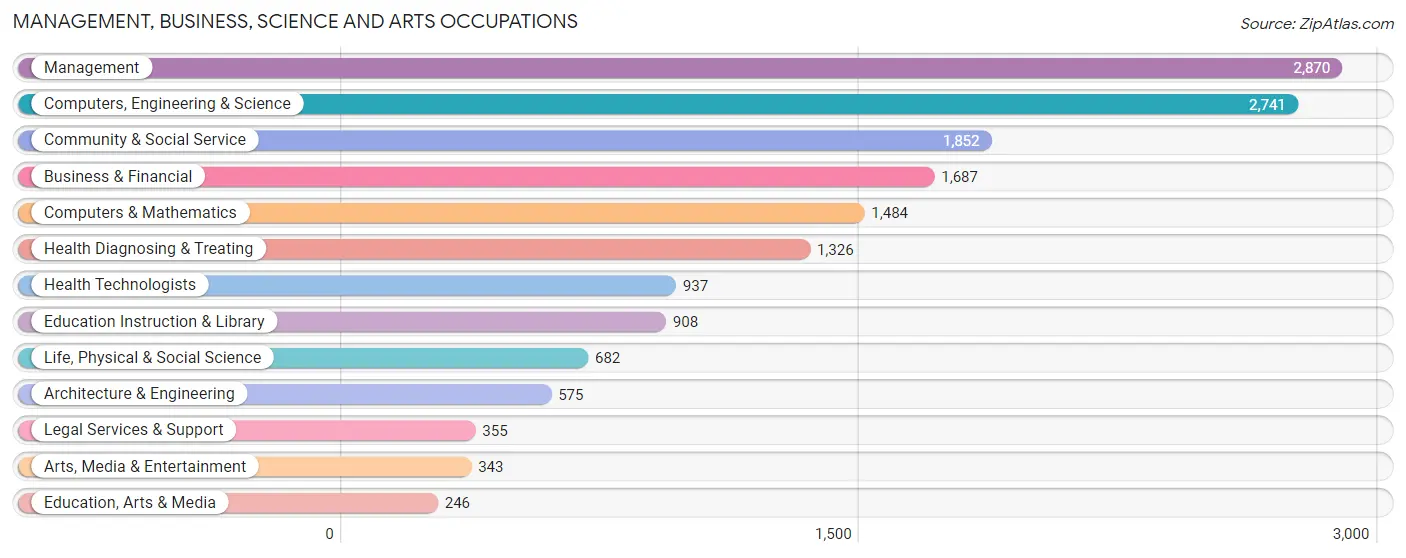
Management, Business, Science and Arts Occupations
The most common Management, Business, Science and Arts occupations in San Bruno are Management (2,870 | 12.0%), Computers, Engineering & Science (2,741 | 11.5%), Community & Social Service (1,852 | 7.7%), Business & Financial (1,687 | 7.0%), and Computers & Mathematics (1,484 | 6.2%).
Management, Business, Science and Arts Occupations by Sex
Within the Management, Business, Science and Arts occupations in San Bruno, the most male-oriented occupations are Architecture & Engineering (92.5%), Computers & Mathematics (77.8%), and Computers, Engineering & Science (73.6%), while the most female-oriented occupations are Health Diagnosing & Treating (75.0%), Health Technologists (69.6%), and Business & Financial (68.3%).
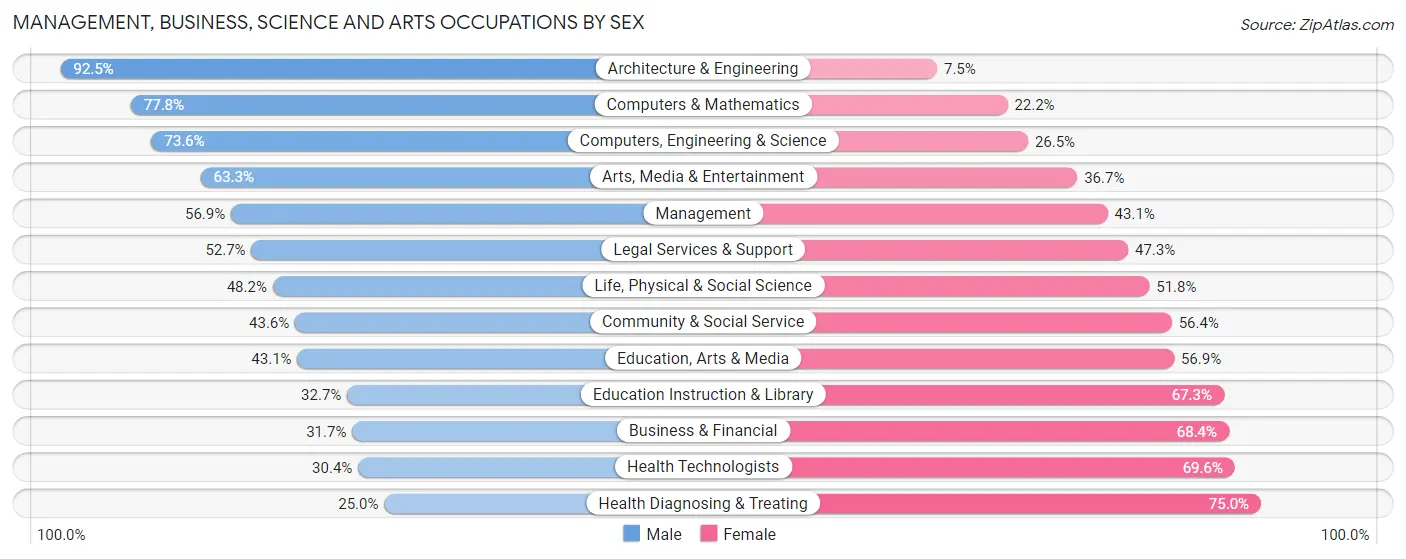
| Occupation | Male | Female |
| Management | 1,634 (56.9%) | 1,236 (43.1%) |
| Business & Financial | 534 (31.7%) | 1,153 (68.3%) |
| Computers, Engineering & Science | 2,016 (73.6%) | 725 (26.5%) |
| Computers & Mathematics | 1,155 (77.8%) | 329 (22.2%) |
| Architecture & Engineering | 532 (92.5%) | 43 (7.5%) |
| Life, Physical & Social Science | 329 (48.2%) | 353 (51.8%) |
| Community & Social Service | 807 (43.6%) | 1,045 (56.4%) |
| Education, Arts & Media | 106 (43.1%) | 140 (56.9%) |
| Legal Services & Support | 187 (52.7%) | 168 (47.3%) |
| Education Instruction & Library | 297 (32.7%) | 611 (67.3%) |
| Arts, Media & Entertainment | 217 (63.3%) | 126 (36.7%) |
| Health Diagnosing & Treating | 331 (25.0%) | 995 (75.0%) |
| Health Technologists | 285 (30.4%) | 652 (69.6%) |
| Total (Category) | 5,322 (50.8%) | 5,154 (49.2%) |
| Total (Overall) | 12,830 (53.6%) | 11,089 (46.4%) |
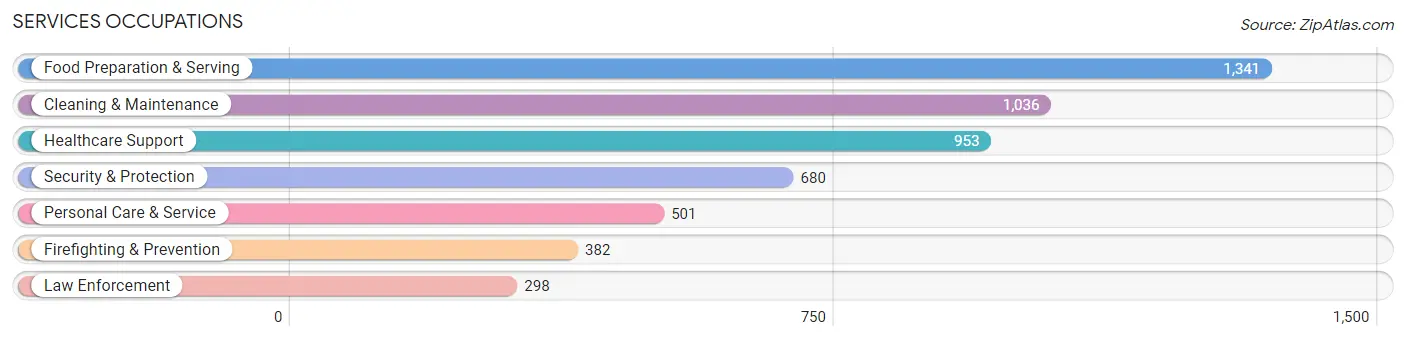
Services Occupations
The most common Services occupations in San Bruno are Food Preparation & Serving (1,341 | 5.6%), Cleaning & Maintenance (1,036 | 4.3%), Healthcare Support (953 | 4.0%), Security & Protection (680 | 2.8%), and Personal Care & Service (501 | 2.1%).
Services Occupations by Sex
Within the Services occupations in San Bruno, the most male-oriented occupations are Firefighting & Prevention (98.4%), Security & Protection (96.9%), and Law Enforcement (95.0%), while the most female-oriented occupations are Healthcare Support (87.0%), Personal Care & Service (80.4%), and Cleaning & Maintenance (44.6%).
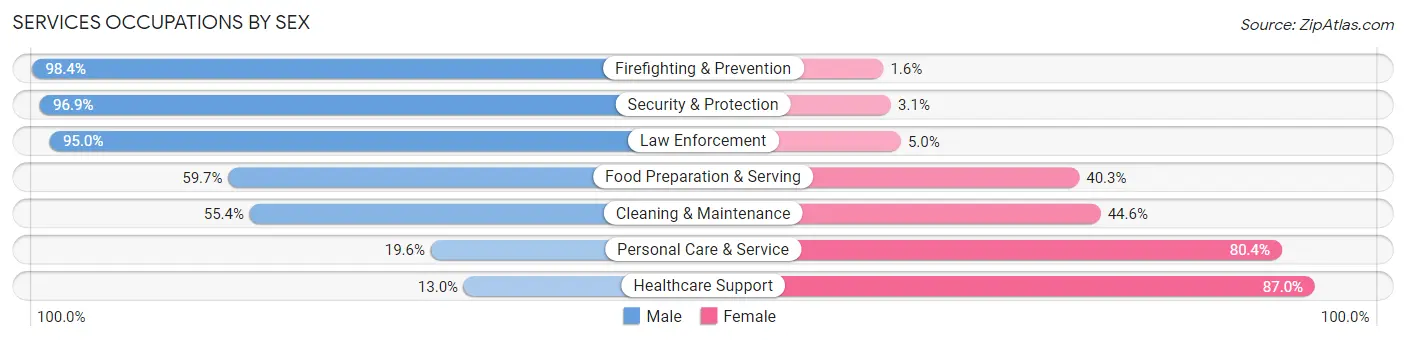
| Occupation | Male | Female |
| Healthcare Support | 124 (13.0%) | 829 (87.0%) |
| Security & Protection | 659 (96.9%) | 21 (3.1%) |
| Firefighting & Prevention | 376 (98.4%) | 6 (1.6%) |
| Law Enforcement | 283 (95.0%) | 15 (5.0%) |
| Food Preparation & Serving | 800 (59.7%) | 541 (40.3%) |
| Cleaning & Maintenance | 574 (55.4%) | 462 (44.6%) |
| Personal Care & Service | 98 (19.6%) | 403 (80.4%) |
| Total (Category) | 2,255 (50.0%) | 2,256 (50.0%) |
| Total (Overall) | 12,830 (53.6%) | 11,089 (46.4%) |
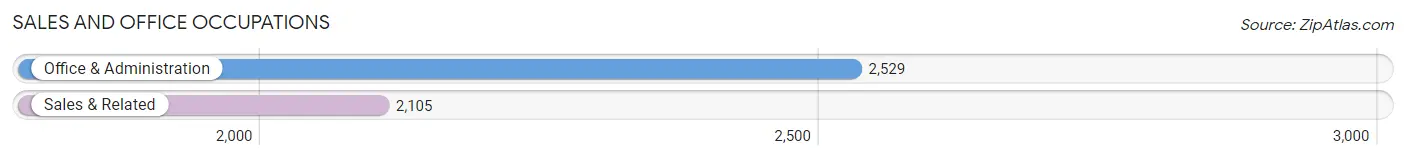
Sales and Office Occupations
The most common Sales and Office occupations in San Bruno are Office & Administration (2,529 | 10.6%), and Sales & Related (2,105 | 8.8%).
Sales and Office Occupations by Sex
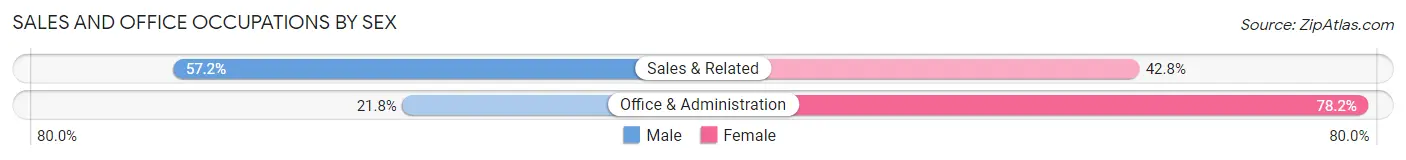
| Occupation | Male | Female |
| Sales & Related | 1,204 (57.2%) | 901 (42.8%) |
| Office & Administration | 552 (21.8%) | 1,977 (78.2%) |
| Total (Category) | 1,756 (37.9%) | 2,878 (62.1%) |
| Total (Overall) | 12,830 (53.6%) | 11,089 (46.4%) |
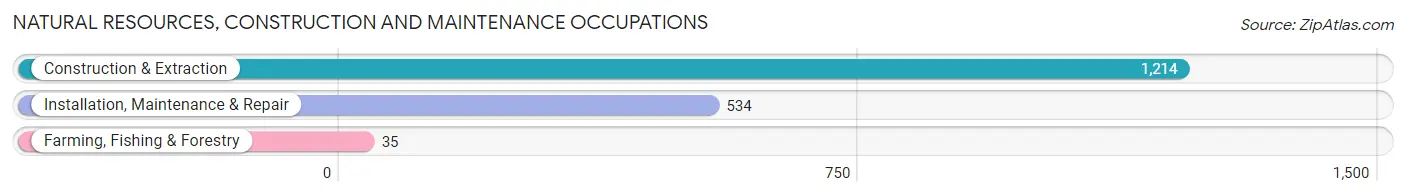
Natural Resources, Construction and Maintenance Occupations
The most common Natural Resources, Construction and Maintenance occupations in San Bruno are Construction & Extraction (1,214 | 5.1%), Installation, Maintenance & Repair (534 | 2.2%), and Farming, Fishing & Forestry (35 | 0.2%).
Natural Resources, Construction and Maintenance Occupations by Sex
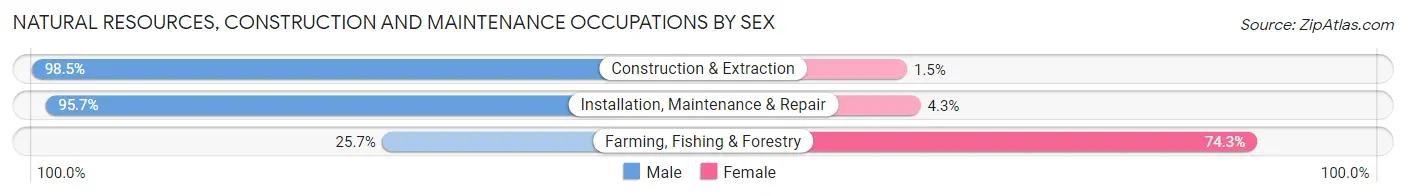
| Occupation | Male | Female |
| Farming, Fishing & Forestry | 9 (25.7%) | 26 (74.3%) |
| Construction & Extraction | 1,196 (98.5%) | 18 (1.5%) |
| Installation, Maintenance & Repair | 511 (95.7%) | 23 (4.3%) |
| Total (Category) | 1,716 (96.2%) | 67 (3.8%) |
| Total (Overall) | 12,830 (53.6%) | 11,089 (46.4%) |
Production, Transportation and Moving Occupations
The most common Production, Transportation and Moving occupations in San Bruno are Transportation (1,006 | 4.2%), Production (858 | 3.6%), and Material Moving (651 | 2.7%).
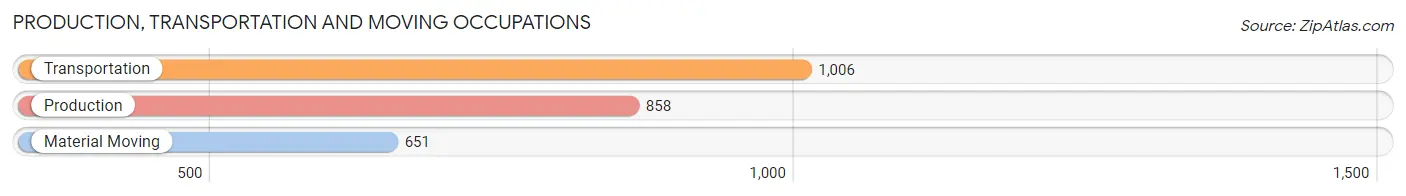
Production, Transportation and Moving Occupations by Sex
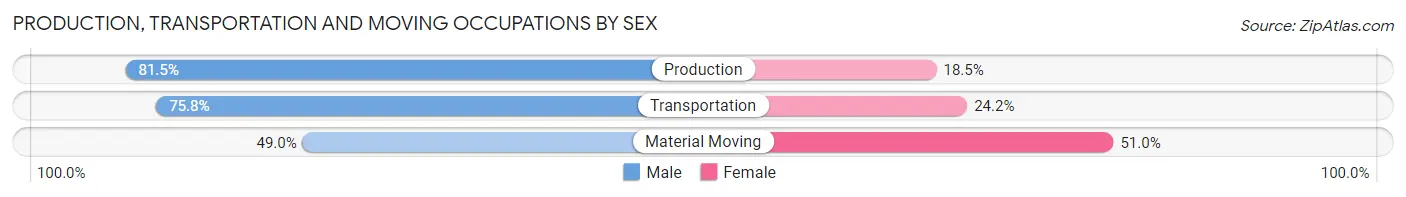
| Occupation | Male | Female |
| Production | 699 (81.5%) | 159 (18.5%) |
| Transportation | 763 (75.8%) | 243 (24.2%) |
| Material Moving | 319 (49.0%) | 332 (51.0%) |
| Total (Category) | 1,781 (70.8%) | 734 (29.2%) |
| Total (Overall) | 12,830 (53.6%) | 11,089 (46.4%) |
Employment Industries by Sex in San Bruno
Employment Industries in San Bruno
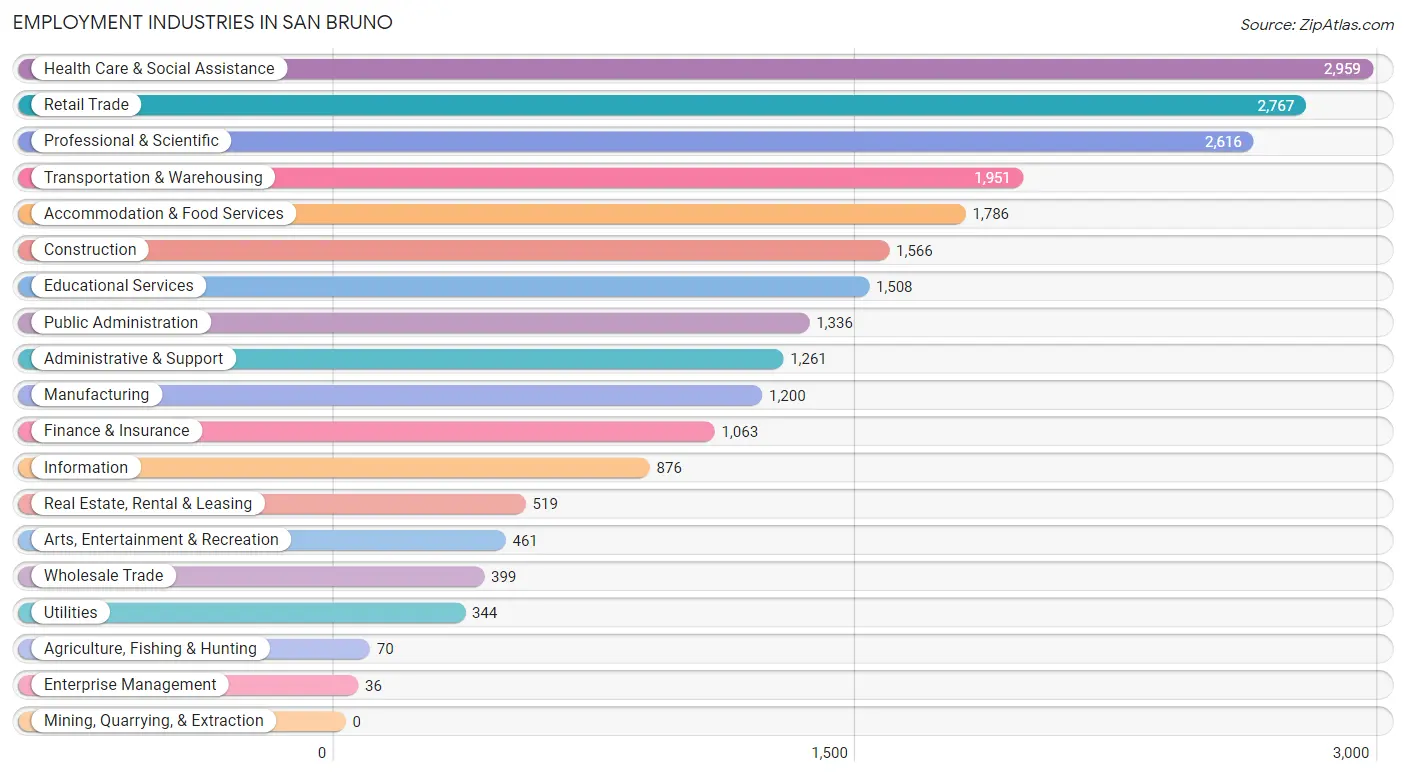
The major employment industries in San Bruno include Health Care & Social Assistance (2,959 | 12.4%), Retail Trade (2,767 | 11.6%), Professional & Scientific (2,616 | 10.9%), Transportation & Warehousing (1,951 | 8.2%), and Accommodation & Food Services (1,786 | 7.5%).
Employment Industries by Sex in San Bruno
The San Bruno industries that see more men than women are Construction (97.1%), Utilities (83.4%), and Administrative & Support (67.9%), whereas the industries that tend to have a higher number of women are Health Care & Social Assistance (76.6%), Finance & Insurance (63.2%), and Arts, Entertainment & Recreation (61.4%).
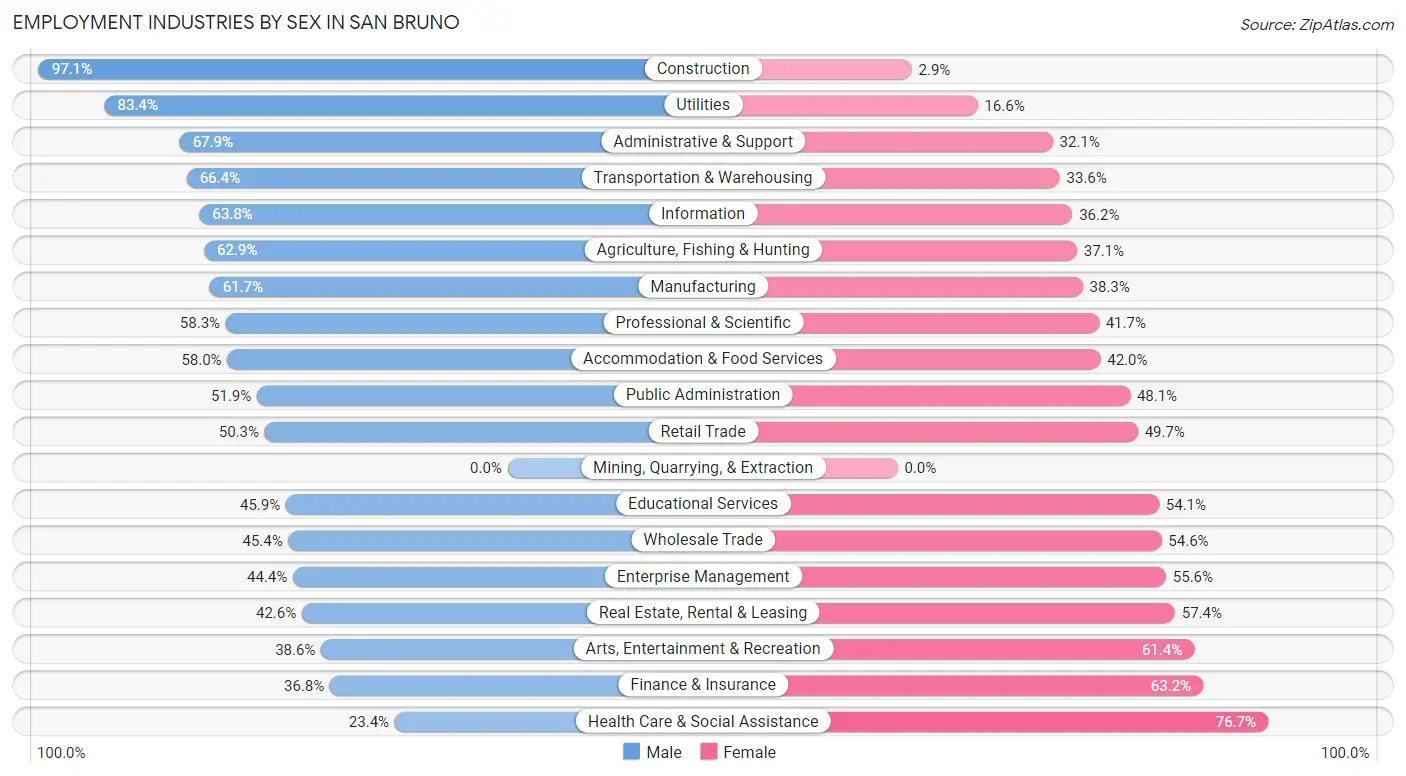
| Industry | Male | Female |
| Agriculture, Fishing & Hunting | 44 (62.9%) | 26 (37.1%) |
| Mining, Quarrying, & Extraction | 0 (0.0%) | 0 (0.0%) |
| Construction | 1,520 (97.1%) | 46 (2.9%) |
| Manufacturing | 740 (61.7%) | 460 (38.3%) |
| Wholesale Trade | 181 (45.4%) | 218 (54.6%) |
| Retail Trade | 1,391 (50.3%) | 1,376 (49.7%) |
| Transportation & Warehousing | 1,296 (66.4%) | 655 (33.6%) |
| Utilities | 287 (83.4%) | 57 (16.6%) |
| Information | 559 (63.8%) | 317 (36.2%) |
| Finance & Insurance | 391 (36.8%) | 672 (63.2%) |
| Real Estate, Rental & Leasing | 221 (42.6%) | 298 (57.4%) |
| Professional & Scientific | 1,526 (58.3%) | 1,090 (41.7%) |
| Enterprise Management | 16 (44.4%) | 20 (55.6%) |
| Administrative & Support | 856 (67.9%) | 405 (32.1%) |
| Educational Services | 692 (45.9%) | 816 (54.1%) |
| Health Care & Social Assistance | 691 (23.4%) | 2,268 (76.6%) |
| Arts, Entertainment & Recreation | 178 (38.6%) | 283 (61.4%) |
| Accommodation & Food Services | 1,036 (58.0%) | 750 (42.0%) |
| Public Administration | 693 (51.9%) | 643 (48.1%) |
| Total | 12,830 (53.6%) | 11,089 (46.4%) |
Education in San Bruno
School Enrollment in San Bruno
The most common levels of schooling among the 9,733 students in San Bruno are college / undergraduate (2,625 | 27.0%), middle school (1,987 | 20.4%), and elementary school (1,795 | 18.4%).
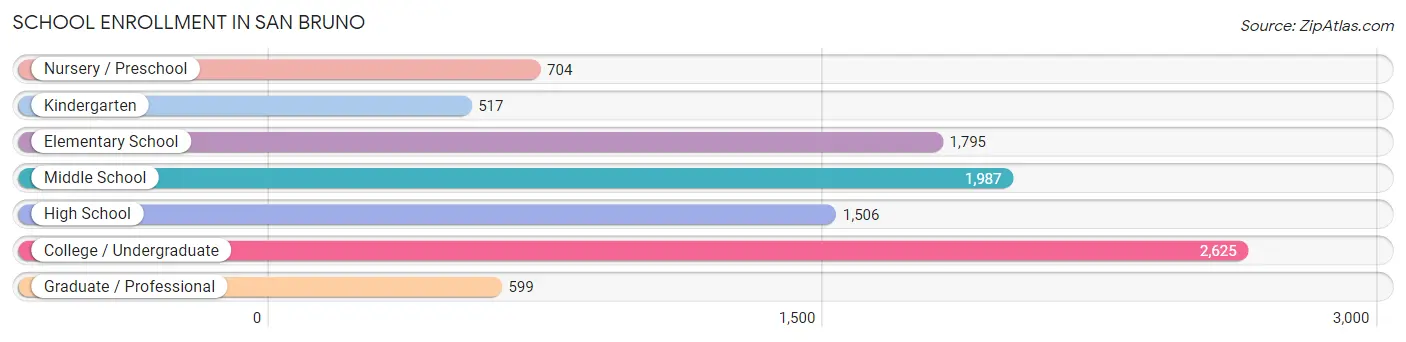
| School Level | # Students | % Students |
| Nursery / Preschool | 704 | 7.2% |
| Kindergarten | 517 | 5.3% |
| Elementary School | 1,795 | 18.4% |
| Middle School | 1,987 | 20.4% |
| High School | 1,506 | 15.5% |
| College / Undergraduate | 2,625 | 27.0% |
| Graduate / Professional | 599 | 6.1% |
| Total | 9,733 | 100.0% |
School Enrollment by Age by Funding Source in San Bruno
Out of a total of 9,733 students who are enrolled in schools in San Bruno, 2,112 (21.7%) attend a private institution, while the remaining 7,621 (78.3%) are enrolled in public schools. The age group of 3 to 4 year olds has the highest likelihood of being enrolled in private schools, with 274 (50.2% in the age bracket) enrolled. Conversely, the age group of 18 to 19 year olds has the lowest likelihood of being enrolled in a private school, with 689 (92.4% in the age bracket) attending a public institution.
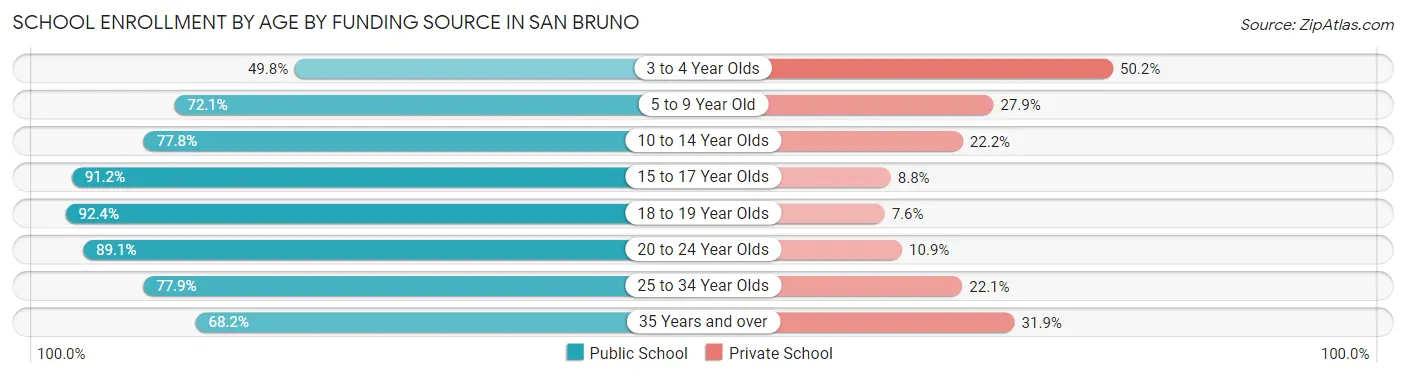
| Age Bracket | Public School | Private School |
| 3 to 4 Year Olds | 272 (49.8%) | 274 (50.2%) |
| 5 to 9 Year Old | 1,703 (72.1%) | 659 (27.9%) |
| 10 to 14 Year Olds | 1,804 (77.8%) | 515 (22.2%) |
| 15 to 17 Year Olds | 1,048 (91.2%) | 101 (8.8%) |
| 18 to 19 Year Olds | 689 (92.4%) | 57 (7.6%) |
| 20 to 24 Year Olds | 1,039 (89.1%) | 127 (10.9%) |
| 25 to 34 Year Olds | 634 (77.9%) | 180 (22.1%) |
| 35 Years and over | 430 (68.1%) | 201 (31.9%) |
| Total | 7,621 (78.3%) | 2,112 (21.7%) |
Educational Attainment by Field of Study in San Bruno
Business (2,690 | 18.4%), engineering (1,556 | 10.6%), social sciences (1,500 | 10.2%), science & technology (1,376 | 9.4%), and bio, nature & agricultural (1,234 | 8.4%) are the most common fields of study among 14,647 individuals in San Bruno who have obtained a bachelor's degree or higher.

| Field of Study | # Graduates | % Graduates |
| Computers & Mathematics | 928 | 6.3% |
| Bio, Nature & Agricultural | 1,234 | 8.4% |
| Physical & Health Sciences | 455 | 3.1% |
| Psychology | 785 | 5.4% |
| Social Sciences | 1,500 | 10.2% |
| Engineering | 1,556 | 10.6% |
| Multidisciplinary Studies | 244 | 1.7% |
| Science & Technology | 1,376 | 9.4% |
| Business | 2,690 | 18.4% |
| Education | 841 | 5.7% |
| Literature & Languages | 595 | 4.1% |
| Liberal Arts & History | 579 | 4.0% |
| Visual & Performing Arts | 525 | 3.6% |
| Communications | 735 | 5.0% |
| Arts & Humanities | 604 | 4.1% |
| Total | 14,647 | 100.0% |
Transportation & Commute in San Bruno
Vehicle Availability by Sex in San Bruno
The most prevalent vehicle ownership categories in San Bruno are males with 2 vehicles (4,066, accounting for 32.5%) and females with 2 vehicles (4,063, making up 38.2%).
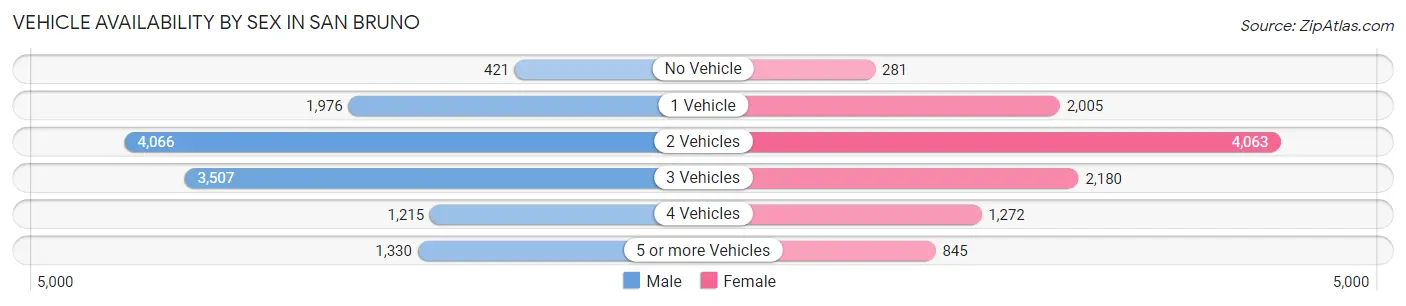
| Vehicles Available | Male | Female |
| No Vehicle | 421 (3.4%) | 281 (2.6%) |
| 1 Vehicle | 1,976 (15.8%) | 2,005 (18.8%) |
| 2 Vehicles | 4,066 (32.5%) | 4,063 (38.2%) |
| 3 Vehicles | 3,507 (28.0%) | 2,180 (20.5%) |
| 4 Vehicles | 1,215 (9.7%) | 1,272 (11.9%) |
| 5 or more Vehicles | 1,330 (10.6%) | 845 (7.9%) |
| Total | 12,515 (100.0%) | 10,646 (100.0%) |
Commute Time in San Bruno
The most frequently occuring commute durations in San Bruno are 30 to 34 minutes (3,312 commuters, 16.7%), 15 to 19 minutes (3,077 commuters, 15.5%), and 10 to 14 minutes (2,810 commuters, 14.1%).
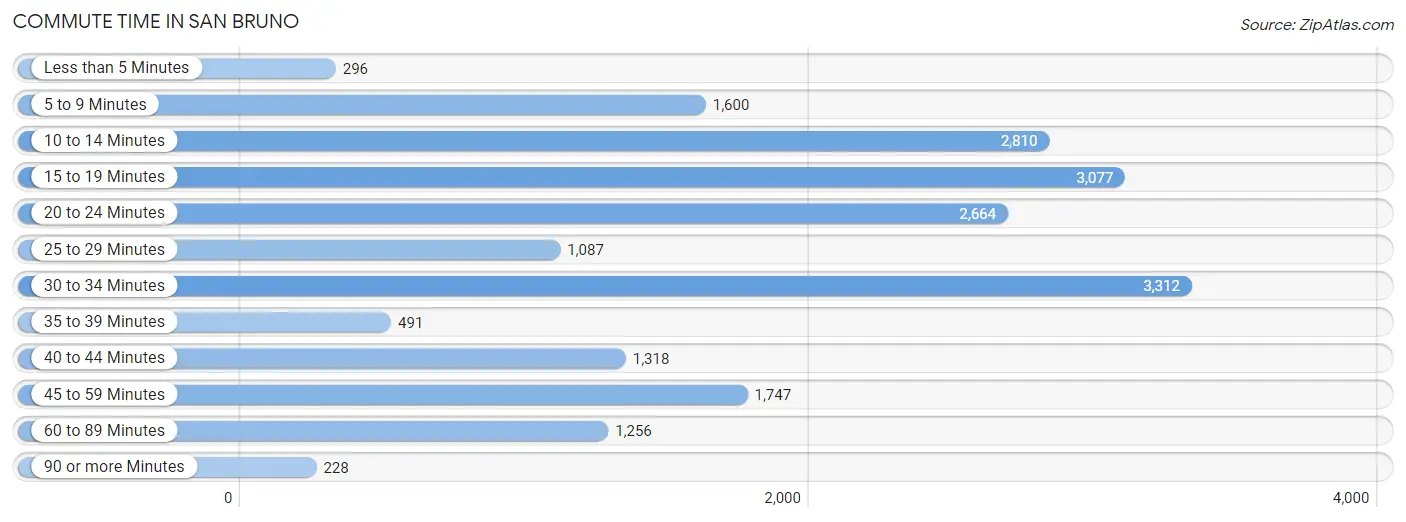
| Commute Time | # Commuters | % Commuters |
| Less than 5 Minutes | 296 | 1.5% |
| 5 to 9 Minutes | 1,600 | 8.1% |
| 10 to 14 Minutes | 2,810 | 14.1% |
| 15 to 19 Minutes | 3,077 | 15.5% |
| 20 to 24 Minutes | 2,664 | 13.4% |
| 25 to 29 Minutes | 1,087 | 5.5% |
| 30 to 34 Minutes | 3,312 | 16.7% |
| 35 to 39 Minutes | 491 | 2.5% |
| 40 to 44 Minutes | 1,318 | 6.6% |
| 45 to 59 Minutes | 1,747 | 8.8% |
| 60 to 89 Minutes | 1,256 | 6.3% |
| 90 or more Minutes | 228 | 1.1% |
Commute Time by Sex in San Bruno
The most common commute times in San Bruno are 10 to 14 minutes (1,834 commuters, 16.9%) for males and 15 to 19 minutes (1,539 commuters, 17.1%) for females.
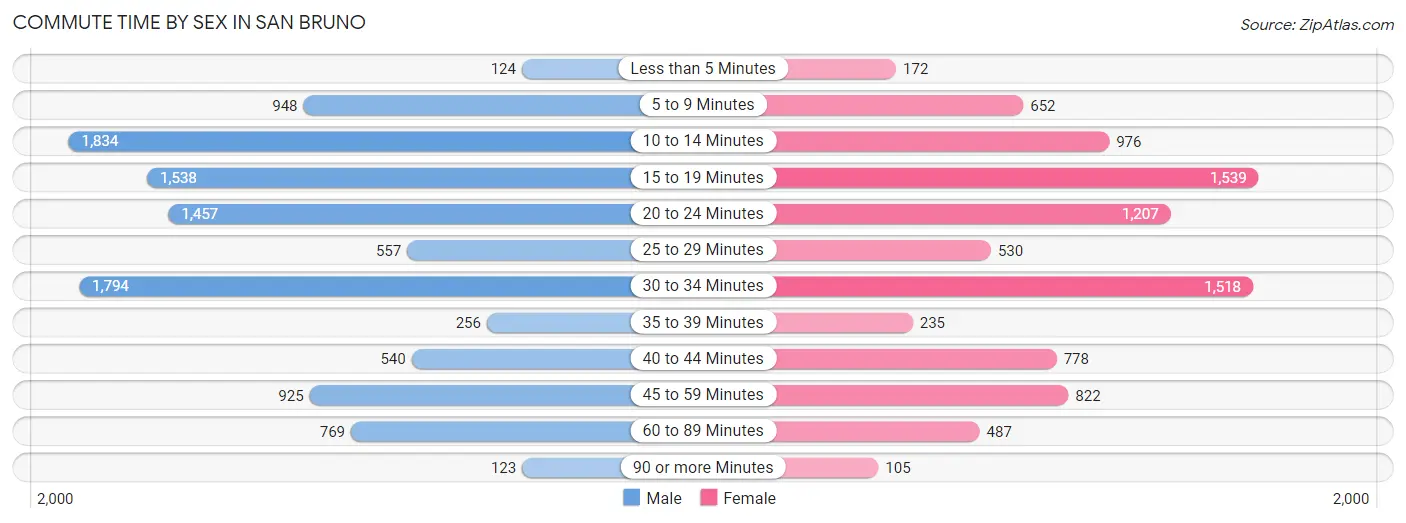
| Commute Time | Male | Female |
| Less than 5 Minutes | 124 (1.1%) | 172 (1.9%) |
| 5 to 9 Minutes | 948 (8.7%) | 652 (7.2%) |
| 10 to 14 Minutes | 1,834 (16.9%) | 976 (10.8%) |
| 15 to 19 Minutes | 1,538 (14.2%) | 1,539 (17.1%) |
| 20 to 24 Minutes | 1,457 (13.4%) | 1,207 (13.4%) |
| 25 to 29 Minutes | 557 (5.1%) | 530 (5.9%) |
| 30 to 34 Minutes | 1,794 (16.5%) | 1,518 (16.8%) |
| 35 to 39 Minutes | 256 (2.4%) | 235 (2.6%) |
| 40 to 44 Minutes | 540 (5.0%) | 778 (8.6%) |
| 45 to 59 Minutes | 925 (8.5%) | 822 (9.1%) |
| 60 to 89 Minutes | 769 (7.1%) | 487 (5.4%) |
| 90 or more Minutes | 123 (1.1%) | 105 (1.2%) |
Time of Departure to Work by Sex in San Bruno
The most frequent times of departure to work in San Bruno are 8:00 AM to 8:29 AM (1,853, 17.1%) for males and 8:00 AM to 8:29 AM (1,542, 17.1%) for females.
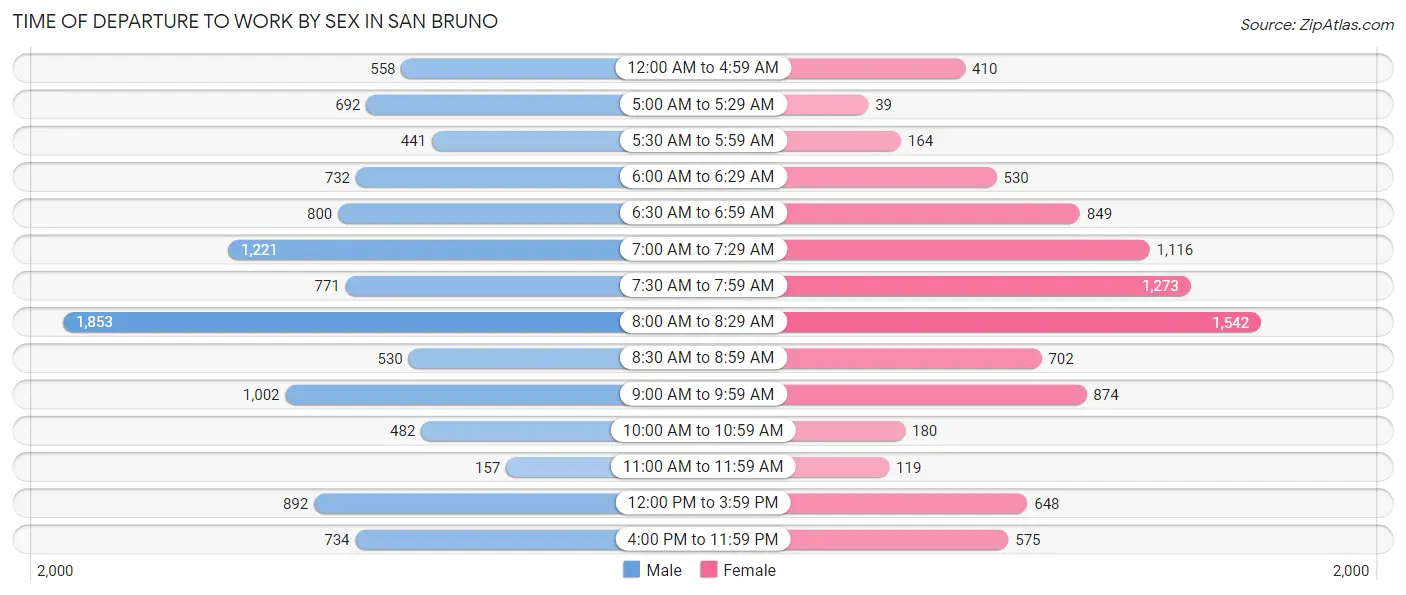
| Time of Departure | Male | Female |
| 12:00 AM to 4:59 AM | 558 (5.1%) | 410 (4.5%) |
| 5:00 AM to 5:29 AM | 692 (6.4%) | 39 (0.4%) |
| 5:30 AM to 5:59 AM | 441 (4.1%) | 164 (1.8%) |
| 6:00 AM to 6:29 AM | 732 (6.7%) | 530 (5.9%) |
| 6:30 AM to 6:59 AM | 800 (7.4%) | 849 (9.4%) |
| 7:00 AM to 7:29 AM | 1,221 (11.2%) | 1,116 (12.4%) |
| 7:30 AM to 7:59 AM | 771 (7.1%) | 1,273 (14.1%) |
| 8:00 AM to 8:29 AM | 1,853 (17.1%) | 1,542 (17.1%) |
| 8:30 AM to 8:59 AM | 530 (4.9%) | 702 (7.8%) |
| 9:00 AM to 9:59 AM | 1,002 (9.2%) | 874 (9.7%) |
| 10:00 AM to 10:59 AM | 482 (4.4%) | 180 (2.0%) |
| 11:00 AM to 11:59 AM | 157 (1.5%) | 119 (1.3%) |
| 12:00 PM to 3:59 PM | 892 (8.2%) | 648 (7.2%) |
| 4:00 PM to 11:59 PM | 734 (6.8%) | 575 (6.4%) |
| Total | 10,865 (100.0%) | 9,021 (100.0%) |
Housing Occupancy in San Bruno
Occupancy by Ownership in San Bruno
Of the total 15,169 dwellings in San Bruno, owner-occupied units account for 9,530 (62.8%), while renter-occupied units make up 5,639 (37.2%).
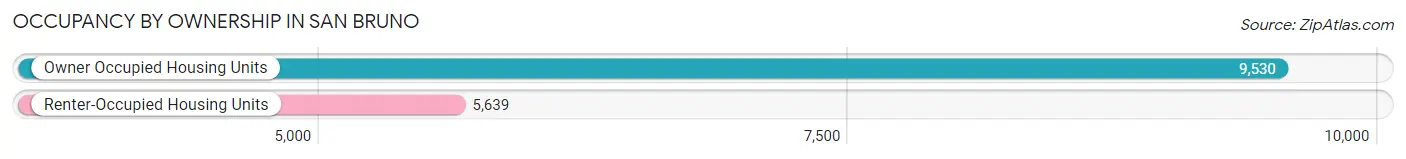
| Occupancy | # Housing Units | % Housing Units |
| Owner Occupied Housing Units | 9,530 | 62.8% |
| Renter-Occupied Housing Units | 5,639 | 37.2% |
| Total Occupied Housing Units | 15,169 | 100.0% |
Occupancy by Household Size in San Bruno
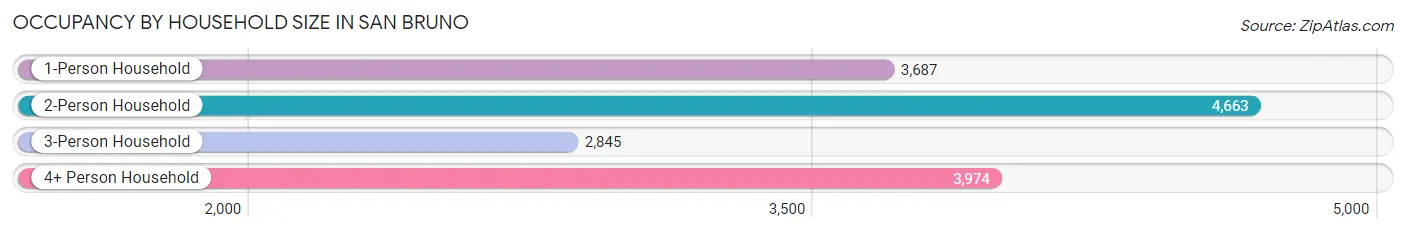
| Household Size | # Housing Units | % Housing Units |
| 1-Person Household | 3,687 | 24.3% |
| 2-Person Household | 4,663 | 30.7% |
| 3-Person Household | 2,845 | 18.8% |
| 4+ Person Household | 3,974 | 26.2% |
| Total Housing Units | 15,169 | 100.0% |
Occupancy by Ownership by Household Size in San Bruno
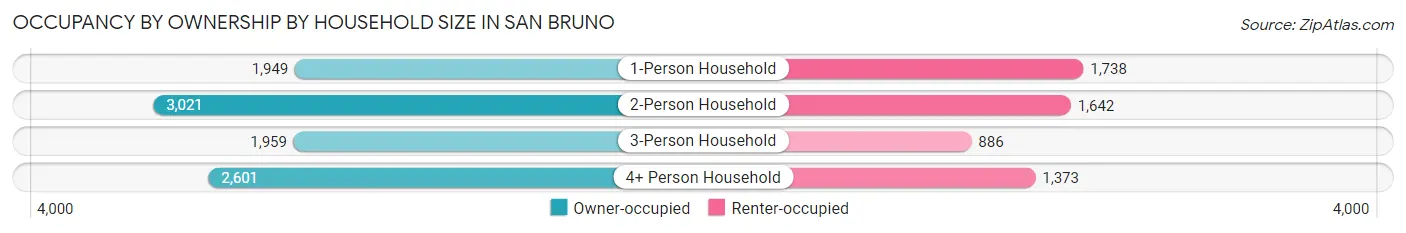
| Household Size | Owner-occupied | Renter-occupied |
| 1-Person Household | 1,949 (52.9%) | 1,738 (47.1%) |
| 2-Person Household | 3,021 (64.8%) | 1,642 (35.2%) |
| 3-Person Household | 1,959 (68.9%) | 886 (31.1%) |
| 4+ Person Household | 2,601 (65.4%) | 1,373 (34.5%) |
| Total Housing Units | 9,530 (62.8%) | 5,639 (37.2%) |
Occupancy by Educational Attainment in San Bruno
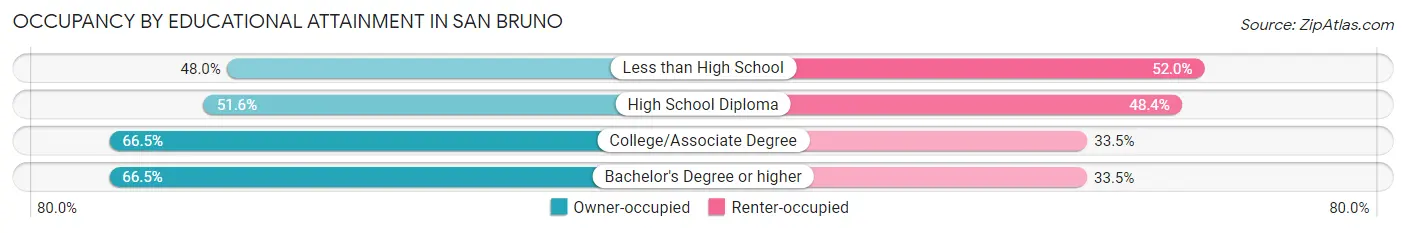
| Household Size | Owner-occupied | Renter-occupied |
| Less than High School | 541 (48.0%) | 587 (52.0%) |
| High School Diploma | 1,210 (51.6%) | 1,137 (48.4%) |
| College/Associate Degree | 2,842 (66.5%) | 1,432 (33.5%) |
| Bachelor's Degree or higher | 4,937 (66.5%) | 2,483 (33.5%) |
Occupancy by Age of Householder in San Bruno
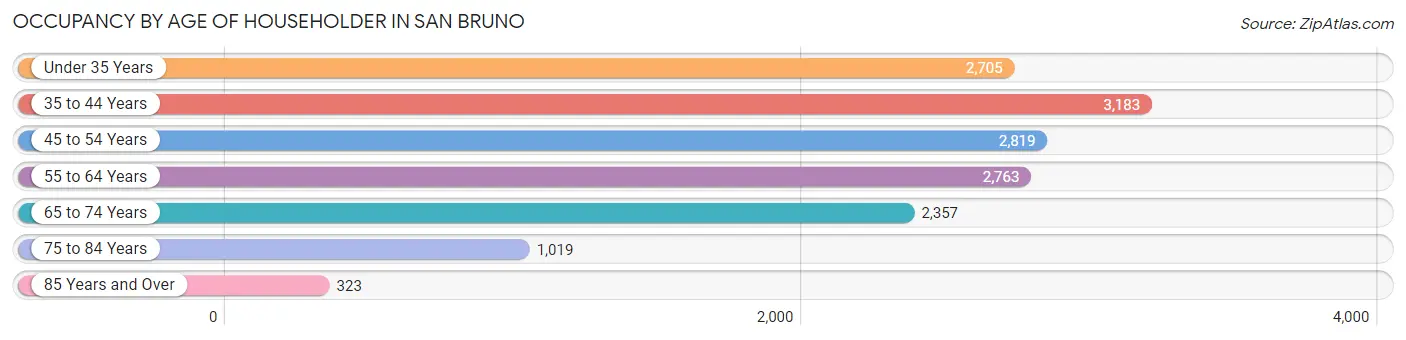
| Age Bracket | # Households | % Households |
| Under 35 Years | 2,705 | 17.8% |
| 35 to 44 Years | 3,183 | 21.0% |
| 45 to 54 Years | 2,819 | 18.6% |
| 55 to 64 Years | 2,763 | 18.2% |
| 65 to 74 Years | 2,357 | 15.5% |
| 75 to 84 Years | 1,019 | 6.7% |
| 85 Years and Over | 323 | 2.1% |
| Total | 15,169 | 100.0% |
Housing Finances in San Bruno
Median Income by Occupancy in San Bruno
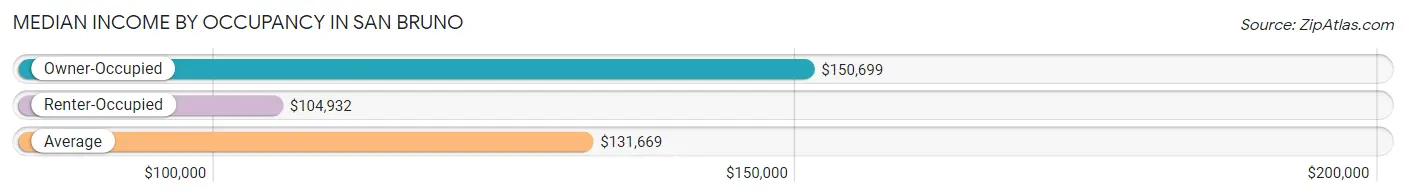
| Occupancy Type | # Households | Median Income |
| Owner-Occupied | 9,530 (62.8%) | $150,699 |
| Renter-Occupied | 5,639 (37.2%) | $104,932 |
| Average | 15,169 (100.0%) | $131,669 |
Occupancy by Householder Income Bracket in San Bruno
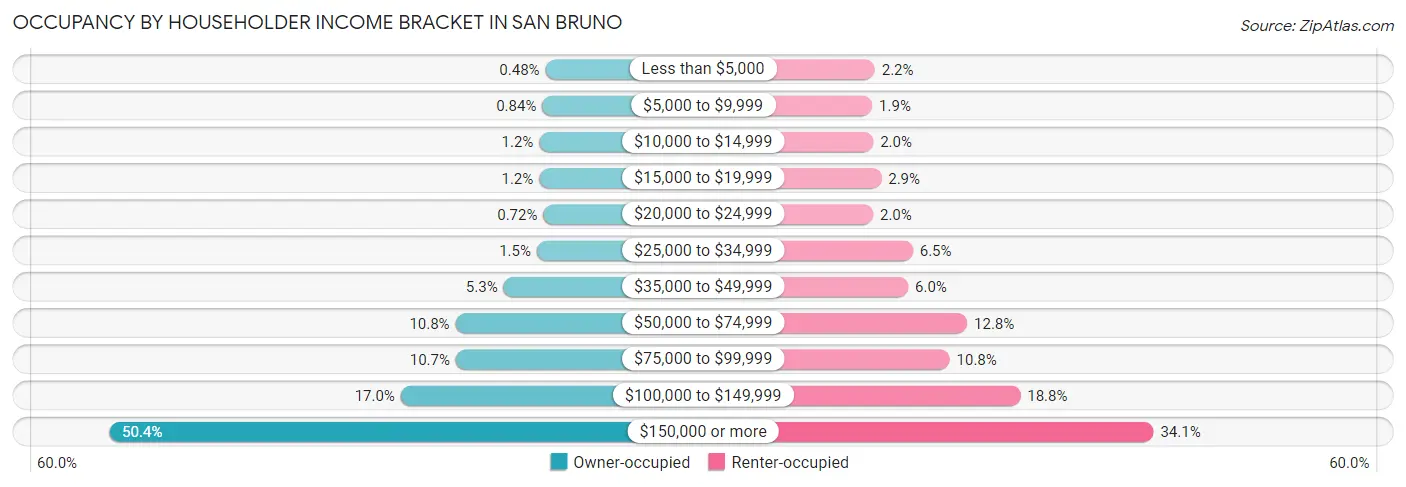
| Income Bracket | Owner-occupied | Renter-occupied |
| Less than $5,000 | 46 (0.5%) | 124 (2.2%) |
| $5,000 to $9,999 | 80 (0.8%) | 107 (1.9%) |
| $10,000 to $14,999 | 113 (1.2%) | 114 (2.0%) |
| $15,000 to $19,999 | 114 (1.2%) | 166 (2.9%) |
| $20,000 to $24,999 | 69 (0.7%) | 113 (2.0%) |
| $25,000 to $34,999 | 139 (1.5%) | 369 (6.5%) |
| $35,000 to $49,999 | 502 (5.3%) | 339 (6.0%) |
| $50,000 to $74,999 | 1,025 (10.8%) | 719 (12.8%) |
| $75,000 to $99,999 | 1,022 (10.7%) | 606 (10.7%) |
| $100,000 to $149,999 | 1,622 (17.0%) | 1,062 (18.8%) |
| $150,000 or more | 4,798 (50.3%) | 1,920 (34.1%) |
| Total | 9,530 (100.0%) | 5,639 (100.0%) |
Monthly Housing Cost Tiers in San Bruno
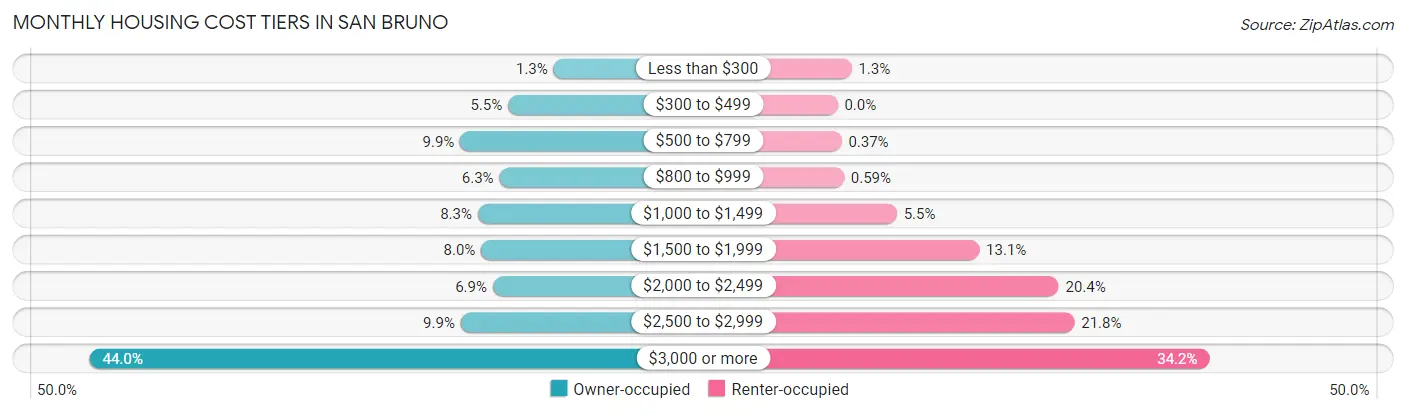
| Monthly Cost | Owner-occupied | Renter-occupied |
| Less than $300 | 124 (1.3%) | 73 (1.3%) |
| $300 to $499 | 523 (5.5%) | 0 (0.0%) |
| $500 to $799 | 943 (9.9%) | 21 (0.4%) |
| $800 to $999 | 599 (6.3%) | 33 (0.6%) |
| $1,000 to $1,499 | 789 (8.3%) | 308 (5.5%) |
| $1,500 to $1,999 | 760 (8.0%) | 736 (13.1%) |
| $2,000 to $2,499 | 658 (6.9%) | 1,148 (20.4%) |
| $2,500 to $2,999 | 939 (9.9%) | 1,230 (21.8%) |
| $3,000 or more | 4,195 (44.0%) | 1,930 (34.2%) |
| Total | 9,530 (100.0%) | 5,639 (100.0%) |
Physical Housing Characteristics in San Bruno
Housing Structures in San Bruno
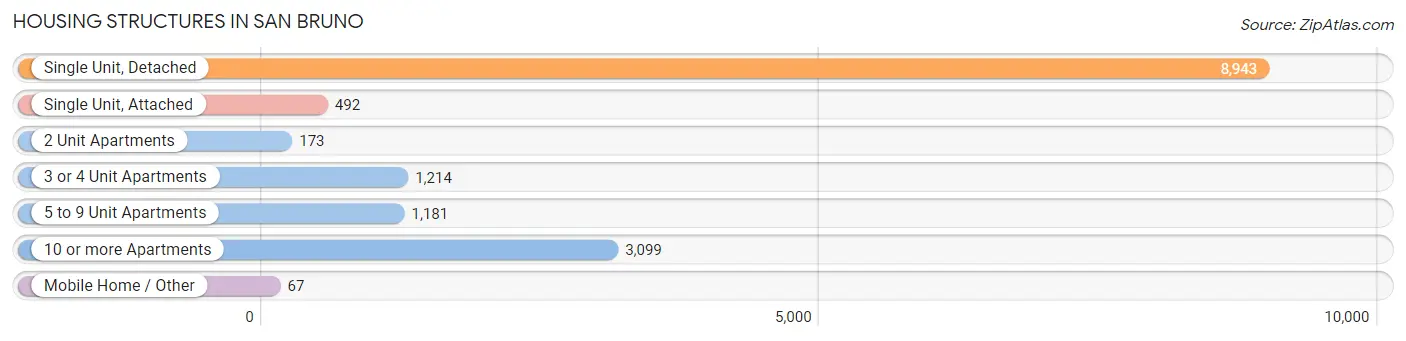
| Structure Type | # Housing Units | % Housing Units |
| Single Unit, Detached | 8,943 | 59.0% |
| Single Unit, Attached | 492 | 3.2% |
| 2 Unit Apartments | 173 | 1.1% |
| 3 or 4 Unit Apartments | 1,214 | 8.0% |
| 5 to 9 Unit Apartments | 1,181 | 7.8% |
| 10 or more Apartments | 3,099 | 20.4% |
| Mobile Home / Other | 67 | 0.4% |
| Total | 15,169 | 100.0% |
Housing Structures by Occupancy in San Bruno
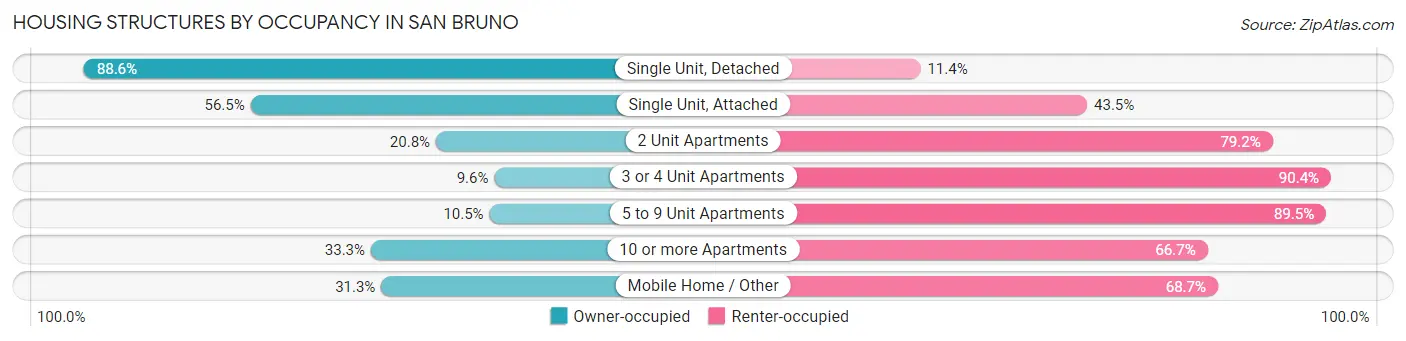
| Structure Type | Owner-occupied | Renter-occupied |
| Single Unit, Detached | 7,922 (88.6%) | 1,021 (11.4%) |
| Single Unit, Attached | 278 (56.5%) | 214 (43.5%) |
| 2 Unit Apartments | 36 (20.8%) | 137 (79.2%) |
| 3 or 4 Unit Apartments | 116 (9.6%) | 1,098 (90.4%) |
| 5 to 9 Unit Apartments | 124 (10.5%) | 1,057 (89.5%) |
| 10 or more Apartments | 1,033 (33.3%) | 2,066 (66.7%) |
| Mobile Home / Other | 21 (31.3%) | 46 (68.7%) |
| Total | 9,530 (62.8%) | 5,639 (37.2%) |
Housing Structures by Number of Rooms in San Bruno
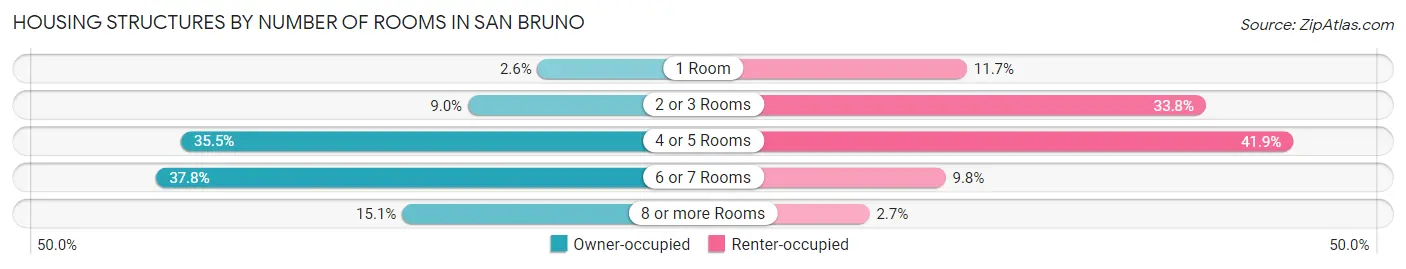
| Number of Rooms | Owner-occupied | Renter-occupied |
| 1 Room | 244 (2.6%) | 662 (11.7%) |
| 2 or 3 Rooms | 858 (9.0%) | 1,908 (33.8%) |
| 4 or 5 Rooms | 3,387 (35.5%) | 2,364 (41.9%) |
| 6 or 7 Rooms | 3,604 (37.8%) | 551 (9.8%) |
| 8 or more Rooms | 1,437 (15.1%) | 154 (2.7%) |
| Total | 9,530 (100.0%) | 5,639 (100.0%) |
Housing Structure by Heating Type in San Bruno
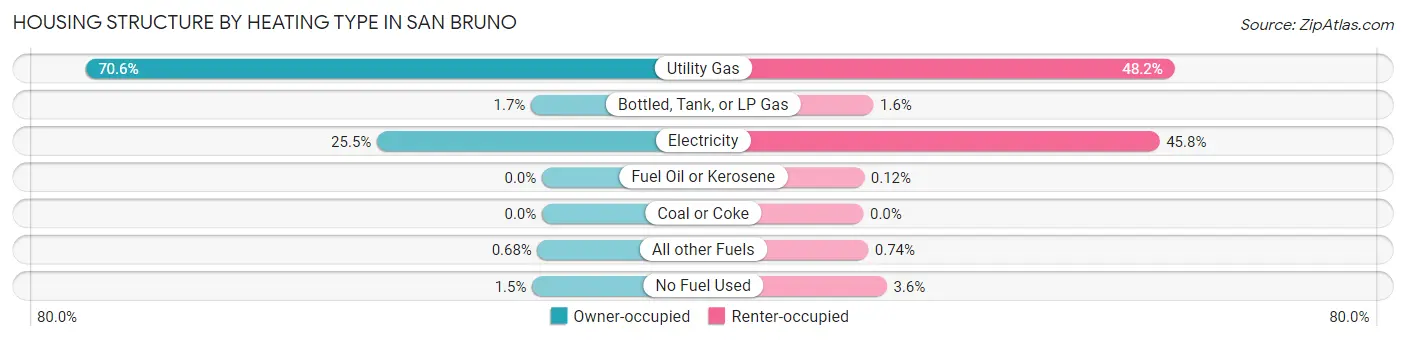
| Heating Type | Owner-occupied | Renter-occupied |
| Utility Gas | 6,730 (70.6%) | 2,716 (48.2%) |
| Bottled, Tank, or LP Gas | 161 (1.7%) | 88 (1.6%) |
| Electricity | 2,430 (25.5%) | 2,582 (45.8%) |
| Fuel Oil or Kerosene | 0 (0.0%) | 7 (0.1%) |
| Coal or Coke | 0 (0.0%) | 0 (0.0%) |
| All other Fuels | 65 (0.7%) | 42 (0.7%) |
| No Fuel Used | 144 (1.5%) | 204 (3.6%) |
| Total | 9,530 (100.0%) | 5,639 (100.0%) |
Household Vehicle Usage in San Bruno
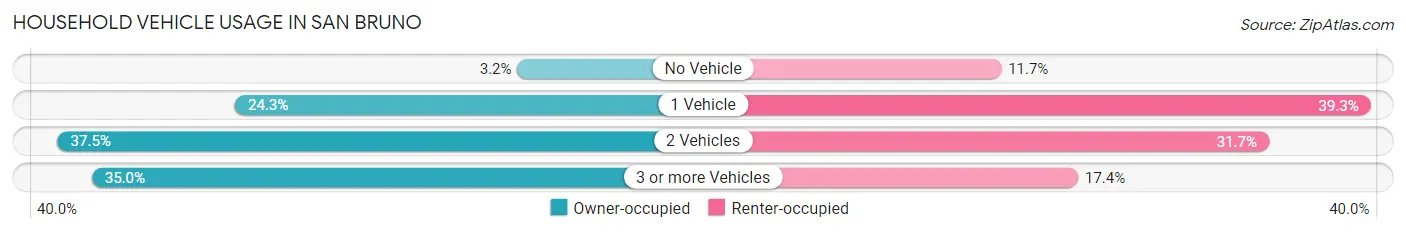
| Vehicles per Household | Owner-occupied | Renter-occupied |
| No Vehicle | 305 (3.2%) | 658 (11.7%) |
| 1 Vehicle | 2,314 (24.3%) | 2,214 (39.3%) |
| 2 Vehicles | 3,577 (37.5%) | 1,785 (31.7%) |
| 3 or more Vehicles | 3,334 (35.0%) | 982 (17.4%) |
| Total | 9,530 (100.0%) | 5,639 (100.0%) |
Real Estate & Mortgages in San Bruno
Real Estate and Mortgage Overview in San Bruno
| Characteristic | Without Mortgage | With Mortgage |
| Housing Units | 2,893 | 6,637 |
| Median Property Value | $1,153,900 | $1,212,600 |
| Median Household Income | $102,755 | $3,797 |
| Monthly Housing Costs | $782 | $4,195 |
| Real Estate Taxes | $3,611 | $58 |
Property Value by Mortgage Status in San Bruno
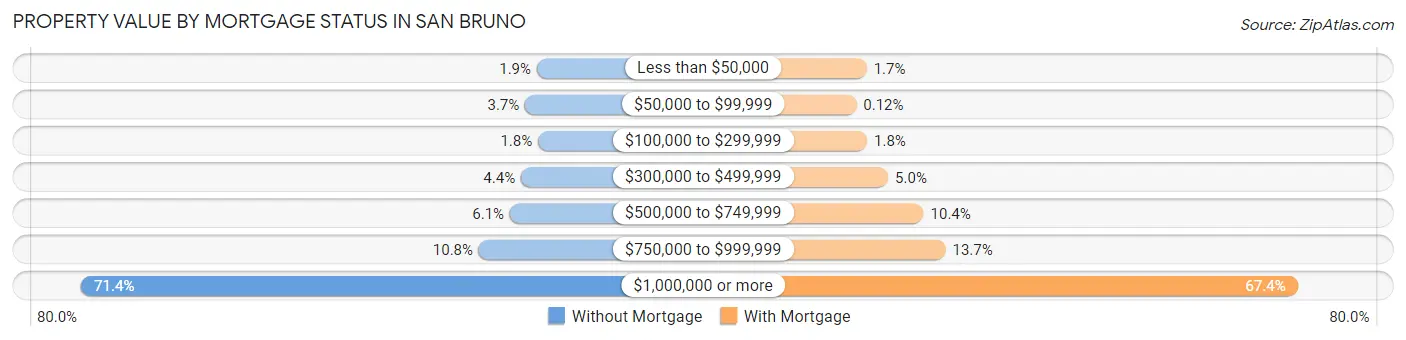
| Property Value | Without Mortgage | With Mortgage |
| Less than $50,000 | 56 (1.9%) | 113 (1.7%) |
| $50,000 to $99,999 | 108 (3.7%) | 8 (0.1%) |
| $100,000 to $299,999 | 51 (1.8%) | 117 (1.8%) |
| $300,000 to $499,999 | 126 (4.4%) | 330 (5.0%) |
| $500,000 to $749,999 | 175 (6.0%) | 688 (10.4%) |
| $750,000 to $999,999 | 312 (10.8%) | 910 (13.7%) |
| $1,000,000 or more | 2,065 (71.4%) | 4,471 (67.4%) |
| Total | 2,893 (100.0%) | 6,637 (100.0%) |
Household Income by Mortgage Status in San Bruno
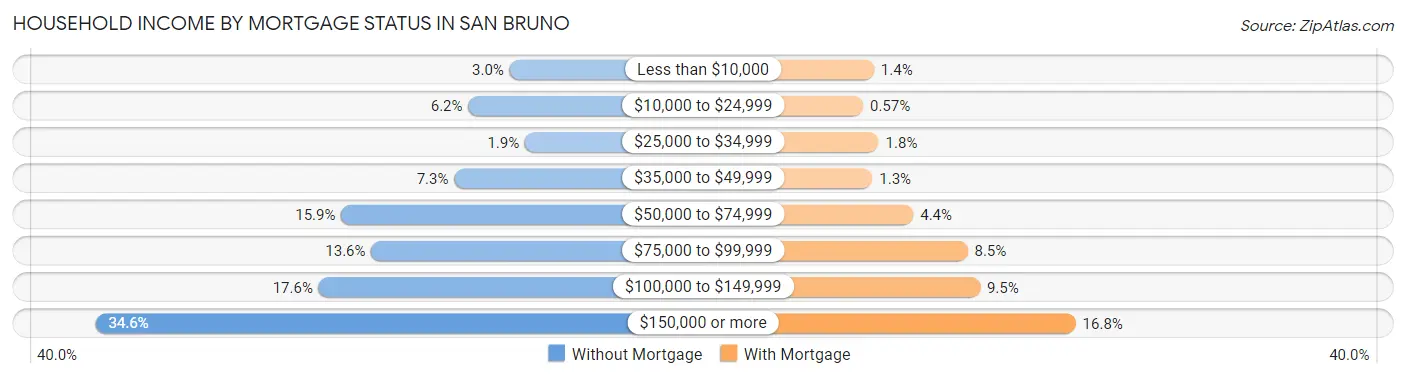
| Household Income | Without Mortgage | With Mortgage |
| Less than $10,000 | 88 (3.0%) | 93 (1.4%) |
| $10,000 to $24,999 | 179 (6.2%) | 38 (0.6%) |
| $25,000 to $34,999 | 54 (1.9%) | 117 (1.8%) |
| $35,000 to $49,999 | 210 (7.3%) | 85 (1.3%) |
| $50,000 to $74,999 | 459 (15.9%) | 292 (4.4%) |
| $75,000 to $99,999 | 393 (13.6%) | 566 (8.5%) |
| $100,000 to $149,999 | 509 (17.6%) | 629 (9.5%) |
| $150,000 or more | 1,001 (34.6%) | 1,113 (16.8%) |
| Total | 2,893 (100.0%) | 6,637 (100.0%) |
Property Value to Household Income Ratio in San Bruno
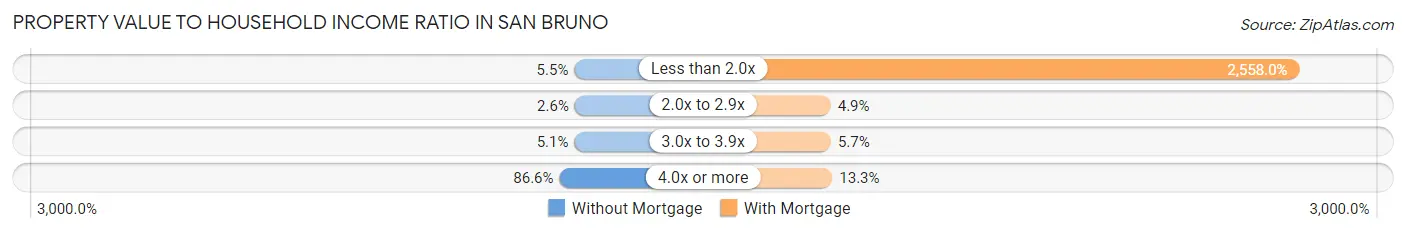
| Value-to-Income Ratio | Without Mortgage | With Mortgage |
| Less than 2.0x | 159 (5.5%) | 169,776 (2,558.0%) |
| 2.0x to 2.9x | 75 (2.6%) | 322 (4.9%) |
| 3.0x to 3.9x | 146 (5.1%) | 376 (5.7%) |
| 4.0x or more | 2,505 (86.6%) | 881 (13.3%) |
| Total | 2,893 (100.0%) | 6,637 (100.0%) |
Real Estate Taxes by Mortgage Status in San Bruno
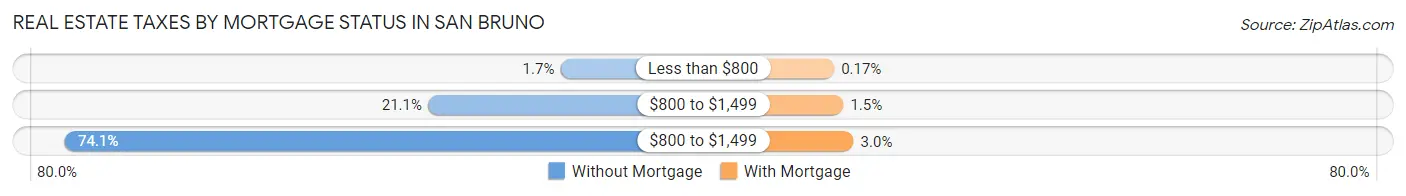
| Property Taxes | Without Mortgage | With Mortgage |
| Less than $800 | 50 (1.7%) | 11 (0.2%) |
| $800 to $1,499 | 610 (21.1%) | 101 (1.5%) |
| $800 to $1,499 | 2,143 (74.1%) | 200 (3.0%) |
| Total | 2,893 (100.0%) | 6,637 (100.0%) |
Health & Disability in San Bruno
Health Insurance Coverage by Age in San Bruno
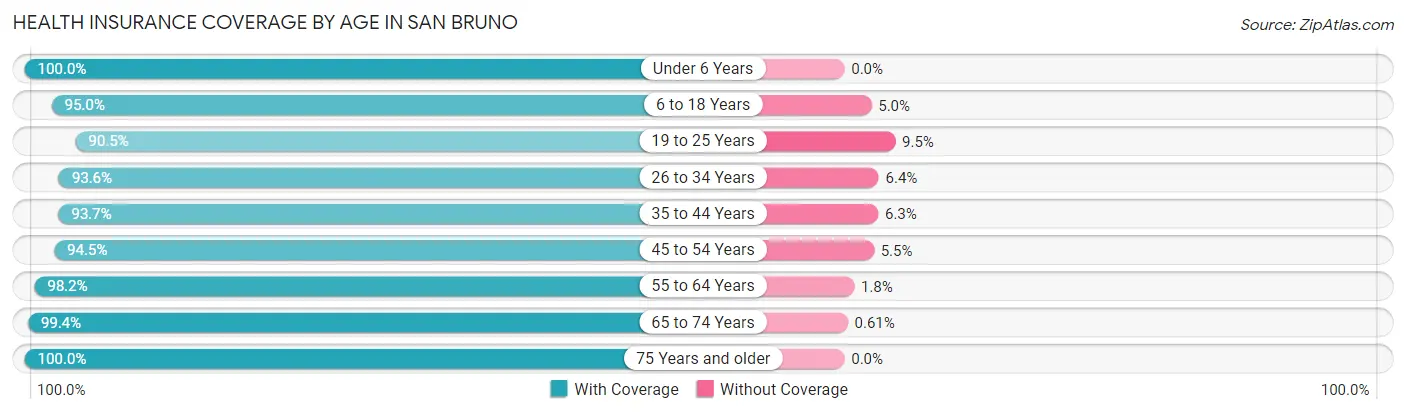
| Age Bracket | With Coverage | Without Coverage |
| Under 6 Years | 2,597 (100.0%) | 0 (0.0%) |
| 6 to 18 Years | 5,698 (95.0%) | 302 (5.0%) |
| 19 to 25 Years | 3,112 (90.5%) | 326 (9.5%) |
| 26 to 34 Years | 6,020 (93.6%) | 411 (6.4%) |
| 35 to 44 Years | 6,567 (93.7%) | 441 (6.3%) |
| 45 to 54 Years | 5,006 (94.5%) | 291 (5.5%) |
| 55 to 64 Years | 5,370 (98.2%) | 99 (1.8%) |
| 65 to 74 Years | 4,084 (99.4%) | 25 (0.6%) |
| 75 Years and older | 2,744 (100.0%) | 0 (0.0%) |
| Total | 41,198 (95.6%) | 1,895 (4.4%) |
Health Insurance Coverage by Citizenship Status in San Bruno
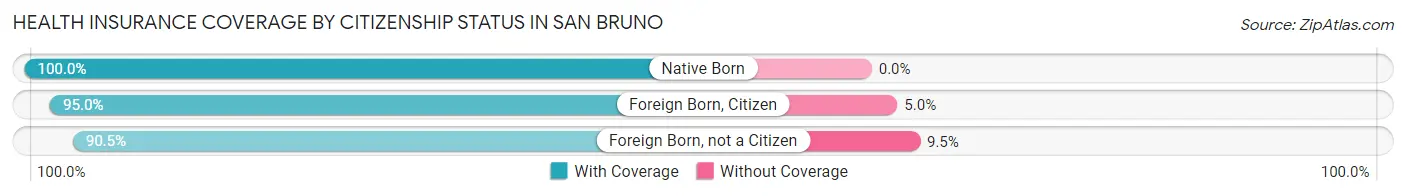
| Citizenship Status | With Coverage | Without Coverage |
| Native Born | 2,597 (100.0%) | 0 (0.0%) |
| Foreign Born, Citizen | 5,698 (95.0%) | 302 (5.0%) |
| Foreign Born, not a Citizen | 3,112 (90.5%) | 326 (9.5%) |
Health Insurance Coverage by Household Income in San Bruno
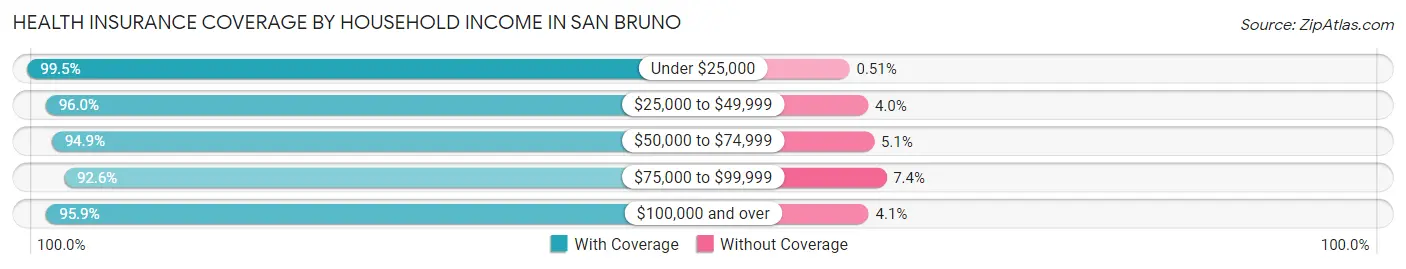
| Household Income | With Coverage | Without Coverage |
| Under $25,000 | 1,762 (99.5%) | 9 (0.5%) |
| $25,000 to $49,999 | 2,424 (96.0%) | 100 (4.0%) |
| $50,000 to $74,999 | 3,226 (94.9%) | 173 (5.1%) |
| $75,000 to $99,999 | 3,918 (92.6%) | 312 (7.4%) |
| $100,000 and over | 29,372 (95.9%) | 1,250 (4.1%) |
Public vs Private Health Insurance Coverage by Age in San Bruno
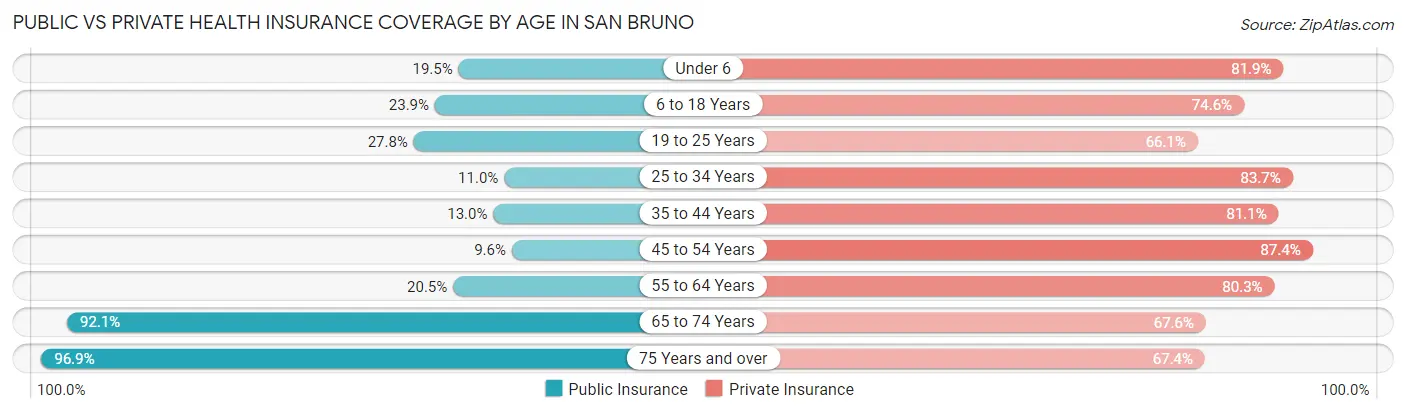
| Age Bracket | Public Insurance | Private Insurance |
| Under 6 | 505 (19.5%) | 2,128 (81.9%) |
| 6 to 18 Years | 1,431 (23.8%) | 4,478 (74.6%) |
| 19 to 25 Years | 955 (27.8%) | 2,271 (66.1%) |
| 25 to 34 Years | 707 (11.0%) | 5,381 (83.7%) |
| 35 to 44 Years | 912 (13.0%) | 5,681 (81.1%) |
| 45 to 54 Years | 507 (9.6%) | 4,629 (87.4%) |
| 55 to 64 Years | 1,119 (20.5%) | 4,391 (80.3%) |
| 65 to 74 Years | 3,786 (92.1%) | 2,776 (67.6%) |
| 75 Years and over | 2,659 (96.9%) | 1,849 (67.4%) |
| Total | 12,581 (29.2%) | 33,584 (77.9%) |
Disability Status by Sex by Age in San Bruno
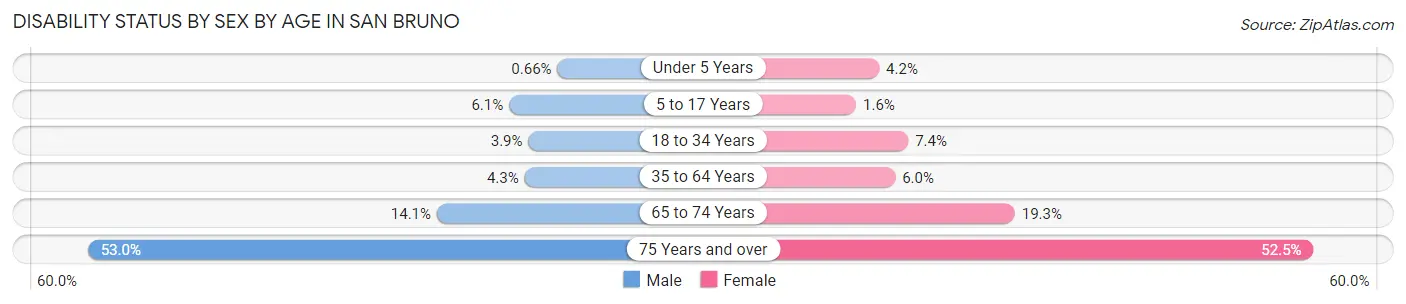
| Age Bracket | Male | Female |
| Under 5 Years | 7 (0.7%) | 41 (4.2%) |
| 5 to 17 Years | 196 (6.0%) | 45 (1.6%) |
| 18 to 34 Years | 227 (3.9%) | 335 (7.4%) |
| 35 to 64 Years | 372 (4.3%) | 545 (5.9%) |
| 65 to 74 Years | 271 (14.1%) | 421 (19.3%) |
| 75 Years and over | 570 (53.0%) | 876 (52.5%) |
Disability Class by Sex by Age in San Bruno
Disability Class: Hearing Difficulty
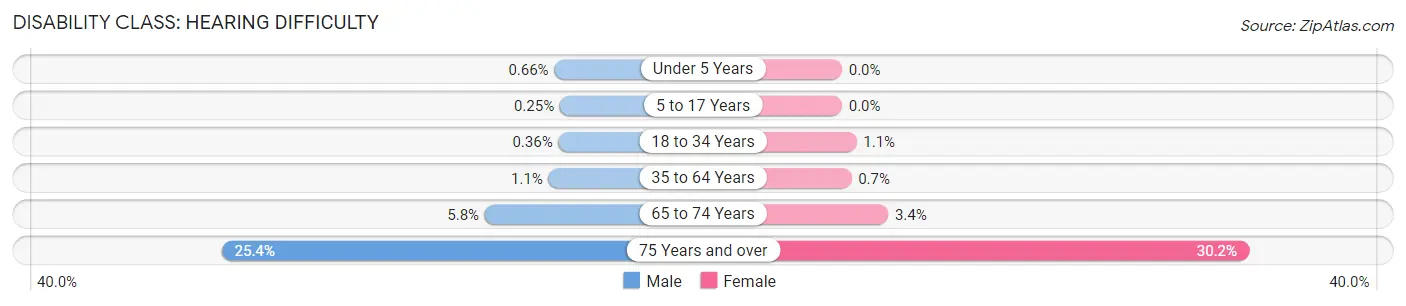
| Age Bracket | Male | Female |
| Under 5 Years | 7 (0.7%) | 0 (0.0%) |
| 5 to 17 Years | 8 (0.3%) | 0 (0.0%) |
| 18 to 34 Years | 21 (0.4%) | 49 (1.1%) |
| 35 to 64 Years | 94 (1.1%) | 64 (0.7%) |
| 65 to 74 Years | 112 (5.8%) | 75 (3.4%) |
| 75 Years and over | 273 (25.4%) | 504 (30.2%) |
Disability Class: Vision Difficulty
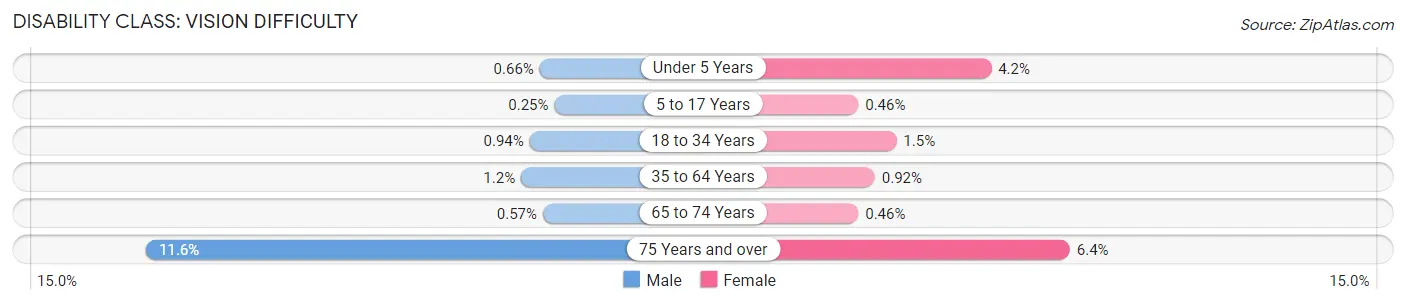
| Age Bracket | Male | Female |
| Under 5 Years | 7 (0.7%) | 41 (4.2%) |
| 5 to 17 Years | 8 (0.3%) | 13 (0.5%) |
| 18 to 34 Years | 55 (0.9%) | 69 (1.5%) |
| 35 to 64 Years | 102 (1.2%) | 84 (0.9%) |
| 65 to 74 Years | 11 (0.6%) | 10 (0.5%) |
| 75 Years and over | 125 (11.6%) | 106 (6.4%) |
Disability Class: Cognitive Difficulty
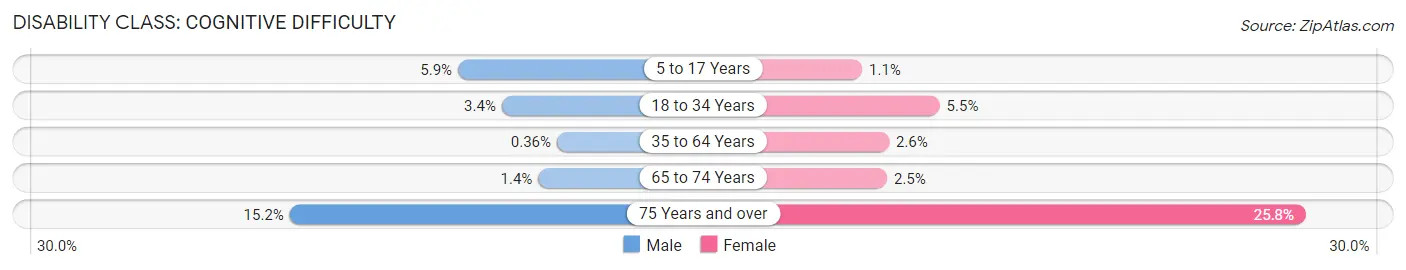
| Age Bracket | Male | Female |
| 5 to 17 Years | 190 (5.9%) | 32 (1.1%) |
| 18 to 34 Years | 200 (3.4%) | 247 (5.4%) |
| 35 to 64 Years | 31 (0.4%) | 241 (2.6%) |
| 65 to 74 Years | 27 (1.4%) | 55 (2.5%) |
| 75 Years and over | 164 (15.2%) | 431 (25.8%) |
Disability Class: Ambulatory Difficulty
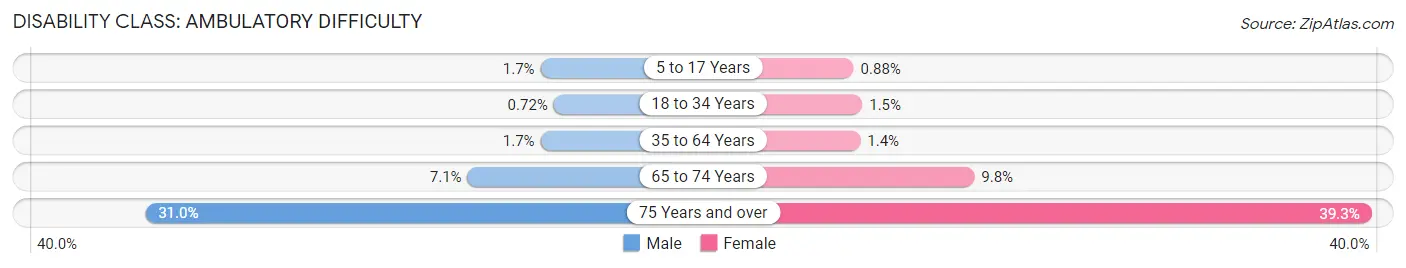
| Age Bracket | Male | Female |
| 5 to 17 Years | 55 (1.7%) | 25 (0.9%) |
| 18 to 34 Years | 42 (0.7%) | 69 (1.5%) |
| 35 to 64 Years | 146 (1.7%) | 126 (1.4%) |
| 65 to 74 Years | 137 (7.1%) | 215 (9.8%) |
| 75 Years and over | 334 (31.0%) | 656 (39.3%) |
Disability Class: Self-Care Difficulty
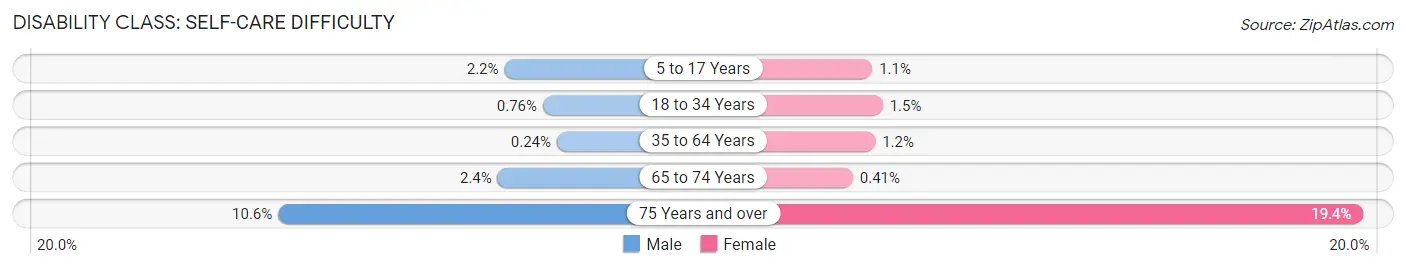
| Age Bracket | Male | Female |
| 5 to 17 Years | 71 (2.2%) | 32 (1.1%) |
| 18 to 34 Years | 44 (0.8%) | 69 (1.5%) |
| 35 to 64 Years | 21 (0.2%) | 114 (1.2%) |
| 65 to 74 Years | 47 (2.4%) | 9 (0.4%) |
| 75 Years and over | 114 (10.6%) | 323 (19.4%) |
Technology Access in San Bruno
Computing Device Access in San Bruno
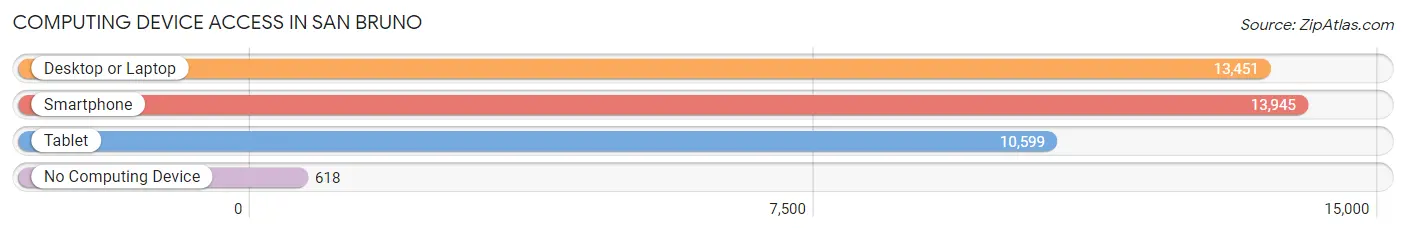
| Device Type | # Households | % Households |
| Desktop or Laptop | 13,451 | 88.7% |
| Smartphone | 13,945 | 91.9% |
| Tablet | 10,599 | 69.9% |
| No Computing Device | 618 | 4.1% |
| Total | 15,169 | 100.0% |
Internet Access in San Bruno
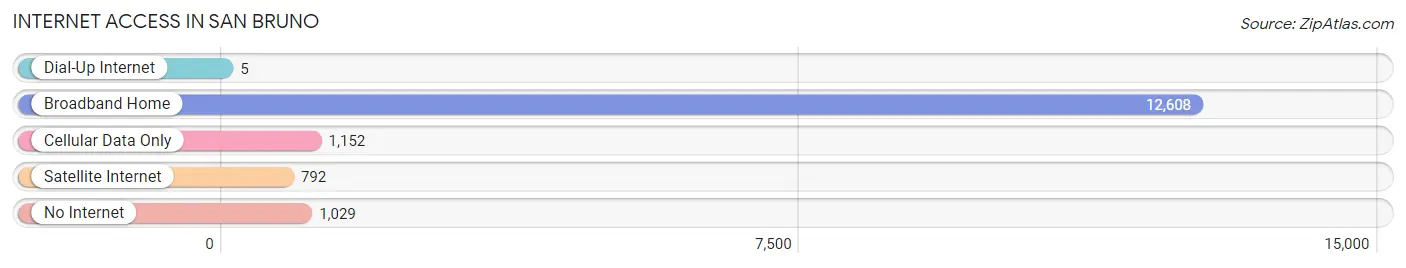
| Internet Type | # Households | % Households |
| Dial-Up Internet | 5 | 0.0% |
| Broadband Home | 12,608 | 83.1% |
| Cellular Data Only | 1,152 | 7.6% |
| Satellite Internet | 792 | 5.2% |
| No Internet | 1,029 | 6.8% |
| Total | 15,169 | 100.0% |
San Bruno Summary
San Bruno, California is a city located in San Mateo County, California, United States. It is located in the San Francisco Bay Area, approximately 12 miles south of San Francisco and 20 miles north of San Jose. As of the 2010 census, the population of San Bruno was 41,114, making it the third-largest city in San Mateo County.
History
San Bruno was originally inhabited by the Ohlone people, who lived in the area for thousands of years before the arrival of Europeans. The first Europeans to settle in the area were the Spanish, who established the Mission San Francisco de Asís in 1776. The mission was later abandoned, and the area was eventually settled by ranchers and farmers in the mid-19th century.
In 1853, the area was incorporated as the town of San Bruno. The town was named after St. Bruno of Cologne, a German monk who founded the Carthusian Order in 1084. The town grew rapidly in the late 19th and early 20th centuries, and in 1908, it was incorporated as a city.
Geography
San Bruno is located in the San Francisco Bay Area, approximately 12 miles south of San Francisco and 20 miles north of San Jose. It is bordered by the cities of South San Francisco, Daly City, and Brisbane. The city covers an area of 5.7 square miles, and its elevation is approximately 33 feet above sea level.
The city is located on the San Andreas Fault, and is prone to earthquakes. The most recent major earthquake to affect the city was the 1989 Loma Prieta earthquake, which caused significant damage to the city.
Climate
San Bruno has a Mediterranean climate, with mild, wet winters and dry, warm summers. The average annual temperature is 57°F, and the average annual precipitation is 22 inches.
Economy
San Bruno is home to several major employers, including YouTube, Walmart, and the San Francisco International Airport. The city is also home to several shopping centers, including the Tanforan Shopping Center and the Shops at Tanforan.
Demographics
As of the 2010 census, the population of San Bruno was 41,114. The racial makeup of the city was 57.2% White, 11.2% Asian, 10.3% Hispanic or Latino, 8.2% African American, 0.7% Native American, and 0.2% Pacific Islander.
The median household income in San Bruno was $76,837, and the median family income was $90,945. The per capita income was $35,945. The city's poverty rate was 8.2%.
Common Questions
What is Per Capita Income in San Bruno?
Per Capita income in San Bruno is $57,984.
What is the Median Family Income in San Bruno?
Median Family Income in San Bruno is $152,290.
What is the Median Household income in San Bruno?
Median Household Income in San Bruno is $131,669.
What is Income or Wage Gap in San Bruno?
Income or Wage Gap in San Bruno is 15.6%.
Women in San Bruno earn 84.4 cents for every dollar earned by a man.
What is Family Income Deficit in San Bruno?
Family Income Deficit in San Bruno is $11,455.
Families that are below poverty line in San Bruno earn $11,455 less on average than the poverty threshold level.
What is Inequality or Gini Index in San Bruno?
Inequality or Gini Index in San Bruno is 0.42.
What is the Total Population of San Bruno?
Total Population of San Bruno is 43,218.
What is the Total Male Population of San Bruno?
Total Male Population of San Bruno is 21,820.
What is the Total Female Population of San Bruno?
Total Female Population of San Bruno is 21,398.
What is the Ratio of Males per 100 Females in San Bruno?
There are 101.97 Males per 100 Females in San Bruno.
What is the Ratio of Females per 100 Males in San Bruno?
There are 98.07 Females per 100 Males in San Bruno.
What is the Median Population Age in San Bruno?
Median Population Age in San Bruno is 39.0 Years.
What is the Average Family Size in San Bruno
Average Family Size in San Bruno is 3.4 People.
What is the Average Household Size in San Bruno
Average Household Size in San Bruno is 2.8 People.
How Large is the Labor Force in San Bruno?
There are 25,124 People in the Labor Forcein in San Bruno.
What is the Percentage of People in the Labor Force in San Bruno?
70.0% of People are in the Labor Force in San Bruno.
What is the Unemployment Rate in San Bruno?
Unemployment Rate in San Bruno is 4.6%.