Jurupa Valley, CA Map & Demographics
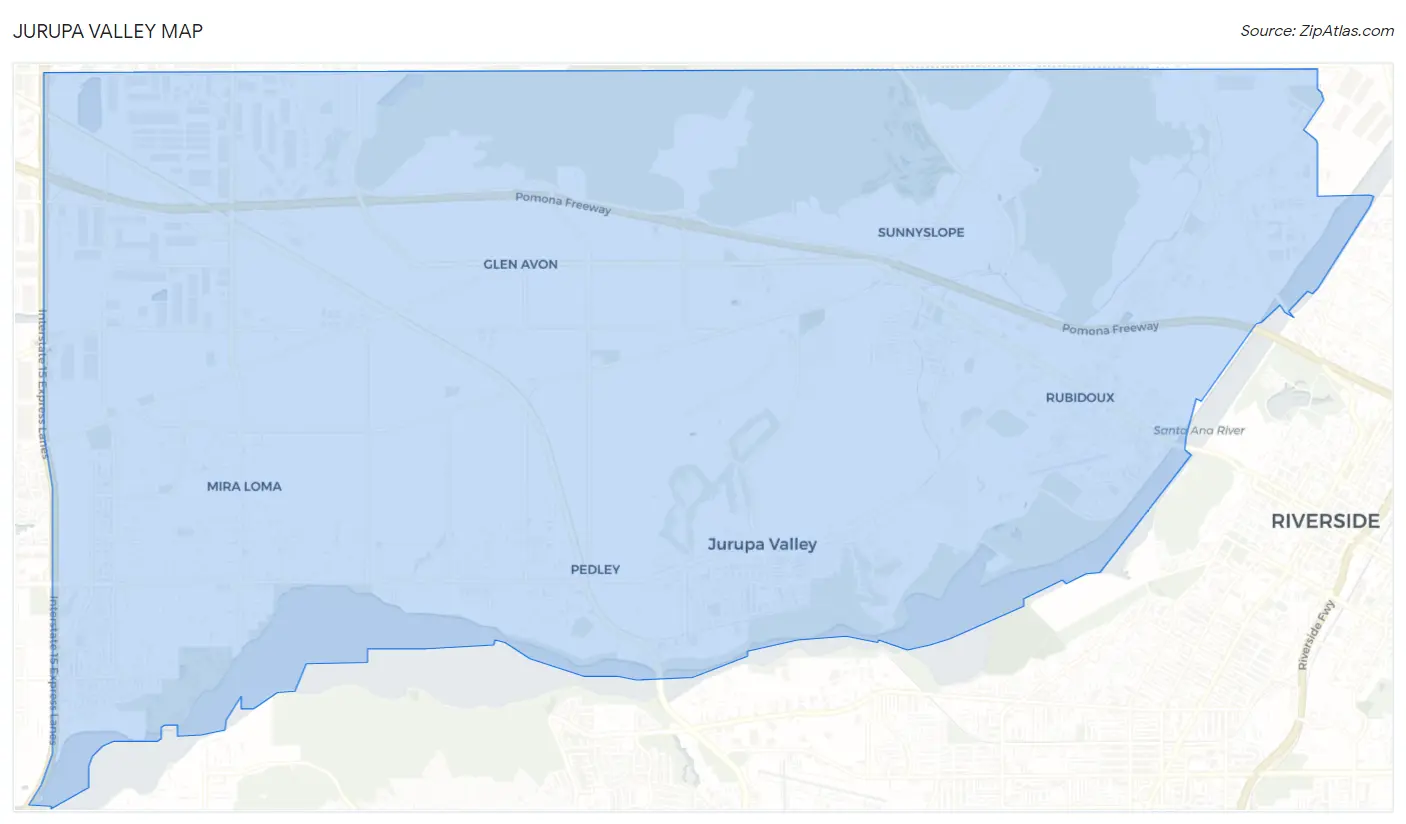
Jurupa Valley Map
Jurupa Valley Overview
$28,723
PER CAPITA INCOME
$95,404
AVG FAMILY INCOME
$91,562
AVG HOUSEHOLD INCOME
31.7%
WAGE / INCOME GAP [ % ]
68.3¢/ $1
WAGE / INCOME GAP [ $ ]
$12,462
FAMILY INCOME DEFICIT
0.41
INEQUALITY / GINI INDEX
105,672
TOTAL POPULATION
53,206
MALE POPULATION
52,466
FEMALE POPULATION
101.41
MALES / 100 FEMALES
98.61
FEMALES / 100 MALES
33.5
MEDIAN AGE
4.4
AVG FAMILY SIZE
4.0
AVG HOUSEHOLD SIZE
51,907
LABOR FORCE [ PEOPLE ]
63.7%
PERCENT IN LABOR FORCE
6.8%
UNEMPLOYMENT RATE
Jurupa Valley Zip Codes
Jurupa Valley Area Codes
Income in Jurupa Valley
Income Overview in Jurupa Valley
Per Capita Income in Jurupa Valley is $28,723, while median incomes of families and households are $95,404 and $91,562 respectively.
| Characteristic | Number | Measure |
| Per Capita Income | 105,672 | $28,723 |
| Median Family Income | 21,408 | $95,404 |
| Mean Family Income | 21,408 | $115,072 |
| Median Household Income | 25,957 | $91,562 |
| Mean Household Income | 25,957 | $110,018 |
| Income Deficit | 21,408 | $12,462 |
| Wage / Income Gap (%) | 105,672 | 31.74% |
| Wage / Income Gap ($) | 105,672 | 68.26¢ per $1 |
| Gini / Inequality Index | 105,672 | 0.41 |
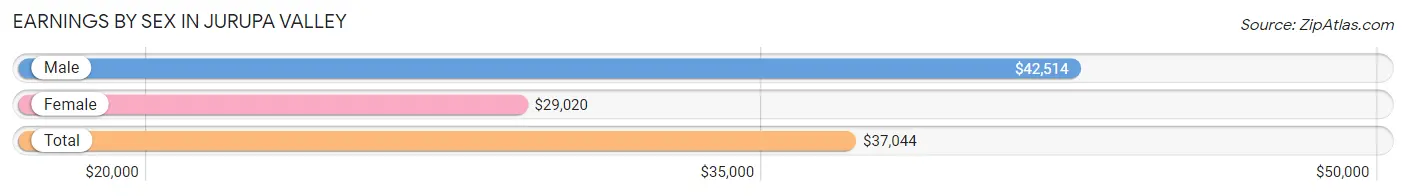
Earnings by Sex in Jurupa Valley
Average Earnings in Jurupa Valley are $37,044, $42,514 for men and $29,020 for women, a difference of 31.7%.
| Sex | Number | Average Earnings |
| Male | 30,148 (57.8%) | $42,514 |
| Female | 22,053 (42.2%) | $29,020 |
| Total | 52,201 (100.0%) | $37,044 |
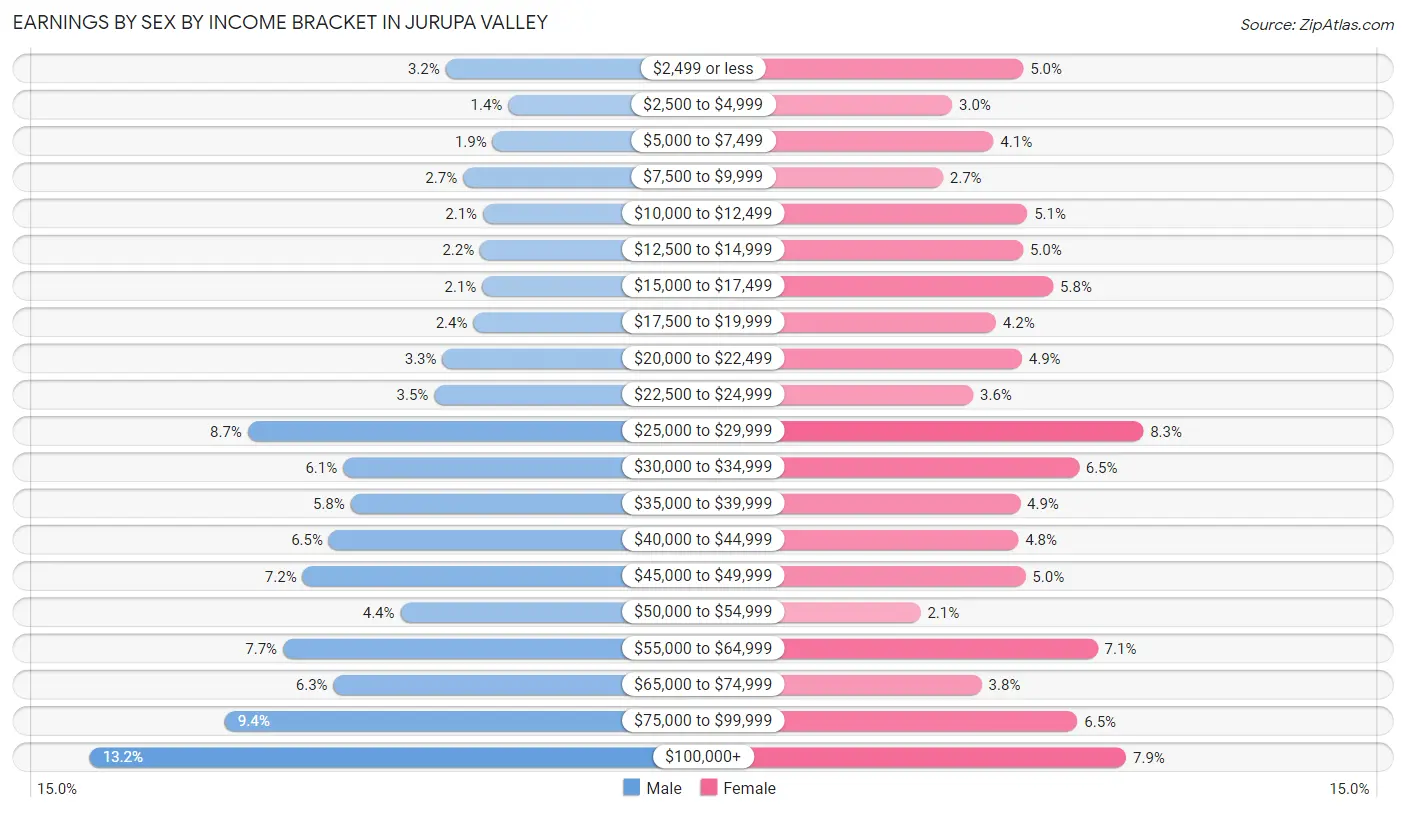
Earnings by Sex by Income Bracket in Jurupa Valley
The most common earnings brackets in Jurupa Valley are $100,000+ for men (3,969 | 13.2%) and $25,000 to $29,999 for women (1,836 | 8.3%).
| Income | Male | Female |
| $2,499 or less | 956 (3.2%) | 1,093 (5.0%) |
| $2,500 to $4,999 | 426 (1.4%) | 653 (3.0%) |
| $5,000 to $7,499 | 558 (1.8%) | 909 (4.1%) |
| $7,500 to $9,999 | 808 (2.7%) | 596 (2.7%) |
| $10,000 to $12,499 | 638 (2.1%) | 1,118 (5.1%) |
| $12,500 to $14,999 | 663 (2.2%) | 1,091 (5.0%) |
| $15,000 to $17,499 | 645 (2.1%) | 1,278 (5.8%) |
| $17,500 to $19,999 | 721 (2.4%) | 924 (4.2%) |
| $20,000 to $22,499 | 983 (3.3%) | 1,084 (4.9%) |
| $22,500 to $24,999 | 1,052 (3.5%) | 782 (3.5%) |
| $25,000 to $29,999 | 2,632 (8.7%) | 1,836 (8.3%) |
| $30,000 to $34,999 | 1,823 (6.0%) | 1,438 (6.5%) |
| $35,000 to $39,999 | 1,761 (5.8%) | 1,075 (4.9%) |
| $40,000 to $44,999 | 1,944 (6.5%) | 1,062 (4.8%) |
| $45,000 to $49,999 | 2,168 (7.2%) | 1,107 (5.0%) |
| $50,000 to $54,999 | 1,339 (4.4%) | 457 (2.1%) |
| $55,000 to $64,999 | 2,334 (7.7%) | 1,555 (7.0%) |
| $65,000 to $74,999 | 1,904 (6.3%) | 835 (3.8%) |
| $75,000 to $99,999 | 2,824 (9.4%) | 1,428 (6.5%) |
| $100,000+ | 3,969 (13.2%) | 1,732 (7.9%) |
| Total | 30,148 (100.0%) | 22,053 (100.0%) |
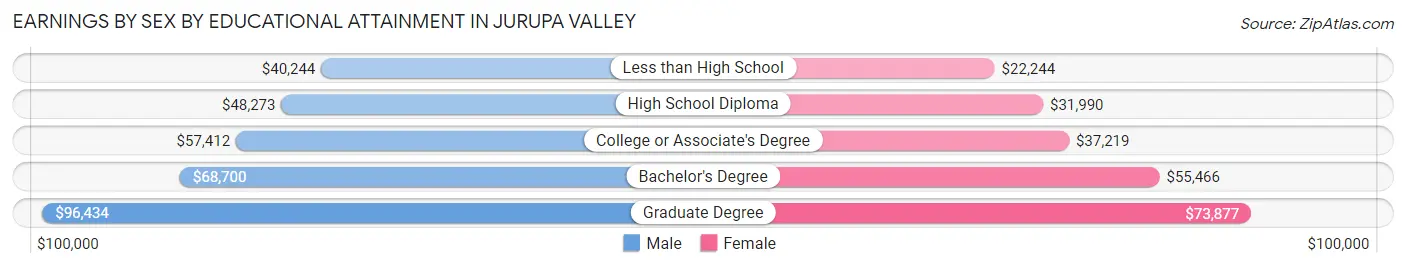
Earnings by Sex by Educational Attainment in Jurupa Valley
Average earnings in Jurupa Valley are $47,860 for men and $35,030 for women, a difference of 26.8%. Men with an educational attainment of graduate degree enjoy the highest average annual earnings of $96,434, while those with less than high school education earn the least with $40,244. Women with an educational attainment of graduate degree earn the most with the average annual earnings of $73,877, while those with less than high school education have the smallest earnings of $22,244.
| Educational Attainment | Male Income | Female Income |
| Less than High School | $40,244 | $22,244 |
| High School Diploma | $48,273 | $31,990 |
| College or Associate's Degree | $57,412 | $37,219 |
| Bachelor's Degree | $68,700 | $55,466 |
| Graduate Degree | $96,434 | $73,877 |
| Total | $47,860 | $35,030 |
Family Income in Jurupa Valley
Family Income Brackets in Jurupa Valley
According to the Jurupa Valley family income data, there are 4,538 families falling into the $100,000 to $149,999 income range, which is the most common income bracket and makes up 21.2% of all families. Conversely, the $10,000 to $14,999 income bracket is the least frequent group with only 278 families (1.3%) belonging to this category.
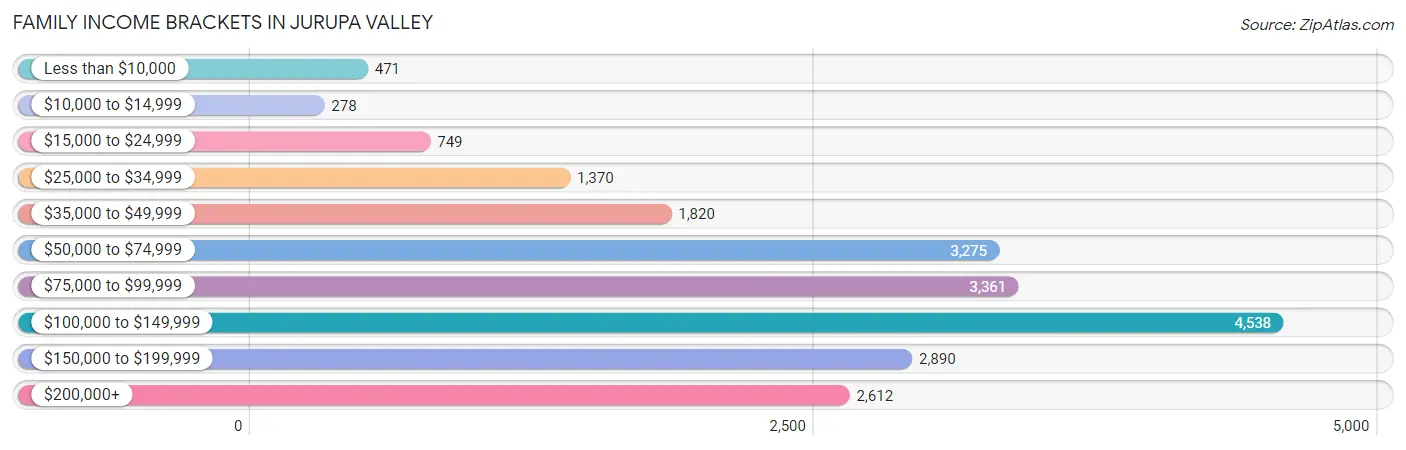
| Income Bracket | # Families | % Families |
| Less than $10,000 | 471 | 2.2% |
| $10,000 to $14,999 | 278 | 1.3% |
| $15,000 to $24,999 | 749 | 3.5% |
| $25,000 to $34,999 | 1,370 | 6.4% |
| $35,000 to $49,999 | 1,820 | 8.5% |
| $50,000 to $74,999 | 3,275 | 15.3% |
| $75,000 to $99,999 | 3,361 | 15.7% |
| $100,000 to $149,999 | 4,538 | 21.2% |
| $150,000 to $199,999 | 2,890 | 13.5% |
| $200,000+ | 2,612 | 12.2% |
Family Income by Famaliy Size in Jurupa Valley
7+ person families (2,360 | 11.0%) account for the highest median family income in Jurupa Valley with $133,289 per family, while 2-person families (4,840 | 22.6%) have the highest median income of $35,655 per family member.
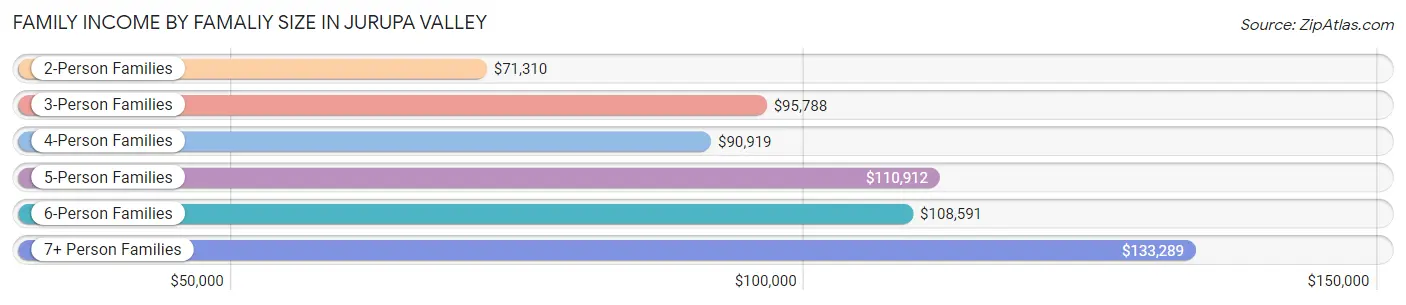
| Income Bracket | # Families | Median Income |
| 2-Person Families | 4,840 (22.6%) | $71,310 |
| 3-Person Families | 4,137 (19.3%) | $95,788 |
| 4-Person Families | 4,976 (23.2%) | $90,919 |
| 5-Person Families | 3,295 (15.4%) | $110,912 |
| 6-Person Families | 1,800 (8.4%) | $108,591 |
| 7+ Person Families | 2,360 (11.0%) | $133,289 |
| Total | 21,408 (100.0%) | $95,404 |
Family Income by Number of Earners in Jurupa Valley
The median family income in Jurupa Valley is $95,404, with families comprising 3+ earners (5,821) having the highest median family income of $145,215, while families with no earners (2,138) have the lowest median family income of $34,896, accounting for 27.2% and 10.0% of families, respectively.
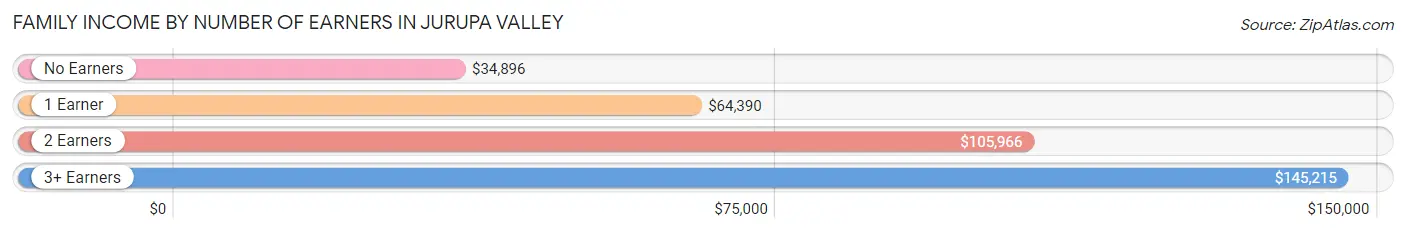
| Number of Earners | # Families | Median Income |
| No Earners | 2,138 (10.0%) | $34,896 |
| 1 Earner | 6,092 (28.5%) | $64,390 |
| 2 Earners | 7,357 (34.4%) | $105,966 |
| 3+ Earners | 5,821 (27.2%) | $145,215 |
| Total | 21,408 (100.0%) | $95,404 |
Household Income in Jurupa Valley
Household Income Brackets in Jurupa Valley
With 5,243 households falling in the category, the $100,000 to $149,999 income range is the most frequent in Jurupa Valley, accounting for 20.2% of all households. In contrast, only 649 households (2.5%) fall into the less than $10,000 income bracket, making it the least populous group.
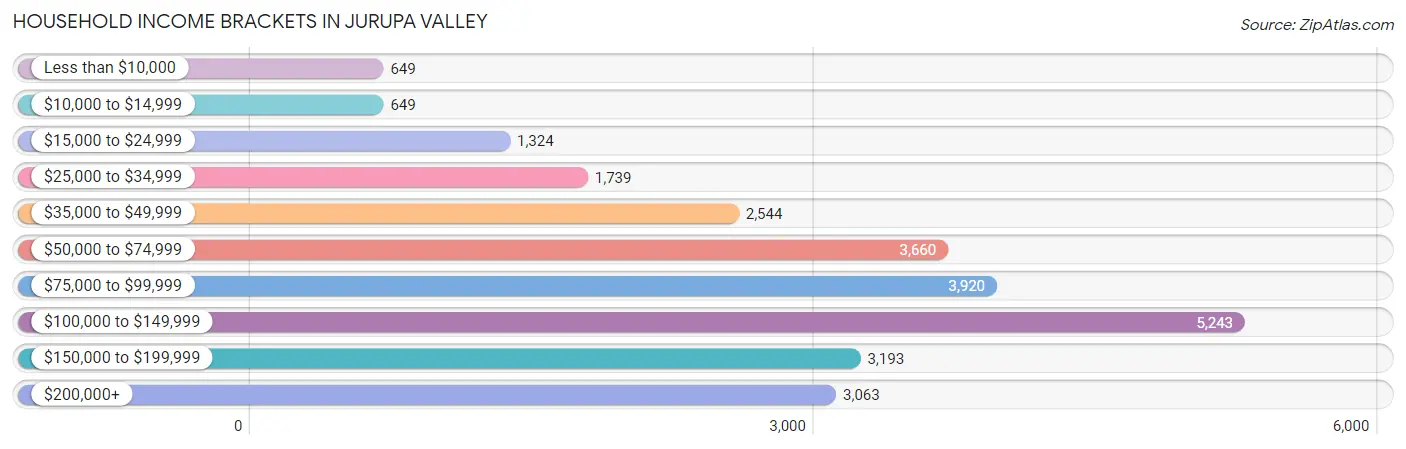
| Income Bracket | # Households | % Households |
| Less than $10,000 | 649 | 2.5% |
| $10,000 to $14,999 | 649 | 2.5% |
| $15,000 to $24,999 | 1,324 | 5.1% |
| $25,000 to $34,999 | 1,739 | 6.7% |
| $35,000 to $49,999 | 2,544 | 9.8% |
| $50,000 to $74,999 | 3,660 | 14.1% |
| $75,000 to $99,999 | 3,920 | 15.1% |
| $100,000 to $149,999 | 5,243 | 20.2% |
| $150,000 to $199,999 | 3,193 | 12.3% |
| $200,000+ | 3,063 | 11.8% |
Household Income by Householder Age in Jurupa Valley
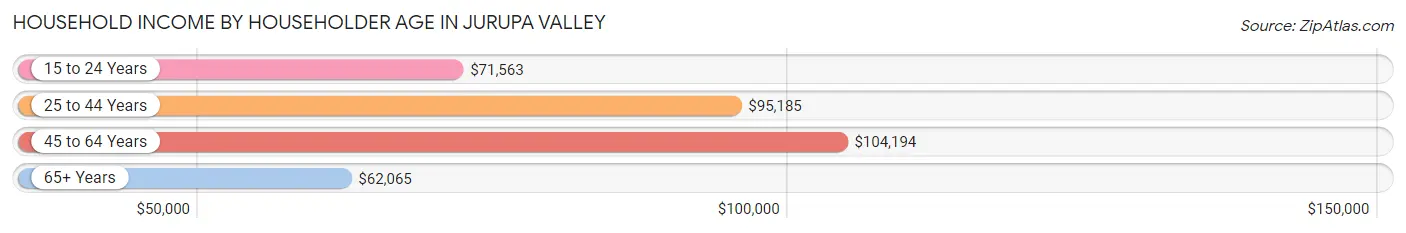
The median household income in Jurupa Valley is $91,562, with the highest median household income of $104,194 found in the 45 to 64 years age bracket for the primary householder. A total of 11,145 households (42.9%) fall into this category. Meanwhile, the 65+ years age bracket for the primary householder has the lowest median household income of $62,065, with 5,641 households (21.7%) in this group.
| Income Bracket | # Households | Median Income |
| 15 to 24 Years | 365 (1.4%) | $71,563 |
| 25 to 44 Years | 8,806 (33.9%) | $95,185 |
| 45 to 64 Years | 11,145 (42.9%) | $104,194 |
| 65+ Years | 5,641 (21.7%) | $62,065 |
| Total | 25,957 (100.0%) | $91,562 |
Poverty in Jurupa Valley
Income Below Poverty by Sex and Age in Jurupa Valley
With 8.4% poverty level for males and 12.2% for females among the residents of Jurupa Valley, 15 year old males and 5 year old females are the most vulnerable to poverty, with 162 males (16.9%) and 183 females (18.6%) in their respective age groups living below the poverty level.
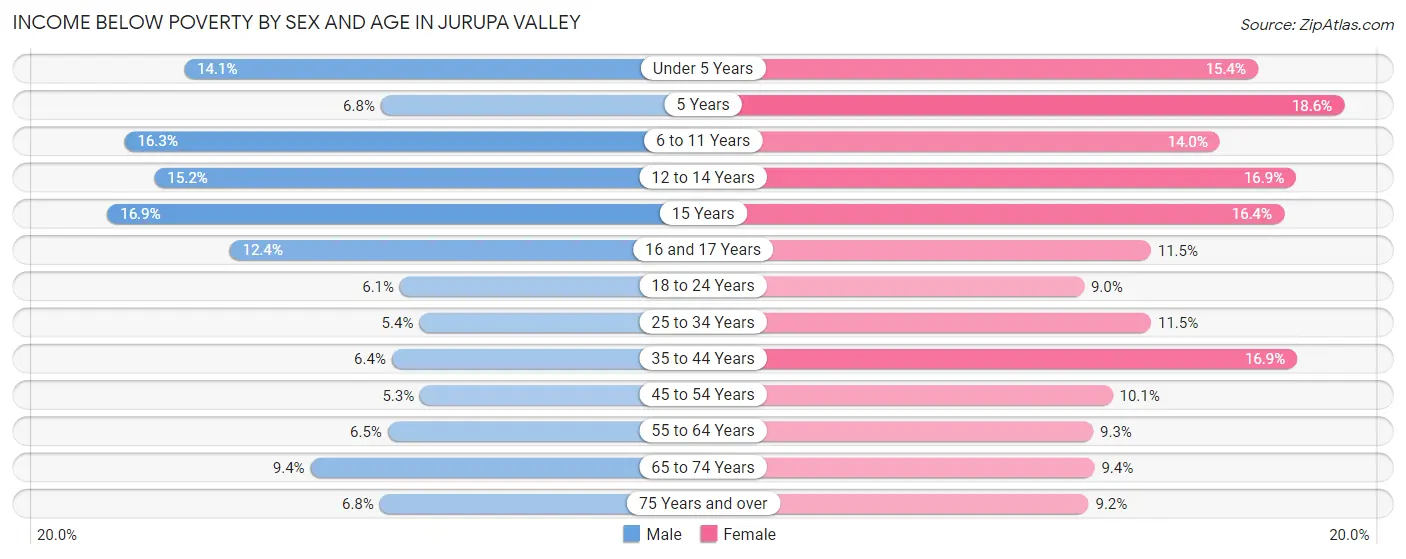
| Age Bracket | Male | Female |
| Under 5 Years | 512 (14.1%) | 474 (15.4%) |
| 5 Years | 25 (6.8%) | 183 (18.6%) |
| 6 to 11 Years | 691 (16.3%) | 665 (14.0%) |
| 12 to 14 Years | 330 (15.2%) | 469 (16.9%) |
| 15 Years | 162 (16.9%) | 157 (16.4%) |
| 16 and 17 Years | 258 (12.4%) | 131 (11.5%) |
| 18 to 24 Years | 364 (6.1%) | 526 (9.0%) |
| 25 to 34 Years | 446 (5.3%) | 865 (11.5%) |
| 35 to 44 Years | 474 (6.4%) | 1,188 (16.9%) |
| 45 to 54 Years | 353 (5.3%) | 586 (10.1%) |
| 55 to 64 Years | 388 (6.5%) | 508 (9.3%) |
| 65 to 74 Years | 321 (9.4%) | 344 (9.4%) |
| 75 Years and over | 106 (6.8%) | 271 (9.2%) |
| Total | 4,430 (8.4%) | 6,367 (12.2%) |
Income Above Poverty by Sex and Age in Jurupa Valley
According to the poverty statistics in Jurupa Valley, males aged 45 to 54 years and females aged 18 to 24 years are the age groups that are most secure financially, with 94.7% of males and 91.0% of females in these age groups living above the poverty line.
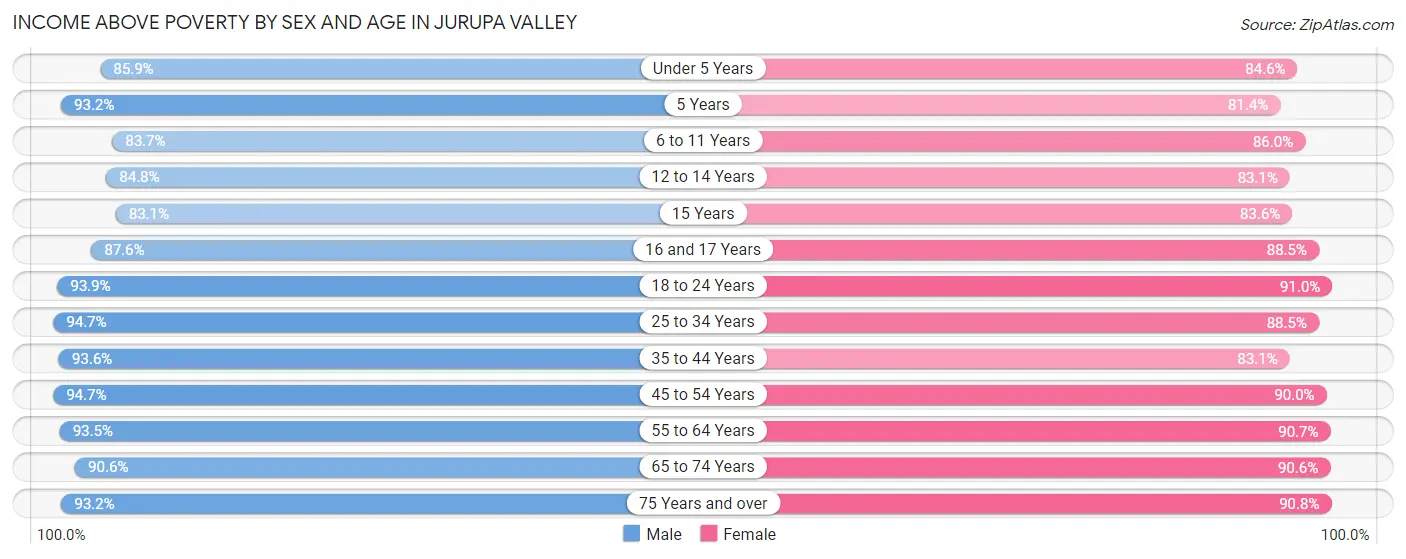
| Age Bracket | Male | Female |
| Under 5 Years | 3,125 (85.9%) | 2,596 (84.6%) |
| 5 Years | 344 (93.2%) | 799 (81.4%) |
| 6 to 11 Years | 3,551 (83.7%) | 4,075 (86.0%) |
| 12 to 14 Years | 1,844 (84.8%) | 2,313 (83.1%) |
| 15 Years | 795 (83.1%) | 800 (83.6%) |
| 16 and 17 Years | 1,824 (87.6%) | 1,011 (88.5%) |
| 18 to 24 Years | 5,637 (93.9%) | 5,326 (91.0%) |
| 25 to 34 Years | 7,888 (94.7%) | 6,671 (88.5%) |
| 35 to 44 Years | 6,967 (93.6%) | 5,843 (83.1%) |
| 45 to 54 Years | 6,288 (94.7%) | 5,245 (89.9%) |
| 55 to 64 Years | 5,562 (93.5%) | 4,934 (90.7%) |
| 65 to 74 Years | 3,099 (90.6%) | 3,325 (90.6%) |
| 75 Years and over | 1,448 (93.2%) | 2,686 (90.8%) |
| Total | 48,372 (91.6%) | 45,624 (87.7%) |
Income Below Poverty Among Married-Couple Families in Jurupa Valley
The poverty statistics for married-couple families in Jurupa Valley show that 5.9% or 877 of the total 14,757 families live below the poverty line. Families with 3 or 4 children have the highest poverty rate of 11.6%, comprising of 271 families. On the other hand, families with no children have the lowest poverty rate of 2.8%, which includes 182 families.
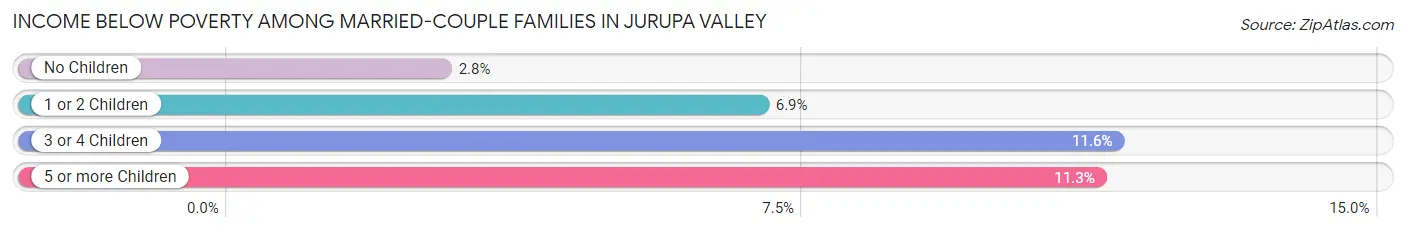
| Children | Above Poverty | Below Poverty |
| No Children | 6,332 (97.2%) | 182 (2.8%) |
| 1 or 2 Children | 5,180 (93.1%) | 386 (6.9%) |
| 3 or 4 Children | 2,071 (88.4%) | 271 (11.6%) |
| 5 or more Children | 297 (88.7%) | 38 (11.3%) |
| Total | 13,880 (94.1%) | 877 (5.9%) |
Income Below Poverty Among Single-Parent Households in Jurupa Valley
According to the poverty data in Jurupa Valley, 9.6% or 229 single-father households and 16.0% or 682 single-mother households are living below the poverty line. Among single-father households, those with 3 or 4 children have the highest poverty rate, with 78 households (17.0%) experiencing poverty. Likewise, among single-mother households, those with 5 or more children have the highest poverty rate, with 87 households (54.4%) falling below the poverty line.
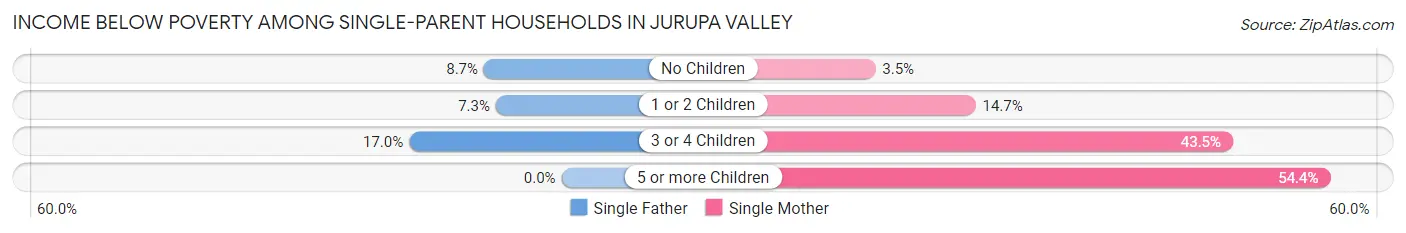
| Children | Single Father | Single Mother |
| No Children | 100 (8.7%) | 61 (3.5%) |
| 1 or 2 Children | 51 (7.3%) | 257 (14.7%) |
| 3 or 4 Children | 78 (17.0%) | 277 (43.5%) |
| 5 or more Children | 0 (0.0%) | 87 (54.4%) |
| Total | 229 (9.6%) | 682 (16.0%) |
Income Below Poverty Among Married-Couple vs Single-Parent Households in Jurupa Valley
The poverty data for Jurupa Valley shows that 877 of the married-couple family households (5.9%) and 911 of the single-parent households (13.7%) are living below the poverty level. Within the married-couple family households, those with 3 or 4 children have the highest poverty rate, with 271 households (11.6%) falling below the poverty line. Among the single-parent households, those with 5 or more children have the highest poverty rate, with 87 household (35.9%) living below poverty.
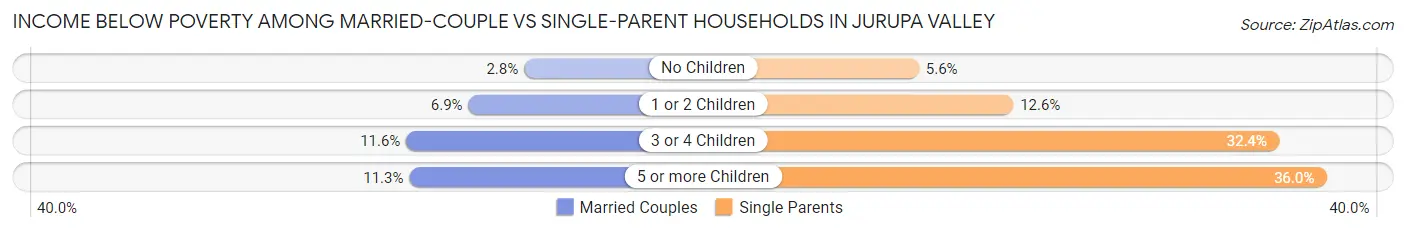
| Children | Married-Couple Families | Single-Parent Households |
| No Children | 182 (2.8%) | 161 (5.6%) |
| 1 or 2 Children | 386 (6.9%) | 308 (12.6%) |
| 3 or 4 Children | 271 (11.6%) | 355 (32.4%) |
| 5 or more Children | 38 (11.3%) | 87 (35.9%) |
| Total | 877 (5.9%) | 911 (13.7%) |
Race in Jurupa Valley
The most populous races in Jurupa Valley are Hispanic or Latino (76,033 | 72.0%), Some other Race (43,749 | 41.4%), and White / Caucasian (38,658 | 36.6%).
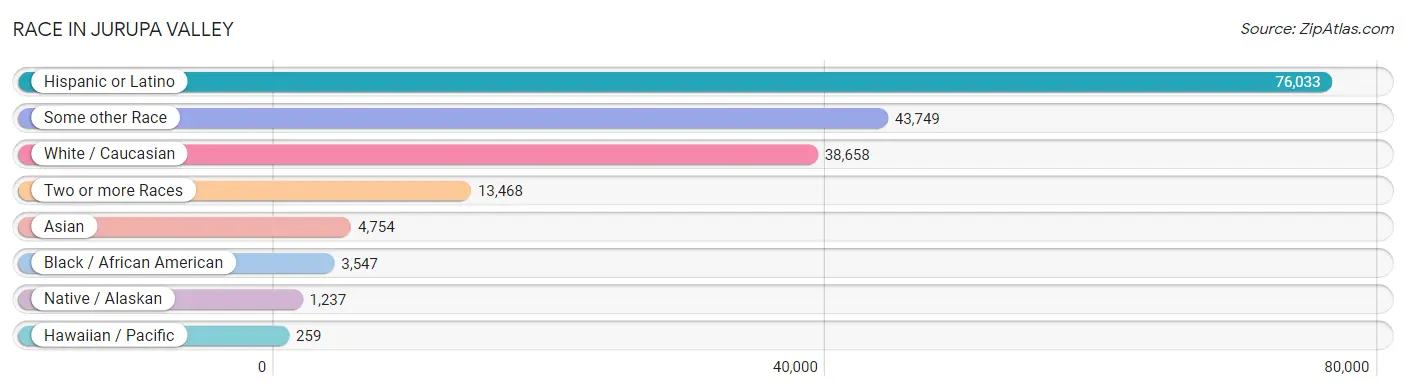
| Race | # Population | % Population |
| Asian | 4,754 | 4.5% |
| Black / African American | 3,547 | 3.4% |
| Hawaiian / Pacific | 259 | 0.3% |
| Hispanic or Latino | 76,033 | 72.0% |
| Native / Alaskan | 1,237 | 1.2% |
| White / Caucasian | 38,658 | 36.6% |
| Two or more Races | 13,468 | 12.8% |
| Some other Race | 43,749 | 41.4% |
| Total | 105,672 | 100.0% |
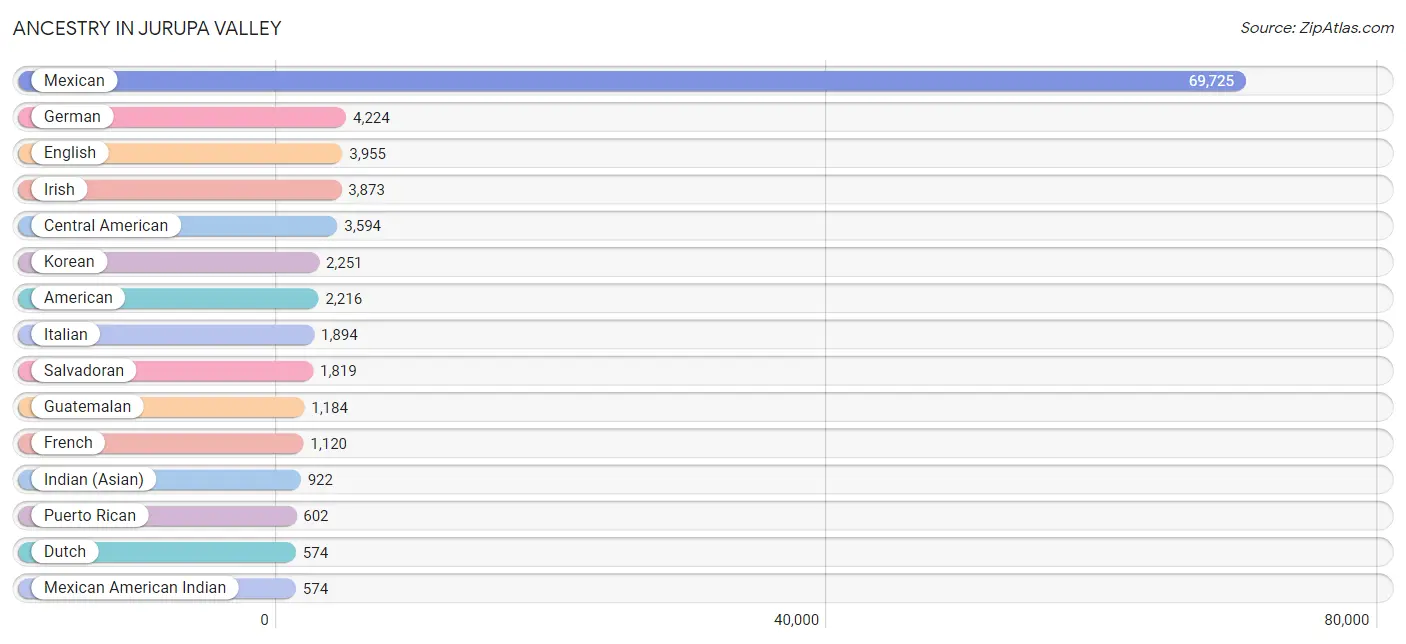
Ancestry in Jurupa Valley
The most populous ancestries reported in Jurupa Valley are Mexican (69,725 | 66.0%), German (4,224 | 4.0%), English (3,955 | 3.7%), Irish (3,873 | 3.7%), and Central American (3,594 | 3.4%), together accounting for 80.8% of all Jurupa Valley residents.
| Ancestry | # Population | % Population |
| Afghan | 46 | 0.0% |
| African | 165 | 0.2% |
| American | 2,216 | 2.1% |
| Arab | 298 | 0.3% |
| Argentinean | 26 | 0.0% |
| Armenian | 26 | 0.0% |
| Assyrian / Chaldean / Syriac | 19 | 0.0% |
| Australian | 2 | 0.0% |
| Austrian | 50 | 0.1% |
| Bangladeshi | 6 | 0.0% |
| Belgian | 45 | 0.0% |
| Bhutanese | 242 | 0.2% |
| Blackfeet | 11 | 0.0% |
| Bolivian | 32 | 0.0% |
| Brazilian | 96 | 0.1% |
| British | 341 | 0.3% |
| Burmese | 382 | 0.4% |
| Canadian | 79 | 0.1% |
| Celtic | 13 | 0.0% |
| Central American | 3,594 | 3.4% |
| Central American Indian | 132 | 0.1% |
| Cherokee | 238 | 0.2% |
| Chilean | 11 | 0.0% |
| Chippewa | 8 | 0.0% |
| Choctaw | 38 | 0.0% |
| Colombian | 109 | 0.1% |
| Costa Rican | 188 | 0.2% |
| Croatian | 35 | 0.0% |
| Cuban | 171 | 0.2% |
| Czech | 62 | 0.1% |
| Czechoslovakian | 19 | 0.0% |
| Danish | 63 | 0.1% |
| Dominican | 57 | 0.1% |
| Dutch | 574 | 0.5% |
| Eastern European | 22 | 0.0% |
| Ecuadorian | 56 | 0.1% |
| Egyptian | 53 | 0.1% |
| English | 3,955 | 3.7% |
| European | 423 | 0.4% |
| Filipino | 8 | 0.0% |
| Finnish | 67 | 0.1% |
| French | 1,120 | 1.1% |
| French Canadian | 212 | 0.2% |
| German | 4,224 | 4.0% |
| Greek | 258 | 0.2% |
| Guamanian / Chamorro | 88 | 0.1% |
| Guatemalan | 1,184 | 1.1% |
| Haitian | 35 | 0.0% |
| Honduran | 231 | 0.2% |
| Hungarian | 139 | 0.1% |
| Indian (Asian) | 922 | 0.9% |
| Indonesian | 11 | 0.0% |
| Irish | 3,873 | 3.7% |
| Iroquois | 28 | 0.0% |
| Italian | 1,894 | 1.8% |
| Jamaican | 105 | 0.1% |
| Japanese | 153 | 0.1% |
| Kiowa | 14 | 0.0% |
| Korean | 2,251 | 2.1% |
| Laotian | 20 | 0.0% |
| Latvian | 11 | 0.0% |
| Lebanese | 95 | 0.1% |
| Lithuanian | 21 | 0.0% |
| Lumbee | 15 | 0.0% |
| Malaysian | 14 | 0.0% |
| Maltese | 7 | 0.0% |
| Mexican | 69,725 | 66.0% |
| Mexican American Indian | 574 | 0.5% |
| Mongolian | 23 | 0.0% |
| Native Hawaiian | 62 | 0.1% |
| Navajo | 230 | 0.2% |
| Nicaraguan | 159 | 0.2% |
| Nigerian | 21 | 0.0% |
| Northern European | 21 | 0.0% |
| Norwegian | 232 | 0.2% |
| Osage | 6 | 0.0% |
| Pakistani | 18 | 0.0% |
| Panamanian | 13 | 0.0% |
| Peruvian | 146 | 0.1% |
| Pima | 11 | 0.0% |
| Polish | 347 | 0.3% |
| Portuguese | 277 | 0.3% |
| Puerto Rican | 602 | 0.6% |
| Romanian | 13 | 0.0% |
| Russian | 124 | 0.1% |
| Salvadoran | 1,819 | 1.7% |
| Samoan | 63 | 0.1% |
| Scandinavian | 112 | 0.1% |
| Scotch-Irish | 277 | 0.3% |
| Scottish | 388 | 0.4% |
| Serbian | 8 | 0.0% |
| Slovak | 4 | 0.0% |
| South American | 420 | 0.4% |
| South American Indian | 7 | 0.0% |
| Spaniard | 408 | 0.4% |
| Spanish | 389 | 0.4% |
| Sri Lankan | 237 | 0.2% |
| Subsaharan African | 186 | 0.2% |
| Swedish | 335 | 0.3% |
| Swiss | 44 | 0.0% |
| Syrian | 42 | 0.0% |
| Thai | 499 | 0.5% |
| Tongan | 247 | 0.2% |
| Turkish | 25 | 0.0% |
| Ukrainian | 55 | 0.1% |
| Uruguayan | 40 | 0.0% |
| Welsh | 178 | 0.2% |
| Yaqui | 14 | 0.0% |
| Yugoslavian | 5 | 0.0% | View All 109 Rows |
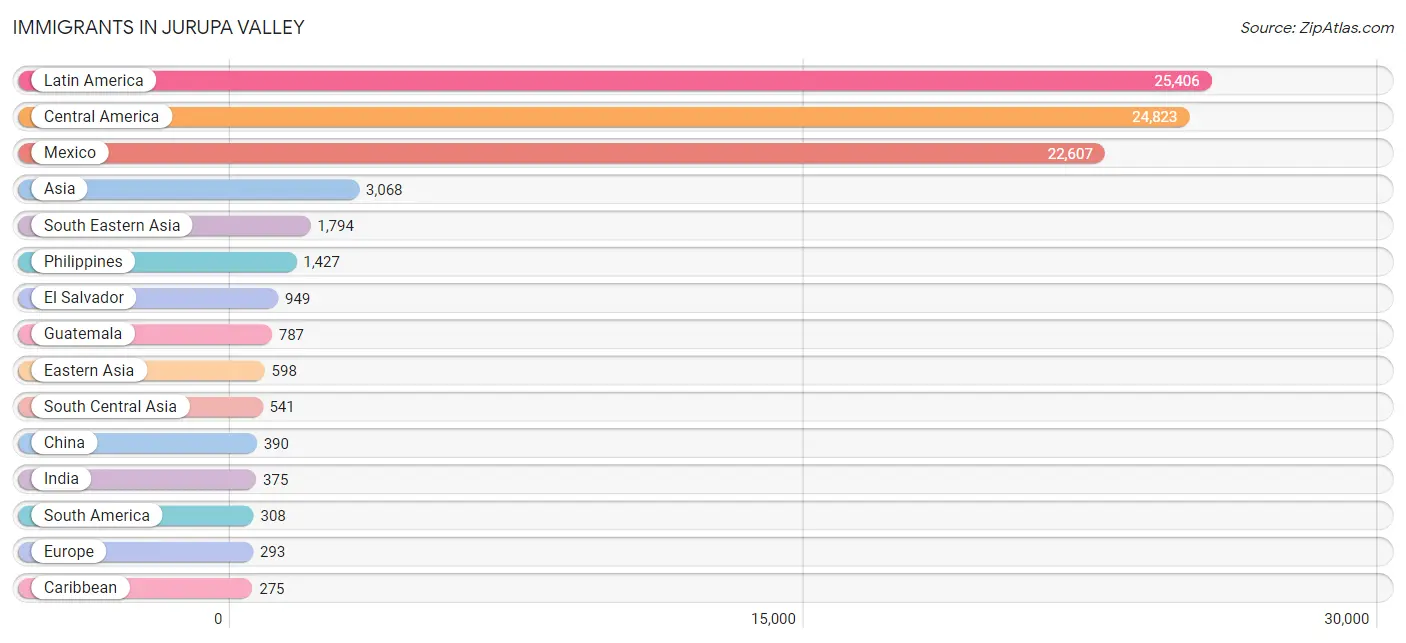
Immigrants in Jurupa Valley
The most numerous immigrant groups reported in Jurupa Valley came from Latin America (25,406 | 24.0%), Central America (24,823 | 23.5%), Mexico (22,607 | 21.4%), Asia (3,068 | 2.9%), and South Eastern Asia (1,794 | 1.7%), together accounting for 73.5% of all Jurupa Valley residents.
| Immigration Origin | # Population | % Population |
| Afghanistan | 46 | 0.0% |
| Africa | 82 | 0.1% |
| Argentina | 5 | 0.0% |
| Asia | 3,068 | 2.9% |
| Australia | 25 | 0.0% |
| Austria | 11 | 0.0% |
| Belize | 6 | 0.0% |
| Bolivia | 39 | 0.0% |
| Brazil | 40 | 0.0% |
| Cambodia | 74 | 0.1% |
| Canada | 110 | 0.1% |
| Caribbean | 275 | 0.3% |
| Central America | 24,823 | 23.5% |
| China | 390 | 0.4% |
| Colombia | 83 | 0.1% |
| Costa Rica | 112 | 0.1% |
| Cuba | 162 | 0.2% |
| Dominican Republic | 5 | 0.0% |
| Eastern Asia | 598 | 0.6% |
| Eastern Europe | 41 | 0.0% |
| Ecuador | 28 | 0.0% |
| Egypt | 20 | 0.0% |
| El Salvador | 949 | 0.9% |
| England | 6 | 0.0% |
| Europe | 293 | 0.3% |
| Fiji | 8 | 0.0% |
| France | 9 | 0.0% |
| Germany | 48 | 0.1% |
| Greece | 67 | 0.1% |
| Guatemala | 787 | 0.7% |
| Haiti | 22 | 0.0% |
| Honduras | 132 | 0.1% |
| Hong Kong | 72 | 0.1% |
| India | 375 | 0.4% |
| Indonesia | 47 | 0.0% |
| Ireland | 13 | 0.0% |
| Italy | 7 | 0.0% |
| Jamaica | 86 | 0.1% |
| Japan | 39 | 0.0% |
| Korea | 169 | 0.2% |
| Latin America | 25,406 | 24.0% |
| Lebanon | 91 | 0.1% |
| Mexico | 22,607 | 21.4% |
| Moldova | 6 | 0.0% |
| Netherlands | 20 | 0.0% |
| Nicaragua | 230 | 0.2% |
| Nigeria | 19 | 0.0% |
| Northern Africa | 34 | 0.0% |
| Northern Europe | 54 | 0.1% |
| Oceania | 105 | 0.1% |
| Pakistan | 120 | 0.1% |
| Peru | 73 | 0.1% |
| Philippines | 1,427 | 1.3% |
| Poland | 14 | 0.0% |
| Saudi Arabia | 25 | 0.0% |
| South America | 308 | 0.3% |
| South Central Asia | 541 | 0.5% |
| South Eastern Asia | 1,794 | 1.7% |
| Southern Europe | 110 | 0.1% |
| Spain | 29 | 0.0% |
| Sweden | 1 | 0.0% |
| Taiwan | 20 | 0.0% |
| Thailand | 8 | 0.0% |
| Turkey | 19 | 0.0% |
| Ukraine | 16 | 0.0% |
| Uruguay | 40 | 0.0% |
| Vietnam | 206 | 0.2% |
| Western Africa | 19 | 0.0% |
| Western Asia | 135 | 0.1% |
| Western Europe | 88 | 0.1% | View All 70 Rows |
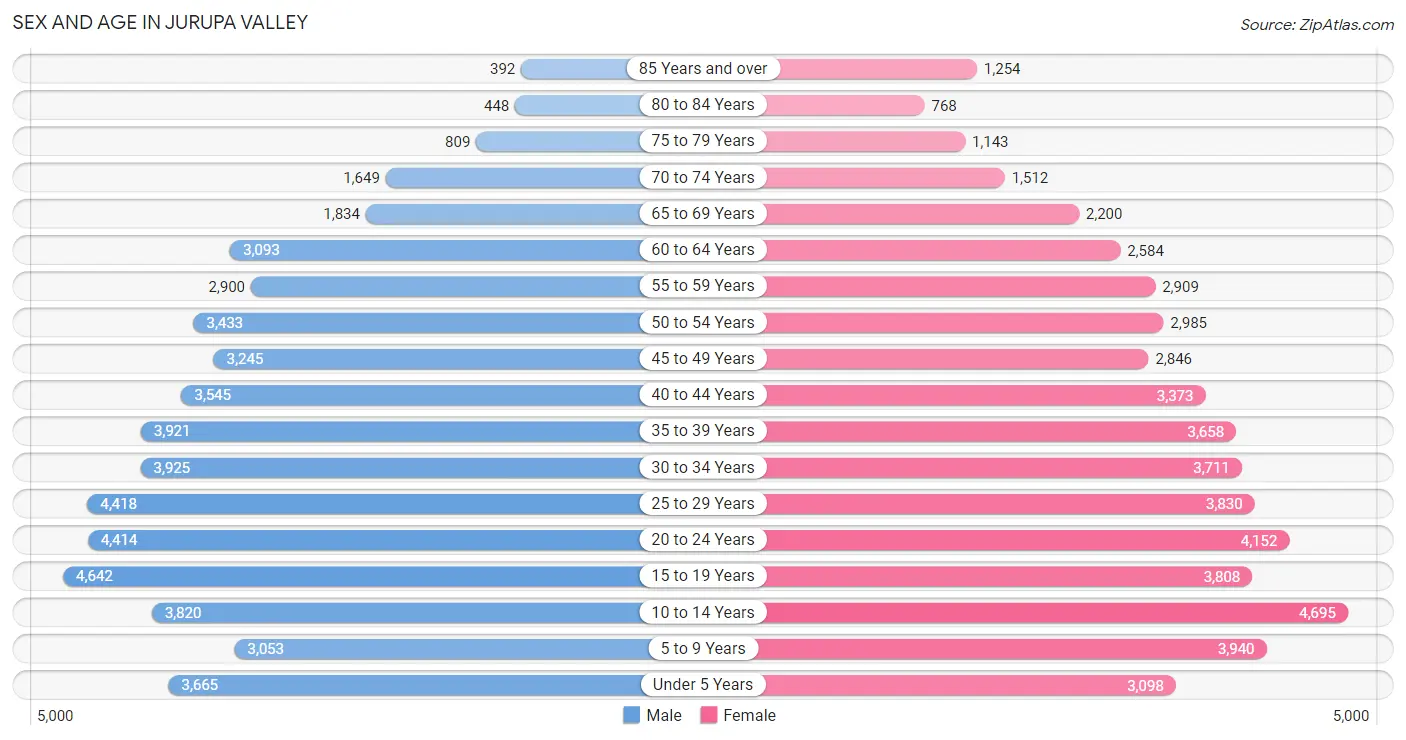
Sex and Age in Jurupa Valley
Sex and Age in Jurupa Valley
The most populous age groups in Jurupa Valley are 15 to 19 Years (4,642 | 8.7%) for men and 10 to 14 Years (4,695 | 8.9%) for women.
| Age Bracket | Male | Female |
| Under 5 Years | 3,665 (6.9%) | 3,098 (5.9%) |
| 5 to 9 Years | 3,053 (5.7%) | 3,940 (7.5%) |
| 10 to 14 Years | 3,820 (7.2%) | 4,695 (8.9%) |
| 15 to 19 Years | 4,642 (8.7%) | 3,808 (7.3%) |
| 20 to 24 Years | 4,414 (8.3%) | 4,152 (7.9%) |
| 25 to 29 Years | 4,418 (8.3%) | 3,830 (7.3%) |
| 30 to 34 Years | 3,925 (7.4%) | 3,711 (7.1%) |
| 35 to 39 Years | 3,921 (7.4%) | 3,658 (7.0%) |
| 40 to 44 Years | 3,545 (6.7%) | 3,373 (6.4%) |
| 45 to 49 Years | 3,245 (6.1%) | 2,846 (5.4%) |
| 50 to 54 Years | 3,433 (6.5%) | 2,985 (5.7%) |
| 55 to 59 Years | 2,900 (5.4%) | 2,909 (5.5%) |
| 60 to 64 Years | 3,093 (5.8%) | 2,584 (4.9%) |
| 65 to 69 Years | 1,834 (3.5%) | 2,200 (4.2%) |
| 70 to 74 Years | 1,649 (3.1%) | 1,512 (2.9%) |
| 75 to 79 Years | 809 (1.5%) | 1,143 (2.2%) |
| 80 to 84 Years | 448 (0.8%) | 768 (1.5%) |
| 85 Years and over | 392 (0.7%) | 1,254 (2.4%) |
| Total | 53,206 (100.0%) | 52,466 (100.0%) |
Families and Households in Jurupa Valley
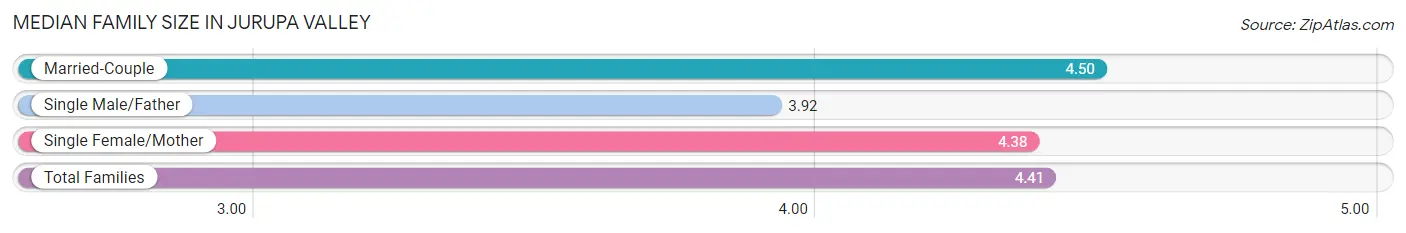
Median Family Size in Jurupa Valley
The median family size in Jurupa Valley is 4.41 persons per family, with married-couple families (14,757 | 68.9%) accounting for the largest median family size of 4.5 persons per family. On the other hand, single male/father families (2,389 | 11.2%) represent the smallest median family size with 3.92 persons per family.
| Family Type | # Families | Family Size |
| Married-Couple | 14,757 (68.9%) | 4.50 |
| Single Male/Father | 2,389 (11.2%) | 3.92 |
| Single Female/Mother | 4,262 (19.9%) | 4.38 |
| Total Families | 21,408 (100.0%) | 4.41 |
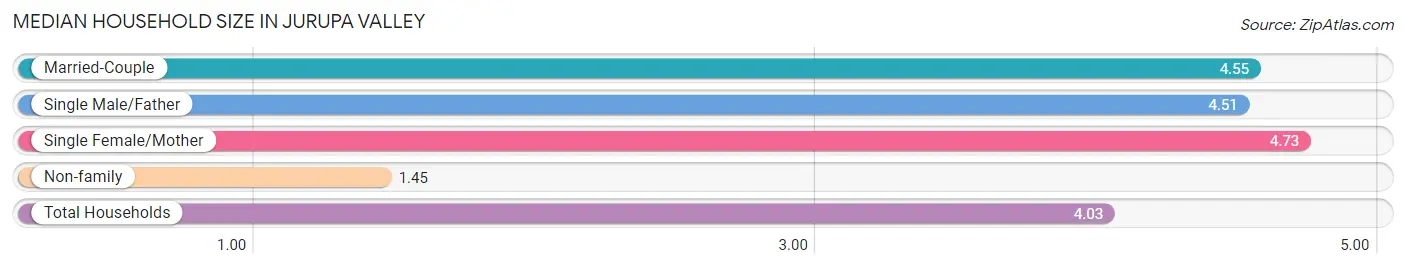
Median Household Size in Jurupa Valley
The median household size in Jurupa Valley is 4.03 persons per household, with single female/mother households (4,262 | 16.4%) accounting for the largest median household size of 4.73 persons per household. non-family households (4,549 | 17.5%) represent the smallest median household size with 1.45 persons per household.
| Household Type | # Households | Household Size |
| Married-Couple | 14,757 (56.9%) | 4.55 |
| Single Male/Father | 2,389 (9.2%) | 4.51 |
| Single Female/Mother | 4,262 (16.4%) | 4.73 |
| Non-family | 4,549 (17.5%) | 1.45 |
| Total Households | 25,957 (100.0%) | 4.03 |
Household Size by Marriage Status in Jurupa Valley
Out of a total of 25,957 households in Jurupa Valley, 21,408 (82.5%) are family households, while 4,549 (17.5%) are nonfamily households. The most numerous type of family households are 4-person households, comprising 4,757, and the most common type of nonfamily households are 1-person households, comprising 3,218.
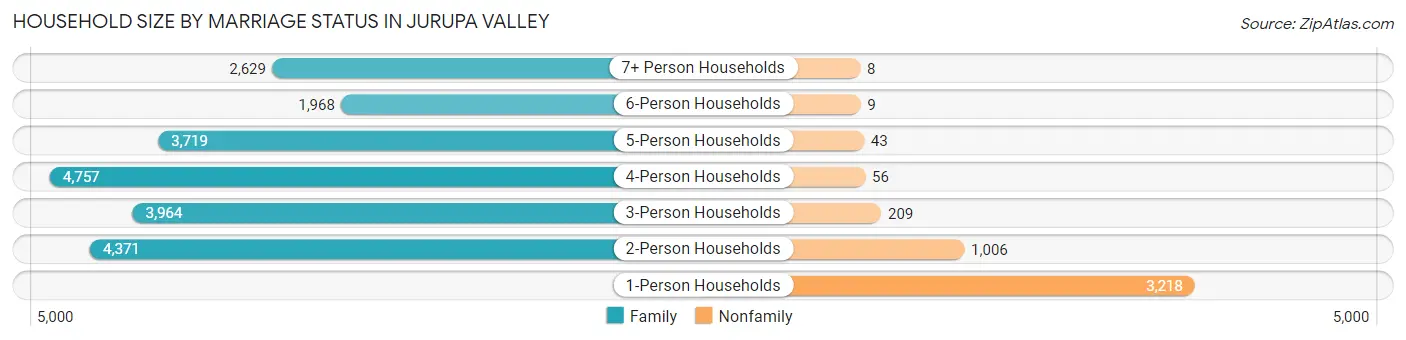
| Household Size | Family Households | Nonfamily Households |
| 1-Person Households | - | 3,218 (12.4%) |
| 2-Person Households | 4,371 (16.8%) | 1,006 (3.9%) |
| 3-Person Households | 3,964 (15.3%) | 209 (0.8%) |
| 4-Person Households | 4,757 (18.3%) | 56 (0.2%) |
| 5-Person Households | 3,719 (14.3%) | 43 (0.2%) |
| 6-Person Households | 1,968 (7.6%) | 9 (0.0%) |
| 7+ Person Households | 2,629 (10.1%) | 8 (0.0%) |
| Total | 21,408 (82.5%) | 4,549 (17.5%) |
Female Fertility in Jurupa Valley
Fertility by Age in Jurupa Valley
Average fertility rate in Jurupa Valley is 61.0 births per 1,000 women. Women in the age bracket of 20 to 34 years have the highest fertility rate with 108.0 births per 1,000 women. Women in the age bracket of 20 to 34 years acount for 79.8% of all women with births.
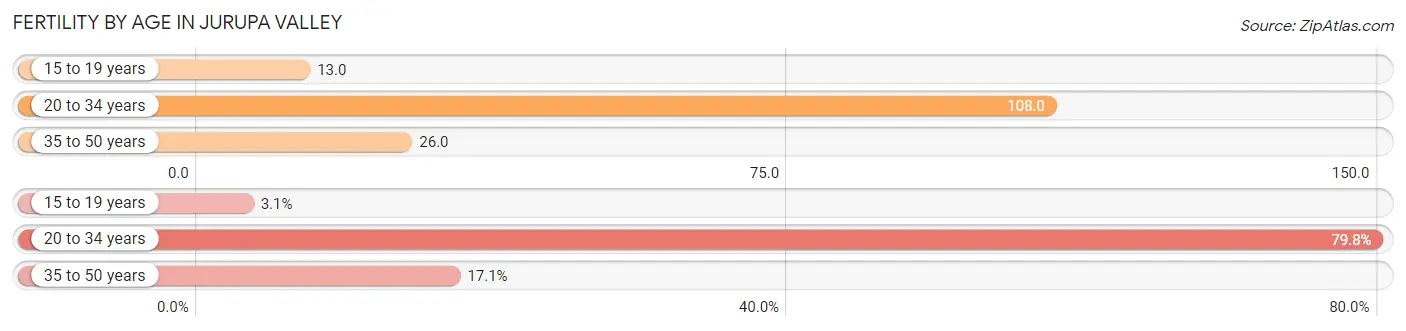
| Age Bracket | Women with Births | Births / 1,000 Women |
| 15 to 19 years | 49 (3.1%) | 13.0 |
| 20 to 34 years | 1,262 (79.8%) | 108.0 |
| 35 to 50 years | 271 (17.1%) | 26.0 |
| Total | 1,582 (100.0%) | 61.0 |
Fertility by Age by Marriage Status in Jurupa Valley
65.7% of women with births (1,582) in Jurupa Valley are married. The highest percentage of unmarried women with births falls into 15 to 19 years age bracket with 100.0% of them unmarried at the time of birth, while the lowest percentage of unmarried women with births belong to 35 to 50 years age bracket with 8.9% of them unmarried.
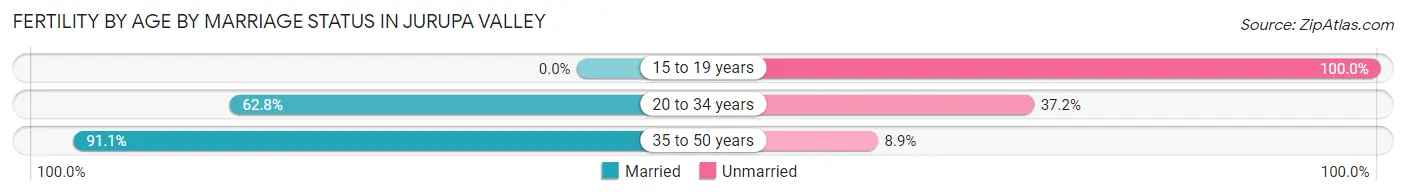
| Age Bracket | Married | Unmarried |
| 15 to 19 years | 0 (0.0%) | 49 (100.0%) |
| 20 to 34 years | 793 (62.8%) | 469 (37.2%) |
| 35 to 50 years | 247 (91.1%) | 24 (8.9%) |
| Total | 1,039 (65.7%) | 543 (34.3%) |
Fertility by Education in Jurupa Valley
Average fertility rate in Jurupa Valley is 61.0 births per 1,000 women. Women with the education attainment of graduate degree have the highest fertility rate of 107.0 births per 1,000 women, while women with the education attainment of less than high school have the lowest fertility at 16.0 births per 1,000 women. Women with the education attainment of college or associate's degree represent 38.9% of all women with births.
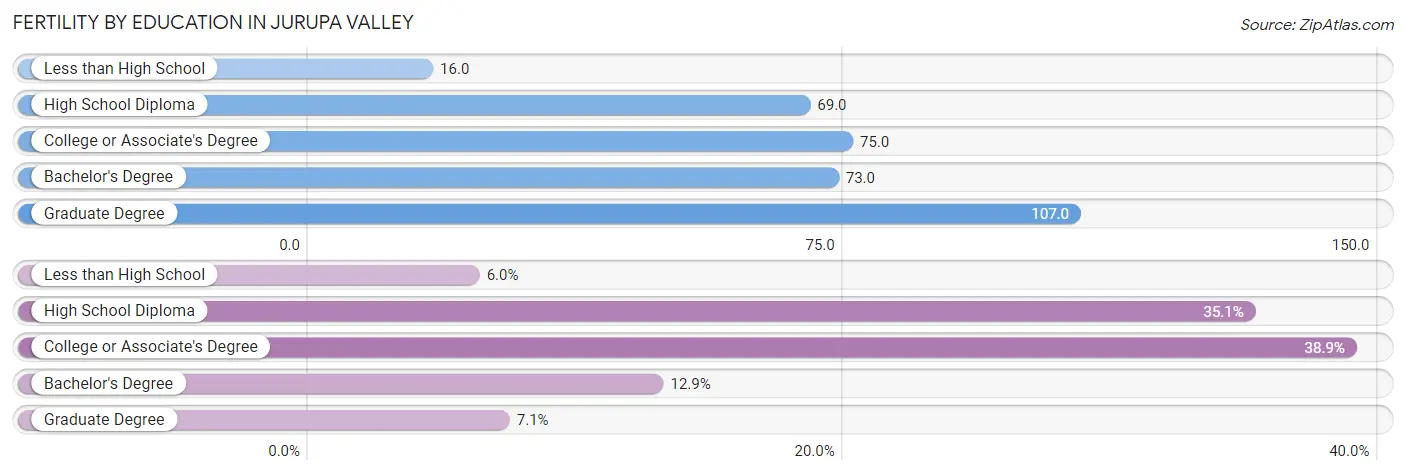
| Educational Attainment | Women with Births | Births / 1,000 Women |
| Less than High School | 95 (6.0%) | 16.0 |
| High School Diploma | 555 (35.1%) | 69.0 |
| College or Associate's Degree | 615 (38.9%) | 75.0 |
| Bachelor's Degree | 204 (12.9%) | 73.0 |
| Graduate Degree | 113 (7.1%) | 107.0 |
| Total | 1,582 (100.0%) | 61.0 |
Fertility by Education by Marriage Status in Jurupa Valley
34.3% of women with births in Jurupa Valley are unmarried. Women with the educational attainment of graduate degree are most likely to be married with 85.8% of them married at childbirth, while women with the educational attainment of college or associate's degree are least likely to be married with 44.4% of them unmarried at childbirth.
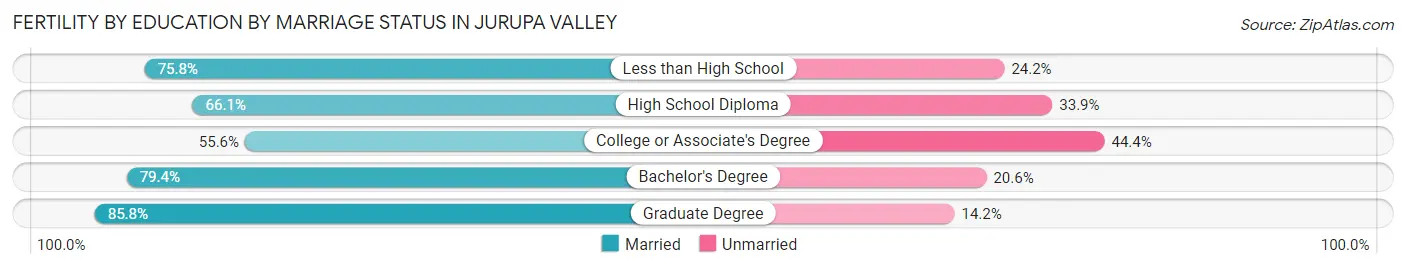
| Educational Attainment | Married | Unmarried |
| Less than High School | 72 (75.8%) | 23 (24.2%) |
| High School Diploma | 367 (66.1%) | 188 (33.9%) |
| College or Associate's Degree | 342 (55.6%) | 273 (44.4%) |
| Bachelor's Degree | 162 (79.4%) | 42 (20.6%) |
| Graduate Degree | 97 (85.8%) | 16 (14.2%) |
| Total | 1,039 (65.7%) | 543 (34.3%) |
Employment Characteristics in Jurupa Valley
Employment by Class of Employer in Jurupa Valley
Among the 46,418 employed individuals in Jurupa Valley, private company employees (34,185 | 73.7%), local government employees (3,484 | 7.5%), and self-employed (not incorporated) (3,025 | 6.5%) make up the most common classes of employment.
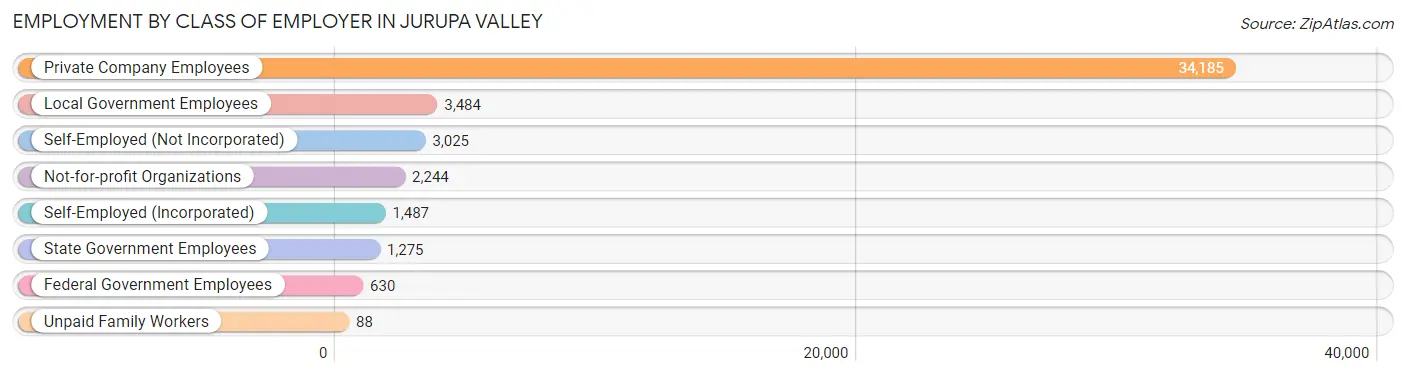
| Employer Class | # Employees | % Employees |
| Private Company Employees | 34,185 | 73.7% |
| Self-Employed (Incorporated) | 1,487 | 3.2% |
| Self-Employed (Not Incorporated) | 3,025 | 6.5% |
| Not-for-profit Organizations | 2,244 | 4.8% |
| Local Government Employees | 3,484 | 7.5% |
| State Government Employees | 1,275 | 2.8% |
| Federal Government Employees | 630 | 1.4% |
| Unpaid Family Workers | 88 | 0.2% |
| Total | 46,418 | 100.0% |
Employment Status by Age in Jurupa Valley
According to the labor force statistics for Jurupa Valley, out of the total population over 16 years of age (81,486), 63.7% or 51,907 individuals are in the labor force, with 6.8% or 3,530 of them unemployed. The age group with the highest labor force participation rate is 25 to 29 years, with 81.4% or 6,714 individuals in the labor force. Within the labor force, the 16 to 19 years age range has the highest percentage of unemployed individuals, with 33.0% or 854 of them being unemployed.
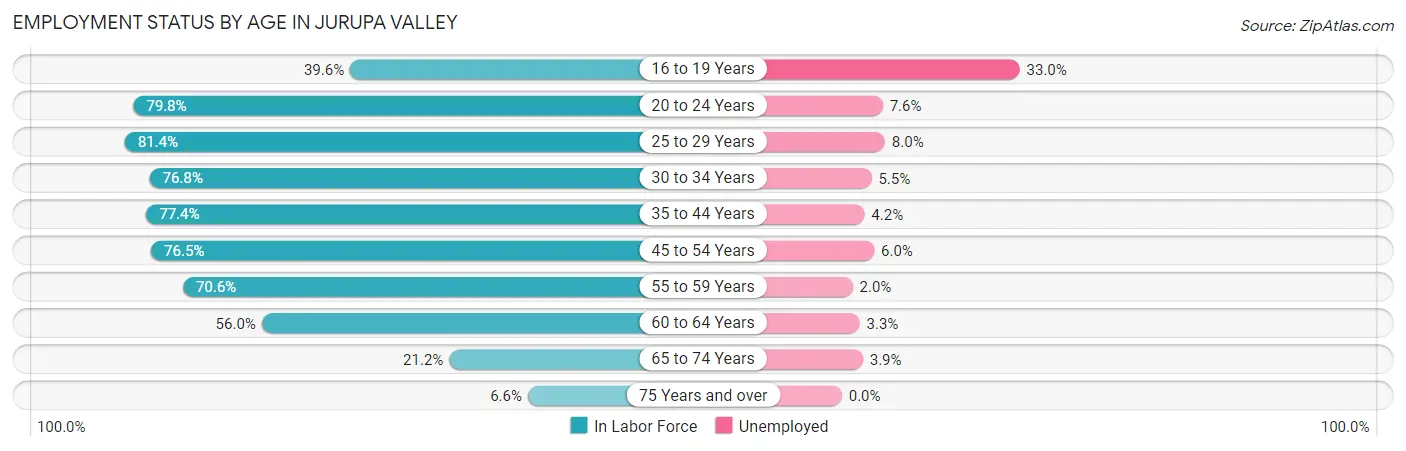
| Age Bracket | In Labor Force | Unemployed |
| 16 to 19 Years | 2,588 (39.6%) | 854 (33.0%) |
| 20 to 24 Years | 6,836 (79.8%) | 520 (7.6%) |
| 25 to 29 Years | 6,714 (81.4%) | 537 (8.0%) |
| 30 to 34 Years | 5,864 (76.8%) | 323 (5.5%) |
| 35 to 44 Years | 11,221 (77.4%) | 471 (4.2%) |
| 45 to 54 Years | 9,569 (76.5%) | 574 (6.0%) |
| 55 to 59 Years | 4,101 (70.6%) | 82 (2.0%) |
| 60 to 64 Years | 3,179 (56.0%) | 105 (3.3%) |
| 65 to 74 Years | 1,525 (21.2%) | 59 (3.9%) |
| 75 Years and over | 318 (6.6%) | 0 (0.0%) |
| Total | 51,907 (63.7%) | 3,530 (6.8%) |
Employment Status by Educational Attainment in Jurupa Valley
According to labor force statistics for Jurupa Valley, 74.8% of individuals (40,673) out of the total population between 25 and 64 years of age (54,376) are in the labor force, with 5.1% or 2,074 of them being unemployed. The group with the highest labor force participation rate are those with the educational attainment of bachelor's degree or higher, with 83.4% or 6,549 individuals in the labor force. Within the labor force, individuals with less than high school education have the highest percentage of unemployment, with 7.8% or 758 of them being unemployed.
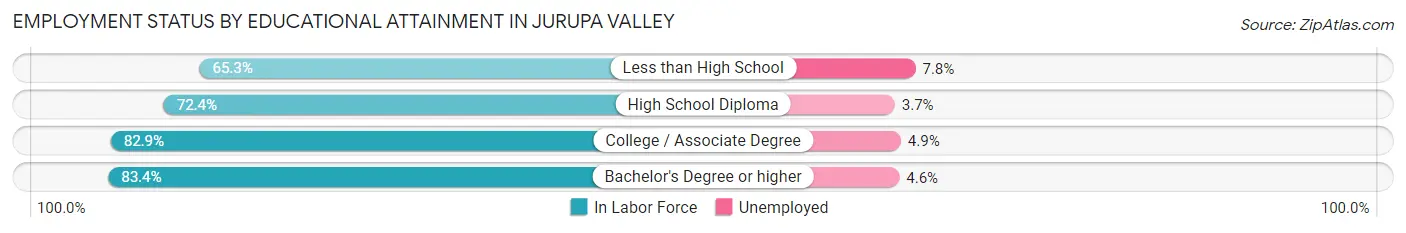
| Educational Attainment | In Labor Force | Unemployed |
| Less than High School | 9,721 (65.3%) | 1,161 (7.8%) |
| High School Diploma | 12,729 (72.4%) | 651 (3.7%) |
| College / Associate Degree | 11,652 (82.9%) | 689 (4.9%) |
| Bachelor's Degree or higher | 6,549 (83.4%) | 361 (4.6%) |
| Total | 40,673 (74.8%) | 2,773 (5.1%) |
Employment Occupations by Sex in Jurupa Valley
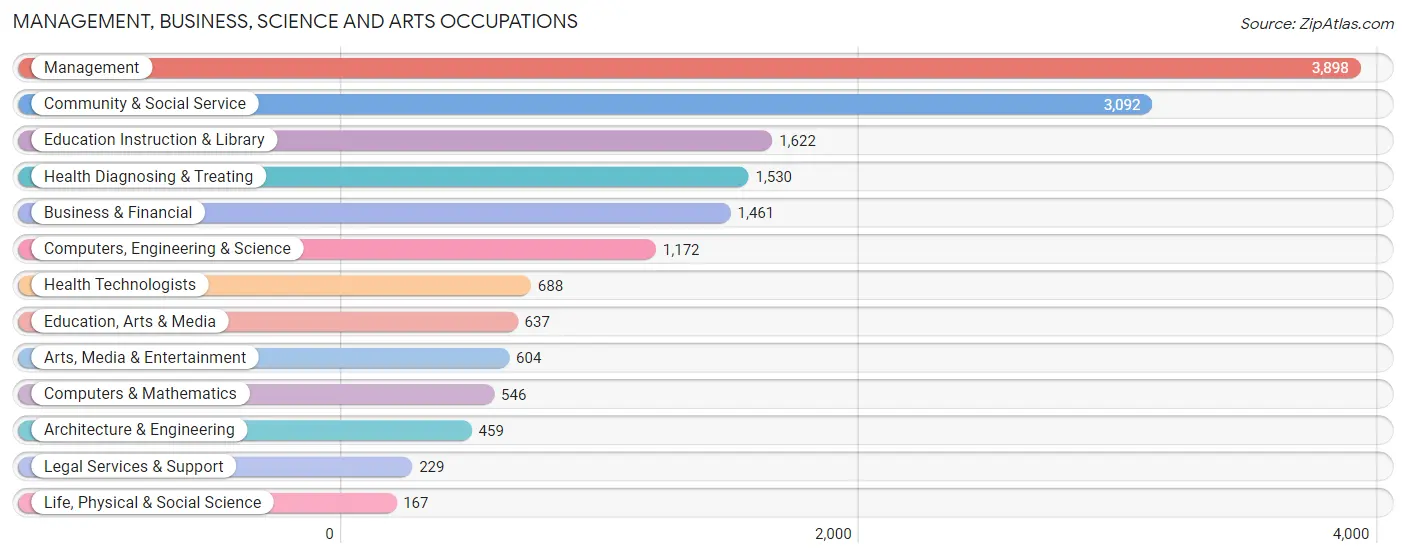
Management, Business, Science and Arts Occupations
The most common Management, Business, Science and Arts occupations in Jurupa Valley are Management (3,898 | 8.1%), Community & Social Service (3,092 | 6.4%), Education Instruction & Library (1,622 | 3.4%), Health Diagnosing & Treating (1,530 | 3.2%), and Business & Financial (1,461 | 3.0%).
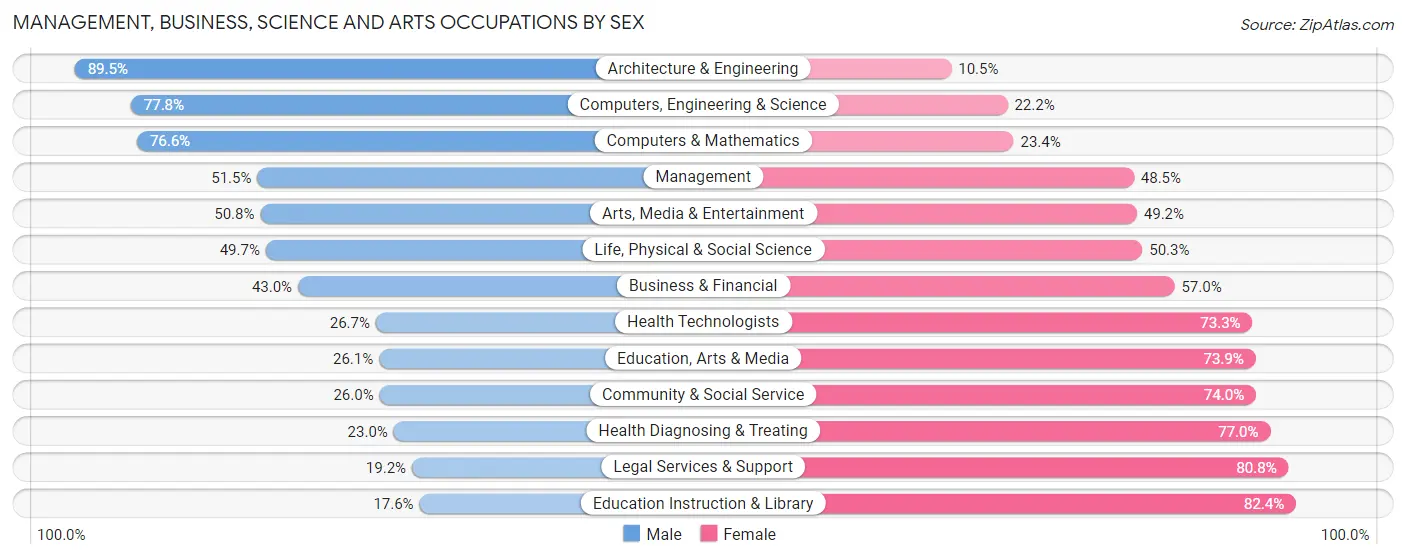
Management, Business, Science and Arts Occupations by Sex
Within the Management, Business, Science and Arts occupations in Jurupa Valley, the most male-oriented occupations are Architecture & Engineering (89.5%), Computers, Engineering & Science (77.8%), and Computers & Mathematics (76.6%), while the most female-oriented occupations are Education Instruction & Library (82.4%), Legal Services & Support (80.8%), and Health Diagnosing & Treating (77.0%).
| Occupation | Male | Female |
| Management | 2,006 (51.5%) | 1,892 (48.5%) |
| Business & Financial | 628 (43.0%) | 833 (57.0%) |
| Computers, Engineering & Science | 912 (77.8%) | 260 (22.2%) |
| Computers & Mathematics | 418 (76.6%) | 128 (23.4%) |
| Architecture & Engineering | 411 (89.5%) | 48 (10.5%) |
| Life, Physical & Social Science | 83 (49.7%) | 84 (50.3%) |
| Community & Social Service | 803 (26.0%) | 2,289 (74.0%) |
| Education, Arts & Media | 166 (26.1%) | 471 (73.9%) |
| Legal Services & Support | 44 (19.2%) | 185 (80.8%) |
| Education Instruction & Library | 286 (17.6%) | 1,336 (82.4%) |
| Arts, Media & Entertainment | 307 (50.8%) | 297 (49.2%) |
| Health Diagnosing & Treating | 352 (23.0%) | 1,178 (77.0%) |
| Health Technologists | 184 (26.7%) | 504 (73.3%) |
| Total (Category) | 4,701 (42.1%) | 6,452 (57.9%) |
| Total (Overall) | 28,230 (58.4%) | 20,136 (41.6%) |
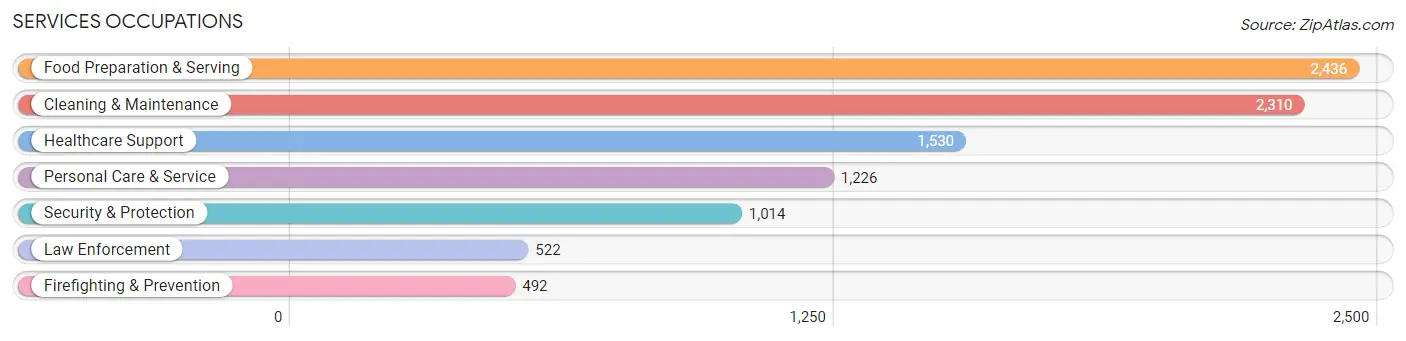
Services Occupations
The most common Services occupations in Jurupa Valley are Food Preparation & Serving (2,436 | 5.0%), Cleaning & Maintenance (2,310 | 4.8%), Healthcare Support (1,530 | 3.2%), Personal Care & Service (1,226 | 2.5%), and Security & Protection (1,014 | 2.1%).
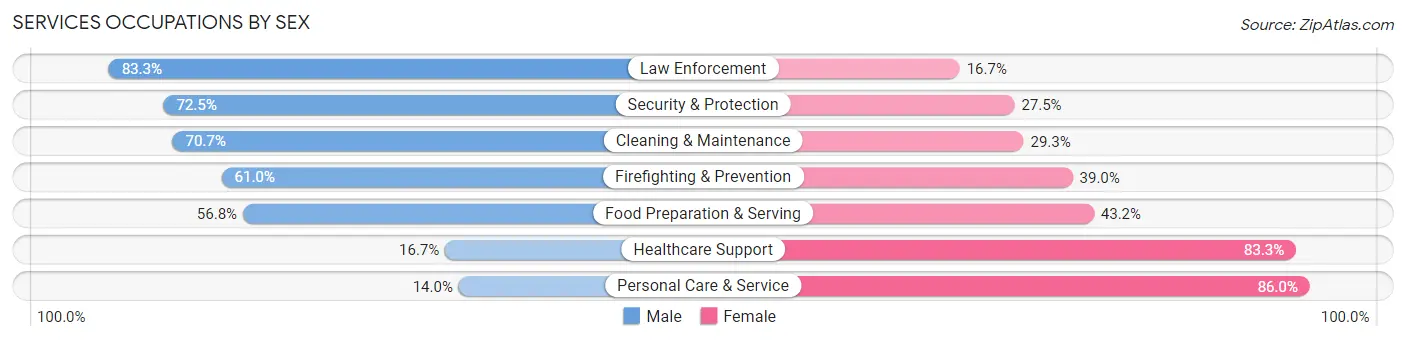
Services Occupations by Sex
Within the Services occupations in Jurupa Valley, the most male-oriented occupations are Law Enforcement (83.3%), Security & Protection (72.5%), and Cleaning & Maintenance (70.7%), while the most female-oriented occupations are Personal Care & Service (86.0%), Healthcare Support (83.3%), and Food Preparation & Serving (43.2%).
| Occupation | Male | Female |
| Healthcare Support | 256 (16.7%) | 1,274 (83.3%) |
| Security & Protection | 735 (72.5%) | 279 (27.5%) |
| Firefighting & Prevention | 300 (61.0%) | 192 (39.0%) |
| Law Enforcement | 435 (83.3%) | 87 (16.7%) |
| Food Preparation & Serving | 1,383 (56.8%) | 1,053 (43.2%) |
| Cleaning & Maintenance | 1,633 (70.7%) | 677 (29.3%) |
| Personal Care & Service | 172 (14.0%) | 1,054 (86.0%) |
| Total (Category) | 4,179 (49.1%) | 4,337 (50.9%) |
| Total (Overall) | 28,230 (58.4%) | 20,136 (41.6%) |
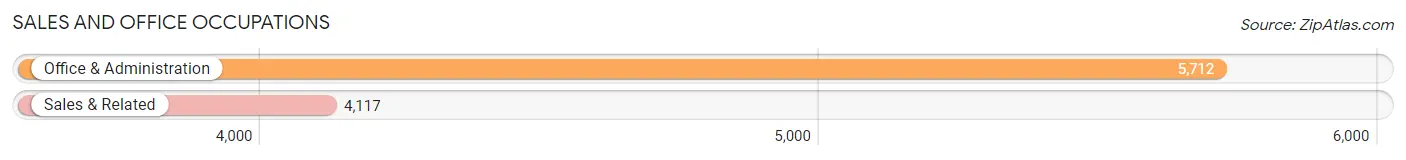
Sales and Office Occupations
The most common Sales and Office occupations in Jurupa Valley are Office & Administration (5,712 | 11.8%), and Sales & Related (4,117 | 8.5%).
Sales and Office Occupations by Sex
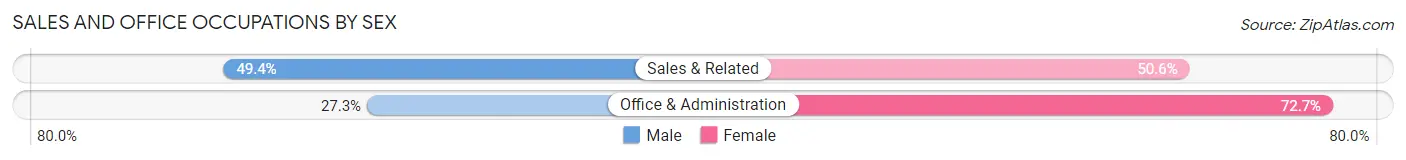
| Occupation | Male | Female |
| Sales & Related | 2,034 (49.4%) | 2,083 (50.6%) |
| Office & Administration | 1,561 (27.3%) | 4,151 (72.7%) |
| Total (Category) | 3,595 (36.6%) | 6,234 (63.4%) |
| Total (Overall) | 28,230 (58.4%) | 20,136 (41.6%) |
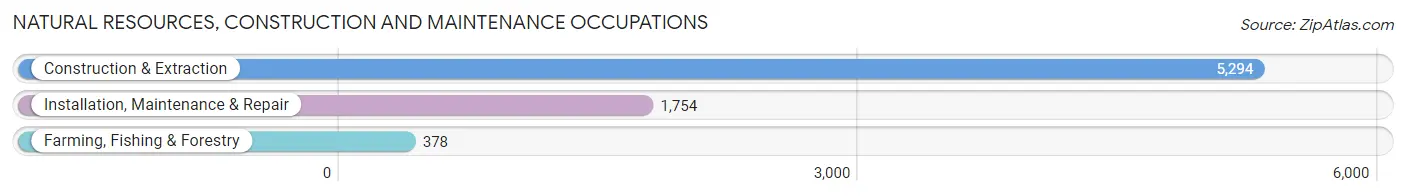
Natural Resources, Construction and Maintenance Occupations
The most common Natural Resources, Construction and Maintenance occupations in Jurupa Valley are Construction & Extraction (5,294 | 11.0%), Installation, Maintenance & Repair (1,754 | 3.6%), and Farming, Fishing & Forestry (378 | 0.8%).
Natural Resources, Construction and Maintenance Occupations by Sex
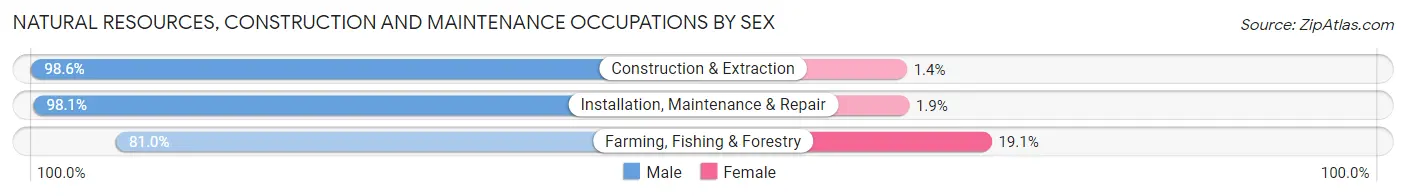
| Occupation | Male | Female |
| Farming, Fishing & Forestry | 306 (80.9%) | 72 (19.1%) |
| Construction & Extraction | 5,219 (98.6%) | 75 (1.4%) |
| Installation, Maintenance & Repair | 1,721 (98.1%) | 33 (1.9%) |
| Total (Category) | 7,246 (97.6%) | 180 (2.4%) |
| Total (Overall) | 28,230 (58.4%) | 20,136 (41.6%) |
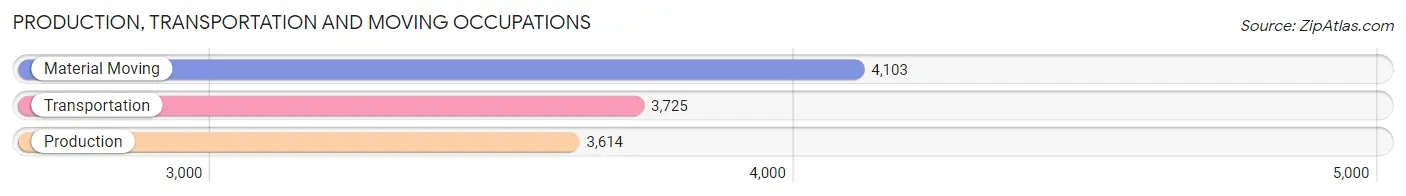
Production, Transportation and Moving Occupations
The most common Production, Transportation and Moving occupations in Jurupa Valley are Material Moving (4,103 | 8.5%), Transportation (3,725 | 7.7%), and Production (3,614 | 7.5%).
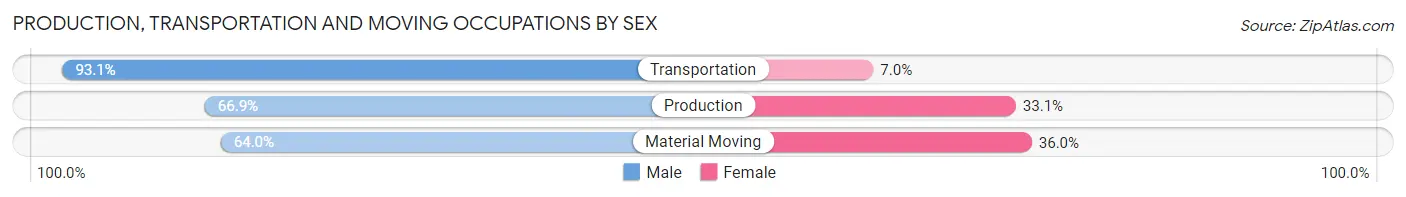
Production, Transportation and Moving Occupations by Sex
| Occupation | Male | Female |
| Production | 2,418 (66.9%) | 1,196 (33.1%) |
| Transportation | 3,466 (93.0%) | 259 (7.0%) |
| Material Moving | 2,625 (64.0%) | 1,478 (36.0%) |
| Total (Category) | 8,509 (74.4%) | 2,933 (25.6%) |
| Total (Overall) | 28,230 (58.4%) | 20,136 (41.6%) |
Employment Industries by Sex in Jurupa Valley
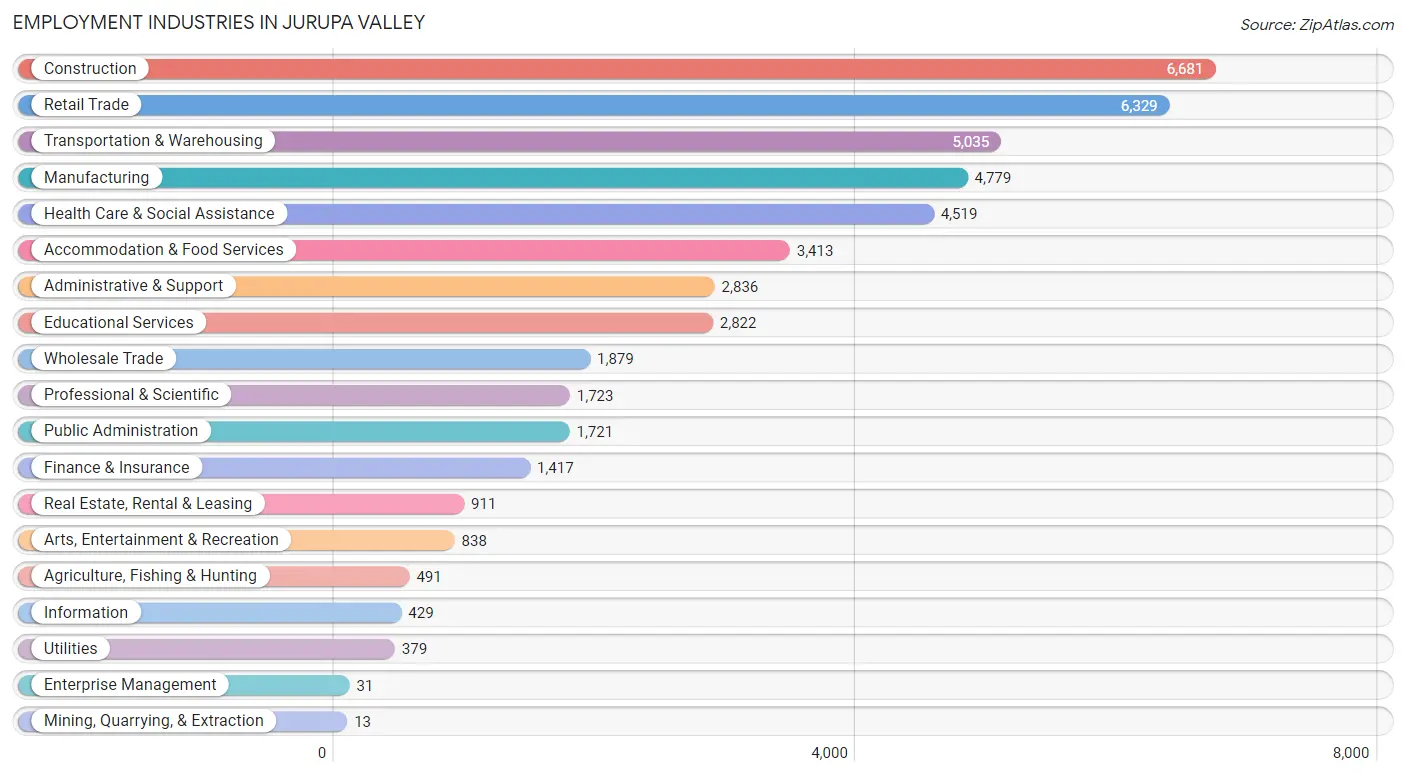
Employment Industries in Jurupa Valley
The major employment industries in Jurupa Valley include Construction (6,681 | 13.8%), Retail Trade (6,329 | 13.1%), Transportation & Warehousing (5,035 | 10.4%), Manufacturing (4,779 | 9.9%), and Health Care & Social Assistance (4,519 | 9.3%).
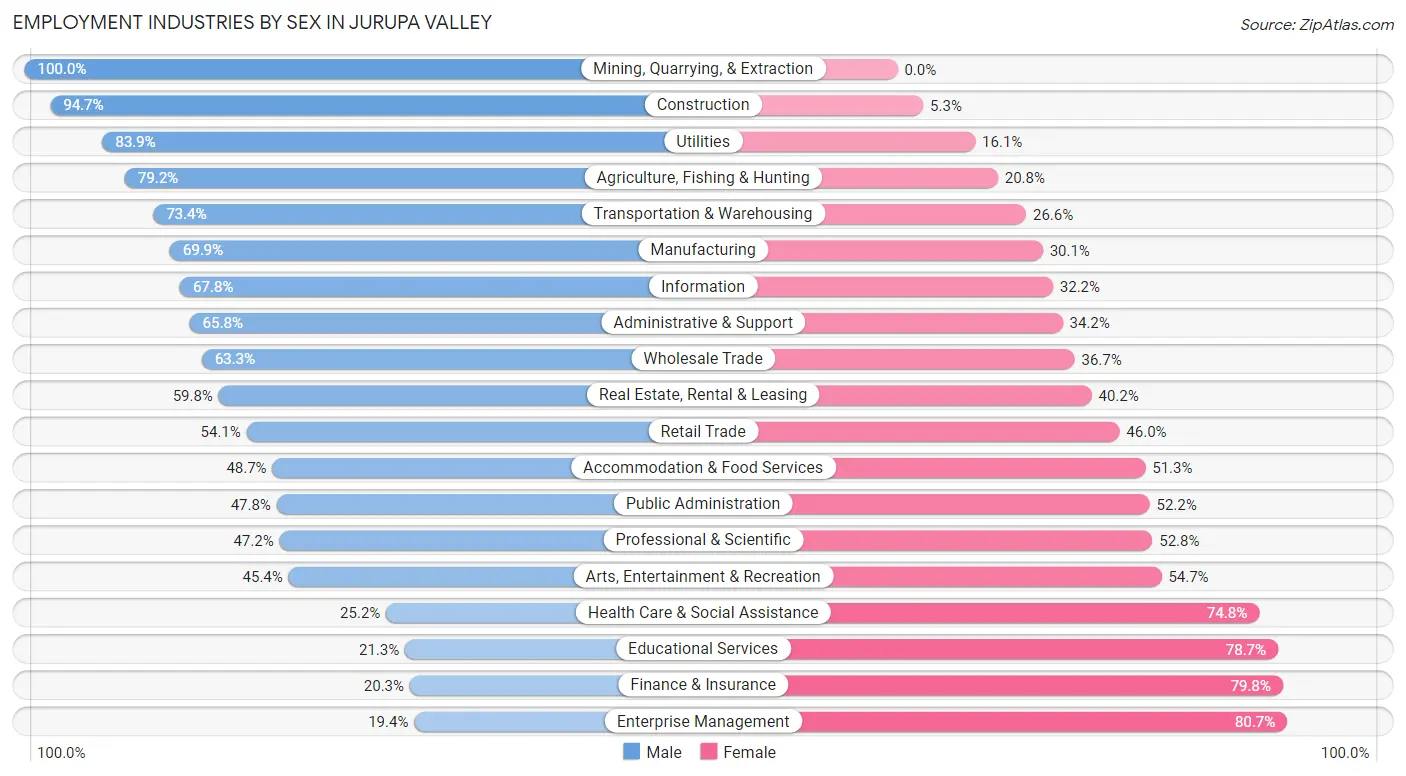
Employment Industries by Sex in Jurupa Valley
The Jurupa Valley industries that see more men than women are Mining, Quarrying, & Extraction (100.0%), Construction (94.7%), and Utilities (83.9%), whereas the industries that tend to have a higher number of women are Enterprise Management (80.6%), Finance & Insurance (79.7%), and Educational Services (78.7%).
| Industry | Male | Female |
| Agriculture, Fishing & Hunting | 389 (79.2%) | 102 (20.8%) |
| Mining, Quarrying, & Extraction | 13 (100.0%) | 0 (0.0%) |
| Construction | 6,325 (94.7%) | 356 (5.3%) |
| Manufacturing | 3,342 (69.9%) | 1,437 (30.1%) |
| Wholesale Trade | 1,190 (63.3%) | 689 (36.7%) |
| Retail Trade | 3,421 (54.0%) | 2,908 (46.0%) |
| Transportation & Warehousing | 3,694 (73.4%) | 1,341 (26.6%) |
| Utilities | 318 (83.9%) | 61 (16.1%) |
| Information | 291 (67.8%) | 138 (32.2%) |
| Finance & Insurance | 287 (20.3%) | 1,130 (79.7%) |
| Real Estate, Rental & Leasing | 545 (59.8%) | 366 (40.2%) |
| Professional & Scientific | 814 (47.2%) | 909 (52.8%) |
| Enterprise Management | 6 (19.4%) | 25 (80.6%) |
| Administrative & Support | 1,867 (65.8%) | 969 (34.2%) |
| Educational Services | 600 (21.3%) | 2,222 (78.7%) |
| Health Care & Social Assistance | 1,137 (25.2%) | 3,382 (74.8%) |
| Arts, Entertainment & Recreation | 380 (45.4%) | 458 (54.6%) |
| Accommodation & Food Services | 1,662 (48.7%) | 1,751 (51.3%) |
| Public Administration | 823 (47.8%) | 898 (52.2%) |
| Total | 28,230 (58.4%) | 20,136 (41.6%) |
Education in Jurupa Valley
School Enrollment in Jurupa Valley
The most common levels of schooling among the 29,270 students in Jurupa Valley are high school (7,120 | 24.3%), college / undergraduate (6,989 | 23.9%), and middle school (6,465 | 22.1%).
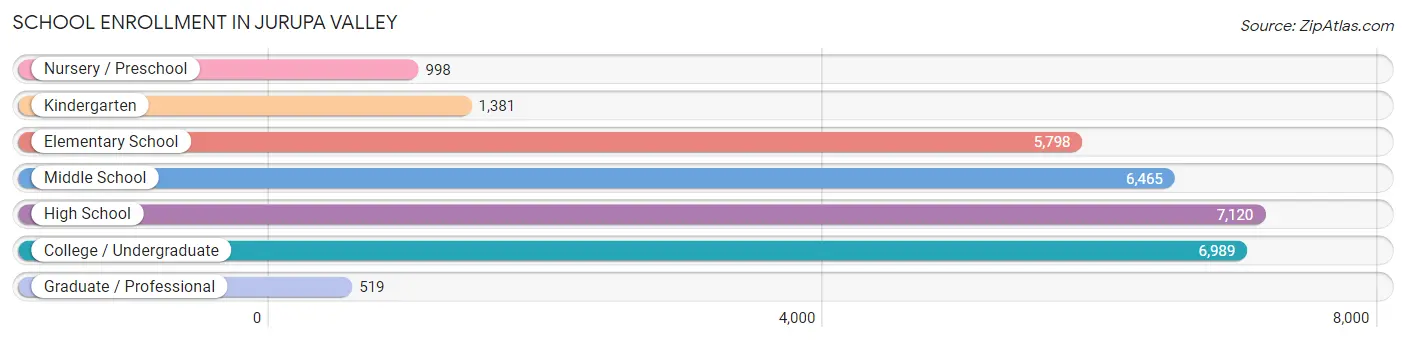
| School Level | # Students | % Students |
| Nursery / Preschool | 998 | 3.4% |
| Kindergarten | 1,381 | 4.7% |
| Elementary School | 5,798 | 19.8% |
| Middle School | 6,465 | 22.1% |
| High School | 7,120 | 24.3% |
| College / Undergraduate | 6,989 | 23.9% |
| Graduate / Professional | 519 | 1.8% |
| Total | 29,270 | 100.0% |
School Enrollment by Age by Funding Source in Jurupa Valley
Out of a total of 29,270 students who are enrolled in schools in Jurupa Valley, 2,371 (8.1%) attend a private institution, while the remaining 26,899 (91.9%) are enrolled in public schools. The age group of 3 to 4 year olds has the highest likelihood of being enrolled in private schools, with 212 (29.6% in the age bracket) enrolled. Conversely, the age group of 15 to 17 year olds has the lowest likelihood of being enrolled in a private school, with 4,678 (96.4% in the age bracket) attending a public institution.
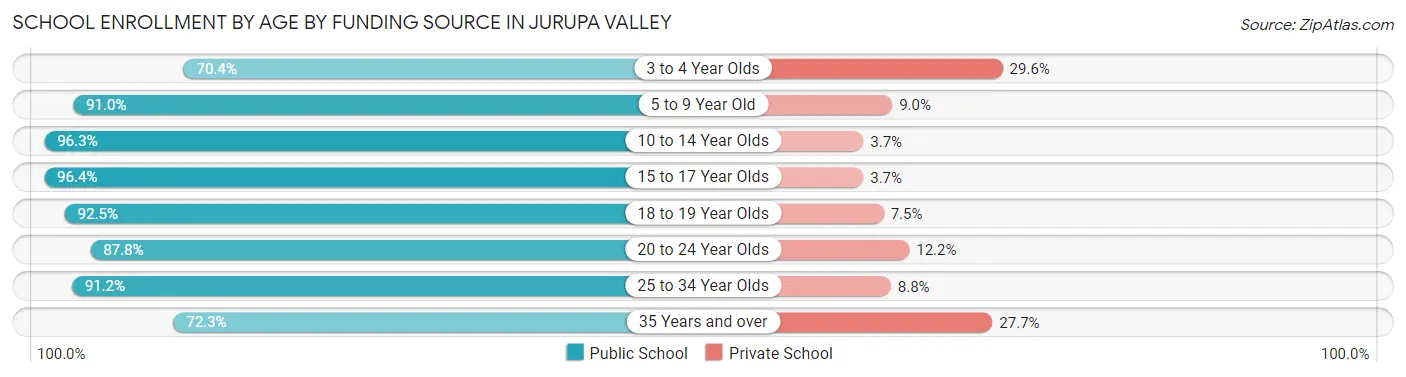
| Age Bracket | Public School | Private School |
| 3 to 4 Year Olds | 504 (70.4%) | 212 (29.6%) |
| 5 to 9 Year Old | 6,176 (91.0%) | 614 (9.0%) |
| 10 to 14 Year Olds | 8,081 (96.3%) | 307 (3.7%) |
| 15 to 17 Year Olds | 4,678 (96.4%) | 177 (3.6%) |
| 18 to 19 Year Olds | 1,911 (92.5%) | 154 (7.5%) |
| 20 to 24 Year Olds | 2,692 (87.8%) | 375 (12.2%) |
| 25 to 34 Year Olds | 1,909 (91.2%) | 184 (8.8%) |
| 35 Years and over | 937 (72.3%) | 359 (27.7%) |
| Total | 26,899 (91.9%) | 2,371 (8.1%) |
Educational Attainment by Field of Study in Jurupa Valley
Business (2,063 | 20.5%), science & technology (1,092 | 10.8%), social sciences (1,020 | 10.1%), arts & humanities (904 | 9.0%), and education (844 | 8.4%) are the most common fields of study among 10,084 individuals in Jurupa Valley who have obtained a bachelor's degree or higher.
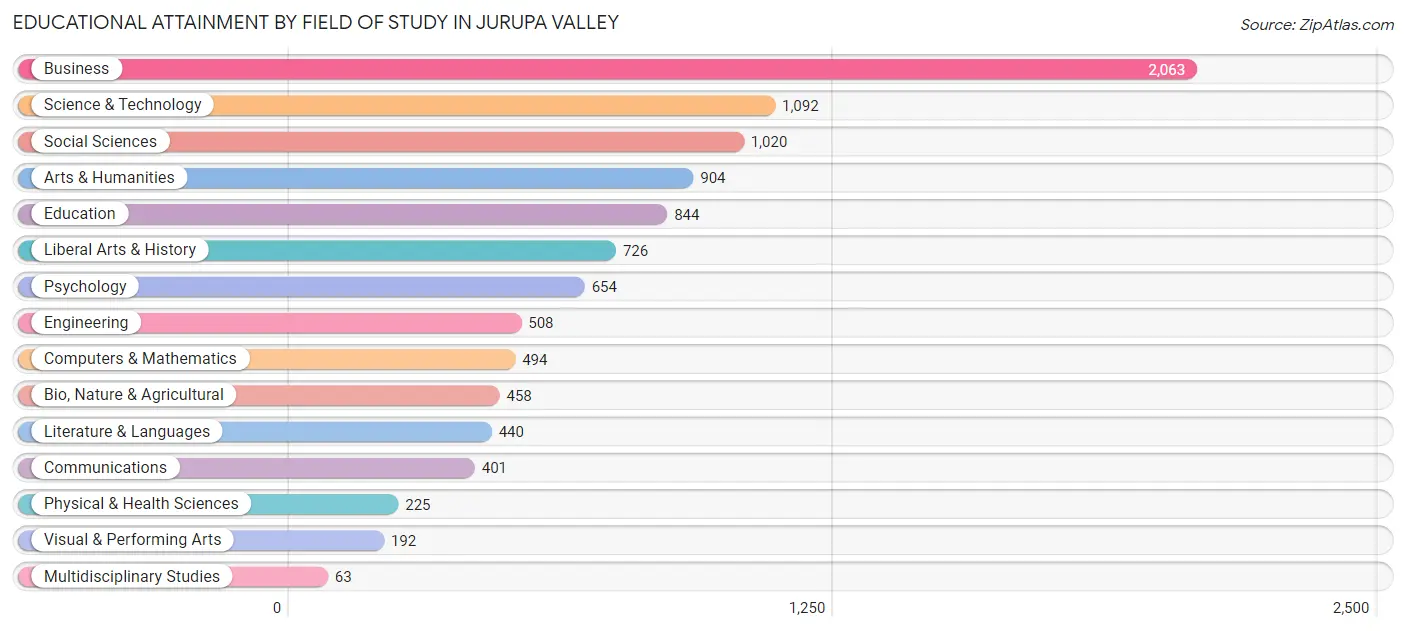
| Field of Study | # Graduates | % Graduates |
| Computers & Mathematics | 494 | 4.9% |
| Bio, Nature & Agricultural | 458 | 4.5% |
| Physical & Health Sciences | 225 | 2.2% |
| Psychology | 654 | 6.5% |
| Social Sciences | 1,020 | 10.1% |
| Engineering | 508 | 5.0% |
| Multidisciplinary Studies | 63 | 0.6% |
| Science & Technology | 1,092 | 10.8% |
| Business | 2,063 | 20.5% |
| Education | 844 | 8.4% |
| Literature & Languages | 440 | 4.4% |
| Liberal Arts & History | 726 | 7.2% |
| Visual & Performing Arts | 192 | 1.9% |
| Communications | 401 | 4.0% |
| Arts & Humanities | 904 | 9.0% |
| Total | 10,084 | 100.0% |
Transportation & Commute in Jurupa Valley
Vehicle Availability by Sex in Jurupa Valley
The most prevalent vehicle ownership categories in Jurupa Valley are males with 3 vehicles (7,326, accounting for 26.8%) and females with 3 vehicles (5,672, making up 38.5%).
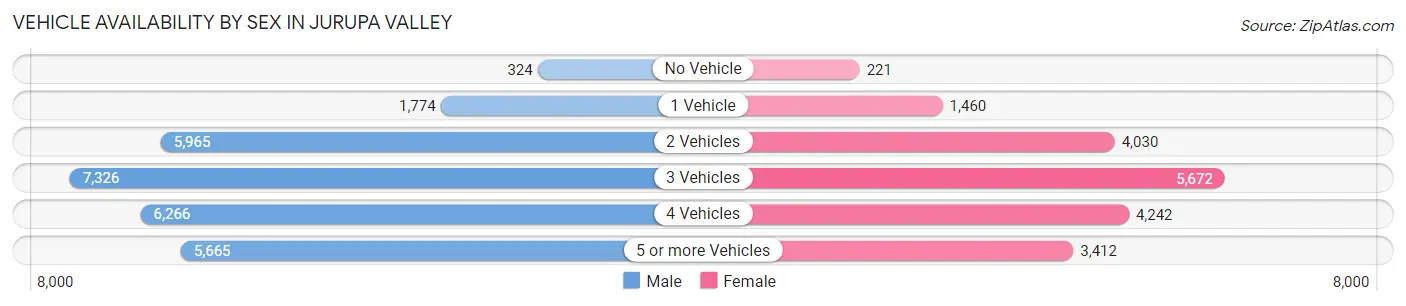
| Vehicles Available | Male | Female |
| No Vehicle | 324 (1.2%) | 221 (1.2%) |
| 1 Vehicle | 1,774 (6.5%) | 1,460 (7.7%) |
| 2 Vehicles | 5,965 (21.8%) | 4,030 (21.2%) |
| 3 Vehicles | 7,326 (26.8%) | 5,672 (29.8%) |
| 4 Vehicles | 6,266 (22.9%) | 4,242 (22.3%) |
| 5 or more Vehicles | 5,665 (20.7%) | 3,412 (17.9%) |
| Total | 27,320 (100.0%) | 19,037 (100.0%) |
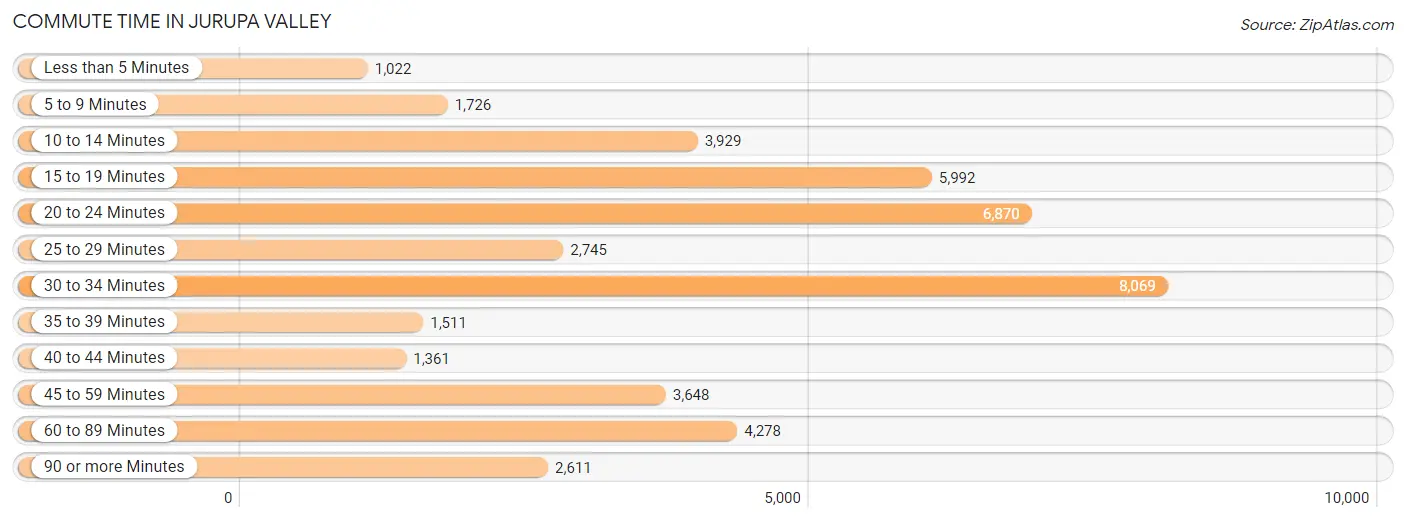
Commute Time in Jurupa Valley
The most frequently occuring commute durations in Jurupa Valley are 30 to 34 minutes (8,069 commuters, 18.4%), 20 to 24 minutes (6,870 commuters, 15.7%), and 15 to 19 minutes (5,992 commuters, 13.7%).
| Commute Time | # Commuters | % Commuters |
| Less than 5 Minutes | 1,022 | 2.3% |
| 5 to 9 Minutes | 1,726 | 3.9% |
| 10 to 14 Minutes | 3,929 | 9.0% |
| 15 to 19 Minutes | 5,992 | 13.7% |
| 20 to 24 Minutes | 6,870 | 15.7% |
| 25 to 29 Minutes | 2,745 | 6.3% |
| 30 to 34 Minutes | 8,069 | 18.4% |
| 35 to 39 Minutes | 1,511 | 3.5% |
| 40 to 44 Minutes | 1,361 | 3.1% |
| 45 to 59 Minutes | 3,648 | 8.3% |
| 60 to 89 Minutes | 4,278 | 9.8% |
| 90 or more Minutes | 2,611 | 6.0% |
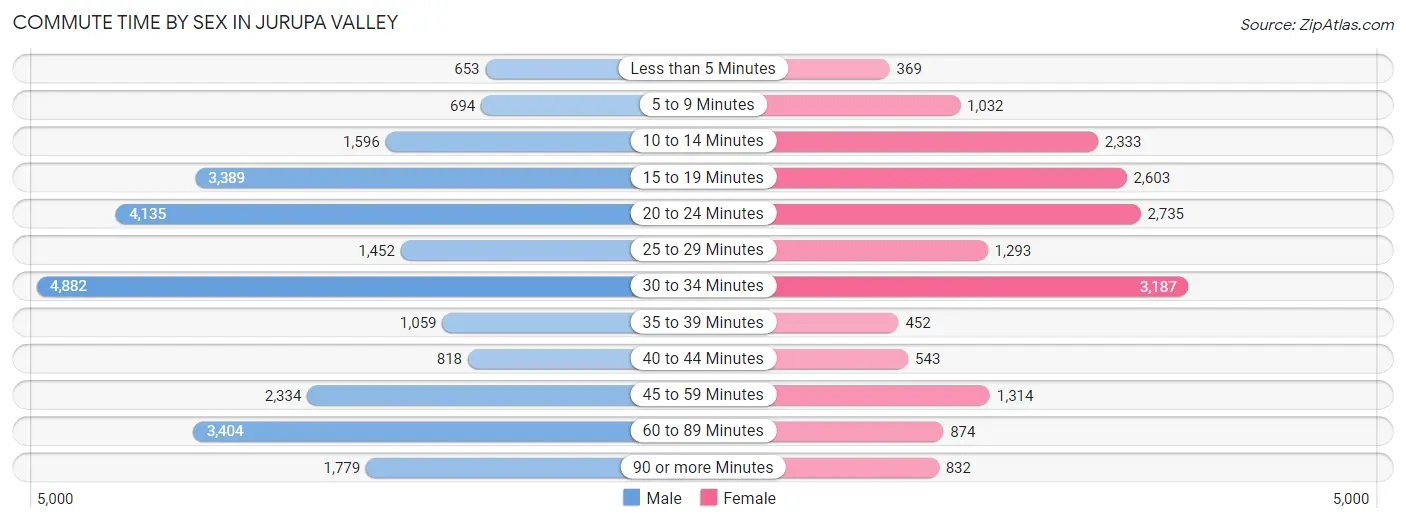
Commute Time by Sex in Jurupa Valley
The most common commute times in Jurupa Valley are 30 to 34 minutes (4,882 commuters, 18.6%) for males and 30 to 34 minutes (3,187 commuters, 18.1%) for females.
| Commute Time | Male | Female |
| Less than 5 Minutes | 653 (2.5%) | 369 (2.1%) |
| 5 to 9 Minutes | 694 (2.6%) | 1,032 (5.9%) |
| 10 to 14 Minutes | 1,596 (6.1%) | 2,333 (13.3%) |
| 15 to 19 Minutes | 3,389 (12.9%) | 2,603 (14.8%) |
| 20 to 24 Minutes | 4,135 (15.8%) | 2,735 (15.6%) |
| 25 to 29 Minutes | 1,452 (5.5%) | 1,293 (7.4%) |
| 30 to 34 Minutes | 4,882 (18.6%) | 3,187 (18.1%) |
| 35 to 39 Minutes | 1,059 (4.0%) | 452 (2.6%) |
| 40 to 44 Minutes | 818 (3.1%) | 543 (3.1%) |
| 45 to 59 Minutes | 2,334 (8.9%) | 1,314 (7.5%) |
| 60 to 89 Minutes | 3,404 (13.0%) | 874 (5.0%) |
| 90 or more Minutes | 1,779 (6.8%) | 832 (4.7%) |
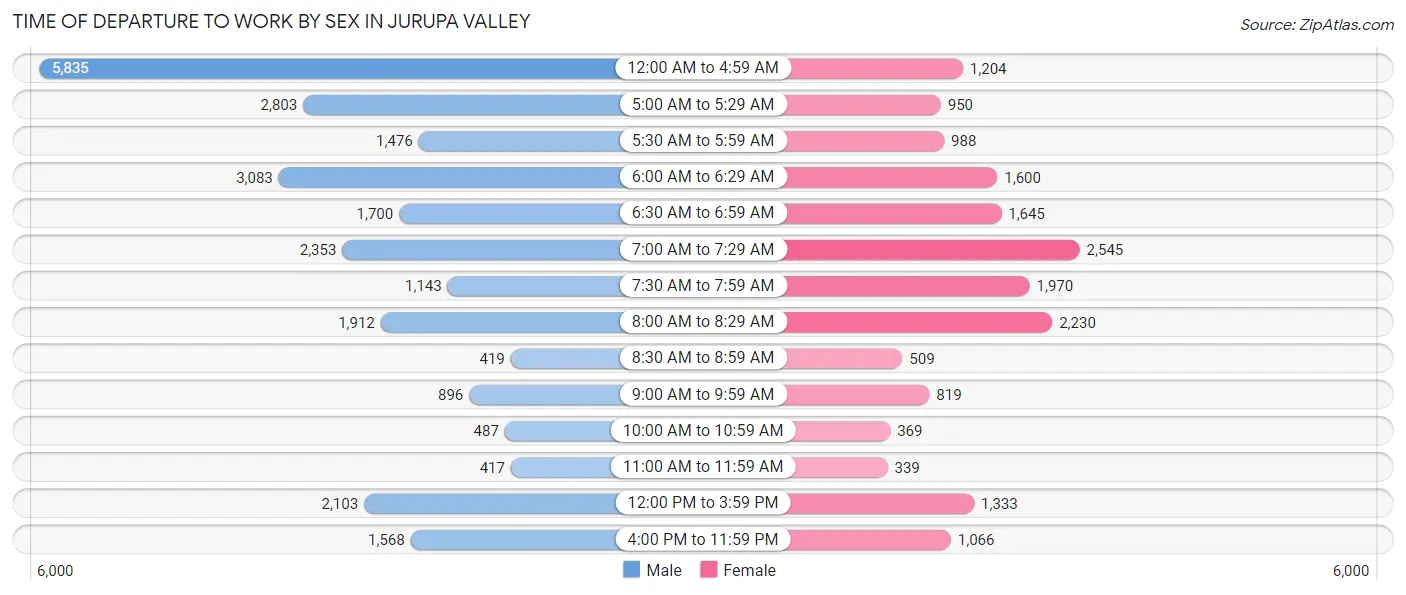
Time of Departure to Work by Sex in Jurupa Valley
The most frequent times of departure to work in Jurupa Valley are 12:00 AM to 4:59 AM (5,835, 22.3%) for males and 7:00 AM to 7:29 AM (2,545, 14.5%) for females.
| Time of Departure | Male | Female |
| 12:00 AM to 4:59 AM | 5,835 (22.3%) | 1,204 (6.9%) |
| 5:00 AM to 5:29 AM | 2,803 (10.7%) | 950 (5.4%) |
| 5:30 AM to 5:59 AM | 1,476 (5.6%) | 988 (5.6%) |
| 6:00 AM to 6:29 AM | 3,083 (11.8%) | 1,600 (9.1%) |
| 6:30 AM to 6:59 AM | 1,700 (6.5%) | 1,645 (9.4%) |
| 7:00 AM to 7:29 AM | 2,353 (9.0%) | 2,545 (14.5%) |
| 7:30 AM to 7:59 AM | 1,143 (4.4%) | 1,970 (11.2%) |
| 8:00 AM to 8:29 AM | 1,912 (7.3%) | 2,230 (12.7%) |
| 8:30 AM to 8:59 AM | 419 (1.6%) | 509 (2.9%) |
| 9:00 AM to 9:59 AM | 896 (3.4%) | 819 (4.7%) |
| 10:00 AM to 10:59 AM | 487 (1.9%) | 369 (2.1%) |
| 11:00 AM to 11:59 AM | 417 (1.6%) | 339 (1.9%) |
| 12:00 PM to 3:59 PM | 2,103 (8.0%) | 1,333 (7.6%) |
| 4:00 PM to 11:59 PM | 1,568 (6.0%) | 1,066 (6.1%) |
| Total | 26,195 (100.0%) | 17,567 (100.0%) |
Housing Occupancy in Jurupa Valley
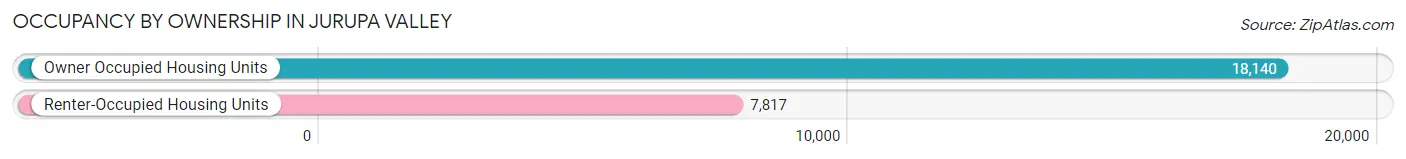
Occupancy by Ownership in Jurupa Valley
Of the total 25,957 dwellings in Jurupa Valley, owner-occupied units account for 18,140 (69.9%), while renter-occupied units make up 7,817 (30.1%).
| Occupancy | # Housing Units | % Housing Units |
| Owner Occupied Housing Units | 18,140 | 69.9% |
| Renter-Occupied Housing Units | 7,817 | 30.1% |
| Total Occupied Housing Units | 25,957 | 100.0% |
Occupancy by Household Size in Jurupa Valley
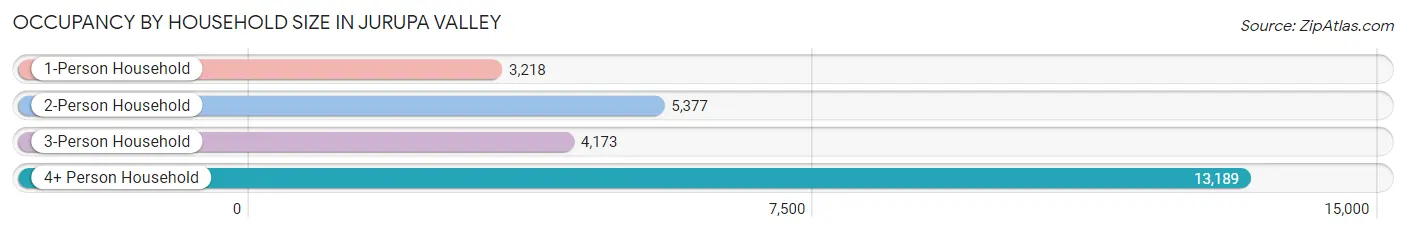
| Household Size | # Housing Units | % Housing Units |
| 1-Person Household | 3,218 | 12.4% |
| 2-Person Household | 5,377 | 20.7% |
| 3-Person Household | 4,173 | 16.1% |
| 4+ Person Household | 13,189 | 50.8% |
| Total Housing Units | 25,957 | 100.0% |
Occupancy by Ownership by Household Size in Jurupa Valley
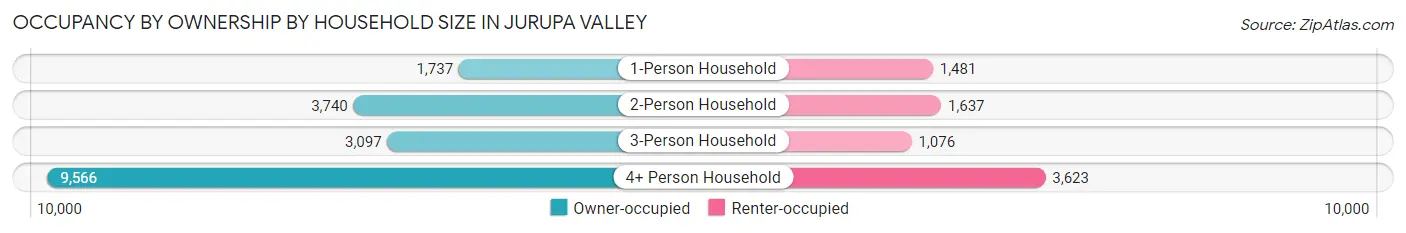
| Household Size | Owner-occupied | Renter-occupied |
| 1-Person Household | 1,737 (54.0%) | 1,481 (46.0%) |
| 2-Person Household | 3,740 (69.6%) | 1,637 (30.4%) |
| 3-Person Household | 3,097 (74.2%) | 1,076 (25.8%) |
| 4+ Person Household | 9,566 (72.5%) | 3,623 (27.5%) |
| Total Housing Units | 18,140 (69.9%) | 7,817 (30.1%) |
Occupancy by Educational Attainment in Jurupa Valley
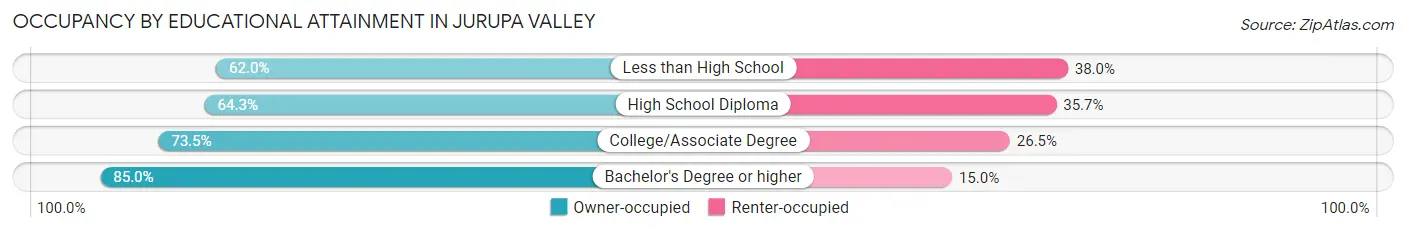
| Household Size | Owner-occupied | Renter-occupied |
| Less than High School | 4,097 (62.0%) | 2,510 (38.0%) |
| High School Diploma | 4,791 (64.3%) | 2,661 (35.7%) |
| College/Associate Degree | 5,488 (73.5%) | 1,980 (26.5%) |
| Bachelor's Degree or higher | 3,764 (85.0%) | 666 (15.0%) |
Occupancy by Age of Householder in Jurupa Valley
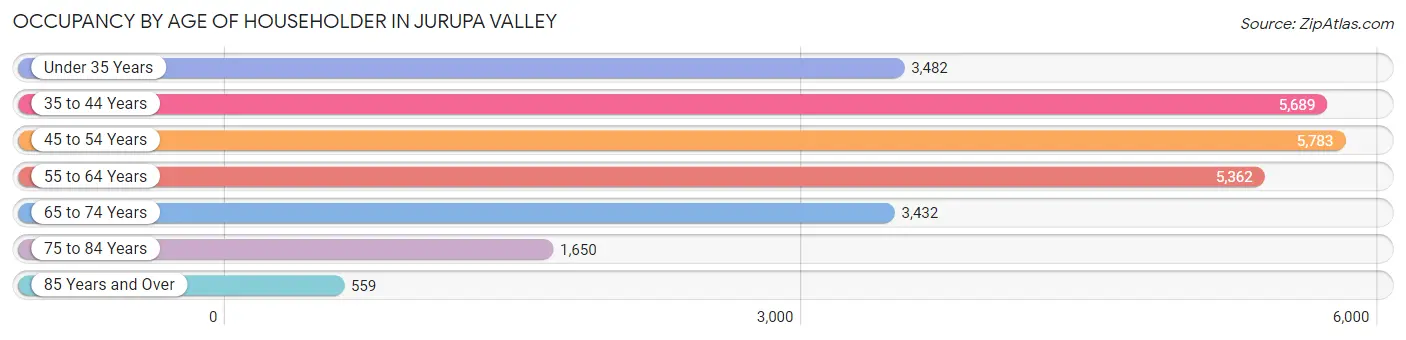
| Age Bracket | # Households | % Households |
| Under 35 Years | 3,482 | 13.4% |
| 35 to 44 Years | 5,689 | 21.9% |
| 45 to 54 Years | 5,783 | 22.3% |
| 55 to 64 Years | 5,362 | 20.7% |
| 65 to 74 Years | 3,432 | 13.2% |
| 75 to 84 Years | 1,650 | 6.4% |
| 85 Years and Over | 559 | 2.1% |
| Total | 25,957 | 100.0% |
Housing Finances in Jurupa Valley
Median Income by Occupancy in Jurupa Valley
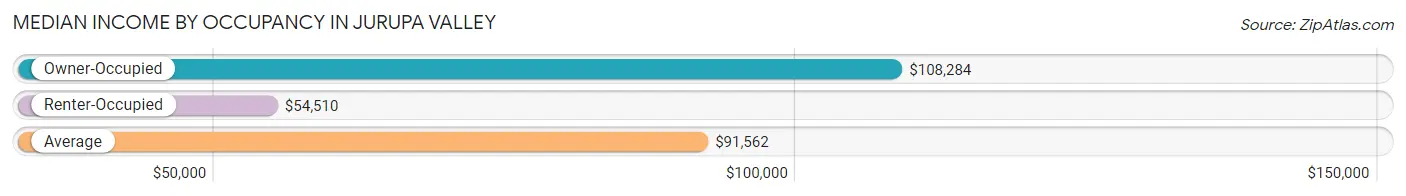
| Occupancy Type | # Households | Median Income |
| Owner-Occupied | 18,140 (69.9%) | $108,284 |
| Renter-Occupied | 7,817 (30.1%) | $54,510 |
| Average | 25,957 (100.0%) | $91,562 |
Occupancy by Householder Income Bracket in Jurupa Valley
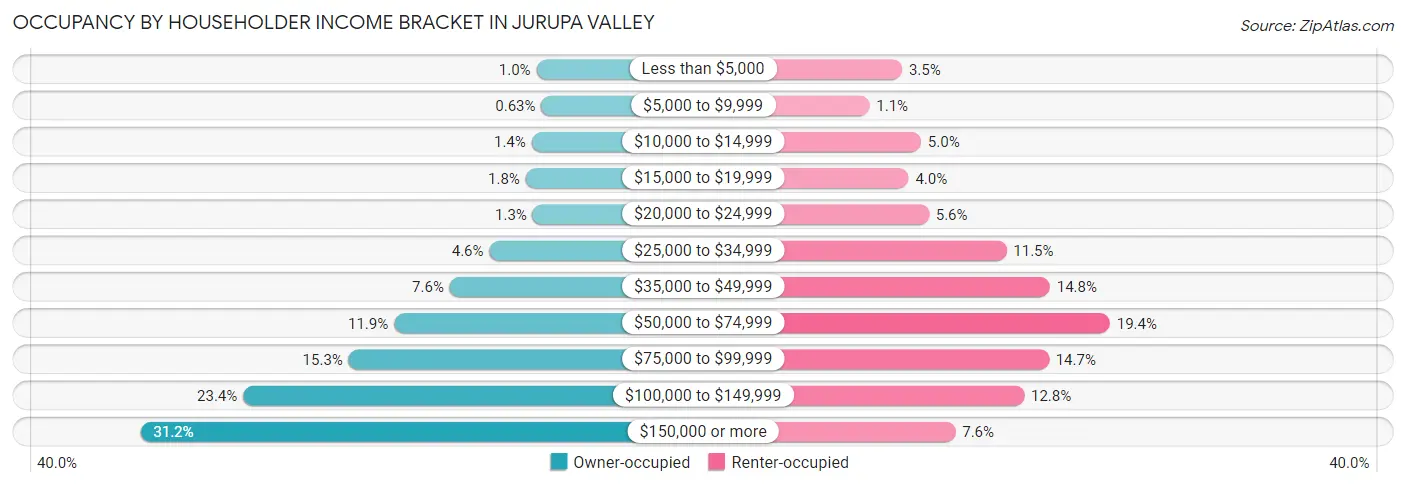
| Income Bracket | Owner-occupied | Renter-occupied |
| Less than $5,000 | 181 (1.0%) | 277 (3.5%) |
| $5,000 to $9,999 | 115 (0.6%) | 82 (1.1%) |
| $10,000 to $14,999 | 248 (1.4%) | 389 (5.0%) |
| $15,000 to $19,999 | 330 (1.8%) | 315 (4.0%) |
| $20,000 to $24,999 | 234 (1.3%) | 436 (5.6%) |
| $25,000 to $34,999 | 833 (4.6%) | 898 (11.5%) |
| $35,000 to $49,999 | 1,380 (7.6%) | 1,157 (14.8%) |
| $50,000 to $74,999 | 2,150 (11.8%) | 1,514 (19.4%) |
| $75,000 to $99,999 | 2,778 (15.3%) | 1,151 (14.7%) |
| $100,000 to $149,999 | 4,235 (23.4%) | 1,004 (12.8%) |
| $150,000 or more | 5,656 (31.2%) | 594 (7.6%) |
| Total | 18,140 (100.0%) | 7,817 (100.0%) |
Monthly Housing Cost Tiers in Jurupa Valley
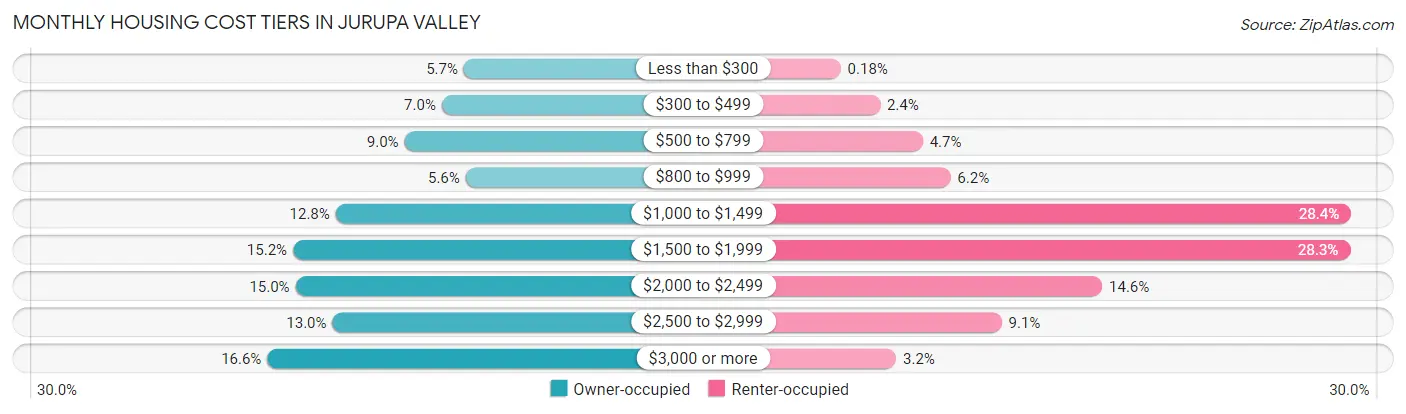
| Monthly Cost | Owner-occupied | Renter-occupied |
| Less than $300 | 1,042 (5.7%) | 14 (0.2%) |
| $300 to $499 | 1,262 (7.0%) | 184 (2.4%) |
| $500 to $799 | 1,637 (9.0%) | 368 (4.7%) |
| $800 to $999 | 1,023 (5.6%) | 488 (6.2%) |
| $1,000 to $1,499 | 2,325 (12.8%) | 2,218 (28.4%) |
| $1,500 to $1,999 | 2,753 (15.2%) | 2,214 (28.3%) |
| $2,000 to $2,499 | 2,728 (15.0%) | 1,143 (14.6%) |
| $2,500 to $2,999 | 2,359 (13.0%) | 709 (9.1%) |
| $3,000 or more | 3,011 (16.6%) | 253 (3.2%) |
| Total | 18,140 (100.0%) | 7,817 (100.0%) |
Physical Housing Characteristics in Jurupa Valley
Housing Structures in Jurupa Valley
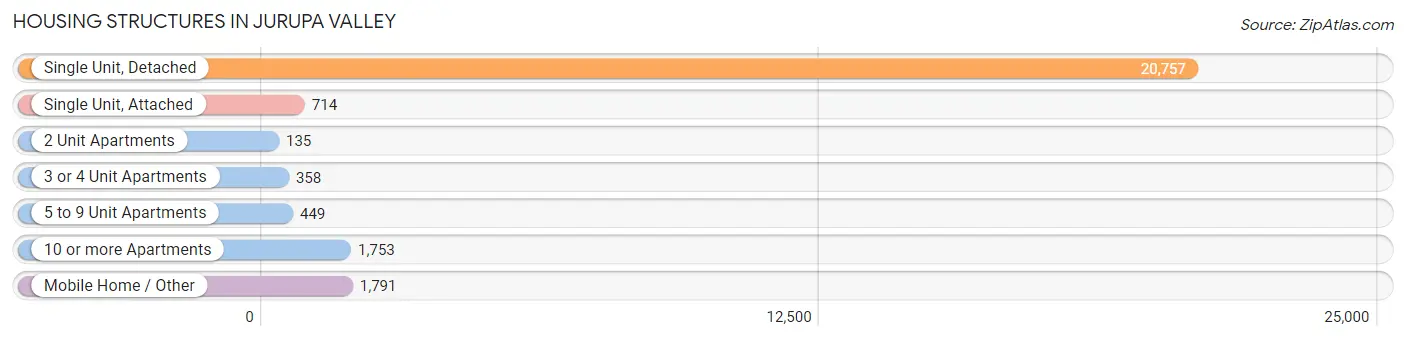
| Structure Type | # Housing Units | % Housing Units |
| Single Unit, Detached | 20,757 | 80.0% |
| Single Unit, Attached | 714 | 2.8% |
| 2 Unit Apartments | 135 | 0.5% |
| 3 or 4 Unit Apartments | 358 | 1.4% |
| 5 to 9 Unit Apartments | 449 | 1.7% |
| 10 or more Apartments | 1,753 | 6.8% |
| Mobile Home / Other | 1,791 | 6.9% |
| Total | 25,957 | 100.0% |
Housing Structures by Occupancy in Jurupa Valley
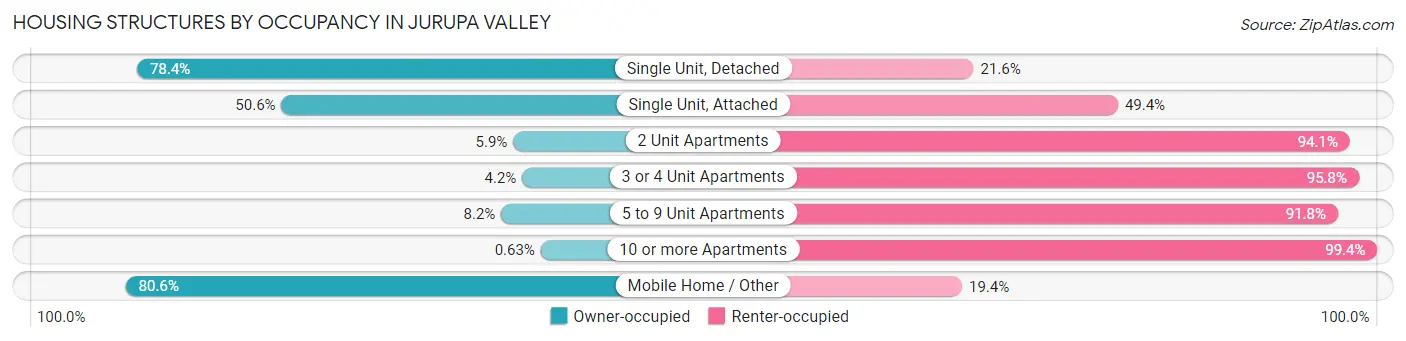
| Structure Type | Owner-occupied | Renter-occupied |
| Single Unit, Detached | 16,265 (78.4%) | 4,492 (21.6%) |
| Single Unit, Attached | 361 (50.6%) | 353 (49.4%) |
| 2 Unit Apartments | 8 (5.9%) | 127 (94.1%) |
| 3 or 4 Unit Apartments | 15 (4.2%) | 343 (95.8%) |
| 5 to 9 Unit Apartments | 37 (8.2%) | 412 (91.8%) |
| 10 or more Apartments | 11 (0.6%) | 1,742 (99.4%) |
| Mobile Home / Other | 1,443 (80.6%) | 348 (19.4%) |
| Total | 18,140 (69.9%) | 7,817 (30.1%) |
Housing Structures by Number of Rooms in Jurupa Valley
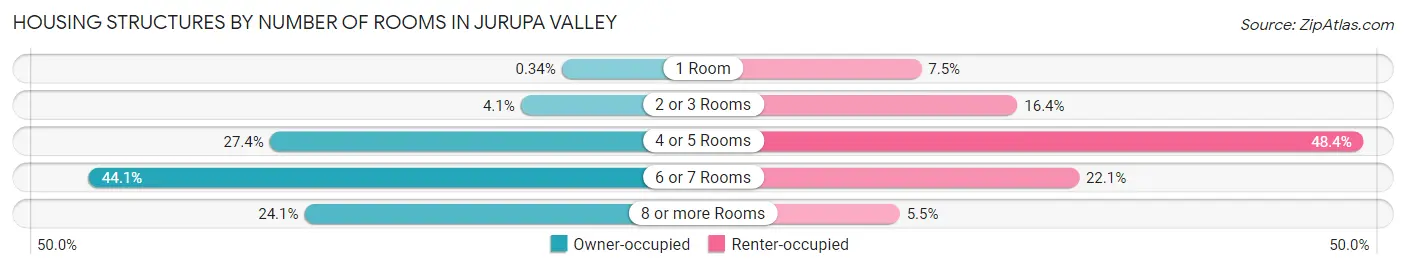
| Number of Rooms | Owner-occupied | Renter-occupied |
| 1 Room | 61 (0.3%) | 589 (7.5%) |
| 2 or 3 Rooms | 749 (4.1%) | 1,283 (16.4%) |
| 4 or 5 Rooms | 4,962 (27.4%) | 3,785 (48.4%) |
| 6 or 7 Rooms | 7,991 (44.1%) | 1,728 (22.1%) |
| 8 or more Rooms | 4,377 (24.1%) | 432 (5.5%) |
| Total | 18,140 (100.0%) | 7,817 (100.0%) |
Housing Structure by Heating Type in Jurupa Valley
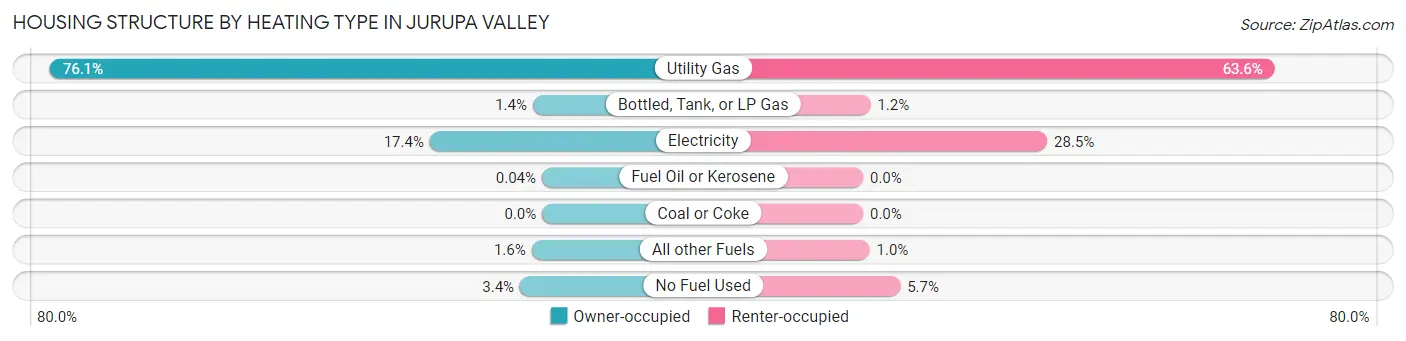
| Heating Type | Owner-occupied | Renter-occupied |
| Utility Gas | 13,803 (76.1%) | 4,974 (63.6%) |
| Bottled, Tank, or LP Gas | 261 (1.4%) | 90 (1.1%) |
| Electricity | 3,151 (17.4%) | 2,225 (28.5%) |
| Fuel Oil or Kerosene | 7 (0.0%) | 0 (0.0%) |
| Coal or Coke | 0 (0.0%) | 0 (0.0%) |
| All other Fuels | 296 (1.6%) | 79 (1.0%) |
| No Fuel Used | 622 (3.4%) | 449 (5.7%) |
| Total | 18,140 (100.0%) | 7,817 (100.0%) |
Household Vehicle Usage in Jurupa Valley
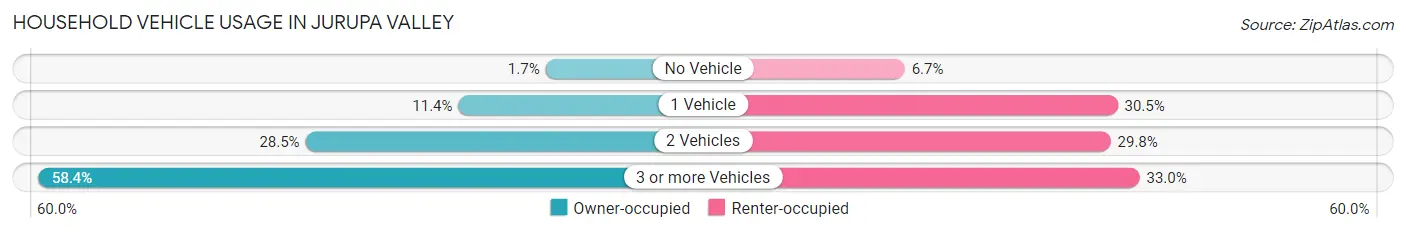
| Vehicles per Household | Owner-occupied | Renter-occupied |
| No Vehicle | 299 (1.7%) | 524 (6.7%) |
| 1 Vehicle | 2,070 (11.4%) | 2,387 (30.5%) |
| 2 Vehicles | 5,177 (28.5%) | 2,326 (29.8%) |
| 3 or more Vehicles | 10,594 (58.4%) | 2,580 (33.0%) |
| Total | 18,140 (100.0%) | 7,817 (100.0%) |
Real Estate & Mortgages in Jurupa Valley
Real Estate and Mortgage Overview in Jurupa Valley
| Characteristic | Without Mortgage | With Mortgage |
| Housing Units | 5,099 | 13,041 |
| Median Property Value | $403,900 | $502,700 |
| Median Household Income | $91,081 | $4,680 |
| Monthly Housing Costs | $556 | $2,999 |
| Real Estate Taxes | $2,036 | $235 |
Property Value by Mortgage Status in Jurupa Valley
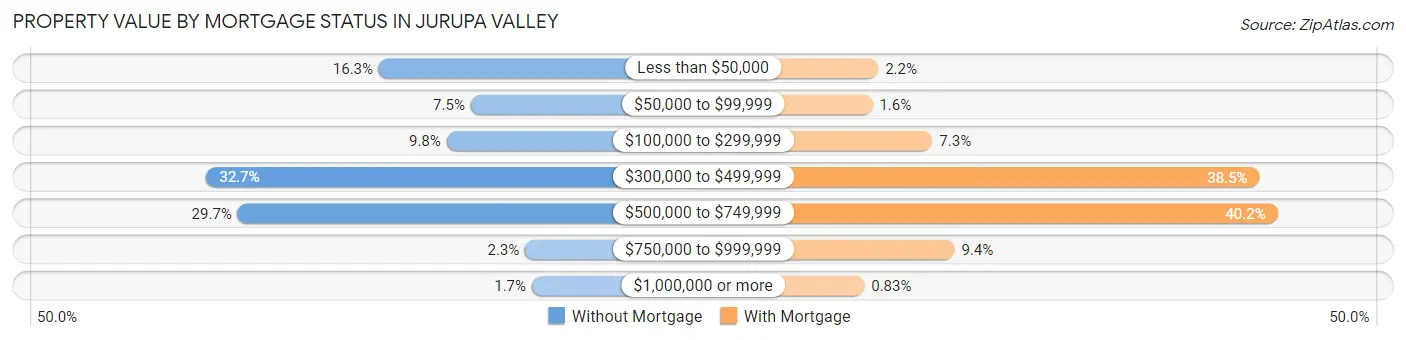
| Property Value | Without Mortgage | With Mortgage |
| Less than $50,000 | 829 (16.3%) | 282 (2.2%) |
| $50,000 to $99,999 | 383 (7.5%) | 210 (1.6%) |
| $100,000 to $299,999 | 500 (9.8%) | 955 (7.3%) |
| $300,000 to $499,999 | 1,667 (32.7%) | 5,016 (38.5%) |
| $500,000 to $749,999 | 1,515 (29.7%) | 5,240 (40.2%) |
| $750,000 to $999,999 | 119 (2.3%) | 1,230 (9.4%) |
| $1,000,000 or more | 86 (1.7%) | 108 (0.8%) |
| Total | 5,099 (100.0%) | 13,041 (100.0%) |
Household Income by Mortgage Status in Jurupa Valley
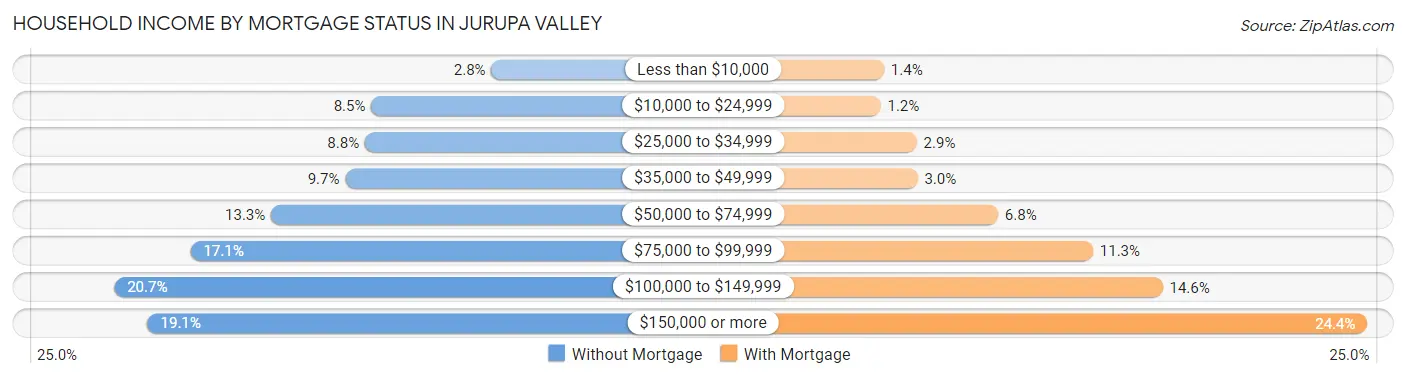
| Household Income | Without Mortgage | With Mortgage |
| Less than $10,000 | 141 (2.8%) | 176 (1.3%) |
| $10,000 to $24,999 | 433 (8.5%) | 155 (1.2%) |
| $25,000 to $34,999 | 448 (8.8%) | 379 (2.9%) |
| $35,000 to $49,999 | 496 (9.7%) | 385 (2.9%) |
| $50,000 to $74,999 | 676 (13.3%) | 884 (6.8%) |
| $75,000 to $99,999 | 872 (17.1%) | 1,474 (11.3%) |
| $100,000 to $149,999 | 1,057 (20.7%) | 1,906 (14.6%) |
| $150,000 or more | 976 (19.1%) | 3,178 (24.4%) |
| Total | 5,099 (100.0%) | 13,041 (100.0%) |
Property Value to Household Income Ratio in Jurupa Valley
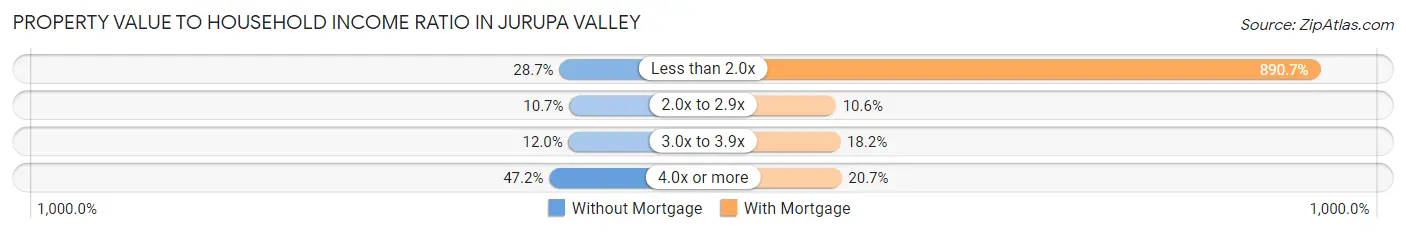
| Value-to-Income Ratio | Without Mortgage | With Mortgage |
| Less than 2.0x | 1,464 (28.7%) | 116,162 (890.7%) |
| 2.0x to 2.9x | 543 (10.6%) | 1,381 (10.6%) |
| 3.0x to 3.9x | 612 (12.0%) | 2,379 (18.2%) |
| 4.0x or more | 2,407 (47.2%) | 2,704 (20.7%) |
| Total | 5,099 (100.0%) | 13,041 (100.0%) |
Real Estate Taxes by Mortgage Status in Jurupa Valley
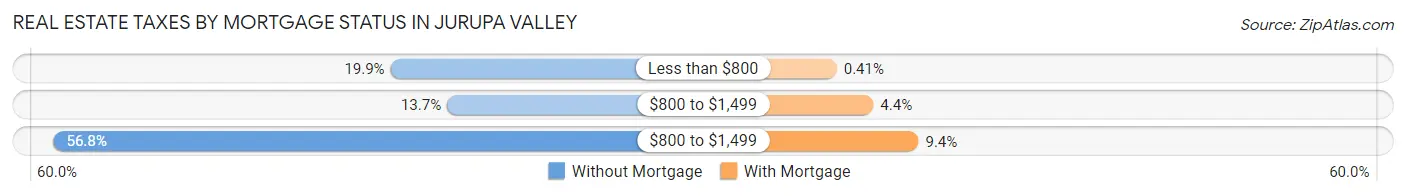
| Property Taxes | Without Mortgage | With Mortgage |
| Less than $800 | 1,015 (19.9%) | 54 (0.4%) |
| $800 to $1,499 | 699 (13.7%) | 577 (4.4%) |
| $800 to $1,499 | 2,897 (56.8%) | 1,222 (9.4%) |
| Total | 5,099 (100.0%) | 13,041 (100.0%) |
Health & Disability in Jurupa Valley
Health Insurance Coverage by Age in Jurupa Valley
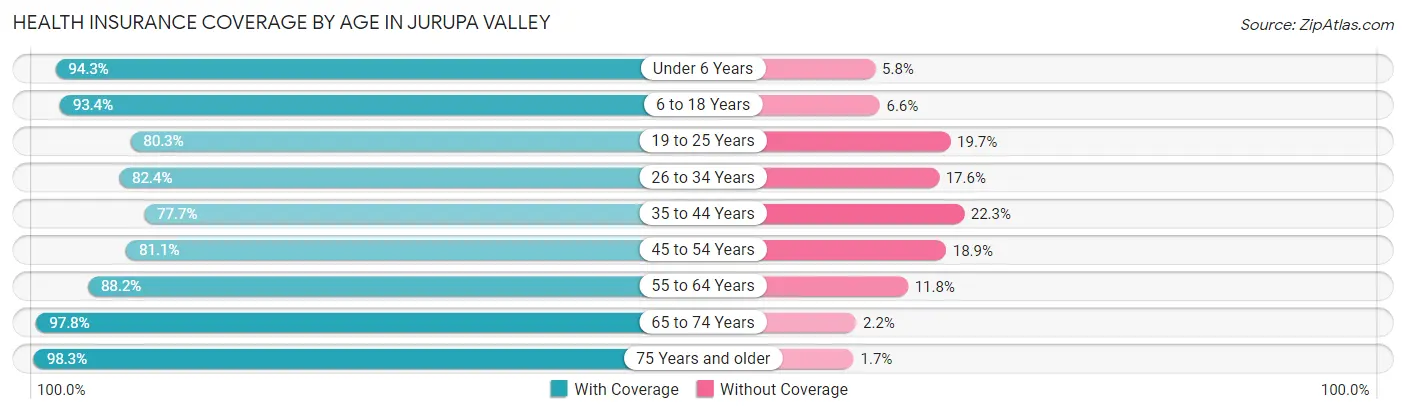
| Age Bracket | With Coverage | Without Coverage |
| Under 6 Years | 7,660 (94.3%) | 467 (5.8%) |
| 6 to 18 Years | 19,743 (93.4%) | 1,388 (6.6%) |
| 19 to 25 Years | 9,619 (80.3%) | 2,364 (19.7%) |
| 26 to 34 Years | 11,445 (82.4%) | 2,447 (17.6%) |
| 35 to 44 Years | 11,237 (77.7%) | 3,221 (22.3%) |
| 45 to 54 Years | 10,101 (81.1%) | 2,358 (18.9%) |
| 55 to 64 Years | 10,046 (88.2%) | 1,346 (11.8%) |
| 65 to 74 Years | 6,933 (97.8%) | 156 (2.2%) |
| 75 Years and older | 4,433 (98.3%) | 78 (1.7%) |
| Total | 91,217 (86.8%) | 13,825 (13.2%) |
Health Insurance Coverage by Citizenship Status in Jurupa Valley
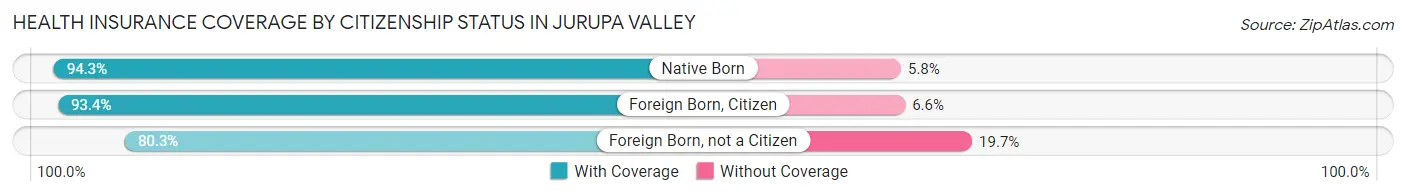
| Citizenship Status | With Coverage | Without Coverage |
| Native Born | 7,660 (94.3%) | 467 (5.8%) |
| Foreign Born, Citizen | 19,743 (93.4%) | 1,388 (6.6%) |
| Foreign Born, not a Citizen | 9,619 (80.3%) | 2,364 (19.7%) |
Health Insurance Coverage by Household Income in Jurupa Valley
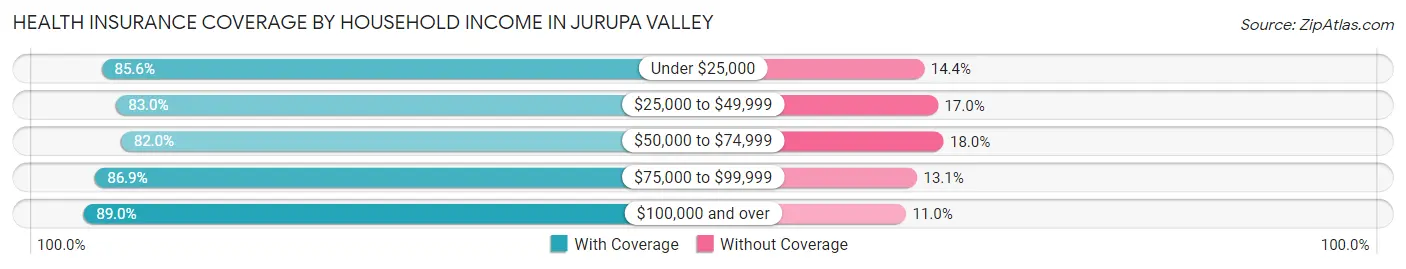
| Household Income | With Coverage | Without Coverage |
| Under $25,000 | 5,289 (85.6%) | 891 (14.4%) |
| $25,000 to $49,999 | 10,819 (83.0%) | 2,214 (17.0%) |
| $50,000 to $74,999 | 11,437 (82.0%) | 2,515 (18.0%) |
| $75,000 to $99,999 | 13,723 (86.9%) | 2,061 (13.1%) |
| $100,000 and over | 49,576 (89.0%) | 6,131 (11.0%) |
Public vs Private Health Insurance Coverage by Age in Jurupa Valley
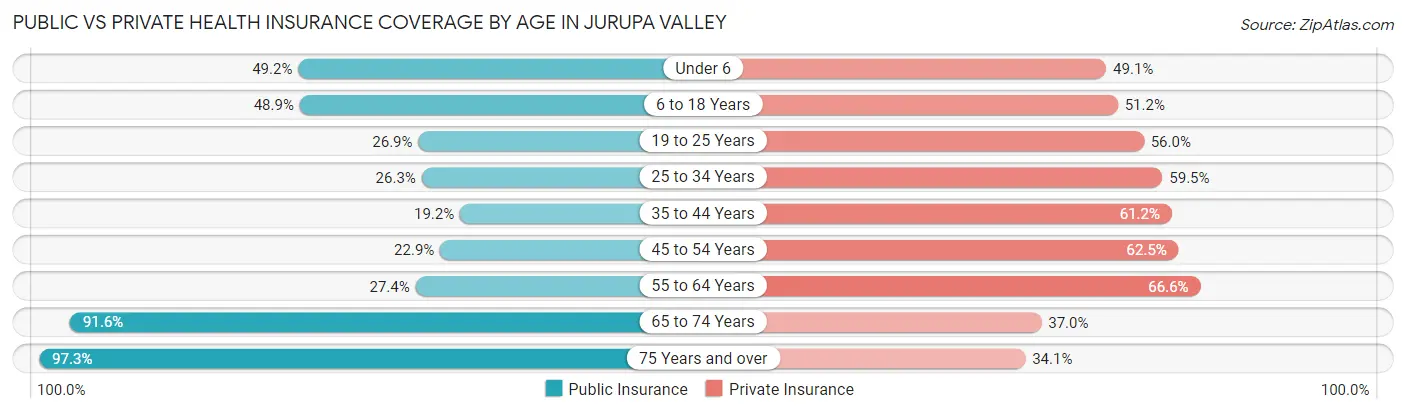
| Age Bracket | Public Insurance | Private Insurance |
| Under 6 | 3,999 (49.2%) | 3,988 (49.1%) |
| 6 to 18 Years | 10,340 (48.9%) | 10,823 (51.2%) |
| 19 to 25 Years | 3,225 (26.9%) | 6,715 (56.0%) |
| 25 to 34 Years | 3,654 (26.3%) | 8,266 (59.5%) |
| 35 to 44 Years | 2,772 (19.2%) | 8,854 (61.2%) |
| 45 to 54 Years | 2,849 (22.9%) | 7,789 (62.5%) |
| 55 to 64 Years | 3,125 (27.4%) | 7,583 (66.6%) |
| 65 to 74 Years | 6,492 (91.6%) | 2,625 (37.0%) |
| 75 Years and over | 4,389 (97.3%) | 1,536 (34.1%) |
| Total | 40,845 (38.9%) | 58,179 (55.4%) |
Disability Status by Sex by Age in Jurupa Valley
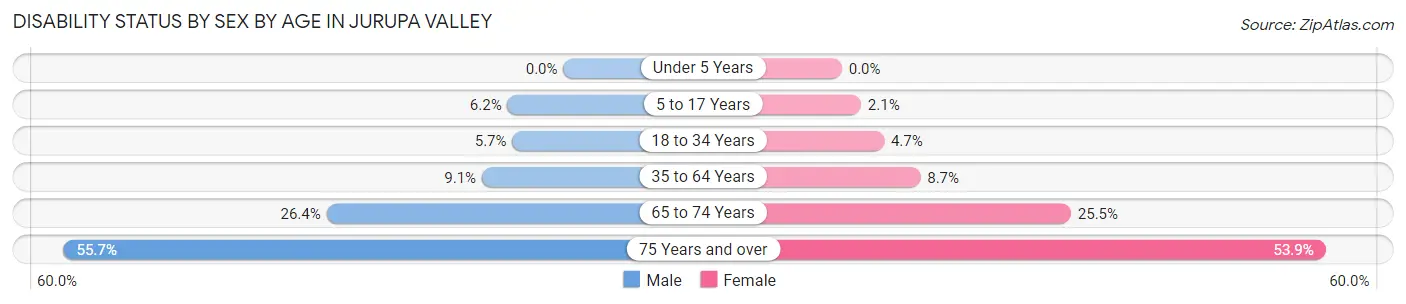
| Age Bracket | Male | Female |
| Under 5 Years | 0 (0.0%) | 0 (0.0%) |
| 5 to 17 Years | 616 (6.2%) | 229 (2.1%) |
| 18 to 34 Years | 814 (5.7%) | 630 (4.7%) |
| 35 to 64 Years | 1,815 (9.1%) | 1,599 (8.7%) |
| 65 to 74 Years | 902 (26.4%) | 936 (25.5%) |
| 75 Years and over | 865 (55.7%) | 1,593 (53.9%) |
Disability Class by Sex by Age in Jurupa Valley
Disability Class: Hearing Difficulty
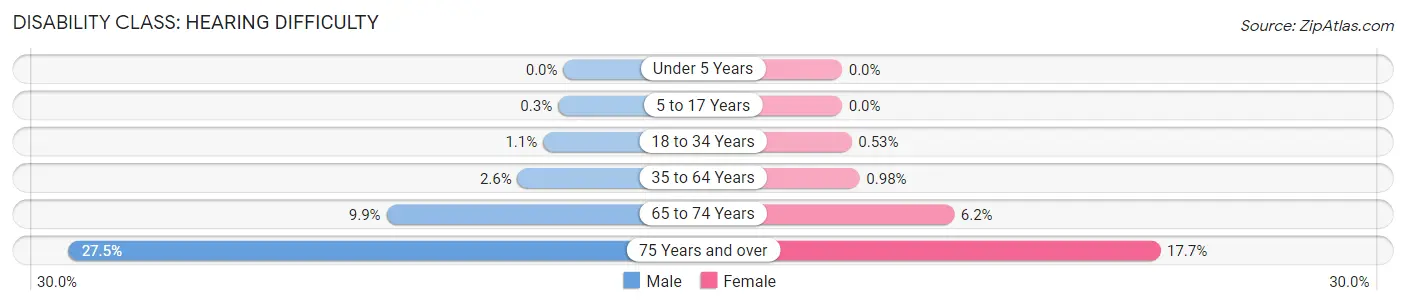
| Age Bracket | Male | Female |
| Under 5 Years | 0 (0.0%) | 0 (0.0%) |
| 5 to 17 Years | 30 (0.3%) | 0 (0.0%) |
| 18 to 34 Years | 162 (1.1%) | 71 (0.5%) |
| 35 to 64 Years | 511 (2.5%) | 179 (1.0%) |
| 65 to 74 Years | 337 (9.9%) | 229 (6.2%) |
| 75 Years and over | 428 (27.5%) | 524 (17.7%) |
Disability Class: Vision Difficulty
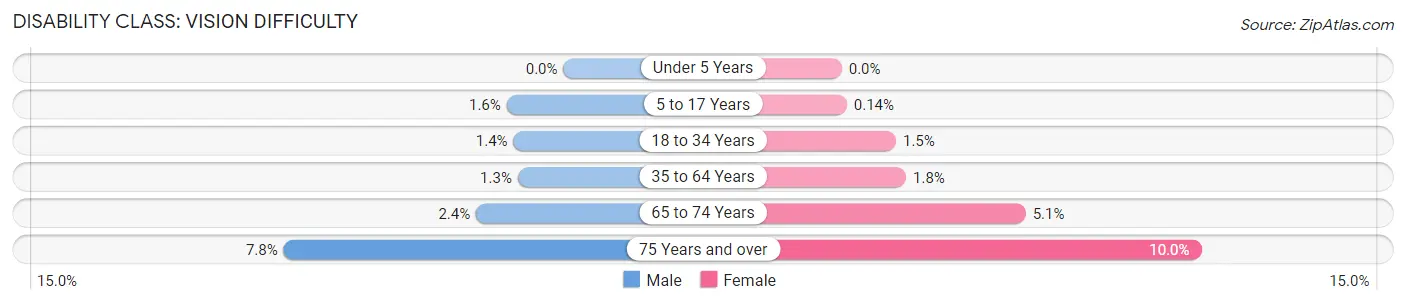
| Age Bracket | Male | Female |
| Under 5 Years | 0 (0.0%) | 0 (0.0%) |
| 5 to 17 Years | 157 (1.6%) | 15 (0.1%) |
| 18 to 34 Years | 199 (1.4%) | 202 (1.5%) |
| 35 to 64 Years | 255 (1.3%) | 327 (1.8%) |
| 65 to 74 Years | 83 (2.4%) | 188 (5.1%) |
| 75 Years and over | 121 (7.8%) | 296 (10.0%) |
Disability Class: Cognitive Difficulty
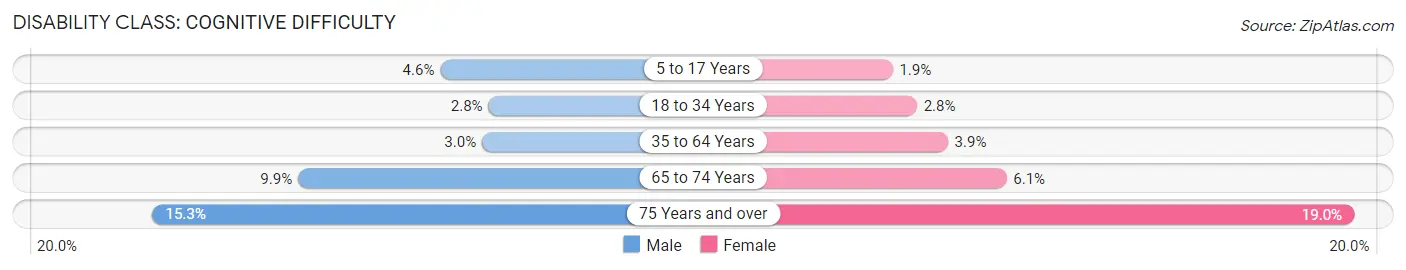
| Age Bracket | Male | Female |
| 5 to 17 Years | 453 (4.6%) | 202 (1.9%) |
| 18 to 34 Years | 398 (2.8%) | 373 (2.8%) |
| 35 to 64 Years | 604 (3.0%) | 719 (3.9%) |
| 65 to 74 Years | 337 (9.9%) | 224 (6.1%) |
| 75 Years and over | 237 (15.2%) | 562 (19.0%) |
Disability Class: Ambulatory Difficulty
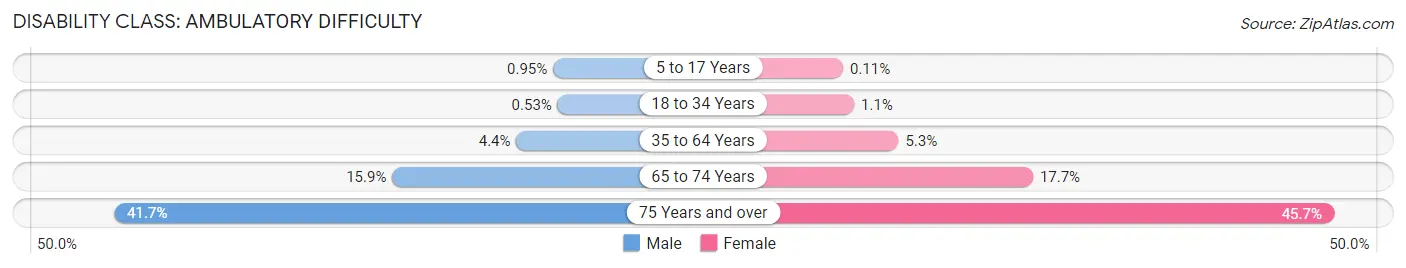
| Age Bracket | Male | Female |
| 5 to 17 Years | 94 (0.9%) | 12 (0.1%) |
| 18 to 34 Years | 76 (0.5%) | 153 (1.1%) |
| 35 to 64 Years | 873 (4.4%) | 963 (5.3%) |
| 65 to 74 Years | 543 (15.9%) | 651 (17.7%) |
| 75 Years and over | 648 (41.7%) | 1,350 (45.7%) |
Disability Class: Self-Care Difficulty
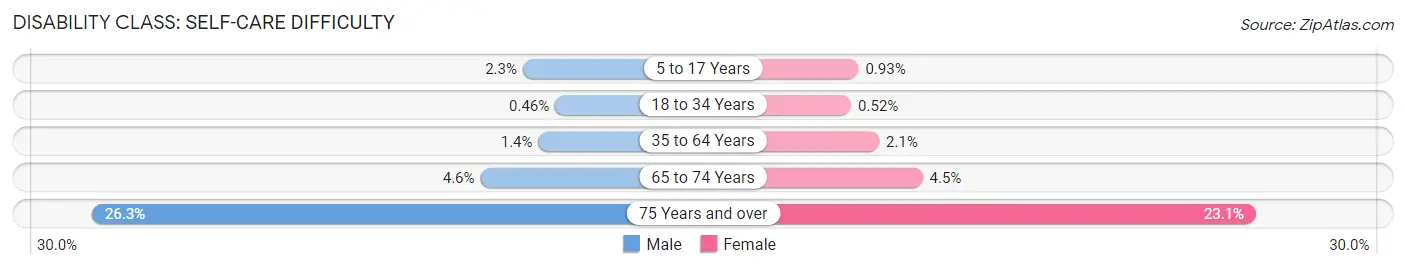
| Age Bracket | Male | Female |
| 5 to 17 Years | 224 (2.3%) | 100 (0.9%) |
| 18 to 34 Years | 66 (0.5%) | 69 (0.5%) |
| 35 to 64 Years | 279 (1.4%) | 378 (2.1%) |
| 65 to 74 Years | 158 (4.6%) | 165 (4.5%) |
| 75 Years and over | 408 (26.3%) | 682 (23.1%) |
Technology Access in Jurupa Valley
Computing Device Access in Jurupa Valley
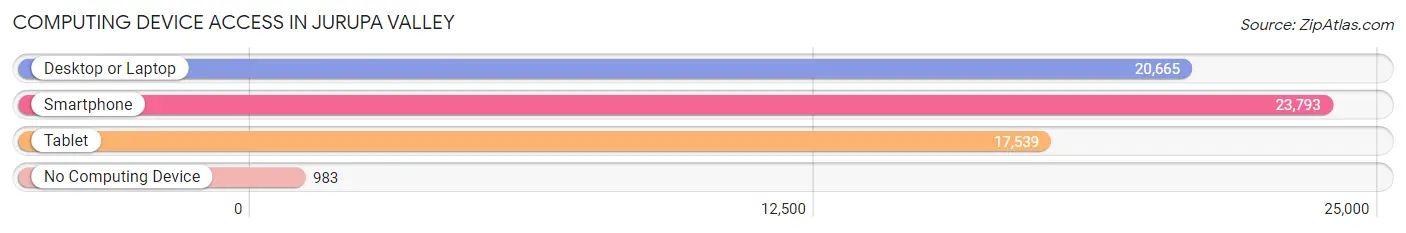
| Device Type | # Households | % Households |
| Desktop or Laptop | 20,665 | 79.6% |
| Smartphone | 23,793 | 91.7% |
| Tablet | 17,539 | 67.6% |
| No Computing Device | 983 | 3.8% |
| Total | 25,957 | 100.0% |
Internet Access in Jurupa Valley
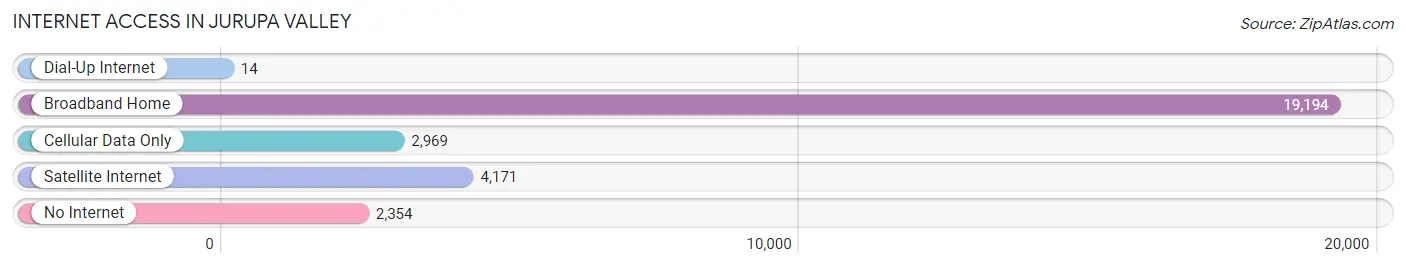
| Internet Type | # Households | % Households |
| Dial-Up Internet | 14 | 0.1% |
| Broadband Home | 19,194 | 74.0% |
| Cellular Data Only | 2,969 | 11.4% |
| Satellite Internet | 4,171 | 16.1% |
| No Internet | 2,354 | 9.1% |
| Total | 25,957 | 100.0% |
Jurupa Valley Summary
Jurupa Valley is a city located in Riverside County, California. It is situated in the western part of the county, just east of the city of Riverside. The city was incorporated in 2011, making it one of the newest cities in the state. Jurupa Valley is home to a diverse population of over 100,000 people, and is known for its agricultural heritage and its proximity to the Santa Ana Mountains.
Geography
Jurupa Valley is located in the western part of Riverside County, just east of the city of Riverside. It is bordered by the cities of Norco to the north, Mira Loma to the east, and Rubidoux to the south. The city is situated in the Santa Ana River Valley, and is surrounded by the Santa Ana Mountains to the west and the San Jacinto Mountains to the east. The city covers an area of approximately 33 square miles, and has an elevation of 1,000 feet.
Climate
Jurupa Valley has a Mediterranean climate, with hot, dry summers and mild, wet winters. The average high temperature in the summer is around 90 degrees Fahrenheit, while the average low temperature in the winter is around 50 degrees Fahrenheit. The city receives an average of 15 inches of rain per year, with most of the precipitation occurring in the winter months.
Demographics
As of the 2010 census, the population of Jurupa Valley was 98,842. The racial makeup of the city was 57.3% White, 4.2% African American, 0.7% Native American, 2.3% Asian, 0.2% Pacific Islander, and 33.3% from other races. The median household income was $50,945, and the median family income was $56,945.
Economy
Jurupa Valley is home to a diverse economy, with a variety of industries represented. The city is home to several large employers, including the Jurupa Unified School District, the Riverside County Sheriff’s Department, and the Riverside County Fire Department. The city is also home to several manufacturing and distribution companies, as well as a number of retail stores and restaurants.
History
Jurupa Valley was originally inhabited by the Serrano and Cahuilla Native American tribes. The area was first settled by Europeans in the late 1800s, when a group of settlers established a small farming community in the area. The city was officially incorporated in 2011, and has since grown to become one of the largest cities in Riverside County.
Conclusion
Jurupa Valley is a city located in Riverside County, California. It is situated in the western part of the county, just east of the city of Riverside. The city was incorporated in 2011, and is home to a diverse population of over 100,000 people. Jurupa Valley has a Mediterranean climate, with hot, dry summers and mild, wet winters. The city is home to a diverse economy, with a variety of industries represented. The city has a rich history, and is known for its agricultural heritage and its proximity to the Santa Ana Mountains.
Common Questions
What is Per Capita Income in Jurupa Valley?
Per Capita income in Jurupa Valley is $28,723.
What is the Median Family Income in Jurupa Valley?
Median Family Income in Jurupa Valley is $95,404.
What is the Median Household income in Jurupa Valley?
Median Household Income in Jurupa Valley is $91,562.
What is Income or Wage Gap in Jurupa Valley?
Income or Wage Gap in Jurupa Valley is 31.7%.
Women in Jurupa Valley earn 68.3 cents for every dollar earned by a man.
What is Family Income Deficit in Jurupa Valley?
Family Income Deficit in Jurupa Valley is $12,462.
Families that are below poverty line in Jurupa Valley earn $12,462 less on average than the poverty threshold level.
What is Inequality or Gini Index in Jurupa Valley?
Inequality or Gini Index in Jurupa Valley is 0.41.
What is the Total Population of Jurupa Valley?
Total Population of Jurupa Valley is 105,672.
What is the Total Male Population of Jurupa Valley?
Total Male Population of Jurupa Valley is 53,206.
What is the Total Female Population of Jurupa Valley?
Total Female Population of Jurupa Valley is 52,466.
What is the Ratio of Males per 100 Females in Jurupa Valley?
There are 101.41 Males per 100 Females in Jurupa Valley.
What is the Ratio of Females per 100 Males in Jurupa Valley?
There are 98.61 Females per 100 Males in Jurupa Valley.
What is the Median Population Age in Jurupa Valley?
Median Population Age in Jurupa Valley is 33.5 Years.
What is the Average Family Size in Jurupa Valley
Average Family Size in Jurupa Valley is 4.4 People.
What is the Average Household Size in Jurupa Valley
Average Household Size in Jurupa Valley is 4.0 People.
How Large is the Labor Force in Jurupa Valley?
There are 51,907 People in the Labor Forcein in Jurupa Valley.
What is the Percentage of People in the Labor Force in Jurupa Valley?
63.7% of People are in the Labor Force in Jurupa Valley.
What is the Unemployment Rate in Jurupa Valley?
Unemployment Rate in Jurupa Valley is 6.8%.