Cities with the Lowest Percentage of Births to Unmarried Women over the Age of 35 in Florida
RELATED REPORTS & OPTIONS
Lowest Illegitimacy | Women 35+
Florida
Compare Cities
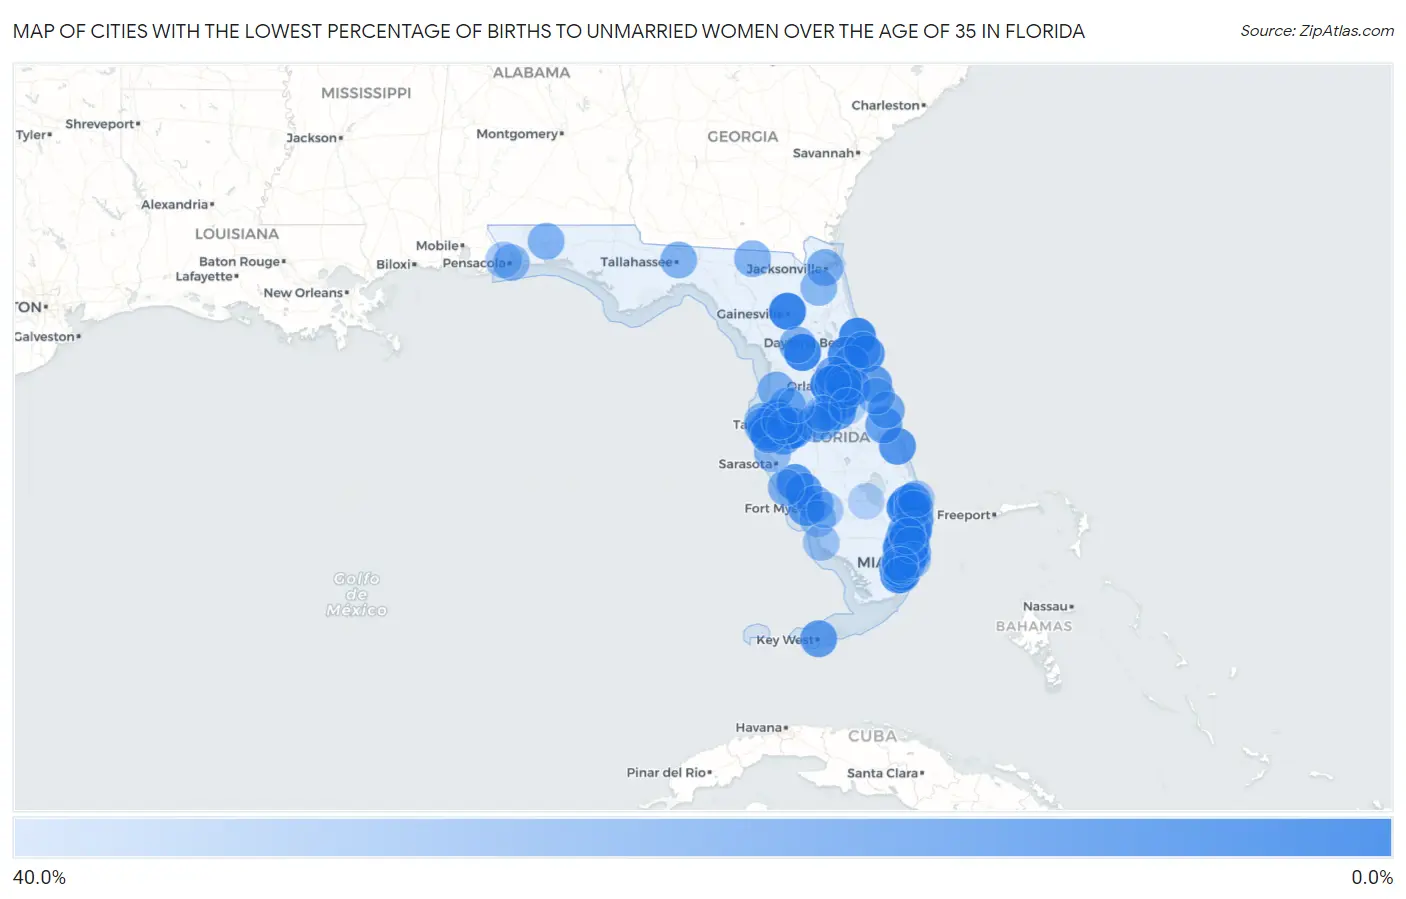
Map of Cities with the Lowest Percentage of Births to Unmarried Women over the Age of 35 in Florida
40.0%
0.0%
Cities with the Lowest Percentage of Births to Unmarried Women over the Age of 35 in Florida
| City | % Unmarried | vs State | vs National | |
| 1. | Gainesville | 3.8% | 26.5%(-22.7)#1 | 20.1%(-16.3)#71 |
| 2. | Winter Garden | 3.9% | 26.5%(-22.6)#2 | 20.1%(-16.2)#77 |
| 3. | South Miami Heights | 4.7% | 26.5%(-21.8)#3 | 20.1%(-15.4)#104 |
| 4. | Ormond Beach | 5.0% | 26.5%(-21.5)#4 | 20.1%(-15.1)#119 |
| 5. | Belleview | 5.3% | 26.5%(-21.2)#5 | 20.1%(-14.8)#134 |
| 6. | Kissimmee | 5.6% | 26.5%(-20.9)#6 | 20.1%(-14.5)#143 |
| 7. | Pine Hills | 6.0% | 26.5%(-20.5)#7 | 20.1%(-14.1)#164 |
| 8. | Davie | 7.1% | 26.5%(-19.4)#8 | 20.1%(-13.0)#210 |
| 9. | Town N Country | 7.9% | 26.5%(-18.6)#9 | 20.1%(-12.2)#249 |
| 10. | Valrico | 7.9% | 26.5%(-18.6)#10 | 20.1%(-12.2)#253 |
| 11. | Deland | 7.9% | 26.5%(-18.6)#11 | 20.1%(-12.2)#254 |
| 12. | Royal Palm Beach | 8.6% | 26.5%(-17.9)#12 | 20.1%(-11.5)#283 |
| 13. | Wellington | 9.4% | 26.5%(-17.1)#13 | 20.1%(-10.7)#318 |
| 14. | Delray Beach | 10.3% | 26.5%(-16.2)#14 | 20.1%(-9.80)#363 |
| 15. | New Smyrna Beach | 10.3% | 26.5%(-16.2)#15 | 20.1%(-9.80)#364 |
| 16. | Belle Isle | 11.0% | 26.5%(-15.5)#16 | 20.1%(-9.10)#389 |
| 17. | Maitland | 11.1% | 26.5%(-15.4)#17 | 20.1%(-9.00)#393 |
| 18. | Sunny Isles Beach | 11.6% | 26.5%(-14.9)#18 | 20.1%(-8.50)#421 |
| 19. | Altamonte Springs | 12.2% | 26.5%(-14.3)#19 | 20.1%(-7.90)#441 |
| 20. | Vero Beach South | 12.5% | 26.5%(-14.0)#20 | 20.1%(-7.60)#459 |
| 21. | Carrollwood | 12.6% | 26.5%(-13.9)#21 | 20.1%(-7.50)#468 |
| 22. | North Port | 12.8% | 26.5%(-13.7)#22 | 20.1%(-7.30)#475 |
| 23. | Poinciana | 13.2% | 26.5%(-13.3)#23 | 20.1%(-6.90)#501 |
| 24. | Kendale Lakes | 13.6% | 26.5%(-12.9)#24 | 20.1%(-6.50)#524 |
| 25. | Fort Lauderdale | 13.8% | 26.5%(-12.7)#25 | 20.1%(-6.30)#534 |
| 26. | Cape Coral | 14.2% | 26.5%(-12.3)#26 | 20.1%(-5.90)#558 |
| 27. | Bloomingdale | 14.3% | 26.5%(-12.2)#27 | 20.1%(-5.80)#568 |
| 28. | Doral | 14.7% | 26.5%(-11.8)#28 | 20.1%(-5.40)#596 |
| 29. | Apollo Beach | 14.7% | 26.5%(-11.8)#29 | 20.1%(-5.40)#600 |
| 30. | Miramar | 15.2% | 26.5%(-11.3)#30 | 20.1%(-4.90)#626 |
| 31. | Lealman | 15.4% | 26.5%(-11.1)#31 | 20.1%(-4.70)#639 |
| 32. | Punta Gorda | 15.4% | 26.5%(-11.1)#32 | 20.1%(-4.70)#640 |
| 33. | Key West | 15.5% | 26.5%(-11.0)#33 | 20.1%(-4.60)#648 |
| 34. | West Palm Beach | 15.8% | 26.5%(-10.7)#34 | 20.1%(-4.30)#658 |
| 35. | North Miami | 15.8% | 26.5%(-10.7)#35 | 20.1%(-4.30)#660 |
| 36. | Fish Hawk | 15.8% | 26.5%(-10.7)#36 | 20.1%(-4.30)#663 |
| 37. | Sunrise | 16.8% | 26.5%(-9.70)#37 | 20.1%(-3.30)#719 |
| 38. | Deltona | 17.0% | 26.5%(-9.50)#38 | 20.1%(-3.10)#731 |
| 39. | Palm Bay | 17.4% | 26.5%(-9.10)#39 | 20.1%(-2.70)#750 |
| 40. | Titusville | 17.4% | 26.5%(-9.10)#40 | 20.1%(-2.70)#752 |
| 41. | Hollywood | 17.5% | 26.5%(-9.00)#41 | 20.1%(-2.60)#753 |
| 42. | North Miami Beach | 18.5% | 26.5%(-8.00)#42 | 20.1%(-1.60)#809 |
| 43. | Haines City | 19.0% | 26.5%(-7.50)#43 | 20.1%(-1.10)#834 |
| 44. | Pompano Beach | 20.1% | 26.5%(-6.40)#44 | 20.1%(=0.000)#883 |
| 45. | Palmetto Bay | 20.4% | 26.5%(-6.10)#45 | 20.1%(+0.300)#898 |
| 46. | Satellite Beach | 20.6% | 26.5%(-5.90)#46 | 20.1%(+0.500)#911 |
| 47. | Riverview | 20.8% | 26.5%(-5.70)#47 | 20.1%(+0.700)#915 |
| 48. | Lauderhill | 20.9% | 26.5%(-5.60)#48 | 20.1%(+0.800)#928 |
| 49. | Palm Springs | 20.9% | 26.5%(-5.60)#49 | 20.1%(+0.800)#929 |
| 50. | Miami Lakes | 21.1% | 26.5%(-5.40)#50 | 20.1%(+1.00)#933 |
| 51. | Kendall | 21.2% | 26.5%(-5.30)#51 | 20.1%(+1.10)#940 |
| 52. | Deerfield Beach | 21.3% | 26.5%(-5.20)#52 | 20.1%(+1.20)#944 |
| 53. | Alafaya | 21.5% | 26.5%(-5.00)#53 | 20.1%(+1.40)#955 |
| 54. | Pembroke Pines | 21.6% | 26.5%(-4.90)#54 | 20.1%(+1.50)#959 |
| 55. | Coral Springs | 22.2% | 26.5%(-4.30)#55 | 20.1%(+2.10)#986 |
| 56. | Apopka | 22.2% | 26.5%(-4.30)#56 | 20.1%(+2.10)#987 |
| 57. | Wesley Chapel | 23.4% | 26.5%(-3.10)#57 | 20.1%(+3.30)#1,040 |
| 58. | Winter Haven | 23.5% | 26.5%(-3.00)#58 | 20.1%(+3.40)#1,043 |
| 59. | Spring Hill | 24.0% | 26.5%(-2.50)#59 | 20.1%(+3.90)#1,064 |
| 60. | Jacksonville | 24.1% | 26.5%(-2.40)#60 | 20.1%(+4.00)#1,067 |
| 61. | North Fort Myers | 24.1% | 26.5%(-2.40)#61 | 20.1%(+4.00)#1,070 |
| 62. | Glenvar Heights | 24.2% | 26.5%(-2.30)#62 | 20.1%(+4.10)#1,077 |
| 63. | Greenacres | 24.6% | 26.5%(-1.90)#63 | 20.1%(+4.50)#1,088 |
| 64. | Ocala | 24.7% | 26.5%(-1.80)#64 | 20.1%(+4.60)#1,094 |
| 65. | Englewood | 25.0% | 26.5%(-1.50)#65 | 20.1%(+4.90)#1,104 |
| 66. | Pinellas Park | 25.4% | 26.5%(-1.10)#66 | 20.1%(+5.30)#1,125 |
| 67. | Crestview | 25.4% | 26.5%(-1.10)#67 | 20.1%(+5.30)#1,127 |
| 68. | Tallahassee | 25.6% | 26.5%(-0.900)#68 | 20.1%(+5.50)#1,133 |
| 69. | Jasper | 26.4% | 26.5%(-0.100)#69 | 20.1%(+6.30)#1,177 |
| 70. | Clearwater | 26.8% | 26.5%(+0.300)#70 | 20.1%(+6.70)#1,190 |
| 71. | Asbury Lake | 27.4% | 26.5%(+0.900)#71 | 20.1%(+7.30)#1,224 |
| 72. | Miami | 27.7% | 26.5%(+1.20)#72 | 20.1%(+7.60)#1,232 |
| 73. | Cocoa | 28.1% | 26.5%(+1.60)#73 | 20.1%(+8.00)#1,253 |
| 74. | Pensacola | 28.3% | 26.5%(+1.80)#74 | 20.1%(+8.20)#1,265 |
| 75. | Brandon | 28.7% | 26.5%(+2.20)#75 | 20.1%(+8.60)#1,287 |
| 76. | Orlando | 29.3% | 26.5%(+2.80)#76 | 20.1%(+9.20)#1,309 |
| 77. | Port Orange | 29.9% | 26.5%(+3.40)#77 | 20.1%(+9.80)#1,334 |
| 78. | Winter Park | 29.9% | 26.5%(+3.40)#78 | 20.1%(+9.80)#1,335 |
| 79. | Highland City | 30.0% | 26.5%(+3.50)#79 | 20.1%(+9.90)#1,344 |
| 80. | Largo | 30.2% | 26.5%(+3.70)#80 | 20.1%(+10.1)#1,351 |
| 81. | Bradenton | 30.6% | 26.5%(+4.10)#81 | 20.1%(+10.5)#1,365 |
| 82. | Ocoee | 31.6% | 26.5%(+5.10)#82 | 20.1%(+11.5)#1,405 |
| 83. | St Petersburg | 31.7% | 26.5%(+5.20)#83 | 20.1%(+11.6)#1,408 |
| 84. | Palm River Clair Mel | 31.7% | 26.5%(+5.20)#84 | 20.1%(+11.6)#1,409 |
| 85. | Miami Beach | 31.9% | 26.5%(+5.40)#85 | 20.1%(+11.8)#1,413 |
| 86. | Three Oaks | 32.1% | 26.5%(+5.60)#86 | 20.1%(+12.0)#1,425 |
| 87. | Bellview | 33.3% | 26.5%(+6.80)#87 | 20.1%(+13.2)#1,463 |
| 88. | Lely | 33.3% | 26.5%(+6.80)#88 | 20.1%(+13.2)#1,481 |
| 89. | Lake Alfred | 33.5% | 26.5%(+7.00)#89 | 20.1%(+13.4)#1,510 |
| 90. | Riviera Beach | 33.7% | 26.5%(+7.20)#90 | 20.1%(+13.6)#1,514 |
| 91. | Lehigh Acres | 34.2% | 26.5%(+7.70)#91 | 20.1%(+14.1)#1,529 |
| 92. | Fountainebleau | 34.4% | 26.5%(+7.90)#92 | 20.1%(+14.3)#1,537 |
| 93. | Dania Beach | 34.7% | 26.5%(+8.20)#93 | 20.1%(+14.6)#1,547 |
| 94. | Tamarac | 38.2% | 26.5%(+11.7)#94 | 20.1%(+18.1)#1,690 |
| 95. | Tampa | 38.4% | 26.5%(+11.9)#95 | 20.1%(+18.3)#1,696 |
| 96. | St Cloud | 38.5% | 26.5%(+12.0)#96 | 20.1%(+18.4)#1,699 |
| 97. | Westchester | 39.0% | 26.5%(+12.5)#97 | 20.1%(+18.9)#1,708 |
| 98. | Clewiston | 39.0% | 26.5%(+12.5)#98 | 20.1%(+18.9)#1,713 |
| 99. | Cutler Bay | 39.8% | 26.5%(+13.3)#99 | 20.1%(+19.7)#1,730 |
| 100. | Zephyrhills | 40.0% | 26.5%(+13.5)#100 | 20.1%(+19.9)#1,739 |
Common Questions
What are the Top 10 Cities with the Lowest Percentage of Births to Unmarried Women over the Age of 35 in Florida?
Top 10 Cities with the Lowest Percentage of Births to Unmarried Women over the Age of 35 in Florida are:
#1
3.8%
#2
3.9%
#3
4.7%
#4
5.0%
#5
5.3%
#6
5.6%
#7
6.0%
#8
7.1%
#9
7.9%
#10
7.9%
What city has the Lowest Percentage of Births to Unmarried Women over the Age of 35 in Florida?
Gainesville has the Lowest Percentage of Births to Unmarried Women over the Age of 35 in Florida with 3.8%.
What is the Percentage of Births to Unmarried Women over the Age of 35 in the State of Florida?
Percentage of Births to Unmarried Women over the Age of 35 in Florida is 26.5%.
What is the Percentage of Births to Unmarried Women over the Age of 35 in the United States?
Percentage of Births to Unmarried Women over the Age of 35 in the United States is 20.1%.