Palm Springs, CA Map & Demographics
Palm Springs Map
Palm Springs Overview
$62,030
PER CAPITA INCOME
$97,683
AVG FAMILY INCOME
$67,451
AVG HOUSEHOLD INCOME
34.4%
WAGE / INCOME GAP [ % ]
65.6¢/ $1
WAGE / INCOME GAP [ $ ]
$12,685
FAMILY INCOME DEFICIT
0.56
INEQUALITY / GINI INDEX
44,935
TOTAL POPULATION
27,128
MALE POPULATION
17,807
FEMALE POPULATION
152.34
MALES / 100 FEMALES
65.64
FEMALES / 100 MALES
57.3
MEDIAN AGE
2.6
AVG FAMILY SIZE
1.9
AVG HOUSEHOLD SIZE
20,866
LABOR FORCE [ PEOPLE ]
50.0%
PERCENT IN LABOR FORCE
8.6%
UNEMPLOYMENT RATE
Income in Palm Springs
Income Overview in Palm Springs
Per Capita Income in Palm Springs is $62,030, while median incomes of families and households are $97,683 and $67,451 respectively.
| Characteristic | Number | Measure |
| Per Capita Income | 44,935 | $62,030 |
| Median Family Income | 9,949 | $97,683 |
| Mean Family Income | 9,949 | $159,137 |
| Median Household Income | 23,889 | $67,451 |
| Mean Household Income | 23,889 | $114,736 |
| Income Deficit | 9,949 | $12,685 |
| Wage / Income Gap (%) | 44,935 | 34.44% |
| Wage / Income Gap ($) | 44,935 | 65.56¢ per $1 |
| Gini / Inequality Index | 44,935 | 0.56 |
Earnings by Sex in Palm Springs
Average Earnings in Palm Springs are $42,758, $50,705 for men and $33,242 for women, a difference of 34.4%.
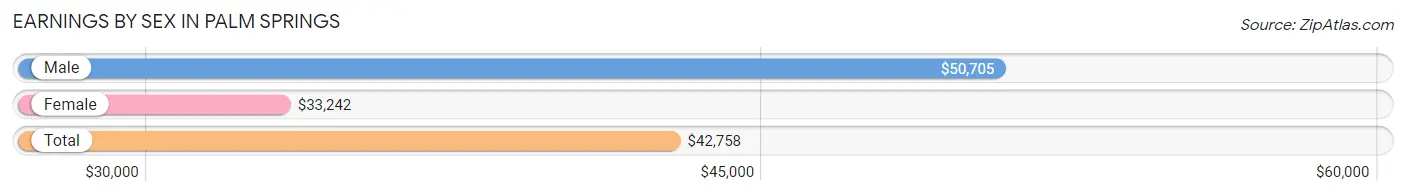
| Sex | Number | Average Earnings |
| Male | 13,503 (62.7%) | $50,705 |
| Female | 8,034 (37.3%) | $33,242 |
| Total | 21,537 (100.0%) | $42,758 |
Earnings by Sex by Income Bracket in Palm Springs
The most common earnings brackets in Palm Springs are $100,000+ for men (3,714 | 27.5%) and $100,000+ for women (1,530 | 19.0%).
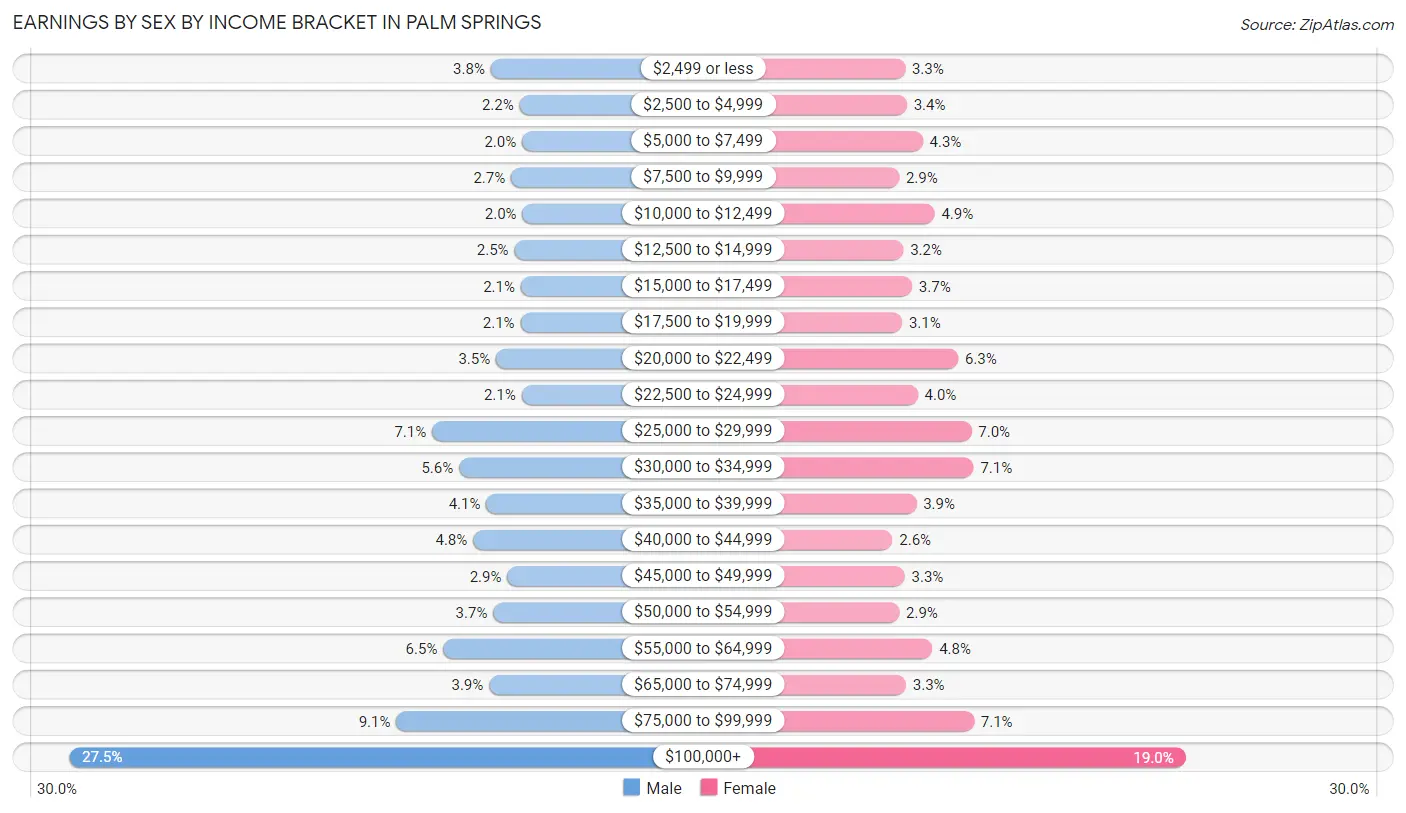
| Income | Male | Female |
| $2,499 or less | 513 (3.8%) | 263 (3.3%) |
| $2,500 to $4,999 | 295 (2.2%) | 271 (3.4%) |
| $5,000 to $7,499 | 275 (2.0%) | 342 (4.3%) |
| $7,500 to $9,999 | 359 (2.7%) | 235 (2.9%) |
| $10,000 to $12,499 | 273 (2.0%) | 396 (4.9%) |
| $12,500 to $14,999 | 334 (2.5%) | 255 (3.2%) |
| $15,000 to $17,499 | 285 (2.1%) | 294 (3.7%) |
| $17,500 to $19,999 | 287 (2.1%) | 249 (3.1%) |
| $20,000 to $22,499 | 472 (3.5%) | 502 (6.2%) |
| $22,500 to $24,999 | 280 (2.1%) | 320 (4.0%) |
| $25,000 to $29,999 | 959 (7.1%) | 562 (7.0%) |
| $30,000 to $34,999 | 753 (5.6%) | 572 (7.1%) |
| $35,000 to $39,999 | 547 (4.1%) | 313 (3.9%) |
| $40,000 to $44,999 | 647 (4.8%) | 206 (2.6%) |
| $45,000 to $49,999 | 387 (2.9%) | 261 (3.3%) |
| $50,000 to $54,999 | 494 (3.7%) | 236 (2.9%) |
| $55,000 to $64,999 | 874 (6.5%) | 386 (4.8%) |
| $65,000 to $74,999 | 525 (3.9%) | 267 (3.3%) |
| $75,000 to $99,999 | 1,230 (9.1%) | 574 (7.1%) |
| $100,000+ | 3,714 (27.5%) | 1,530 (19.0%) |
| Total | 13,503 (100.0%) | 8,034 (100.0%) |
Earnings by Sex by Educational Attainment in Palm Springs
Average earnings in Palm Springs are $54,116 for men and $37,843 for women, a difference of 30.1%. Men with an educational attainment of graduate degree enjoy the highest average annual earnings of $134,671, while those with less than high school education earn the least with $33,730. Women with an educational attainment of graduate degree earn the most with the average annual earnings of $91,346, while those with less than high school education have the smallest earnings of $21,632.
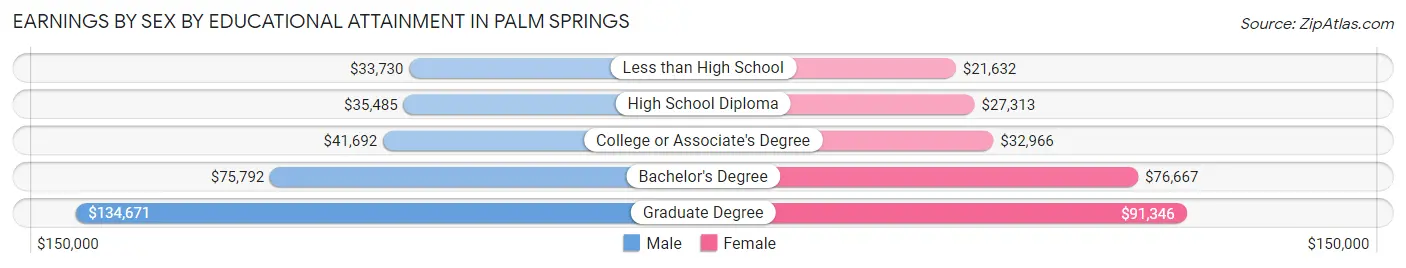
| Educational Attainment | Male Income | Female Income |
| Less than High School | $33,730 | $21,632 |
| High School Diploma | $35,485 | $27,313 |
| College or Associate's Degree | $41,692 | $32,966 |
| Bachelor's Degree | $75,792 | $76,667 |
| Graduate Degree | $134,671 | $91,346 |
| Total | $54,116 | $37,843 |
Family Income in Palm Springs
Family Income Brackets in Palm Springs
According to the Palm Springs family income data, there are 2,229 families falling into the $200,000+ income range, which is the most common income bracket and makes up 22.4% of all families. Conversely, the $10,000 to $14,999 income bracket is the least frequent group with only 99 families (1.0%) belonging to this category.
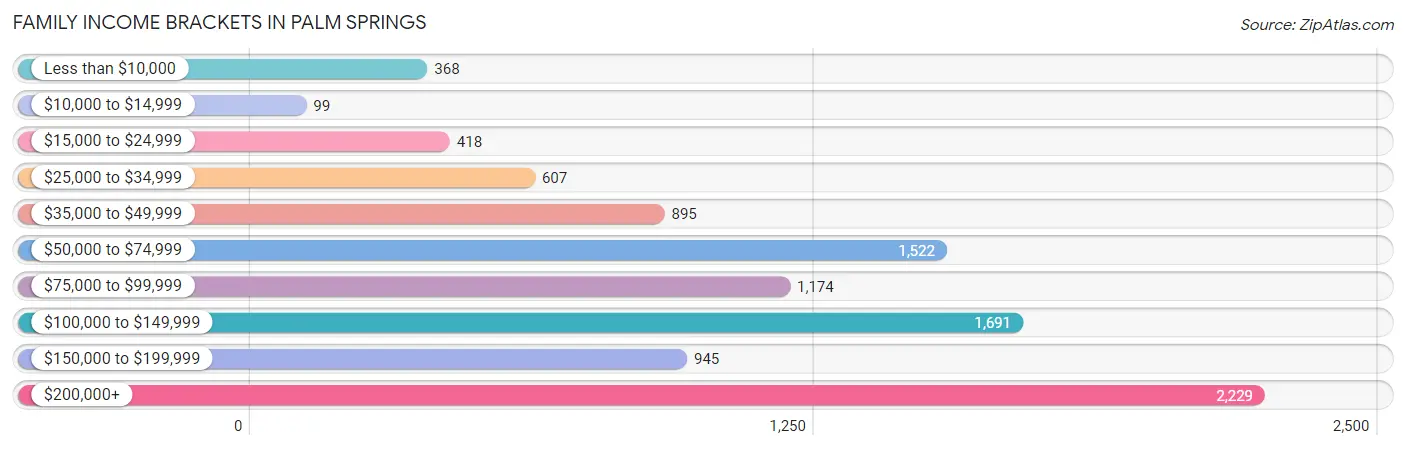
| Income Bracket | # Families | % Families |
| Less than $10,000 | 368 | 3.7% |
| $10,000 to $14,999 | 99 | 1.0% |
| $15,000 to $24,999 | 418 | 4.2% |
| $25,000 to $34,999 | 607 | 6.1% |
| $35,000 to $49,999 | 895 | 9.0% |
| $50,000 to $74,999 | 1,522 | 15.3% |
| $75,000 to $99,999 | 1,174 | 11.8% |
| $100,000 to $149,999 | 1,691 | 17.0% |
| $150,000 to $199,999 | 945 | 9.5% |
| $200,000+ | 2,229 | 22.4% |
Family Income by Famaliy Size in Palm Springs
7+ person families (44 | 0.4%) account for the highest median family income in Palm Springs with $235,978 per family, while 2-person families (7,314 | 73.5%) have the highest median income of $55,430 per family member.
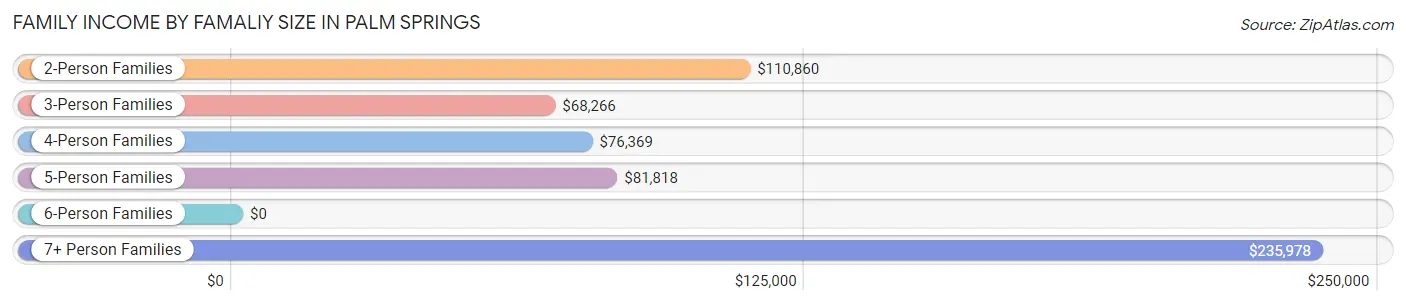
| Income Bracket | # Families | Median Income |
| 2-Person Families | 7,314 (73.5%) | $110,860 |
| 3-Person Families | 1,291 (13.0%) | $68,266 |
| 4-Person Families | 803 (8.1%) | $76,369 |
| 5-Person Families | 326 (3.3%) | $81,818 |
| 6-Person Families | 171 (1.7%) | $0 |
| 7+ Person Families | 44 (0.4%) | $235,978 |
| Total | 9,949 (100.0%) | $97,683 |
Family Income by Number of Earners in Palm Springs
The median family income in Palm Springs is $97,683, with families comprising 2 earners (3,274) having the highest median family income of $149,239, while families with no earners (3,046) have the lowest median family income of $79,359, accounting for 32.9% and 30.6% of families, respectively.
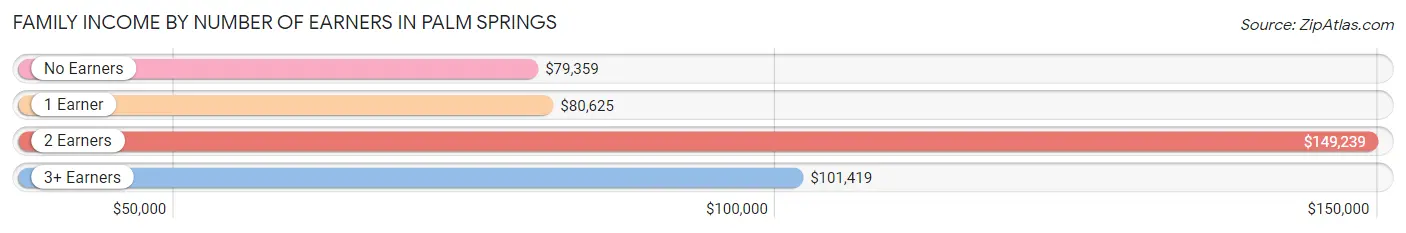
| Number of Earners | # Families | Median Income |
| No Earners | 3,046 (30.6%) | $79,359 |
| 1 Earner | 3,095 (31.1%) | $80,625 |
| 2 Earners | 3,274 (32.9%) | $149,239 |
| 3+ Earners | 534 (5.4%) | $101,419 |
| Total | 9,949 (100.0%) | $97,683 |
Household Income in Palm Springs
Household Income Brackets in Palm Springs
With 3,607 households falling in the category, the $50,000 to $74,999 income range is the most frequent in Palm Springs, accounting for 15.1% of all households. In contrast, only 693 households (2.9%) fall into the $10,000 to $14,999 income bracket, making it the least populous group.
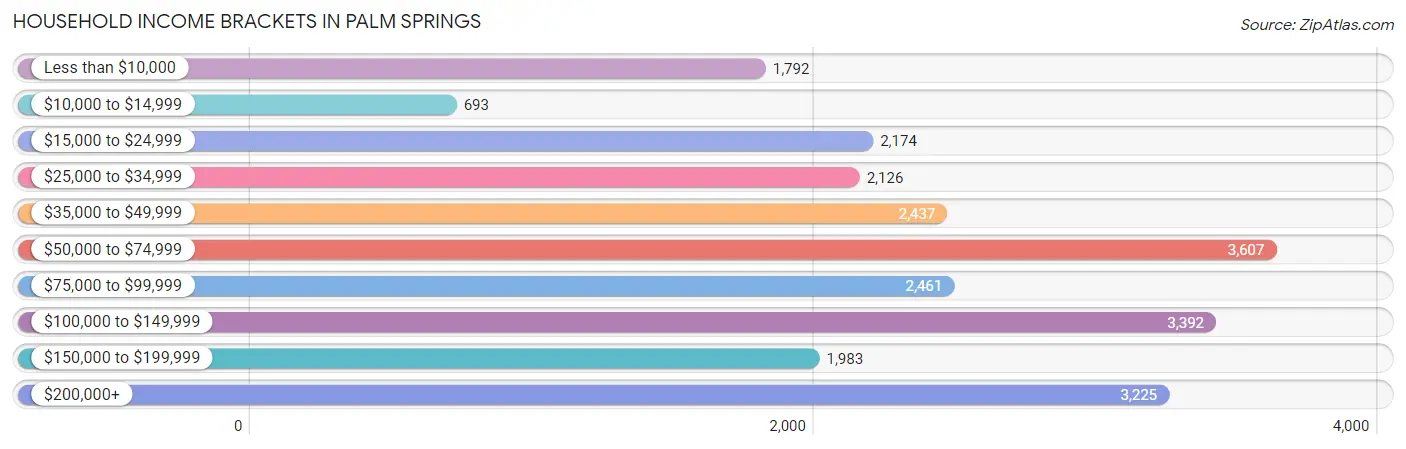
| Income Bracket | # Households | % Households |
| Less than $10,000 | 1,792 | 7.5% |
| $10,000 to $14,999 | 693 | 2.9% |
| $15,000 to $24,999 | 2,174 | 9.1% |
| $25,000 to $34,999 | 2,126 | 8.9% |
| $35,000 to $49,999 | 2,437 | 10.2% |
| $50,000 to $74,999 | 3,607 | 15.1% |
| $75,000 to $99,999 | 2,461 | 10.3% |
| $100,000 to $149,999 | 3,392 | 14.2% |
| $150,000 to $199,999 | 1,983 | 8.3% |
| $200,000+ | 3,225 | 13.5% |
Household Income by Householder Age in Palm Springs
The median household income in Palm Springs is $67,451, with the highest median household income of $81,086 found in the 45 to 64 years age bracket for the primary householder. A total of 9,336 households (39.1%) fall into this category. Meanwhile, the 15 to 24 years age bracket for the primary householder has the lowest median household income of $51,184, with 344 households (1.4%) in this group.
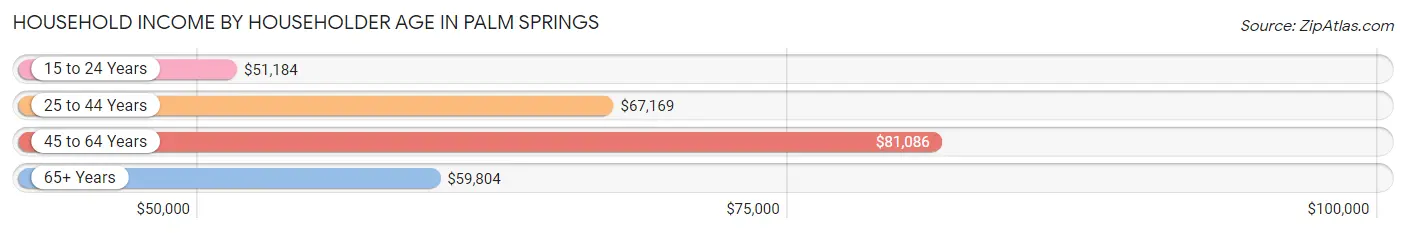
| Income Bracket | # Households | Median Income |
| 15 to 24 Years | 344 (1.4%) | $51,184 |
| 25 to 44 Years | 3,784 (15.8%) | $67,169 |
| 45 to 64 Years | 9,336 (39.1%) | $81,086 |
| 65+ Years | 10,425 (43.6%) | $59,804 |
| Total | 23,889 (100.0%) | $67,451 |
Poverty in Palm Springs
Income Below Poverty by Sex and Age in Palm Springs
With 14.2% poverty level for males and 13.5% for females among the residents of Palm Springs, 18 to 24 year old males and 16 and 17 year old females are the most vulnerable to poverty, with 465 males (36.8%) and 96 females (38.9%) in their respective age groups living below the poverty level.
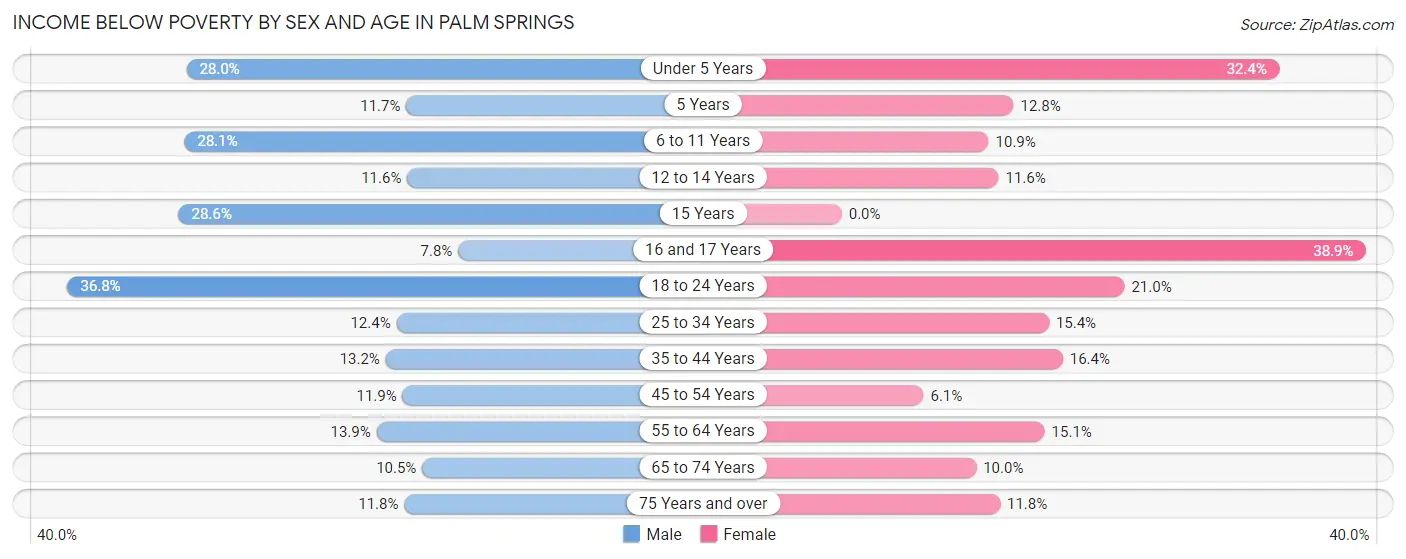
| Age Bracket | Male | Female |
| Under 5 Years | 155 (28.0%) | 97 (32.4%) |
| 5 Years | 19 (11.7%) | 13 (12.8%) |
| 6 to 11 Years | 206 (28.1%) | 45 (10.9%) |
| 12 to 14 Years | 43 (11.6%) | 37 (11.6%) |
| 15 Years | 22 (28.6%) | 0 (0.0%) |
| 16 and 17 Years | 20 (7.8%) | 96 (38.9%) |
| 18 to 24 Years | 465 (36.8%) | 284 (21.0%) |
| 25 to 34 Years | 297 (12.4%) | 305 (15.4%) |
| 35 to 44 Years | 272 (13.2%) | 228 (16.4%) |
| 45 to 54 Years | 498 (11.9%) | 125 (6.1%) |
| 55 to 64 Years | 893 (13.9%) | 464 (15.1%) |
| 65 to 74 Years | 540 (10.5%) | 321 (10.0%) |
| 75 Years and over | 390 (11.8%) | 354 (11.7%) |
| Total | 3,820 (14.2%) | 2,369 (13.5%) |
Income Above Poverty by Sex and Age in Palm Springs
According to the poverty statistics in Palm Springs, males aged 16 and 17 years and females aged 15 years are the age groups that are most secure financially, with 92.2% of males and 100.0% of females in these age groups living above the poverty line.
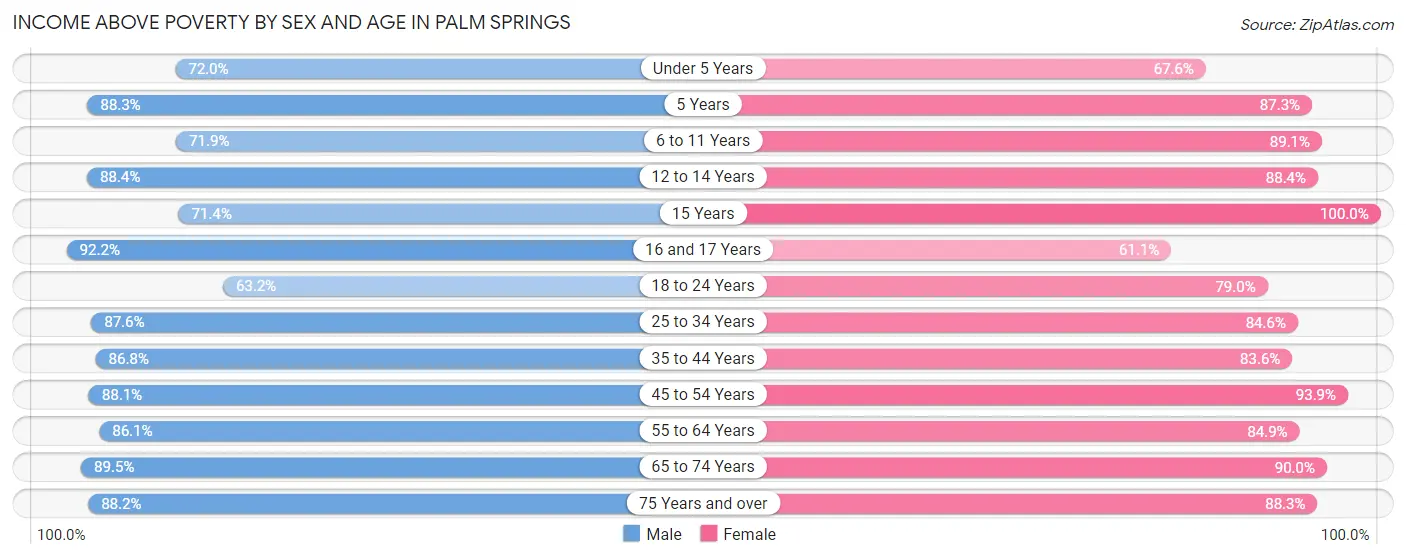
| Age Bracket | Male | Female |
| Under 5 Years | 399 (72.0%) | 202 (67.6%) |
| 5 Years | 144 (88.3%) | 89 (87.3%) |
| 6 to 11 Years | 526 (71.9%) | 368 (89.1%) |
| 12 to 14 Years | 328 (88.4%) | 281 (88.4%) |
| 15 Years | 55 (71.4%) | 129 (100.0%) |
| 16 and 17 Years | 236 (92.2%) | 151 (61.1%) |
| 18 to 24 Years | 798 (63.2%) | 1,069 (79.0%) |
| 25 to 34 Years | 2,101 (87.6%) | 1,678 (84.6%) |
| 35 to 44 Years | 1,790 (86.8%) | 1,161 (83.6%) |
| 45 to 54 Years | 3,674 (88.1%) | 1,935 (93.9%) |
| 55 to 64 Years | 5,546 (86.1%) | 2,617 (84.9%) |
| 65 to 74 Years | 4,614 (89.5%) | 2,897 (90.0%) |
| 75 Years and over | 2,912 (88.2%) | 2,660 (88.2%) |
| Total | 23,123 (85.8%) | 15,237 (86.5%) |
Income Below Poverty Among Married-Couple Families in Palm Springs
The poverty statistics for married-couple families in Palm Springs show that 4.7% or 363 of the total 7,767 families live below the poverty line. Families with 3 or 4 children have the highest poverty rate of 14.8%, comprising of 19 families. On the other hand, families with no children have the lowest poverty rate of 4.3%, which includes 287 families.
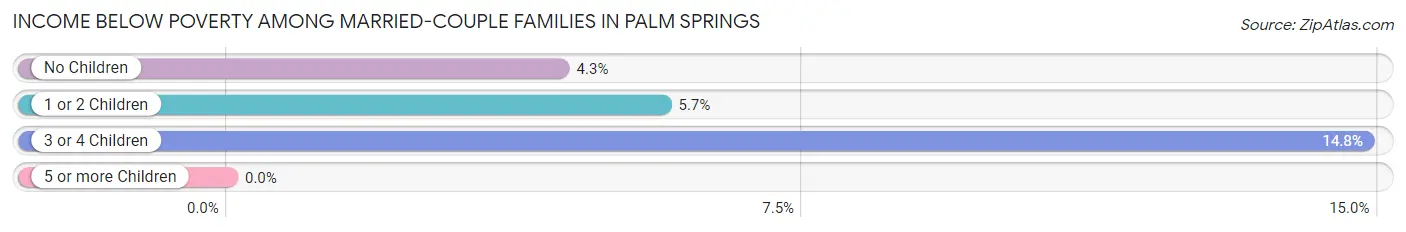
| Children | Above Poverty | Below Poverty |
| No Children | 6,345 (95.7%) | 287 (4.3%) |
| 1 or 2 Children | 950 (94.3%) | 57 (5.7%) |
| 3 or 4 Children | 109 (85.2%) | 19 (14.8%) |
| 5 or more Children | 0 (0.0%) | 0 (0.0%) |
| Total | 7,404 (95.3%) | 363 (4.7%) |
Income Below Poverty Among Single-Parent Households in Palm Springs
According to the poverty data in Palm Springs, 6.3% or 47 single-father households and 21.6% or 310 single-mother households are living below the poverty line. Among single-father households, those with 1 or 2 children have the highest poverty rate, with 21 households (11.5%) experiencing poverty. Likewise, among single-mother households, those with 3 or 4 children have the highest poverty rate, with 52 households (42.3%) falling below the poverty line.
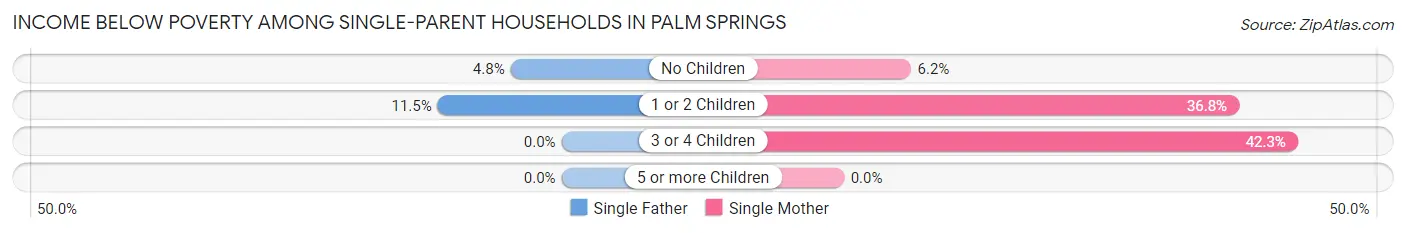
| Children | Single Father | Single Mother |
| No Children | 26 (4.8%) | 46 (6.2%) |
| 1 or 2 Children | 21 (11.5%) | 212 (36.8%) |
| 3 or 4 Children | 0 (0.0%) | 52 (42.3%) |
| 5 or more Children | 0 (0.0%) | 0 (0.0%) |
| Total | 47 (6.3%) | 310 (21.6%) |
Income Below Poverty Among Married-Couple vs Single-Parent Households in Palm Springs
The poverty data for Palm Springs shows that 363 of the married-couple family households (4.7%) and 357 of the single-parent households (16.4%) are living below the poverty level. Within the married-couple family households, those with 3 or 4 children have the highest poverty rate, with 19 households (14.8%) falling below the poverty line. Among the single-parent households, those with 3 or 4 children have the highest poverty rate, with 52 household (37.4%) living below poverty.
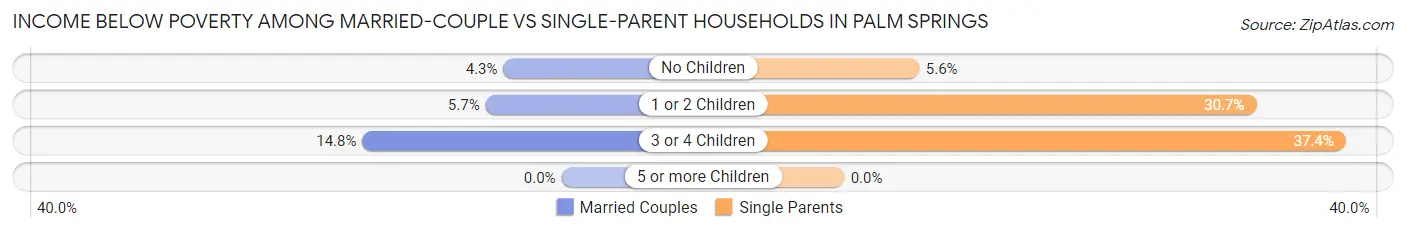
| Children | Married-Couple Families | Single-Parent Households |
| No Children | 287 (4.3%) | 72 (5.6%) |
| 1 or 2 Children | 57 (5.7%) | 233 (30.7%) |
| 3 or 4 Children | 19 (14.8%) | 52 (37.4%) |
| 5 or more Children | 0 (0.0%) | 0 (0.0%) |
| Total | 363 (4.7%) | 357 (16.4%) |
Race in Palm Springs
The most populous races in Palm Springs are White / Caucasian (32,211 | 71.7%), Hispanic or Latino (10,491 | 23.4%), and Two or more Races (4,353 | 9.7%).
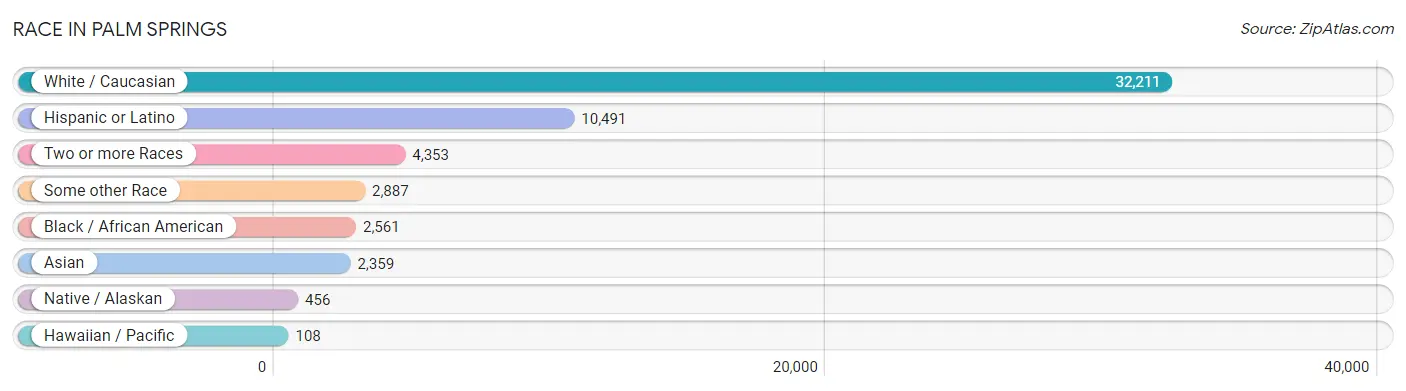
| Race | # Population | % Population |
| Asian | 2,359 | 5.2% |
| Black / African American | 2,561 | 5.7% |
| Hawaiian / Pacific | 108 | 0.2% |
| Hispanic or Latino | 10,491 | 23.4% |
| Native / Alaskan | 456 | 1.0% |
| White / Caucasian | 32,211 | 71.7% |
| Two or more Races | 4,353 | 9.7% |
| Some other Race | 2,887 | 6.4% |
| Total | 44,935 | 100.0% |
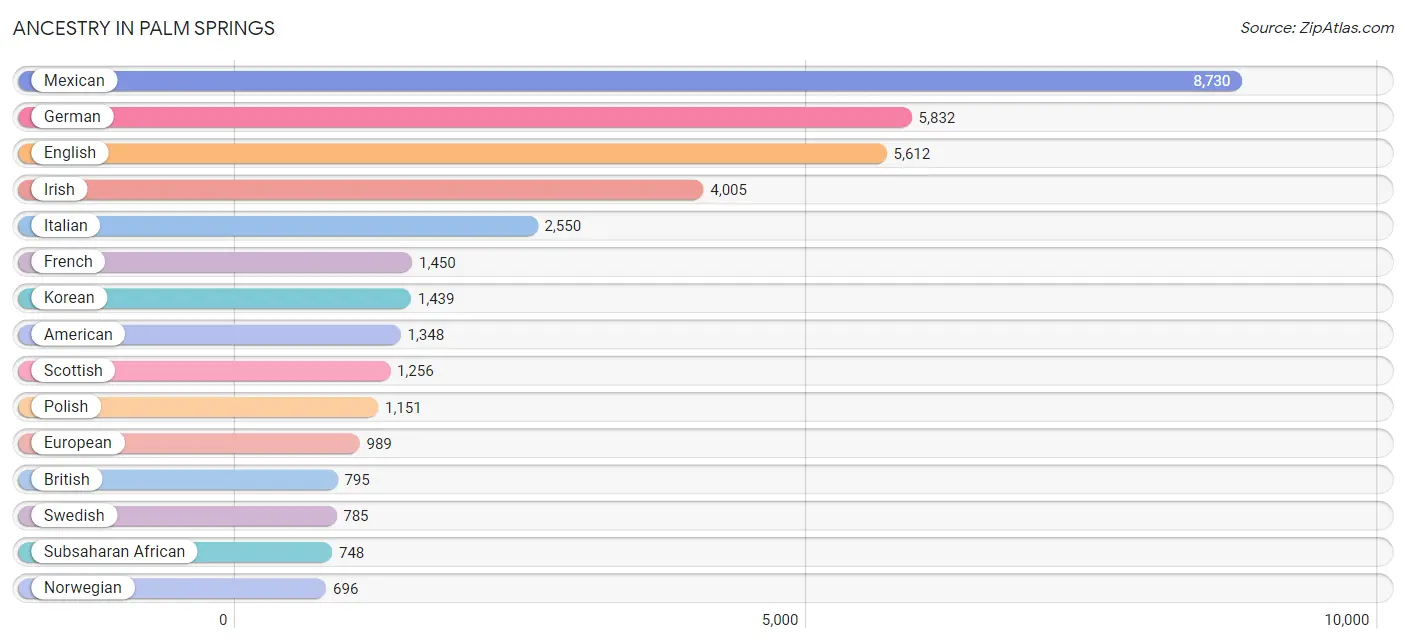
Ancestry in Palm Springs
The most populous ancestries reported in Palm Springs are Mexican (8,730 | 19.4%), German (5,832 | 13.0%), English (5,612 | 12.5%), Irish (4,005 | 8.9%), and Italian (2,550 | 5.7%), together accounting for 59.5% of all Palm Springs residents.
| Ancestry | # Population | % Population |
| Afghan | 12 | 0.0% |
| African | 659 | 1.5% |
| Albanian | 2 | 0.0% |
| Alsatian | 4 | 0.0% |
| American | 1,348 | 3.0% |
| Apache | 30 | 0.1% |
| Arab | 314 | 0.7% |
| Argentinean | 68 | 0.2% |
| Armenian | 146 | 0.3% |
| Assyrian / Chaldean / Syriac | 61 | 0.1% |
| Australian | 23 | 0.1% |
| Austrian | 251 | 0.6% |
| Bangladeshi | 1 | 0.0% |
| Barbadian | 2 | 0.0% |
| Basque | 56 | 0.1% |
| Belgian | 65 | 0.1% |
| Belizean | 6 | 0.0% |
| Bhutanese | 351 | 0.8% |
| Blackfeet | 132 | 0.3% |
| Bolivian | 15 | 0.0% |
| Brazilian | 12 | 0.0% |
| British | 795 | 1.8% |
| Bulgarian | 151 | 0.3% |
| Burmese | 110 | 0.2% |
| Cambodian | 2 | 0.0% |
| Canadian | 215 | 0.5% |
| Cape Verdean | 3 | 0.0% |
| Carpatho Rusyn | 5 | 0.0% |
| Celtic | 47 | 0.1% |
| Central American | 455 | 1.0% |
| Central American Indian | 35 | 0.1% |
| Cherokee | 297 | 0.7% |
| Chilean | 3 | 0.0% |
| Chippewa | 8 | 0.0% |
| Choctaw | 23 | 0.1% |
| Colombian | 27 | 0.1% |
| Comanche | 6 | 0.0% |
| Costa Rican | 3 | 0.0% |
| Cree | 1 | 0.0% |
| Creek | 7 | 0.0% |
| Croatian | 106 | 0.2% |
| Crow | 3 | 0.0% |
| Cuban | 157 | 0.4% |
| Czech | 162 | 0.4% |
| Czechoslovakian | 22 | 0.1% |
| Danish | 355 | 0.8% |
| Delaware | 9 | 0.0% |
| Dominican | 17 | 0.0% |
| Dutch | 588 | 1.3% |
| Eastern European | 435 | 1.0% |
| Ecuadorian | 17 | 0.0% |
| Egyptian | 36 | 0.1% |
| English | 5,612 | 12.5% |
| Estonian | 1 | 0.0% |
| European | 989 | 2.2% |
| Filipino | 12 | 0.0% |
| Finnish | 130 | 0.3% |
| French | 1,450 | 3.2% |
| French American Indian | 7 | 0.0% |
| French Canadian | 259 | 0.6% |
| German | 5,832 | 13.0% |
| Greek | 209 | 0.5% |
| Guamanian / Chamorro | 1 | 0.0% |
| Guatemalan | 82 | 0.2% |
| Honduran | 76 | 0.2% |
| Houma | 17 | 0.0% |
| Hungarian | 293 | 0.6% |
| Icelander | 23 | 0.1% |
| Indian (Asian) | 374 | 0.8% |
| Indonesian | 6 | 0.0% |
| Inupiat | 11 | 0.0% |
| Iranian | 97 | 0.2% |
| Irish | 4,005 | 8.9% |
| Iroquois | 7 | 0.0% |
| Israeli | 69 | 0.2% |
| Italian | 2,550 | 5.7% |
| Jamaican | 138 | 0.3% |
| Japanese | 11 | 0.0% |
| Jordanian | 4 | 0.0% |
| Kiowa | 11 | 0.0% |
| Korean | 1,439 | 3.2% |
| Laotian | 30 | 0.1% |
| Latvian | 21 | 0.1% |
| Lebanese | 118 | 0.3% |
| Lithuanian | 96 | 0.2% |
| Luxembourger | 4 | 0.0% |
| Macedonian | 3 | 0.0% |
| Malaysian | 4 | 0.0% |
| Maltese | 22 | 0.1% |
| Menominee | 2 | 0.0% |
| Mexican | 8,730 | 19.4% |
| Mexican American Indian | 73 | 0.2% |
| Mongolian | 8 | 0.0% |
| Moroccan | 49 | 0.1% |
| Native Hawaiian | 136 | 0.3% |
| Navajo | 11 | 0.0% |
| New Zealander | 4 | 0.0% |
| Nicaraguan | 20 | 0.0% |
| Nigerian | 83 | 0.2% |
| Northern European | 224 | 0.5% |
| Norwegian | 696 | 1.5% |
| Pakistani | 78 | 0.2% |
| Panamanian | 12 | 0.0% |
| Pennsylvania German | 4 | 0.0% |
| Peruvian | 113 | 0.3% |
| Pima | 29 | 0.1% |
| Polish | 1,151 | 2.6% |
| Portuguese | 327 | 0.7% |
| Pueblo | 19 | 0.0% |
| Puerto Rican | 212 | 0.5% |
| Romanian | 77 | 0.2% |
| Russian | 596 | 1.3% |
| Salvadoran | 262 | 0.6% |
| Samoan | 42 | 0.1% |
| Scandinavian | 353 | 0.8% |
| Scotch-Irish | 343 | 0.8% |
| Scottish | 1,256 | 2.8% |
| Seminole | 2 | 0.0% |
| Serbian | 44 | 0.1% |
| Sioux | 16 | 0.0% |
| Slavic | 66 | 0.2% |
| Slovak | 89 | 0.2% |
| Slovene | 17 | 0.0% |
| South African | 2 | 0.0% |
| South American | 306 | 0.7% |
| South American Indian | 17 | 0.0% |
| Soviet Union | 2 | 0.0% |
| Spaniard | 262 | 0.6% |
| Spanish | 199 | 0.4% |
| Spanish American | 3 | 0.0% |
| Sri Lankan | 91 | 0.2% |
| Subsaharan African | 748 | 1.7% |
| Sudanese | 1 | 0.0% |
| Swedish | 785 | 1.8% |
| Swiss | 197 | 0.4% |
| Syrian | 41 | 0.1% |
| Thai | 320 | 0.7% |
| Tlingit-Haida | 3 | 0.0% |
| Tohono O'Odham | 2 | 0.0% |
| Trinidadian and Tobagonian | 4 | 0.0% |
| Turkish | 65 | 0.1% |
| Ukrainian | 171 | 0.4% |
| Venezuelan | 63 | 0.1% |
| Welsh | 345 | 0.8% |
| West Indian | 3 | 0.0% |
| Yugoslavian | 50 | 0.1% |
| Yuman | 29 | 0.1% |
| Yup'ik | 1 | 0.0% | View All 148 Rows |
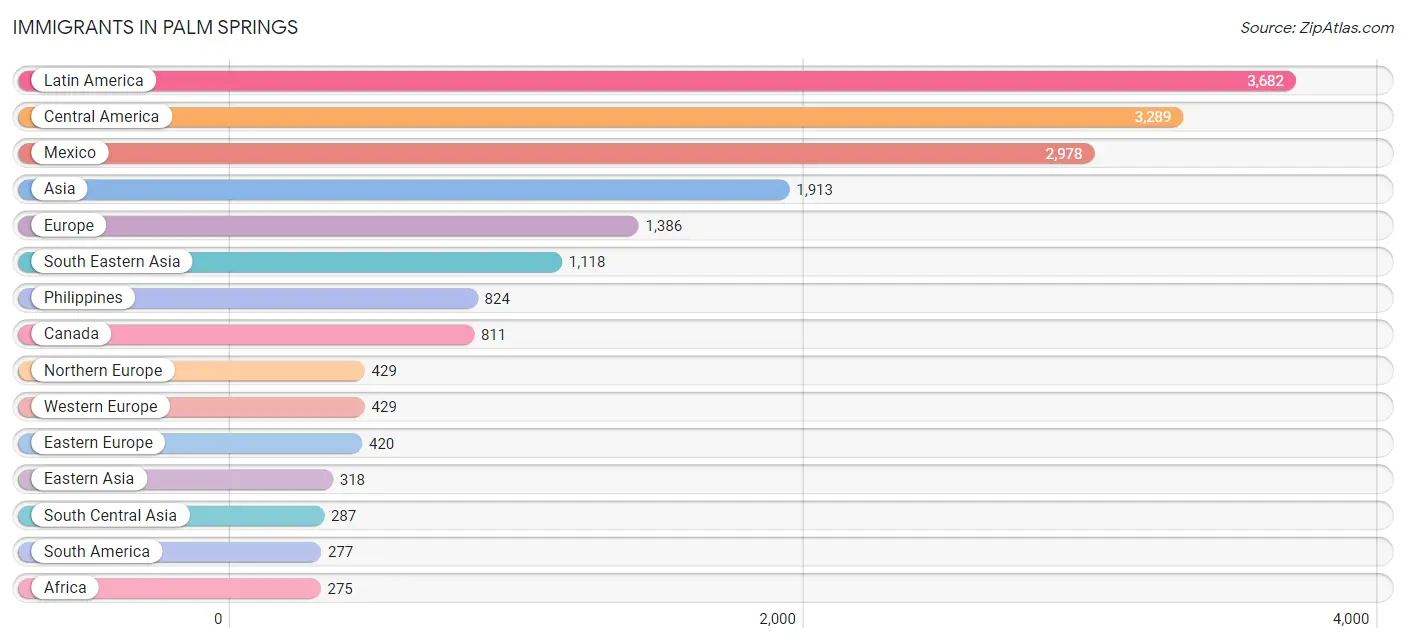
Immigrants in Palm Springs
The most numerous immigrant groups reported in Palm Springs came from Latin America (3,682 | 8.2%), Central America (3,289 | 7.3%), Mexico (2,978 | 6.6%), Asia (1,913 | 4.3%), and Europe (1,386 | 3.1%), together accounting for 29.5% of all Palm Springs residents.
| Immigration Origin | # Population | % Population |
| Afghanistan | 12 | 0.0% |
| Africa | 275 | 0.6% |
| Argentina | 74 | 0.2% |
| Armenia | 5 | 0.0% |
| Asia | 1,913 | 4.3% |
| Australia | 42 | 0.1% |
| Austria | 44 | 0.1% |
| Barbados | 2 | 0.0% |
| Belgium | 8 | 0.0% |
| Bolivia | 6 | 0.0% |
| Bosnia and Herzegovina | 5 | 0.0% |
| Brazil | 42 | 0.1% |
| Bulgaria | 155 | 0.3% |
| Cambodia | 4 | 0.0% |
| Canada | 811 | 1.8% |
| Caribbean | 116 | 0.3% |
| Central America | 3,289 | 7.3% |
| Chile | 14 | 0.0% |
| China | 169 | 0.4% |
| Colombia | 15 | 0.0% |
| Congo | 26 | 0.1% |
| Croatia | 57 | 0.1% |
| Cuba | 67 | 0.2% |
| Czechoslovakia | 11 | 0.0% |
| Denmark | 23 | 0.1% |
| Eastern Africa | 95 | 0.2% |
| Eastern Asia | 318 | 0.7% |
| Eastern Europe | 420 | 0.9% |
| Ecuador | 11 | 0.0% |
| Egypt | 26 | 0.1% |
| El Salvador | 179 | 0.4% |
| England | 129 | 0.3% |
| Europe | 1,386 | 3.1% |
| France | 135 | 0.3% |
| Germany | 187 | 0.4% |
| Greece | 22 | 0.1% |
| Guatemala | 59 | 0.1% |
| Guyana | 6 | 0.0% |
| Honduras | 58 | 0.1% |
| Hong Kong | 40 | 0.1% |
| Hungary | 60 | 0.1% |
| India | 92 | 0.2% |
| Indonesia | 14 | 0.0% |
| Iran | 168 | 0.4% |
| Iraq | 11 | 0.0% |
| Ireland | 25 | 0.1% |
| Israel | 63 | 0.1% |
| Italy | 51 | 0.1% |
| Jamaica | 47 | 0.1% |
| Japan | 91 | 0.2% |
| Jordan | 4 | 0.0% |
| Korea | 58 | 0.1% |
| Laos | 4 | 0.0% |
| Latin America | 3,682 | 8.2% |
| Latvia | 3 | 0.0% |
| Lebanon | 26 | 0.1% |
| Malaysia | 97 | 0.2% |
| Mexico | 2,978 | 6.6% |
| Middle Africa | 26 | 0.1% |
| Morocco | 17 | 0.0% |
| Nepal | 12 | 0.0% |
| Netherlands | 34 | 0.1% |
| Nicaragua | 5 | 0.0% |
| Nigeria | 72 | 0.2% |
| Northern Africa | 52 | 0.1% |
| Northern Europe | 429 | 0.9% |
| Norway | 5 | 0.0% |
| Oceania | 64 | 0.1% |
| Panama | 10 | 0.0% |
| Peru | 60 | 0.1% |
| Philippines | 824 | 1.8% |
| Poland | 44 | 0.1% |
| Portugal | 3 | 0.0% |
| Romania | 44 | 0.1% |
| Russia | 6 | 0.0% |
| Scotland | 17 | 0.0% |
| Serbia | 27 | 0.1% |
| Singapore | 7 | 0.0% |
| South Africa | 30 | 0.1% |
| South America | 277 | 0.6% |
| South Central Asia | 287 | 0.6% |
| South Eastern Asia | 1,118 | 2.5% |
| Southern Europe | 108 | 0.2% |
| Spain | 32 | 0.1% |
| Sri Lanka | 3 | 0.0% |
| Sweden | 23 | 0.1% |
| Switzerland | 21 | 0.1% |
| Syria | 20 | 0.0% |
| Taiwan | 35 | 0.1% |
| Thailand | 84 | 0.2% |
| Turkey | 25 | 0.1% |
| Ukraine | 5 | 0.0% |
| Venezuela | 42 | 0.1% |
| Vietnam | 76 | 0.2% |
| Western Africa | 72 | 0.2% |
| Western Asia | 190 | 0.4% |
| Western Europe | 429 | 0.9% |
| Zimbabwe | 18 | 0.0% | View All 98 Rows |
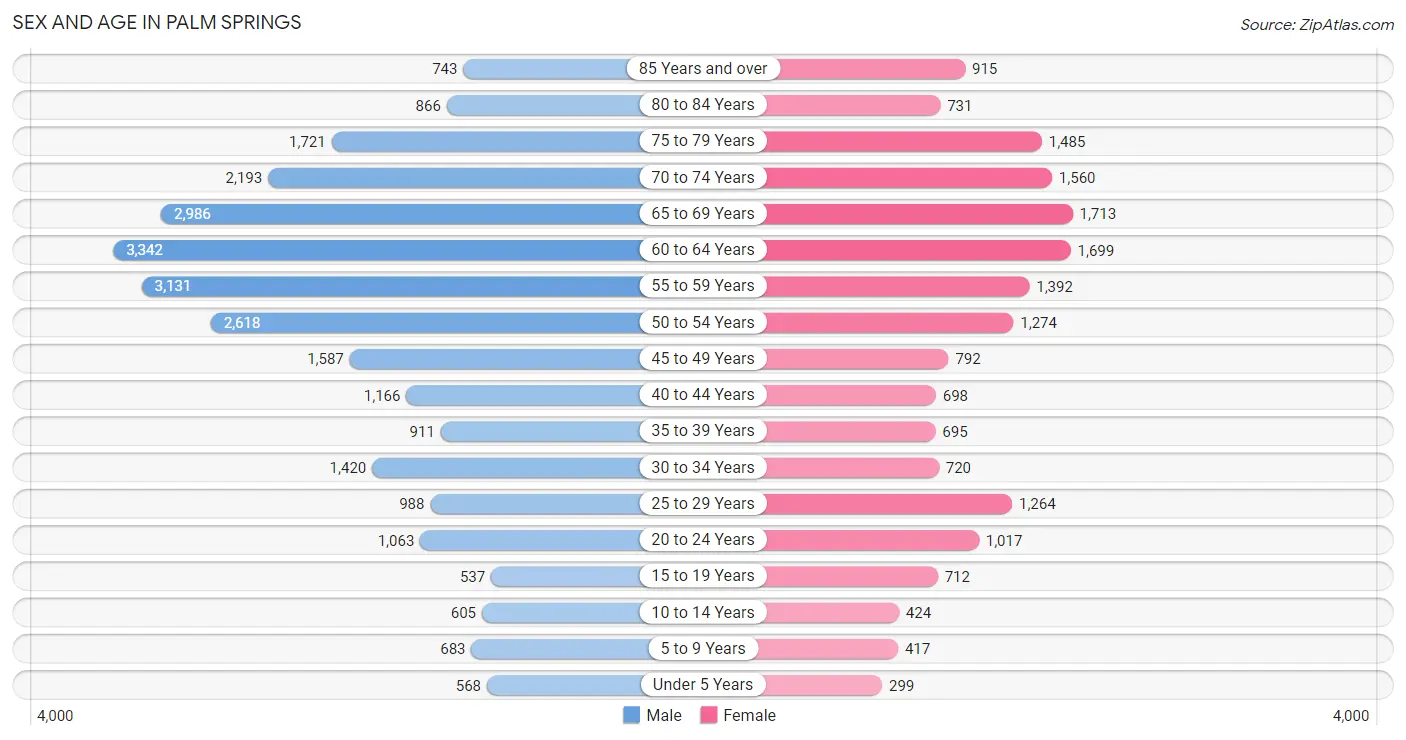
Sex and Age in Palm Springs
Sex and Age in Palm Springs
The most populous age groups in Palm Springs are 60 to 64 Years (3,342 | 12.3%) for men and 65 to 69 Years (1,713 | 9.6%) for women.
| Age Bracket | Male | Female |
| Under 5 Years | 568 (2.1%) | 299 (1.7%) |
| 5 to 9 Years | 683 (2.5%) | 417 (2.3%) |
| 10 to 14 Years | 605 (2.2%) | 424 (2.4%) |
| 15 to 19 Years | 537 (2.0%) | 712 (4.0%) |
| 20 to 24 Years | 1,063 (3.9%) | 1,017 (5.7%) |
| 25 to 29 Years | 988 (3.6%) | 1,264 (7.1%) |
| 30 to 34 Years | 1,420 (5.2%) | 720 (4.0%) |
| 35 to 39 Years | 911 (3.4%) | 695 (3.9%) |
| 40 to 44 Years | 1,166 (4.3%) | 698 (3.9%) |
| 45 to 49 Years | 1,587 (5.9%) | 792 (4.4%) |
| 50 to 54 Years | 2,618 (9.7%) | 1,274 (7.1%) |
| 55 to 59 Years | 3,131 (11.5%) | 1,392 (7.8%) |
| 60 to 64 Years | 3,342 (12.3%) | 1,699 (9.5%) |
| 65 to 69 Years | 2,986 (11.0%) | 1,713 (9.6%) |
| 70 to 74 Years | 2,193 (8.1%) | 1,560 (8.8%) |
| 75 to 79 Years | 1,721 (6.3%) | 1,485 (8.3%) |
| 80 to 84 Years | 866 (3.2%) | 731 (4.1%) |
| 85 Years and over | 743 (2.7%) | 915 (5.1%) |
| Total | 27,128 (100.0%) | 17,807 (100.0%) |
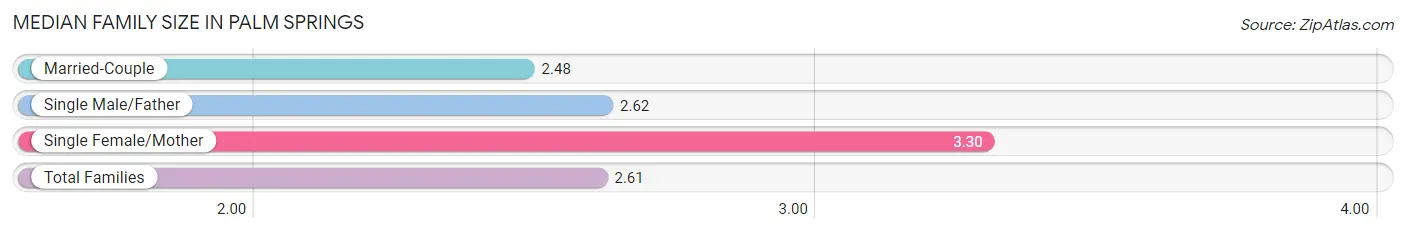
Families and Households in Palm Springs
Median Family Size in Palm Springs
The median family size in Palm Springs is 2.61 persons per family, with single female/mother families (1,437 | 14.4%) accounting for the largest median family size of 3.3 persons per family. On the other hand, married-couple families (7,767 | 78.1%) represent the smallest median family size with 2.48 persons per family.
| Family Type | # Families | Family Size |
| Married-Couple | 7,767 (78.1%) | 2.48 |
| Single Male/Father | 745 (7.5%) | 2.62 |
| Single Female/Mother | 1,437 (14.4%) | 3.30 |
| Total Families | 9,949 (100.0%) | 2.61 |
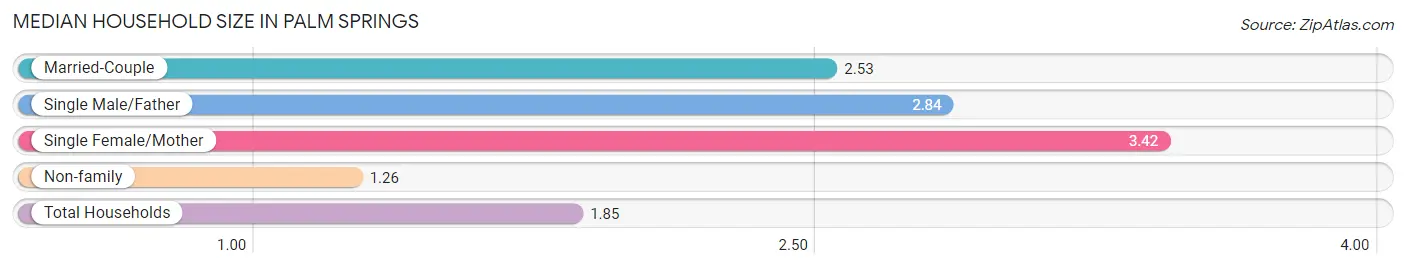
Median Household Size in Palm Springs
The median household size in Palm Springs is 1.85 persons per household, with single female/mother households (1,437 | 6.0%) accounting for the largest median household size of 3.42 persons per household. non-family households (13,940 | 58.4%) represent the smallest median household size with 1.26 persons per household.
| Household Type | # Households | Household Size |
| Married-Couple | 7,767 (32.5%) | 2.53 |
| Single Male/Father | 745 (3.1%) | 2.84 |
| Single Female/Mother | 1,437 (6.0%) | 3.42 |
| Non-family | 13,940 (58.4%) | 1.26 |
| Total Households | 23,889 (100.0%) | 1.85 |
Household Size by Marriage Status in Palm Springs
Out of a total of 23,889 households in Palm Springs, 9,949 (41.6%) are family households, while 13,940 (58.4%) are nonfamily households. The most numerous type of family households are 2-person households, comprising 6,967, and the most common type of nonfamily households are 1-person households, comprising 10,939.
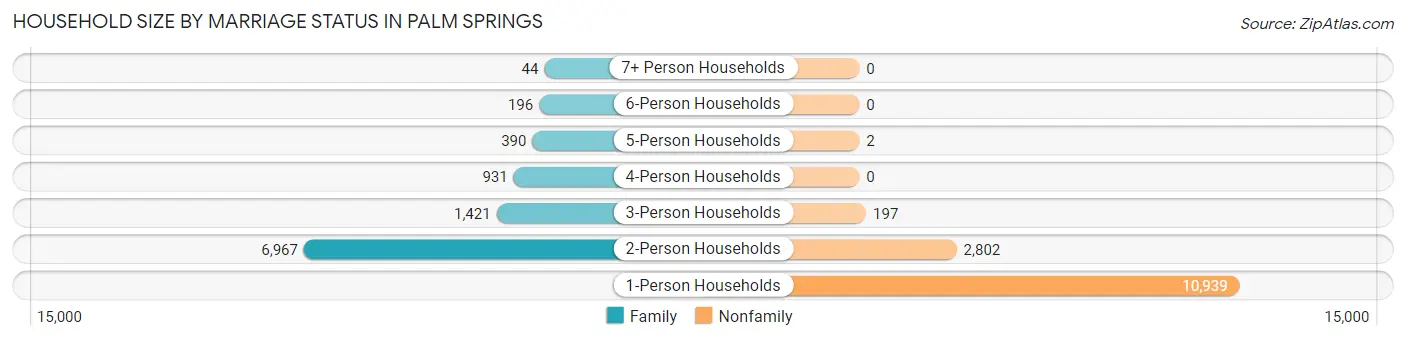
| Household Size | Family Households | Nonfamily Households |
| 1-Person Households | - | 10,939 (45.8%) |
| 2-Person Households | 6,967 (29.2%) | 2,802 (11.7%) |
| 3-Person Households | 1,421 (5.9%) | 197 (0.8%) |
| 4-Person Households | 931 (3.9%) | 0 (0.0%) |
| 5-Person Households | 390 (1.6%) | 2 (0.0%) |
| 6-Person Households | 196 (0.8%) | 0 (0.0%) |
| 7+ Person Households | 44 (0.2%) | 0 (0.0%) |
| Total | 9,949 (41.6%) | 13,940 (58.4%) |
Female Fertility in Palm Springs
Fertility by Age in Palm Springs
Average fertility rate in Palm Springs is 36.0 births per 1,000 women. Women in the age bracket of 20 to 34 years have the highest fertility rate with 60.0 births per 1,000 women. Women in the age bracket of 20 to 34 years acount for 81.5% of all women with births.
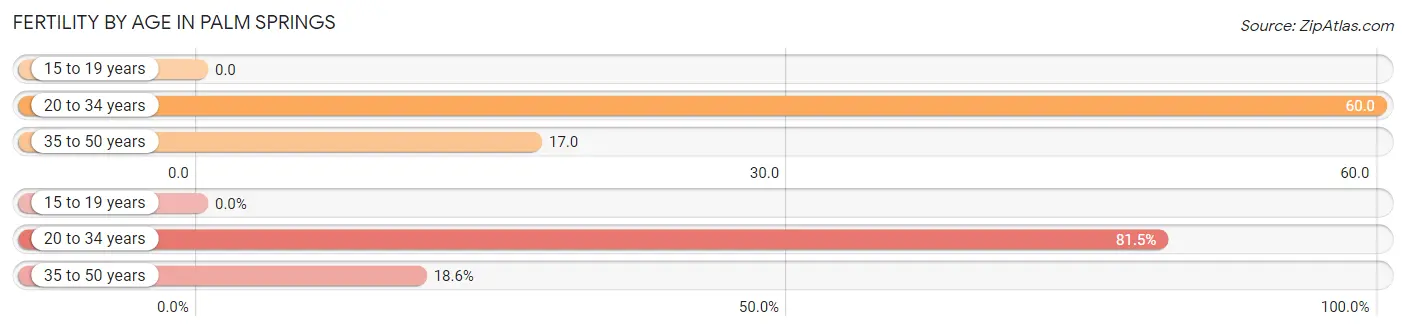
| Age Bracket | Women with Births | Births / 1,000 Women |
| 15 to 19 years | 0 (0.0%) | 0.0 |
| 20 to 34 years | 180 (81.5%) | 60.0 |
| 35 to 50 years | 41 (18.5%) | 17.0 |
| Total | 221 (100.0%) | 36.0 |
Fertility by Age by Marriage Status in Palm Springs
79.2% of women with births (221) in Palm Springs are married. The highest percentage of unmarried women with births falls into 20 to 34 years age bracket with 22.8% of them unmarried at the time of birth, while the lowest percentage of unmarried women with births belong to 35 to 50 years age bracket with 12.2% of them unmarried.
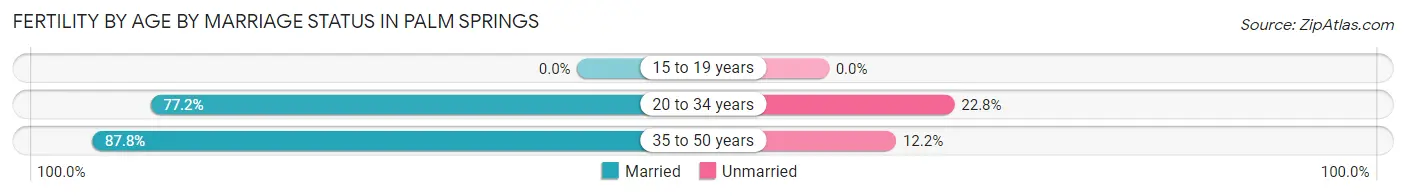
| Age Bracket | Married | Unmarried |
| 15 to 19 years | 0 (0.0%) | 0 (0.0%) |
| 20 to 34 years | 139 (77.2%) | 41 (22.8%) |
| 35 to 50 years | 36 (87.8%) | 5 (12.2%) |
| Total | 175 (79.2%) | 46 (20.8%) |
Fertility by Education in Palm Springs
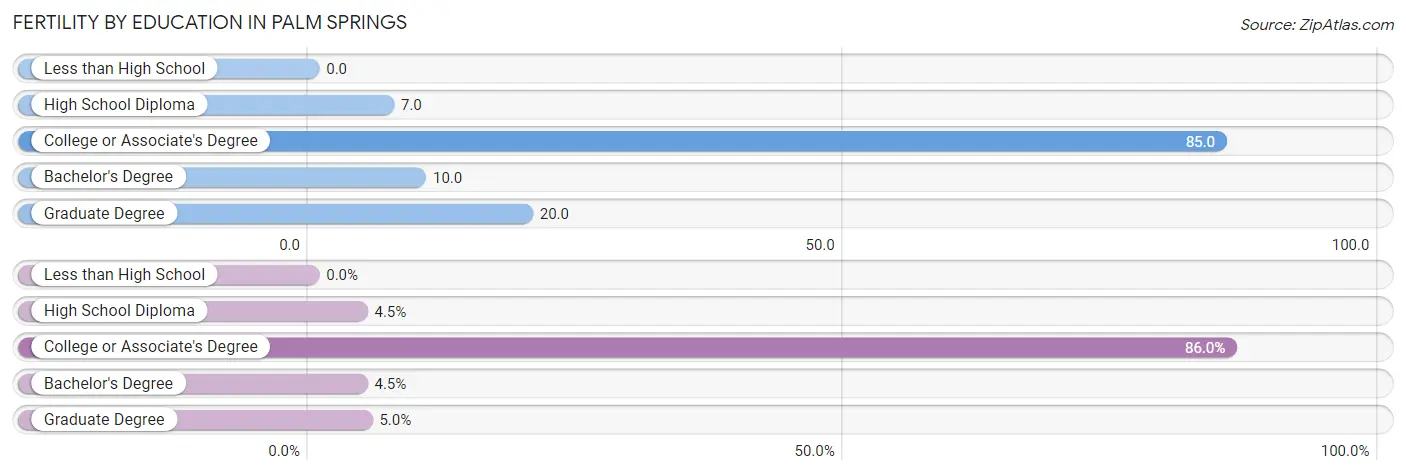
| Educational Attainment | Women with Births | Births / 1,000 Women |
| Less than High School | 0 (0.0%) | 0.0 |
| High School Diploma | 10 (4.5%) | 7.0 |
| College or Associate's Degree | 190 (86.0%) | 85.0 |
| Bachelor's Degree | 10 (4.5%) | 10.0 |
| Graduate Degree | 11 (5.0%) | 20.0 |
| Total | 221 (100.0%) | 36.0 |
Fertility by Education by Marriage Status in Palm Springs
20.8% of women with births in Palm Springs are unmarried. Women with the educational attainment of high school diploma are most likely to be married with 100.0% of them married at childbirth, while women with the educational attainment of college or associate's degree are least likely to be married with 24.2% of them unmarried at childbirth.
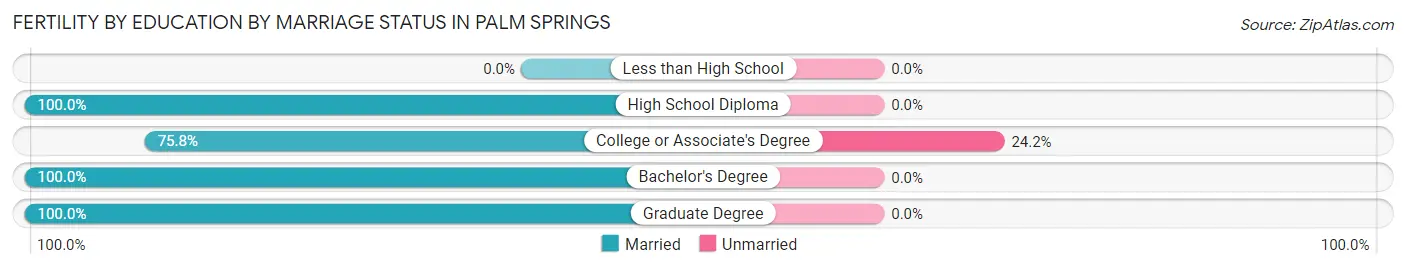
| Educational Attainment | Married | Unmarried |
| Less than High School | 0 (0.0%) | 0 (0.0%) |
| High School Diploma | 10 (100.0%) | 0 (0.0%) |
| College or Associate's Degree | 144 (75.8%) | 46 (24.2%) |
| Bachelor's Degree | 10 (100.0%) | 0 (0.0%) |
| Graduate Degree | 11 (100.0%) | 0 (0.0%) |
| Total | 175 (79.2%) | 46 (20.8%) |
Employment Characteristics in Palm Springs
Employment by Class of Employer in Palm Springs
Among the 18,777 employed individuals in Palm Springs, private company employees (11,814 | 62.9%), self-employed (not incorporated) (2,120 | 11.3%), and not-for-profit organizations (1,639 | 8.7%) make up the most common classes of employment.
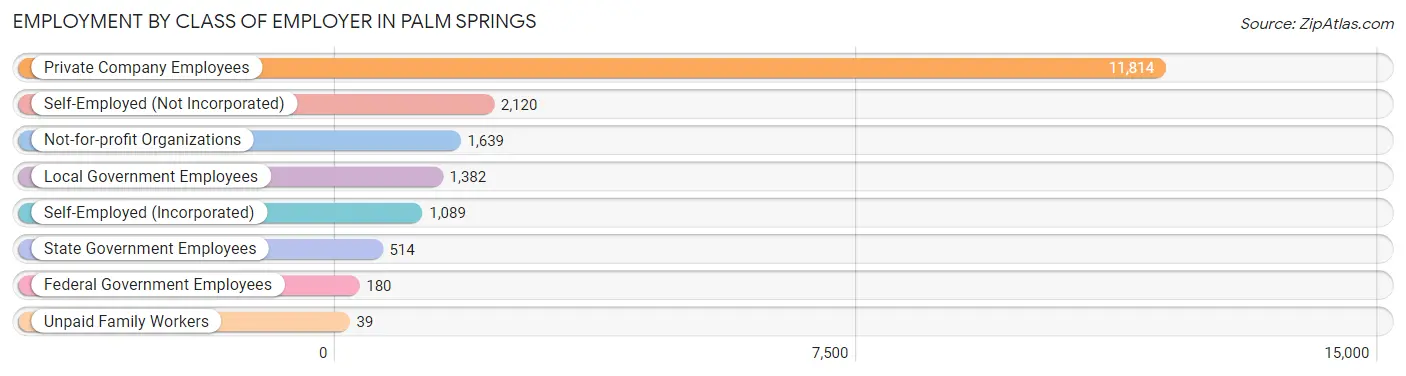
| Employer Class | # Employees | % Employees |
| Private Company Employees | 11,814 | 62.9% |
| Self-Employed (Incorporated) | 1,089 | 5.8% |
| Self-Employed (Not Incorporated) | 2,120 | 11.3% |
| Not-for-profit Organizations | 1,639 | 8.7% |
| Local Government Employees | 1,382 | 7.4% |
| State Government Employees | 514 | 2.7% |
| Federal Government Employees | 180 | 1.0% |
| Unpaid Family Workers | 39 | 0.2% |
| Total | 18,777 | 100.0% |
Employment Status by Age in Palm Springs
According to the labor force statistics for Palm Springs, out of the total population over 16 years of age (41,733), 50.0% or 20,866 individuals are in the labor force, with 8.6% or 1,794 of them unemployed. The age group with the highest labor force participation rate is 25 to 29 years, with 85.3% or 1,921 individuals in the labor force. Within the labor force, the 75 years and over age range has the highest percentage of unemployed individuals, with 18.4% or 124 of them being unemployed.
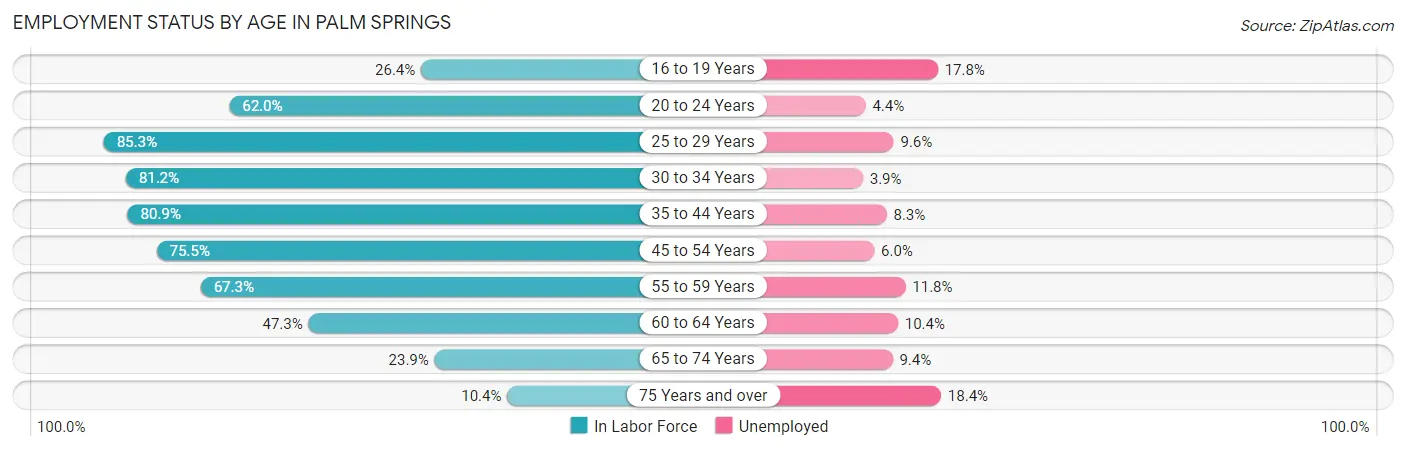
| Age Bracket | In Labor Force | Unemployed |
| 16 to 19 Years | 275 (26.4%) | 49 (17.8%) |
| 20 to 24 Years | 1,290 (62.0%) | 57 (4.4%) |
| 25 to 29 Years | 1,921 (85.3%) | 184 (9.6%) |
| 30 to 34 Years | 1,738 (81.2%) | 68 (3.9%) |
| 35 to 44 Years | 2,807 (80.9%) | 233 (8.3%) |
| 45 to 54 Years | 4,735 (75.5%) | 284 (6.0%) |
| 55 to 59 Years | 3,044 (67.3%) | 359 (11.8%) |
| 60 to 64 Years | 2,384 (47.3%) | 248 (10.4%) |
| 65 to 74 Years | 2,020 (23.9%) | 190 (9.4%) |
| 75 Years and over | 672 (10.4%) | 124 (18.4%) |
| Total | 20,866 (50.0%) | 1,794 (8.6%) |
Employment Status by Educational Attainment in Palm Springs
According to labor force statistics for Palm Springs, 70.2% of individuals (16,635) out of the total population between 25 and 64 years of age (23,697) are in the labor force, with 8.3% or 1,381 of them being unemployed. The group with the highest labor force participation rate are those with the educational attainment of bachelor's degree or higher, with 77.3% or 7,395 individuals in the labor force. Within the labor force, individuals with college / associate degree education have the highest percentage of unemployment, with 10.2% or 536 of them being unemployed.
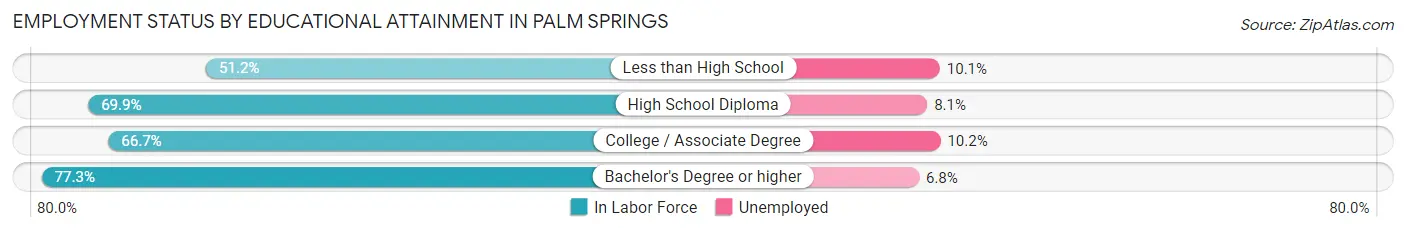
| Educational Attainment | In Labor Force | Unemployed |
| Less than High School | 1,066 (51.2%) | 210 (10.1%) |
| High School Diploma | 2,916 (69.9%) | 338 (8.1%) |
| College / Associate Degree | 5,255 (66.7%) | 804 (10.2%) |
| Bachelor's Degree or higher | 7,395 (77.3%) | 650 (6.8%) |
| Total | 16,635 (70.2%) | 1,967 (8.3%) |
Employment Occupations by Sex in Palm Springs
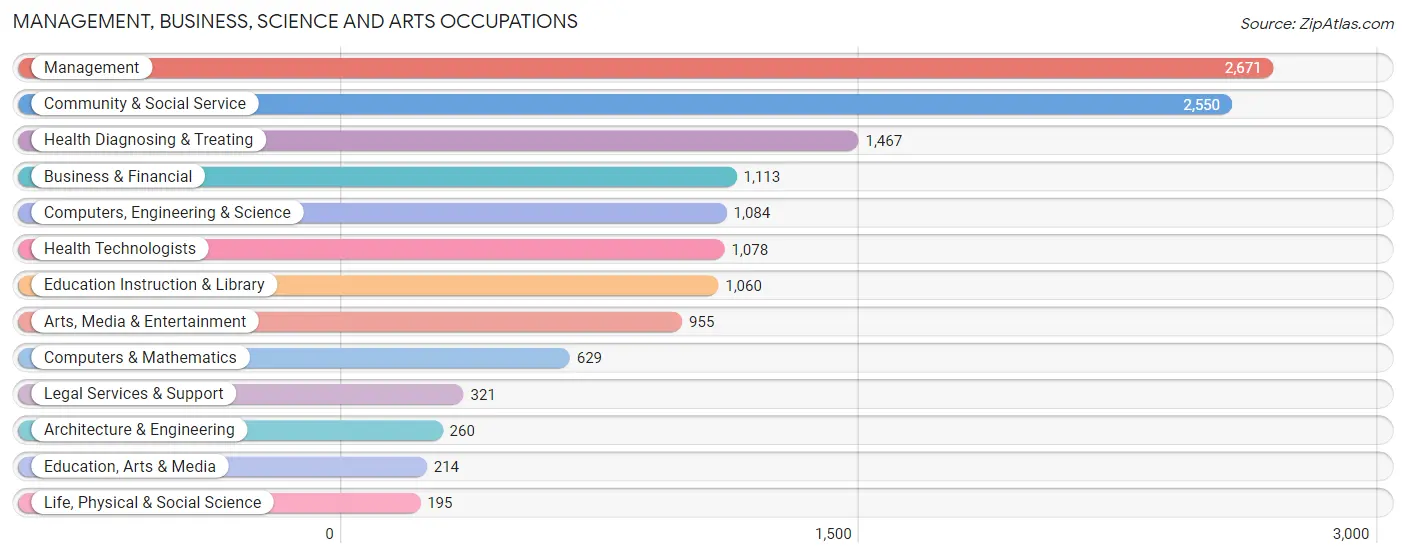
Management, Business, Science and Arts Occupations
The most common Management, Business, Science and Arts occupations in Palm Springs are Management (2,671 | 14.0%), Community & Social Service (2,550 | 13.4%), Health Diagnosing & Treating (1,467 | 7.7%), Business & Financial (1,113 | 5.8%), and Computers, Engineering & Science (1,084 | 5.7%).
Management, Business, Science and Arts Occupations by Sex
Within the Management, Business, Science and Arts occupations in Palm Springs, the most male-oriented occupations are Architecture & Engineering (83.5%), Computers & Mathematics (81.4%), and Computers, Engineering & Science (78.4%), while the most female-oriented occupations are Health Diagnosing & Treating (51.3%), Education Instruction & Library (51.1%), and Health Technologists (47.9%).
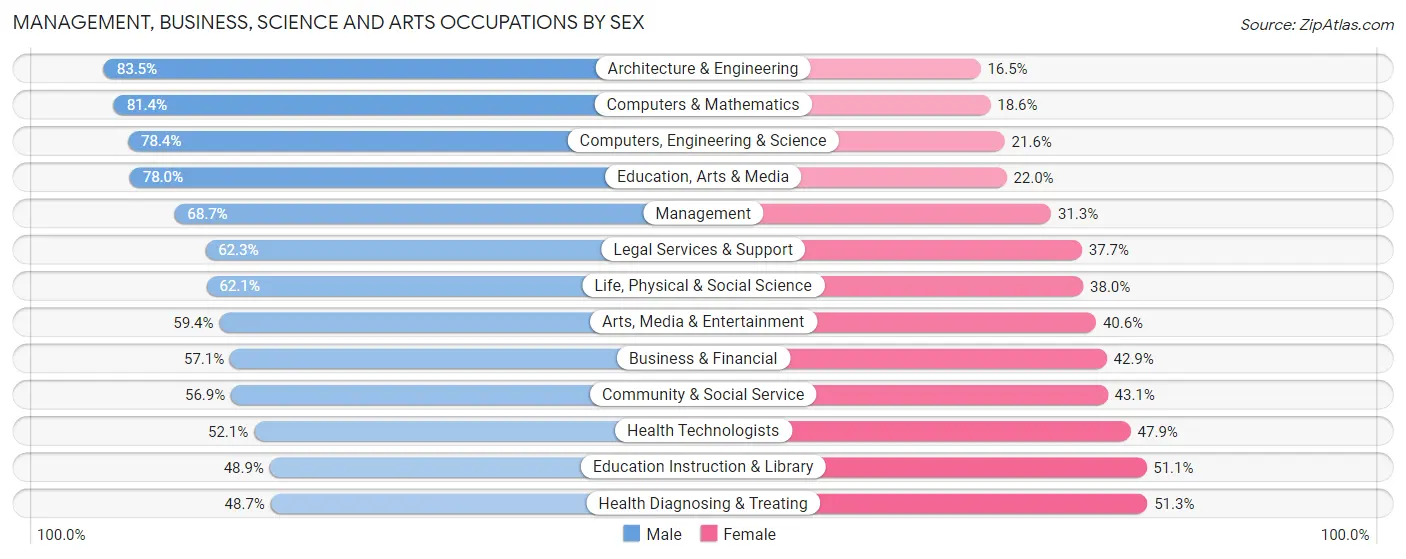
| Occupation | Male | Female |
| Management | 1,836 (68.7%) | 835 (31.3%) |
| Business & Financial | 636 (57.1%) | 477 (42.9%) |
| Computers, Engineering & Science | 850 (78.4%) | 234 (21.6%) |
| Computers & Mathematics | 512 (81.4%) | 117 (18.6%) |
| Architecture & Engineering | 217 (83.5%) | 43 (16.5%) |
| Life, Physical & Social Science | 121 (62.1%) | 74 (38.0%) |
| Community & Social Service | 1,452 (56.9%) | 1,098 (43.1%) |
| Education, Arts & Media | 167 (78.0%) | 47 (22.0%) |
| Legal Services & Support | 200 (62.3%) | 121 (37.7%) |
| Education Instruction & Library | 518 (48.9%) | 542 (51.1%) |
| Arts, Media & Entertainment | 567 (59.4%) | 388 (40.6%) |
| Health Diagnosing & Treating | 714 (48.7%) | 753 (51.3%) |
| Health Technologists | 562 (52.1%) | 516 (47.9%) |
| Total (Category) | 5,488 (61.8%) | 3,397 (38.2%) |
| Total (Overall) | 11,950 (62.6%) | 7,131 (37.4%) |
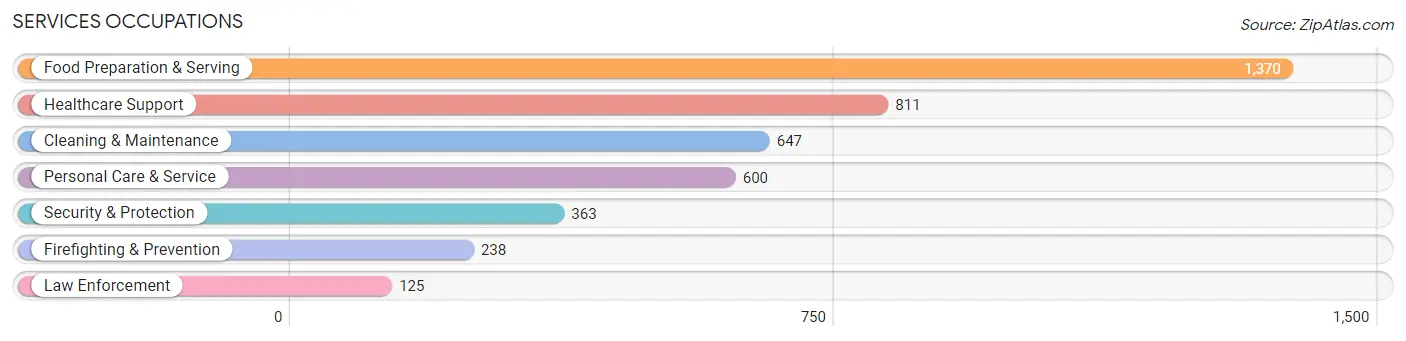
Services Occupations
The most common Services occupations in Palm Springs are Food Preparation & Serving (1,370 | 7.2%), Healthcare Support (811 | 4.3%), Cleaning & Maintenance (647 | 3.4%), Personal Care & Service (600 | 3.1%), and Security & Protection (363 | 1.9%).
Services Occupations by Sex
Within the Services occupations in Palm Springs, the most male-oriented occupations are Law Enforcement (90.4%), Security & Protection (84.6%), and Firefighting & Prevention (81.5%), while the most female-oriented occupations are Healthcare Support (57.1%), Personal Care & Service (52.0%), and Food Preparation & Serving (48.8%).
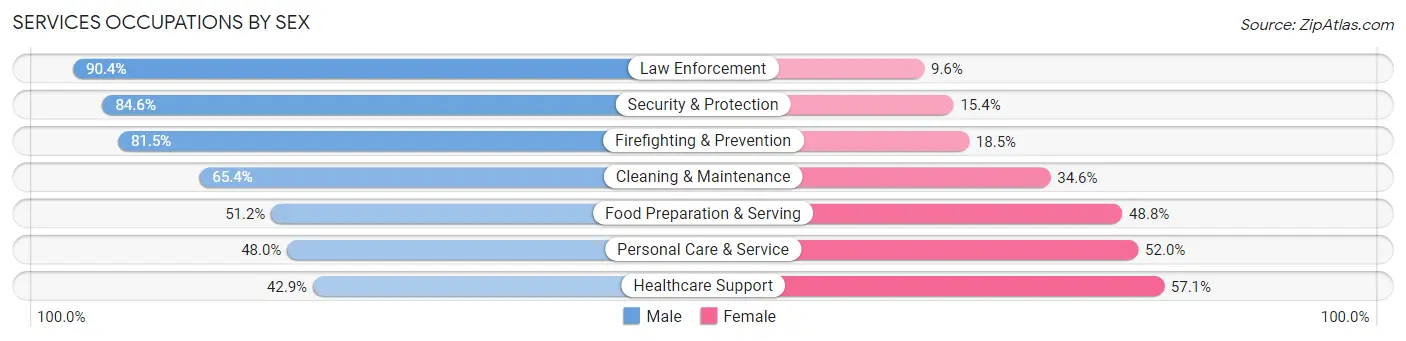
| Occupation | Male | Female |
| Healthcare Support | 348 (42.9%) | 463 (57.1%) |
| Security & Protection | 307 (84.6%) | 56 (15.4%) |
| Firefighting & Prevention | 194 (81.5%) | 44 (18.5%) |
| Law Enforcement | 113 (90.4%) | 12 (9.6%) |
| Food Preparation & Serving | 701 (51.2%) | 669 (48.8%) |
| Cleaning & Maintenance | 423 (65.4%) | 224 (34.6%) |
| Personal Care & Service | 288 (48.0%) | 312 (52.0%) |
| Total (Category) | 2,067 (54.5%) | 1,724 (45.5%) |
| Total (Overall) | 11,950 (62.6%) | 7,131 (37.4%) |
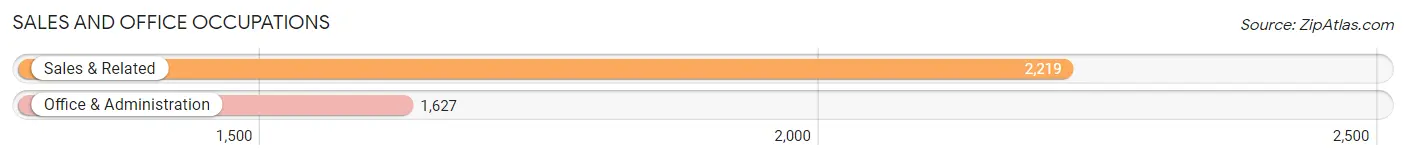
Sales and Office Occupations
The most common Sales and Office occupations in Palm Springs are Sales & Related (2,219 | 11.6%), and Office & Administration (1,627 | 8.5%).
Sales and Office Occupations by Sex
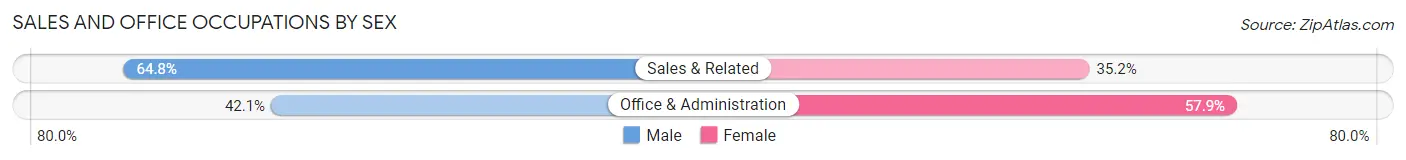
| Occupation | Male | Female |
| Sales & Related | 1,437 (64.8%) | 782 (35.2%) |
| Office & Administration | 685 (42.1%) | 942 (57.9%) |
| Total (Category) | 2,122 (55.2%) | 1,724 (44.8%) |
| Total (Overall) | 11,950 (62.6%) | 7,131 (37.4%) |
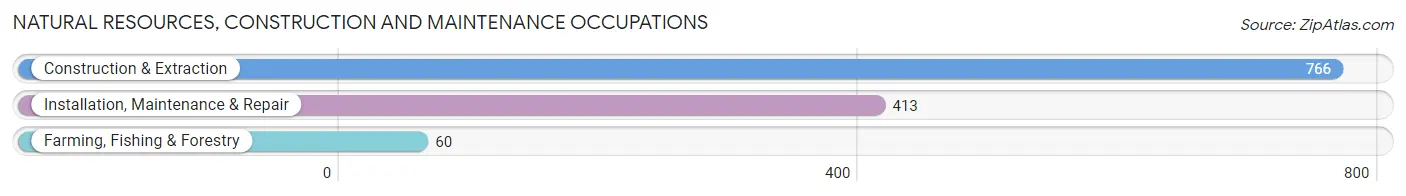
Natural Resources, Construction and Maintenance Occupations
The most common Natural Resources, Construction and Maintenance occupations in Palm Springs are Construction & Extraction (766 | 4.0%), Installation, Maintenance & Repair (413 | 2.2%), and Farming, Fishing & Forestry (60 | 0.3%).
Natural Resources, Construction and Maintenance Occupations by Sex
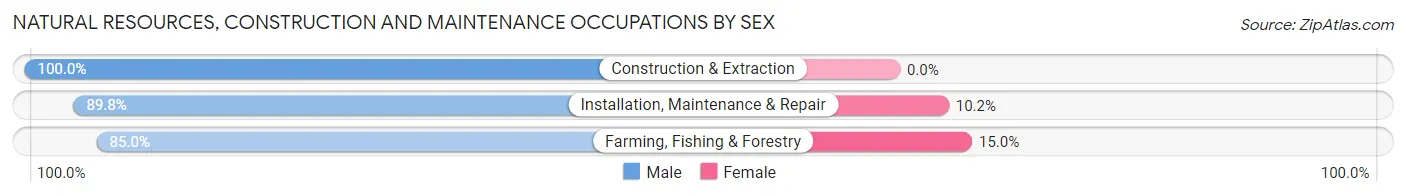
| Occupation | Male | Female |
| Farming, Fishing & Forestry | 51 (85.0%) | 9 (15.0%) |
| Construction & Extraction | 766 (100.0%) | 0 (0.0%) |
| Installation, Maintenance & Repair | 371 (89.8%) | 42 (10.2%) |
| Total (Category) | 1,188 (95.9%) | 51 (4.1%) |
| Total (Overall) | 11,950 (62.6%) | 7,131 (37.4%) |
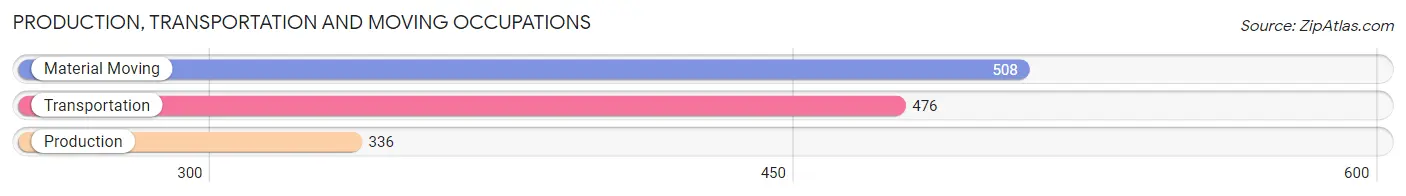
Production, Transportation and Moving Occupations
The most common Production, Transportation and Moving occupations in Palm Springs are Material Moving (508 | 2.7%), Transportation (476 | 2.5%), and Production (336 | 1.8%).
Production, Transportation and Moving Occupations by Sex
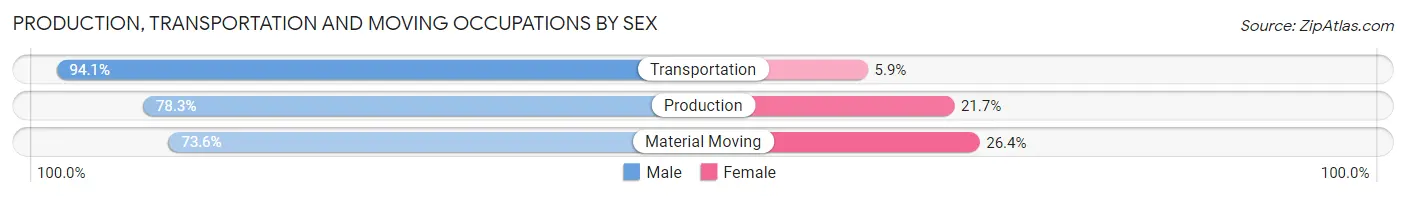
| Occupation | Male | Female |
| Production | 263 (78.3%) | 73 (21.7%) |
| Transportation | 448 (94.1%) | 28 (5.9%) |
| Material Moving | 374 (73.6%) | 134 (26.4%) |
| Total (Category) | 1,085 (82.2%) | 235 (17.8%) |
| Total (Overall) | 11,950 (62.6%) | 7,131 (37.4%) |
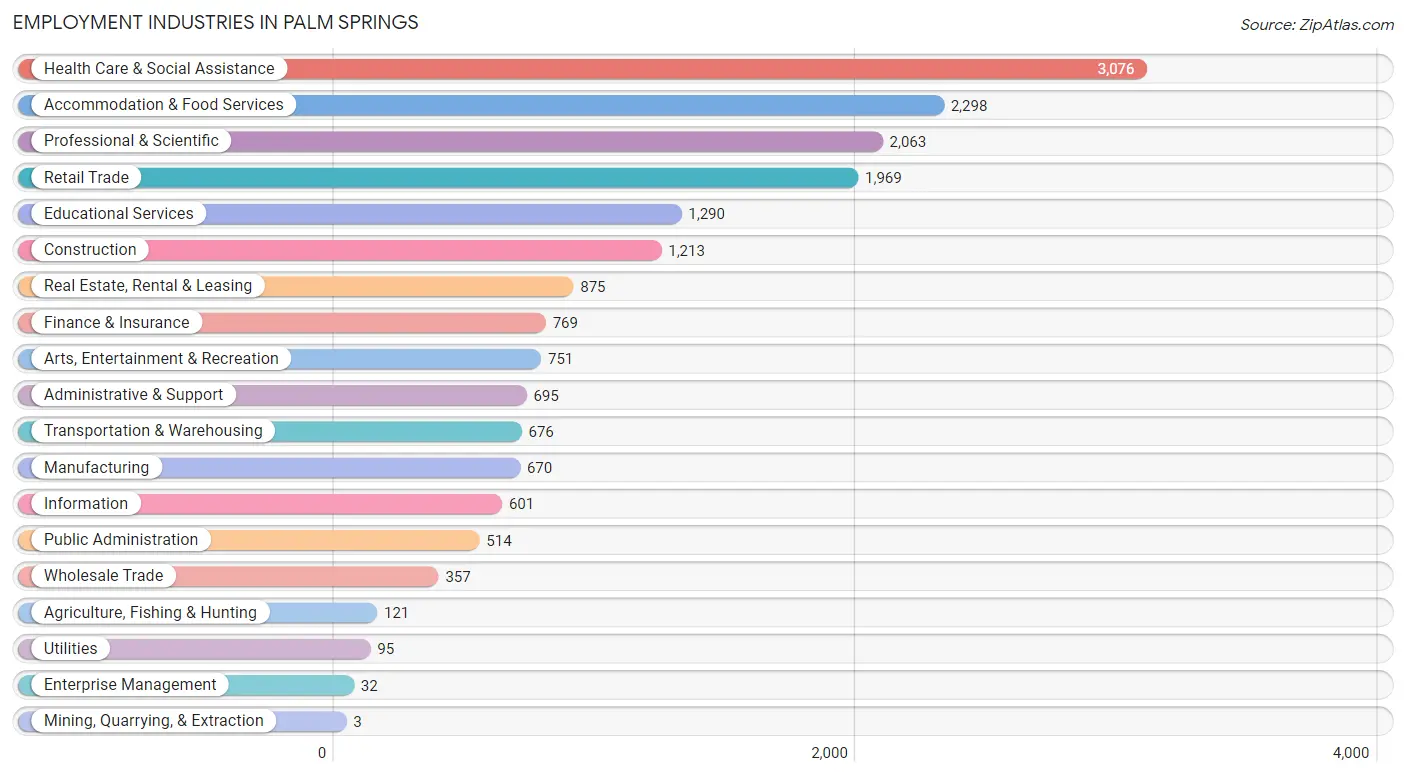
Employment Industries by Sex in Palm Springs
Employment Industries in Palm Springs
The major employment industries in Palm Springs include Health Care & Social Assistance (3,076 | 16.1%), Accommodation & Food Services (2,298 | 12.0%), Professional & Scientific (2,063 | 10.8%), Retail Trade (1,969 | 10.3%), and Educational Services (1,290 | 6.8%).
Employment Industries by Sex in Palm Springs
The Palm Springs industries that see more men than women are Mining, Quarrying, & Extraction (100.0%), Construction (92.3%), and Administrative & Support (80.3%), whereas the industries that tend to have a higher number of women are Public Administration (51.2%), Information (50.6%), and Educational Services (48.4%).
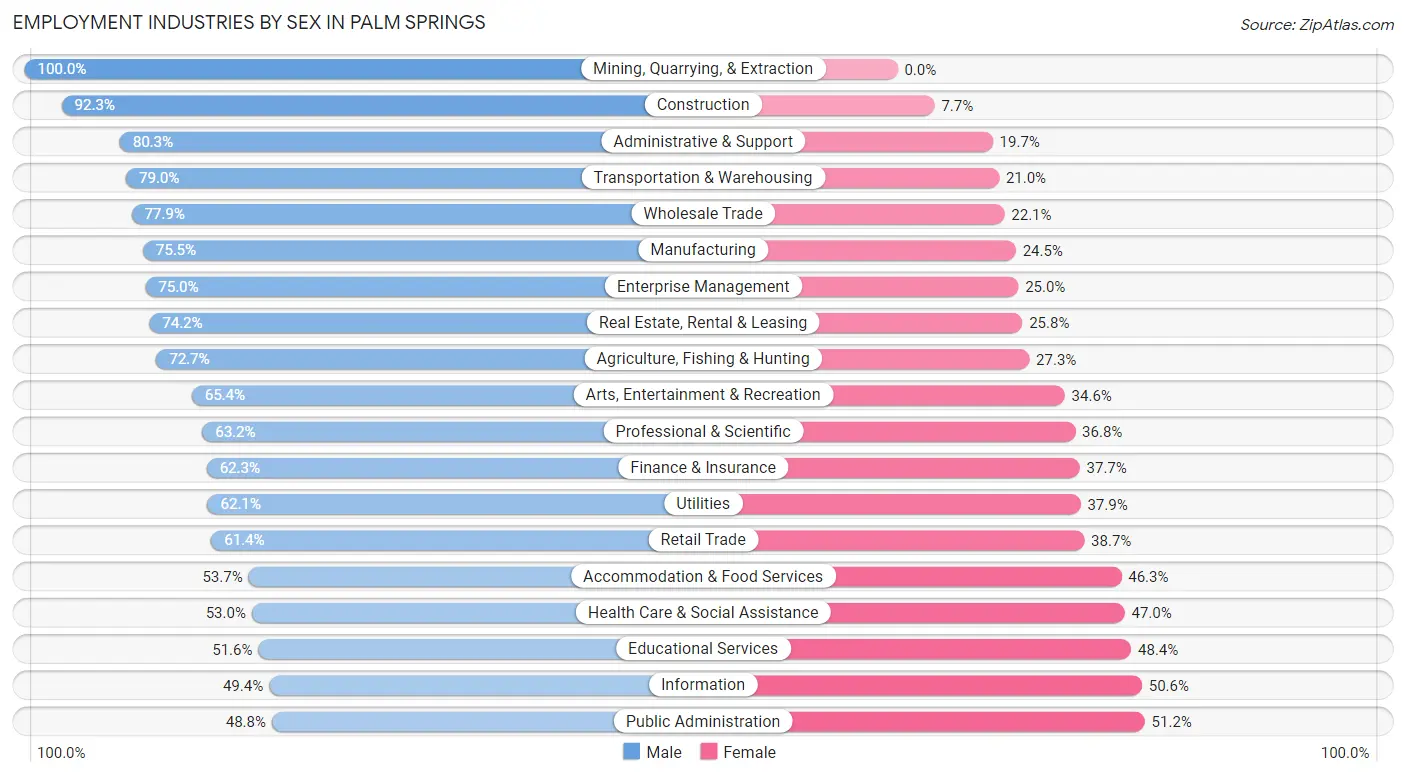
| Industry | Male | Female |
| Agriculture, Fishing & Hunting | 88 (72.7%) | 33 (27.3%) |
| Mining, Quarrying, & Extraction | 3 (100.0%) | 0 (0.0%) |
| Construction | 1,120 (92.3%) | 93 (7.7%) |
| Manufacturing | 506 (75.5%) | 164 (24.5%) |
| Wholesale Trade | 278 (77.9%) | 79 (22.1%) |
| Retail Trade | 1,208 (61.4%) | 761 (38.7%) |
| Transportation & Warehousing | 534 (79.0%) | 142 (21.0%) |
| Utilities | 59 (62.1%) | 36 (37.9%) |
| Information | 297 (49.4%) | 304 (50.6%) |
| Finance & Insurance | 479 (62.3%) | 290 (37.7%) |
| Real Estate, Rental & Leasing | 649 (74.2%) | 226 (25.8%) |
| Professional & Scientific | 1,304 (63.2%) | 759 (36.8%) |
| Enterprise Management | 24 (75.0%) | 8 (25.0%) |
| Administrative & Support | 558 (80.3%) | 137 (19.7%) |
| Educational Services | 666 (51.6%) | 624 (48.4%) |
| Health Care & Social Assistance | 1,630 (53.0%) | 1,446 (47.0%) |
| Arts, Entertainment & Recreation | 491 (65.4%) | 260 (34.6%) |
| Accommodation & Food Services | 1,233 (53.7%) | 1,065 (46.3%) |
| Public Administration | 251 (48.8%) | 263 (51.2%) |
| Total | 11,950 (62.6%) | 7,131 (37.4%) |
Education in Palm Springs
School Enrollment in Palm Springs
The most common levels of schooling among the 4,975 students in Palm Springs are college / undergraduate (1,790 | 36.0%), high school (1,018 | 20.5%), and middle school (868 | 17.4%).
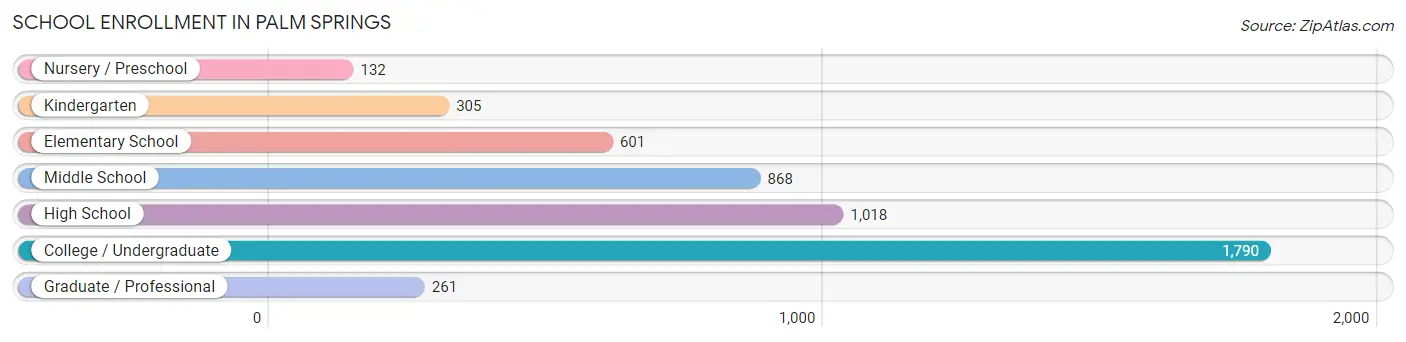
| School Level | # Students | % Students |
| Nursery / Preschool | 132 | 2.6% |
| Kindergarten | 305 | 6.1% |
| Elementary School | 601 | 12.1% |
| Middle School | 868 | 17.4% |
| High School | 1,018 | 20.5% |
| College / Undergraduate | 1,790 | 36.0% |
| Graduate / Professional | 261 | 5.2% |
| Total | 4,975 | 100.0% |
School Enrollment by Age by Funding Source in Palm Springs
Out of a total of 4,975 students who are enrolled in schools in Palm Springs, 562 (11.3%) attend a private institution, while the remaining 4,413 (88.7%) are enrolled in public schools. The age group of 35 years and over has the highest likelihood of being enrolled in private schools, with 144 (23.7% in the age bracket) enrolled. Conversely, the age group of 18 to 19 year olds has the lowest likelihood of being enrolled in a private school, with 344 (94.3% in the age bracket) attending a public institution.
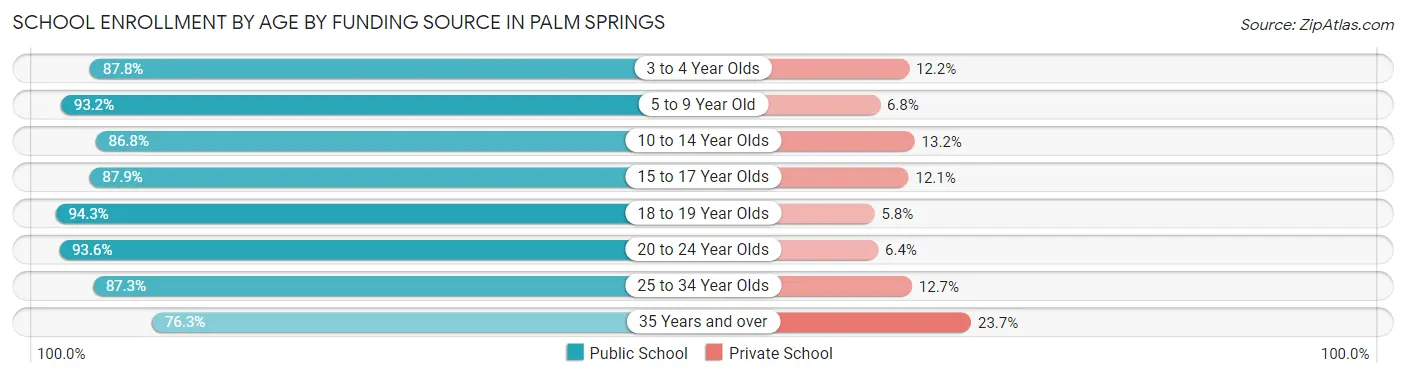
| Age Bracket | Public School | Private School |
| 3 to 4 Year Olds | 101 (87.8%) | 14 (12.2%) |
| 5 to 9 Year Old | 883 (93.2%) | 64 (6.8%) |
| 10 to 14 Year Olds | 853 (86.8%) | 130 (13.2%) |
| 15 to 17 Year Olds | 524 (87.9%) | 72 (12.1%) |
| 18 to 19 Year Olds | 344 (94.3%) | 21 (5.8%) |
| 20 to 24 Year Olds | 818 (93.6%) | 56 (6.4%) |
| 25 to 34 Year Olds | 426 (87.3%) | 62 (12.7%) |
| 35 Years and over | 463 (76.3%) | 144 (23.7%) |
| Total | 4,413 (88.7%) | 562 (11.3%) |
Educational Attainment by Field of Study in Palm Springs
Business (3,286 | 17.4%), social sciences (2,038 | 10.8%), science & technology (1,729 | 9.2%), education (1,505 | 8.0%), and visual & performing arts (1,503 | 8.0%) are the most common fields of study among 18,873 individuals in Palm Springs who have obtained a bachelor's degree or higher.
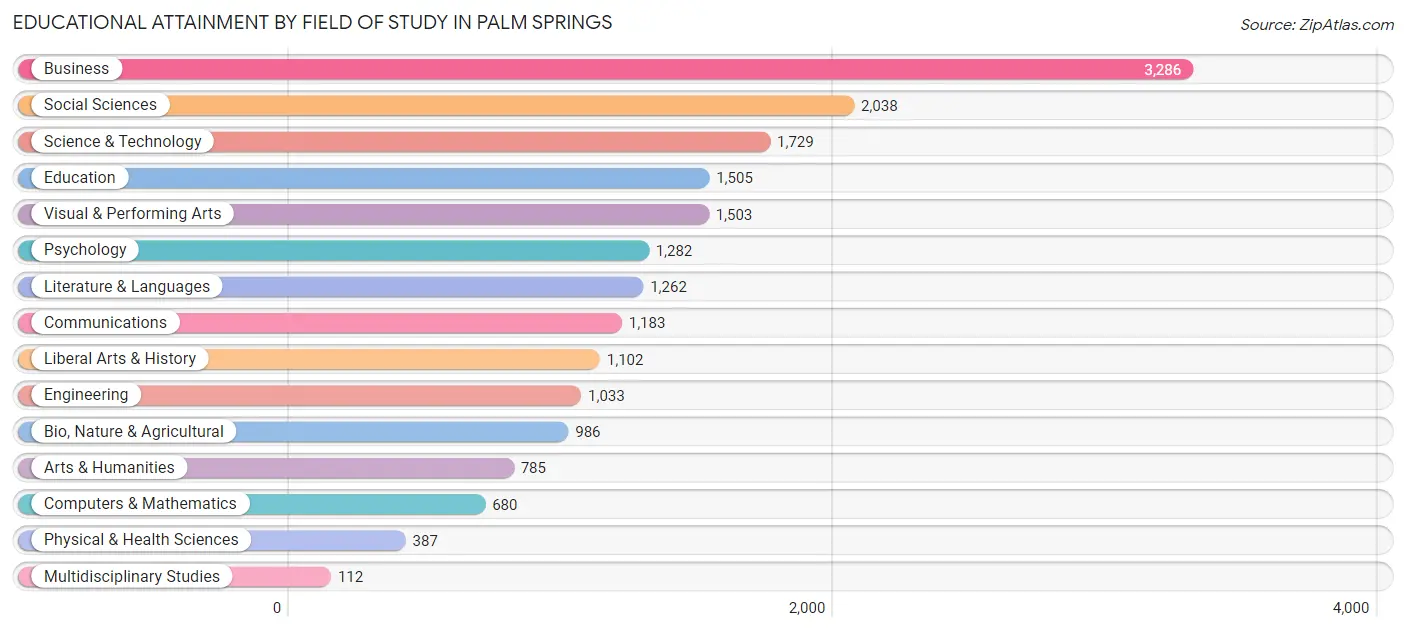
| Field of Study | # Graduates | % Graduates |
| Computers & Mathematics | 680 | 3.6% |
| Bio, Nature & Agricultural | 986 | 5.2% |
| Physical & Health Sciences | 387 | 2.1% |
| Psychology | 1,282 | 6.8% |
| Social Sciences | 2,038 | 10.8% |
| Engineering | 1,033 | 5.5% |
| Multidisciplinary Studies | 112 | 0.6% |
| Science & Technology | 1,729 | 9.2% |
| Business | 3,286 | 17.4% |
| Education | 1,505 | 8.0% |
| Literature & Languages | 1,262 | 6.7% |
| Liberal Arts & History | 1,102 | 5.8% |
| Visual & Performing Arts | 1,503 | 8.0% |
| Communications | 1,183 | 6.3% |
| Arts & Humanities | 785 | 4.2% |
| Total | 18,873 | 100.0% |
Transportation & Commute in Palm Springs
Vehicle Availability by Sex in Palm Springs
The most prevalent vehicle ownership categories in Palm Springs are males with 2 vehicles (5,288, accounting for 45.0%) and females with 2 vehicles (2,837, making up 76.4%).
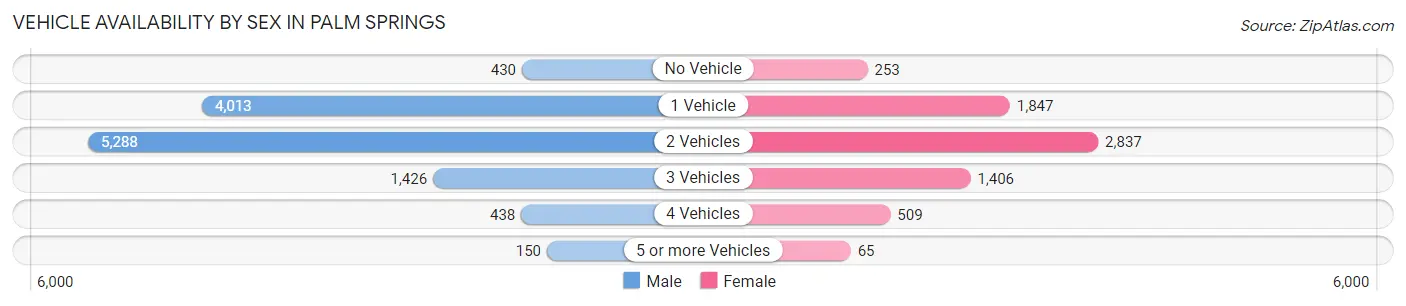
| Vehicles Available | Male | Female |
| No Vehicle | 430 (3.7%) | 253 (3.7%) |
| 1 Vehicle | 4,013 (34.2%) | 1,847 (26.7%) |
| 2 Vehicles | 5,288 (45.0%) | 2,837 (41.0%) |
| 3 Vehicles | 1,426 (12.1%) | 1,406 (20.3%) |
| 4 Vehicles | 438 (3.7%) | 509 (7.4%) |
| 5 or more Vehicles | 150 (1.3%) | 65 (0.9%) |
| Total | 11,745 (100.0%) | 6,917 (100.0%) |
Commute Time in Palm Springs
The most frequently occuring commute durations in Palm Springs are 10 to 14 minutes (3,030 commuters, 21.0%), 5 to 9 minutes (2,714 commuters, 18.8%), and 20 to 24 minutes (1,804 commuters, 12.5%).
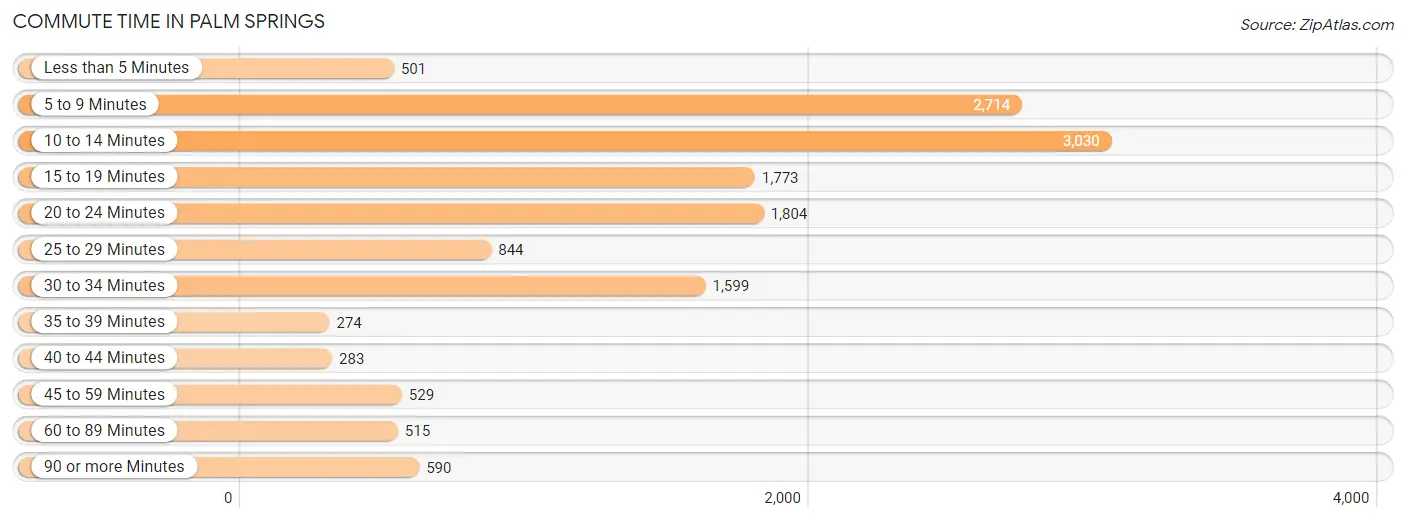
| Commute Time | # Commuters | % Commuters |
| Less than 5 Minutes | 501 | 3.5% |
| 5 to 9 Minutes | 2,714 | 18.8% |
| 10 to 14 Minutes | 3,030 | 21.0% |
| 15 to 19 Minutes | 1,773 | 12.3% |
| 20 to 24 Minutes | 1,804 | 12.5% |
| 25 to 29 Minutes | 844 | 5.8% |
| 30 to 34 Minutes | 1,599 | 11.1% |
| 35 to 39 Minutes | 274 | 1.9% |
| 40 to 44 Minutes | 283 | 2.0% |
| 45 to 59 Minutes | 529 | 3.7% |
| 60 to 89 Minutes | 515 | 3.6% |
| 90 or more Minutes | 590 | 4.1% |
Commute Time by Sex in Palm Springs
The most common commute times in Palm Springs are 10 to 14 minutes (1,718 commuters, 18.9%) for males and 10 to 14 minutes (1,312 commuters, 24.4%) for females.
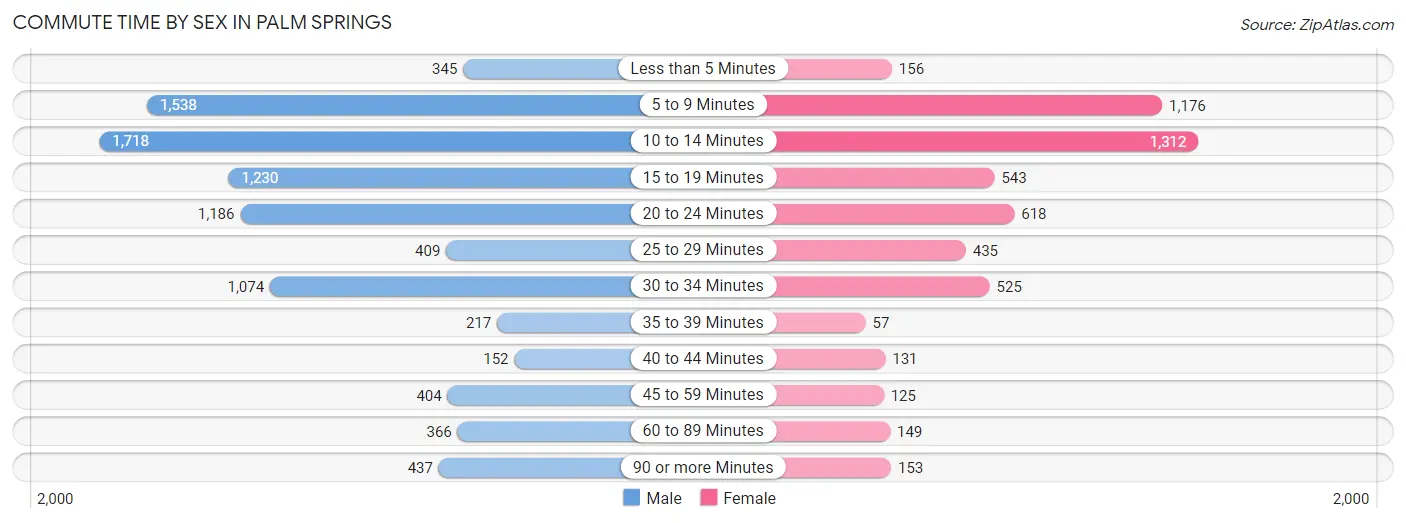
| Commute Time | Male | Female |
| Less than 5 Minutes | 345 (3.8%) | 156 (2.9%) |
| 5 to 9 Minutes | 1,538 (17.0%) | 1,176 (21.9%) |
| 10 to 14 Minutes | 1,718 (18.9%) | 1,312 (24.4%) |
| 15 to 19 Minutes | 1,230 (13.6%) | 543 (10.1%) |
| 20 to 24 Minutes | 1,186 (13.1%) | 618 (11.5%) |
| 25 to 29 Minutes | 409 (4.5%) | 435 (8.1%) |
| 30 to 34 Minutes | 1,074 (11.8%) | 525 (9.8%) |
| 35 to 39 Minutes | 217 (2.4%) | 57 (1.1%) |
| 40 to 44 Minutes | 152 (1.7%) | 131 (2.4%) |
| 45 to 59 Minutes | 404 (4.4%) | 125 (2.3%) |
| 60 to 89 Minutes | 366 (4.0%) | 149 (2.8%) |
| 90 or more Minutes | 437 (4.8%) | 153 (2.8%) |
Time of Departure to Work by Sex in Palm Springs
The most frequent times of departure to work in Palm Springs are 8:00 AM to 8:29 AM (1,441, 15.9%) for males and 8:00 AM to 8:29 AM (916, 17.0%) for females.
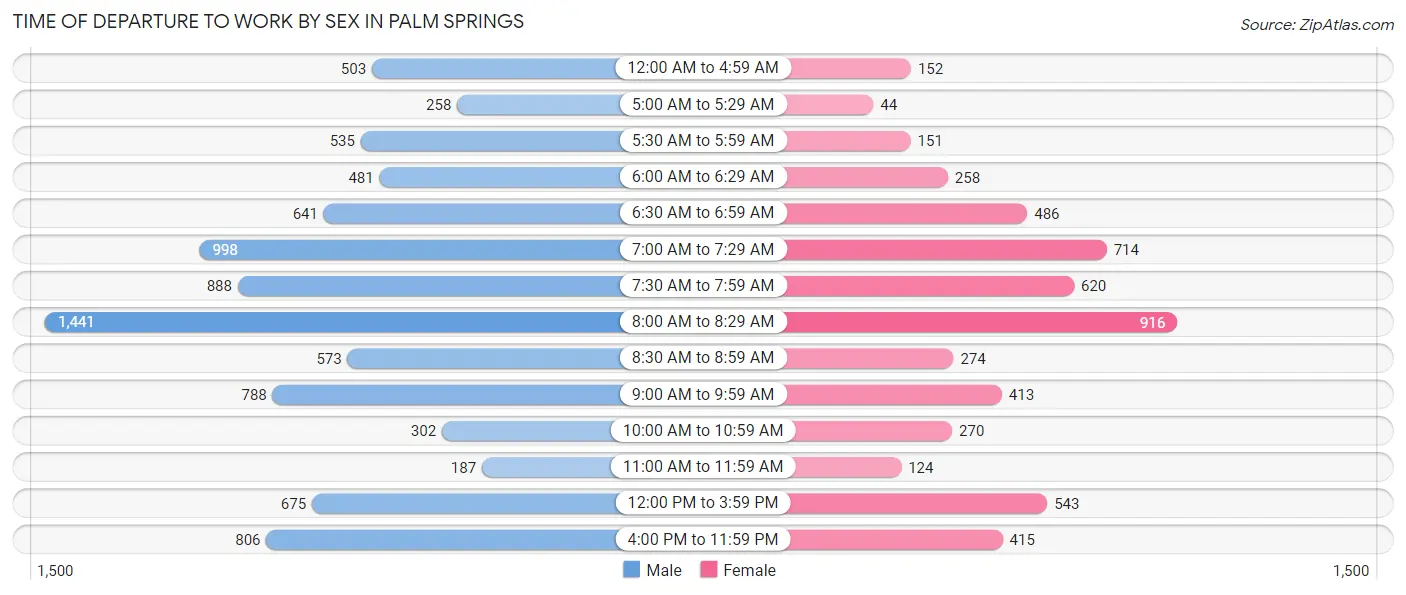
| Time of Departure | Male | Female |
| 12:00 AM to 4:59 AM | 503 (5.5%) | 152 (2.8%) |
| 5:00 AM to 5:29 AM | 258 (2.8%) | 44 (0.8%) |
| 5:30 AM to 5:59 AM | 535 (5.9%) | 151 (2.8%) |
| 6:00 AM to 6:29 AM | 481 (5.3%) | 258 (4.8%) |
| 6:30 AM to 6:59 AM | 641 (7.1%) | 486 (9.0%) |
| 7:00 AM to 7:29 AM | 998 (11.0%) | 714 (13.3%) |
| 7:30 AM to 7:59 AM | 888 (9.8%) | 620 (11.5%) |
| 8:00 AM to 8:29 AM | 1,441 (15.9%) | 916 (17.0%) |
| 8:30 AM to 8:59 AM | 573 (6.3%) | 274 (5.1%) |
| 9:00 AM to 9:59 AM | 788 (8.7%) | 413 (7.7%) |
| 10:00 AM to 10:59 AM | 302 (3.3%) | 270 (5.0%) |
| 11:00 AM to 11:59 AM | 187 (2.1%) | 124 (2.3%) |
| 12:00 PM to 3:59 PM | 675 (7.4%) | 543 (10.1%) |
| 4:00 PM to 11:59 PM | 806 (8.9%) | 415 (7.7%) |
| Total | 9,076 (100.0%) | 5,380 (100.0%) |
Housing Occupancy in Palm Springs
Occupancy by Ownership in Palm Springs
Of the total 23,889 dwellings in Palm Springs, owner-occupied units account for 15,457 (64.7%), while renter-occupied units make up 8,432 (35.3%).
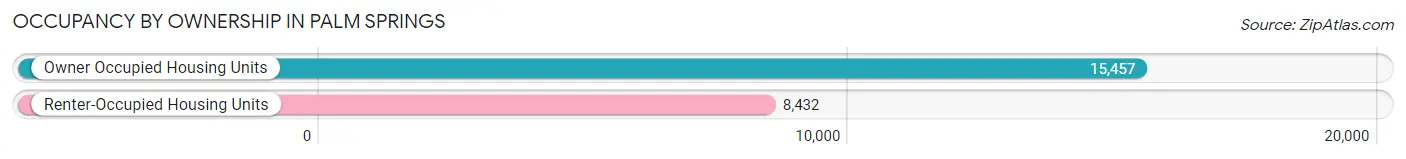
| Occupancy | # Housing Units | % Housing Units |
| Owner Occupied Housing Units | 15,457 | 64.7% |
| Renter-Occupied Housing Units | 8,432 | 35.3% |
| Total Occupied Housing Units | 23,889 | 100.0% |
Occupancy by Household Size in Palm Springs
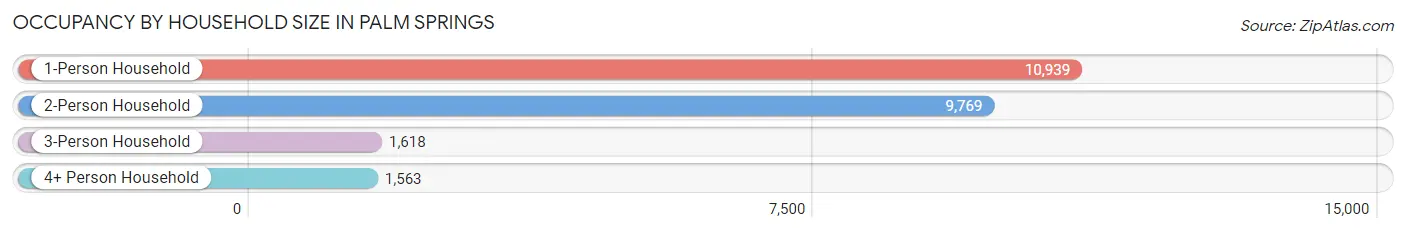
| Household Size | # Housing Units | % Housing Units |
| 1-Person Household | 10,939 | 45.8% |
| 2-Person Household | 9,769 | 40.9% |
| 3-Person Household | 1,618 | 6.8% |
| 4+ Person Household | 1,563 | 6.5% |
| Total Housing Units | 23,889 | 100.0% |
Occupancy by Ownership by Household Size in Palm Springs
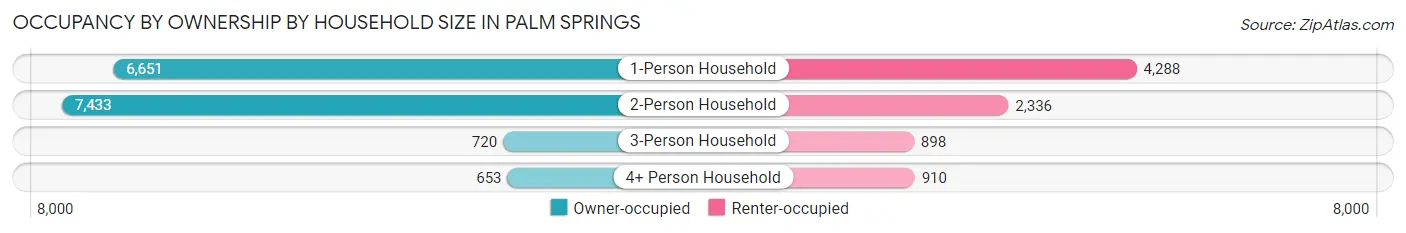
| Household Size | Owner-occupied | Renter-occupied |
| 1-Person Household | 6,651 (60.8%) | 4,288 (39.2%) |
| 2-Person Household | 7,433 (76.1%) | 2,336 (23.9%) |
| 3-Person Household | 720 (44.5%) | 898 (55.5%) |
| 4+ Person Household | 653 (41.8%) | 910 (58.2%) |
| Total Housing Units | 15,457 (64.7%) | 8,432 (35.3%) |
Occupancy by Educational Attainment in Palm Springs
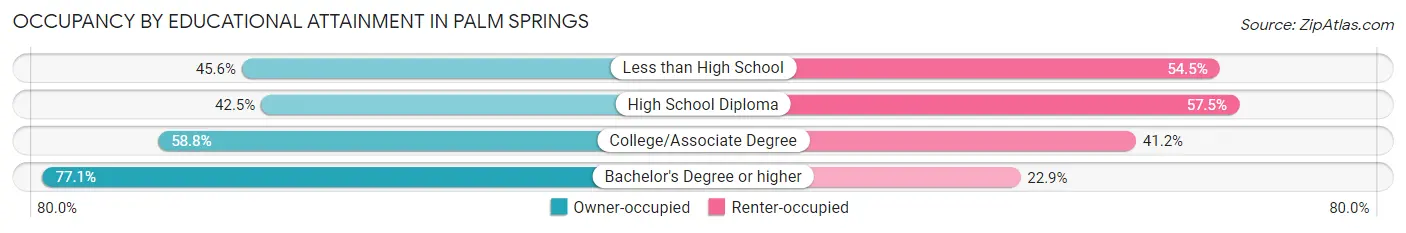
| Household Size | Owner-occupied | Renter-occupied |
| Less than High School | 593 (45.6%) | 709 (54.4%) |
| High School Diploma | 1,346 (42.5%) | 1,822 (57.5%) |
| College/Associate Degree | 4,681 (58.8%) | 3,280 (41.2%) |
| Bachelor's Degree or higher | 8,837 (77.1%) | 2,621 (22.9%) |
Occupancy by Age of Householder in Palm Springs
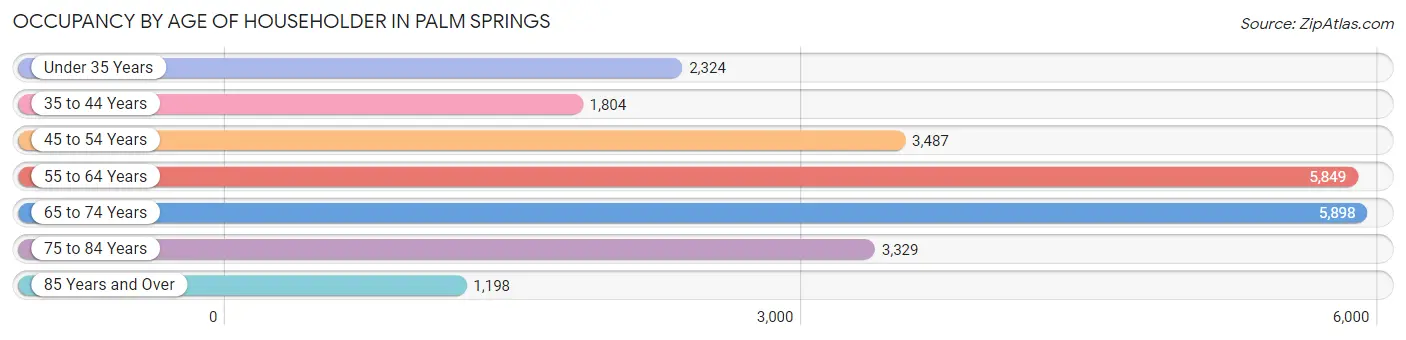
| Age Bracket | # Households | % Households |
| Under 35 Years | 2,324 | 9.7% |
| 35 to 44 Years | 1,804 | 7.5% |
| 45 to 54 Years | 3,487 | 14.6% |
| 55 to 64 Years | 5,849 | 24.5% |
| 65 to 74 Years | 5,898 | 24.7% |
| 75 to 84 Years | 3,329 | 13.9% |
| 85 Years and Over | 1,198 | 5.0% |
| Total | 23,889 | 100.0% |
Housing Finances in Palm Springs
Median Income by Occupancy in Palm Springs
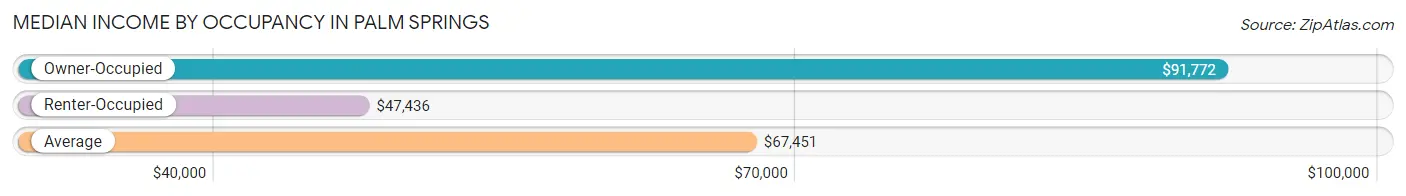
| Occupancy Type | # Households | Median Income |
| Owner-Occupied | 15,457 (64.7%) | $91,772 |
| Renter-Occupied | 8,432 (35.3%) | $47,436 |
| Average | 23,889 (100.0%) | $67,451 |
Occupancy by Householder Income Bracket in Palm Springs
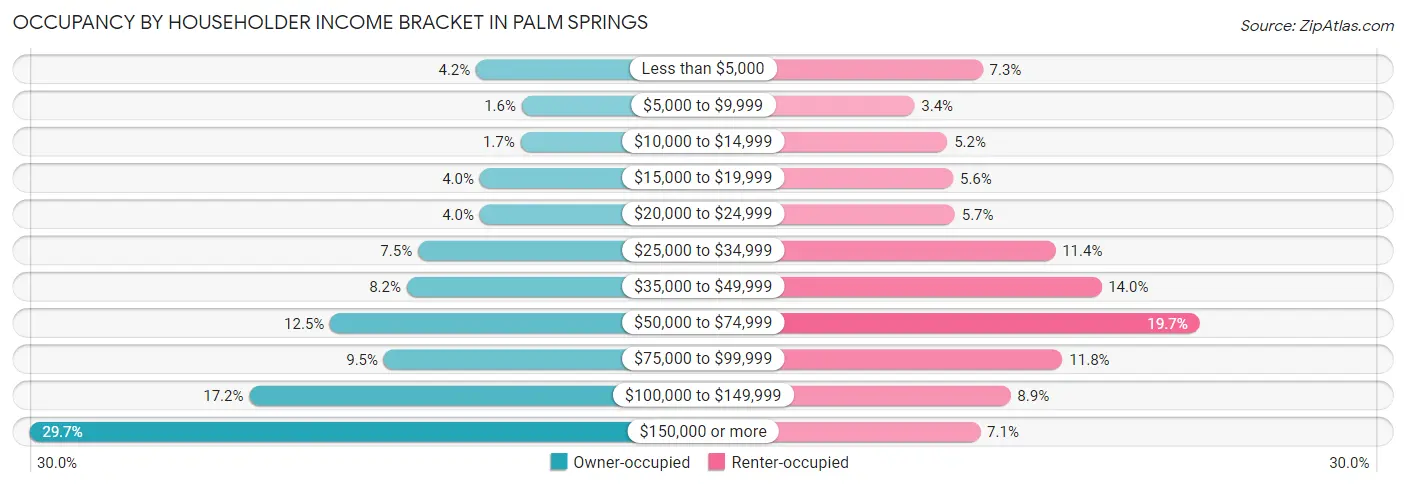
| Income Bracket | Owner-occupied | Renter-occupied |
| Less than $5,000 | 649 (4.2%) | 612 (7.3%) |
| $5,000 to $9,999 | 246 (1.6%) | 283 (3.4%) |
| $10,000 to $14,999 | 256 (1.7%) | 442 (5.2%) |
| $15,000 to $19,999 | 617 (4.0%) | 470 (5.6%) |
| $20,000 to $24,999 | 616 (4.0%) | 478 (5.7%) |
| $25,000 to $34,999 | 1,162 (7.5%) | 962 (11.4%) |
| $35,000 to $49,999 | 1,261 (8.2%) | 1,184 (14.0%) |
| $50,000 to $74,999 | 1,938 (12.5%) | 1,658 (19.7%) |
| $75,000 to $99,999 | 1,464 (9.5%) | 997 (11.8%) |
| $100,000 to $149,999 | 2,652 (17.2%) | 746 (8.8%) |
| $150,000 or more | 4,596 (29.7%) | 600 (7.1%) |
| Total | 15,457 (100.0%) | 8,432 (100.0%) |
Monthly Housing Cost Tiers in Palm Springs
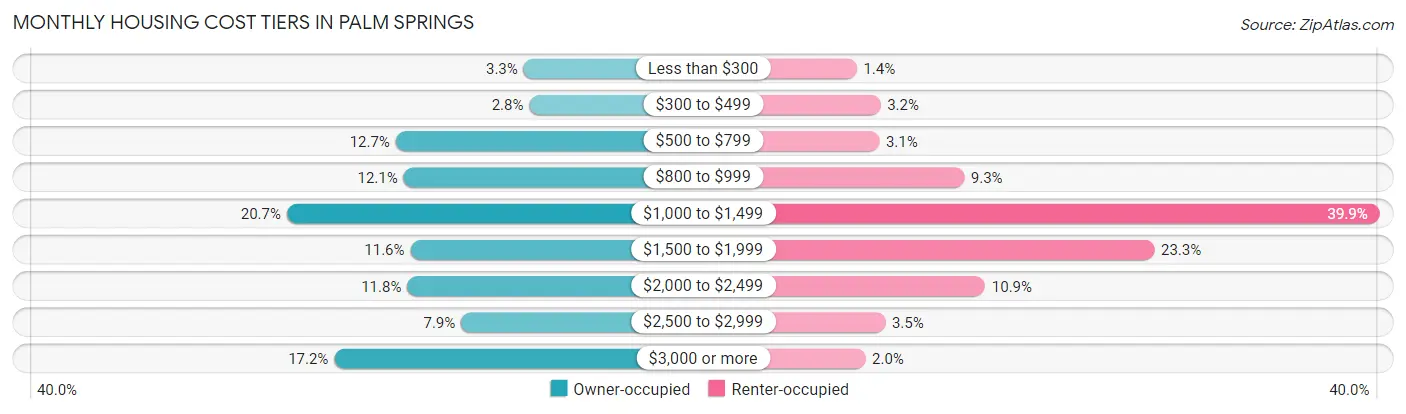
| Monthly Cost | Owner-occupied | Renter-occupied |
| Less than $300 | 503 (3.3%) | 118 (1.4%) |
| $300 to $499 | 438 (2.8%) | 266 (3.2%) |
| $500 to $799 | 1,959 (12.7%) | 258 (3.1%) |
| $800 to $999 | 1,868 (12.1%) | 785 (9.3%) |
| $1,000 to $1,499 | 3,198 (20.7%) | 3,367 (39.9%) |
| $1,500 to $1,999 | 1,791 (11.6%) | 1,966 (23.3%) |
| $2,000 to $2,499 | 1,827 (11.8%) | 916 (10.9%) |
| $2,500 to $2,999 | 1,214 (7.9%) | 295 (3.5%) |
| $3,000 or more | 2,659 (17.2%) | 172 (2.0%) |
| Total | 15,457 (100.0%) | 8,432 (100.0%) |
Physical Housing Characteristics in Palm Springs
Housing Structures in Palm Springs
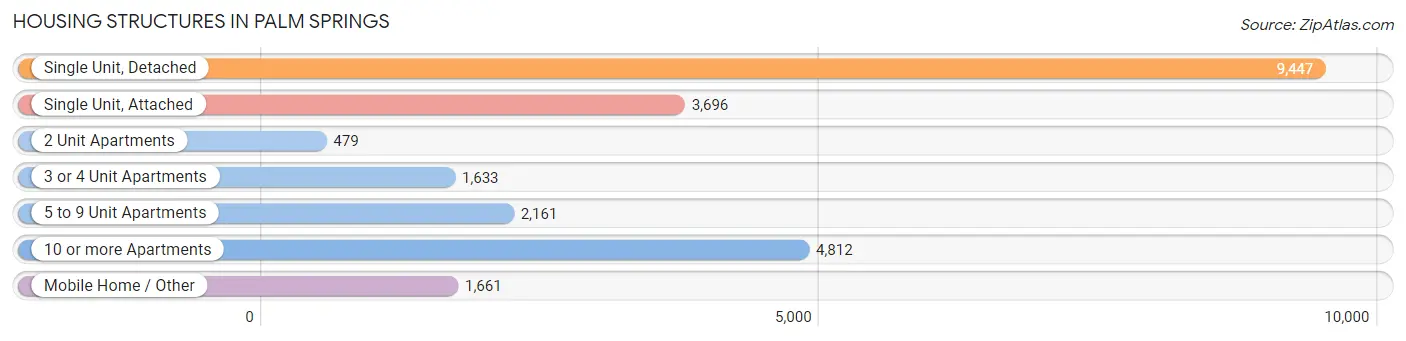
| Structure Type | # Housing Units | % Housing Units |
| Single Unit, Detached | 9,447 | 39.6% |
| Single Unit, Attached | 3,696 | 15.5% |
| 2 Unit Apartments | 479 | 2.0% |
| 3 or 4 Unit Apartments | 1,633 | 6.8% |
| 5 to 9 Unit Apartments | 2,161 | 9.0% |
| 10 or more Apartments | 4,812 | 20.1% |
| Mobile Home / Other | 1,661 | 7.0% |
| Total | 23,889 | 100.0% |
Housing Structures by Occupancy in Palm Springs
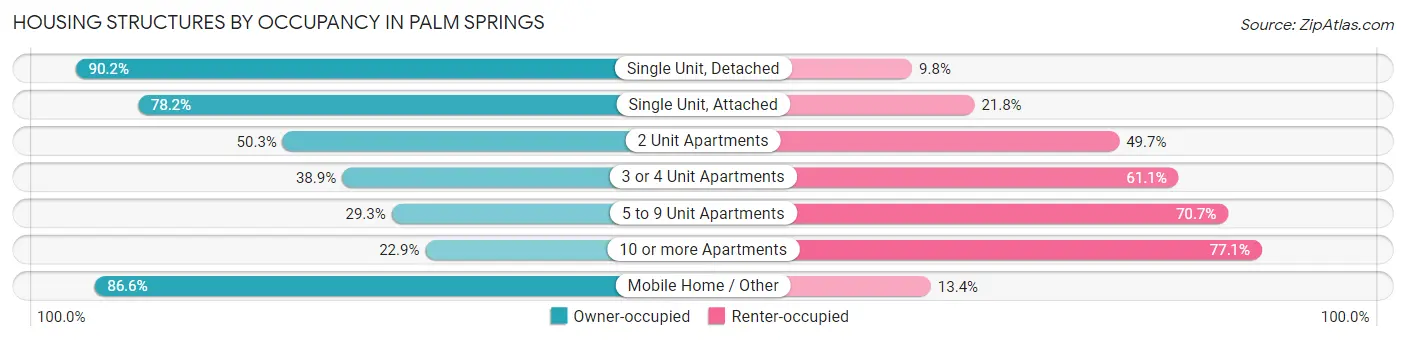
| Structure Type | Owner-occupied | Renter-occupied |
| Single Unit, Detached | 8,519 (90.2%) | 928 (9.8%) |
| Single Unit, Attached | 2,890 (78.2%) | 806 (21.8%) |
| 2 Unit Apartments | 241 (50.3%) | 238 (49.7%) |
| 3 or 4 Unit Apartments | 635 (38.9%) | 998 (61.1%) |
| 5 to 9 Unit Apartments | 634 (29.3%) | 1,527 (70.7%) |
| 10 or more Apartments | 1,100 (22.9%) | 3,712 (77.1%) |
| Mobile Home / Other | 1,438 (86.6%) | 223 (13.4%) |
| Total | 15,457 (64.7%) | 8,432 (35.3%) |
Housing Structures by Number of Rooms in Palm Springs
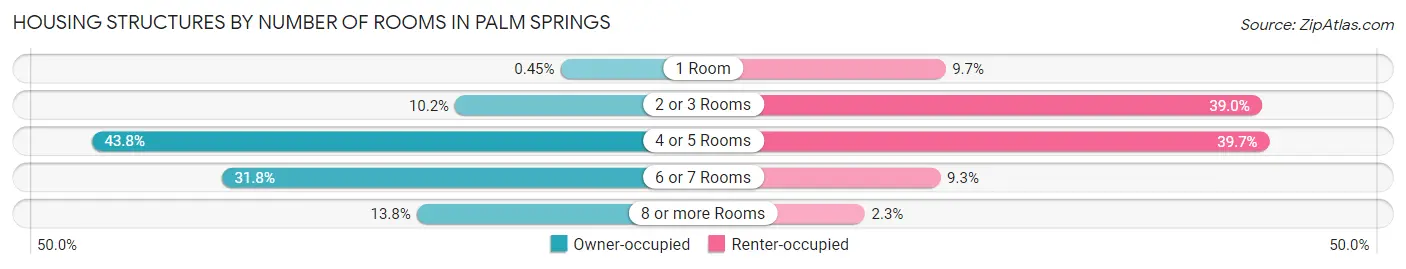
| Number of Rooms | Owner-occupied | Renter-occupied |
| 1 Room | 69 (0.4%) | 821 (9.7%) |
| 2 or 3 Rooms | 1,577 (10.2%) | 3,288 (39.0%) |
| 4 or 5 Rooms | 6,772 (43.8%) | 3,349 (39.7%) |
| 6 or 7 Rooms | 4,914 (31.8%) | 782 (9.3%) |
| 8 or more Rooms | 2,125 (13.8%) | 192 (2.3%) |
| Total | 15,457 (100.0%) | 8,432 (100.0%) |
Housing Structure by Heating Type in Palm Springs
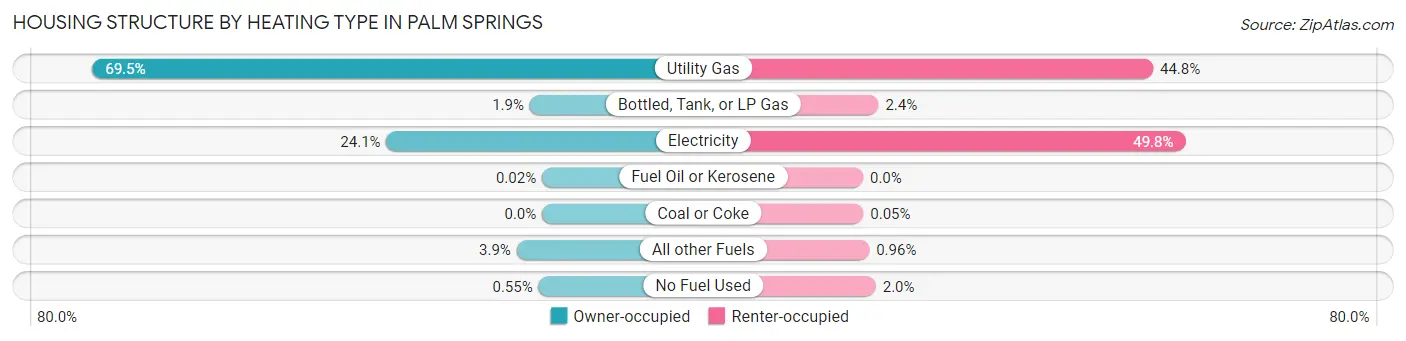
| Heating Type | Owner-occupied | Renter-occupied |
| Utility Gas | 10,748 (69.5%) | 3,780 (44.8%) |
| Bottled, Tank, or LP Gas | 293 (1.9%) | 201 (2.4%) |
| Electricity | 3,721 (24.1%) | 4,200 (49.8%) |
| Fuel Oil or Kerosene | 3 (0.0%) | 0 (0.0%) |
| Coal or Coke | 0 (0.0%) | 4 (0.1%) |
| All other Fuels | 607 (3.9%) | 81 (1.0%) |
| No Fuel Used | 85 (0.5%) | 166 (2.0%) |
| Total | 15,457 (100.0%) | 8,432 (100.0%) |
Household Vehicle Usage in Palm Springs
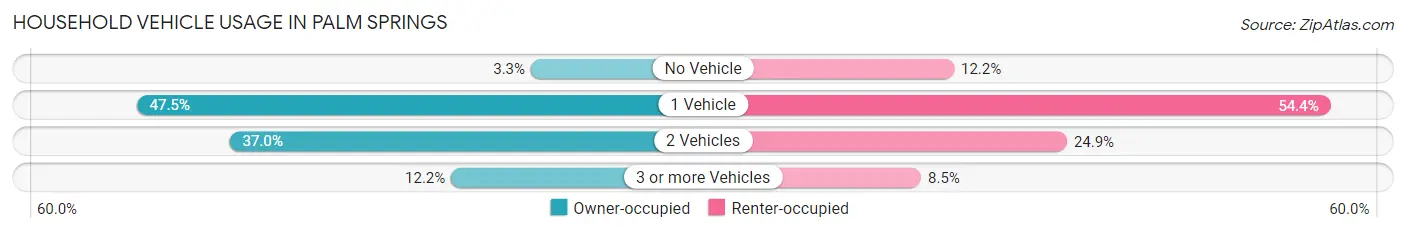
| Vehicles per Household | Owner-occupied | Renter-occupied |
| No Vehicle | 508 (3.3%) | 1,030 (12.2%) |
| 1 Vehicle | 7,334 (47.4%) | 4,586 (54.4%) |
| 2 Vehicles | 5,726 (37.0%) | 2,097 (24.9%) |
| 3 or more Vehicles | 1,889 (12.2%) | 719 (8.5%) |
| Total | 15,457 (100.0%) | 8,432 (100.0%) |
Real Estate & Mortgages in Palm Springs
Real Estate and Mortgage Overview in Palm Springs
| Characteristic | Without Mortgage | With Mortgage |
| Housing Units | 7,493 | 7,964 |
| Median Property Value | $429,600 | $578,900 |
| Median Household Income | $64,100 | $3,017 |
| Monthly Housing Costs | $916 | $2,561 |
| Real Estate Taxes | $3,647 | $125 |
Property Value by Mortgage Status in Palm Springs
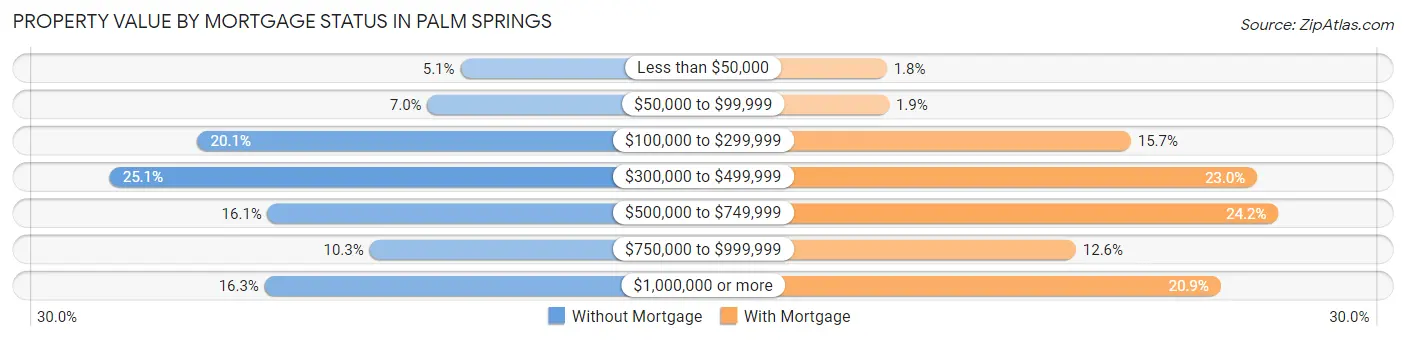
| Property Value | Without Mortgage | With Mortgage |
| Less than $50,000 | 382 (5.1%) | 142 (1.8%) |
| $50,000 to $99,999 | 523 (7.0%) | 152 (1.9%) |
| $100,000 to $299,999 | 1,507 (20.1%) | 1,253 (15.7%) |
| $300,000 to $499,999 | 1,883 (25.1%) | 1,828 (23.0%) |
| $500,000 to $749,999 | 1,207 (16.1%) | 1,924 (24.2%) |
| $750,000 to $999,999 | 771 (10.3%) | 1,003 (12.6%) |
| $1,000,000 or more | 1,220 (16.3%) | 1,662 (20.9%) |
| Total | 7,493 (100.0%) | 7,964 (100.0%) |
Household Income by Mortgage Status in Palm Springs
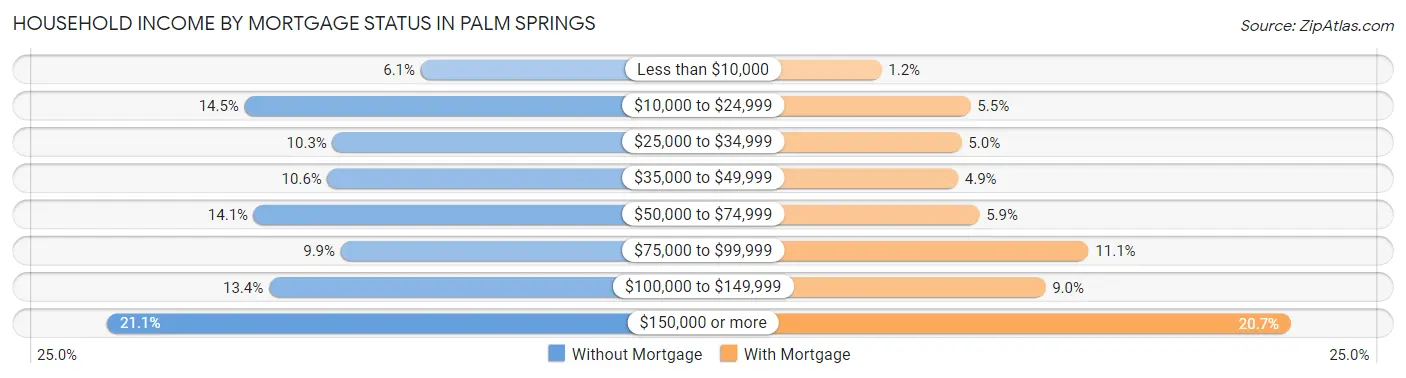
| Household Income | Without Mortgage | With Mortgage |
| Less than $10,000 | 459 (6.1%) | 98 (1.2%) |
| $10,000 to $24,999 | 1,088 (14.5%) | 436 (5.5%) |
| $25,000 to $34,999 | 774 (10.3%) | 401 (5.0%) |
| $35,000 to $49,999 | 792 (10.6%) | 388 (4.9%) |
| $50,000 to $74,999 | 1,055 (14.1%) | 469 (5.9%) |
| $75,000 to $99,999 | 745 (9.9%) | 883 (11.1%) |
| $100,000 to $149,999 | 1,001 (13.4%) | 719 (9.0%) |
| $150,000 or more | 1,579 (21.1%) | 1,651 (20.7%) |
| Total | 7,493 (100.0%) | 7,964 (100.0%) |
Property Value to Household Income Ratio in Palm Springs
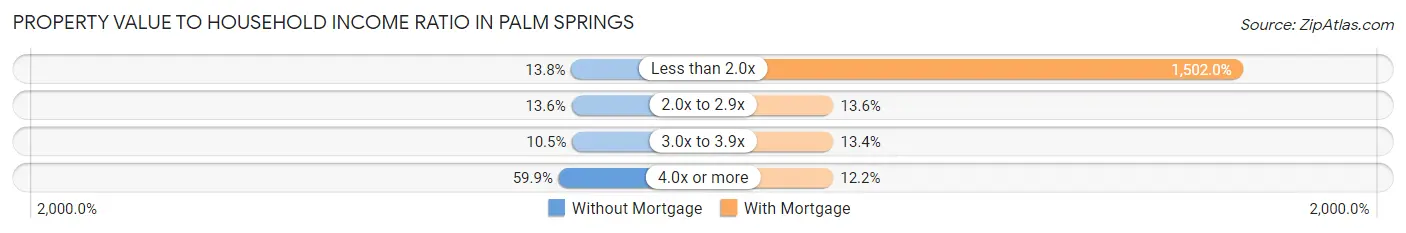
| Value-to-Income Ratio | Without Mortgage | With Mortgage |
| Less than 2.0x | 1,037 (13.8%) | 119,617 (1,502.0%) |
| 2.0x to 2.9x | 1,017 (13.6%) | 1,081 (13.6%) |
| 3.0x to 3.9x | 788 (10.5%) | 1,067 (13.4%) |
| 4.0x or more | 4,489 (59.9%) | 972 (12.2%) |
| Total | 7,493 (100.0%) | 7,964 (100.0%) |
Real Estate Taxes by Mortgage Status in Palm Springs
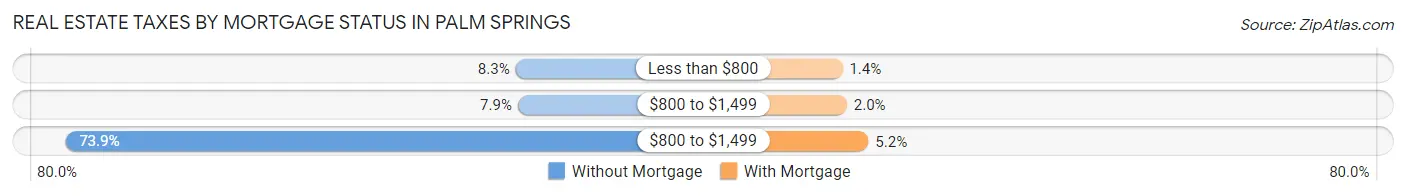
| Property Taxes | Without Mortgage | With Mortgage |
| Less than $800 | 620 (8.3%) | 109 (1.4%) |
| $800 to $1,499 | 595 (7.9%) | 161 (2.0%) |
| $800 to $1,499 | 5,538 (73.9%) | 412 (5.2%) |
| Total | 7,493 (100.0%) | 7,964 (100.0%) |
Health & Disability in Palm Springs
Health Insurance Coverage by Age in Palm Springs
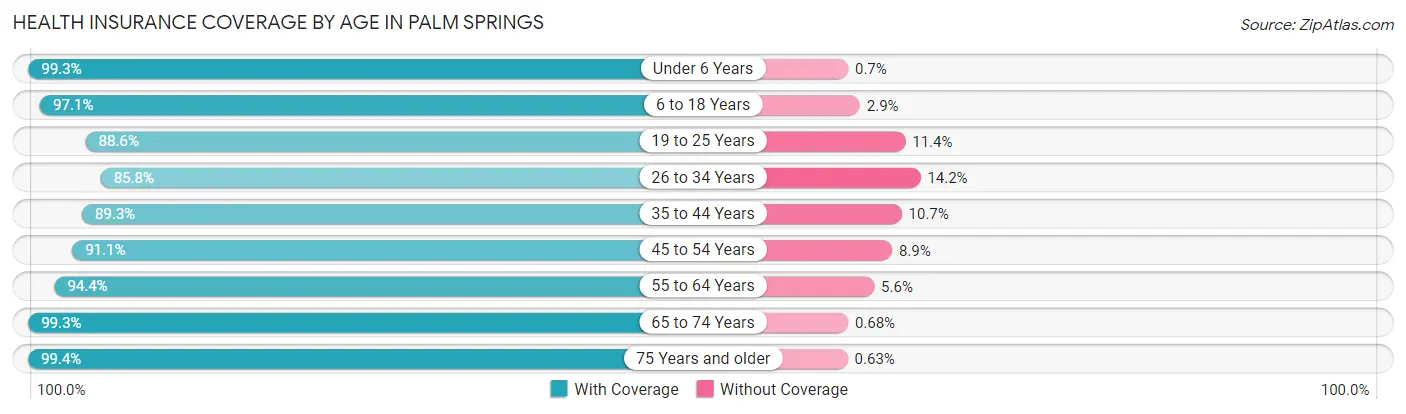
| Age Bracket | With Coverage | Without Coverage |
| Under 6 Years | 1,128 (99.3%) | 8 (0.7%) |
| 6 to 18 Years | 2,776 (97.1%) | 83 (2.9%) |
| 19 to 25 Years | 2,495 (88.6%) | 320 (11.4%) |
| 26 to 34 Years | 3,341 (85.8%) | 553 (14.2%) |
| 35 to 44 Years | 3,082 (89.3%) | 369 (10.7%) |
| 45 to 54 Years | 5,676 (91.1%) | 554 (8.9%) |
| 55 to 64 Years | 8,990 (94.4%) | 530 (5.6%) |
| 65 to 74 Years | 8,315 (99.3%) | 57 (0.7%) |
| 75 Years and older | 6,276 (99.4%) | 40 (0.6%) |
| Total | 42,079 (94.4%) | 2,514 (5.6%) |
Health Insurance Coverage by Citizenship Status in Palm Springs
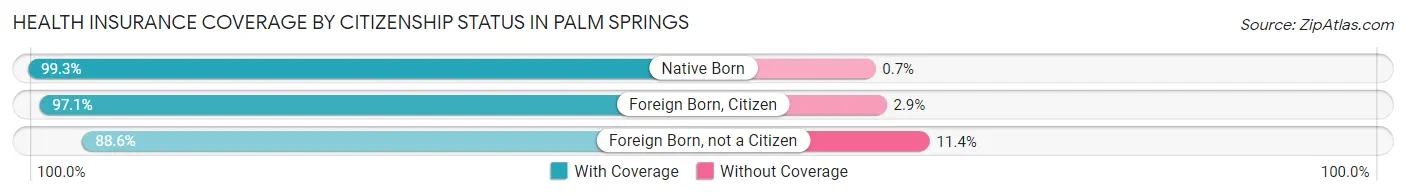
| Citizenship Status | With Coverage | Without Coverage |
| Native Born | 1,128 (99.3%) | 8 (0.7%) |
| Foreign Born, Citizen | 2,776 (97.1%) | 83 (2.9%) |
| Foreign Born, not a Citizen | 2,495 (88.6%) | 320 (11.4%) |
Health Insurance Coverage by Household Income in Palm Springs
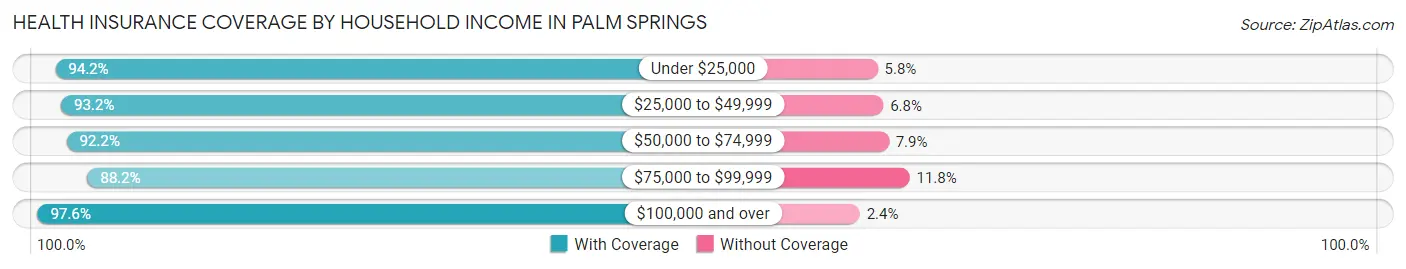
| Household Income | With Coverage | Without Coverage |
| Under $25,000 | 6,094 (94.2%) | 373 (5.8%) |
| $25,000 to $49,999 | 7,324 (93.2%) | 537 (6.8%) |
| $50,000 to $74,999 | 6,658 (92.1%) | 567 (7.9%) |
| $75,000 to $99,999 | 4,406 (88.2%) | 587 (11.8%) |
| $100,000 and over | 17,256 (97.6%) | 428 (2.4%) |
Public vs Private Health Insurance Coverage by Age in Palm Springs
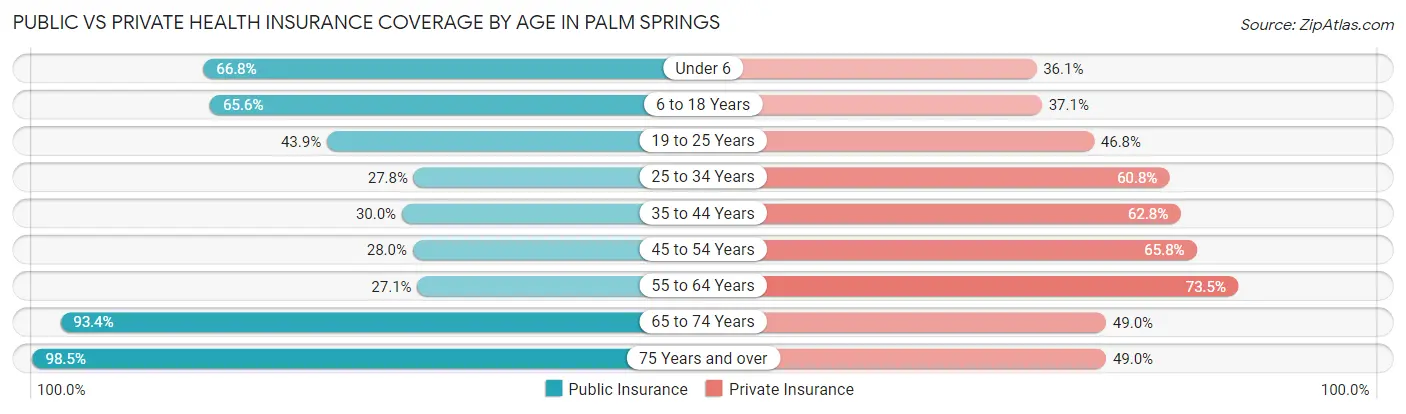
| Age Bracket | Public Insurance | Private Insurance |
| Under 6 | 759 (66.8%) | 410 (36.1%) |
| 6 to 18 Years | 1,875 (65.6%) | 1,061 (37.1%) |
| 19 to 25 Years | 1,235 (43.9%) | 1,317 (46.8%) |
| 25 to 34 Years | 1,081 (27.8%) | 2,366 (60.8%) |
| 35 to 44 Years | 1,034 (30.0%) | 2,167 (62.8%) |
| 45 to 54 Years | 1,741 (28.0%) | 4,100 (65.8%) |
| 55 to 64 Years | 2,579 (27.1%) | 6,997 (73.5%) |
| 65 to 74 Years | 7,817 (93.4%) | 4,104 (49.0%) |
| 75 Years and over | 6,222 (98.5%) | 3,097 (49.0%) |
| Total | 24,343 (54.6%) | 25,619 (57.5%) |
Disability Status by Sex by Age in Palm Springs
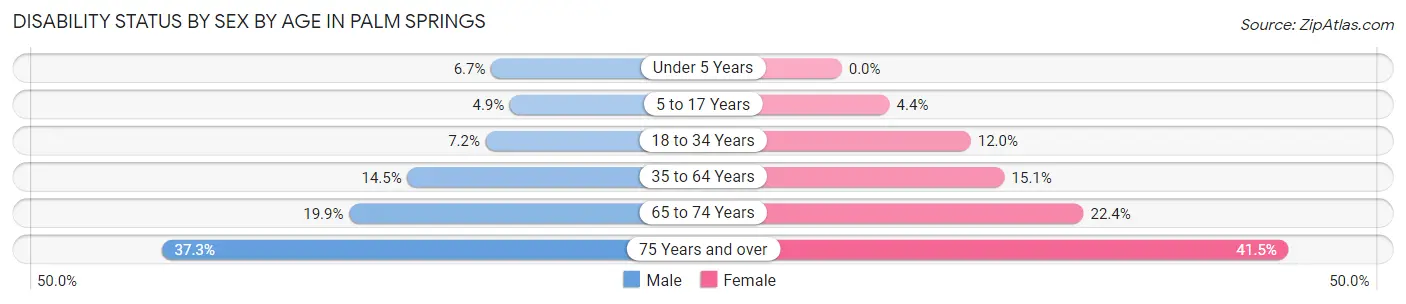
| Age Bracket | Male | Female |
| Under 5 Years | 38 (6.7%) | 0 (0.0%) |
| 5 to 17 Years | 80 (4.9%) | 54 (4.4%) |
| 18 to 34 Years | 264 (7.2%) | 399 (12.0%) |
| 35 to 64 Years | 1,832 (14.5%) | 987 (15.1%) |
| 65 to 74 Years | 1,024 (19.9%) | 722 (22.4%) |
| 75 Years and over | 1,231 (37.3%) | 1,250 (41.5%) |
Disability Class by Sex by Age in Palm Springs
Disability Class: Hearing Difficulty
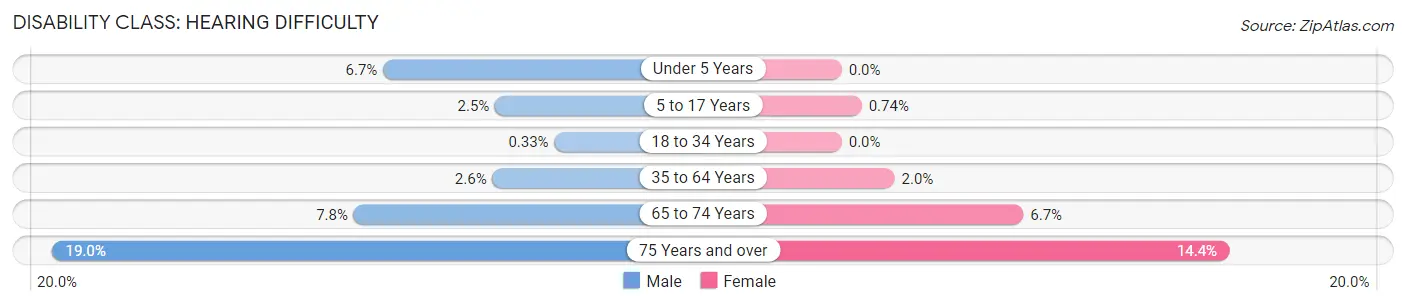
| Age Bracket | Male | Female |
| Under 5 Years | 38 (6.7%) | 0 (0.0%) |
| 5 to 17 Years | 41 (2.5%) | 9 (0.7%) |
| 18 to 34 Years | 12 (0.3%) | 0 (0.0%) |
| 35 to 64 Years | 333 (2.6%) | 128 (2.0%) |
| 65 to 74 Years | 401 (7.8%) | 217 (6.7%) |
| 75 Years and over | 626 (19.0%) | 433 (14.4%) |
Disability Class: Vision Difficulty
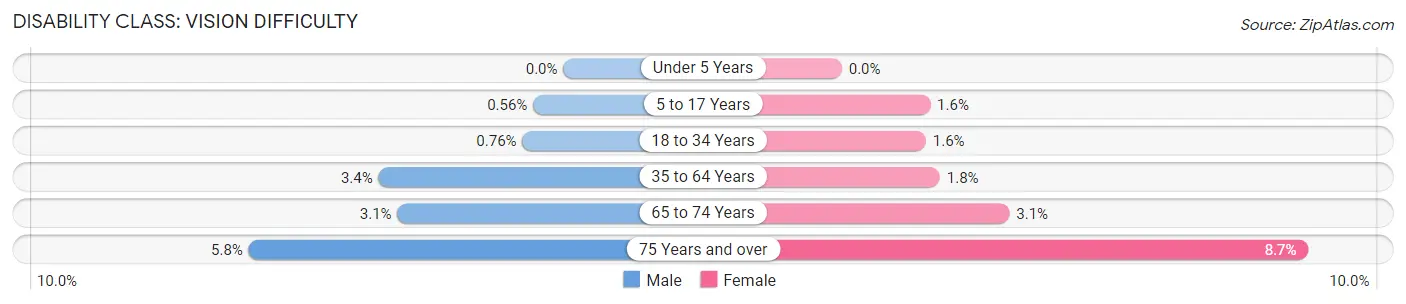
| Age Bracket | Male | Female |
| Under 5 Years | 0 (0.0%) | 0 (0.0%) |
| 5 to 17 Years | 9 (0.6%) | 20 (1.6%) |
| 18 to 34 Years | 28 (0.8%) | 52 (1.6%) |
| 35 to 64 Years | 434 (3.4%) | 119 (1.8%) |
| 65 to 74 Years | 159 (3.1%) | 100 (3.1%) |
| 75 Years and over | 193 (5.8%) | 261 (8.7%) |
Disability Class: Cognitive Difficulty
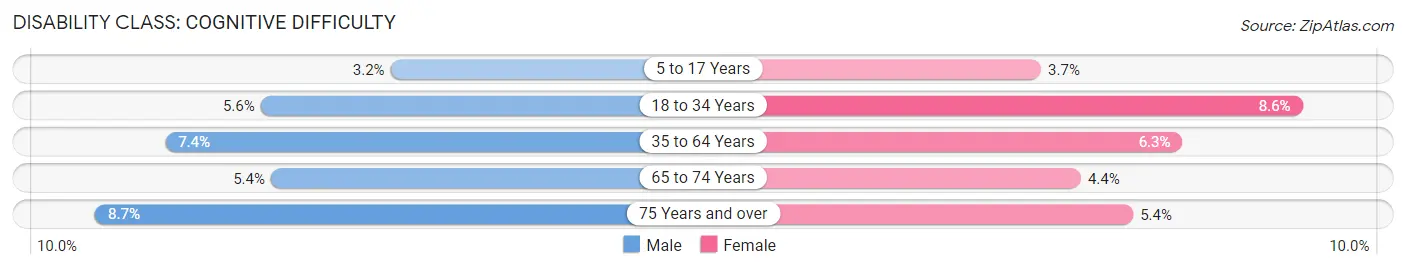
| Age Bracket | Male | Female |
| 5 to 17 Years | 52 (3.2%) | 45 (3.7%) |
| 18 to 34 Years | 206 (5.6%) | 285 (8.6%) |
| 35 to 64 Years | 936 (7.4%) | 413 (6.3%) |
| 65 to 74 Years | 280 (5.4%) | 143 (4.4%) |
| 75 Years and over | 287 (8.7%) | 163 (5.4%) |
Disability Class: Ambulatory Difficulty
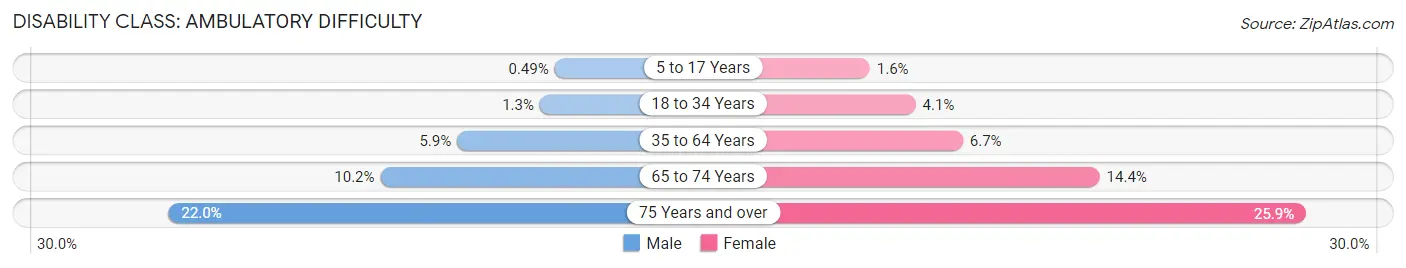
| Age Bracket | Male | Female |
| 5 to 17 Years | 8 (0.5%) | 19 (1.6%) |
| 18 to 34 Years | 48 (1.3%) | 137 (4.1%) |
| 35 to 64 Years | 750 (5.9%) | 440 (6.7%) |
| 65 to 74 Years | 525 (10.2%) | 462 (14.4%) |
| 75 Years and over | 726 (22.0%) | 779 (25.9%) |
Disability Class: Self-Care Difficulty
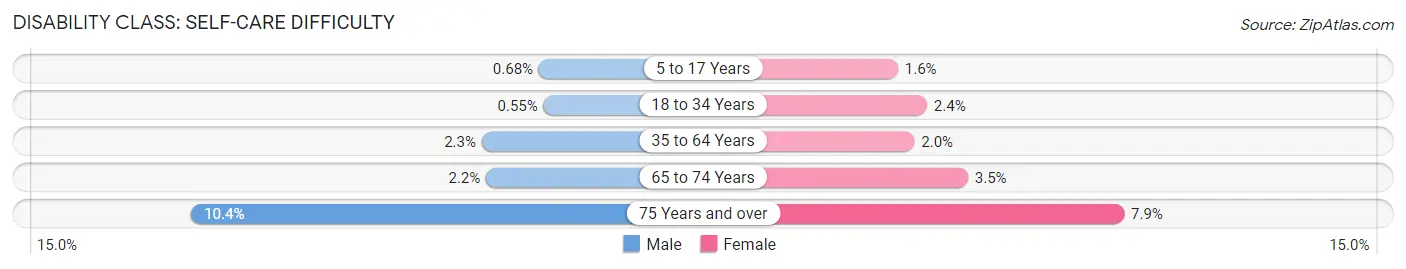
| Age Bracket | Male | Female |
| 5 to 17 Years | 11 (0.7%) | 19 (1.6%) |
| 18 to 34 Years | 20 (0.5%) | 79 (2.4%) |
| 35 to 64 Years | 287 (2.3%) | 132 (2.0%) |
| 65 to 74 Years | 111 (2.1%) | 113 (3.5%) |
| 75 Years and over | 342 (10.4%) | 237 (7.9%) |
Technology Access in Palm Springs
Computing Device Access in Palm Springs
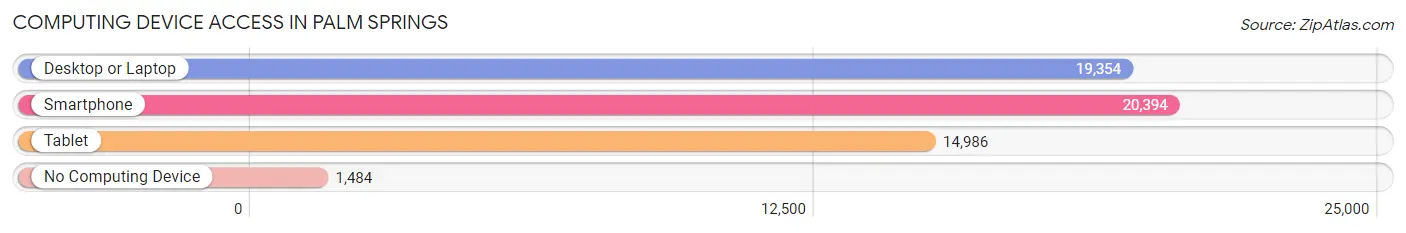
| Device Type | # Households | % Households |
| Desktop or Laptop | 19,354 | 81.0% |
| Smartphone | 20,394 | 85.4% |
| Tablet | 14,986 | 62.7% |
| No Computing Device | 1,484 | 6.2% |
| Total | 23,889 | 100.0% |
Internet Access in Palm Springs
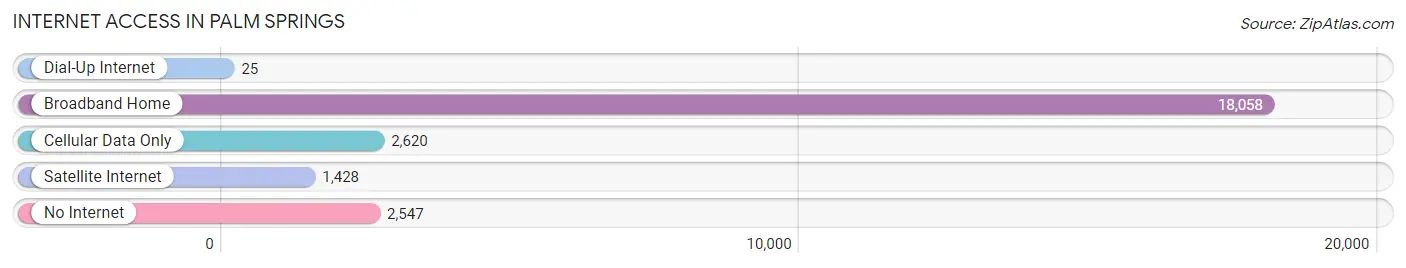
| Internet Type | # Households | % Households |
| Dial-Up Internet | 25 | 0.1% |
| Broadband Home | 18,058 | 75.6% |
| Cellular Data Only | 2,620 | 11.0% |
| Satellite Internet | 1,428 | 6.0% |
| No Internet | 2,547 | 10.7% |
| Total | 23,889 | 100.0% |
Palm Springs Summary
Palm Springs, California is a city located in Riverside County, California, in the Coachella Valley. It is situated approximately 110 miles east of Los Angeles and is a popular tourist destination. Palm Springs is known for its hot desert climate, its many golf courses, and its numerous resorts. The city has a population of 45,746 as of the 2010 census, and is the most populous city in the Coachella Valley.
History
The area that is now Palm Springs was originally inhabited by the Cahuilla people, who were hunter-gatherers. The first Europeans to visit the area were Spanish explorers in the late 18th century. The area was later settled by the Agua Caliente Band of Cahuilla Indians, who established a series of villages in the area.
In the late 19th century, the area began to attract settlers from the United States, and the city of Palm Springs was officially incorporated in 1938. The city quickly became a popular destination for Hollywood celebrities, and it was during this time that many of the city's iconic mid-century modern buildings were constructed.
Geography
Palm Springs is located in the Coachella Valley, a desert region of Southern California. The city is situated at the base of the San Jacinto Mountains, and is surrounded by the Santa Rosa Mountains to the north and the San Bernardino Mountains to the east. The city has a total area of 94.2 square miles, of which 92.5 square miles is land and 1.7 square miles is water.
The city has a hot desert climate, with hot summers and mild winters. The average high temperature in July is 103°F, and the average low temperature in January is 43°F. The city receives an average of 4.5 inches of precipitation per year.
Economy
The economy of Palm Springs is largely driven by tourism. The city is home to numerous resorts, golf courses, and other attractions, and is a popular destination for both domestic and international tourists. The city also has a thriving arts and culture scene, with numerous galleries, museums, and performing arts venues.
The city is also home to a number of corporate headquarters, including the headquarters of the Agua Caliente Band of Cahuilla Indians, the Agua Caliente Casino Resort Spa, and the Palm Springs International Airport.
Demographics
As of the 2010 census, the population of Palm Springs was 45,746. The racial makeup of the city was 68.2% White, 8.2% African American, 0.7% Native American, 4.2% Asian, 0.2% Pacific Islander, and 16.7% from other races. Hispanic or Latino of any race were 33.2% of the population.
The median household income in Palm Springs was $45,837, and the median family income was $51,837. The per capita income for the city was $27,837. About 14.2% of the population was below the poverty line.
Palm Springs is a diverse city, with a variety of cultures and lifestyles. The city is home to a large LGBT community, and is a popular destination for LGBT tourists. The city also has a large retirement population, and is home to numerous retirement communities.
Common Questions
What is Per Capita Income in Palm Springs?
Per Capita income in Palm Springs is $62,030.
What is the Median Family Income in Palm Springs?
Median Family Income in Palm Springs is $97,683.
What is the Median Household income in Palm Springs?
Median Household Income in Palm Springs is $67,451.
What is Income or Wage Gap in Palm Springs?
Income or Wage Gap in Palm Springs is 34.4%.
Women in Palm Springs earn 65.6 cents for every dollar earned by a man.
What is Family Income Deficit in Palm Springs?
Family Income Deficit in Palm Springs is $12,685.
Families that are below poverty line in Palm Springs earn $12,685 less on average than the poverty threshold level.
What is Inequality or Gini Index in Palm Springs?
Inequality or Gini Index in Palm Springs is 0.56.
What is the Total Population of Palm Springs?
Total Population of Palm Springs is 44,935.
What is the Total Male Population of Palm Springs?
Total Male Population of Palm Springs is 27,128.
What is the Total Female Population of Palm Springs?
Total Female Population of Palm Springs is 17,807.
What is the Ratio of Males per 100 Females in Palm Springs?
There are 152.34 Males per 100 Females in Palm Springs.
What is the Ratio of Females per 100 Males in Palm Springs?
There are 65.64 Females per 100 Males in Palm Springs.
What is the Median Population Age in Palm Springs?
Median Population Age in Palm Springs is 57.3 Years.
What is the Average Family Size in Palm Springs
Average Family Size in Palm Springs is 2.6 People.
What is the Average Household Size in Palm Springs
Average Household Size in Palm Springs is 1.9 People.
How Large is the Labor Force in Palm Springs?
There are 20,866 People in the Labor Forcein in Palm Springs.
What is the Percentage of People in the Labor Force in Palm Springs?
50.0% of People are in the Labor Force in Palm Springs.
What is the Unemployment Rate in Palm Springs?
Unemployment Rate in Palm Springs is 8.6%.