Orange, CA Map & Demographics
Orange Map
Orange Overview
$48,092
PER CAPITA INCOME
$124,289
AVG FAMILY INCOME
$109,335
AVG HOUSEHOLD INCOME
18.2%
WAGE / INCOME GAP [ % ]
81.8¢/ $1
WAGE / INCOME GAP [ $ ]
$11,741
FAMILY INCOME DEFICIT
0.45
INEQUALITY / GINI INDEX
138,728
TOTAL POPULATION
70,909
MALE POPULATION
67,819
FEMALE POPULATION
104.56
MALES / 100 FEMALES
95.64
FEMALES / 100 MALES
36.5
MEDIAN AGE
3.4
AVG FAMILY SIZE
3.0
AVG HOUSEHOLD SIZE
75,300
LABOR FORCE [ PEOPLE ]
66.1%
PERCENT IN LABOR FORCE
4.7%
UNEMPLOYMENT RATE
Income in Orange
Income Overview in Orange
Per Capita Income in Orange is $48,092, while median incomes of families and households are $124,289 and $109,335 respectively.
| Characteristic | Number | Measure |
| Per Capita Income | 138,728 | $48,092 |
| Median Family Income | 31,391 | $124,289 |
| Mean Family Income | 31,391 | $163,112 |
| Median Household Income | 44,336 | $109,335 |
| Mean Household Income | 44,336 | $145,649 |
| Income Deficit | 31,391 | $11,741 |
| Wage / Income Gap (%) | 138,728 | 18.15% |
| Wage / Income Gap ($) | 138,728 | 81.85¢ per $1 |
| Gini / Inequality Index | 138,728 | 0.45 |
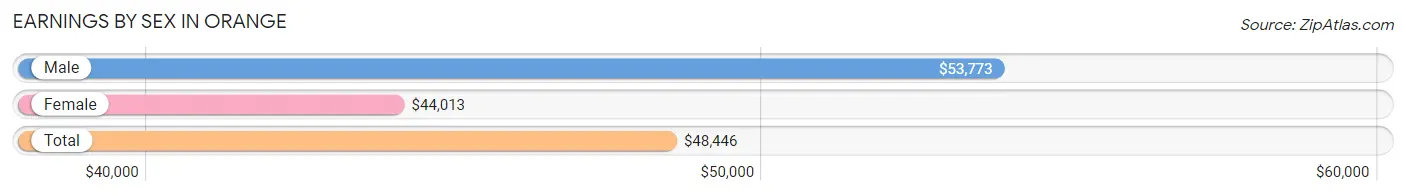
Earnings by Sex in Orange
Average Earnings in Orange are $48,446, $53,773 for men and $44,013 for women, a difference of 18.1%.
| Sex | Number | Average Earnings |
| Male | 42,938 (54.6%) | $53,773 |
| Female | 35,759 (45.4%) | $44,013 |
| Total | 78,697 (100.0%) | $48,446 |
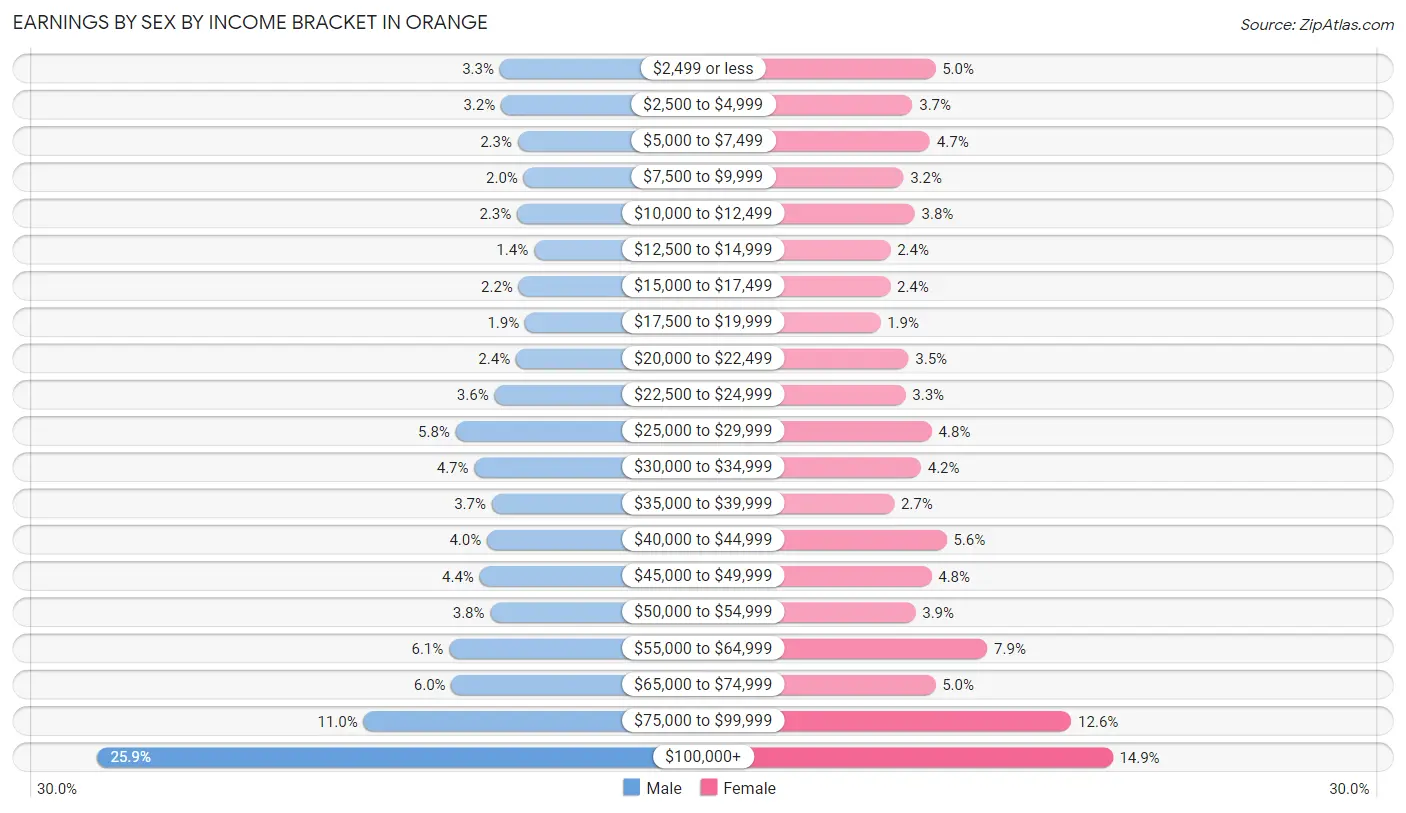
Earnings by Sex by Income Bracket in Orange
The most common earnings brackets in Orange are $100,000+ for men (11,123 | 25.9%) and $100,000+ for women (5,339 | 14.9%).
| Income | Male | Female |
| $2,499 or less | 1,412 (3.3%) | 1,779 (5.0%) |
| $2,500 to $4,999 | 1,383 (3.2%) | 1,317 (3.7%) |
| $5,000 to $7,499 | 981 (2.3%) | 1,671 (4.7%) |
| $7,500 to $9,999 | 837 (1.9%) | 1,134 (3.2%) |
| $10,000 to $12,499 | 998 (2.3%) | 1,364 (3.8%) |
| $12,500 to $14,999 | 587 (1.4%) | 872 (2.4%) |
| $15,000 to $17,499 | 959 (2.2%) | 869 (2.4%) |
| $17,500 to $19,999 | 803 (1.9%) | 673 (1.9%) |
| $20,000 to $22,499 | 1,023 (2.4%) | 1,238 (3.5%) |
| $22,500 to $24,999 | 1,541 (3.6%) | 1,175 (3.3%) |
| $25,000 to $29,999 | 2,479 (5.8%) | 1,704 (4.8%) |
| $30,000 to $34,999 | 2,028 (4.7%) | 1,486 (4.2%) |
| $35,000 to $39,999 | 1,604 (3.7%) | 949 (2.6%) |
| $40,000 to $44,999 | 1,720 (4.0%) | 2,003 (5.6%) |
| $45,000 to $49,999 | 1,898 (4.4%) | 1,698 (4.8%) |
| $50,000 to $54,999 | 1,642 (3.8%) | 1,377 (3.8%) |
| $55,000 to $64,999 | 2,638 (6.1%) | 2,823 (7.9%) |
| $65,000 to $74,999 | 2,582 (6.0%) | 1,778 (5.0%) |
| $75,000 to $99,999 | 4,700 (11.0%) | 4,510 (12.6%) |
| $100,000+ | 11,123 (25.9%) | 5,339 (14.9%) |
| Total | 42,938 (100.0%) | 35,759 (100.0%) |
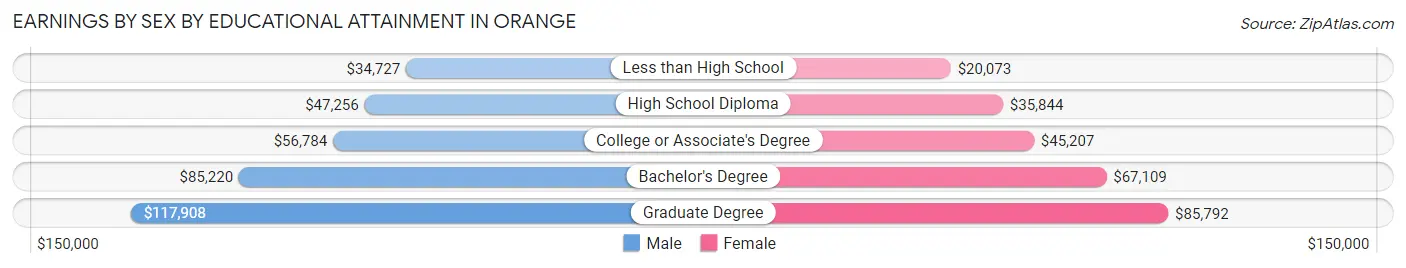
Earnings by Sex by Educational Attainment in Orange
Average earnings in Orange are $62,941 for men and $51,508 for women, a difference of 18.2%. Men with an educational attainment of graduate degree enjoy the highest average annual earnings of $117,908, while those with less than high school education earn the least with $34,727. Women with an educational attainment of graduate degree earn the most with the average annual earnings of $85,792, while those with less than high school education have the smallest earnings of $20,073.
| Educational Attainment | Male Income | Female Income |
| Less than High School | $34,727 | $20,073 |
| High School Diploma | $47,256 | $35,844 |
| College or Associate's Degree | $56,784 | $45,207 |
| Bachelor's Degree | $85,220 | $67,109 |
| Graduate Degree | $117,908 | $85,792 |
| Total | $62,941 | $51,508 |
Family Income in Orange
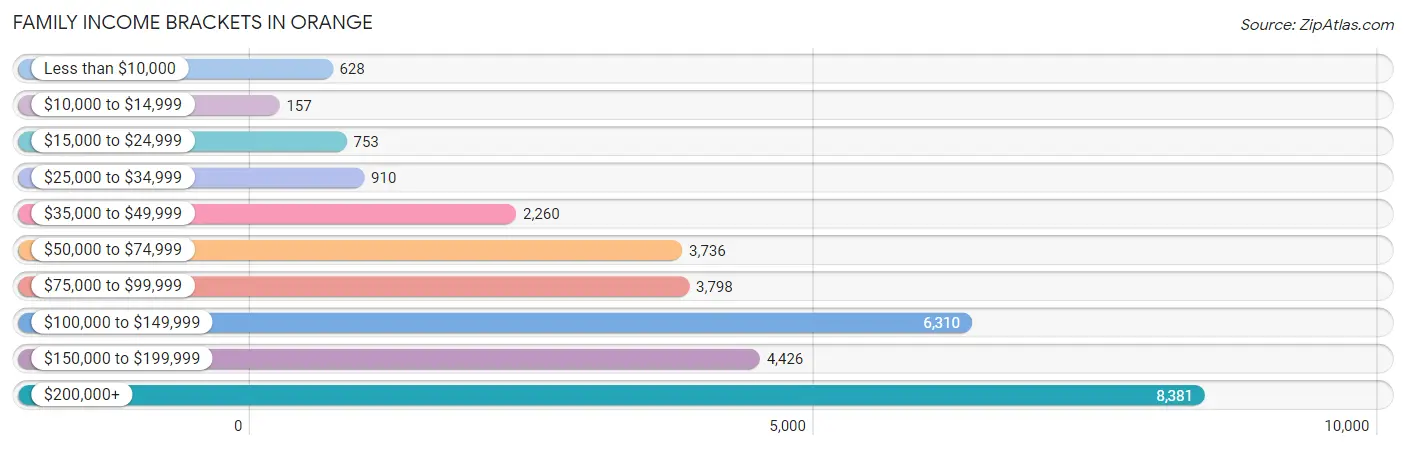
Family Income Brackets in Orange
According to the Orange family income data, there are 8,381 families falling into the $200,000+ income range, which is the most common income bracket and makes up 26.7% of all families. Conversely, the $10,000 to $14,999 income bracket is the least frequent group with only 157 families (0.5%) belonging to this category.
| Income Bracket | # Families | % Families |
| Less than $10,000 | 628 | 2.0% |
| $10,000 to $14,999 | 157 | 0.5% |
| $15,000 to $24,999 | 753 | 2.4% |
| $25,000 to $34,999 | 910 | 2.9% |
| $35,000 to $49,999 | 2,260 | 7.2% |
| $50,000 to $74,999 | 3,736 | 11.9% |
| $75,000 to $99,999 | 3,798 | 12.1% |
| $100,000 to $149,999 | 6,310 | 20.1% |
| $150,000 to $199,999 | 4,426 | 14.1% |
| $200,000+ | 8,381 | 26.7% |
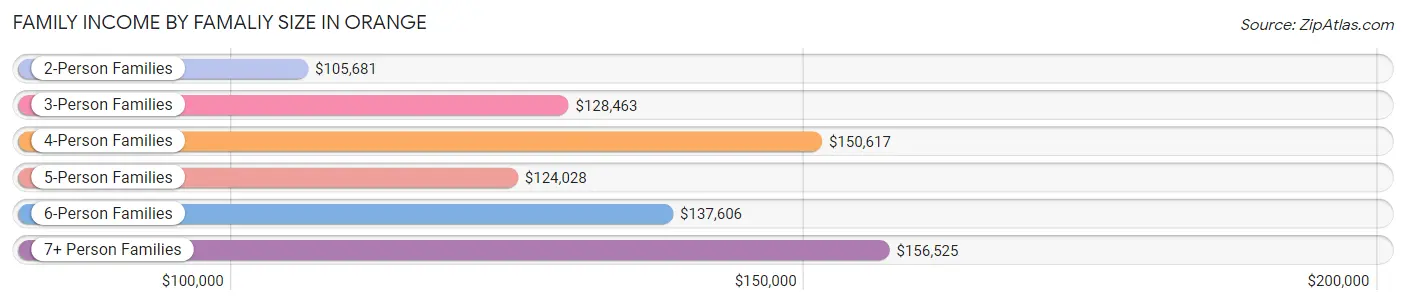
Family Income by Famaliy Size in Orange
7+ person families (823 | 2.6%) account for the highest median family income in Orange with $156,525 per family, while 2-person families (11,647 | 37.1%) have the highest median income of $52,840 per family member.
| Income Bracket | # Families | Median Income |
| 2-Person Families | 11,647 (37.1%) | $105,681 |
| 3-Person Families | 7,613 (24.2%) | $128,463 |
| 4-Person Families | 6,913 (22.0%) | $150,617 |
| 5-Person Families | 3,117 (9.9%) | $124,028 |
| 6-Person Families | 1,278 (4.1%) | $137,606 |
| 7+ Person Families | 823 (2.6%) | $156,525 |
| Total | 31,391 (100.0%) | $124,289 |
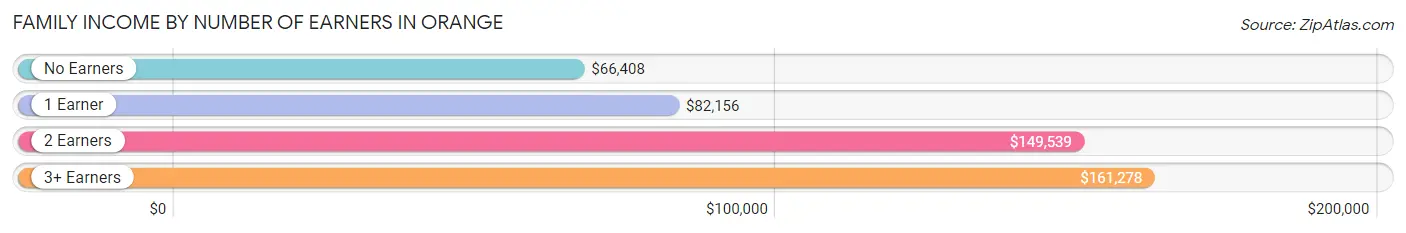
Family Income by Number of Earners in Orange
The median family income in Orange is $124,289, with families comprising 3+ earners (5,891) having the highest median family income of $161,278, while families with no earners (2,828) have the lowest median family income of $66,408, accounting for 18.8% and 9.0% of families, respectively.
| Number of Earners | # Families | Median Income |
| No Earners | 2,828 (9.0%) | $66,408 |
| 1 Earner | 8,763 (27.9%) | $82,156 |
| 2 Earners | 13,909 (44.3%) | $149,539 |
| 3+ Earners | 5,891 (18.8%) | $161,278 |
| Total | 31,391 (100.0%) | $124,289 |
Household Income in Orange
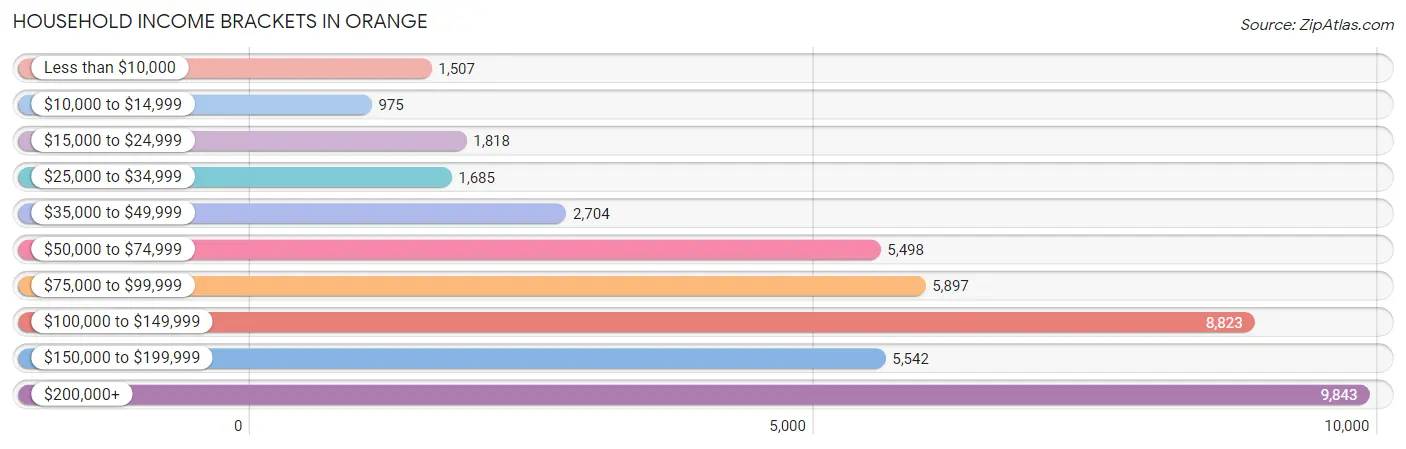
Household Income Brackets in Orange
With 9,843 households falling in the category, the $200,000+ income range is the most frequent in Orange, accounting for 22.2% of all households. In contrast, only 975 households (2.2%) fall into the $10,000 to $14,999 income bracket, making it the least populous group.
| Income Bracket | # Households | % Households |
| Less than $10,000 | 1,507 | 3.4% |
| $10,000 to $14,999 | 975 | 2.2% |
| $15,000 to $24,999 | 1,818 | 4.1% |
| $25,000 to $34,999 | 1,685 | 3.8% |
| $35,000 to $49,999 | 2,704 | 6.1% |
| $50,000 to $74,999 | 5,498 | 12.4% |
| $75,000 to $99,999 | 5,897 | 13.3% |
| $100,000 to $149,999 | 8,823 | 19.9% |
| $150,000 to $199,999 | 5,542 | 12.5% |
| $200,000+ | 9,843 | 22.2% |
Household Income by Householder Age in Orange
The median household income in Orange is $109,335, with the highest median household income of $123,633 found in the 45 to 64 years age bracket for the primary householder. A total of 17,161 households (38.7%) fall into this category. Meanwhile, the 15 to 24 years age bracket for the primary householder has the lowest median household income of $46,625, with 1,201 households (2.7%) in this group.
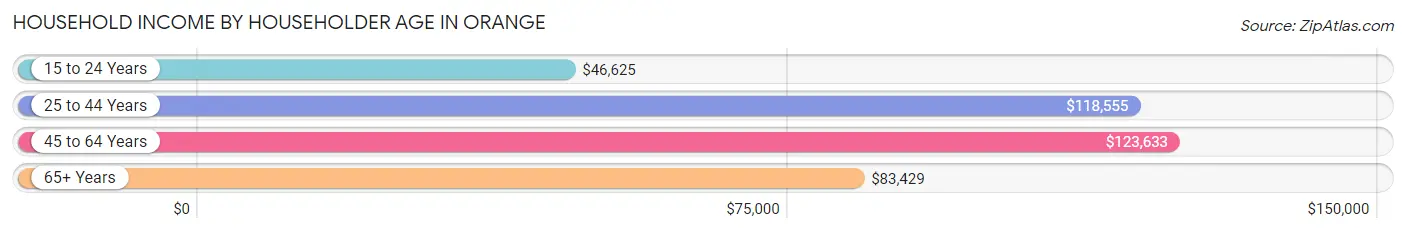
| Income Bracket | # Households | Median Income |
| 15 to 24 Years | 1,201 (2.7%) | $46,625 |
| 25 to 44 Years | 15,100 (34.1%) | $118,555 |
| 45 to 64 Years | 17,161 (38.7%) | $123,633 |
| 65+ Years | 10,874 (24.5%) | $83,429 |
| Total | 44,336 (100.0%) | $109,335 |
Poverty in Orange
Income Below Poverty by Sex and Age in Orange
With 7.6% poverty level for males and 10.9% for females among the residents of Orange, 5 year old males and 18 to 24 year old females are the most vulnerable to poverty, with 289 males (22.9%) and 1,970 females (30.9%) in their respective age groups living below the poverty level.
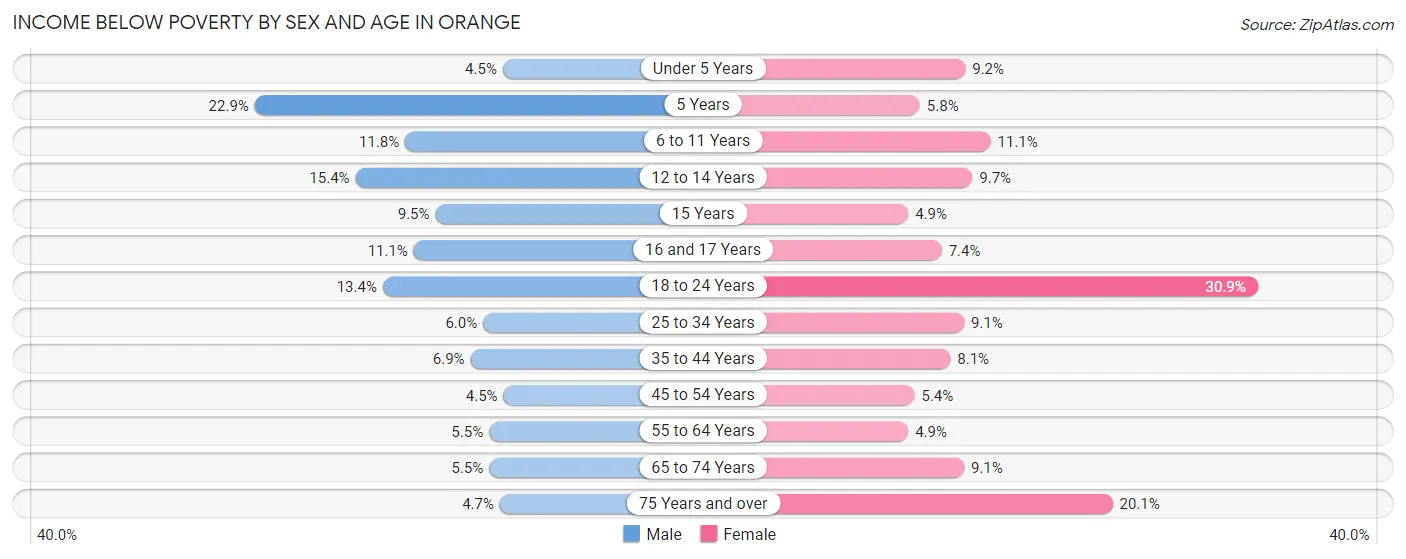
| Age Bracket | Male | Female |
| Under 5 Years | 163 (4.5%) | 366 (9.2%) |
| 5 Years | 289 (22.9%) | 36 (5.8%) |
| 6 to 11 Years | 533 (11.7%) | 494 (11.1%) |
| 12 to 14 Years | 345 (15.4%) | 197 (9.7%) |
| 15 Years | 82 (9.5%) | 30 (4.9%) |
| 16 and 17 Years | 229 (11.1%) | 102 (7.4%) |
| 18 to 24 Years | 840 (13.4%) | 1,970 (30.9%) |
| 25 to 34 Years | 624 (6.0%) | 968 (9.1%) |
| 35 to 44 Years | 642 (6.9%) | 666 (8.1%) |
| 45 to 54 Years | 408 (4.4%) | 450 (5.4%) |
| 55 to 64 Years | 469 (5.5%) | 397 (4.9%) |
| 65 to 74 Years | 281 (5.5%) | 601 (9.1%) |
| 75 Years and over | 162 (4.7%) | 919 (20.1%) |
| Total | 5,067 (7.6%) | 7,196 (10.9%) |
Income Above Poverty by Sex and Age in Orange
According to the poverty statistics in Orange, males aged 45 to 54 years and females aged 15 years are the age groups that are most secure financially, with 95.6% of males and 95.1% of females in these age groups living above the poverty line.
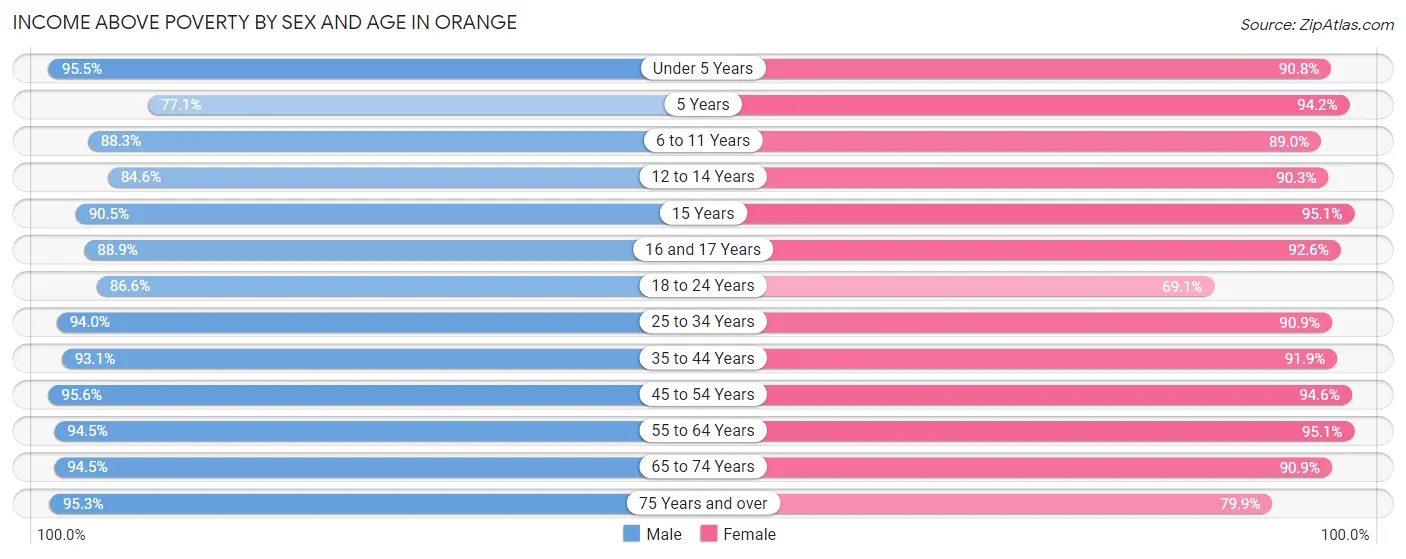
| Age Bracket | Male | Female |
| Under 5 Years | 3,461 (95.5%) | 3,627 (90.8%) |
| 5 Years | 972 (77.1%) | 585 (94.2%) |
| 6 to 11 Years | 4,002 (88.2%) | 3,975 (88.9%) |
| 12 to 14 Years | 1,890 (84.6%) | 1,835 (90.3%) |
| 15 Years | 781 (90.5%) | 578 (95.1%) |
| 16 and 17 Years | 1,832 (88.9%) | 1,273 (92.6%) |
| 18 to 24 Years | 5,425 (86.6%) | 4,411 (69.1%) |
| 25 to 34 Years | 9,843 (94.0%) | 9,687 (90.9%) |
| 35 to 44 Years | 8,669 (93.1%) | 7,597 (91.9%) |
| 45 to 54 Years | 8,767 (95.6%) | 7,876 (94.6%) |
| 55 to 64 Years | 8,021 (94.5%) | 7,652 (95.1%) |
| 65 to 74 Years | 4,816 (94.5%) | 6,022 (90.9%) |
| 75 Years and over | 3,267 (95.3%) | 3,653 (79.9%) |
| Total | 61,746 (92.4%) | 58,771 (89.1%) |
Income Below Poverty Among Married-Couple Families in Orange
The poverty statistics for married-couple families in Orange show that 3.3% or 792 of the total 23,732 families live below the poverty line. Families with 3 or 4 children have the highest poverty rate of 11.2%, comprising of 201 families. On the other hand, families with 5 or more children have the lowest poverty rate of 0.0%, which includes 0 families.
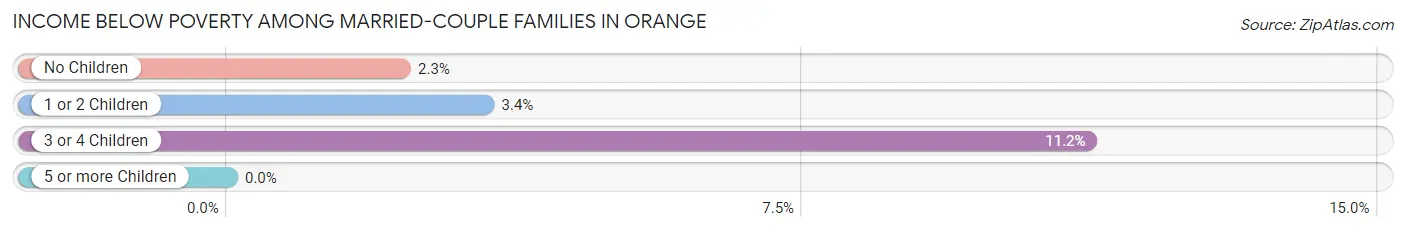
| Children | Above Poverty | Below Poverty |
| No Children | 12,827 (97.7%) | 297 (2.3%) |
| 1 or 2 Children | 8,470 (96.7%) | 294 (3.4%) |
| 3 or 4 Children | 1,590 (88.8%) | 201 (11.2%) |
| 5 or more Children | 53 (100.0%) | 0 (0.0%) |
| Total | 22,940 (96.7%) | 792 (3.3%) |
Income Below Poverty Among Single-Parent Households in Orange
According to the poverty data in Orange, 4.7% or 117 single-father households and 12.6% or 649 single-mother households are living below the poverty line. Among single-father households, those with 1 or 2 children have the highest poverty rate, with 93 households (9.0%) experiencing poverty. Likewise, among single-mother households, those with 5 or more children have the highest poverty rate, with 59 households (100.0%) falling below the poverty line.
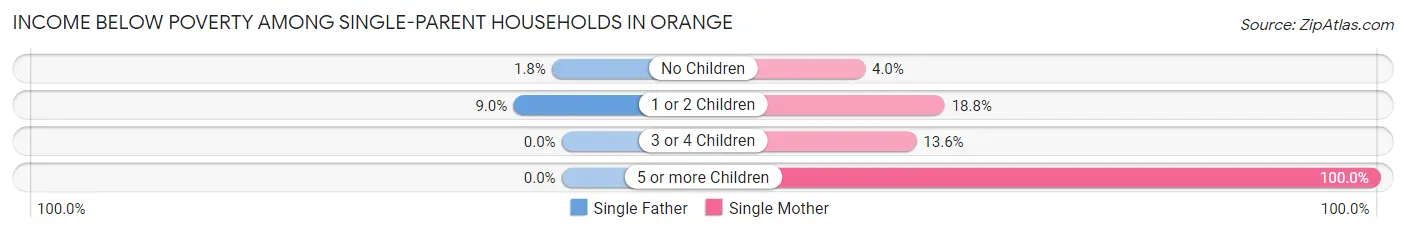
| Children | Single Father | Single Mother |
| No Children | 24 (1.8%) | 94 (4.0%) |
| 1 or 2 Children | 93 (9.0%) | 446 (18.8%) |
| 3 or 4 Children | 0 (0.0%) | 50 (13.6%) |
| 5 or more Children | 0 (0.0%) | 59 (100.0%) |
| Total | 117 (4.7%) | 649 (12.6%) |
Income Below Poverty Among Married-Couple vs Single-Parent Households in Orange
The poverty data for Orange shows that 792 of the married-couple family households (3.3%) and 766 of the single-parent households (10.0%) are living below the poverty level. Within the married-couple family households, those with 3 or 4 children have the highest poverty rate, with 201 households (11.2%) falling below the poverty line. Among the single-parent households, those with 5 or more children have the highest poverty rate, with 59 household (100.0%) living below poverty.
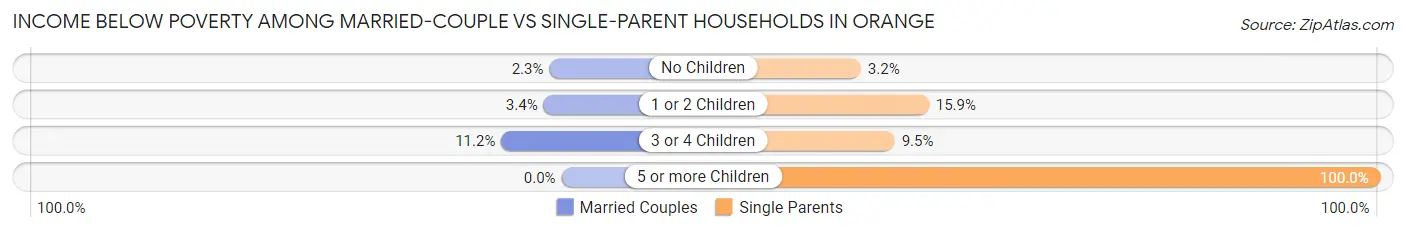
| Children | Married-Couple Families | Single-Parent Households |
| No Children | 297 (2.3%) | 118 (3.2%) |
| 1 or 2 Children | 294 (3.4%) | 539 (15.9%) |
| 3 or 4 Children | 201 (11.2%) | 50 (9.5%) |
| 5 or more Children | 0 (0.0%) | 59 (100.0%) |
| Total | 792 (3.3%) | 766 (10.0%) |
Race in Orange
The most populous races in Orange are White / Caucasian (80,758 | 58.2%), Hispanic or Latino (54,176 | 39.1%), and Two or more Races (18,811 | 13.6%).
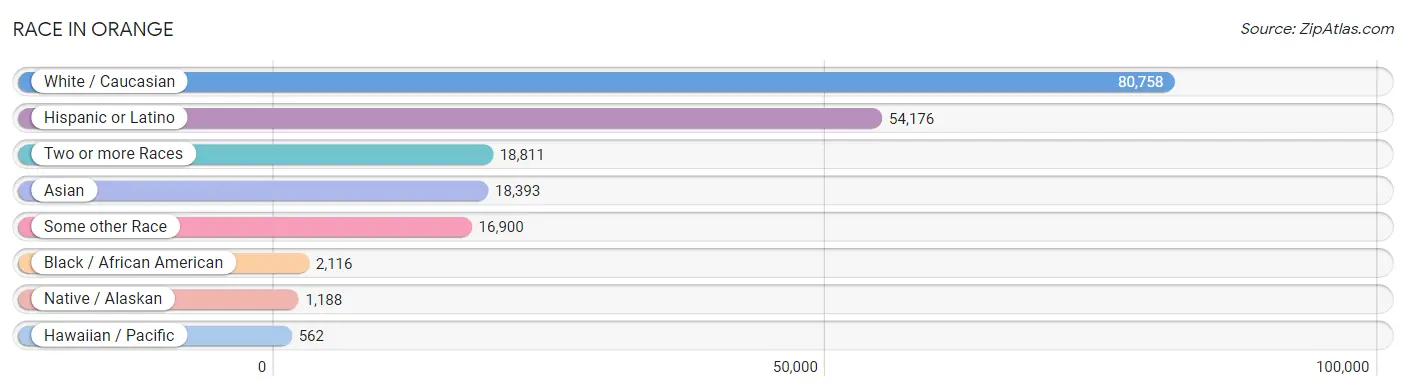
| Race | # Population | % Population |
| Asian | 18,393 | 13.3% |
| Black / African American | 2,116 | 1.5% |
| Hawaiian / Pacific | 562 | 0.4% |
| Hispanic or Latino | 54,176 | 39.1% |
| Native / Alaskan | 1,188 | 0.9% |
| White / Caucasian | 80,758 | 58.2% |
| Two or more Races | 18,811 | 13.6% |
| Some other Race | 16,900 | 12.2% |
| Total | 138,728 | 100.0% |
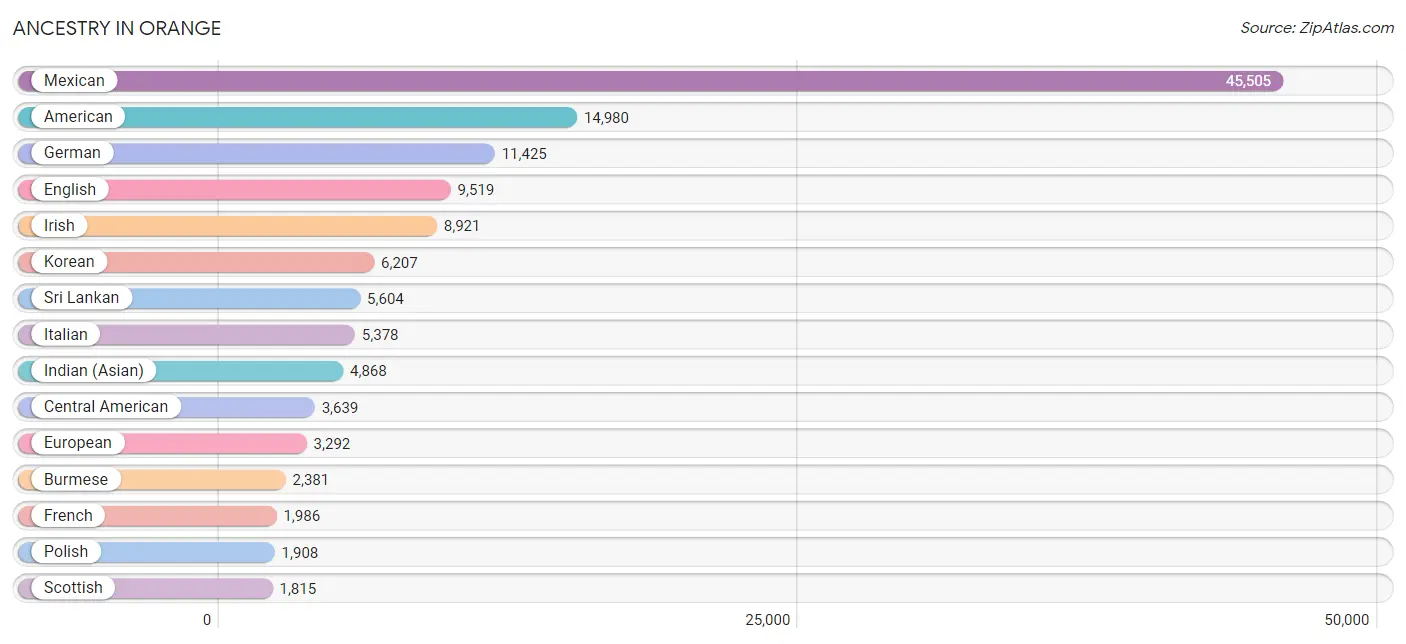
Ancestry in Orange
The most populous ancestries reported in Orange are Mexican (45,505 | 32.8%), American (14,980 | 10.8%), German (11,425 | 8.2%), English (9,519 | 6.9%), and Irish (8,921 | 6.4%), together accounting for 65.1% of all Orange residents.
| Ancestry | # Population | % Population |
| Afghan | 372 | 0.3% |
| African | 189 | 0.1% |
| Albanian | 11 | 0.0% |
| American | 14,980 | 10.8% |
| Apache | 39 | 0.0% |
| Arab | 1,058 | 0.8% |
| Argentinean | 308 | 0.2% |
| Armenian | 314 | 0.2% |
| Assyrian / Chaldean / Syriac | 35 | 0.0% |
| Australian | 63 | 0.1% |
| Austrian | 121 | 0.1% |
| Basque | 88 | 0.1% |
| Belgian | 90 | 0.1% |
| Bhutanese | 1,470 | 1.1% |
| Blackfeet | 48 | 0.0% |
| Bolivian | 139 | 0.1% |
| Brazilian | 78 | 0.1% |
| British | 725 | 0.5% |
| British West Indian | 11 | 0.0% |
| Bulgarian | 17 | 0.0% |
| Burmese | 2,381 | 1.7% |
| Cambodian | 20 | 0.0% |
| Canadian | 520 | 0.4% |
| Carpatho Rusyn | 14 | 0.0% |
| Celtic | 4 | 0.0% |
| Central American | 3,639 | 2.6% |
| Central American Indian | 122 | 0.1% |
| Cherokee | 220 | 0.2% |
| Chickasaw | 17 | 0.0% |
| Chilean | 63 | 0.1% |
| Chinese | 25 | 0.0% |
| Chippewa | 22 | 0.0% |
| Choctaw | 55 | 0.0% |
| Colombian | 309 | 0.2% |
| Comanche | 20 | 0.0% |
| Costa Rican | 145 | 0.1% |
| Creek | 135 | 0.1% |
| Croatian | 109 | 0.1% |
| Crow | 14 | 0.0% |
| Cuban | 459 | 0.3% |
| Czech | 322 | 0.2% |
| Czechoslovakian | 56 | 0.0% |
| Danish | 474 | 0.3% |
| Dutch | 1,274 | 0.9% |
| Eastern European | 499 | 0.4% |
| Ecuadorian | 217 | 0.2% |
| Egyptian | 247 | 0.2% |
| English | 9,519 | 6.9% |
| European | 3,292 | 2.4% |
| Filipino | 430 | 0.3% |
| Finnish | 289 | 0.2% |
| French | 1,986 | 1.4% |
| French Canadian | 408 | 0.3% |
| German | 11,425 | 8.2% |
| Greek | 624 | 0.4% |
| Guamanian / Chamorro | 106 | 0.1% |
| Guatemalan | 1,235 | 0.9% |
| Haitian | 23 | 0.0% |
| Honduran | 331 | 0.2% |
| Hopi | 3 | 0.0% |
| Hungarian | 275 | 0.2% |
| Icelander | 47 | 0.0% |
| Indian (Asian) | 4,868 | 3.5% |
| Indonesian | 6 | 0.0% |
| Iranian | 808 | 0.6% |
| Iraqi | 7 | 0.0% |
| Irish | 8,921 | 6.4% |
| Israeli | 23 | 0.0% |
| Italian | 5,378 | 3.9% |
| Jamaican | 105 | 0.1% |
| Japanese | 292 | 0.2% |
| Jordanian | 118 | 0.1% |
| Kenyan | 55 | 0.0% |
| Korean | 6,207 | 4.5% |
| Laotian | 27 | 0.0% |
| Latvian | 27 | 0.0% |
| Lebanese | 208 | 0.2% |
| Lithuanian | 228 | 0.2% |
| Luxembourger | 19 | 0.0% |
| Malaysian | 115 | 0.1% |
| Maltese | 15 | 0.0% |
| Mexican | 45,505 | 32.8% |
| Mexican American Indian | 627 | 0.4% |
| Moroccan | 31 | 0.0% |
| Native Hawaiian | 423 | 0.3% |
| Navajo | 21 | 0.0% |
| Nicaraguan | 368 | 0.3% |
| Nigerian | 68 | 0.1% |
| Northern European | 208 | 0.2% |
| Norwegian | 1,189 | 0.9% |
| Pakistani | 218 | 0.2% |
| Palestinian | 53 | 0.0% |
| Panamanian | 36 | 0.0% |
| Pennsylvania German | 26 | 0.0% |
| Peruvian | 378 | 0.3% |
| Polish | 1,908 | 1.4% |
| Portuguese | 336 | 0.2% |
| Pueblo | 9 | 0.0% |
| Puerto Rican | 398 | 0.3% |
| Puget Sound Salish | 18 | 0.0% |
| Romanian | 322 | 0.2% |
| Russian | 539 | 0.4% |
| Salvadoran | 1,524 | 1.1% |
| Samoan | 176 | 0.1% |
| Scandinavian | 454 | 0.3% |
| Scotch-Irish | 767 | 0.5% |
| Scottish | 1,815 | 1.3% |
| Seminole | 28 | 0.0% |
| Serbian | 69 | 0.1% |
| Sioux | 26 | 0.0% |
| Slavic | 17 | 0.0% |
| Slovak | 83 | 0.1% |
| Slovene | 11 | 0.0% |
| Somali | 16 | 0.0% |
| South African | 38 | 0.0% |
| South American | 1,809 | 1.3% |
| South American Indian | 55 | 0.0% |
| Spaniard | 750 | 0.5% |
| Spanish | 714 | 0.5% |
| Sri Lankan | 5,604 | 4.0% |
| Subsaharan African | 366 | 0.3% |
| Swedish | 1,292 | 0.9% |
| Swiss | 334 | 0.2% |
| Syrian | 89 | 0.1% |
| Thai | 1,695 | 1.2% |
| Tongan | 48 | 0.0% |
| Trinidadian and Tobagonian | 60 | 0.0% |
| Turkish | 36 | 0.0% |
| Ukrainian | 270 | 0.2% |
| Uruguayan | 333 | 0.2% |
| Venezuelan | 62 | 0.0% |
| Vietnamese | 35 | 0.0% |
| Welsh | 402 | 0.3% |
| Yaqui | 25 | 0.0% |
| Yugoslavian | 68 | 0.1% | View All 135 Rows |
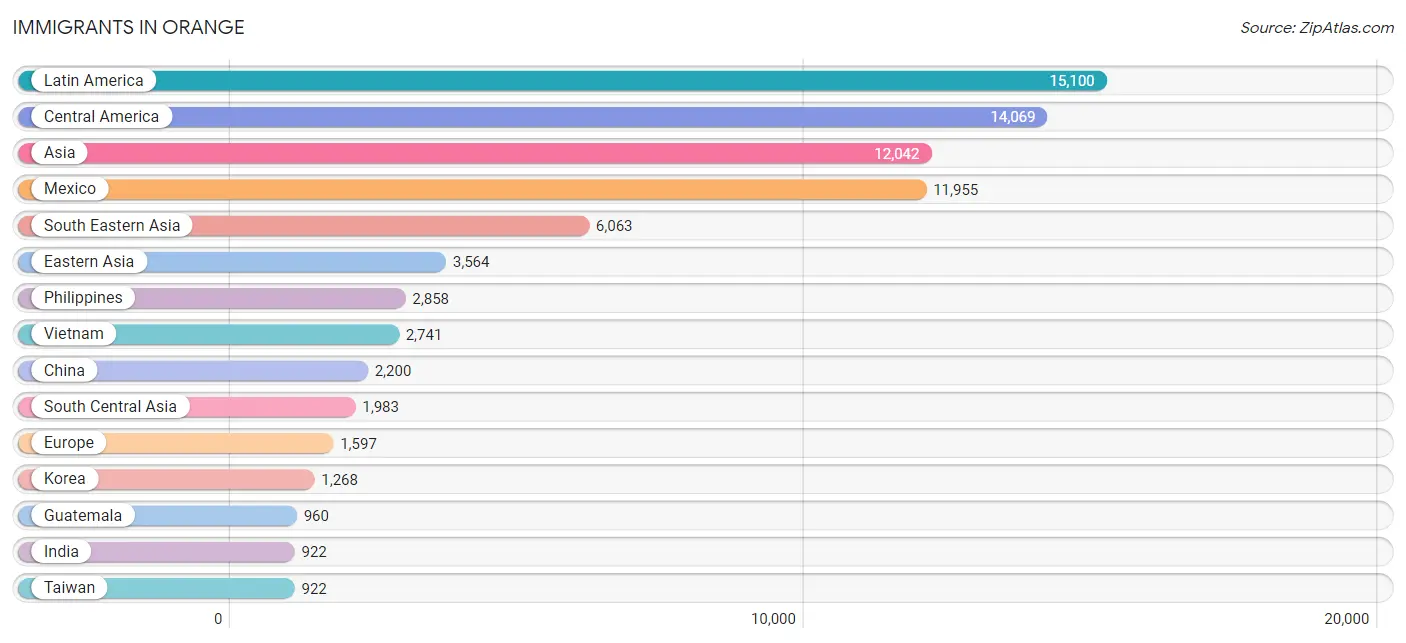
Immigrants in Orange
The most numerous immigrant groups reported in Orange came from Latin America (15,100 | 10.9%), Central America (14,069 | 10.1%), Asia (12,042 | 8.7%), Mexico (11,955 | 8.6%), and South Eastern Asia (6,063 | 4.4%), together accounting for 42.7% of all Orange residents.
| Immigration Origin | # Population | % Population |
| Afghanistan | 300 | 0.2% |
| Africa | 456 | 0.3% |
| Argentina | 57 | 0.0% |
| Asia | 12,042 | 8.7% |
| Australia | 82 | 0.1% |
| Bangladesh | 33 | 0.0% |
| Belarus | 16 | 0.0% |
| Bolivia | 48 | 0.0% |
| Brazil | 78 | 0.1% |
| Bulgaria | 133 | 0.1% |
| Cambodia | 157 | 0.1% |
| Canada | 429 | 0.3% |
| Caribbean | 278 | 0.2% |
| Central America | 14,069 | 10.1% |
| Chile | 9 | 0.0% |
| China | 2,200 | 1.6% |
| Colombia | 170 | 0.1% |
| Cuba | 147 | 0.1% |
| Czechoslovakia | 25 | 0.0% |
| Denmark | 9 | 0.0% |
| Eastern Africa | 131 | 0.1% |
| Eastern Asia | 3,564 | 2.6% |
| Eastern Europe | 387 | 0.3% |
| Ecuador | 42 | 0.0% |
| Egypt | 125 | 0.1% |
| El Salvador | 909 | 0.7% |
| England | 254 | 0.2% |
| Europe | 1,597 | 1.1% |
| Fiji | 10 | 0.0% |
| France | 21 | 0.0% |
| Germany | 185 | 0.1% |
| Greece | 55 | 0.0% |
| Grenada | 11 | 0.0% |
| Guatemala | 960 | 0.7% |
| Honduras | 48 | 0.0% |
| Hong Kong | 355 | 0.3% |
| Hungary | 9 | 0.0% |
| India | 922 | 0.7% |
| Indonesia | 65 | 0.1% |
| Iran | 603 | 0.4% |
| Iraq | 8 | 0.0% |
| Ireland | 119 | 0.1% |
| Israel | 33 | 0.0% |
| Italy | 108 | 0.1% |
| Jamaica | 60 | 0.0% |
| Japan | 96 | 0.1% |
| Jordan | 94 | 0.1% |
| Kenya | 64 | 0.1% |
| Korea | 1,268 | 0.9% |
| Kuwait | 16 | 0.0% |
| Laos | 57 | 0.0% |
| Latin America | 15,100 | 10.9% |
| Lebanon | 68 | 0.1% |
| Lithuania | 19 | 0.0% |
| Malaysia | 92 | 0.1% |
| Mexico | 11,955 | 8.6% |
| Morocco | 11 | 0.0% |
| Nepal | 19 | 0.0% |
| Netherlands | 93 | 0.1% |
| Nicaragua | 154 | 0.1% |
| Nigeria | 47 | 0.0% |
| Northern Africa | 147 | 0.1% |
| Northern Europe | 660 | 0.5% |
| Oceania | 312 | 0.2% |
| Pakistan | 106 | 0.1% |
| Panama | 12 | 0.0% |
| Peru | 299 | 0.2% |
| Philippines | 2,858 | 2.1% |
| Poland | 35 | 0.0% |
| Portugal | 32 | 0.0% |
| Romania | 97 | 0.1% |
| Russia | 26 | 0.0% |
| Saudi Arabia | 42 | 0.0% |
| Scotland | 102 | 0.1% |
| Somalia | 16 | 0.0% |
| South Africa | 118 | 0.1% |
| South America | 753 | 0.5% |
| South Central Asia | 1,983 | 1.4% |
| South Eastern Asia | 6,063 | 4.4% |
| Southern Europe | 233 | 0.2% |
| Spain | 38 | 0.0% |
| Sweden | 10 | 0.0% |
| Switzerland | 18 | 0.0% |
| Syria | 85 | 0.1% |
| Taiwan | 922 | 0.7% |
| Thailand | 93 | 0.1% |
| Trinidad and Tobago | 60 | 0.0% |
| Turkey | 7 | 0.0% |
| Ukraine | 27 | 0.0% |
| Uruguay | 8 | 0.0% |
| Venezuela | 31 | 0.0% |
| Vietnam | 2,741 | 2.0% |
| Western Africa | 47 | 0.0% |
| Western Asia | 389 | 0.3% |
| Western Europe | 317 | 0.2% | View All 95 Rows |
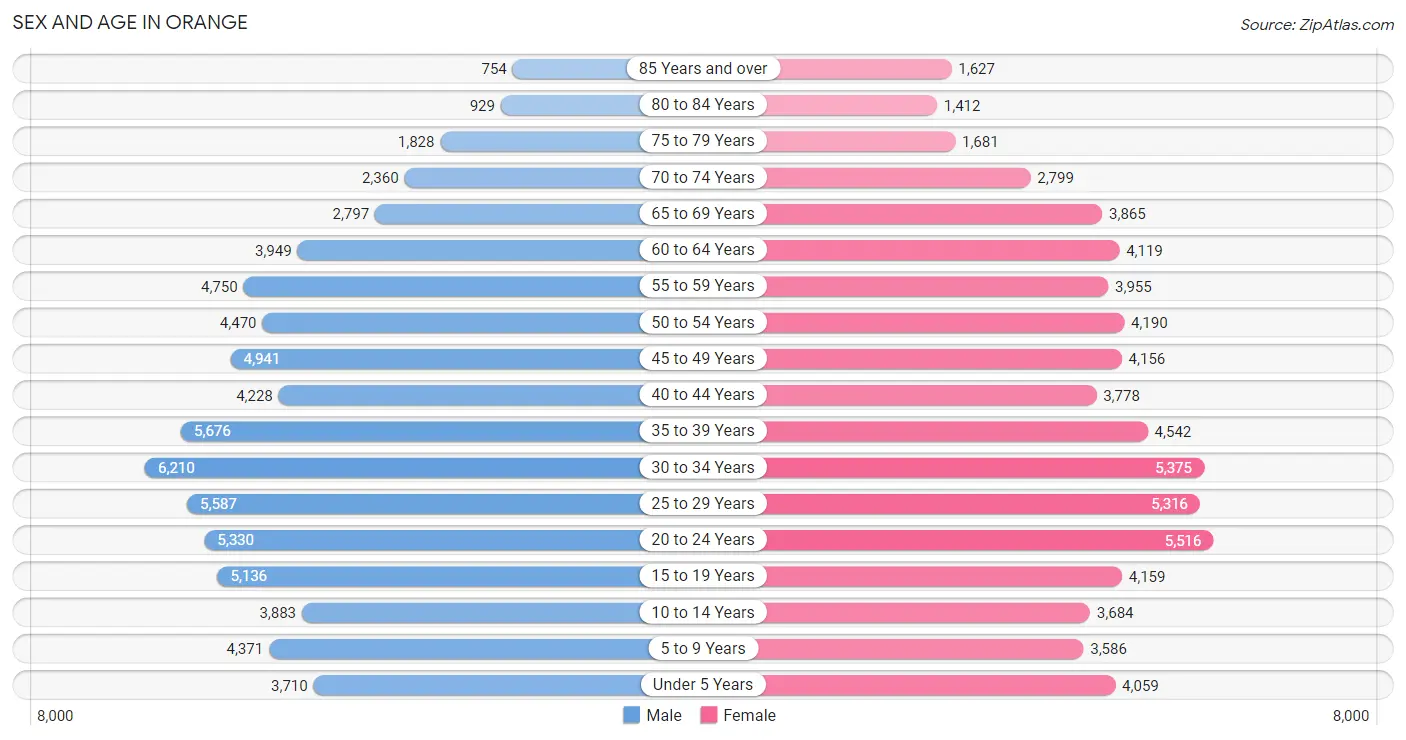
Sex and Age in Orange
Sex and Age in Orange
The most populous age groups in Orange are 30 to 34 Years (6,210 | 8.8%) for men and 20 to 24 Years (5,516 | 8.1%) for women.
| Age Bracket | Male | Female |
| Under 5 Years | 3,710 (5.2%) | 4,059 (6.0%) |
| 5 to 9 Years | 4,371 (6.2%) | 3,586 (5.3%) |
| 10 to 14 Years | 3,883 (5.5%) | 3,684 (5.4%) |
| 15 to 19 Years | 5,136 (7.2%) | 4,159 (6.1%) |
| 20 to 24 Years | 5,330 (7.5%) | 5,516 (8.1%) |
| 25 to 29 Years | 5,587 (7.9%) | 5,316 (7.8%) |
| 30 to 34 Years | 6,210 (8.8%) | 5,375 (7.9%) |
| 35 to 39 Years | 5,676 (8.0%) | 4,542 (6.7%) |
| 40 to 44 Years | 4,228 (6.0%) | 3,778 (5.6%) |
| 45 to 49 Years | 4,941 (7.0%) | 4,156 (6.1%) |
| 50 to 54 Years | 4,470 (6.3%) | 4,190 (6.2%) |
| 55 to 59 Years | 4,750 (6.7%) | 3,955 (5.8%) |
| 60 to 64 Years | 3,949 (5.6%) | 4,119 (6.1%) |
| 65 to 69 Years | 2,797 (3.9%) | 3,865 (5.7%) |
| 70 to 74 Years | 2,360 (3.3%) | 2,799 (4.1%) |
| 75 to 79 Years | 1,828 (2.6%) | 1,681 (2.5%) |
| 80 to 84 Years | 929 (1.3%) | 1,412 (2.1%) |
| 85 Years and over | 754 (1.1%) | 1,627 (2.4%) |
| Total | 70,909 (100.0%) | 67,819 (100.0%) |
Families and Households in Orange
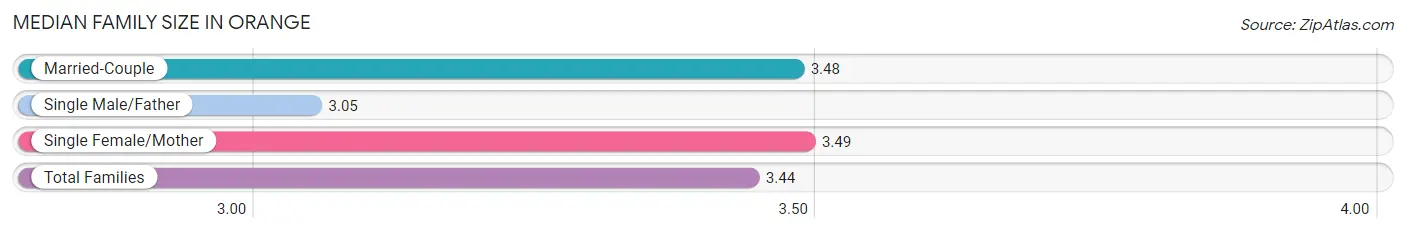
Median Family Size in Orange
The median family size in Orange is 3.44 persons per family, with single female/mother families (5,158 | 16.4%) accounting for the largest median family size of 3.49 persons per family. On the other hand, single male/father families (2,501 | 8.0%) represent the smallest median family size with 3.05 persons per family.
| Family Type | # Families | Family Size |
| Married-Couple | 23,732 (75.6%) | 3.48 |
| Single Male/Father | 2,501 (8.0%) | 3.05 |
| Single Female/Mother | 5,158 (16.4%) | 3.49 |
| Total Families | 31,391 (100.0%) | 3.44 |
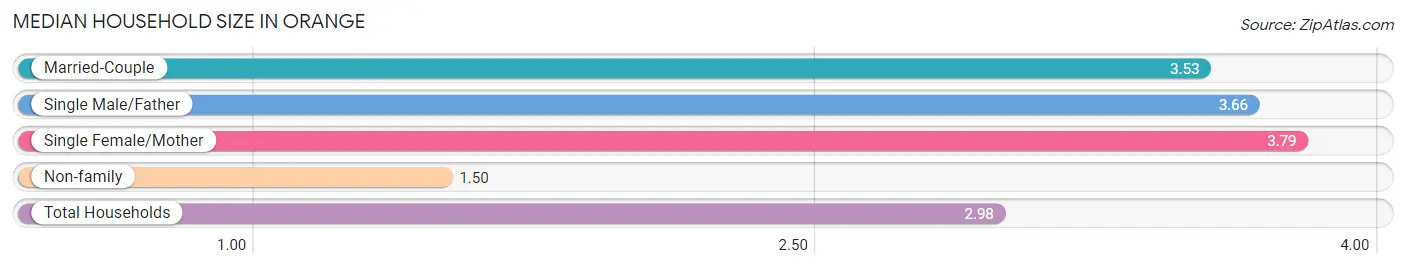
Median Household Size in Orange
The median household size in Orange is 2.98 persons per household, with single female/mother households (5,158 | 11.6%) accounting for the largest median household size of 3.79 persons per household. non-family households (12,945 | 29.2%) represent the smallest median household size with 1.50 persons per household.
| Household Type | # Households | Household Size |
| Married-Couple | 23,732 (53.5%) | 3.53 |
| Single Male/Father | 2,501 (5.6%) | 3.66 |
| Single Female/Mother | 5,158 (11.6%) | 3.79 |
| Non-family | 12,945 (29.2%) | 1.50 |
| Total Households | 44,336 (100.0%) | 2.98 |
Household Size by Marriage Status in Orange
Out of a total of 44,336 households in Orange, 31,391 (70.8%) are family households, while 12,945 (29.2%) are nonfamily households. The most numerous type of family households are 2-person households, comprising 10,465, and the most common type of nonfamily households are 1-person households, comprising 8,972.
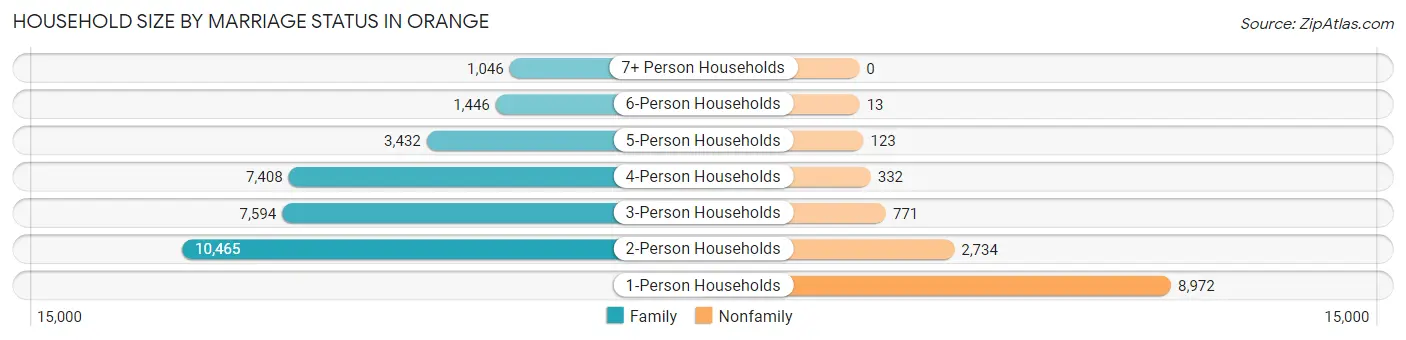
| Household Size | Family Households | Nonfamily Households |
| 1-Person Households | - | 8,972 (20.2%) |
| 2-Person Households | 10,465 (23.6%) | 2,734 (6.2%) |
| 3-Person Households | 7,594 (17.1%) | 771 (1.7%) |
| 4-Person Households | 7,408 (16.7%) | 332 (0.7%) |
| 5-Person Households | 3,432 (7.7%) | 123 (0.3%) |
| 6-Person Households | 1,446 (3.3%) | 13 (0.0%) |
| 7+ Person Households | 1,046 (2.4%) | 0 (0.0%) |
| Total | 31,391 (70.8%) | 12,945 (29.2%) |
Female Fertility in Orange
Fertility by Age in Orange
Average fertility rate in Orange is 40.0 births per 1,000 women. Women in the age bracket of 20 to 34 years have the highest fertility rate with 51.0 births per 1,000 women. Women in the age bracket of 20 to 34 years acount for 61.2% of all women with births.
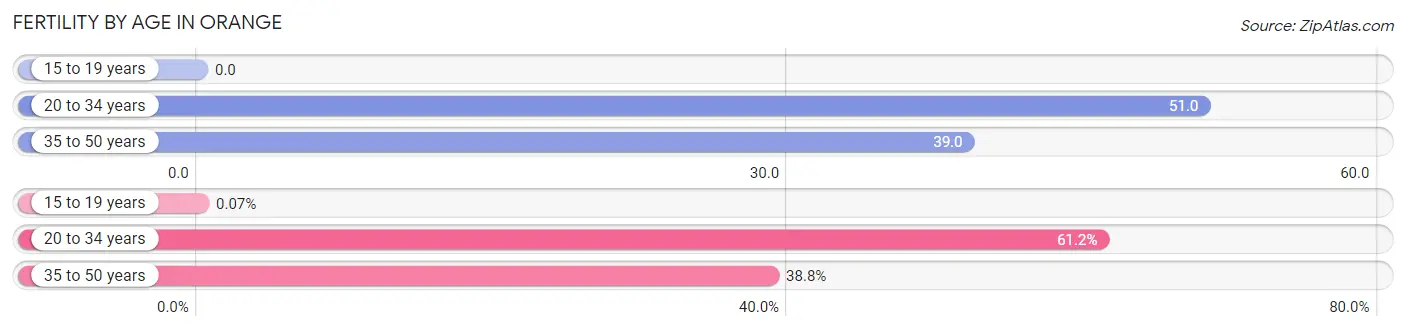
| Age Bracket | Women with Births | Births / 1,000 Women |
| 15 to 19 years | 1 (0.1%) | 0.0 |
| 20 to 34 years | 830 (61.2%) | 51.0 |
| 35 to 50 years | 526 (38.8%) | 39.0 |
| Total | 1,357 (100.0%) | 40.0 |
Fertility by Age by Marriage Status in Orange
81.2% of women with births (1,357) in Orange are married. The highest percentage of unmarried women with births falls into 15 to 19 years age bracket with 100.0% of them unmarried at the time of birth, while the lowest percentage of unmarried women with births belong to 35 to 50 years age bracket with 4.9% of them unmarried.
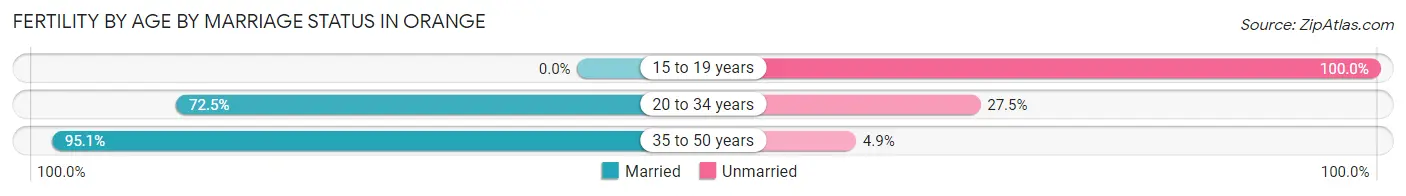
| Age Bracket | Married | Unmarried |
| 15 to 19 years | 0 (0.0%) | 1 (100.0%) |
| 20 to 34 years | 602 (72.5%) | 228 (27.5%) |
| 35 to 50 years | 500 (95.1%) | 26 (4.9%) |
| Total | 1,102 (81.2%) | 255 (18.8%) |
Fertility by Education in Orange
Average fertility rate in Orange is 40.0 births per 1,000 women. Women with the education attainment of graduate degree have the highest fertility rate of 115.0 births per 1,000 women, while women with the education attainment of less than high school have the lowest fertility at 23.0 births per 1,000 women. Women with the education attainment of graduate degree represent 31.2% of all women with births.
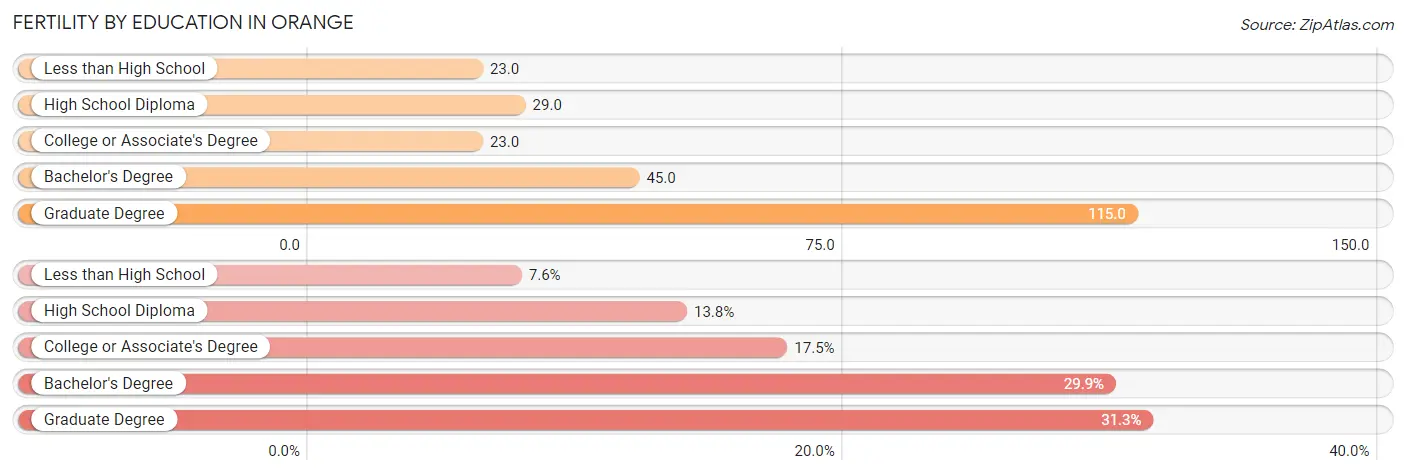
| Educational Attainment | Women with Births | Births / 1,000 Women |
| Less than High School | 103 (7.6%) | 23.0 |
| High School Diploma | 187 (13.8%) | 29.0 |
| College or Associate's Degree | 238 (17.5%) | 23.0 |
| Bachelor's Degree | 405 (29.8%) | 45.0 |
| Graduate Degree | 424 (31.2%) | 115.0 |
| Total | 1,357 (100.0%) | 40.0 |
Fertility by Education by Marriage Status in Orange
18.8% of women with births in Orange are unmarried. Women with the educational attainment of less than high school are most likely to be married with 94.2% of them married at childbirth, while women with the educational attainment of high school diploma are least likely to be married with 52.4% of them unmarried at childbirth.
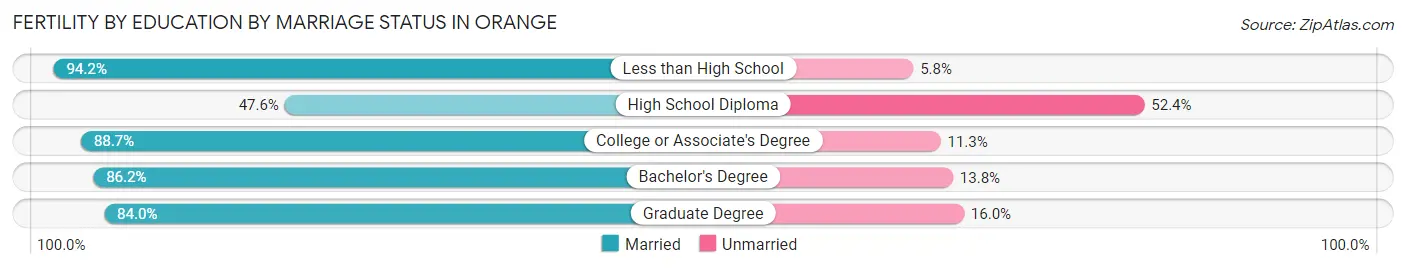
| Educational Attainment | Married | Unmarried |
| Less than High School | 97 (94.2%) | 6 (5.8%) |
| High School Diploma | 89 (47.6%) | 98 (52.4%) |
| College or Associate's Degree | 211 (88.7%) | 27 (11.3%) |
| Bachelor's Degree | 349 (86.2%) | 56 (13.8%) |
| Graduate Degree | 356 (84.0%) | 68 (16.0%) |
| Total | 1,102 (81.2%) | 255 (18.8%) |
Employment Characteristics in Orange
Employment by Class of Employer in Orange
Among the 70,170 employed individuals in Orange, private company employees (47,393 | 67.5%), local government employees (5,962 | 8.5%), and not-for-profit organizations (5,295 | 7.5%) make up the most common classes of employment.
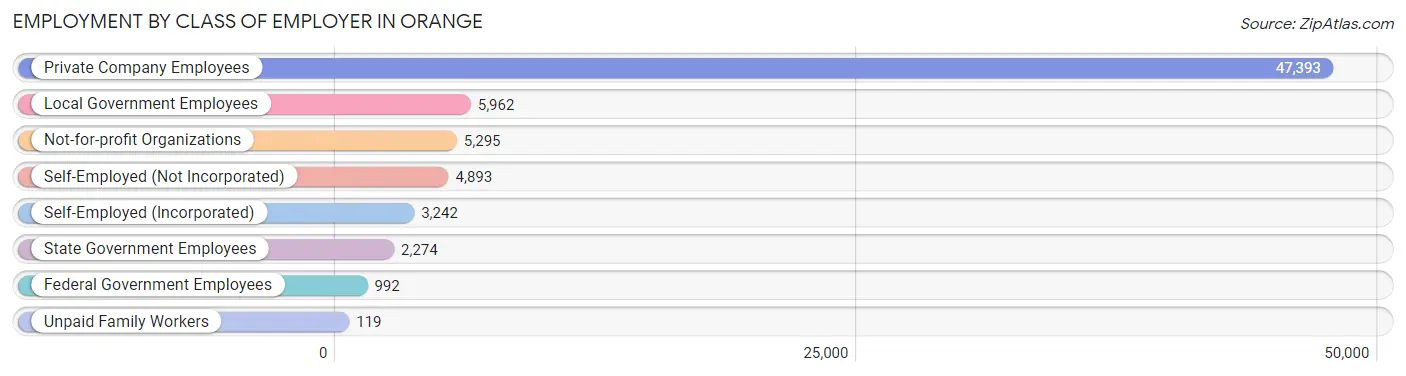
| Employer Class | # Employees | % Employees |
| Private Company Employees | 47,393 | 67.5% |
| Self-Employed (Incorporated) | 3,242 | 4.6% |
| Self-Employed (Not Incorporated) | 4,893 | 7.0% |
| Not-for-profit Organizations | 5,295 | 7.5% |
| Local Government Employees | 5,962 | 8.5% |
| State Government Employees | 2,274 | 3.2% |
| Federal Government Employees | 992 | 1.4% |
| Unpaid Family Workers | 119 | 0.2% |
| Total | 70,170 | 100.0% |
Employment Status by Age in Orange
According to the labor force statistics for Orange, out of the total population over 16 years of age (113,918), 66.1% or 75,300 individuals are in the labor force, with 4.7% or 3,539 of them unemployed. The age group with the highest labor force participation rate is 35 to 44 years, with 85.8% or 15,636 individuals in the labor force. Within the labor force, the 16 to 19 years age range has the highest percentage of unemployed individuals, with 18.2% or 503 of them being unemployed.
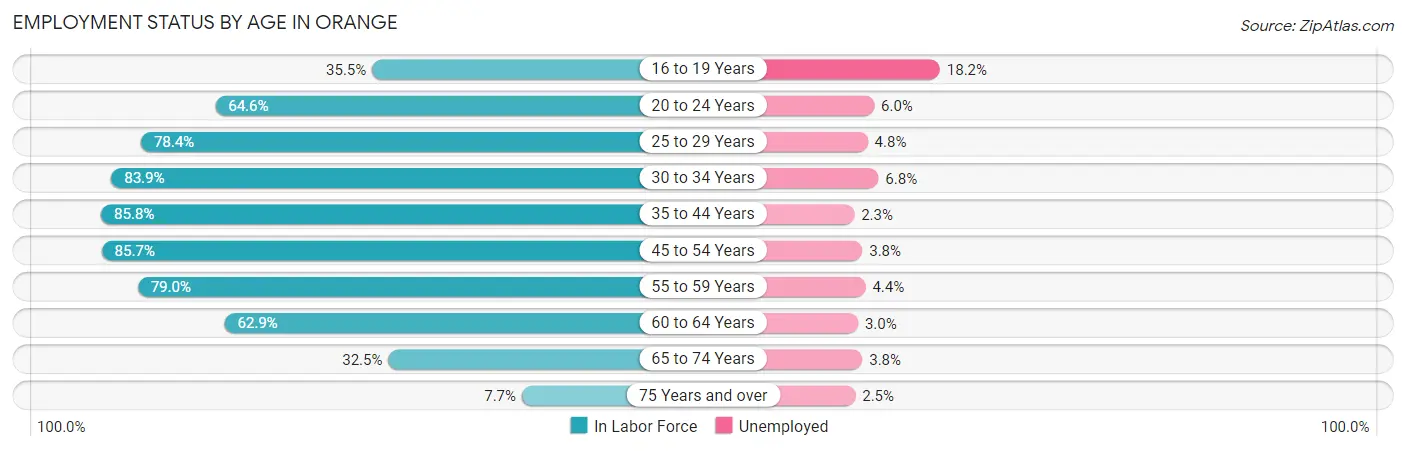
| Age Bracket | In Labor Force | Unemployed |
| 16 to 19 Years | 2,761 (35.5%) | 503 (18.2%) |
| 20 to 24 Years | 7,007 (64.6%) | 420 (6.0%) |
| 25 to 29 Years | 8,548 (78.4%) | 410 (4.8%) |
| 30 to 34 Years | 9,720 (83.9%) | 661 (6.8%) |
| 35 to 44 Years | 15,636 (85.8%) | 360 (2.3%) |
| 45 to 54 Years | 15,218 (85.7%) | 578 (3.8%) |
| 55 to 59 Years | 6,877 (79.0%) | 303 (4.4%) |
| 60 to 64 Years | 5,075 (62.9%) | 152 (3.0%) |
| 65 to 74 Years | 3,842 (32.5%) | 146 (3.8%) |
| 75 Years and over | 634 (7.7%) | 16 (2.5%) |
| Total | 75,300 (66.1%) | 3,539 (4.7%) |
Employment Status by Educational Attainment in Orange
According to labor force statistics for Orange, 81.2% of individuals (61,097) out of the total population between 25 and 64 years of age (75,242) are in the labor force, with 4.0% or 2,444 of them being unemployed. The group with the highest labor force participation rate are those with the educational attainment of bachelor's degree or higher, with 88.4% or 27,539 individuals in the labor force. Within the labor force, individuals with less than high school education have the highest percentage of unemployment, with 8.6% or 495 of them being unemployed.
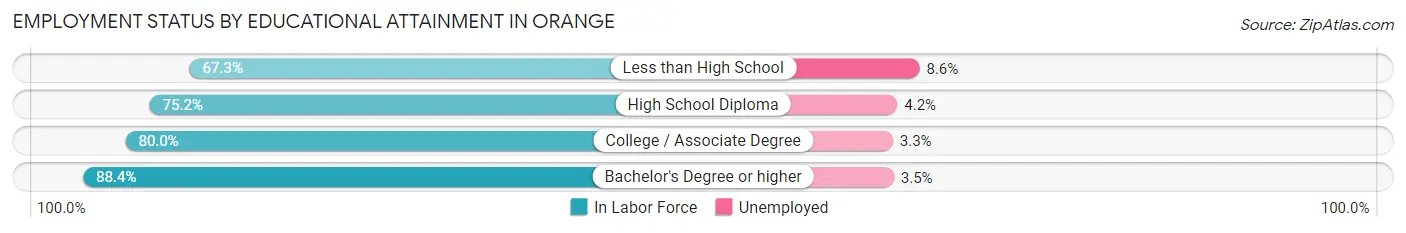
| Educational Attainment | In Labor Force | Unemployed |
| Less than High School | 5,753 (67.3%) | 735 (8.6%) |
| High School Diploma | 10,178 (75.2%) | 568 (4.2%) |
| College / Associate Degree | 17,604 (80.0%) | 726 (3.3%) |
| Bachelor's Degree or higher | 27,539 (88.4%) | 1,090 (3.5%) |
| Total | 61,097 (81.2%) | 3,010 (4.0%) |
Employment Occupations by Sex in Orange
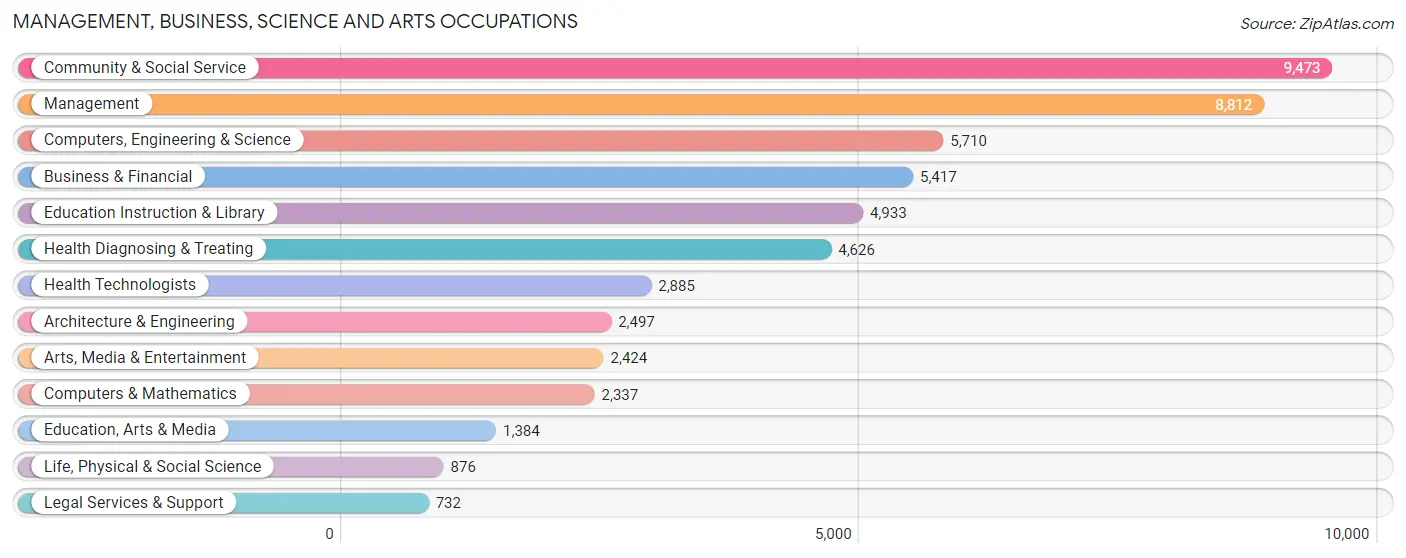
Management, Business, Science and Arts Occupations
The most common Management, Business, Science and Arts occupations in Orange are Community & Social Service (9,473 | 13.2%), Management (8,812 | 12.3%), Computers, Engineering & Science (5,710 | 8.0%), Business & Financial (5,417 | 7.5%), and Education Instruction & Library (4,933 | 6.9%).
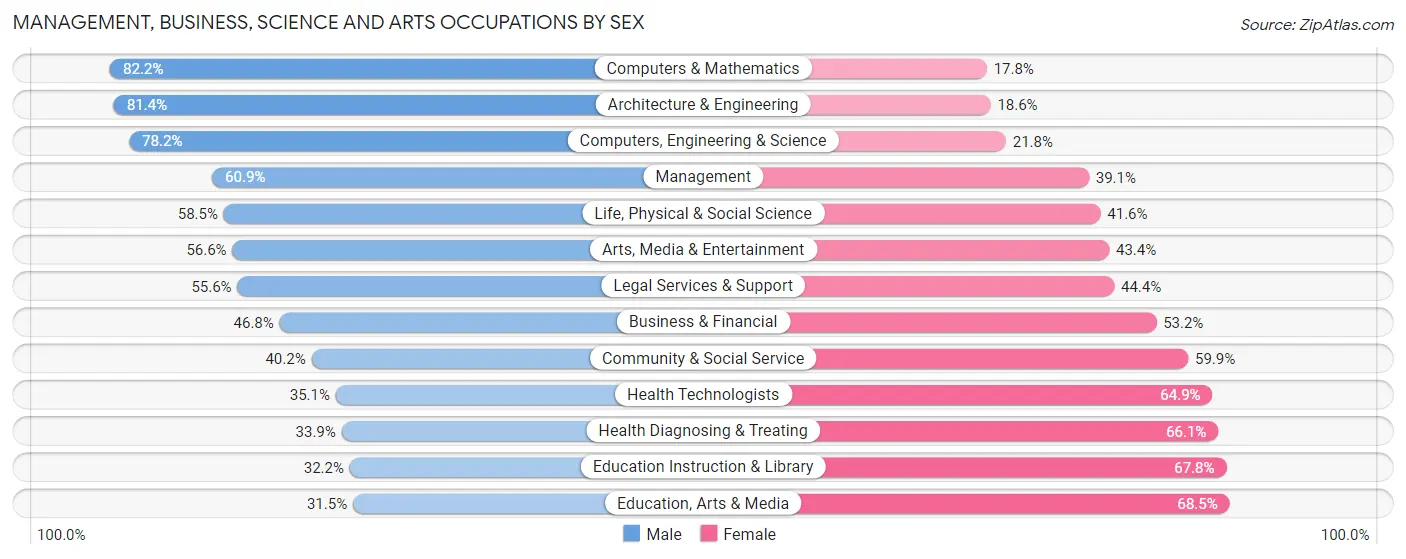
Management, Business, Science and Arts Occupations by Sex
Within the Management, Business, Science and Arts occupations in Orange, the most male-oriented occupations are Computers & Mathematics (82.2%), Architecture & Engineering (81.4%), and Computers, Engineering & Science (78.2%), while the most female-oriented occupations are Education, Arts & Media (68.5%), Education Instruction & Library (67.8%), and Health Diagnosing & Treating (66.1%).
| Occupation | Male | Female |
| Management | 5,364 (60.9%) | 3,448 (39.1%) |
| Business & Financial | 2,535 (46.8%) | 2,882 (53.2%) |
| Computers, Engineering & Science | 4,464 (78.2%) | 1,246 (21.8%) |
| Computers & Mathematics | 1,920 (82.2%) | 417 (17.8%) |
| Architecture & Engineering | 2,032 (81.4%) | 465 (18.6%) |
| Life, Physical & Social Science | 512 (58.5%) | 364 (41.5%) |
| Community & Social Service | 3,803 (40.2%) | 5,670 (59.9%) |
| Education, Arts & Media | 436 (31.5%) | 948 (68.5%) |
| Legal Services & Support | 407 (55.6%) | 325 (44.4%) |
| Education Instruction & Library | 1,587 (32.2%) | 3,346 (67.8%) |
| Arts, Media & Entertainment | 1,373 (56.6%) | 1,051 (43.4%) |
| Health Diagnosing & Treating | 1,567 (33.9%) | 3,059 (66.1%) |
| Health Technologists | 1,012 (35.1%) | 1,873 (64.9%) |
| Total (Category) | 17,733 (52.1%) | 16,305 (47.9%) |
| Total (Overall) | 38,947 (54.3%) | 32,794 (45.7%) |
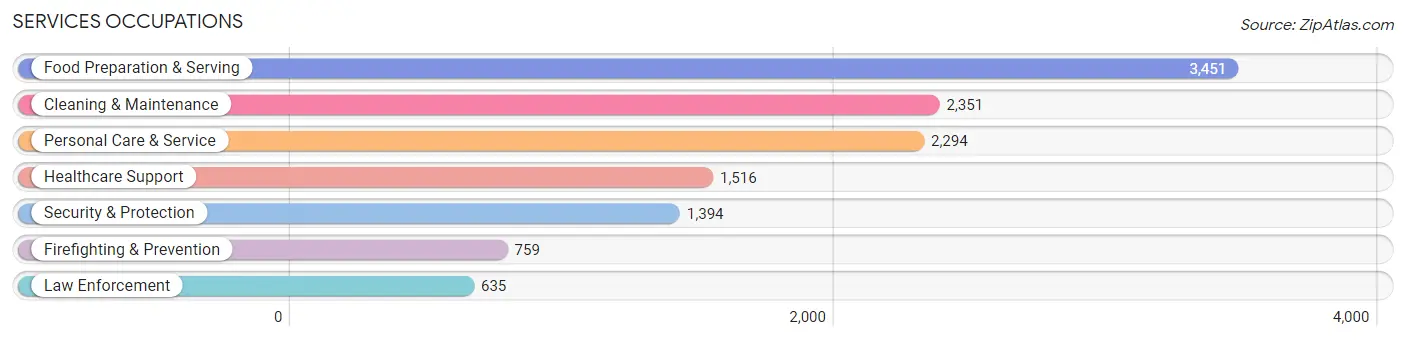
Services Occupations
The most common Services occupations in Orange are Food Preparation & Serving (3,451 | 4.8%), Cleaning & Maintenance (2,351 | 3.3%), Personal Care & Service (2,294 | 3.2%), Healthcare Support (1,516 | 2.1%), and Security & Protection (1,394 | 1.9%).
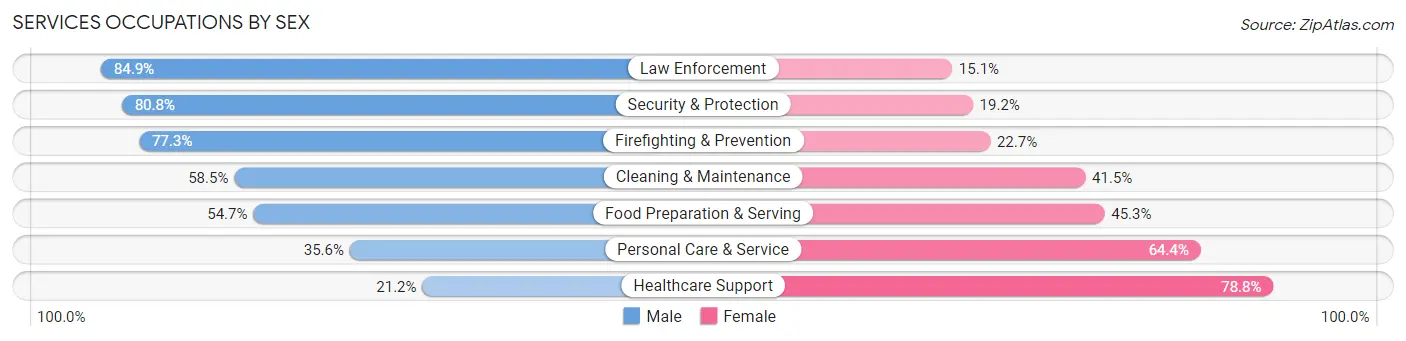
Services Occupations by Sex
Within the Services occupations in Orange, the most male-oriented occupations are Law Enforcement (84.9%), Security & Protection (80.8%), and Firefighting & Prevention (77.3%), while the most female-oriented occupations are Healthcare Support (78.8%), Personal Care & Service (64.4%), and Food Preparation & Serving (45.3%).
| Occupation | Male | Female |
| Healthcare Support | 322 (21.2%) | 1,194 (78.8%) |
| Security & Protection | 1,126 (80.8%) | 268 (19.2%) |
| Firefighting & Prevention | 587 (77.3%) | 172 (22.7%) |
| Law Enforcement | 539 (84.9%) | 96 (15.1%) |
| Food Preparation & Serving | 1,888 (54.7%) | 1,563 (45.3%) |
| Cleaning & Maintenance | 1,375 (58.5%) | 976 (41.5%) |
| Personal Care & Service | 817 (35.6%) | 1,477 (64.4%) |
| Total (Category) | 5,528 (50.2%) | 5,478 (49.8%) |
| Total (Overall) | 38,947 (54.3%) | 32,794 (45.7%) |
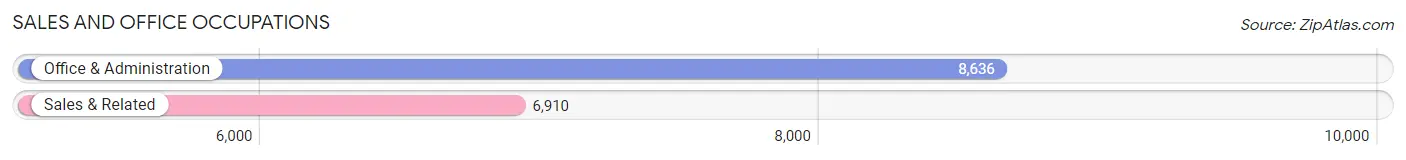
Sales and Office Occupations
The most common Sales and Office occupations in Orange are Office & Administration (8,636 | 12.0%), and Sales & Related (6,910 | 9.6%).
Sales and Office Occupations by Sex
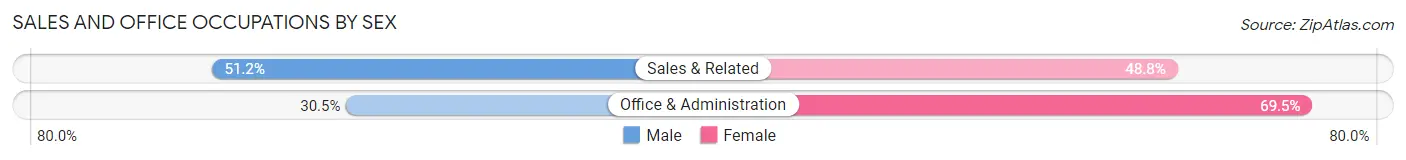
| Occupation | Male | Female |
| Sales & Related | 3,541 (51.2%) | 3,369 (48.8%) |
| Office & Administration | 2,635 (30.5%) | 6,001 (69.5%) |
| Total (Category) | 6,176 (39.7%) | 9,370 (60.3%) |
| Total (Overall) | 38,947 (54.3%) | 32,794 (45.7%) |
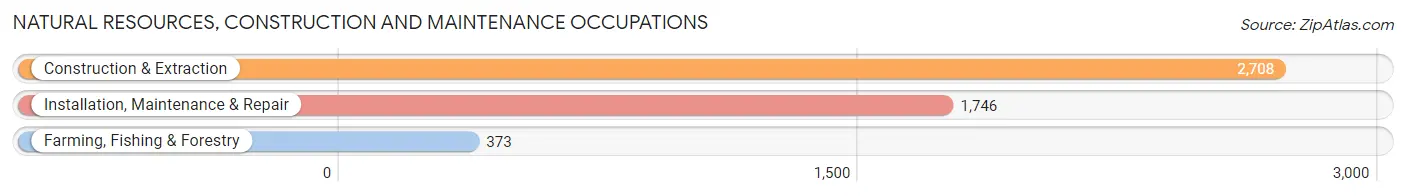
Natural Resources, Construction and Maintenance Occupations
The most common Natural Resources, Construction and Maintenance occupations in Orange are Construction & Extraction (2,708 | 3.8%), Installation, Maintenance & Repair (1,746 | 2.4%), and Farming, Fishing & Forestry (373 | 0.5%).
Natural Resources, Construction and Maintenance Occupations by Sex
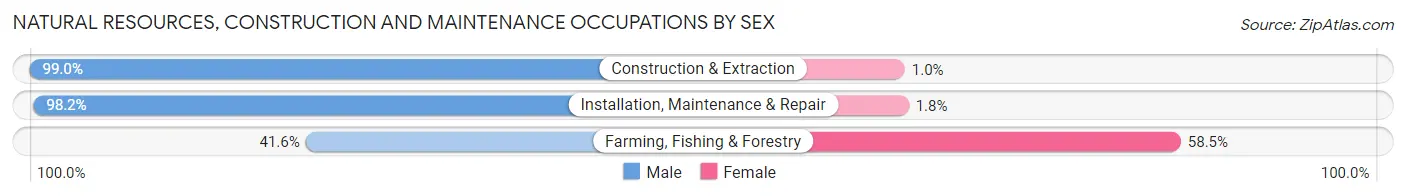
| Occupation | Male | Female |
| Farming, Fishing & Forestry | 155 (41.5%) | 218 (58.5%) |
| Construction & Extraction | 2,680 (99.0%) | 28 (1.0%) |
| Installation, Maintenance & Repair | 1,714 (98.2%) | 32 (1.8%) |
| Total (Category) | 4,549 (94.2%) | 278 (5.8%) |
| Total (Overall) | 38,947 (54.3%) | 32,794 (45.7%) |
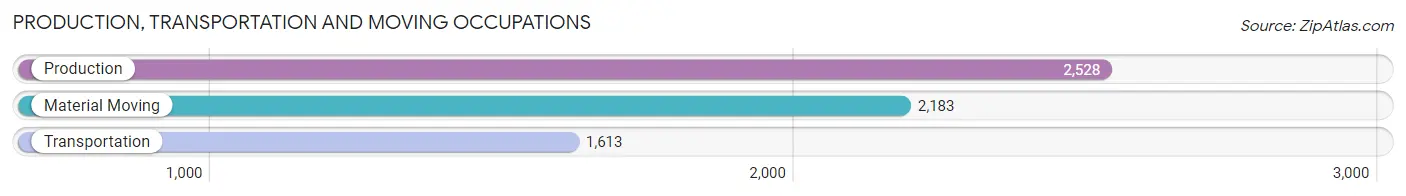
Production, Transportation and Moving Occupations
The most common Production, Transportation and Moving occupations in Orange are Production (2,528 | 3.5%), Material Moving (2,183 | 3.0%), and Transportation (1,613 | 2.2%).
Production, Transportation and Moving Occupations by Sex
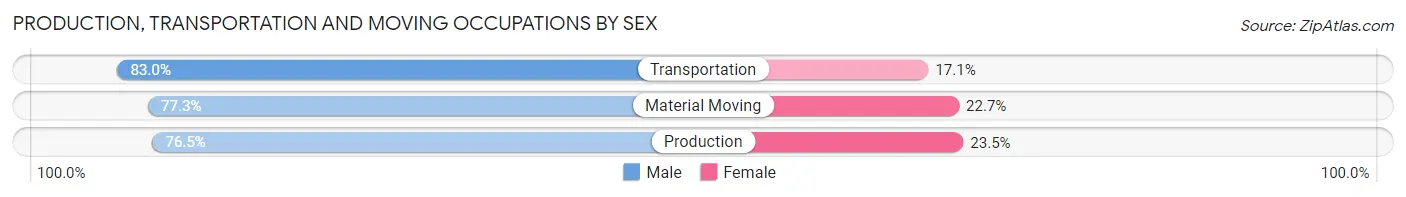
| Occupation | Male | Female |
| Production | 1,935 (76.5%) | 593 (23.5%) |
| Transportation | 1,338 (83.0%) | 275 (17.1%) |
| Material Moving | 1,688 (77.3%) | 495 (22.7%) |
| Total (Category) | 4,961 (78.4%) | 1,363 (21.5%) |
| Total (Overall) | 38,947 (54.3%) | 32,794 (45.7%) |
Employment Industries by Sex in Orange
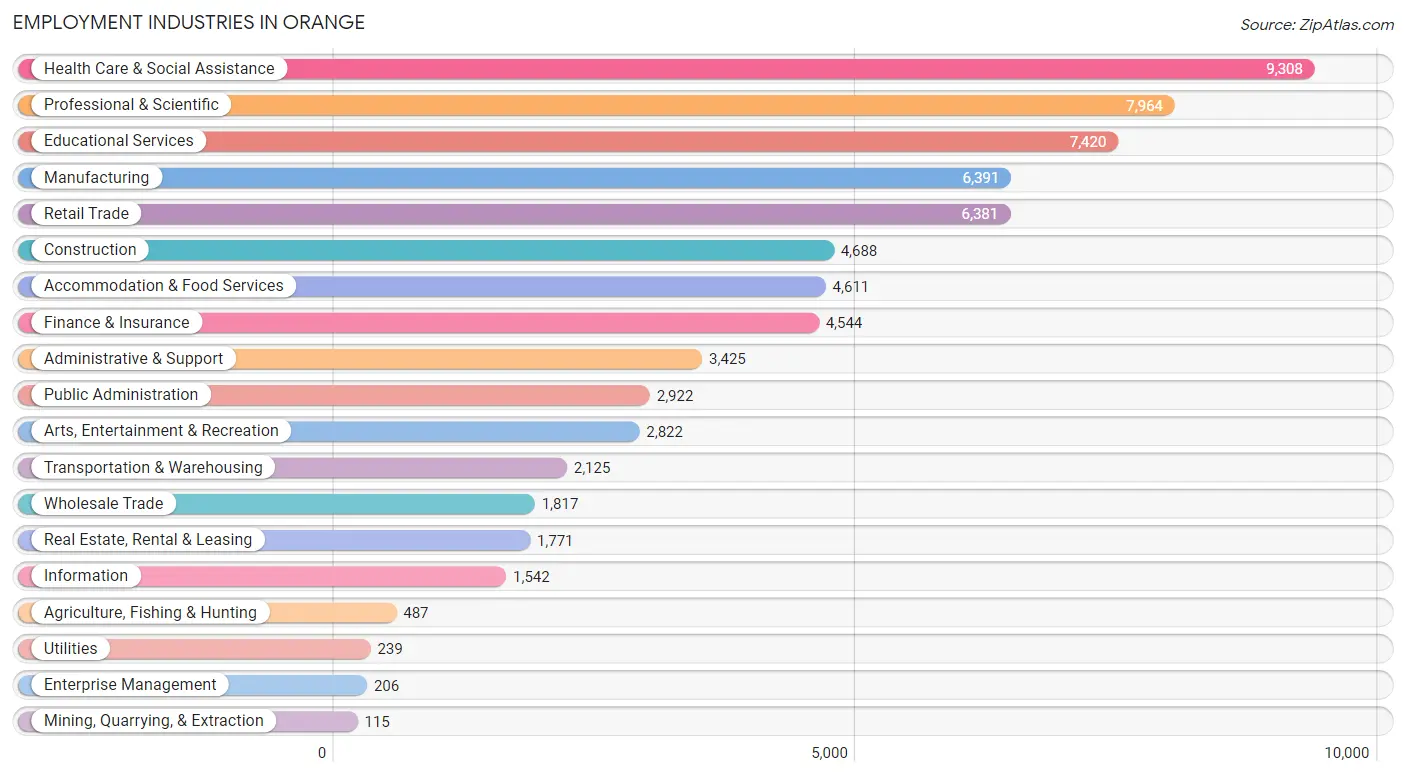
Employment Industries in Orange
The major employment industries in Orange include Health Care & Social Assistance (9,308 | 13.0%), Professional & Scientific (7,964 | 11.1%), Educational Services (7,420 | 10.3%), Manufacturing (6,391 | 8.9%), and Retail Trade (6,381 | 8.9%).
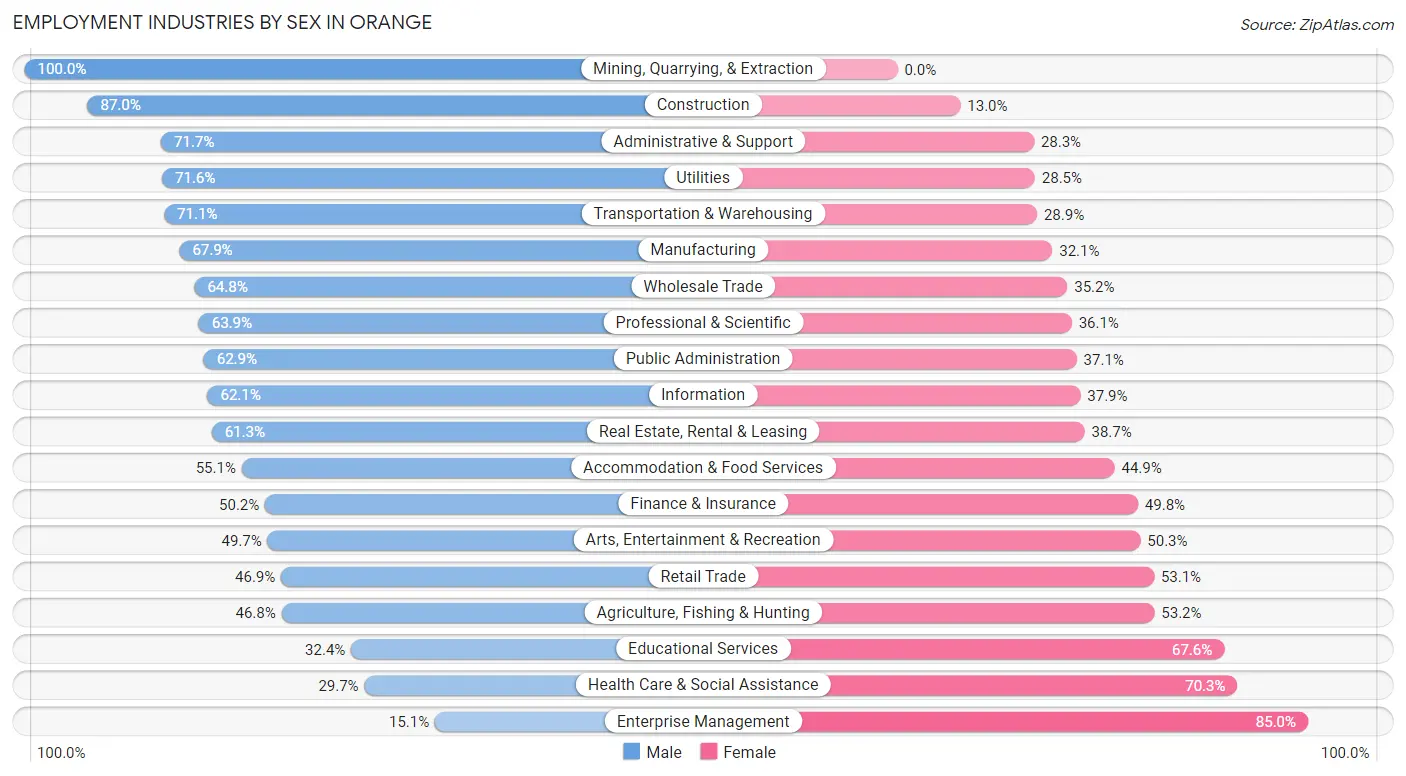
Employment Industries by Sex in Orange
The Orange industries that see more men than women are Mining, Quarrying, & Extraction (100.0%), Construction (87.0%), and Administrative & Support (71.7%), whereas the industries that tend to have a higher number of women are Enterprise Management (85.0%), Health Care & Social Assistance (70.3%), and Educational Services (67.6%).
| Industry | Male | Female |
| Agriculture, Fishing & Hunting | 228 (46.8%) | 259 (53.2%) |
| Mining, Quarrying, & Extraction | 115 (100.0%) | 0 (0.0%) |
| Construction | 4,077 (87.0%) | 611 (13.0%) |
| Manufacturing | 4,342 (67.9%) | 2,049 (32.1%) |
| Wholesale Trade | 1,178 (64.8%) | 639 (35.2%) |
| Retail Trade | 2,993 (46.9%) | 3,388 (53.1%) |
| Transportation & Warehousing | 1,511 (71.1%) | 614 (28.9%) |
| Utilities | 171 (71.6%) | 68 (28.4%) |
| Information | 958 (62.1%) | 584 (37.9%) |
| Finance & Insurance | 2,282 (50.2%) | 2,262 (49.8%) |
| Real Estate, Rental & Leasing | 1,085 (61.3%) | 686 (38.7%) |
| Professional & Scientific | 5,091 (63.9%) | 2,873 (36.1%) |
| Enterprise Management | 31 (15.0%) | 175 (85.0%) |
| Administrative & Support | 2,457 (71.7%) | 968 (28.3%) |
| Educational Services | 2,405 (32.4%) | 5,015 (67.6%) |
| Health Care & Social Assistance | 2,761 (29.7%) | 6,547 (70.3%) |
| Arts, Entertainment & Recreation | 1,403 (49.7%) | 1,419 (50.3%) |
| Accommodation & Food Services | 2,539 (55.1%) | 2,072 (44.9%) |
| Public Administration | 1,838 (62.9%) | 1,084 (37.1%) |
| Total | 38,947 (54.3%) | 32,794 (45.7%) |
Education in Orange
School Enrollment in Orange
The most common levels of schooling among the 37,376 students in Orange are college / undergraduate (11,408 | 30.5%), high school (6,713 | 18.0%), and middle school (6,438 | 17.2%).
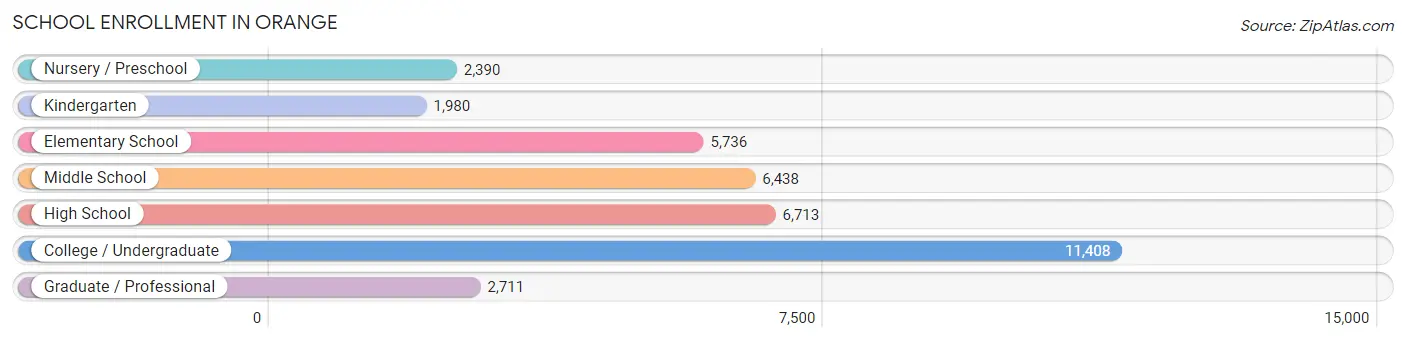
| School Level | # Students | % Students |
| Nursery / Preschool | 2,390 | 6.4% |
| Kindergarten | 1,980 | 5.3% |
| Elementary School | 5,736 | 15.3% |
| Middle School | 6,438 | 17.2% |
| High School | 6,713 | 18.0% |
| College / Undergraduate | 11,408 | 30.5% |
| Graduate / Professional | 2,711 | 7.2% |
| Total | 37,376 | 100.0% |
School Enrollment by Age by Funding Source in Orange
Out of a total of 37,376 students who are enrolled in schools in Orange, 8,709 (23.3%) attend a private institution, while the remaining 28,667 (76.7%) are enrolled in public schools. The age group of 3 to 4 year olds has the highest likelihood of being enrolled in private schools, with 860 (45.3% in the age bracket) enrolled. Conversely, the age group of 10 to 14 year olds has the lowest likelihood of being enrolled in a private school, with 6,522 (87.5% in the age bracket) attending a public institution.
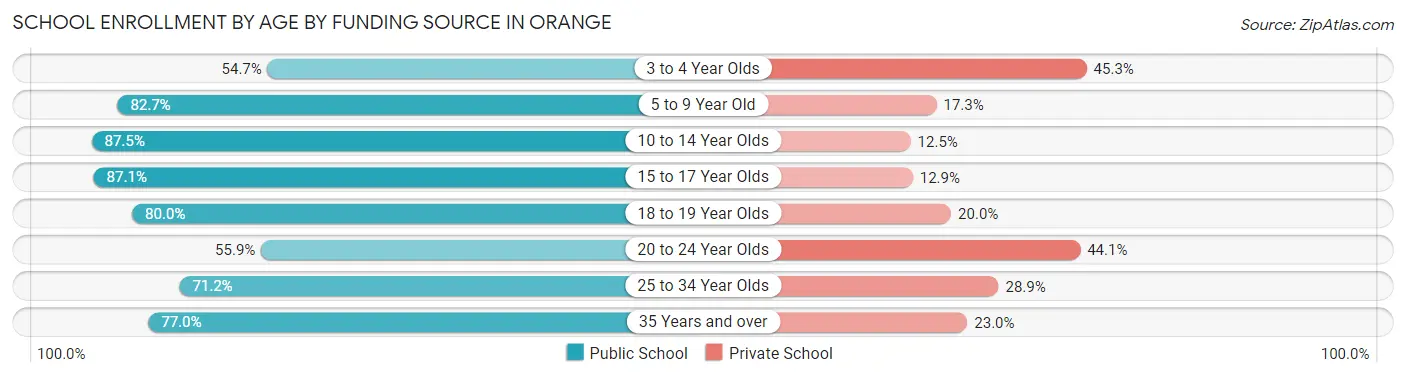
| Age Bracket | Public School | Private School |
| 3 to 4 Year Olds | 1,040 (54.7%) | 860 (45.3%) |
| 5 to 9 Year Old | 6,356 (82.7%) | 1,330 (17.3%) |
| 10 to 14 Year Olds | 6,522 (87.5%) | 930 (12.5%) |
| 15 to 17 Year Olds | 4,379 (87.1%) | 647 (12.9%) |
| 18 to 19 Year Olds | 2,909 (80.0%) | 728 (20.0%) |
| 20 to 24 Year Olds | 3,501 (55.9%) | 2,758 (44.1%) |
| 25 to 34 Year Olds | 2,405 (71.2%) | 975 (28.8%) |
| 35 Years and over | 1,567 (77.0%) | 469 (23.0%) |
| Total | 28,667 (76.7%) | 8,709 (23.3%) |
Educational Attainment by Field of Study in Orange
Business (8,006 | 19.6%), engineering (3,981 | 9.7%), social sciences (3,897 | 9.5%), science & technology (3,798 | 9.3%), and education (2,648 | 6.5%) are the most common fields of study among 40,858 individuals in Orange who have obtained a bachelor's degree or higher.
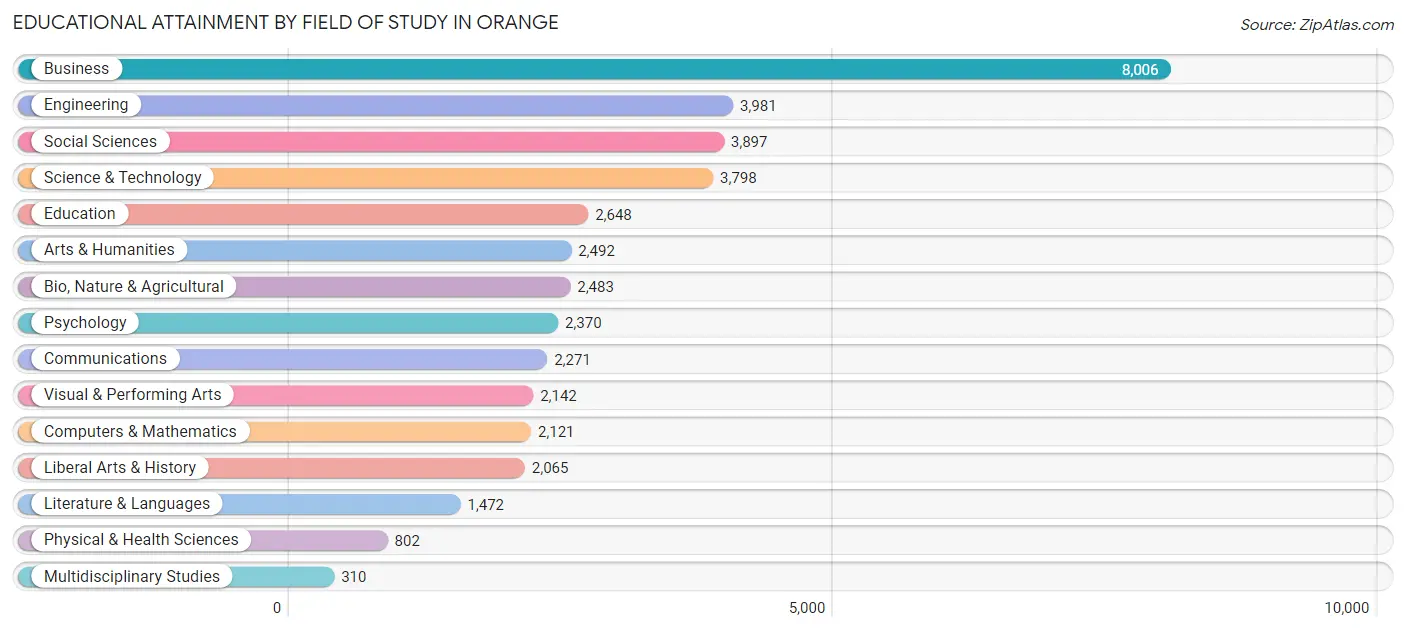
| Field of Study | # Graduates | % Graduates |
| Computers & Mathematics | 2,121 | 5.2% |
| Bio, Nature & Agricultural | 2,483 | 6.1% |
| Physical & Health Sciences | 802 | 2.0% |
| Psychology | 2,370 | 5.8% |
| Social Sciences | 3,897 | 9.5% |
| Engineering | 3,981 | 9.7% |
| Multidisciplinary Studies | 310 | 0.8% |
| Science & Technology | 3,798 | 9.3% |
| Business | 8,006 | 19.6% |
| Education | 2,648 | 6.5% |
| Literature & Languages | 1,472 | 3.6% |
| Liberal Arts & History | 2,065 | 5.1% |
| Visual & Performing Arts | 2,142 | 5.2% |
| Communications | 2,271 | 5.6% |
| Arts & Humanities | 2,492 | 6.1% |
| Total | 40,858 | 100.0% |
Transportation & Commute in Orange
Vehicle Availability by Sex in Orange
The most prevalent vehicle ownership categories in Orange are males with 2 vehicles (14,317, accounting for 37.8%) and females with 2 vehicles (12,102, making up 45.9%).
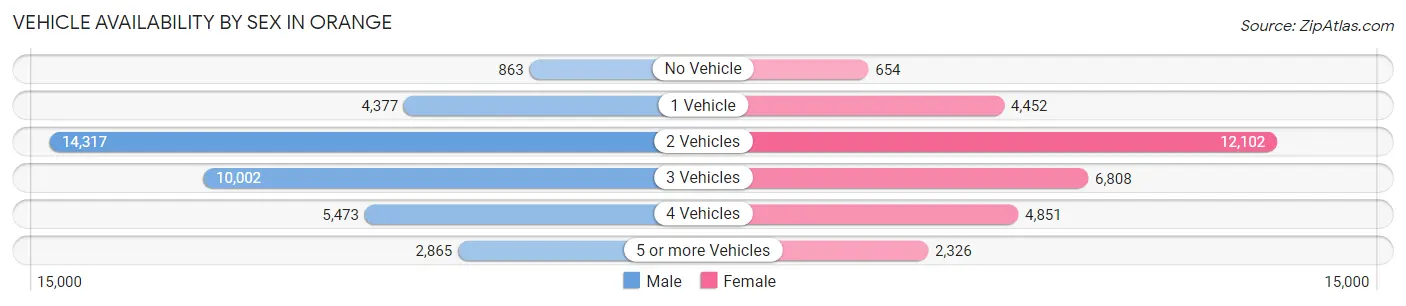
| Vehicles Available | Male | Female |
| No Vehicle | 863 (2.3%) | 654 (2.1%) |
| 1 Vehicle | 4,377 (11.6%) | 4,452 (14.3%) |
| 2 Vehicles | 14,317 (37.8%) | 12,102 (38.8%) |
| 3 Vehicles | 10,002 (26.4%) | 6,808 (21.8%) |
| 4 Vehicles | 5,473 (14.4%) | 4,851 (15.5%) |
| 5 or more Vehicles | 2,865 (7.6%) | 2,326 (7.5%) |
| Total | 37,897 (100.0%) | 31,193 (100.0%) |
Commute Time in Orange
The most frequently occuring commute durations in Orange are 30 to 34 minutes (10,265 commuters, 17.0%), 20 to 24 minutes (10,154 commuters, 16.8%), and 15 to 19 minutes (9,299 commuters, 15.4%).
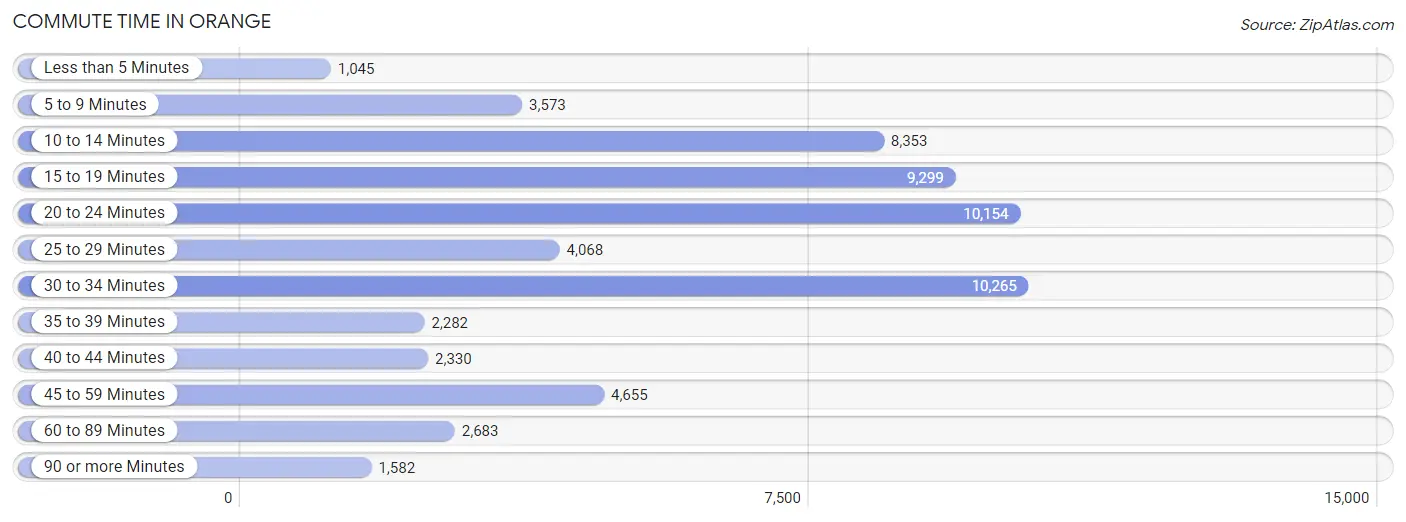
| Commute Time | # Commuters | % Commuters |
| Less than 5 Minutes | 1,045 | 1.7% |
| 5 to 9 Minutes | 3,573 | 5.9% |
| 10 to 14 Minutes | 8,353 | 13.9% |
| 15 to 19 Minutes | 9,299 | 15.4% |
| 20 to 24 Minutes | 10,154 | 16.8% |
| 25 to 29 Minutes | 4,068 | 6.8% |
| 30 to 34 Minutes | 10,265 | 17.0% |
| 35 to 39 Minutes | 2,282 | 3.8% |
| 40 to 44 Minutes | 2,330 | 3.9% |
| 45 to 59 Minutes | 4,655 | 7.7% |
| 60 to 89 Minutes | 2,683 | 4.4% |
| 90 or more Minutes | 1,582 | 2.6% |
Commute Time by Sex in Orange
The most common commute times in Orange are 30 to 34 minutes (5,682 commuters, 16.9%) for males and 20 to 24 minutes (4,801 commuters, 18.0%) for females.
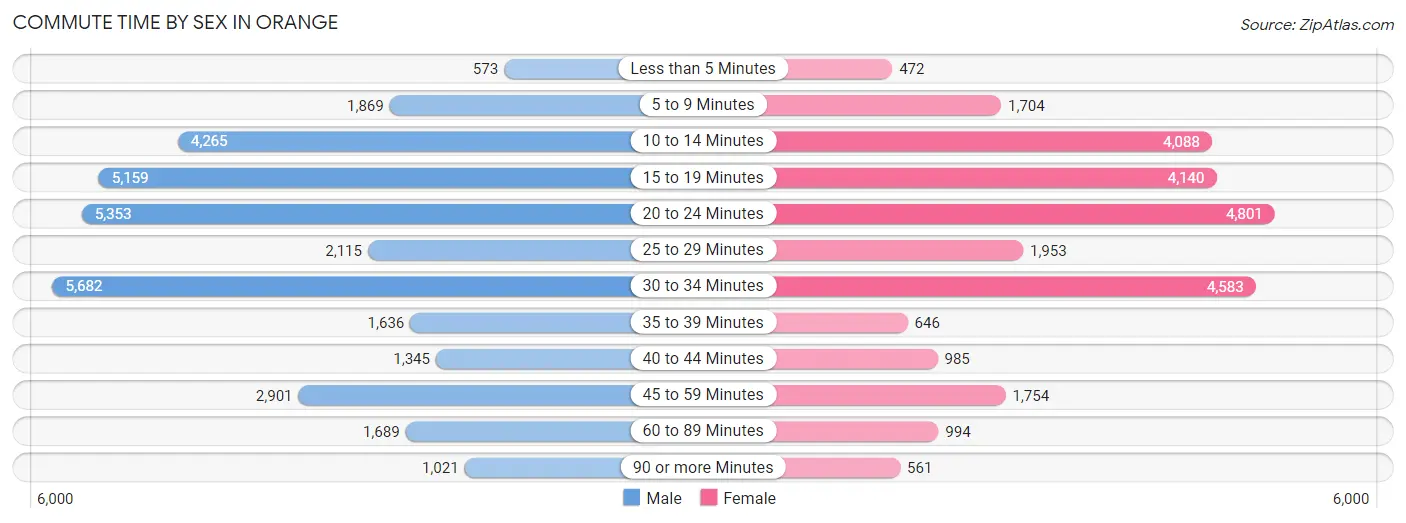
| Commute Time | Male | Female |
| Less than 5 Minutes | 573 (1.7%) | 472 (1.8%) |
| 5 to 9 Minutes | 1,869 (5.6%) | 1,704 (6.4%) |
| 10 to 14 Minutes | 4,265 (12.7%) | 4,088 (15.3%) |
| 15 to 19 Minutes | 5,159 (15.3%) | 4,140 (15.5%) |
| 20 to 24 Minutes | 5,353 (15.9%) | 4,801 (18.0%) |
| 25 to 29 Minutes | 2,115 (6.3%) | 1,953 (7.3%) |
| 30 to 34 Minutes | 5,682 (16.9%) | 4,583 (17.2%) |
| 35 to 39 Minutes | 1,636 (4.9%) | 646 (2.4%) |
| 40 to 44 Minutes | 1,345 (4.0%) | 985 (3.7%) |
| 45 to 59 Minutes | 2,901 (8.6%) | 1,754 (6.6%) |
| 60 to 89 Minutes | 1,689 (5.0%) | 994 (3.7%) |
| 90 or more Minutes | 1,021 (3.0%) | 561 (2.1%) |
Time of Departure to Work by Sex in Orange
The most frequent times of departure to work in Orange are 7:00 AM to 7:29 AM (4,471, 13.3%) for males and 7:00 AM to 7:29 AM (4,474, 16.8%) for females.
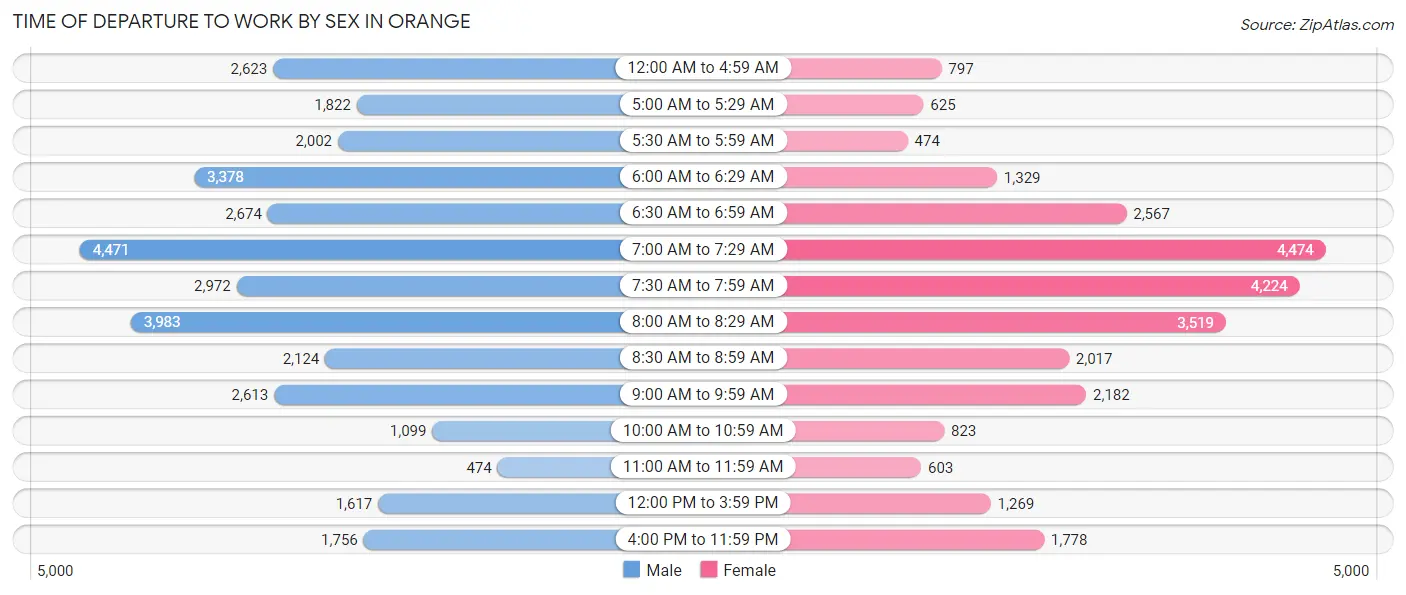
| Time of Departure | Male | Female |
| 12:00 AM to 4:59 AM | 2,623 (7.8%) | 797 (3.0%) |
| 5:00 AM to 5:29 AM | 1,822 (5.4%) | 625 (2.3%) |
| 5:30 AM to 5:59 AM | 2,002 (6.0%) | 474 (1.8%) |
| 6:00 AM to 6:29 AM | 3,378 (10.1%) | 1,329 (5.0%) |
| 6:30 AM to 6:59 AM | 2,674 (8.0%) | 2,567 (9.6%) |
| 7:00 AM to 7:29 AM | 4,471 (13.3%) | 4,474 (16.8%) |
| 7:30 AM to 7:59 AM | 2,972 (8.8%) | 4,224 (15.8%) |
| 8:00 AM to 8:29 AM | 3,983 (11.8%) | 3,519 (13.2%) |
| 8:30 AM to 8:59 AM | 2,124 (6.3%) | 2,017 (7.6%) |
| 9:00 AM to 9:59 AM | 2,613 (7.8%) | 2,182 (8.2%) |
| 10:00 AM to 10:59 AM | 1,099 (3.3%) | 823 (3.1%) |
| 11:00 AM to 11:59 AM | 474 (1.4%) | 603 (2.3%) |
| 12:00 PM to 3:59 PM | 1,617 (4.8%) | 1,269 (4.8%) |
| 4:00 PM to 11:59 PM | 1,756 (5.2%) | 1,778 (6.7%) |
| Total | 33,608 (100.0%) | 26,681 (100.0%) |
Housing Occupancy in Orange
Occupancy by Ownership in Orange
Of the total 44,336 dwellings in Orange, owner-occupied units account for 26,103 (58.9%), while renter-occupied units make up 18,233 (41.1%).
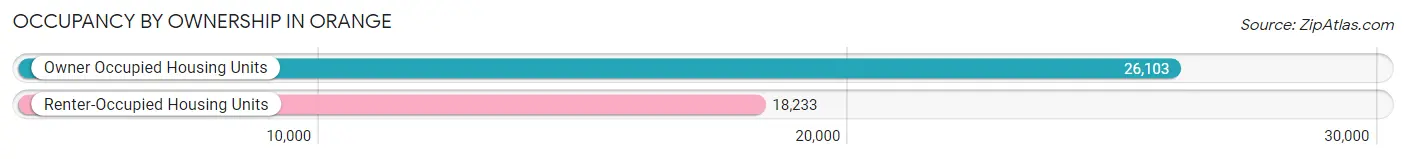
| Occupancy | # Housing Units | % Housing Units |
| Owner Occupied Housing Units | 26,103 | 58.9% |
| Renter-Occupied Housing Units | 18,233 | 41.1% |
| Total Occupied Housing Units | 44,336 | 100.0% |
Occupancy by Household Size in Orange
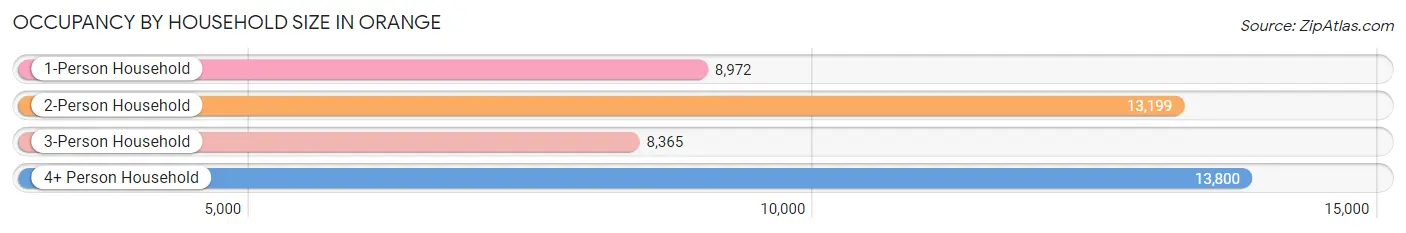
| Household Size | # Housing Units | % Housing Units |
| 1-Person Household | 8,972 | 20.2% |
| 2-Person Household | 13,199 | 29.8% |
| 3-Person Household | 8,365 | 18.9% |
| 4+ Person Household | 13,800 | 31.1% |
| Total Housing Units | 44,336 | 100.0% |
Occupancy by Ownership by Household Size in Orange
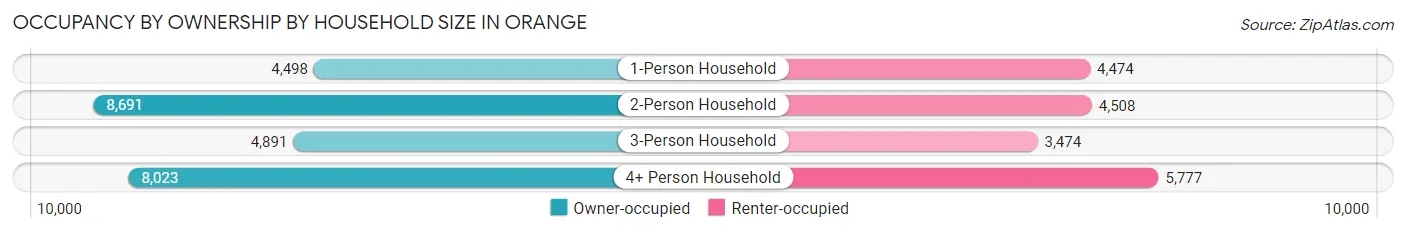
| Household Size | Owner-occupied | Renter-occupied |
| 1-Person Household | 4,498 (50.1%) | 4,474 (49.9%) |
| 2-Person Household | 8,691 (65.8%) | 4,508 (34.2%) |
| 3-Person Household | 4,891 (58.5%) | 3,474 (41.5%) |
| 4+ Person Household | 8,023 (58.1%) | 5,777 (41.9%) |
| Total Housing Units | 26,103 (58.9%) | 18,233 (41.1%) |
Occupancy by Educational Attainment in Orange
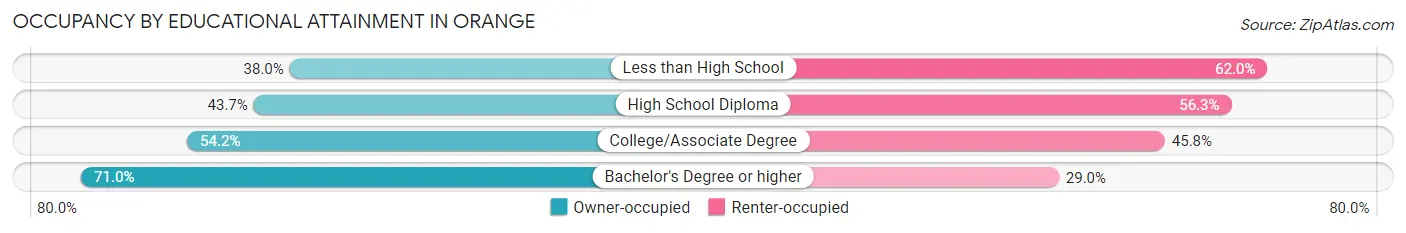
| Household Size | Owner-occupied | Renter-occupied |
| Less than High School | 1,412 (38.0%) | 2,307 (62.0%) |
| High School Diploma | 2,976 (43.7%) | 3,837 (56.3%) |
| College/Associate Degree | 7,394 (54.2%) | 6,245 (45.8%) |
| Bachelor's Degree or higher | 14,321 (71.0%) | 5,844 (29.0%) |
Occupancy by Age of Householder in Orange
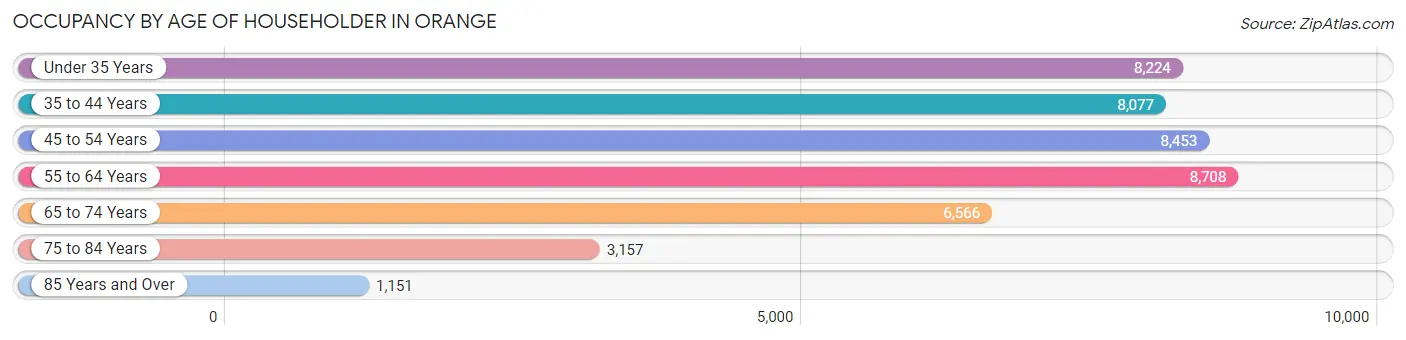
| Age Bracket | # Households | % Households |
| Under 35 Years | 8,224 | 18.5% |
| 35 to 44 Years | 8,077 | 18.2% |
| 45 to 54 Years | 8,453 | 19.1% |
| 55 to 64 Years | 8,708 | 19.6% |
| 65 to 74 Years | 6,566 | 14.8% |
| 75 to 84 Years | 3,157 | 7.1% |
| 85 Years and Over | 1,151 | 2.6% |
| Total | 44,336 | 100.0% |
Housing Finances in Orange
Median Income by Occupancy in Orange
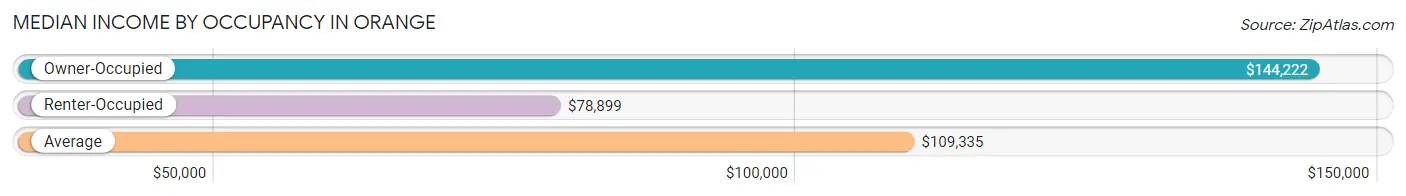
| Occupancy Type | # Households | Median Income |
| Owner-Occupied | 26,103 (58.9%) | $144,222 |
| Renter-Occupied | 18,233 (41.1%) | $78,899 |
| Average | 44,336 (100.0%) | $109,335 |
Occupancy by Householder Income Bracket in Orange
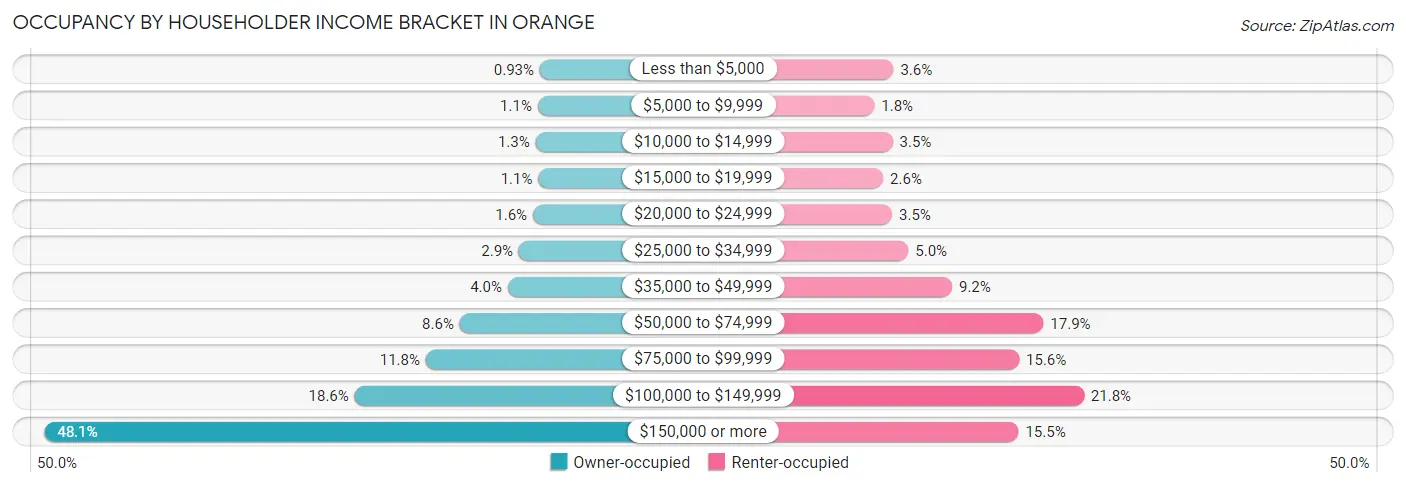
| Income Bracket | Owner-occupied | Renter-occupied |
| Less than $5,000 | 242 (0.9%) | 659 (3.6%) |
| $5,000 to $9,999 | 294 (1.1%) | 327 (1.8%) |
| $10,000 to $14,999 | 349 (1.3%) | 644 (3.5%) |
| $15,000 to $19,999 | 283 (1.1%) | 479 (2.6%) |
| $20,000 to $24,999 | 414 (1.6%) | 634 (3.5%) |
| $25,000 to $34,999 | 761 (2.9%) | 917 (5.0%) |
| $35,000 to $49,999 | 1,038 (4.0%) | 1,675 (9.2%) |
| $50,000 to $74,999 | 2,235 (8.6%) | 3,262 (17.9%) |
| $75,000 to $99,999 | 3,077 (11.8%) | 2,840 (15.6%) |
| $100,000 to $149,999 | 4,848 (18.6%) | 3,966 (21.7%) |
| $150,000 or more | 12,562 (48.1%) | 2,830 (15.5%) |
| Total | 26,103 (100.0%) | 18,233 (100.0%) |
Monthly Housing Cost Tiers in Orange
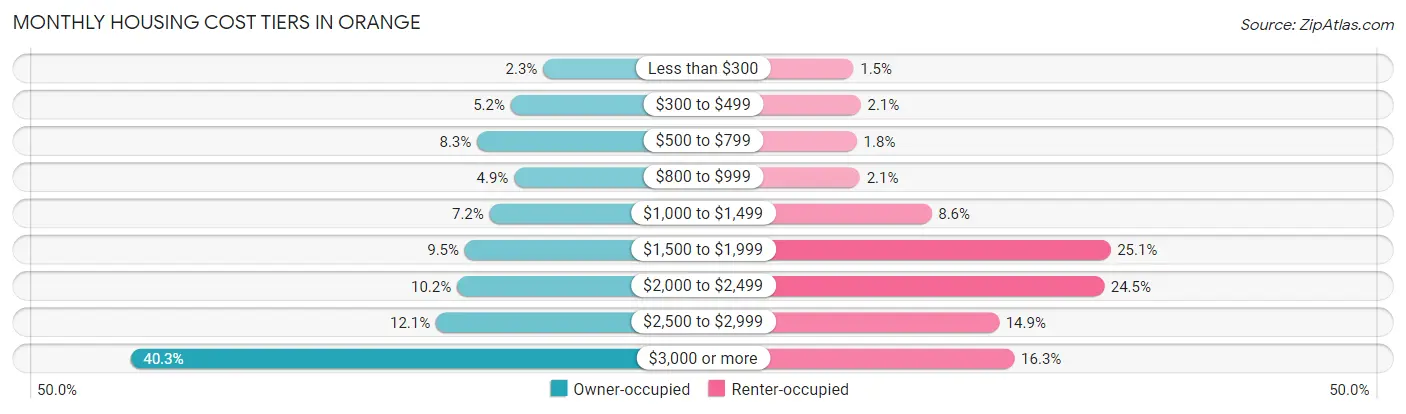
| Monthly Cost | Owner-occupied | Renter-occupied |
| Less than $300 | 591 (2.3%) | 266 (1.5%) |
| $300 to $499 | 1,367 (5.2%) | 388 (2.1%) |
| $500 to $799 | 2,176 (8.3%) | 323 (1.8%) |
| $800 to $999 | 1,286 (4.9%) | 374 (2.1%) |
| $1,000 to $1,499 | 1,877 (7.2%) | 1,575 (8.6%) |
| $1,500 to $1,999 | 2,472 (9.5%) | 4,579 (25.1%) |
| $2,000 to $2,499 | 2,659 (10.2%) | 4,471 (24.5%) |
| $2,500 to $2,999 | 3,163 (12.1%) | 2,707 (14.8%) |
| $3,000 or more | 10,512 (40.3%) | 2,966 (16.3%) |
| Total | 26,103 (100.0%) | 18,233 (100.0%) |
Physical Housing Characteristics in Orange
Housing Structures in Orange
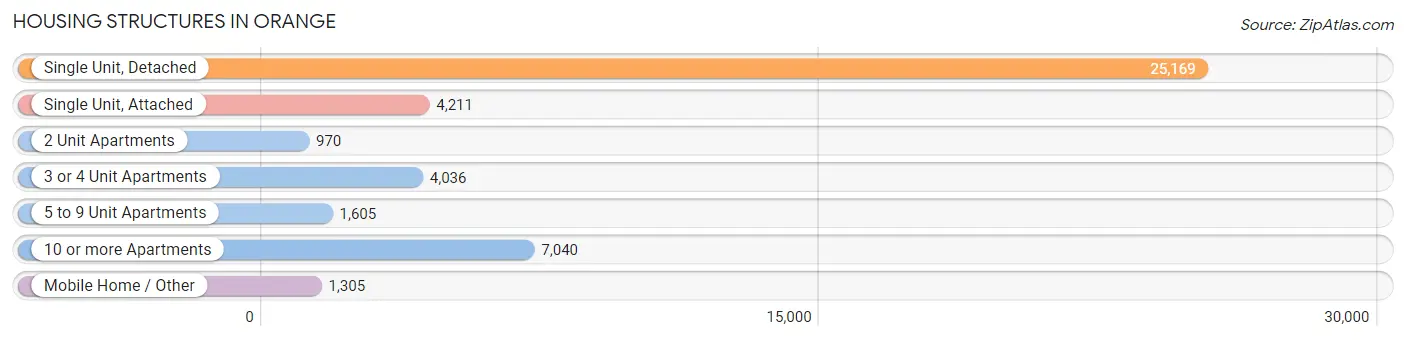
| Structure Type | # Housing Units | % Housing Units |
| Single Unit, Detached | 25,169 | 56.8% |
| Single Unit, Attached | 4,211 | 9.5% |
| 2 Unit Apartments | 970 | 2.2% |
| 3 or 4 Unit Apartments | 4,036 | 9.1% |
| 5 to 9 Unit Apartments | 1,605 | 3.6% |
| 10 or more Apartments | 7,040 | 15.9% |
| Mobile Home / Other | 1,305 | 2.9% |
| Total | 44,336 | 100.0% |
Housing Structures by Occupancy in Orange
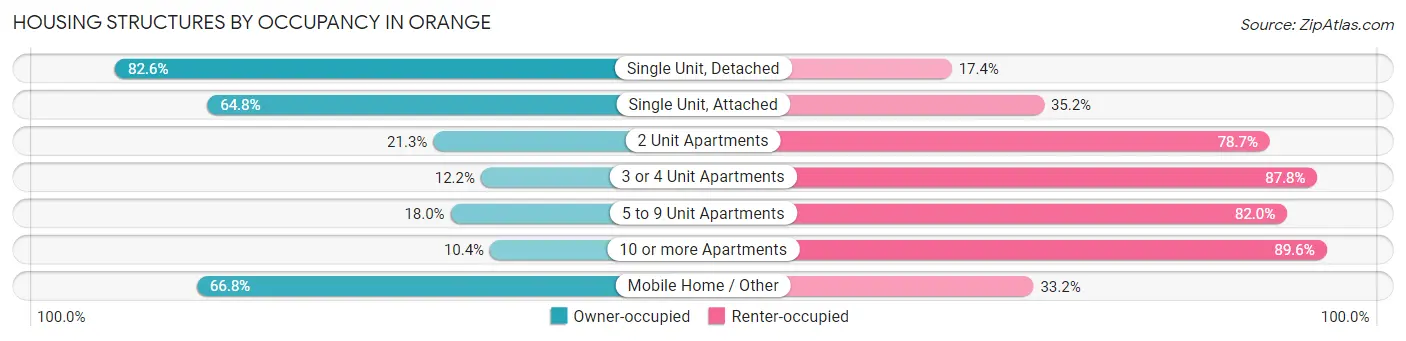
| Structure Type | Owner-occupied | Renter-occupied |
| Single Unit, Detached | 20,783 (82.6%) | 4,386 (17.4%) |
| Single Unit, Attached | 2,729 (64.8%) | 1,482 (35.2%) |
| 2 Unit Apartments | 207 (21.3%) | 763 (78.7%) |
| 3 or 4 Unit Apartments | 491 (12.2%) | 3,545 (87.8%) |
| 5 to 9 Unit Apartments | 289 (18.0%) | 1,316 (82.0%) |
| 10 or more Apartments | 732 (10.4%) | 6,308 (89.6%) |
| Mobile Home / Other | 872 (66.8%) | 433 (33.2%) |
| Total | 26,103 (58.9%) | 18,233 (41.1%) |
Housing Structures by Number of Rooms in Orange
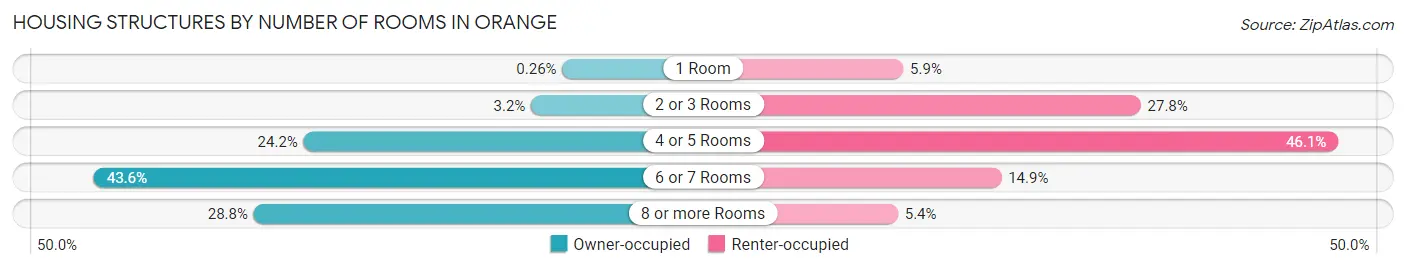
| Number of Rooms | Owner-occupied | Renter-occupied |
| 1 Room | 69 (0.3%) | 1,066 (5.9%) |
| 2 or 3 Rooms | 821 (3.2%) | 5,070 (27.8%) |
| 4 or 5 Rooms | 6,314 (24.2%) | 8,401 (46.1%) |
| 6 or 7 Rooms | 11,381 (43.6%) | 2,721 (14.9%) |
| 8 or more Rooms | 7,518 (28.8%) | 975 (5.3%) |
| Total | 26,103 (100.0%) | 18,233 (100.0%) |
Housing Structure by Heating Type in Orange
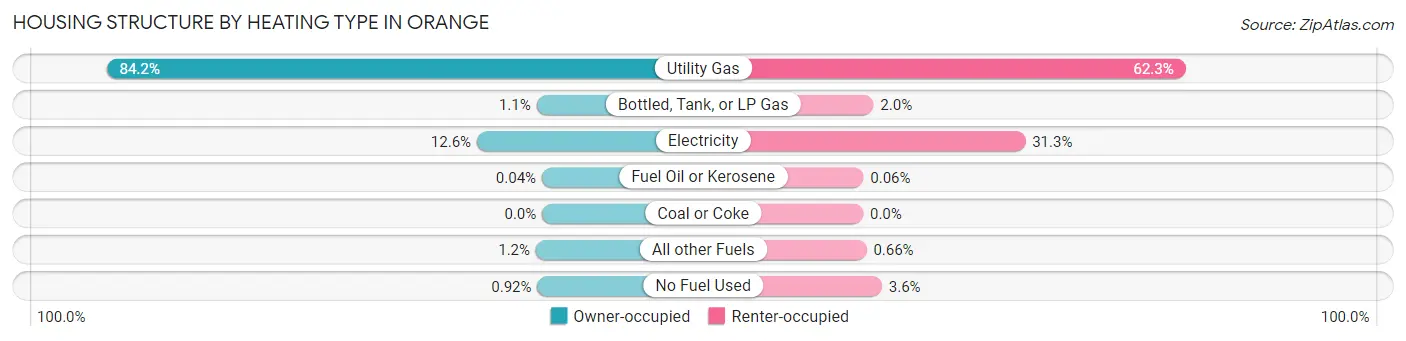
| Heating Type | Owner-occupied | Renter-occupied |
| Utility Gas | 21,968 (84.2%) | 11,361 (62.3%) |
| Bottled, Tank, or LP Gas | 279 (1.1%) | 365 (2.0%) |
| Electricity | 3,289 (12.6%) | 5,715 (31.3%) |
| Fuel Oil or Kerosene | 10 (0.0%) | 11 (0.1%) |
| Coal or Coke | 0 (0.0%) | 0 (0.0%) |
| All other Fuels | 316 (1.2%) | 120 (0.7%) |
| No Fuel Used | 241 (0.9%) | 661 (3.6%) |
| Total | 26,103 (100.0%) | 18,233 (100.0%) |
Household Vehicle Usage in Orange
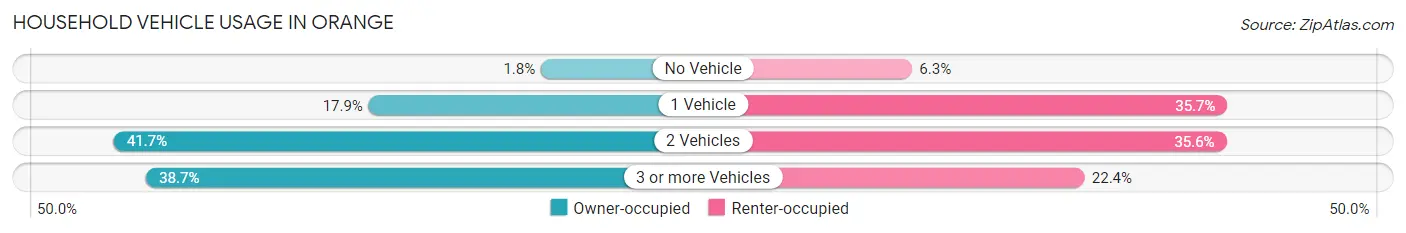
| Vehicles per Household | Owner-occupied | Renter-occupied |
| No Vehicle | 468 (1.8%) | 1,149 (6.3%) |
| 1 Vehicle | 4,667 (17.9%) | 6,508 (35.7%) |
| 2 Vehicles | 10,878 (41.7%) | 6,492 (35.6%) |
| 3 or more Vehicles | 10,090 (38.7%) | 4,084 (22.4%) |
| Total | 26,103 (100.0%) | 18,233 (100.0%) |
Real Estate & Mortgages in Orange
Real Estate and Mortgage Overview in Orange
| Characteristic | Without Mortgage | With Mortgage |
| Housing Units | 7,094 | 19,009 |
| Median Property Value | $830,500 | $855,400 |
| Median Household Income | $99,435 | $10,187 |
| Monthly Housing Costs | $712 | $10,473 |
| Real Estate Taxes | $3,966 | $318 |
Property Value by Mortgage Status in Orange
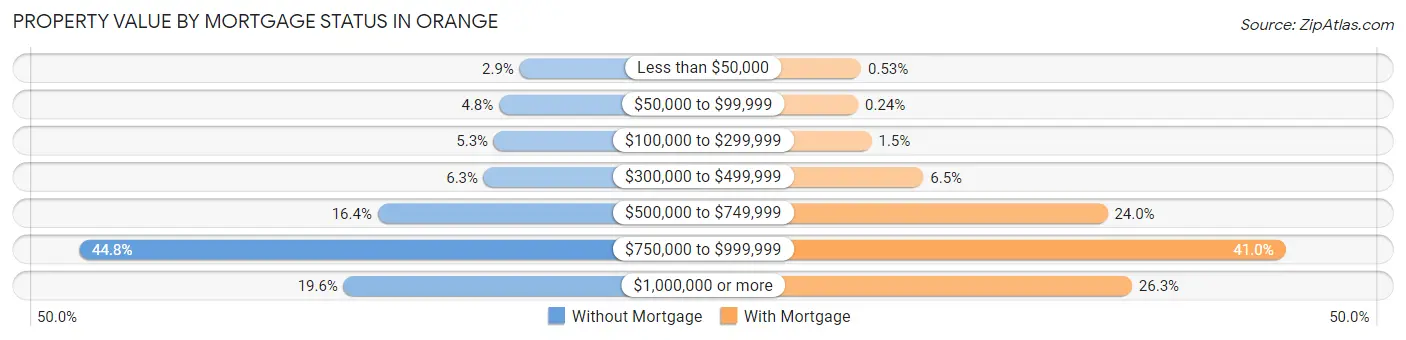
| Property Value | Without Mortgage | With Mortgage |
| Less than $50,000 | 202 (2.9%) | 100 (0.5%) |
| $50,000 to $99,999 | 341 (4.8%) | 45 (0.2%) |
| $100,000 to $299,999 | 376 (5.3%) | 288 (1.5%) |
| $300,000 to $499,999 | 444 (6.3%) | 1,228 (6.5%) |
| $500,000 to $749,999 | 1,161 (16.4%) | 4,560 (24.0%) |
| $750,000 to $999,999 | 3,179 (44.8%) | 7,785 (40.9%) |
| $1,000,000 or more | 1,391 (19.6%) | 5,003 (26.3%) |
| Total | 7,094 (100.0%) | 19,009 (100.0%) |
Household Income by Mortgage Status in Orange
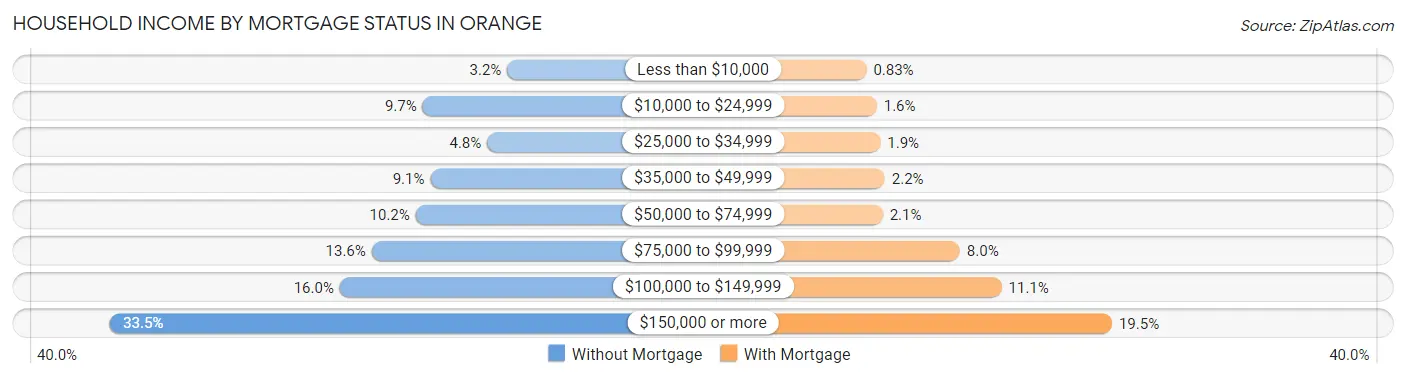
| Household Income | Without Mortgage | With Mortgage |
| Less than $10,000 | 229 (3.2%) | 157 (0.8%) |
| $10,000 to $24,999 | 687 (9.7%) | 307 (1.6%) |
| $25,000 to $34,999 | 338 (4.8%) | 359 (1.9%) |
| $35,000 to $49,999 | 645 (9.1%) | 423 (2.2%) |
| $50,000 to $74,999 | 724 (10.2%) | 393 (2.1%) |
| $75,000 to $99,999 | 962 (13.6%) | 1,511 (8.0%) |
| $100,000 to $149,999 | 1,134 (16.0%) | 2,115 (11.1%) |
| $150,000 or more | 2,375 (33.5%) | 3,714 (19.5%) |
| Total | 7,094 (100.0%) | 19,009 (100.0%) |
Property Value to Household Income Ratio in Orange
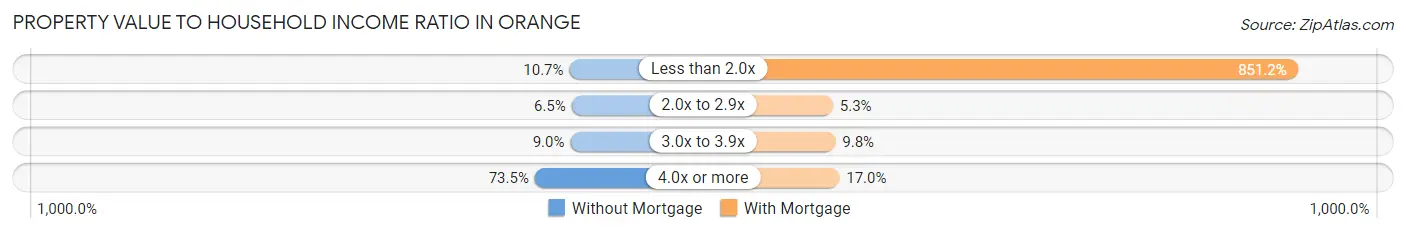
| Value-to-Income Ratio | Without Mortgage | With Mortgage |
| Less than 2.0x | 756 (10.7%) | 161,797 (851.2%) |
| 2.0x to 2.9x | 463 (6.5%) | 1,002 (5.3%) |
| 3.0x to 3.9x | 635 (8.9%) | 1,870 (9.8%) |
| 4.0x or more | 5,214 (73.5%) | 3,231 (17.0%) |
| Total | 7,094 (100.0%) | 19,009 (100.0%) |
Real Estate Taxes by Mortgage Status in Orange
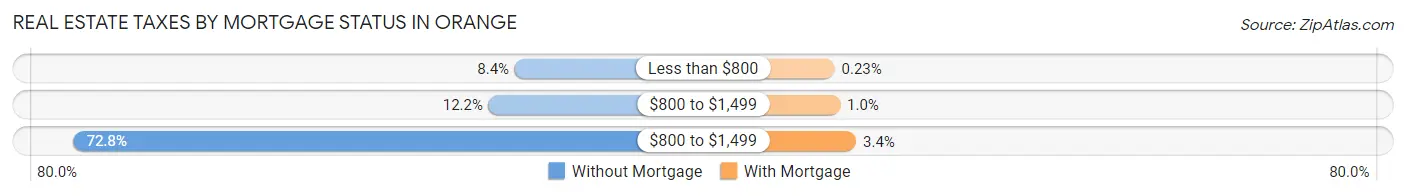
| Property Taxes | Without Mortgage | With Mortgage |
| Less than $800 | 592 (8.4%) | 44 (0.2%) |
| $800 to $1,499 | 863 (12.2%) | 196 (1.0%) |
| $800 to $1,499 | 5,167 (72.8%) | 641 (3.4%) |
| Total | 7,094 (100.0%) | 19,009 (100.0%) |
Health & Disability in Orange
Health Insurance Coverage by Age in Orange
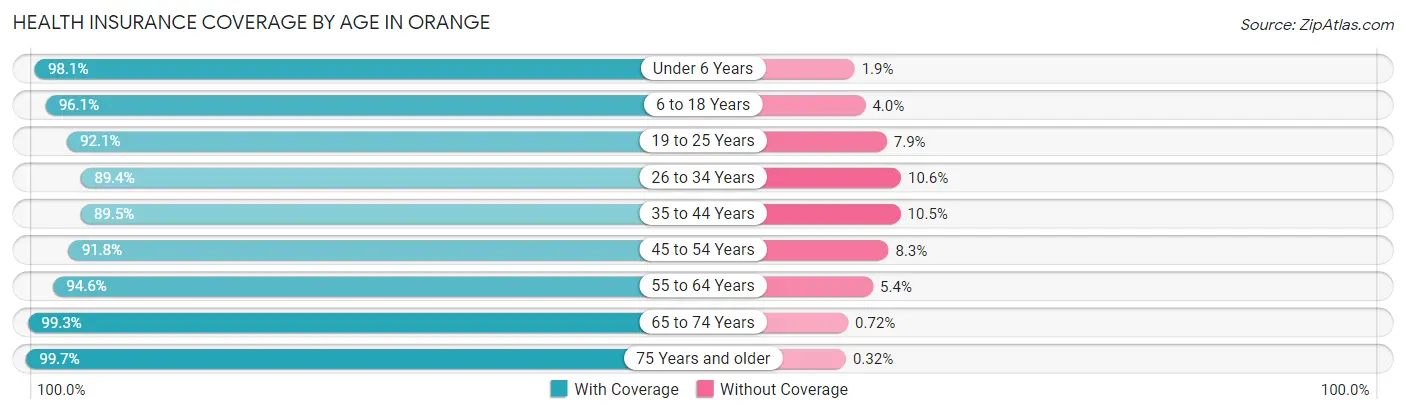
| Age Bracket | With Coverage | Without Coverage |
| Under 6 Years | 9,458 (98.1%) | 187 (1.9%) |
| 6 to 18 Years | 19,679 (96.1%) | 810 (4.0%) |
| 19 to 25 Years | 13,236 (92.1%) | 1,141 (7.9%) |
| 26 to 34 Years | 17,365 (89.4%) | 2,055 (10.6%) |
| 35 to 44 Years | 15,797 (89.5%) | 1,855 (10.5%) |
| 45 to 54 Years | 16,060 (91.7%) | 1,445 (8.3%) |
| 55 to 64 Years | 15,650 (94.6%) | 889 (5.4%) |
| 65 to 74 Years | 11,636 (99.3%) | 84 (0.7%) |
| 75 Years and older | 7,975 (99.7%) | 26 (0.3%) |
| Total | 126,856 (93.7%) | 8,492 (6.3%) |
Health Insurance Coverage by Citizenship Status in Orange
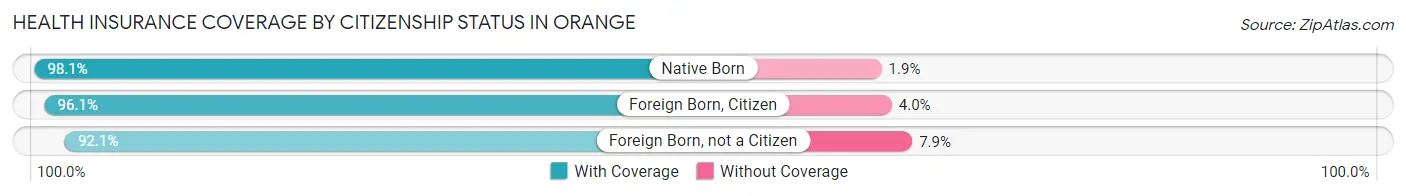
| Citizenship Status | With Coverage | Without Coverage |
| Native Born | 9,458 (98.1%) | 187 (1.9%) |
| Foreign Born, Citizen | 19,679 (96.1%) | 810 (4.0%) |
| Foreign Born, not a Citizen | 13,236 (92.1%) | 1,141 (7.9%) |
Health Insurance Coverage by Household Income in Orange
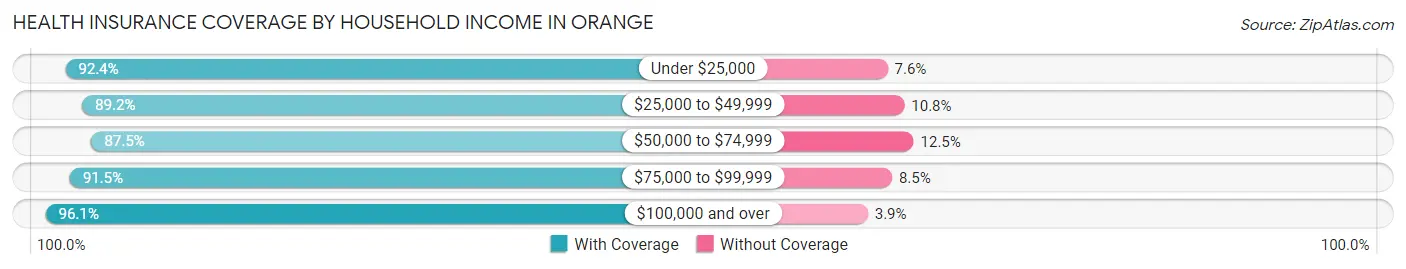
| Household Income | With Coverage | Without Coverage |
| Under $25,000 | 7,604 (92.4%) | 629 (7.6%) |
| $25,000 to $49,999 | 10,719 (89.2%) | 1,296 (10.8%) |
| $50,000 to $74,999 | 13,006 (87.5%) | 1,862 (12.5%) |
| $75,000 to $99,999 | 14,424 (91.5%) | 1,334 (8.5%) |
| $100,000 and over | 77,841 (96.1%) | 3,188 (3.9%) |
Public vs Private Health Insurance Coverage by Age in Orange
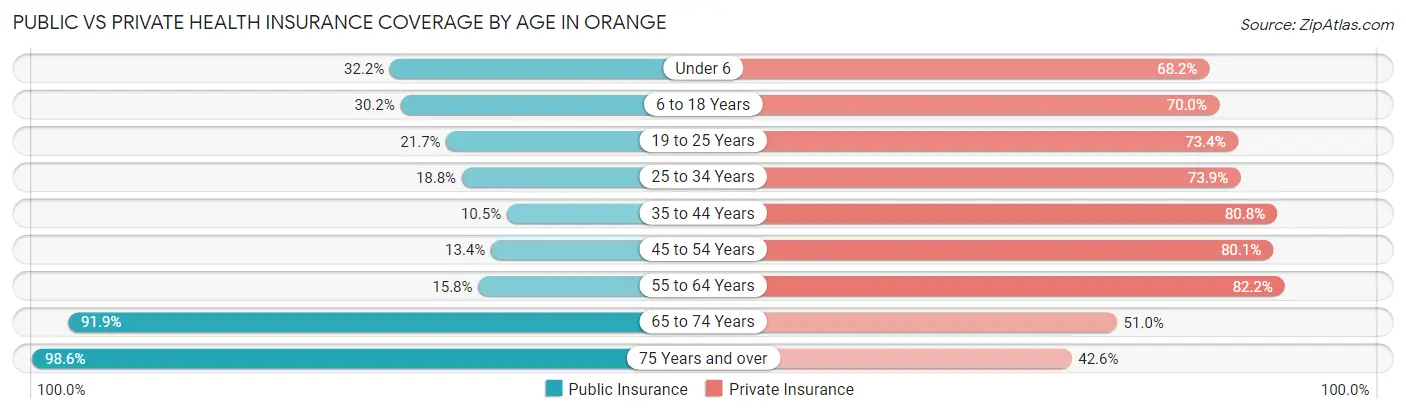
| Age Bracket | Public Insurance | Private Insurance |
| Under 6 | 3,103 (32.2%) | 6,578 (68.2%) |
| 6 to 18 Years | 6,192 (30.2%) | 14,339 (70.0%) |
| 19 to 25 Years | 3,121 (21.7%) | 10,558 (73.4%) |
| 25 to 34 Years | 3,654 (18.8%) | 14,357 (73.9%) |
| 35 to 44 Years | 1,847 (10.5%) | 14,257 (80.8%) |
| 45 to 54 Years | 2,347 (13.4%) | 14,017 (80.1%) |
| 55 to 64 Years | 2,610 (15.8%) | 13,595 (82.2%) |
| 65 to 74 Years | 10,773 (91.9%) | 5,980 (51.0%) |
| 75 Years and over | 7,889 (98.6%) | 3,408 (42.6%) |
| Total | 41,536 (30.7%) | 97,089 (71.7%) |
Disability Status by Sex by Age in Orange
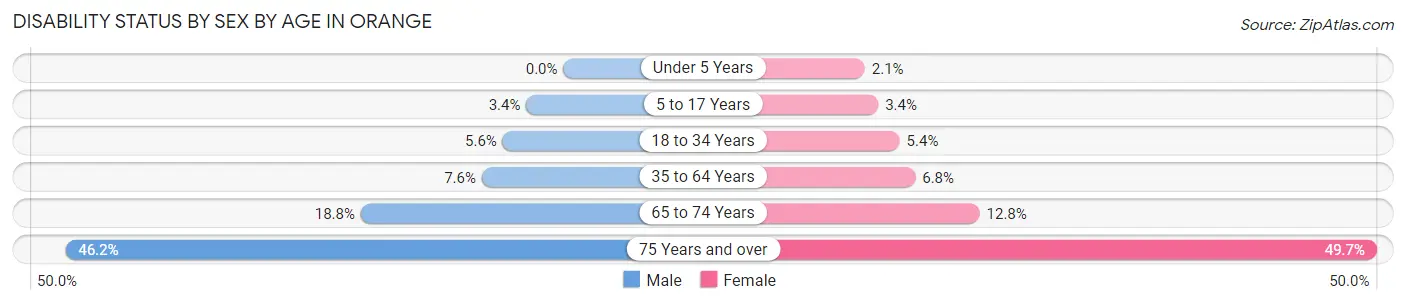
| Age Bracket | Male | Female |
| Under 5 Years | 0 (0.0%) | 87 (2.1%) |
| 5 to 17 Years | 383 (3.4%) | 312 (3.4%) |
| 18 to 34 Years | 986 (5.6%) | 981 (5.4%) |
| 35 to 64 Years | 2,045 (7.6%) | 1,684 (6.8%) |
| 65 to 74 Years | 958 (18.8%) | 847 (12.8%) |
| 75 Years and over | 1,585 (46.2%) | 2,270 (49.6%) |
Disability Class by Sex by Age in Orange
Disability Class: Hearing Difficulty
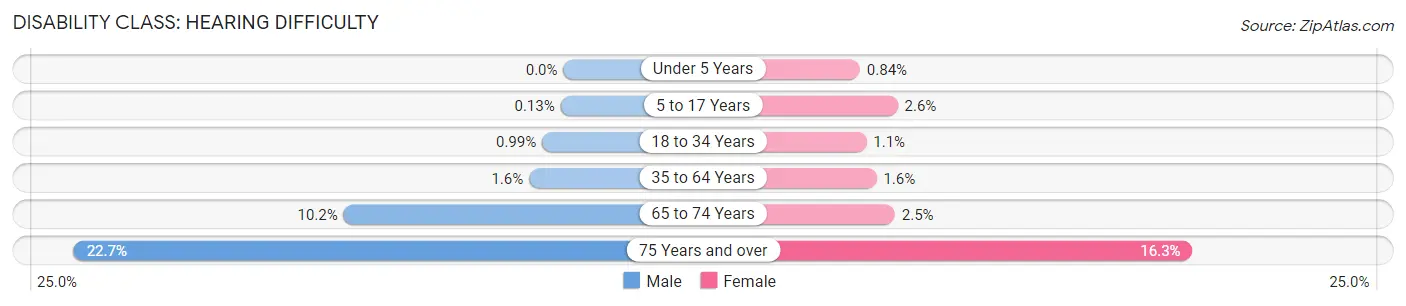
| Age Bracket | Male | Female |
| Under 5 Years | 0 (0.0%) | 34 (0.8%) |
| 5 to 17 Years | 15 (0.1%) | 239 (2.6%) |
| 18 to 34 Years | 174 (1.0%) | 209 (1.1%) |
| 35 to 64 Years | 430 (1.6%) | 398 (1.6%) |
| 65 to 74 Years | 520 (10.2%) | 163 (2.5%) |
| 75 Years and over | 779 (22.7%) | 744 (16.3%) |
Disability Class: Vision Difficulty
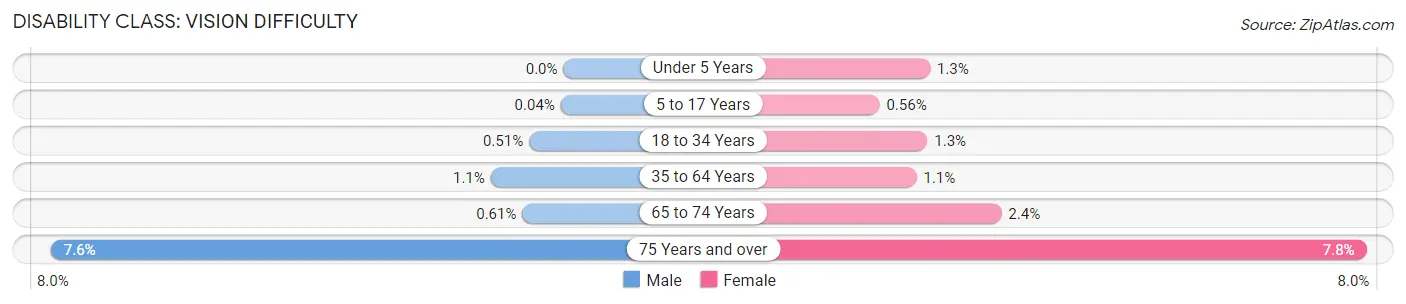
| Age Bracket | Male | Female |
| Under 5 Years | 0 (0.0%) | 53 (1.3%) |
| 5 to 17 Years | 4 (0.0%) | 52 (0.6%) |
| 18 to 34 Years | 89 (0.5%) | 233 (1.3%) |
| 35 to 64 Years | 293 (1.1%) | 274 (1.1%) |
| 65 to 74 Years | 31 (0.6%) | 157 (2.4%) |
| 75 Years and over | 261 (7.6%) | 356 (7.8%) |
Disability Class: Cognitive Difficulty
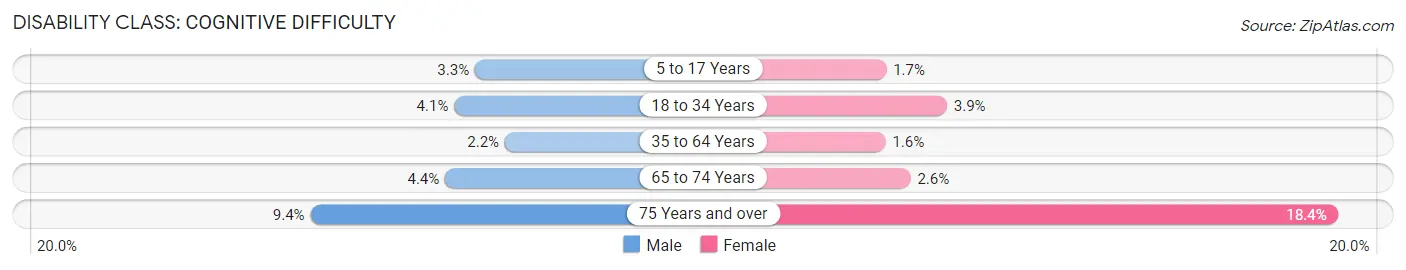
| Age Bracket | Male | Female |
| 5 to 17 Years | 365 (3.3%) | 152 (1.7%) |
| 18 to 34 Years | 709 (4.1%) | 713 (3.9%) |
| 35 to 64 Years | 585 (2.2%) | 399 (1.6%) |
| 65 to 74 Years | 224 (4.4%) | 169 (2.5%) |
| 75 Years and over | 322 (9.4%) | 843 (18.4%) |
Disability Class: Ambulatory Difficulty
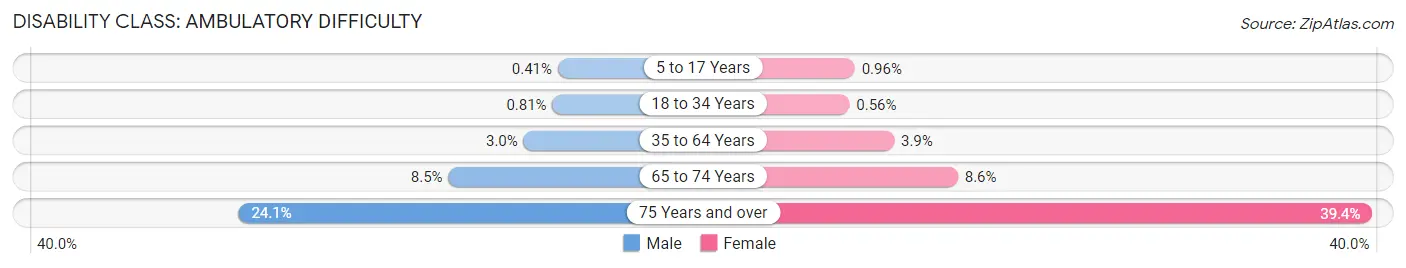
| Age Bracket | Male | Female |
| 5 to 17 Years | 46 (0.4%) | 89 (1.0%) |
| 18 to 34 Years | 141 (0.8%) | 102 (0.6%) |
| 35 to 64 Years | 796 (2.9%) | 958 (3.9%) |
| 65 to 74 Years | 435 (8.5%) | 570 (8.6%) |
| 75 Years and over | 827 (24.1%) | 1,801 (39.4%) |
Disability Class: Self-Care Difficulty
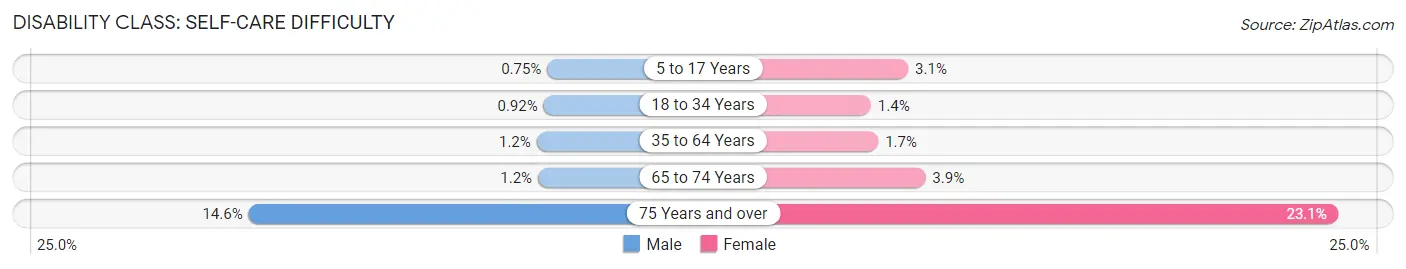
| Age Bracket | Male | Female |
| 5 to 17 Years | 84 (0.7%) | 285 (3.1%) |
| 18 to 34 Years | 161 (0.9%) | 247 (1.3%) |
| 35 to 64 Years | 335 (1.2%) | 416 (1.7%) |
| 65 to 74 Years | 60 (1.2%) | 257 (3.9%) |
| 75 Years and over | 501 (14.6%) | 1,054 (23.1%) |
Technology Access in Orange
Computing Device Access in Orange
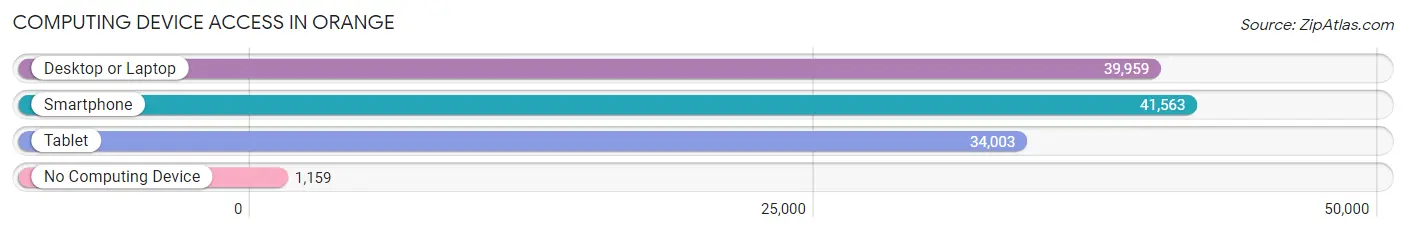
| Device Type | # Households | % Households |
| Desktop or Laptop | 39,959 | 90.1% |
| Smartphone | 41,563 | 93.8% |
| Tablet | 34,003 | 76.7% |
| No Computing Device | 1,159 | 2.6% |
| Total | 44,336 | 100.0% |
Internet Access in Orange
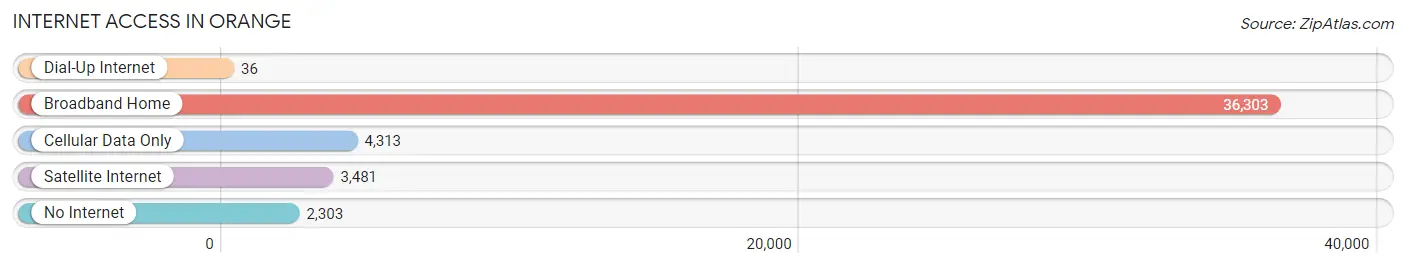
| Internet Type | # Households | % Households |
| Dial-Up Internet | 36 | 0.1% |
| Broadband Home | 36,303 | 81.9% |
| Cellular Data Only | 4,313 | 9.7% |
| Satellite Internet | 3,481 | 7.9% |
| No Internet | 2,303 | 5.2% |
| Total | 44,336 | 100.0% |
Orange Summary
Orange, California is a city located in Orange County, California. It is the county seat of Orange County and is located in the Los Angeles metropolitan area. The city has a population of approximately 140,000 people and is the second most populous city in Orange County.
Geography
Orange is located in the northern part of Orange County, California, and is bordered by the cities of Anaheim, Santa Ana, Garden Grove, and Irvine. The city is situated in a valley between the Santa Ana Mountains and the Chino Hills. The city is located approximately 25 miles southeast of Los Angeles and is part of the Los Angeles metropolitan area. The city has a total area of 25.7 square miles, of which 25.3 square miles is land and 0.4 square miles is water.
Climate
Orange has a Mediterranean climate, with warm, dry summers and mild, wet winters. The average temperature in the summer is around 75°F and in the winter it is around 55°F. The average annual precipitation is around 15 inches.
Economy
Orange is a major economic center in Orange County. The city is home to several large corporations, including the headquarters of the Fisker Automotive, the headquarters of the El Pollo Loco restaurant chain, and the headquarters of the Taco Bell restaurant chain. The city is also home to several major shopping centers, including the Outlets at Orange, the Block at Orange, and the MainPlace Mall.
Demographics
As of the 2010 census, the population of Orange was 140,095. The racial makeup of the city was 57.2% White, 2.3% African American, 0.7% Native American, 15.2% Asian, 0.3% Pacific Islander, 17.2% from other races, and 7.2% from two or more races. Hispanic or Latino of any race were 33.7% of the population.
The median income for a household in the city was $60,845, and the median income for a family was $68,945. The per capita income for the city was $27,845. About 8.2% of families and 11.2% of the population were below the poverty line, including 15.2% of those under age 18 and 6.2% of those age 65 or over.
Education
Orange is served by the Orange Unified School District, which includes seven elementary schools, three middle schools, and two high schools. The city is also home to Chapman University, a private university with an enrollment of over 8,000 students. The city is also home to Santiago Canyon College, a two-year community college.
Common Questions
What is Per Capita Income in Orange?
Per Capita income in Orange is $48,092.
What is the Median Family Income in Orange?
Median Family Income in Orange is $124,289.
What is the Median Household income in Orange?
Median Household Income in Orange is $109,335.
What is Income or Wage Gap in Orange?
Income or Wage Gap in Orange is 18.2%.
Women in Orange earn 81.8 cents for every dollar earned by a man.
What is Family Income Deficit in Orange?
Family Income Deficit in Orange is $11,741.
Families that are below poverty line in Orange earn $11,741 less on average than the poverty threshold level.
What is Inequality or Gini Index in Orange?
Inequality or Gini Index in Orange is 0.45.
What is the Total Population of Orange?
Total Population of Orange is 138,728.
What is the Total Male Population of Orange?
Total Male Population of Orange is 70,909.
What is the Total Female Population of Orange?
Total Female Population of Orange is 67,819.
What is the Ratio of Males per 100 Females in Orange?
There are 104.56 Males per 100 Females in Orange.
What is the Ratio of Females per 100 Males in Orange?
There are 95.64 Females per 100 Males in Orange.
What is the Median Population Age in Orange?
Median Population Age in Orange is 36.5 Years.
What is the Average Family Size in Orange
Average Family Size in Orange is 3.4 People.
What is the Average Household Size in Orange
Average Household Size in Orange is 3.0 People.
How Large is the Labor Force in Orange?
There are 75,300 People in the Labor Forcein in Orange.
What is the Percentage of People in the Labor Force in Orange?
66.1% of People are in the Labor Force in Orange.
What is the Unemployment Rate in Orange?
Unemployment Rate in Orange is 4.7%.