Cities with the Lowest Percentage of Births to Unmarried Women over the Age of 35 in New Mexico

RELATED REPORTS & OPTIONS

Lowest Illegitimacy | Women 35+
Population
Families and Households
Female Fertility
Female Fertility (Unmarried)
Race (Community Size)
Race (Percentage)
Ancestry (Community Size)
AfghanAfricanAlaska NativeAlaskan AthabascanAlbanianAleutAlsatianAmericanApacheArabArapahoArgentineanArmenianAssyrian / Chaldean / SyriacAustralianAustrianBahamianBangladeshiBarbadianBasqueBelgianBelizeanBermudanBhutaneseBlackfeetBolivianBrazilianBritishBritish West IndianBulgarianBurmeseCajunCambodianCanadianCape VerdeanCarpatho RusynCelticCentral AmericanCentral American IndianCherokeeCheyenneChickasawChileanChineseChippewaChoctawColombianColvilleComancheCosta RicanCreeCreekCroatianCrowCubanCypriotCzechCzechoslovakianDanishDelawareDominicanDutchDutch West IndianEastern EuropeanEcuadorianEgyptianEnglishEstonianEthiopianEuropeanFijianFilipinoFinnishFrenchFrench American IndianFrench CanadianGermanGerman RussianGhanaianGreekGuamanian / ChamorroGuatemalanGuyaneseHaitianHmongHonduranHopiHoumaHungarianIcelanderIndian (Asian)IndonesianInupiatIranianIraqiIrishIroquoisIsraeliItalianJamaicanJapaneseJordanianKenyanKiowaKoreanLaotianLatvianLebaneseLiberianLithuanianLumbeeLuxembourgerMacedonianMalaysianMalteseMarshalleseMenomineeMexicanMexican American IndianMongolianMoroccanNative HawaiianNavajoNepaleseNew ZealanderNicaraguanNigerianNorthern EuropeanNorwegianOkinawanOsageOttawaPaiutePakistaniPalestinianPanamanianParaguayanPennsylvania GermanPeruvianPimaPolishPortuguesePotawatomiPuebloPuerto RicanPuget Sound SalishRomanianRussianSalvadoranSamoanScandinavianScotch-IrishScottishSeminoleSenegaleseSerbianShoshoneSierra LeoneanSiouxSlavicSlovakSloveneSomaliSouth AfricanSouth AmericanSouth American IndianSoviet UnionSpaniardSpanishSpanish AmericanSpanish American IndianSri LankanSubsaharan AfricanSudaneseSwedishSwissSyrianTaiwaneseThaiTlingit-HaidaTohono O'OdhamTonganTrinidadian and TobagonianTsimshianTurkishU.S. Virgin IslanderUgandanUkrainianUruguayanUteVenezuelanVietnameseWelshWest IndianYakamaYaquiYugoslavianYumanYup'ikZimbabwean
Ancestry (Percentage)
AfghanAfricanAlaska NativeAlaskan AthabascanAlbanianAleutAlsatianAmericanApacheArabArapahoArgentineanArmenianAssyrian / Chaldean / SyriacAustralianAustrianBahamianBangladeshiBarbadianBasqueBelgianBelizeanBermudanBhutaneseBlackfeetBolivianBrazilianBritishBritish West IndianBulgarianBurmeseCajunCambodianCanadianCape VerdeanCarpatho RusynCelticCentral AmericanCentral American IndianCherokeeCheyenneChickasawChileanChineseChippewaChoctawColombianColvilleComancheCosta RicanCreeCreekCroatianCrowCubanCypriotCzechCzechoslovakianDanishDelawareDominicanDutchDutch West IndianEastern EuropeanEcuadorianEgyptianEnglishEstonianEthiopianEuropeanFijianFilipinoFinnishFrenchFrench American IndianFrench CanadianGermanGerman RussianGhanaianGreekGuamanian / ChamorroGuatemalanGuyaneseHaitianHmongHonduranHopiHoumaHungarianIcelanderIndian (Asian)IndonesianInupiatIranianIraqiIrishIroquoisIsraeliItalianJamaicanJapaneseJordanianKenyanKiowaKoreanLaotianLatvianLebaneseLiberianLithuanianLumbeeLuxembourgerMacedonianMalaysianMalteseMarshalleseMenomineeMexicanMexican American IndianMongolianMoroccanNative HawaiianNavajoNepaleseNew ZealanderNicaraguanNigerianNorthern EuropeanNorwegianOkinawanOsageOttawaPaiutePakistaniPalestinianPanamanianParaguayanPennsylvania GermanPeruvianPimaPolishPortuguesePotawatomiPuebloPuerto RicanPuget Sound SalishRomanianRussianSalvadoranSamoanScandinavianScotch-IrishScottishSeminoleSenegaleseSerbianShoshoneSierra LeoneanSiouxSlavicSlovakSloveneSomaliSouth AfricanSouth AmericanSouth American IndianSoviet UnionSpaniardSpanishSpanish AmericanSpanish American IndianSri LankanSubsaharan AfricanSudaneseSwedishSwissSyrianTaiwaneseThaiTlingit-HaidaTohono O'OdhamTonganTrinidadian and TobagonianTsimshianTurkishU.S. Virgin IslanderUgandanUkrainianUruguayanUteVenezuelanVietnameseWelshWest IndianYakamaYaquiYugoslavianYumanYup'ikZimbabwean
Immigrant Origin (Total)
AfghanistanAfricaAlbaniaArgentinaArmeniaAsiaAustraliaAustriaAzoresBahamasBangladeshBarbadosBelarusBelgiumBelizeBoliviaBosnia and HerzegovinaBrazilBulgariaBurma / MyanmarCabo VerdeCambodiaCameroonCanadaCaribbeanCentral AmericaChileChinaColombiaCongoCosta RicaCroatiaCubaCzechoslovakiaDenmarkDominicaDominican RepublicEastern AfricaEastern AsiaEastern EuropeEcuadorEgyptEl SalvadorEnglandEritreaEthiopiaEuropeFijiFranceGermanyGhanaGreeceGrenadaGuatemalaGuyanaHaitiHondurasHong KongHungaryIndiaIndonesiaIranIraqIrelandIsraelItalyJamaicaJapanJordanKazakhstanKenyaKoreaKuwaitLaosLatin AmericaLatviaLebanonLiberiaLithuaniaMalaysiaMexicoMicronesiaMiddle AfricaMoldovaMoroccoNepalNetherlandsNicaraguaNigeriaNorth MacedoniaNorthern AfricaNorthern EuropeNorwayOceaniaPakistanPanamaPeruPhilippinesPolandPortugalRomaniaRussiaSaudi ArabiaScotlandSenegalSerbiaSierra LeoneSingaporeSomaliaSouth AfricaSouth AmericaSouth Central AsiaSouth Eastern AsiaSouthern EuropeSpainSri LankaSt. Vincent and the GrenadinesSudanSwedenSwitzerlandSyriaTaiwanThailandTrinidad and TobagoTurkeyUgandaUkraineUruguayUzbekistanVenezuelaVietnamWest IndiesWestern AfricaWestern AsiaWestern EuropeYemenZaireZimbabwe
Immigrant Origin (Percentage)
AfghanistanAfricaAlbaniaArgentinaArmeniaAsiaAustraliaAustriaAzoresBahamasBangladeshBarbadosBelarusBelgiumBelizeBoliviaBosnia and HerzegovinaBrazilBulgariaBurma / MyanmarCabo VerdeCambodiaCameroonCanadaCaribbeanCentral AmericaChileChinaColombiaCongoCosta RicaCroatiaCubaCzechoslovakiaDenmarkDominicaDominican RepublicEastern AfricaEastern AsiaEastern EuropeEcuadorEgyptEl SalvadorEnglandEritreaEthiopiaEuropeFijiFranceGermanyGhanaGreeceGrenadaGuatemalaGuyanaHaitiHondurasHong KongHungaryIndiaIndonesiaIranIraqIrelandIsraelItalyJamaicaJapanJordanKazakhstanKenyaKoreaKuwaitLaosLatin AmericaLatviaLebanonLiberiaLithuaniaMalaysiaMexicoMicronesiaMiddle AfricaMoldovaMoroccoNepalNetherlandsNicaraguaNigeriaNorth MacedoniaNorthern AfricaNorthern EuropeNorwayOceaniaPakistanPanamaPeruPhilippinesPolandPortugalRomaniaRussiaSaudi ArabiaScotlandSenegalSerbiaSierra LeoneSingaporeSomaliaSouth AfricaSouth AmericaSouth Central AsiaSouth Eastern AsiaSouthern EuropeSpainSri LankaSt. Vincent and the GrenadinesSudanSwedenSwitzerlandSyriaTaiwanThailandTrinidad and TobagoTurkeyUgandaUkraineUruguayUzbekistanVenezuelaVietnamWest IndiesWestern AfricaWestern AsiaWestern EuropeYemenZaireZimbabwe
Income
Income (Families)
Income (Households)
Poverty
Poverty (Families)
Unemployment
Employment Occupations
Employment Industries
Employer Class
Commute Time
Commute Means
School Enrollment
Education by Degree Field
Occupancy
Finances
Physical Characteristics
New Mexico
Compare Cities
Comparison Subject

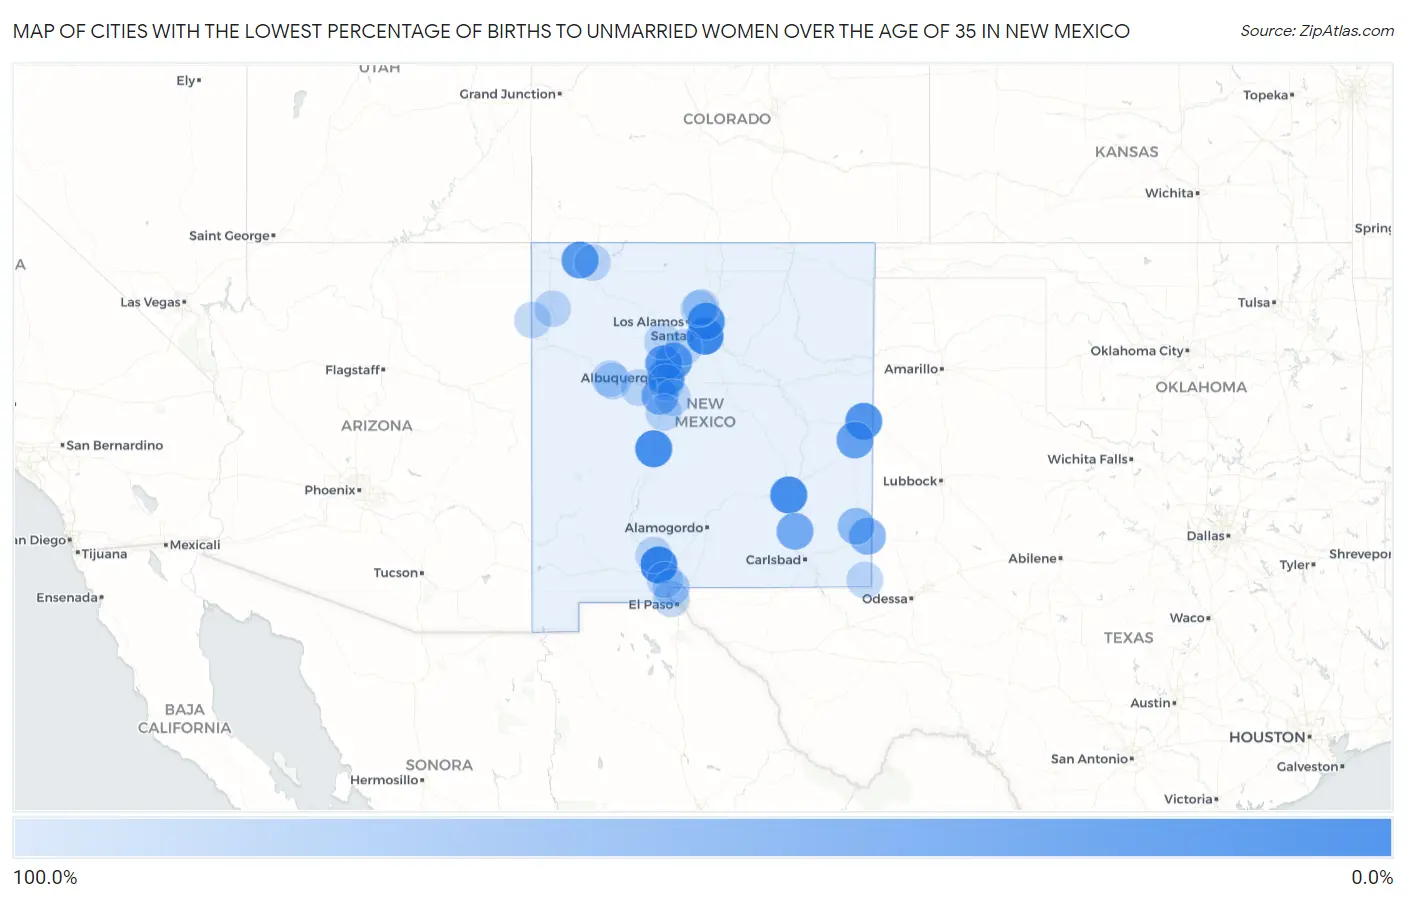
Map of Cities with the Lowest Percentage of Births to Unmarried Women over the Age of 35 in New Mexico

100.0%
0.0%
Cities with the Lowest Percentage of Births to Unmarried Women over the Age of 35 in New Mexico Map

Cities with the Lowest Percentage of Births to Unmarried Women over the Age of 35 in New Mexico

City % Unmarried vs State vs National
1.Las Cruces6.8%30.7%(-23.9)#120.1%(-13.3)#194
2.Santa Fe9.7%30.7%(-21.0)#220.1%(-10.4)#332
3.Socorro15.5%30.7%(-15.2)#320.1%(-4.60)#649
4.Roswell16.2%30.7%(-14.5)#420.1%(-3.90)#683
5.Nambe21.4%30.7%(-9.30)#520.1%(+1.30)#952
6.Clovis25.9%30.7%(-4.80)#620.1%(+5.80)#1,153
7.Albuquerque26.7%30.7%(-4.00)#720.1%(+6.60)#1,184
8.Farmington32.3%30.7%(+1.60)#820.1%(+12.2)#1,436
9.Bernalillo33.3%30.7%(+2.60)#920.1%(+13.2)#1,474
10.Rio Rancho33.9%30.7%(+3.20)#1020.1%(+13.8)#1,519
11.Portales39.0%30.7%(+8.30)#1120.1%(+18.9)#1,711
12.Artesia52.5%30.7%(+21.8)#1220.1%(+32.4)#2,134
13.Los Lunas54.5%30.7%(+23.8)#1320.1%(+34.4)#2,174
14.Espanola60.0%30.7%(+29.3)#1420.1%(+39.9)#2,295
15.North Hobbs62.2%30.7%(+31.5)#1520.1%(+42.1)#2,349
16.Lovington69.0%30.7%(+38.3)#1620.1%(+48.9)#2,492
17.Anthony85.6%30.7%(+54.9)#1720.1%(+65.5)#2,679
18.South Valley100.0%30.7%(+69.3)#1820.1%(+79.9)#2,741
19.Sunland Park100.0%30.7%(+69.3)#1920.1%(+79.9)#2,798
20.Bloomfield100.0%30.7%(+69.3)#2020.1%(+79.9)#2,998
21.Crouch Mesa100.0%30.7%(+69.3)#2120.1%(+79.9)#3,130
22.Meadow Lake100.0%30.7%(+69.3)#2220.1%(+79.9)#3,136
23.Jal100.0%30.7%(+69.3)#2320.1%(+79.9)#3,399
24.Navajo100.0%30.7%(+69.3)#2420.1%(+79.9)#3,433
25.Jemez Pueblo100.0%30.7%(+69.3)#2520.1%(+79.9)#3,435
26.Santo Domingo Pueblo100.0%30.7%(+69.3)#2620.1%(+79.9)#3,447
27.Radium Springs100.0%30.7%(+69.3)#2720.1%(+79.9)#3,527
28.Rio Rancho Estates100.0%30.7%(+69.3)#2820.1%(+79.9)#3,572
29.Skyline Ganipa100.0%30.7%(+69.3)#2920.1%(+79.9)#3,663
30.Chamita100.0%30.7%(+69.3)#3020.1%(+79.9)#3,779
31.La Mesa100.0%30.7%(+69.3)#3120.1%(+79.9)#3,865
32.Mccartys Village100.0%30.7%(+69.3)#3220.1%(+79.9)#3,898
33.Highland Meadows100.0%30.7%(+69.3)#3320.1%(+79.9)#3,997
34.Naschitti100.0%30.7%(+69.3)#3420.1%(+79.9)#4,027
35.Alcalde100.0%30.7%(+69.3)#3520.1%(+79.9)#4,093
36.Madrone100.0%30.7%(+69.3)#3620.1%(+79.9)#4,136

Common Questions

What are the Top 10 Cities with the Lowest Percentage of Births to Unmarried Women over the Age of 35 in New Mexico?
Top 10 Cities with the Lowest Percentage of Births to Unmarried Women over the Age of 35 in New Mexico are:
#1
0.0%
#2
0.0%
#3
0.0%
#4
0.0%
#5
0.0%
#6
0.0%
#7
0.0%
#8
0.0%
#9
0.0%
#10
0.0%
What city has the Lowest Percentage of Births to Unmarried Women over the Age of 35 in New Mexico?
Las Cruces has the Lowest Percentage of Births to Unmarried Women over the Age of 35 in New Mexico with 6.8%.
What is the Percentage of Births to Unmarried Women over the Age of 35 in the State of New Mexico?
Percentage of Births to Unmarried Women over the Age of 35 in New Mexico is 30.7%.
What is the Percentage of Births to Unmarried Women over the Age of 35 in the United States?
Percentage of Births to Unmarried Women over the Age of 35 in the United States is 20.1%.