Cities with the Lowest Percentage of Births to Unmarried Women over the Age of 35 in Arkansas

RELATED REPORTS & OPTIONS

Lowest Illegitimacy | Women 35+
Population
Families and Households
Female Fertility
Female Fertility (Unmarried)
Race (Community Size)
Race (Percentage)
Ancestry (Community Size)
AfghanAfricanAlaska NativeAlaskan AthabascanAlbanianAleutAlsatianAmericanApacheArabArapahoArgentineanArmenianAssyrian / Chaldean / SyriacAustralianAustrianBahamianBangladeshiBarbadianBasqueBelgianBelizeanBermudanBhutaneseBlackfeetBolivianBrazilianBritishBritish West IndianBulgarianBurmeseCajunCambodianCanadianCape VerdeanCarpatho RusynCelticCentral AmericanCentral American IndianCherokeeCheyenneChickasawChileanChineseChippewaChoctawColombianColvilleComancheCosta RicanCreeCreekCroatianCrowCubanCypriotCzechCzechoslovakianDanishDelawareDominicanDutchDutch West IndianEastern EuropeanEcuadorianEgyptianEnglishEstonianEthiopianEuropeanFijianFilipinoFinnishFrenchFrench American IndianFrench CanadianGermanGerman RussianGhanaianGreekGuamanian / ChamorroGuatemalanGuyaneseHaitianHmongHonduranHopiHoumaHungarianIcelanderIndian (Asian)IndonesianInupiatIranianIraqiIrishIroquoisIsraeliItalianJamaicanJapaneseJordanianKenyanKiowaKoreanLaotianLatvianLebaneseLiberianLithuanianLumbeeLuxembourgerMacedonianMalaysianMalteseMarshalleseMenomineeMexicanMexican American IndianMongolianMoroccanNative HawaiianNavajoNepaleseNew ZealanderNicaraguanNigerianNorthern EuropeanNorwegianOkinawanOsageOttawaPaiutePakistaniPalestinianPanamanianParaguayanPennsylvania GermanPeruvianPimaPolishPortuguesePotawatomiPuebloPuerto RicanPuget Sound SalishRomanianRussianSalvadoranSamoanScandinavianScotch-IrishScottishSeminoleSenegaleseSerbianShoshoneSierra LeoneanSiouxSlavicSlovakSloveneSomaliSouth AfricanSouth AmericanSouth American IndianSoviet UnionSpaniardSpanishSpanish AmericanSpanish American IndianSri LankanSubsaharan AfricanSudaneseSwedishSwissSyrianTaiwaneseThaiTlingit-HaidaTohono O'OdhamTonganTrinidadian and TobagonianTsimshianTurkishU.S. Virgin IslanderUgandanUkrainianUruguayanUteVenezuelanVietnameseWelshWest IndianYakamaYaquiYugoslavianYumanYup'ikZimbabwean
Ancestry (Percentage)
AfghanAfricanAlaska NativeAlaskan AthabascanAlbanianAleutAlsatianAmericanApacheArabArapahoArgentineanArmenianAssyrian / Chaldean / SyriacAustralianAustrianBahamianBangladeshiBarbadianBasqueBelgianBelizeanBermudanBhutaneseBlackfeetBolivianBrazilianBritishBritish West IndianBulgarianBurmeseCajunCambodianCanadianCape VerdeanCarpatho RusynCelticCentral AmericanCentral American IndianCherokeeCheyenneChickasawChileanChineseChippewaChoctawColombianColvilleComancheCosta RicanCreeCreekCroatianCrowCubanCypriotCzechCzechoslovakianDanishDelawareDominicanDutchDutch West IndianEastern EuropeanEcuadorianEgyptianEnglishEstonianEthiopianEuropeanFijianFilipinoFinnishFrenchFrench American IndianFrench CanadianGermanGerman RussianGhanaianGreekGuamanian / ChamorroGuatemalanGuyaneseHaitianHmongHonduranHopiHoumaHungarianIcelanderIndian (Asian)IndonesianInupiatIranianIraqiIrishIroquoisIsraeliItalianJamaicanJapaneseJordanianKenyanKiowaKoreanLaotianLatvianLebaneseLiberianLithuanianLumbeeLuxembourgerMacedonianMalaysianMalteseMarshalleseMenomineeMexicanMexican American IndianMongolianMoroccanNative HawaiianNavajoNepaleseNew ZealanderNicaraguanNigerianNorthern EuropeanNorwegianOkinawanOsageOttawaPaiutePakistaniPalestinianPanamanianParaguayanPennsylvania GermanPeruvianPimaPolishPortuguesePotawatomiPuebloPuerto RicanPuget Sound SalishRomanianRussianSalvadoranSamoanScandinavianScotch-IrishScottishSeminoleSenegaleseSerbianShoshoneSierra LeoneanSiouxSlavicSlovakSloveneSomaliSouth AfricanSouth AmericanSouth American IndianSoviet UnionSpaniardSpanishSpanish AmericanSpanish American IndianSri LankanSubsaharan AfricanSudaneseSwedishSwissSyrianTaiwaneseThaiTlingit-HaidaTohono O'OdhamTonganTrinidadian and TobagonianTsimshianTurkishU.S. Virgin IslanderUgandanUkrainianUruguayanUteVenezuelanVietnameseWelshWest IndianYakamaYaquiYugoslavianYumanYup'ikZimbabwean
Immigrant Origin (Total)
AfghanistanAfricaAlbaniaArgentinaArmeniaAsiaAustraliaAustriaAzoresBahamasBangladeshBarbadosBelarusBelgiumBelizeBoliviaBosnia and HerzegovinaBrazilBulgariaBurma / MyanmarCabo VerdeCambodiaCameroonCanadaCaribbeanCentral AmericaChileChinaColombiaCongoCosta RicaCroatiaCubaCzechoslovakiaDenmarkDominicaDominican RepublicEastern AfricaEastern AsiaEastern EuropeEcuadorEgyptEl SalvadorEnglandEritreaEthiopiaEuropeFijiFranceGermanyGhanaGreeceGrenadaGuatemalaGuyanaHaitiHondurasHong KongHungaryIndiaIndonesiaIranIraqIrelandIsraelItalyJamaicaJapanJordanKazakhstanKenyaKoreaKuwaitLaosLatin AmericaLatviaLebanonLiberiaLithuaniaMalaysiaMexicoMicronesiaMiddle AfricaMoldovaMoroccoNepalNetherlandsNicaraguaNigeriaNorth MacedoniaNorthern AfricaNorthern EuropeNorwayOceaniaPakistanPanamaPeruPhilippinesPolandPortugalRomaniaRussiaSaudi ArabiaScotlandSenegalSerbiaSierra LeoneSingaporeSomaliaSouth AfricaSouth AmericaSouth Central AsiaSouth Eastern AsiaSouthern EuropeSpainSri LankaSt. Vincent and the GrenadinesSudanSwedenSwitzerlandSyriaTaiwanThailandTrinidad and TobagoTurkeyUgandaUkraineUruguayUzbekistanVenezuelaVietnamWest IndiesWestern AfricaWestern AsiaWestern EuropeYemenZaireZimbabwe
Immigrant Origin (Percentage)
AfghanistanAfricaAlbaniaArgentinaArmeniaAsiaAustraliaAustriaAzoresBahamasBangladeshBarbadosBelarusBelgiumBelizeBoliviaBosnia and HerzegovinaBrazilBulgariaBurma / MyanmarCabo VerdeCambodiaCameroonCanadaCaribbeanCentral AmericaChileChinaColombiaCongoCosta RicaCroatiaCubaCzechoslovakiaDenmarkDominicaDominican RepublicEastern AfricaEastern AsiaEastern EuropeEcuadorEgyptEl SalvadorEnglandEritreaEthiopiaEuropeFijiFranceGermanyGhanaGreeceGrenadaGuatemalaGuyanaHaitiHondurasHong KongHungaryIndiaIndonesiaIranIraqIrelandIsraelItalyJamaicaJapanJordanKazakhstanKenyaKoreaKuwaitLaosLatin AmericaLatviaLebanonLiberiaLithuaniaMalaysiaMexicoMicronesiaMiddle AfricaMoldovaMoroccoNepalNetherlandsNicaraguaNigeriaNorth MacedoniaNorthern AfricaNorthern EuropeNorwayOceaniaPakistanPanamaPeruPhilippinesPolandPortugalRomaniaRussiaSaudi ArabiaScotlandSenegalSerbiaSierra LeoneSingaporeSomaliaSouth AfricaSouth AmericaSouth Central AsiaSouth Eastern AsiaSouthern EuropeSpainSri LankaSt. Vincent and the GrenadinesSudanSwedenSwitzerlandSyriaTaiwanThailandTrinidad and TobagoTurkeyUgandaUkraineUruguayUzbekistanVenezuelaVietnamWest IndiesWestern AfricaWestern AsiaWestern EuropeYemenZaireZimbabwe
Income
Income (Families)
Income (Households)
Poverty
Poverty (Families)
Unemployment
Employment Occupations
Employment Industries
Employer Class
Commute Time
Commute Means
School Enrollment
Education by Degree Field
Occupancy
Finances
Physical Characteristics
Arkansas
Compare Cities
Comparison Subject

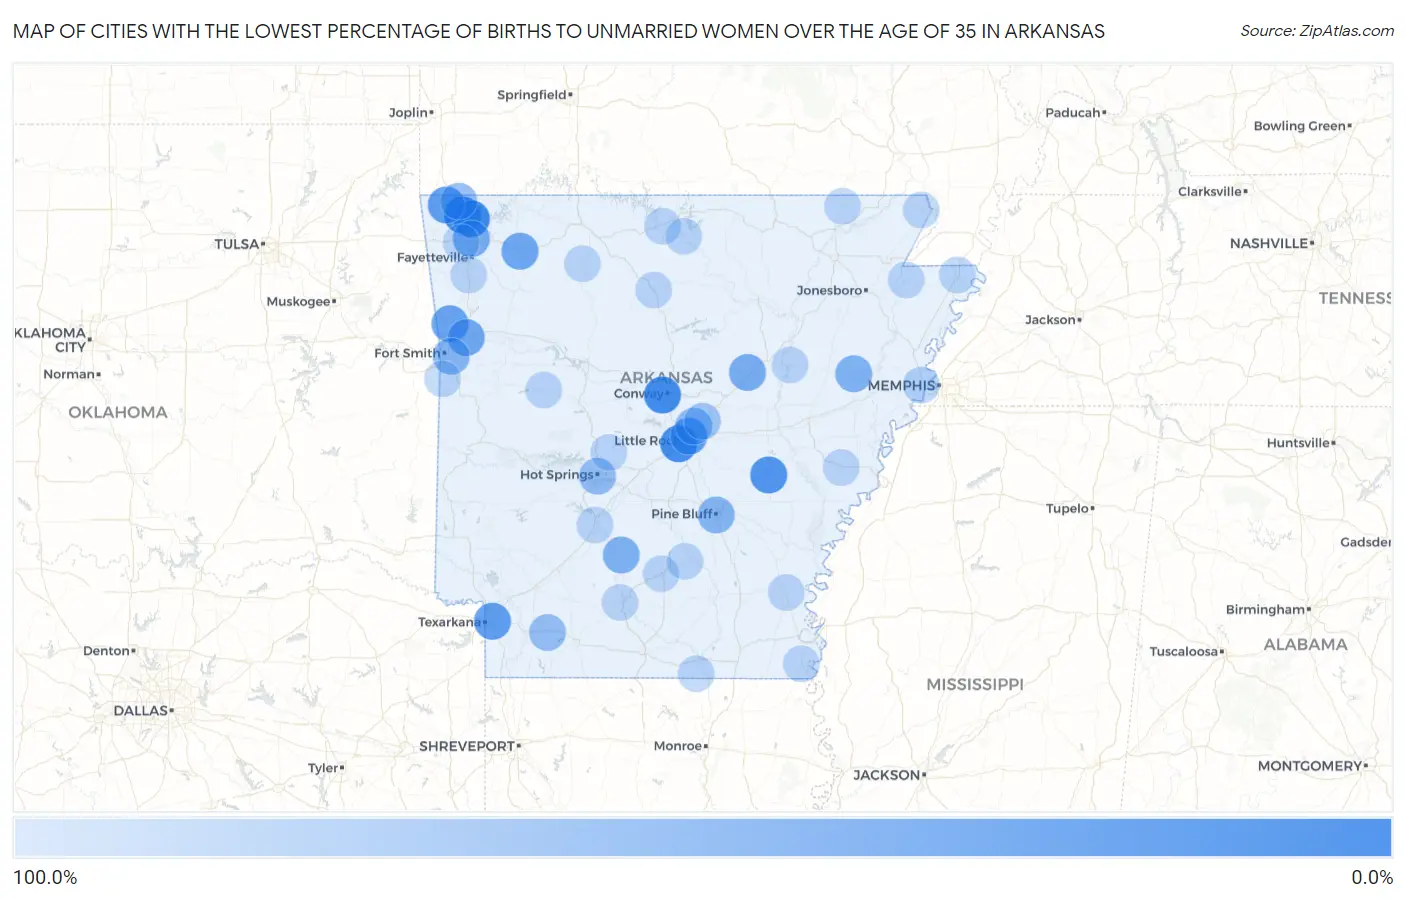
Map of Cities with the Lowest Percentage of Births to Unmarried Women over the Age of 35 in Arkansas

100.0%
0.0%
Cities with the Lowest Percentage of Births to Unmarried Women over the Age of 35 in Arkansas Map

Cities with the Lowest Percentage of Births to Unmarried Women over the Age of 35 in Arkansas

City % Unmarried vs State vs National
1.Bentonville7.3%25.7%(-18.4)#120.1%(-12.8)#222
2.Rogers11.3%25.7%(-14.4)#220.1%(-8.80)#398
3.Little Rock14.6%25.7%(-11.1)#320.1%(-5.50)#582
4.Conway14.6%25.7%(-11.1)#420.1%(-5.50)#586
5.Stuttgart25.0%25.7%(-0.700)#520.1%(+4.90)#1,106
6.Gravette35.1%25.7%(+9.40)#620.1%(+15.0)#1,572
7.Texarkana36.3%25.7%(+10.6)#720.1%(+16.2)#1,612
8.North Little Rock38.0%25.7%(+12.3)#820.1%(+17.9)#1,677
9.Cedarville43.5%25.7%(+17.8)#920.1%(+23.4)#1,854
10.Huntsville46.2%25.7%(+20.5)#1020.1%(+26.1)#1,941
11.Alma47.1%25.7%(+21.4)#1120.1%(+27.0)#1,964
12.Searcy53.2%25.7%(+27.5)#1220.1%(+33.1)#2,152
13.Springdale54.1%25.7%(+28.4)#1320.1%(+34.0)#2,170
14.Wynne60.0%25.7%(+34.3)#1420.1%(+39.9)#2,296
15.Sparkman60.0%25.7%(+34.3)#1520.1%(+39.9)#2,306
16.Pine Bluff63.8%25.7%(+38.1)#1620.1%(+43.7)#2,389
17.Fort Smith64.0%25.7%(+38.3)#1720.1%(+43.9)#2,392
18.Sherwood68.8%25.7%(+43.1)#1820.1%(+48.7)#2,487
19.Bella Vista71.8%25.7%(+46.1)#1920.1%(+51.7)#2,529
20.Hot Springs72.1%25.7%(+46.4)#2020.1%(+52.0)#2,533
21.Stamps75.0%25.7%(+49.3)#2120.1%(+54.9)#2,570
22.Jacksonville83.3%25.7%(+57.6)#2220.1%(+63.2)#2,656
23.West Memphis95.2%25.7%(+69.5)#2320.1%(+75.1)#2,731
24.Blytheville98.2%25.7%(+72.5)#2420.1%(+78.1)#2,735
25.Hot Springs Village100.0%25.7%(+74.3)#2520.1%(+79.9)#2,796
26.Camden100.0%25.7%(+74.3)#2620.1%(+79.9)#2,903
27.Arkadelphia100.0%25.7%(+74.3)#2720.1%(+79.9)#2,911
28.Tontitown100.0%25.7%(+74.3)#2820.1%(+79.9)#3,115
29.Mcgehee100.0%25.7%(+74.3)#2920.1%(+79.9)#3,205
30.Piggott100.0%25.7%(+74.3)#3020.1%(+79.9)#3,221
31.West Fork100.0%25.7%(+74.3)#3120.1%(+79.9)#3,275
32.Gassville100.0%25.7%(+74.3)#3220.1%(+79.9)#3,381
33.Eudora100.0%25.7%(+74.3)#3320.1%(+79.9)#3,414
34.Augusta100.0%25.7%(+74.3)#3420.1%(+79.9)#3,451
35.Monette100.0%25.7%(+74.3)#3520.1%(+79.9)#3,607
36.Marvell100.0%25.7%(+74.3)#3620.1%(+79.9)#3,677
37.Hackett100.0%25.7%(+74.3)#3720.1%(+79.9)#3,782
38.Jasper100.0%25.7%(+74.3)#3820.1%(+79.9)#3,877
39.Havana100.0%25.7%(+74.3)#3920.1%(+79.9)#3,904
40.Norfork100.0%25.7%(+74.3)#4020.1%(+79.9)#3,911
41.Kingsland100.0%25.7%(+74.3)#4120.1%(+79.9)#3,936
42.Huttig100.0%25.7%(+74.3)#4220.1%(+79.9)#3,944
43.Leslie100.0%25.7%(+74.3)#4320.1%(+79.9)#3,959
44.Maynard100.0%25.7%(+74.3)#4420.1%(+79.9)#3,989
45.Thornton100.0%25.7%(+74.3)#4520.1%(+79.9)#4,002

Common Questions

What are the Top 10 Cities with the Lowest Percentage of Births to Unmarried Women over the Age of 35 in Arkansas?
Top 10 Cities with the Lowest Percentage of Births to Unmarried Women over the Age of 35 in Arkansas are:
#1
0.0%
#2
0.0%
#3
0.0%
#4
0.0%
#5
0.0%
#6
0.0%
#7
0.0%
#8
0.0%
#9
0.0%
#10
0.0%
What city has the Lowest Percentage of Births to Unmarried Women over the Age of 35 in Arkansas?
Bentonville has the Lowest Percentage of Births to Unmarried Women over the Age of 35 in Arkansas with 7.3%.
What is the Percentage of Births to Unmarried Women over the Age of 35 in the State of Arkansas?
Percentage of Births to Unmarried Women over the Age of 35 in Arkansas is 25.7%.
What is the Percentage of Births to Unmarried Women over the Age of 35 in the United States?
Percentage of Births to Unmarried Women over the Age of 35 in the United States is 20.1%.