Cities with the Lowest Percentage of Births to Unmarried Women over the Age of 35 in New Jersey
RELATED REPORTS & OPTIONS
Lowest Illegitimacy | Women 35+
New Jersey
Compare Cities
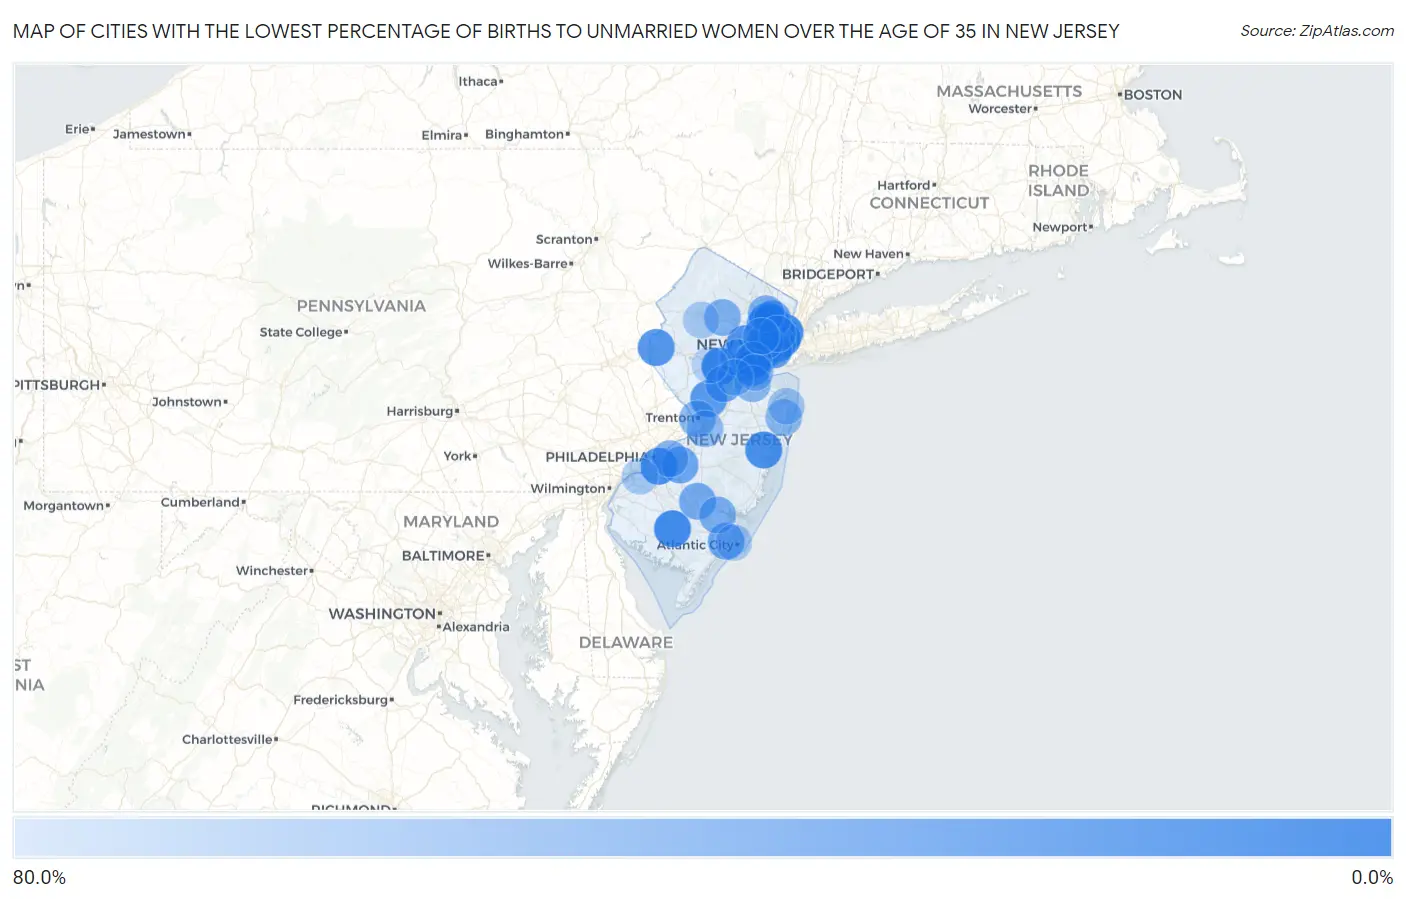
Map of Cities with the Lowest Percentage of Births to Unmarried Women over the Age of 35 in New Jersey
80.0%
0.0%
Cities with the Lowest Percentage of Births to Unmarried Women over the Age of 35 in New Jersey
| City | % Unmarried | vs State | vs National | |
| 1. | Union City | 0.80% | 17.5%(-16.7)#1 | 20.1%(-19.3)#4 |
| 2. | Edgewater Borough | 2.2% | 17.5%(-15.3)#2 | 20.1%(-17.9)#29 |
| 3. | Somerville Borough | 3.4% | 17.5%(-14.1)#3 | 20.1%(-16.7)#60 |
| 4. | North Plainfield Borough | 4.5% | 17.5%(-13.0)#4 | 20.1%(-15.6)#94 |
| 5. | Little Ferry Borough | 4.5% | 17.5%(-13.0)#5 | 20.1%(-15.6)#95 |
| 6. | Finderne | 5.0% | 17.5%(-12.5)#6 | 20.1%(-15.1)#122 |
| 7. | Audubon Borough | 6.4% | 17.5%(-11.1)#7 | 20.1%(-13.7)#181 |
| 8. | Vineland | 6.5% | 17.5%(-11.0)#8 | 20.1%(-13.6)#182 |
| 9. | Sicklerville | 6.5% | 17.5%(-11.0)#9 | 20.1%(-13.6)#185 |
| 10. | Wanaque Borough | 6.9% | 17.5%(-10.6)#10 | 20.1%(-13.2)#202 |
| 11. | Fort Lee Borough | 7.6% | 17.5%(-9.90)#11 | 20.1%(-12.5)#233 |
| 12. | West New York | 8.3% | 17.5%(-9.20)#12 | 20.1%(-11.8)#273 |
| 13. | Elmwood Park Borough | 9.1% | 17.5%(-8.40)#13 | 20.1%(-11.0)#307 |
| 14. | Gloucester City | 9.6% | 17.5%(-7.90)#14 | 20.1%(-10.5)#329 |
| 15. | Sayreville Borough | 10.2% | 17.5%(-7.30)#15 | 20.1%(-9.90)#359 |
| 16. | Brookdale | 11.1% | 17.5%(-6.40)#16 | 20.1%(-9.00)#395 |
| 17. | Toms River | 11.4% | 17.5%(-6.10)#17 | 20.1%(-8.70)#405 |
| 18. | Summit | 12.8% | 17.5%(-4.70)#18 | 20.1%(-7.30)#481 |
| 19. | Red Bank Borough | 14.1% | 17.5%(-3.40)#19 | 20.1%(-6.00)#557 |
| 20. | Hoboken | 14.4% | 17.5%(-3.10)#20 | 20.1%(-5.70)#575 |
| 21. | Clifton | 14.8% | 17.5%(-2.70)#21 | 20.1%(-5.30)#605 |
| 22. | Florham Park Borough | 14.9% | 17.5%(-2.60)#22 | 20.1%(-5.20)#611 |
| 23. | Maywood Borough | 14.9% | 17.5%(-2.60)#23 | 20.1%(-5.20)#612 |
| 24. | Jersey City | 15.0% | 17.5%(-2.50)#24 | 20.1%(-5.10)#613 |
| 25. | Harrison | 15.2% | 17.5%(-2.30)#25 | 20.1%(-4.90)#629 |
| 26. | Bergenfield Borough | 15.5% | 17.5%(-2.00)#26 | 20.1%(-4.60)#647 |
| 27. | Closter Borough | 15.9% | 17.5%(-1.60)#27 | 20.1%(-4.20)#672 |
| 28. | New Milford Borough | 16.1% | 17.5%(-1.40)#28 | 20.1%(-4.00)#679 |
| 29. | Colonia | 16.3% | 17.5%(-1.20)#29 | 20.1%(-3.80)#697 |
| 30. | Greenwich | 16.7% | 17.5%(-0.800)#30 | 20.1%(-3.40)#713 |
| 31. | Hillsdale Borough | 17.5% | 17.5%(=0.000)#31 | 20.1%(-2.60)#758 |
| 32. | Linden | 17.7% | 17.5%(+0.200)#32 | 20.1%(-2.40)#764 |
| 33. | Dumont Borough | 17.9% | 17.5%(+0.400)#33 | 20.1%(-2.20)#774 |
| 34. | Pine Brook | 18.4% | 17.5%(+0.900)#34 | 20.1%(-1.70)#806 |
| 35. | Bogota Borough | 19.2% | 17.5%(+1.70)#35 | 20.1%(-0.900)#840 |
| 36. | Princeton | 19.6% | 17.5%(+2.10)#36 | 20.1%(-0.500)#859 |
| 37. | Lodi Borough | 20.1% | 17.5%(+2.60)#37 | 20.1%(=0.000)#885 |
| 38. | Palisades Park Borough | 20.5% | 17.5%(+3.00)#38 | 20.1%(+0.400)#903 |
| 39. | Kearny | 20.6% | 17.5%(+3.10)#39 | 20.1%(+0.500)#907 |
| 40. | Stanhope Borough | 21.1% | 17.5%(+3.60)#40 | 20.1%(+1.00)#938 |
| 41. | Passaic | 21.9% | 17.5%(+4.40)#41 | 20.1%(+1.80)#975 |
| 42. | North Arlington Borough | 22.2% | 17.5%(+4.70)#42 | 20.1%(+2.10)#990 |
| 43. | Rutherford Borough | 24.4% | 17.5%(+6.90)#43 | 20.1%(+4.30)#1,081 |
| 44. | Elizabeth | 26.0% | 17.5%(+8.50)#44 | 20.1%(+5.90)#1,156 |
| 45. | Bayonne | 26.0% | 17.5%(+8.50)#45 | 20.1%(+5.90)#1,157 |
| 46. | Point Pleasant Borough | 26.5% | 17.5%(+9.00)#46 | 20.1%(+6.40)#1,181 |
| 47. | Glassboro Borough | 26.8% | 17.5%(+9.30)#47 | 20.1%(+6.70)#1,192 |
| 48. | Garfield | 27.3% | 17.5%(+9.80)#48 | 20.1%(+7.20)#1,212 |
| 49. | Fair Lawn Borough | 27.5% | 17.5%(+10.0)#49 | 20.1%(+7.40)#1,226 |
| 50. | Franklin Park | 28.4% | 17.5%(+10.9)#50 | 20.1%(+8.30)#1,269 |
| 51. | Newark | 28.5% | 17.5%(+11.0)#51 | 20.1%(+8.40)#1,270 |
| 52. | Woodbridge | 29.1% | 17.5%(+11.6)#52 | 20.1%(+9.00)#1,300 |
| 53. | Marlton | 29.6% | 17.5%(+12.1)#53 | 20.1%(+9.50)#1,323 |
| 54. | Pleasantville | 29.8% | 17.5%(+12.3)#54 | 20.1%(+9.70)#1,333 |
| 55. | Roselle Borough | 30.0% | 17.5%(+12.5)#55 | 20.1%(+9.90)#1,338 |
| 56. | Eatontown Borough | 32.1% | 17.5%(+14.6)#56 | 20.1%(+12.0)#1,423 |
| 57. | North Haledon Borough | 33.3% | 17.5%(+15.8)#57 | 20.1%(+13.2)#1,475 |
| 58. | Forsgate | 34.2% | 17.5%(+16.7)#58 | 20.1%(+14.1)#1,532 |
| 59. | Hammonton | 35.7% | 17.5%(+18.2)#59 | 20.1%(+15.6)#1,591 |
| 60. | Preakness | 36.8% | 17.5%(+19.3)#60 | 20.1%(+16.7)#1,626 |
| 61. | Collingswood Borough | 37.1% | 17.5%(+19.6)#61 | 20.1%(+17.0)#1,638 |
| 62. | Woodland Park Borough | 37.9% | 17.5%(+20.4)#62 | 20.1%(+17.8)#1,674 |
| 63. | Paterson | 38.3% | 17.5%(+20.8)#63 | 20.1%(+18.2)#1,694 |
| 64. | Secaucus | 38.5% | 17.5%(+21.0)#64 | 20.1%(+18.4)#1,701 |
| 65. | Stirling | 39.0% | 17.5%(+21.5)#65 | 20.1%(+18.9)#1,714 |
| 66. | Egg Harbor City | 39.1% | 17.5%(+21.6)#66 | 20.1%(+19.0)#1,718 |
| 67. | Dover | 40.5% | 17.5%(+23.0)#67 | 20.1%(+20.4)#1,771 |
| 68. | Cherry Hill Mall | 41.1% | 17.5%(+23.6)#68 | 20.1%(+21.0)#1,785 |
| 69. | Freehold Borough | 42.9% | 17.5%(+25.4)#69 | 20.1%(+22.8)#1,828 |
| 70. | Menlo Park Terrace | 42.9% | 17.5%(+25.4)#70 | 20.1%(+22.8)#1,835 |
| 71. | Trenton | 43.3% | 17.5%(+25.8)#71 | 20.1%(+23.2)#1,848 |
| 72. | Plainfield | 45.4% | 17.5%(+27.9)#72 | 20.1%(+25.3)#1,911 |
| 73. | Rahway | 45.5% | 17.5%(+28.0)#73 | 20.1%(+25.4)#1,913 |
| 74. | Madison Park | 45.6% | 17.5%(+28.1)#74 | 20.1%(+25.5)#1,927 |
| 75. | Asbury Park | 46.2% | 17.5%(+28.7)#75 | 20.1%(+26.1)#1,939 |
| 76. | East Orange | 46.6% | 17.5%(+29.1)#76 | 20.1%(+26.5)#1,947 |
| 77. | Glen Rock Borough | 48.2% | 17.5%(+30.7)#77 | 20.1%(+28.1)#1,994 |
| 78. | Rutgers University-Busch Campus | 50.0% | 17.5%(+32.5)#78 | 20.1%(+29.9)#2,041 |
| 79. | Bordentown | 50.0% | 17.5%(+32.5)#79 | 20.1%(+29.9)#2,047 |
| 80. | Lake Como Borough | 50.0% | 17.5%(+32.5)#80 | 20.1%(+29.9)#2,056 |
| 81. | Perth Amboy | 51.4% | 17.5%(+33.9)#81 | 20.1%(+31.3)#2,102 |
| 82. | Wallington Borough | 51.5% | 17.5%(+34.0)#82 | 20.1%(+31.4)#2,106 |
| 83. | Ramsey Borough | 54.7% | 17.5%(+37.2)#83 | 20.1%(+34.6)#2,185 |
| 84. | Stratford Borough | 55.0% | 17.5%(+37.5)#84 | 20.1%(+34.9)#2,189 |
| 85. | Atlantic Highlands Borough | 55.6% | 17.5%(+38.1)#85 | 20.1%(+35.5)#2,198 |
| 86. | Point Pleasant Beach Borough | 56.5% | 17.5%(+39.0)#86 | 20.1%(+36.4)#2,215 |
| 87. | Chesilhurst Borough | 57.1% | 17.5%(+39.6)#87 | 20.1%(+37.0)#2,234 |
| 88. | Long Branch | 57.3% | 17.5%(+39.8)#88 | 20.1%(+37.2)#2,242 |
| 89. | South Toms River Borough | 60.0% | 17.5%(+42.5)#89 | 20.1%(+39.9)#2,300 |
| 90. | New Brunswick | 60.1% | 17.5%(+42.6)#90 | 20.1%(+40.0)#2,308 |
| 91. | Budd Lake | 61.8% | 17.5%(+44.3)#91 | 20.1%(+41.7)#2,340 |
| 92. | Gibbstown | 61.9% | 17.5%(+44.4)#92 | 20.1%(+41.8)#2,342 |
| 93. | Atlantic City | 62.3% | 17.5%(+44.8)#93 | 20.1%(+42.2)#2,350 |
| 94. | Bound Brook Borough | 62.7% | 17.5%(+45.2)#94 | 20.1%(+42.6)#2,371 |
| 95. | Alpha Borough | 64.3% | 17.5%(+46.8)#95 | 20.1%(+44.2)#2,404 |
| 96. | Carteret Borough | 64.4% | 17.5%(+46.9)#96 | 20.1%(+44.3)#2,406 |
| 97. | Berlin Borough | 64.8% | 17.5%(+47.3)#97 | 20.1%(+44.7)#2,419 |
| 98. | Haledon Borough | 65.0% | 17.5%(+47.5)#98 | 20.1%(+44.9)#2,423 |
| 99. | Lake Hiawatha | 66.7% | 17.5%(+49.2)#99 | 20.1%(+46.6)#2,446 |
| 100. | Bradley Gardens | 69.5% | 17.5%(+52.0)#100 | 20.1%(+49.4)#2,502 |
Common Questions
What are the Top 10 Cities with the Lowest Percentage of Births to Unmarried Women over the Age of 35 in New Jersey?
Top 10 Cities with the Lowest Percentage of Births to Unmarried Women over the Age of 35 in New Jersey are:
#1
0.80%
#2
5.0%
#3
6.5%
#4
8.3%
#5
9.6%
#6
11.1%
#7
11.4%
#8
12.8%
#9
14.4%
#10
14.8%
What city has the Lowest Percentage of Births to Unmarried Women over the Age of 35 in New Jersey?
Union City has the Lowest Percentage of Births to Unmarried Women over the Age of 35 in New Jersey with 0.80%.
What is the Percentage of Births to Unmarried Women over the Age of 35 in the State of New Jersey?
Percentage of Births to Unmarried Women over the Age of 35 in New Jersey is 17.5%.
What is the Percentage of Births to Unmarried Women over the Age of 35 in the United States?
Percentage of Births to Unmarried Women over the Age of 35 in the United States is 20.1%.