Marina, CA Map & Demographics
Marina Map
Marina Overview
$38,806
PER CAPITA INCOME
$96,657
AVG FAMILY INCOME
$85,783
AVG HOUSEHOLD INCOME
25.6%
WAGE / INCOME GAP [ % ]
74.4¢/ $1
WAGE / INCOME GAP [ $ ]
$12,564
FAMILY INCOME DEFICIT
0.44
INEQUALITY / GINI INDEX
22,253
TOTAL POPULATION
11,040
MALE POPULATION
11,213
FEMALE POPULATION
98.46
MALES / 100 FEMALES
101.57
FEMALES / 100 MALES
36.0
MEDIAN AGE
3.2
AVG FAMILY SIZE
2.7
AVG HOUSEHOLD SIZE
12,079
LABOR FORCE [ PEOPLE ]
67.0%
PERCENT IN LABOR FORCE
5.9%
UNEMPLOYMENT RATE
Marina Zip Codes
Marina Area Codes
Income in Marina
Income Overview in Marina
Per Capita Income in Marina is $38,806, while median incomes of families and households are $96,657 and $85,783 respectively.
| Characteristic | Number | Measure |
| Per Capita Income | 22,253 | $38,806 |
| Median Family Income | 5,017 | $96,657 |
| Mean Family Income | 5,017 | $121,722 |
| Median Household Income | 7,797 | $85,783 |
| Mean Household Income | 7,797 | $109,246 |
| Income Deficit | 5,017 | $12,564 |
| Wage / Income Gap (%) | 22,253 | 25.57% |
| Wage / Income Gap ($) | 22,253 | 74.43¢ per $1 |
| Gini / Inequality Index | 22,253 | 0.44 |
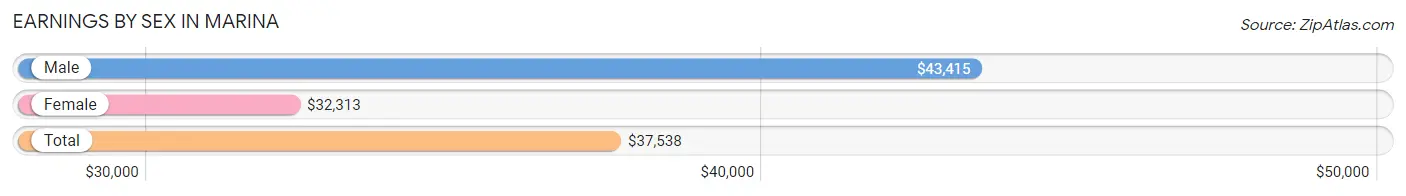
Earnings by Sex in Marina
Average Earnings in Marina are $37,538, $43,415 for men and $32,313 for women, a difference of 25.6%.
| Sex | Number | Average Earnings |
| Male | 6,598 (52.4%) | $43,415 |
| Female | 5,992 (47.6%) | $32,313 |
| Total | 12,590 (100.0%) | $37,538 |
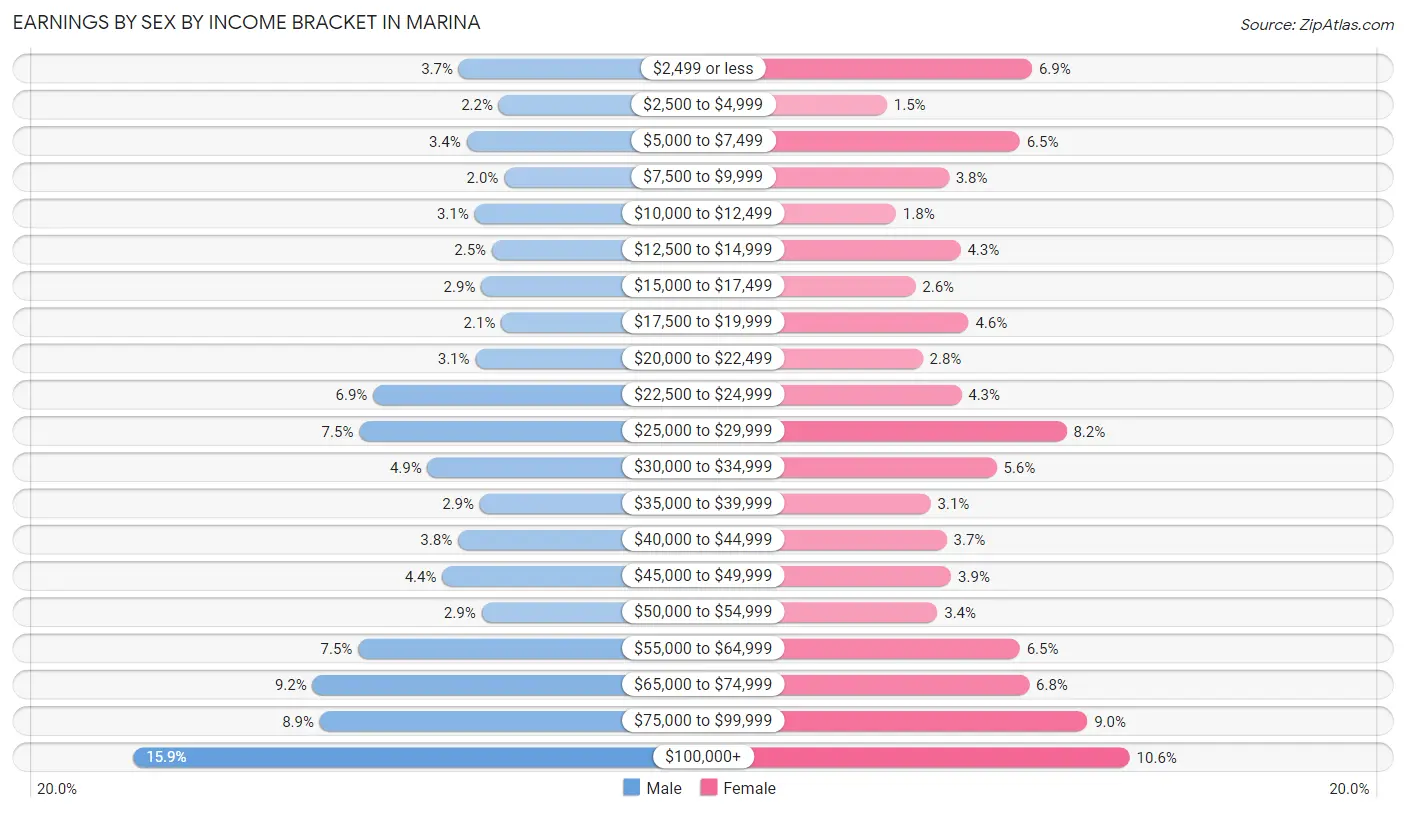
Earnings by Sex by Income Bracket in Marina
The most common earnings brackets in Marina are $100,000+ for men (1,051 | 15.9%) and $100,000+ for women (635 | 10.6%).
| Income | Male | Female |
| $2,499 or less | 246 (3.7%) | 416 (6.9%) |
| $2,500 to $4,999 | 147 (2.2%) | 90 (1.5%) |
| $5,000 to $7,499 | 227 (3.4%) | 388 (6.5%) |
| $7,500 to $9,999 | 134 (2.0%) | 229 (3.8%) |
| $10,000 to $12,499 | 207 (3.1%) | 110 (1.8%) |
| $12,500 to $14,999 | 164 (2.5%) | 255 (4.3%) |
| $15,000 to $17,499 | 191 (2.9%) | 154 (2.6%) |
| $17,500 to $19,999 | 141 (2.1%) | 273 (4.6%) |
| $20,000 to $22,499 | 205 (3.1%) | 170 (2.8%) |
| $22,500 to $24,999 | 458 (6.9%) | 257 (4.3%) |
| $25,000 to $29,999 | 492 (7.5%) | 493 (8.2%) |
| $30,000 to $34,999 | 323 (4.9%) | 336 (5.6%) |
| $35,000 to $39,999 | 194 (2.9%) | 188 (3.1%) |
| $40,000 to $44,999 | 248 (3.8%) | 224 (3.7%) |
| $45,000 to $49,999 | 287 (4.3%) | 234 (3.9%) |
| $50,000 to $54,999 | 190 (2.9%) | 203 (3.4%) |
| $55,000 to $64,999 | 495 (7.5%) | 388 (6.5%) |
| $65,000 to $74,999 | 608 (9.2%) | 409 (6.8%) |
| $75,000 to $99,999 | 590 (8.9%) | 540 (9.0%) |
| $100,000+ | 1,051 (15.9%) | 635 (10.6%) |
| Total | 6,598 (100.0%) | 5,992 (100.0%) |
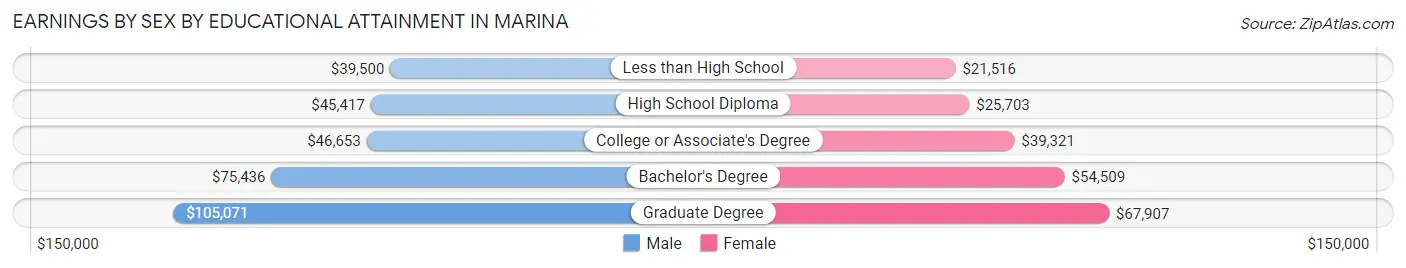
Earnings by Sex by Educational Attainment in Marina
Average earnings in Marina are $54,602 for men and $42,790 for women, a difference of 21.6%. Men with an educational attainment of graduate degree enjoy the highest average annual earnings of $105,071, while those with less than high school education earn the least with $39,500. Women with an educational attainment of graduate degree earn the most with the average annual earnings of $67,907, while those with less than high school education have the smallest earnings of $21,516.
| Educational Attainment | Male Income | Female Income |
| Less than High School | $39,500 | $21,516 |
| High School Diploma | $45,417 | $25,703 |
| College or Associate's Degree | $46,653 | $39,321 |
| Bachelor's Degree | $75,436 | $54,509 |
| Graduate Degree | $105,071 | $67,907 |
| Total | $54,602 | $42,790 |
Family Income in Marina
Family Income Brackets in Marina
According to the Marina family income data, there are 978 families falling into the $100,000 to $149,999 income range, which is the most common income bracket and makes up 19.5% of all families. Conversely, the $10,000 to $14,999 income bracket is the least frequent group with only 95 families (1.9%) belonging to this category.
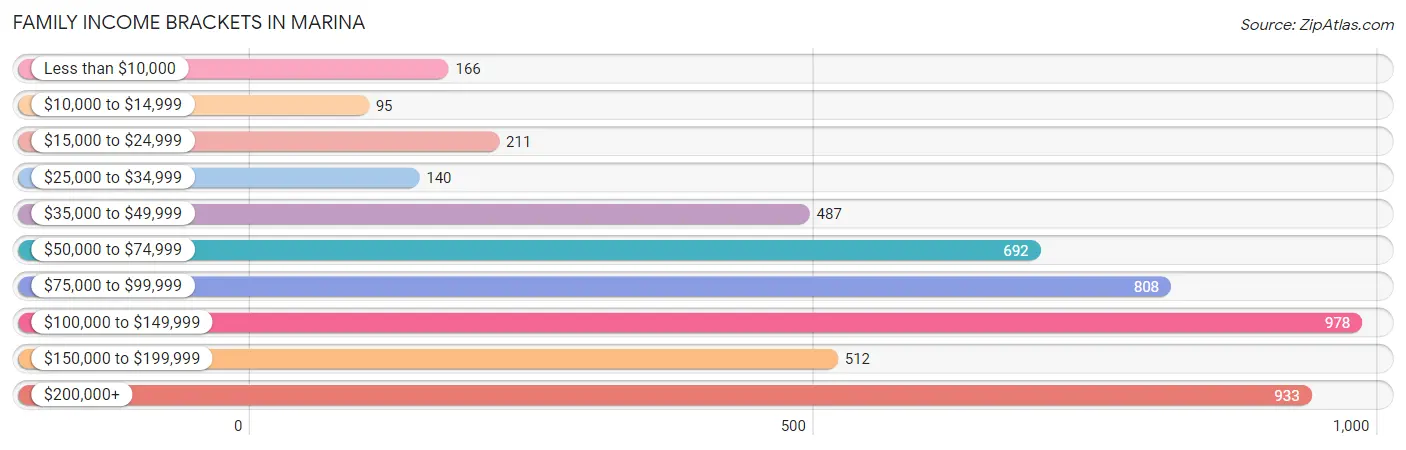
| Income Bracket | # Families | % Families |
| Less than $10,000 | 166 | 3.3% |
| $10,000 to $14,999 | 95 | 1.9% |
| $15,000 to $24,999 | 211 | 4.2% |
| $25,000 to $34,999 | 140 | 2.8% |
| $35,000 to $49,999 | 487 | 9.7% |
| $50,000 to $74,999 | 692 | 13.8% |
| $75,000 to $99,999 | 808 | 16.1% |
| $100,000 to $149,999 | 978 | 19.5% |
| $150,000 to $199,999 | 512 | 10.2% |
| $200,000+ | 933 | 18.6% |
Family Income by Famaliy Size in Marina
4-person families (779 | 15.5%) account for the highest median family income in Marina with $118,036 per family, while 2-person families (2,160 | 43.0%) have the highest median income of $42,292 per family member.
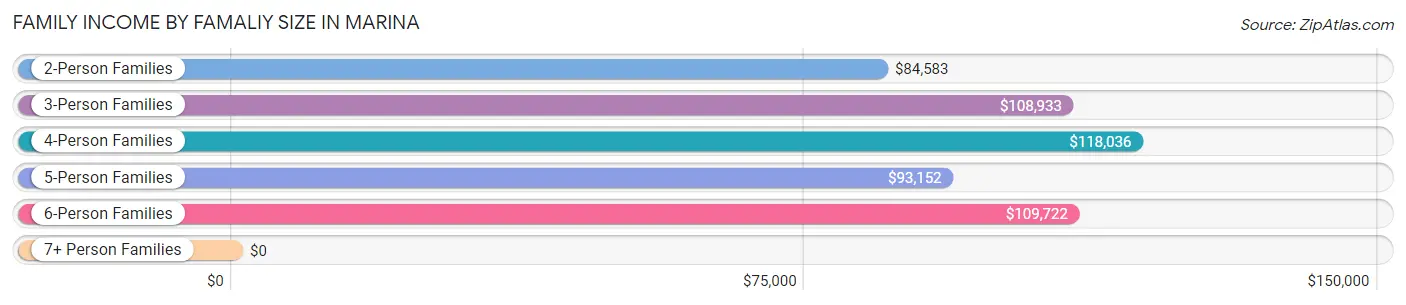
| Income Bracket | # Families | Median Income |
| 2-Person Families | 2,160 (43.0%) | $84,583 |
| 3-Person Families | 1,261 (25.1%) | $108,933 |
| 4-Person Families | 779 (15.5%) | $118,036 |
| 5-Person Families | 402 (8.0%) | $93,152 |
| 6-Person Families | 272 (5.4%) | $109,722 |
| 7+ Person Families | 143 (2.9%) | $0 |
| Total | 5,017 (100.0%) | $96,657 |
Family Income by Number of Earners in Marina
The median family income in Marina is $96,657, with families comprising 3+ earners (783) having the highest median family income of $156,949, while families with no earners (677) have the lowest median family income of $44,321, accounting for 15.6% and 13.5% of families, respectively.
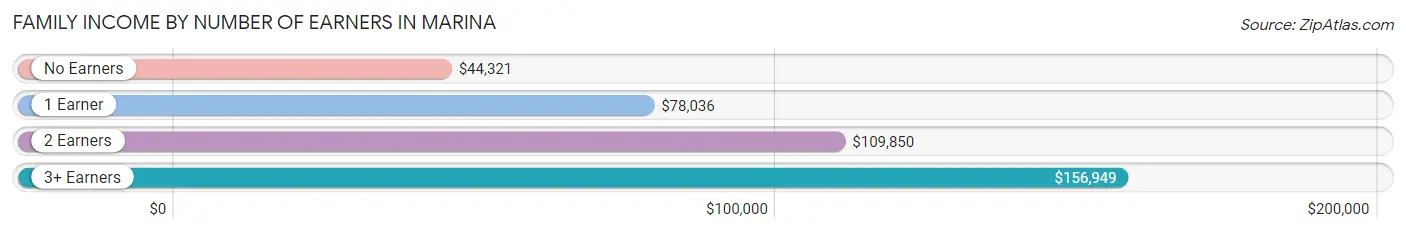
| Number of Earners | # Families | Median Income |
| No Earners | 677 (13.5%) | $44,321 |
| 1 Earner | 1,386 (27.6%) | $78,036 |
| 2 Earners | 2,171 (43.3%) | $109,850 |
| 3+ Earners | 783 (15.6%) | $156,949 |
| Total | 5,017 (100.0%) | $96,657 |
Household Income in Marina
Household Income Brackets in Marina
With 1,357 households falling in the category, the $100,000 to $149,999 income range is the most frequent in Marina, accounting for 17.4% of all households. In contrast, only 203 households (2.6%) fall into the $10,000 to $14,999 income bracket, making it the least populous group.
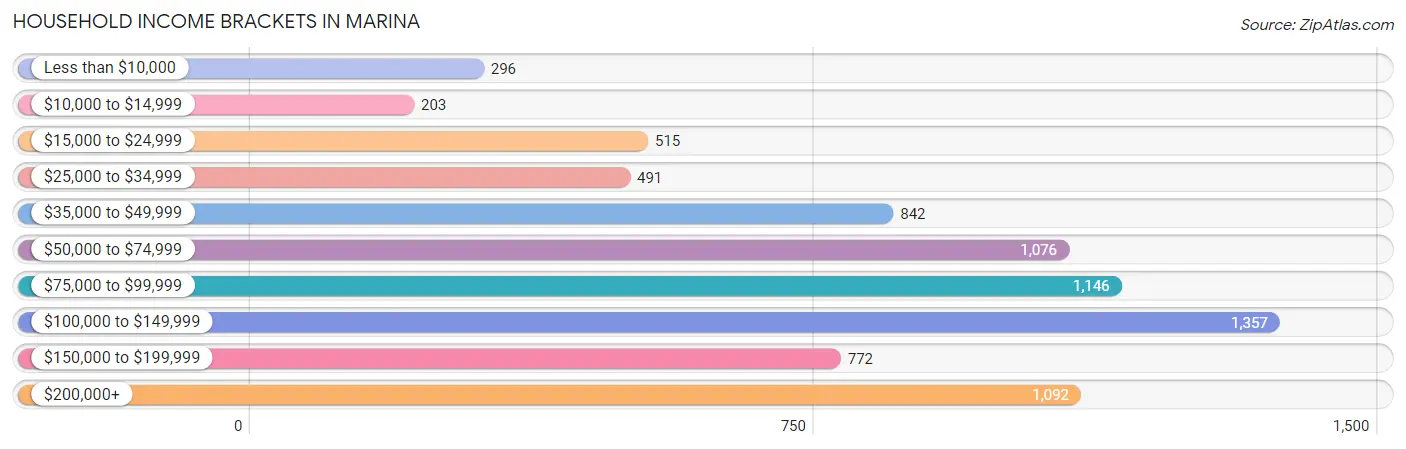
| Income Bracket | # Households | % Households |
| Less than $10,000 | 296 | 3.8% |
| $10,000 to $14,999 | 203 | 2.6% |
| $15,000 to $24,999 | 515 | 6.6% |
| $25,000 to $34,999 | 491 | 6.3% |
| $35,000 to $49,999 | 842 | 10.8% |
| $50,000 to $74,999 | 1,076 | 13.8% |
| $75,000 to $99,999 | 1,146 | 14.7% |
| $100,000 to $149,999 | 1,357 | 17.4% |
| $150,000 to $199,999 | 772 | 9.9% |
| $200,000+ | 1,092 | 14.0% |
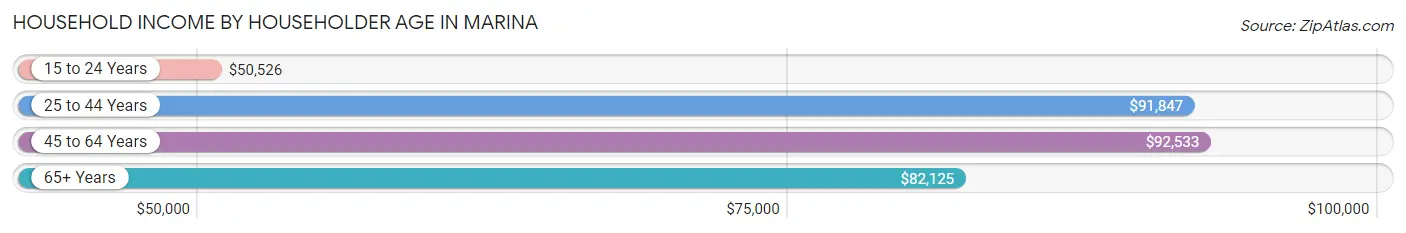
Household Income by Householder Age in Marina
The median household income in Marina is $85,783, with the highest median household income of $92,533 found in the 45 to 64 years age bracket for the primary householder. A total of 2,974 households (38.1%) fall into this category. Meanwhile, the 15 to 24 years age bracket for the primary householder has the lowest median household income of $50,526, with 458 households (5.9%) in this group.
| Income Bracket | # Households | Median Income |
| 15 to 24 Years | 458 (5.9%) | $50,526 |
| 25 to 44 Years | 2,431 (31.2%) | $91,847 |
| 45 to 64 Years | 2,974 (38.1%) | $92,533 |
| 65+ Years | 1,934 (24.8%) | $82,125 |
| Total | 7,797 (100.0%) | $85,783 |
Poverty in Marina
Income Below Poverty by Sex and Age in Marina
With 10.0% poverty level for males and 12.0% for females among the residents of Marina, 5 year old males and 16 and 17 year old females are the most vulnerable to poverty, with 46 males (28.2%) and 52 females (25.4%) in their respective age groups living below the poverty level.
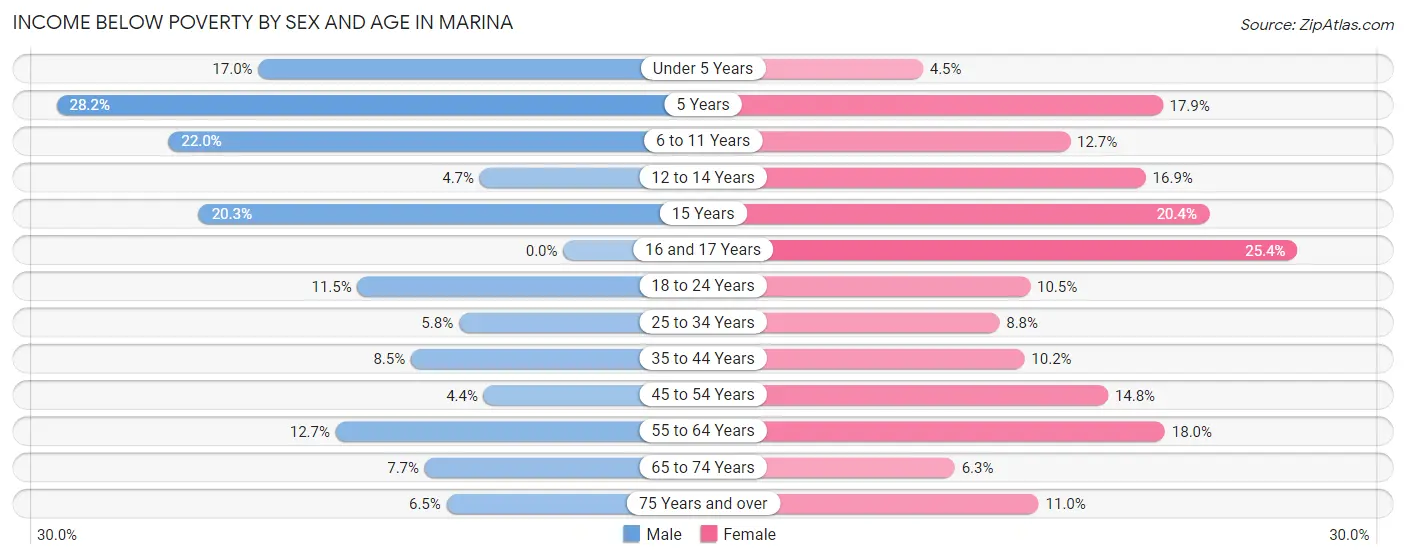
| Age Bracket | Male | Female |
| Under 5 Years | 126 (17.0%) | 24 (4.5%) |
| 5 Years | 46 (28.2%) | 10 (17.9%) |
| 6 to 11 Years | 161 (22.0%) | 106 (12.7%) |
| 12 to 14 Years | 18 (4.6%) | 66 (16.9%) |
| 15 Years | 27 (20.3%) | 48 (20.4%) |
| 16 and 17 Years | 0 (0.0%) | 52 (25.4%) |
| 18 to 24 Years | 159 (11.5%) | 87 (10.5%) |
| 25 to 34 Years | 85 (5.8%) | 145 (8.8%) |
| 35 to 44 Years | 108 (8.5%) | 145 (10.2%) |
| 45 to 54 Years | 57 (4.4%) | 171 (14.8%) |
| 55 to 64 Years | 151 (12.7%) | 265 (18.0%) |
| 65 to 74 Years | 87 (7.7%) | 62 (6.3%) |
| 75 Years and over | 37 (6.5%) | 102 (11.0%) |
| Total | 1,062 (10.0%) | 1,283 (12.0%) |
Income Above Poverty by Sex and Age in Marina
According to the poverty statistics in Marina, males aged 16 and 17 years and females aged under 5 years are the age groups that are most secure financially, with 100.0% of males and 95.5% of females in these age groups living above the poverty line.
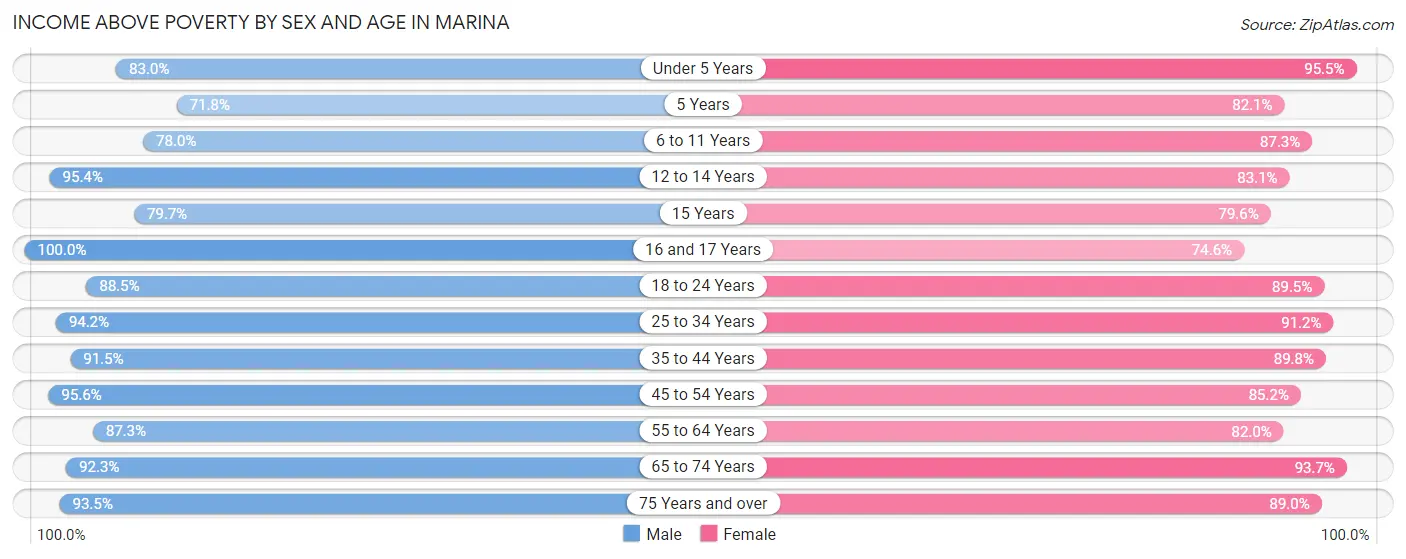
| Age Bracket | Male | Female |
| Under 5 Years | 616 (83.0%) | 508 (95.5%) |
| 5 Years | 117 (71.8%) | 46 (82.1%) |
| 6 to 11 Years | 571 (78.0%) | 728 (87.3%) |
| 12 to 14 Years | 369 (95.4%) | 324 (83.1%) |
| 15 Years | 106 (79.7%) | 187 (79.6%) |
| 16 and 17 Years | 169 (100.0%) | 153 (74.6%) |
| 18 to 24 Years | 1,229 (88.5%) | 743 (89.5%) |
| 25 to 34 Years | 1,379 (94.2%) | 1,509 (91.2%) |
| 35 to 44 Years | 1,166 (91.5%) | 1,281 (89.8%) |
| 45 to 54 Years | 1,229 (95.6%) | 983 (85.2%) |
| 55 to 64 Years | 1,041 (87.3%) | 1,208 (82.0%) |
| 65 to 74 Years | 1,041 (92.3%) | 924 (93.7%) |
| 75 Years and over | 532 (93.5%) | 829 (89.0%) |
| Total | 9,565 (90.0%) | 9,423 (88.0%) |
Income Below Poverty Among Married-Couple Families in Marina
The poverty statistics for married-couple families in Marina show that 3.4% or 124 of the total 3,637 families live below the poverty line. Families with no children have the highest poverty rate of 3.6%, comprising of 79 families. On the other hand, families with 5 or more children have the lowest poverty rate of 0.0%, which includes 0 families.
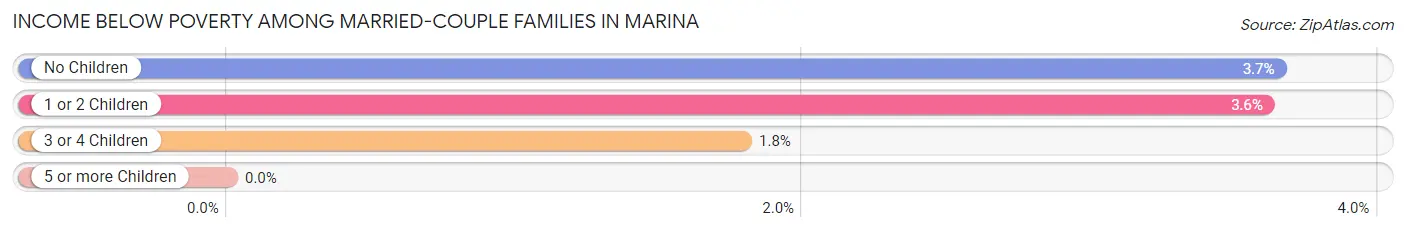
| Children | Above Poverty | Below Poverty |
| No Children | 2,084 (96.4%) | 79 (3.6%) |
| 1 or 2 Children | 987 (96.4%) | 37 (3.6%) |
| 3 or 4 Children | 439 (98.2%) | 8 (1.8%) |
| 5 or more Children | 3 (100.0%) | 0 (0.0%) |
| Total | 3,513 (96.6%) | 124 (3.4%) |
Income Below Poverty Among Single-Parent Households in Marina
According to the poverty data in Marina, 14.3% or 53 single-father households and 21.4% or 216 single-mother households are living below the poverty line. Among single-father households, those with 1 or 2 children have the highest poverty rate, with 18 households (21.2%) experiencing poverty. Likewise, among single-mother households, those with 3 or 4 children have the highest poverty rate, with 76 households (45.0%) falling below the poverty line.
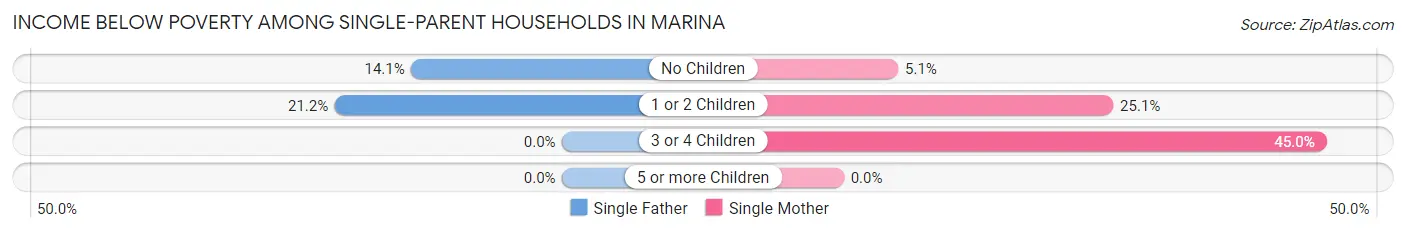
| Children | Single Father | Single Mother |
| No Children | 35 (14.1%) | 18 (5.1%) |
| 1 or 2 Children | 18 (21.2%) | 122 (25.1%) |
| 3 or 4 Children | 0 (0.0%) | 76 (45.0%) |
| 5 or more Children | 0 (0.0%) | 0 (0.0%) |
| Total | 53 (14.3%) | 216 (21.4%) |
Income Below Poverty Among Married-Couple vs Single-Parent Households in Marina
The poverty data for Marina shows that 124 of the married-couple family households (3.4%) and 269 of the single-parent households (19.5%) are living below the poverty level. Within the married-couple family households, those with no children have the highest poverty rate, with 79 households (3.6%) falling below the poverty line. Among the single-parent households, those with 3 or 4 children have the highest poverty rate, with 76 household (37.1%) living below poverty.
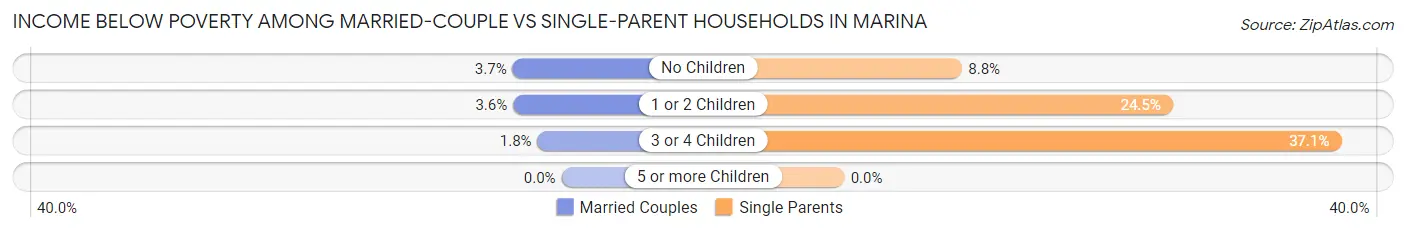
| Children | Married-Couple Families | Single-Parent Households |
| No Children | 79 (3.6%) | 53 (8.8%) |
| 1 or 2 Children | 37 (3.6%) | 140 (24.5%) |
| 3 or 4 Children | 8 (1.8%) | 76 (37.1%) |
| 5 or more Children | 0 (0.0%) | 0 (0.0%) |
| Total | 124 (3.4%) | 269 (19.5%) |
Race in Marina
The most populous races in Marina are White / Caucasian (10,358 | 46.6%), Hispanic or Latino (6,545 | 29.4%), and Two or more Races (3,464 | 15.6%).
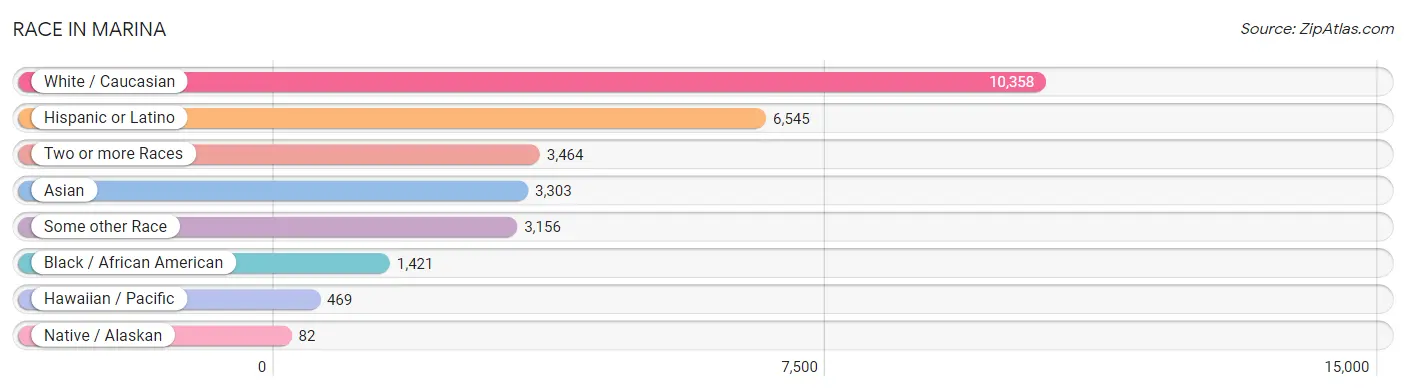
| Race | # Population | % Population |
| Asian | 3,303 | 14.8% |
| Black / African American | 1,421 | 6.4% |
| Hawaiian / Pacific | 469 | 2.1% |
| Hispanic or Latino | 6,545 | 29.4% |
| Native / Alaskan | 82 | 0.4% |
| White / Caucasian | 10,358 | 46.6% |
| Two or more Races | 3,464 | 15.6% |
| Some other Race | 3,156 | 14.2% |
| Total | 22,253 | 100.0% |
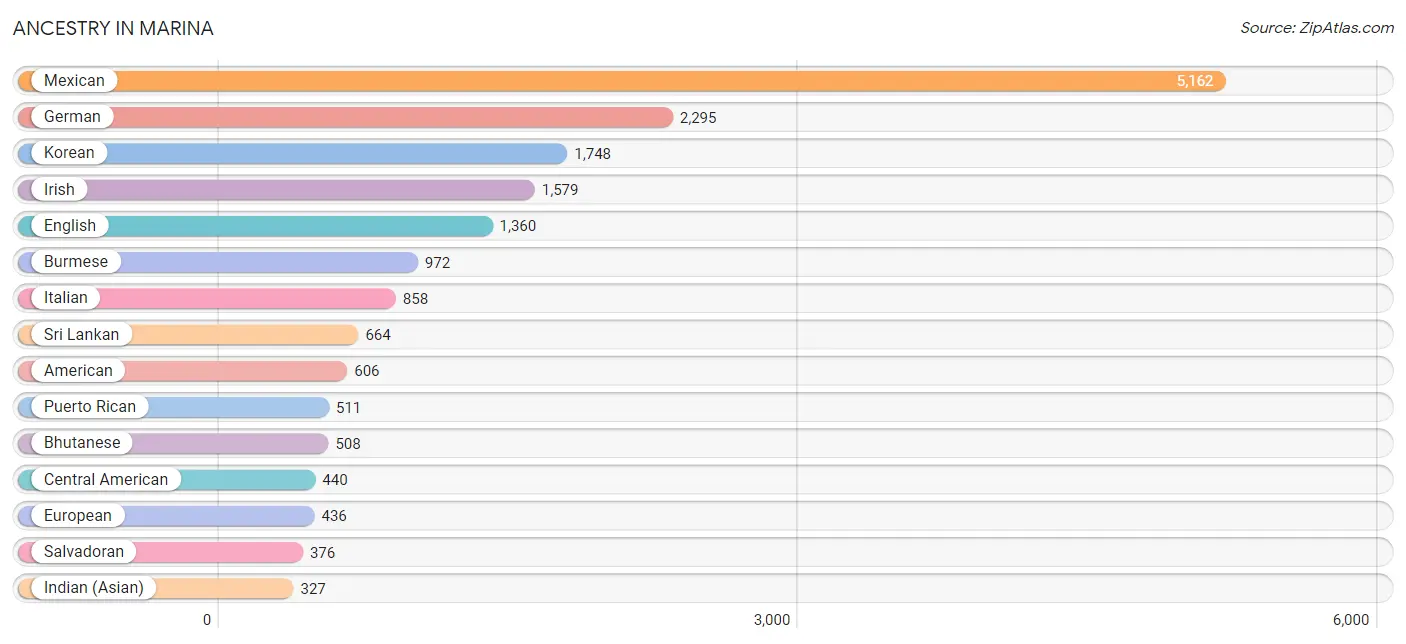
Ancestry in Marina
The most populous ancestries reported in Marina are Mexican (5,162 | 23.2%), German (2,295 | 10.3%), Korean (1,748 | 7.9%), Irish (1,579 | 7.1%), and English (1,360 | 6.1%), together accounting for 54.6% of all Marina residents.
| Ancestry | # Population | % Population |
| African | 134 | 0.6% |
| American | 606 | 2.7% |
| Arab | 103 | 0.5% |
| Argentinean | 11 | 0.1% |
| Armenian | 51 | 0.2% |
| Austrian | 53 | 0.2% |
| Bhutanese | 508 | 2.3% |
| Blackfeet | 57 | 0.3% |
| British | 154 | 0.7% |
| Burmese | 972 | 4.4% |
| Canadian | 58 | 0.3% |
| Cape Verdean | 11 | 0.1% |
| Central American | 440 | 2.0% |
| Cherokee | 94 | 0.4% |
| Chickasaw | 30 | 0.1% |
| Chilean | 24 | 0.1% |
| Choctaw | 21 | 0.1% |
| Croatian | 19 | 0.1% |
| Cuban | 71 | 0.3% |
| Czech | 28 | 0.1% |
| Danish | 101 | 0.4% |
| Dutch | 161 | 0.7% |
| Eastern European | 46 | 0.2% |
| Egyptian | 68 | 0.3% |
| English | 1,360 | 6.1% |
| European | 436 | 2.0% |
| Filipino | 167 | 0.7% |
| Finnish | 53 | 0.2% |
| French | 266 | 1.2% |
| French Canadian | 126 | 0.6% |
| German | 2,295 | 10.3% |
| German Russian | 29 | 0.1% |
| Greek | 26 | 0.1% |
| Guamanian / Chamorro | 78 | 0.4% |
| Guatemalan | 56 | 0.3% |
| Hungarian | 42 | 0.2% |
| Indian (Asian) | 327 | 1.5% |
| Iranian | 118 | 0.5% |
| Iraqi | 8 | 0.0% |
| Irish | 1,579 | 7.1% |
| Italian | 858 | 3.9% |
| Jamaican | 8 | 0.0% |
| Korean | 1,748 | 7.9% |
| Laotian | 33 | 0.2% |
| Lebanese | 20 | 0.1% |
| Lithuanian | 24 | 0.1% |
| Maltese | 17 | 0.1% |
| Mexican | 5,162 | 23.2% |
| Mexican American Indian | 22 | 0.1% |
| Native Hawaiian | 138 | 0.6% |
| New Zealander | 9 | 0.0% |
| Northern European | 16 | 0.1% |
| Norwegian | 109 | 0.5% |
| Pakistani | 100 | 0.4% |
| Panamanian | 8 | 0.0% |
| Pennsylvania German | 14 | 0.1% |
| Polish | 210 | 0.9% |
| Portuguese | 105 | 0.5% |
| Pueblo | 12 | 0.1% |
| Puerto Rican | 511 | 2.3% |
| Russian | 178 | 0.8% |
| Salvadoran | 376 | 1.7% |
| Samoan | 321 | 1.4% |
| Scandinavian | 34 | 0.2% |
| Scotch-Irish | 68 | 0.3% |
| Scottish | 313 | 1.4% |
| Serbian | 32 | 0.1% |
| Sioux | 22 | 0.1% |
| Slovak | 13 | 0.1% |
| South American | 35 | 0.2% |
| Spaniard | 62 | 0.3% |
| Spanish | 31 | 0.1% |
| Sri Lankan | 664 | 3.0% |
| Subsaharan African | 165 | 0.7% |
| Swedish | 104 | 0.5% |
| Swiss | 87 | 0.4% |
| Thai | 206 | 0.9% |
| Tlingit-Haida | 26 | 0.1% |
| Tongan | 228 | 1.0% |
| Ukrainian | 80 | 0.4% |
| Vietnamese | 22 | 0.1% |
| Welsh | 127 | 0.6% | View All 82 Rows |
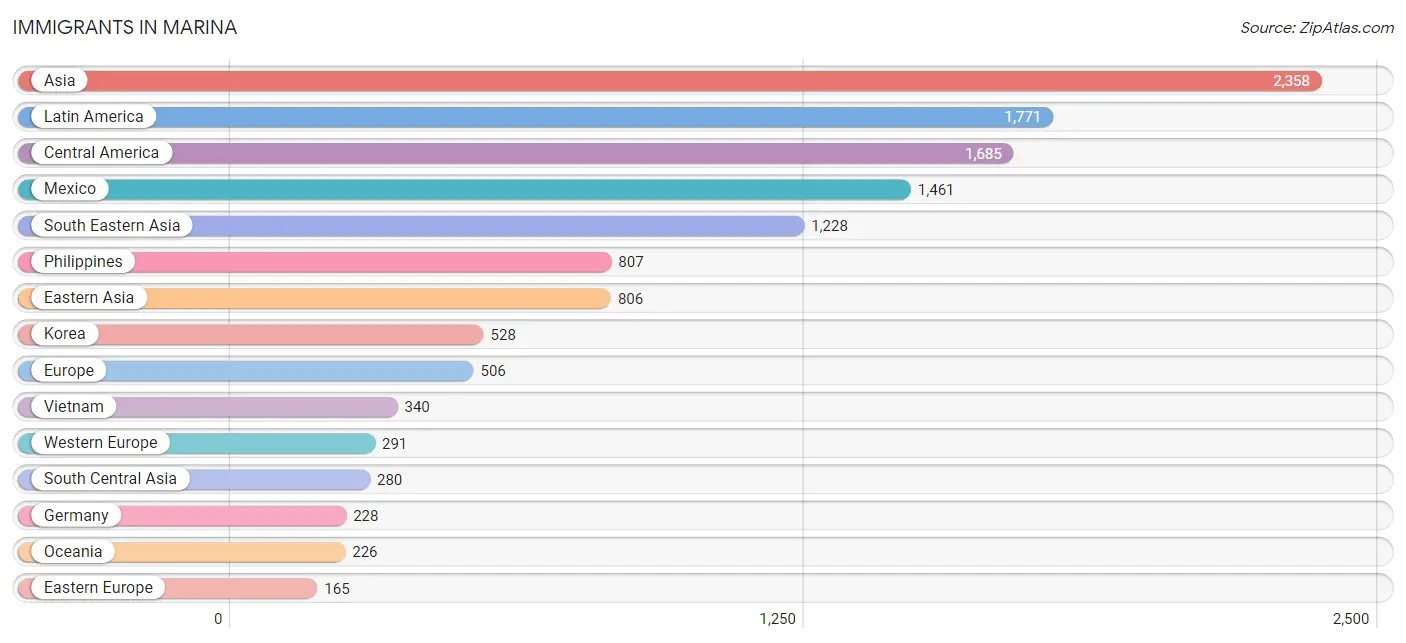
Immigrants in Marina
The most numerous immigrant groups reported in Marina came from Asia (2,358 | 10.6%), Latin America (1,771 | 8.0%), Central America (1,685 | 7.6%), Mexico (1,461 | 6.6%), and South Eastern Asia (1,228 | 5.5%), together accounting for 38.2% of all Marina residents.
| Immigration Origin | # Population | % Population |
| Afghanistan | 5 | 0.0% |
| Africa | 72 | 0.3% |
| Armenia | 8 | 0.0% |
| Asia | 2,358 | 10.6% |
| Austria | 11 | 0.1% |
| Bangladesh | 15 | 0.1% |
| Belarus | 23 | 0.1% |
| Brazil | 8 | 0.0% |
| Canada | 33 | 0.2% |
| Central America | 1,685 | 7.6% |
| China | 139 | 0.6% |
| Eastern Asia | 806 | 3.6% |
| Eastern Europe | 165 | 0.7% |
| Egypt | 68 | 0.3% |
| El Salvador | 152 | 0.7% |
| England | 26 | 0.1% |
| Europe | 506 | 2.3% |
| Fiji | 77 | 0.4% |
| France | 32 | 0.1% |
| Germany | 228 | 1.0% |
| Guatemala | 55 | 0.3% |
| Hong Kong | 16 | 0.1% |
| India | 123 | 0.5% |
| Indonesia | 33 | 0.2% |
| Iran | 113 | 0.5% |
| Iraq | 8 | 0.0% |
| Israel | 28 | 0.1% |
| Italy | 12 | 0.1% |
| Japan | 139 | 0.6% |
| Korea | 528 | 2.4% |
| Latin America | 1,771 | 8.0% |
| Mexico | 1,461 | 6.6% |
| Micronesia | 20 | 0.1% |
| Nepal | 24 | 0.1% |
| Netherlands | 13 | 0.1% |
| Northern Africa | 68 | 0.3% |
| Northern Europe | 38 | 0.2% |
| Norway | 12 | 0.1% |
| Oceania | 226 | 1.0% |
| Panama | 17 | 0.1% |
| Peru | 78 | 0.4% |
| Philippines | 807 | 3.6% |
| Poland | 26 | 0.1% |
| Russia | 67 | 0.3% |
| Senegal | 4 | 0.0% |
| Serbia | 32 | 0.1% |
| South America | 86 | 0.4% |
| South Central Asia | 280 | 1.3% |
| South Eastern Asia | 1,228 | 5.5% |
| Southern Europe | 12 | 0.1% |
| Switzerland | 7 | 0.0% |
| Taiwan | 62 | 0.3% |
| Thailand | 48 | 0.2% |
| Ukraine | 17 | 0.1% |
| Vietnam | 340 | 1.5% |
| Western Africa | 4 | 0.0% |
| Western Asia | 44 | 0.2% |
| Western Europe | 291 | 1.3% | View All 58 Rows |
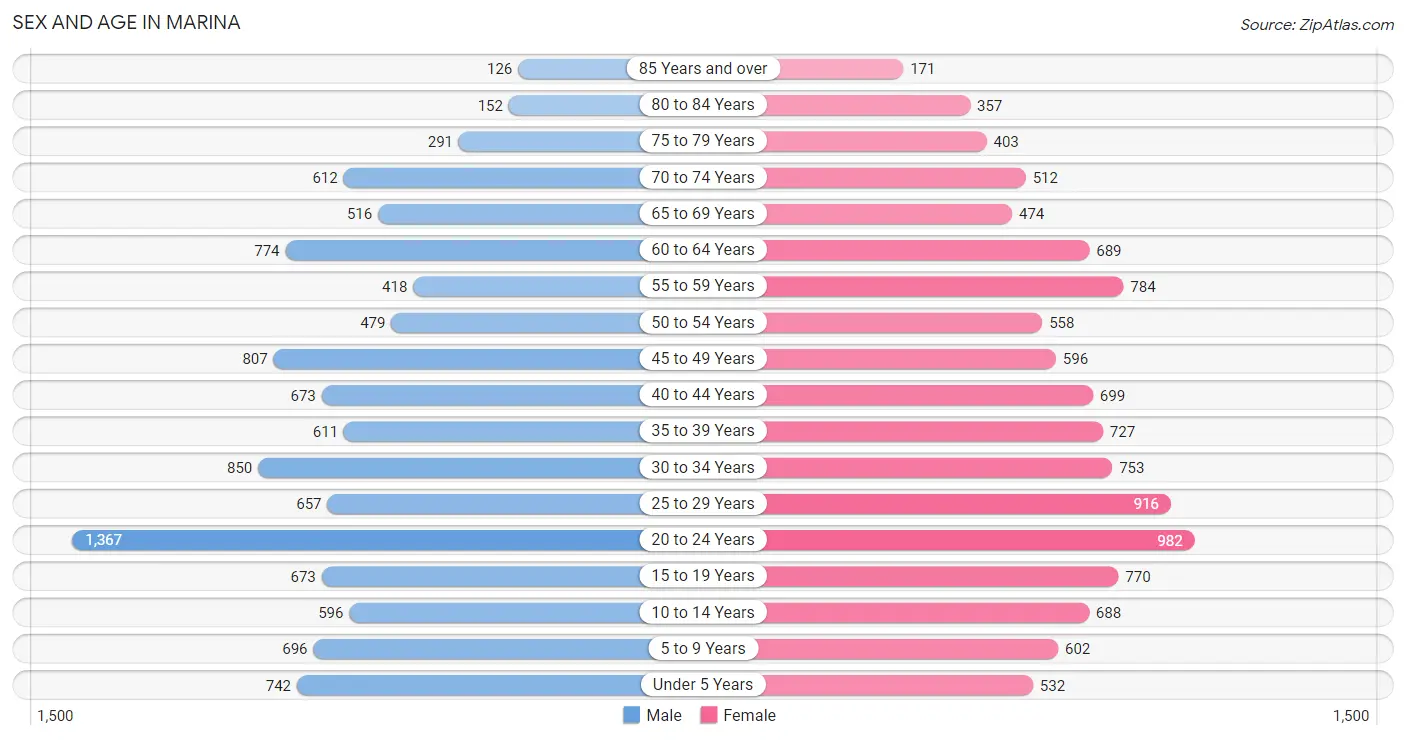
Sex and Age in Marina
Sex and Age in Marina
The most populous age groups in Marina are 20 to 24 Years (1,367 | 12.4%) for men and 20 to 24 Years (982 | 8.8%) for women.
| Age Bracket | Male | Female |
| Under 5 Years | 742 (6.7%) | 532 (4.7%) |
| 5 to 9 Years | 696 (6.3%) | 602 (5.4%) |
| 10 to 14 Years | 596 (5.4%) | 688 (6.1%) |
| 15 to 19 Years | 673 (6.1%) | 770 (6.9%) |
| 20 to 24 Years | 1,367 (12.4%) | 982 (8.8%) |
| 25 to 29 Years | 657 (5.9%) | 916 (8.2%) |
| 30 to 34 Years | 850 (7.7%) | 753 (6.7%) |
| 35 to 39 Years | 611 (5.5%) | 727 (6.5%) |
| 40 to 44 Years | 673 (6.1%) | 699 (6.2%) |
| 45 to 49 Years | 807 (7.3%) | 596 (5.3%) |
| 50 to 54 Years | 479 (4.3%) | 558 (5.0%) |
| 55 to 59 Years | 418 (3.8%) | 784 (7.0%) |
| 60 to 64 Years | 774 (7.0%) | 689 (6.1%) |
| 65 to 69 Years | 516 (4.7%) | 474 (4.2%) |
| 70 to 74 Years | 612 (5.5%) | 512 (4.6%) |
| 75 to 79 Years | 291 (2.6%) | 403 (3.6%) |
| 80 to 84 Years | 152 (1.4%) | 357 (3.2%) |
| 85 Years and over | 126 (1.1%) | 171 (1.5%) |
| Total | 11,040 (100.0%) | 11,213 (100.0%) |
Families and Households in Marina
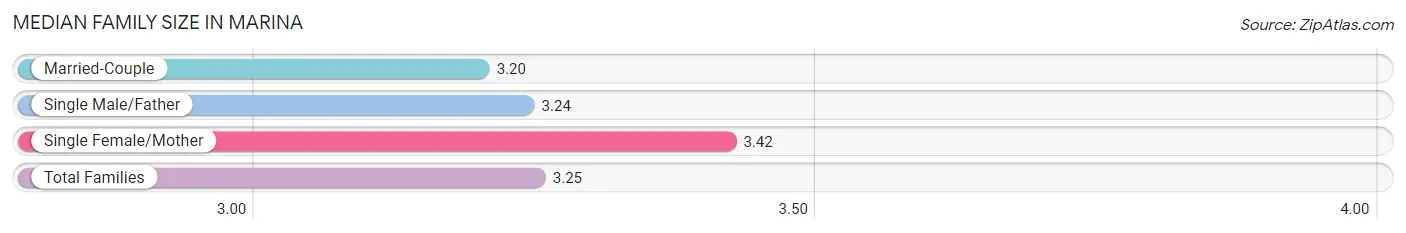
Median Family Size in Marina
The median family size in Marina is 3.25 persons per family, with single female/mother families (1,010 | 20.1%) accounting for the largest median family size of 3.42 persons per family. On the other hand, married-couple families (3,637 | 72.5%) represent the smallest median family size with 3.20 persons per family.
| Family Type | # Families | Family Size |
| Married-Couple | 3,637 (72.5%) | 3.20 |
| Single Male/Father | 370 (7.4%) | 3.24 |
| Single Female/Mother | 1,010 (20.1%) | 3.42 |
| Total Families | 5,017 (100.0%) | 3.25 |
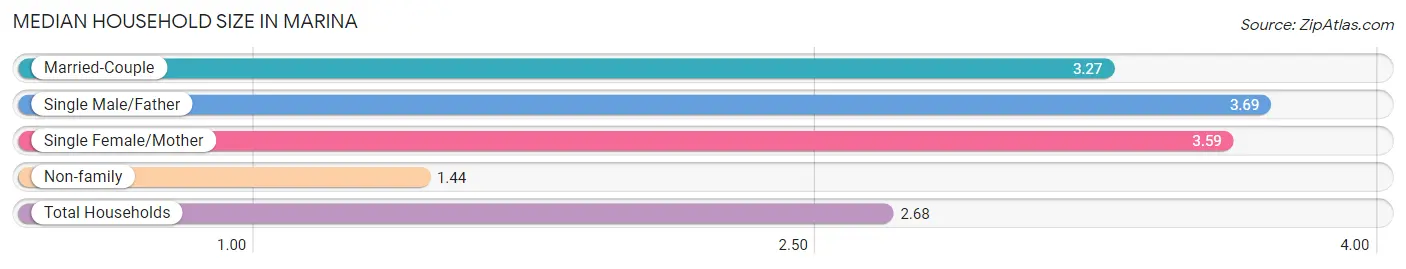
Median Household Size in Marina
The median household size in Marina is 2.68 persons per household, with single male/father households (370 | 4.8%) accounting for the largest median household size of 3.69 persons per household. non-family households (2,780 | 35.6%) represent the smallest median household size with 1.44 persons per household.
| Household Type | # Households | Household Size |
| Married-Couple | 3,637 (46.7%) | 3.27 |
| Single Male/Father | 370 (4.8%) | 3.69 |
| Single Female/Mother | 1,010 (13.0%) | 3.59 |
| Non-family | 2,780 (35.6%) | 1.44 |
| Total Households | 7,797 (100.0%) | 2.68 |
Household Size by Marriage Status in Marina
Out of a total of 7,797 households in Marina, 5,017 (64.3%) are family households, while 2,780 (35.6%) are nonfamily households. The most numerous type of family households are 2-person households, comprising 1,976, and the most common type of nonfamily households are 1-person households, comprising 1,959.
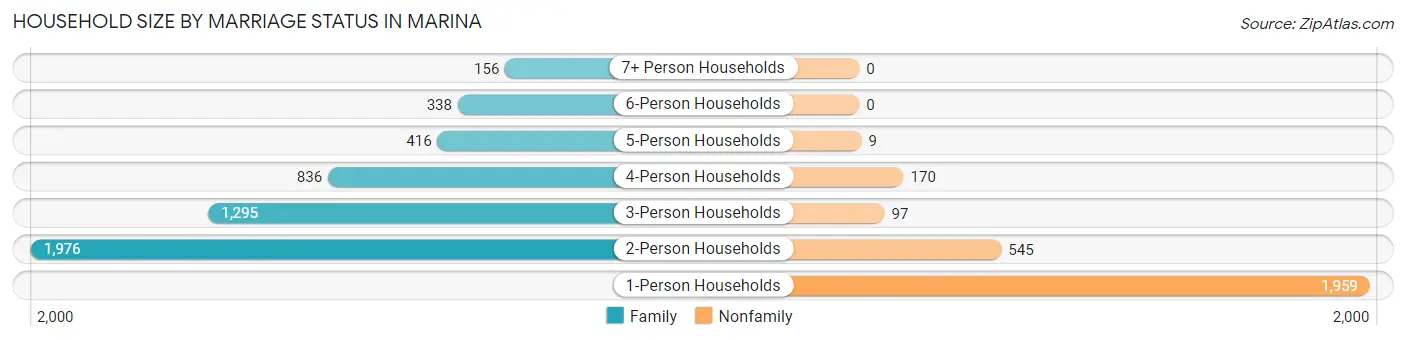
| Household Size | Family Households | Nonfamily Households |
| 1-Person Households | - | 1,959 (25.1%) |
| 2-Person Households | 1,976 (25.3%) | 545 (7.0%) |
| 3-Person Households | 1,295 (16.6%) | 97 (1.2%) |
| 4-Person Households | 836 (10.7%) | 170 (2.2%) |
| 5-Person Households | 416 (5.3%) | 9 (0.1%) |
| 6-Person Households | 338 (4.3%) | 0 (0.0%) |
| 7+ Person Households | 156 (2.0%) | 0 (0.0%) |
| Total | 5,017 (64.3%) | 2,780 (35.6%) |
Female Fertility in Marina
Fertility by Age in Marina
Average fertility rate in Marina is 44.0 births per 1,000 women. Women in the age bracket of 20 to 34 years have the highest fertility rate with 54.0 births per 1,000 women. Women in the age bracket of 20 to 34 years acount for 58.7% of all women with births.
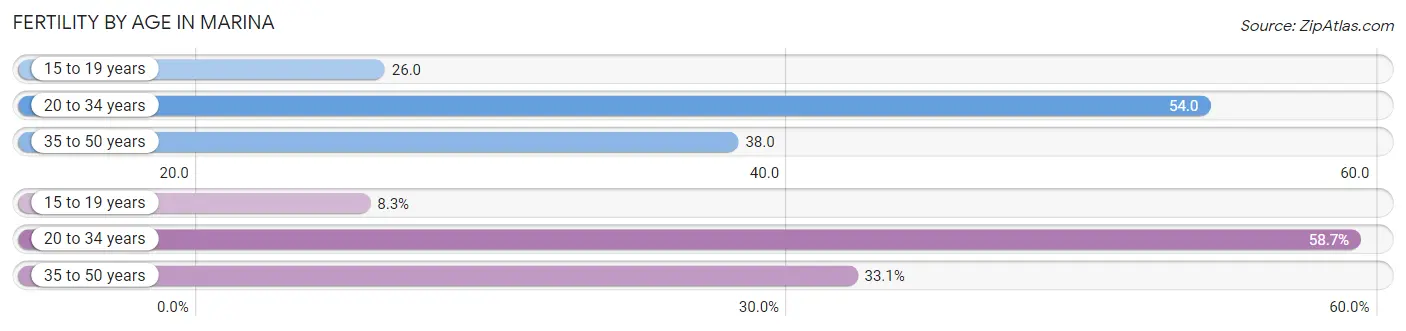
| Age Bracket | Women with Births | Births / 1,000 Women |
| 15 to 19 years | 20 (8.3%) | 26.0 |
| 20 to 34 years | 142 (58.7%) | 54.0 |
| 35 to 50 years | 80 (33.1%) | 38.0 |
| Total | 242 (100.0%) | 44.0 |
Fertility by Age by Marriage Status in Marina
73.1% of women with births (242) in Marina are married. The highest percentage of unmarried women with births falls into 20 to 34 years age bracket with 40.1% of them unmarried at the time of birth, while the lowest percentage of unmarried women with births belong to 15 to 19 years age bracket with 0.0% of them unmarried.
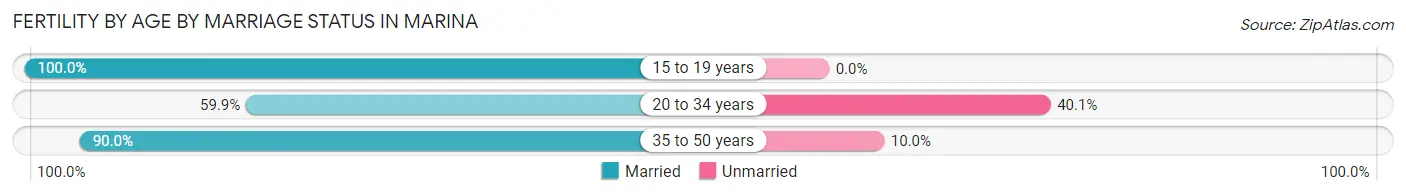
| Age Bracket | Married | Unmarried |
| 15 to 19 years | 20 (100.0%) | 0 (0.0%) |
| 20 to 34 years | 85 (59.9%) | 57 (40.1%) |
| 35 to 50 years | 72 (90.0%) | 8 (10.0%) |
| Total | 177 (73.1%) | 65 (26.9%) |
Fertility by Education in Marina
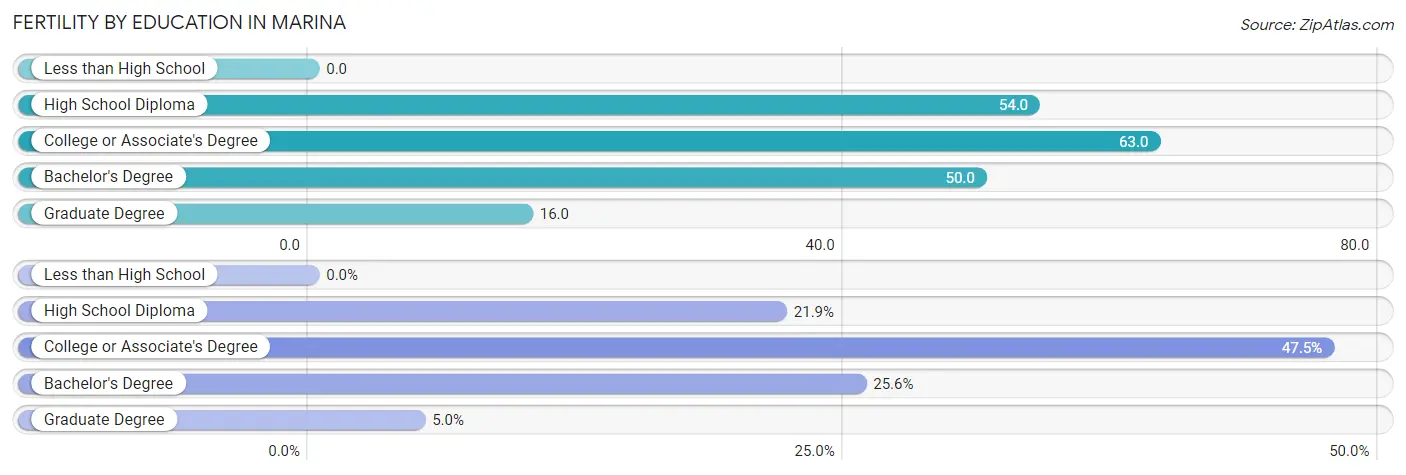
| Educational Attainment | Women with Births | Births / 1,000 Women |
| Less than High School | 0 (0.0%) | 0.0 |
| High School Diploma | 53 (21.9%) | 54.0 |
| College or Associate's Degree | 115 (47.5%) | 63.0 |
| Bachelor's Degree | 62 (25.6%) | 50.0 |
| Graduate Degree | 12 (5.0%) | 16.0 |
| Total | 242 (100.0%) | 44.0 |
Fertility by Education by Marriage Status in Marina
26.9% of women with births in Marina are unmarried. Women with the educational attainment of bachelor's degree are most likely to be married with 100.0% of them married at childbirth, while women with the educational attainment of graduate degree are least likely to be married with 66.7% of them unmarried at childbirth.
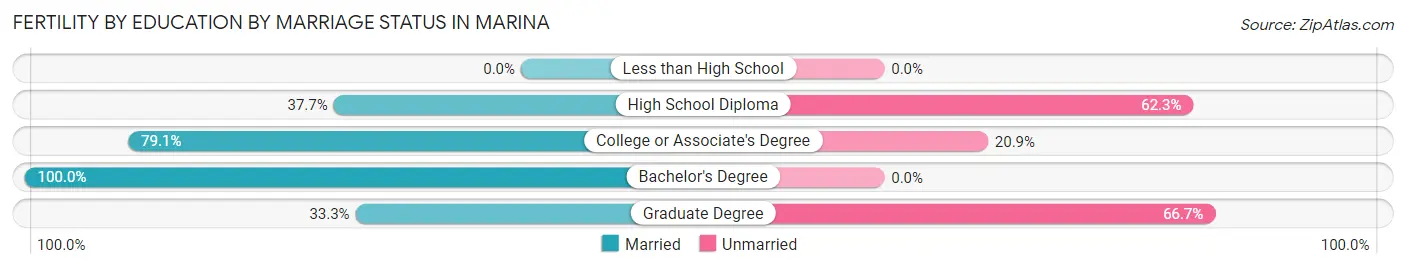
| Educational Attainment | Married | Unmarried |
| Less than High School | 0 (0.0%) | 0 (0.0%) |
| High School Diploma | 20 (37.7%) | 33 (62.3%) |
| College or Associate's Degree | 91 (79.1%) | 24 (20.9%) |
| Bachelor's Degree | 62 (100.0%) | 0 (0.0%) |
| Graduate Degree | 4 (33.3%) | 8 (66.7%) |
| Total | 177 (73.1%) | 65 (26.9%) |
Employment Characteristics in Marina
Employment by Class of Employer in Marina
Among the 11,096 employed individuals in Marina, private company employees (6,393 | 57.6%), local government employees (1,240 | 11.2%), and not-for-profit organizations (928 | 8.4%) make up the most common classes of employment.
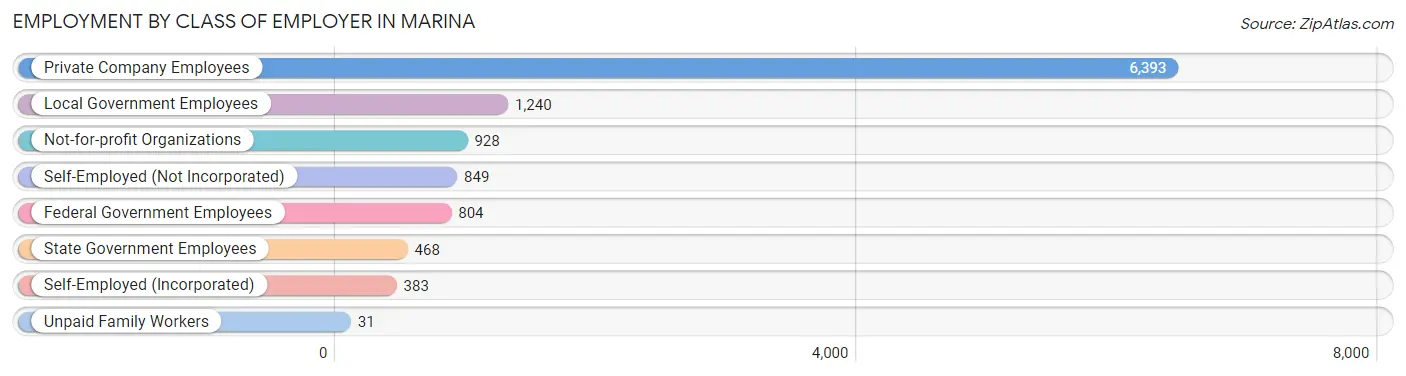
| Employer Class | # Employees | % Employees |
| Private Company Employees | 6,393 | 57.6% |
| Self-Employed (Incorporated) | 383 | 3.5% |
| Self-Employed (Not Incorporated) | 849 | 7.6% |
| Not-for-profit Organizations | 928 | 8.4% |
| Local Government Employees | 1,240 | 11.2% |
| State Government Employees | 468 | 4.2% |
| Federal Government Employees | 804 | 7.2% |
| Unpaid Family Workers | 31 | 0.3% |
| Total | 11,096 | 100.0% |
Employment Status by Age in Marina
According to the labor force statistics for Marina, out of the total population over 16 years of age (18,029), 67.0% or 12,079 individuals are in the labor force, with 5.9% or 713 of them unemployed. The age group with the highest labor force participation rate is 25 to 29 years, with 89.3% or 1,405 individuals in the labor force. Within the labor force, the 16 to 19 years age range has the highest percentage of unemployed individuals, with 22.3% or 92 of them being unemployed.
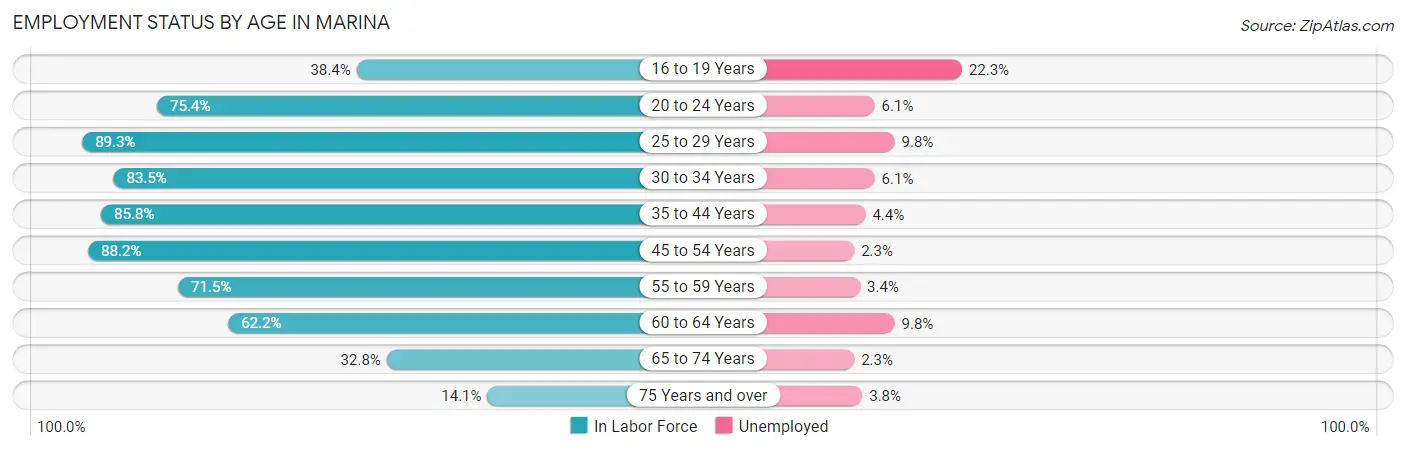
| Age Bracket | In Labor Force | Unemployed |
| 16 to 19 Years | 413 (38.4%) | 92 (22.3%) |
| 20 to 24 Years | 1,771 (75.4%) | 108 (6.1%) |
| 25 to 29 Years | 1,405 (89.3%) | 138 (9.8%) |
| 30 to 34 Years | 1,339 (83.5%) | 82 (6.1%) |
| 35 to 44 Years | 2,325 (85.8%) | 102 (4.4%) |
| 45 to 54 Years | 2,152 (88.2%) | 49 (2.3%) |
| 55 to 59 Years | 859 (71.5%) | 29 (3.4%) |
| 60 to 64 Years | 910 (62.2%) | 89 (9.8%) |
| 65 to 74 Years | 693 (32.8%) | 16 (2.3%) |
| 75 Years and over | 212 (14.1%) | 8 (3.8%) |
| Total | 12,079 (67.0%) | 713 (5.9%) |
Employment Status by Educational Attainment in Marina
According to labor force statistics for Marina, 81.8% of individuals (8,991) out of the total population between 25 and 64 years of age (10,991) are in the labor force, with 5.4% or 486 of them being unemployed. The group with the highest labor force participation rate are those with the educational attainment of bachelor's degree or higher, with 86.4% or 3,402 individuals in the labor force. Within the labor force, individuals with bachelor's degree or higher education have the highest percentage of unemployment, with 6.1% or 208 of them being unemployed.
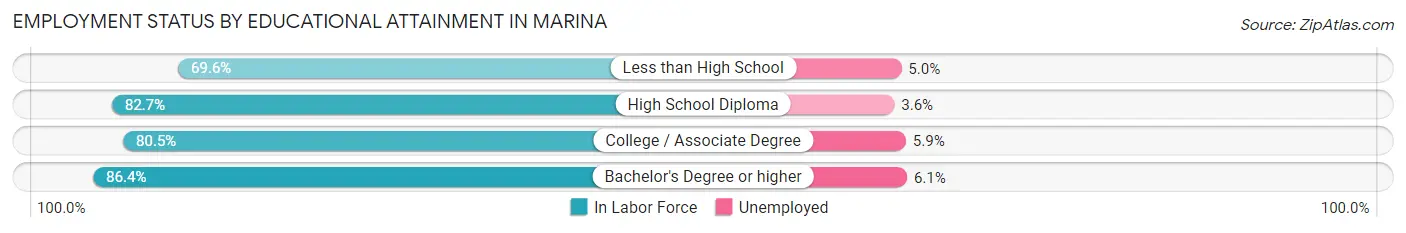
| Educational Attainment | In Labor Force | Unemployed |
| Less than High School | 904 (69.6%) | 65 (5.0%) |
| High School Diploma | 1,826 (82.7%) | 79 (3.6%) |
| College / Associate Degree | 2,855 (80.5%) | 209 (5.9%) |
| Bachelor's Degree or higher | 3,402 (86.4%) | 240 (6.1%) |
| Total | 8,991 (81.8%) | 594 (5.4%) |
Employment Occupations by Sex in Marina
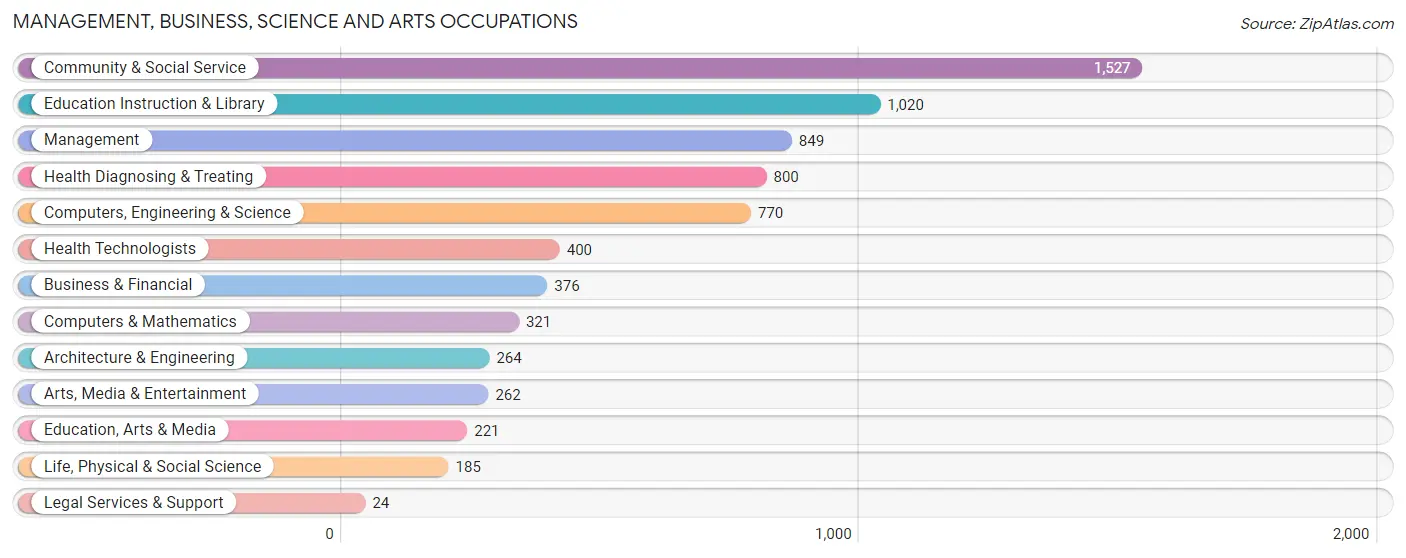
Management, Business, Science and Arts Occupations
The most common Management, Business, Science and Arts occupations in Marina are Community & Social Service (1,527 | 13.6%), Education Instruction & Library (1,020 | 9.1%), Management (849 | 7.6%), Health Diagnosing & Treating (800 | 7.1%), and Computers, Engineering & Science (770 | 6.9%).
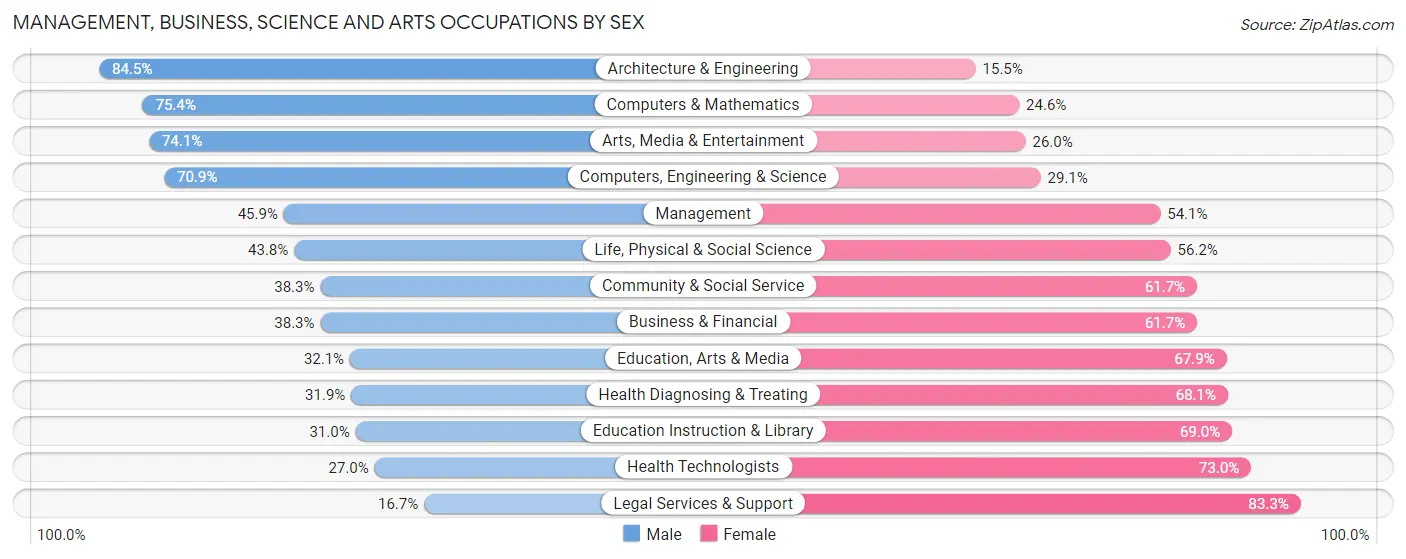
Management, Business, Science and Arts Occupations by Sex
Within the Management, Business, Science and Arts occupations in Marina, the most male-oriented occupations are Architecture & Engineering (84.5%), Computers & Mathematics (75.4%), and Arts, Media & Entertainment (74.1%), while the most female-oriented occupations are Legal Services & Support (83.3%), Health Technologists (73.0%), and Education Instruction & Library (69.0%).
| Occupation | Male | Female |
| Management | 390 (45.9%) | 459 (54.1%) |
| Business & Financial | 144 (38.3%) | 232 (61.7%) |
| Computers, Engineering & Science | 546 (70.9%) | 224 (29.1%) |
| Computers & Mathematics | 242 (75.4%) | 79 (24.6%) |
| Architecture & Engineering | 223 (84.5%) | 41 (15.5%) |
| Life, Physical & Social Science | 81 (43.8%) | 104 (56.2%) |
| Community & Social Service | 585 (38.3%) | 942 (61.7%) |
| Education, Arts & Media | 71 (32.1%) | 150 (67.9%) |
| Legal Services & Support | 4 (16.7%) | 20 (83.3%) |
| Education Instruction & Library | 316 (31.0%) | 704 (69.0%) |
| Arts, Media & Entertainment | 194 (74.1%) | 68 (26.0%) |
| Health Diagnosing & Treating | 255 (31.9%) | 545 (68.1%) |
| Health Technologists | 108 (27.0%) | 292 (73.0%) |
| Total (Category) | 1,920 (44.4%) | 2,402 (55.6%) |
| Total (Overall) | 5,858 (52.2%) | 5,371 (47.8%) |
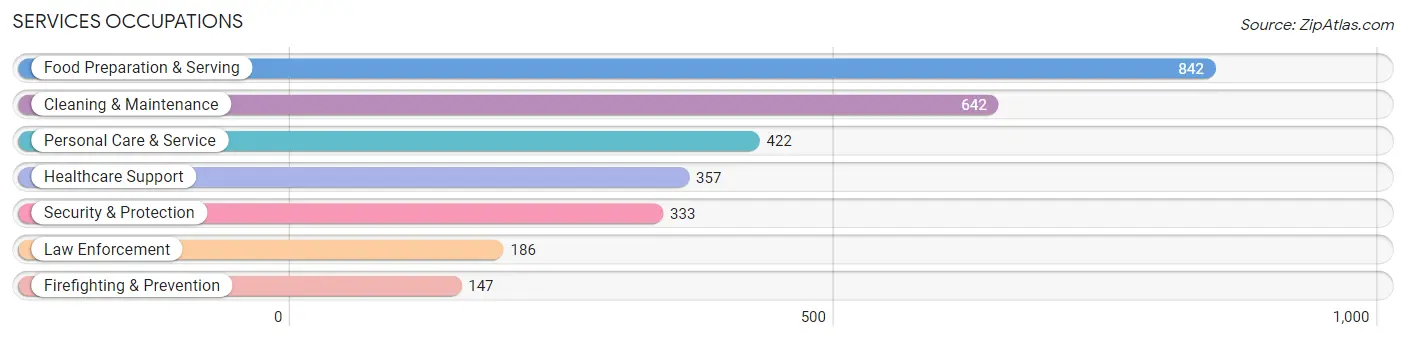
Services Occupations
The most common Services occupations in Marina are Food Preparation & Serving (842 | 7.5%), Cleaning & Maintenance (642 | 5.7%), Personal Care & Service (422 | 3.8%), Healthcare Support (357 | 3.2%), and Security & Protection (333 | 3.0%).
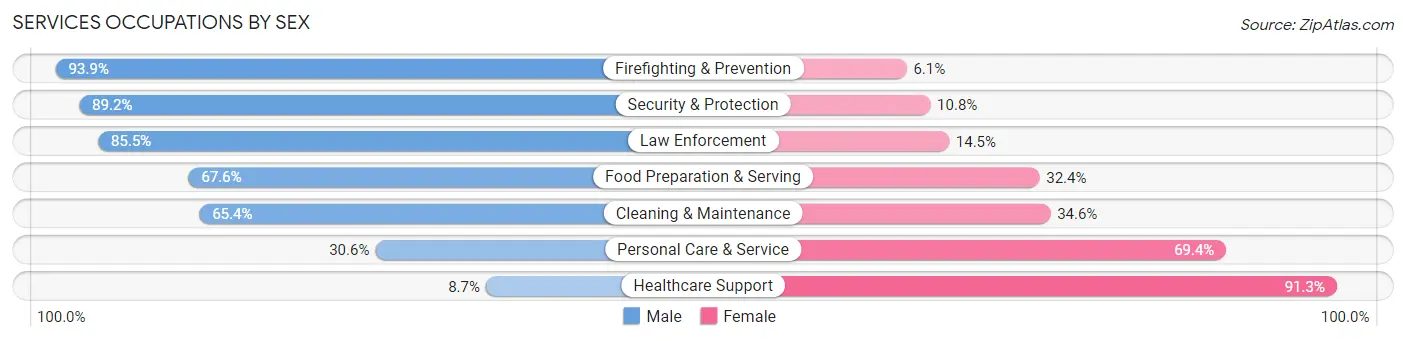
Services Occupations by Sex
Within the Services occupations in Marina, the most male-oriented occupations are Firefighting & Prevention (93.9%), Security & Protection (89.2%), and Law Enforcement (85.5%), while the most female-oriented occupations are Healthcare Support (91.3%), Personal Care & Service (69.4%), and Cleaning & Maintenance (34.6%).
| Occupation | Male | Female |
| Healthcare Support | 31 (8.7%) | 326 (91.3%) |
| Security & Protection | 297 (89.2%) | 36 (10.8%) |
| Firefighting & Prevention | 138 (93.9%) | 9 (6.1%) |
| Law Enforcement | 159 (85.5%) | 27 (14.5%) |
| Food Preparation & Serving | 569 (67.6%) | 273 (32.4%) |
| Cleaning & Maintenance | 420 (65.4%) | 222 (34.6%) |
| Personal Care & Service | 129 (30.6%) | 293 (69.4%) |
| Total (Category) | 1,446 (55.7%) | 1,150 (44.3%) |
| Total (Overall) | 5,858 (52.2%) | 5,371 (47.8%) |
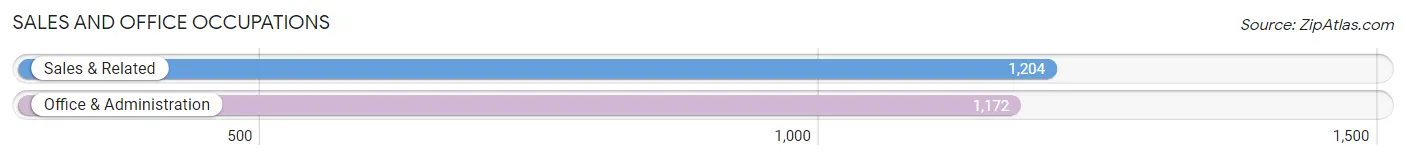
Sales and Office Occupations
The most common Sales and Office occupations in Marina are Sales & Related (1,204 | 10.7%), and Office & Administration (1,172 | 10.4%).
Sales and Office Occupations by Sex
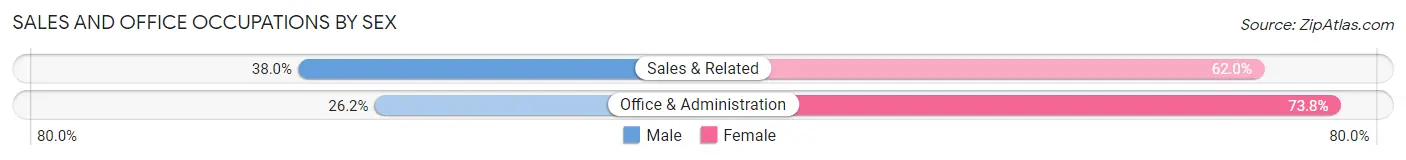
| Occupation | Male | Female |
| Sales & Related | 457 (38.0%) | 747 (62.0%) |
| Office & Administration | 307 (26.2%) | 865 (73.8%) |
| Total (Category) | 764 (32.2%) | 1,612 (67.8%) |
| Total (Overall) | 5,858 (52.2%) | 5,371 (47.8%) |
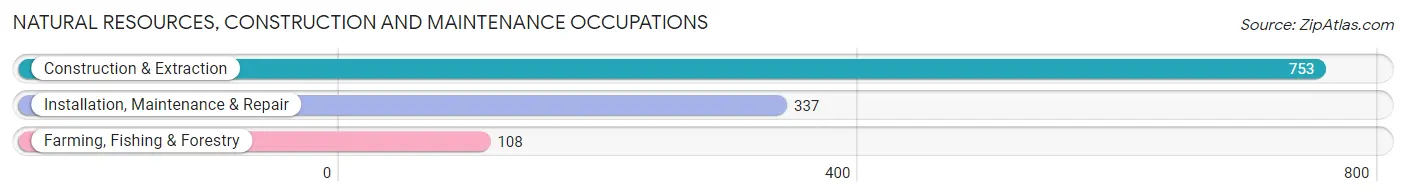
Natural Resources, Construction and Maintenance Occupations
The most common Natural Resources, Construction and Maintenance occupations in Marina are Construction & Extraction (753 | 6.7%), Installation, Maintenance & Repair (337 | 3.0%), and Farming, Fishing & Forestry (108 | 1.0%).
Natural Resources, Construction and Maintenance Occupations by Sex
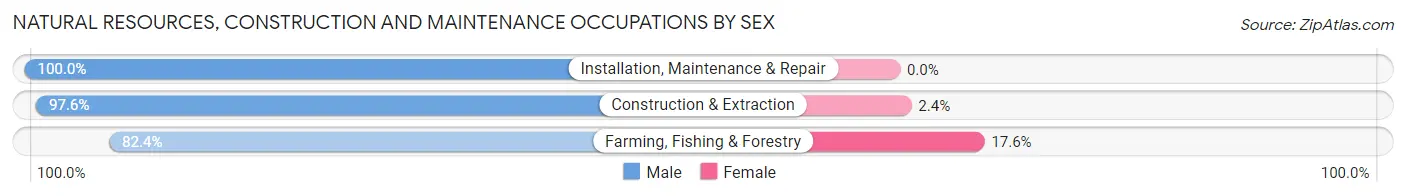
| Occupation | Male | Female |
| Farming, Fishing & Forestry | 89 (82.4%) | 19 (17.6%) |
| Construction & Extraction | 735 (97.6%) | 18 (2.4%) |
| Installation, Maintenance & Repair | 337 (100.0%) | 0 (0.0%) |
| Total (Category) | 1,161 (96.9%) | 37 (3.1%) |
| Total (Overall) | 5,858 (52.2%) | 5,371 (47.8%) |
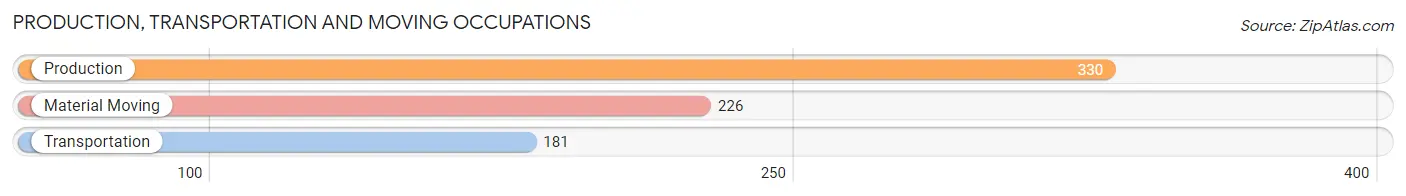
Production, Transportation and Moving Occupations
The most common Production, Transportation and Moving occupations in Marina are Production (330 | 2.9%), Material Moving (226 | 2.0%), and Transportation (181 | 1.6%).
Production, Transportation and Moving Occupations by Sex
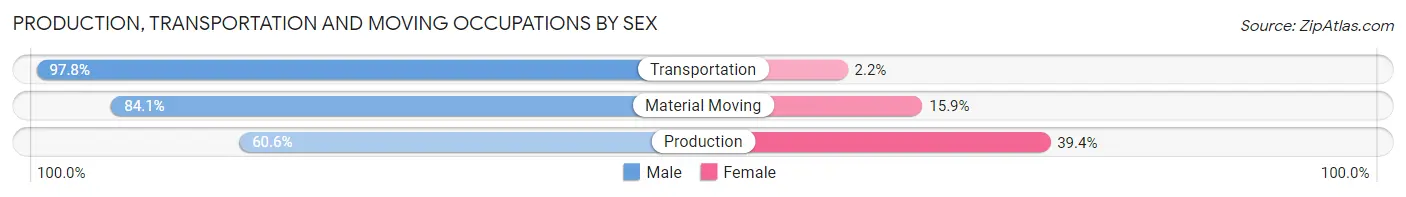
| Occupation | Male | Female |
| Production | 200 (60.6%) | 130 (39.4%) |
| Transportation | 177 (97.8%) | 4 (2.2%) |
| Material Moving | 190 (84.1%) | 36 (15.9%) |
| Total (Category) | 567 (76.9%) | 170 (23.1%) |
| Total (Overall) | 5,858 (52.2%) | 5,371 (47.8%) |
Employment Industries by Sex in Marina
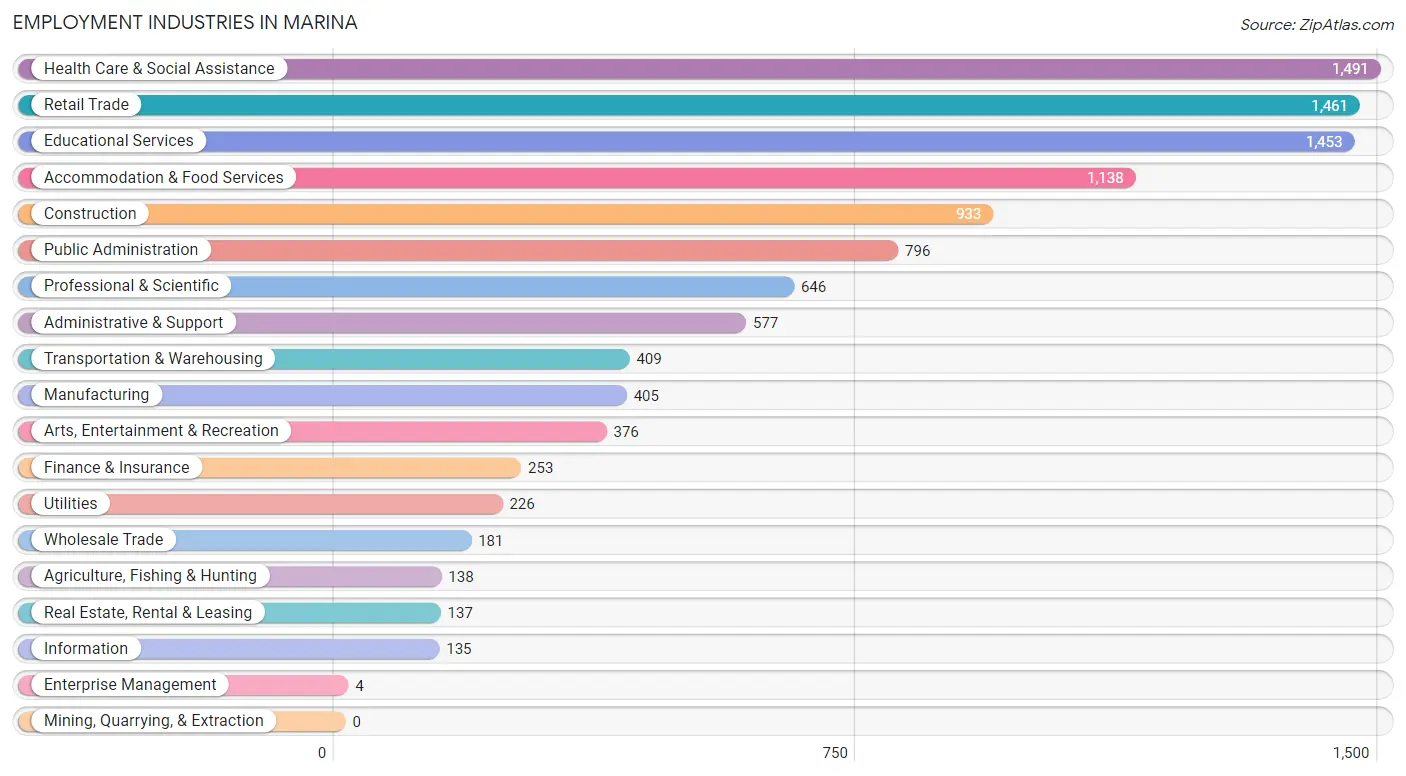
Employment Industries in Marina
The major employment industries in Marina include Health Care & Social Assistance (1,491 | 13.3%), Retail Trade (1,461 | 13.0%), Educational Services (1,453 | 12.9%), Accommodation & Food Services (1,138 | 10.1%), and Construction (933 | 8.3%).
Employment Industries by Sex in Marina
The Marina industries that see more men than women are Agriculture, Fishing & Hunting (100.0%), Enterprise Management (100.0%), and Construction (95.3%), whereas the industries that tend to have a higher number of women are Finance & Insurance (85.0%), Health Care & Social Assistance (73.7%), and Educational Services (70.8%).
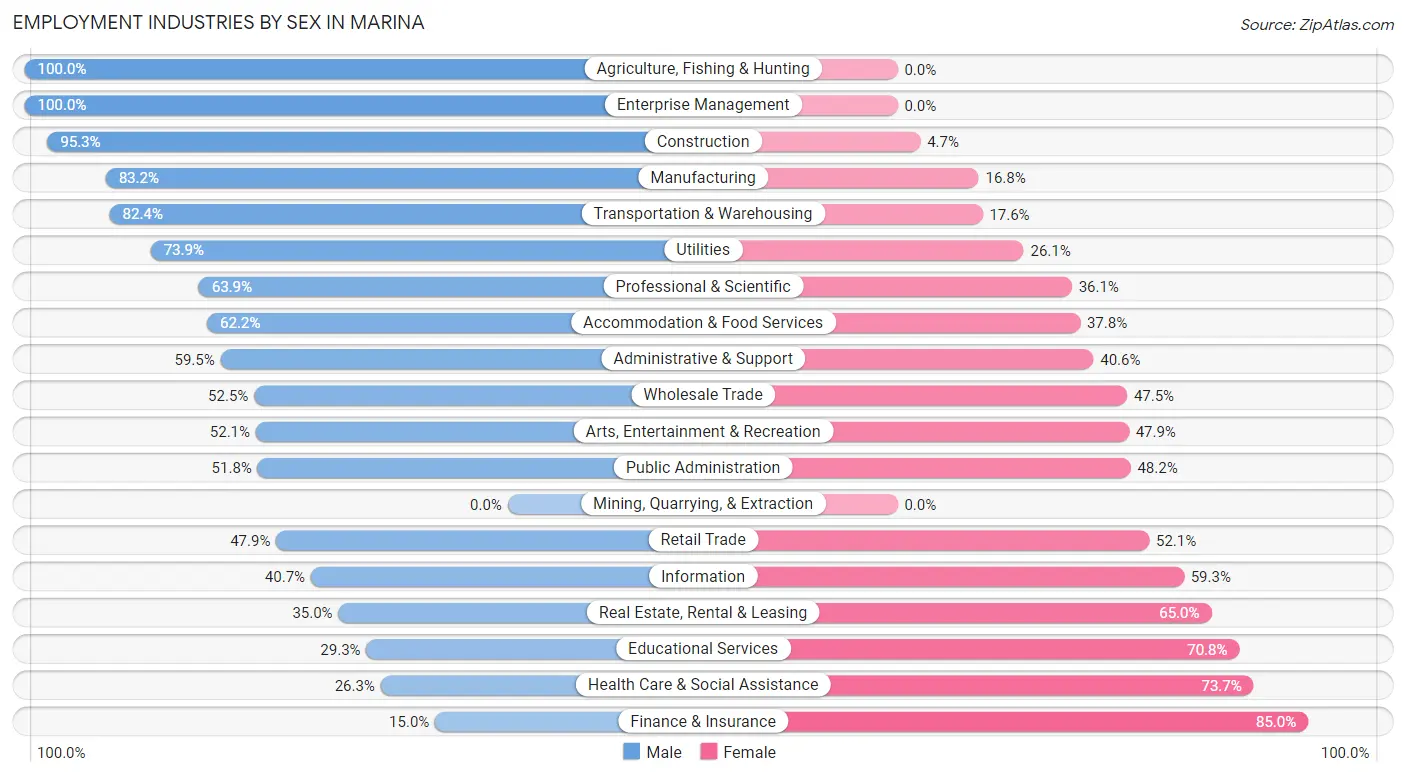
| Industry | Male | Female |
| Agriculture, Fishing & Hunting | 138 (100.0%) | 0 (0.0%) |
| Mining, Quarrying, & Extraction | 0 (0.0%) | 0 (0.0%) |
| Construction | 889 (95.3%) | 44 (4.7%) |
| Manufacturing | 337 (83.2%) | 68 (16.8%) |
| Wholesale Trade | 95 (52.5%) | 86 (47.5%) |
| Retail Trade | 700 (47.9%) | 761 (52.1%) |
| Transportation & Warehousing | 337 (82.4%) | 72 (17.6%) |
| Utilities | 167 (73.9%) | 59 (26.1%) |
| Information | 55 (40.7%) | 80 (59.3%) |
| Finance & Insurance | 38 (15.0%) | 215 (85.0%) |
| Real Estate, Rental & Leasing | 48 (35.0%) | 89 (65.0%) |
| Professional & Scientific | 413 (63.9%) | 233 (36.1%) |
| Enterprise Management | 4 (100.0%) | 0 (0.0%) |
| Administrative & Support | 343 (59.5%) | 234 (40.6%) |
| Educational Services | 425 (29.2%) | 1,028 (70.8%) |
| Health Care & Social Assistance | 392 (26.3%) | 1,099 (73.7%) |
| Arts, Entertainment & Recreation | 196 (52.1%) | 180 (47.9%) |
| Accommodation & Food Services | 708 (62.2%) | 430 (37.8%) |
| Public Administration | 412 (51.8%) | 384 (48.2%) |
| Total | 5,858 (52.2%) | 5,371 (47.8%) |
Education in Marina
School Enrollment in Marina
The most common levels of schooling among the 6,784 students in Marina are college / undergraduate (2,489 | 36.7%), elementary school (1,125 | 16.6%), and high school (1,077 | 15.9%).
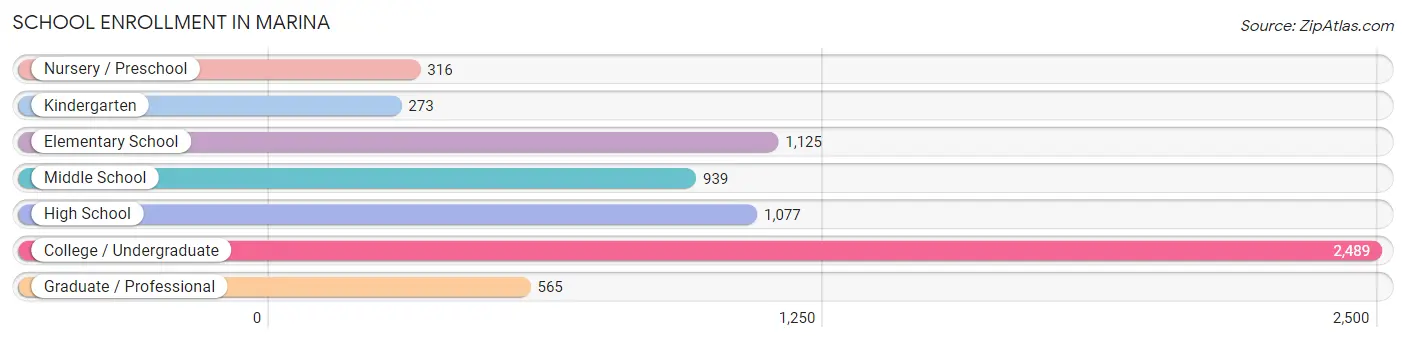
| School Level | # Students | % Students |
| Nursery / Preschool | 316 | 4.7% |
| Kindergarten | 273 | 4.0% |
| Elementary School | 1,125 | 16.6% |
| Middle School | 939 | 13.8% |
| High School | 1,077 | 15.9% |
| College / Undergraduate | 2,489 | 36.7% |
| Graduate / Professional | 565 | 8.3% |
| Total | 6,784 | 100.0% |
School Enrollment by Age by Funding Source in Marina
Out of a total of 6,784 students who are enrolled in schools in Marina, 855 (12.6%) attend a private institution, while the remaining 5,929 (87.4%) are enrolled in public schools. The age group of 3 to 4 year olds has the highest likelihood of being enrolled in private schools, with 100 (34.6% in the age bracket) enrolled. Conversely, the age group of 15 to 17 year olds has the lowest likelihood of being enrolled in a private school, with 699 (94.7% in the age bracket) attending a public institution.
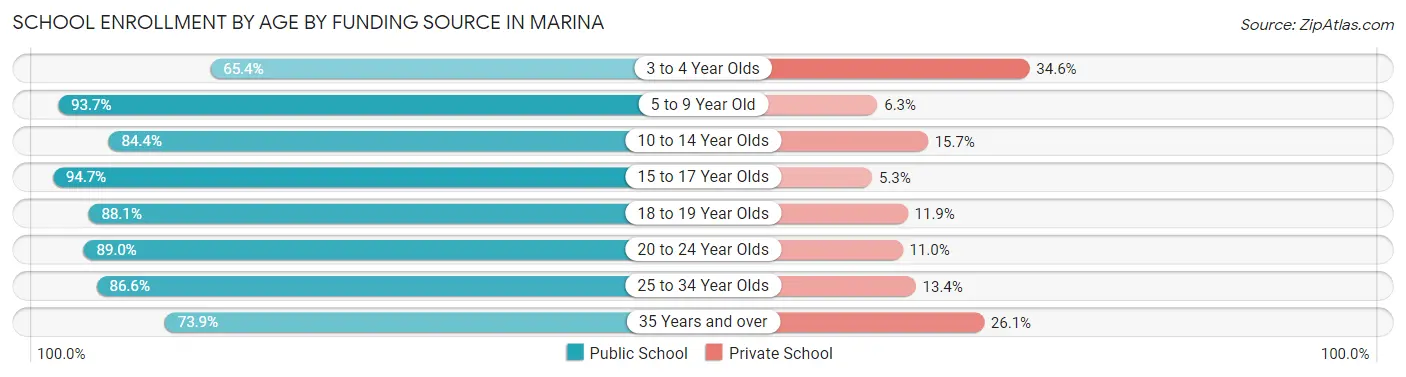
| Age Bracket | Public School | Private School |
| 3 to 4 Year Olds | 189 (65.4%) | 100 (34.6%) |
| 5 to 9 Year Old | 1,212 (93.7%) | 81 (6.3%) |
| 10 to 14 Year Olds | 1,083 (84.4%) | 201 (15.7%) |
| 15 to 17 Year Olds | 699 (94.7%) | 39 (5.3%) |
| 18 to 19 Year Olds | 503 (88.1%) | 68 (11.9%) |
| 20 to 24 Year Olds | 1,347 (89.0%) | 166 (11.0%) |
| 25 to 34 Year Olds | 601 (86.6%) | 93 (13.4%) |
| 35 Years and over | 297 (73.9%) | 105 (26.1%) |
| Total | 5,929 (87.4%) | 855 (12.6%) |
Educational Attainment by Field of Study in Marina
Business (587 | 10.8%), science & technology (515 | 9.5%), education (478 | 8.8%), liberal arts & history (461 | 8.5%), and social sciences (419 | 7.7%) are the most common fields of study among 5,421 individuals in Marina who have obtained a bachelor's degree or higher.
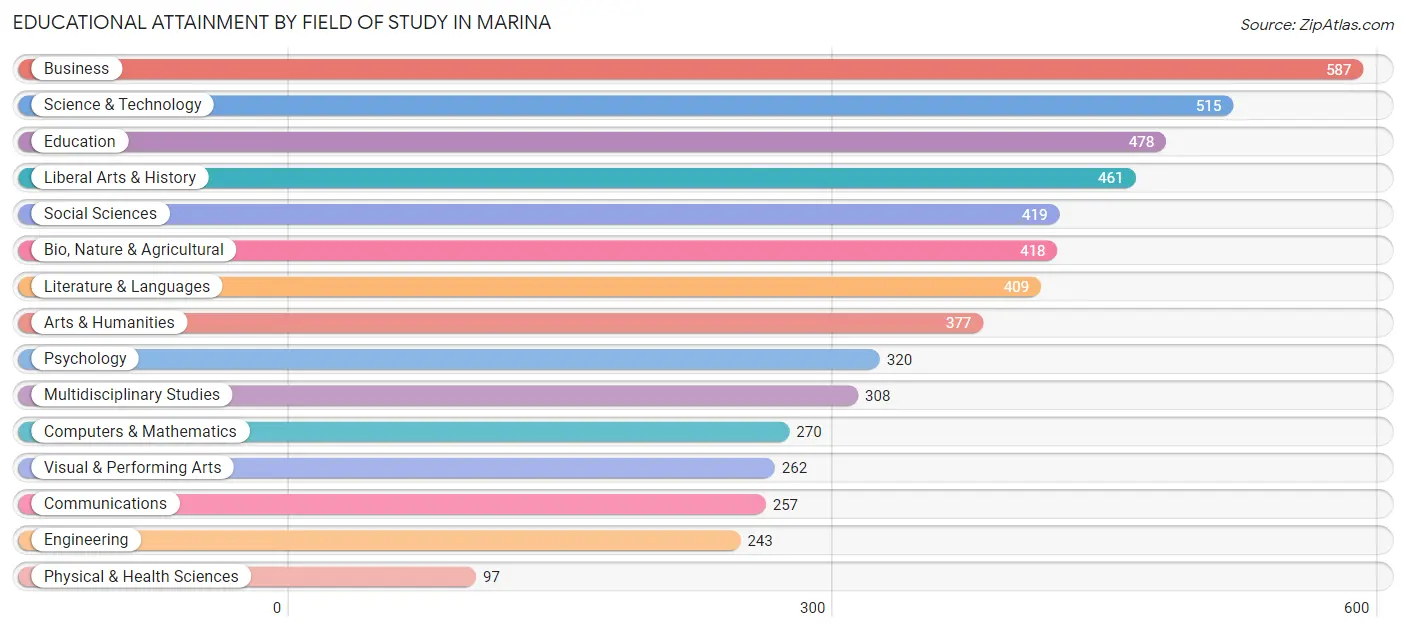
| Field of Study | # Graduates | % Graduates |
| Computers & Mathematics | 270 | 5.0% |
| Bio, Nature & Agricultural | 418 | 7.7% |
| Physical & Health Sciences | 97 | 1.8% |
| Psychology | 320 | 5.9% |
| Social Sciences | 419 | 7.7% |
| Engineering | 243 | 4.5% |
| Multidisciplinary Studies | 308 | 5.7% |
| Science & Technology | 515 | 9.5% |
| Business | 587 | 10.8% |
| Education | 478 | 8.8% |
| Literature & Languages | 409 | 7.5% |
| Liberal Arts & History | 461 | 8.5% |
| Visual & Performing Arts | 262 | 4.8% |
| Communications | 257 | 4.7% |
| Arts & Humanities | 377 | 7.0% |
| Total | 5,421 | 100.0% |
Transportation & Commute in Marina
Vehicle Availability by Sex in Marina
The most prevalent vehicle ownership categories in Marina are males with 2 vehicles (2,245, accounting for 39.5%) and females with 2 vehicles (1,838, making up 45.5%).
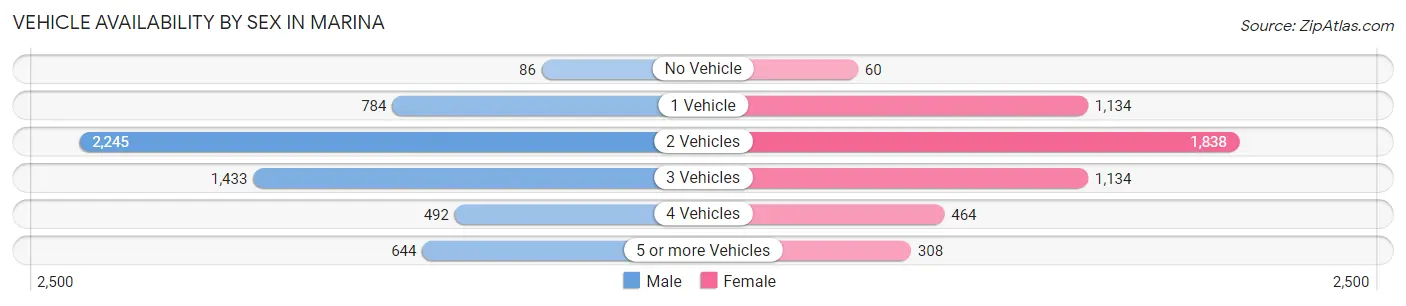
| Vehicles Available | Male | Female |
| No Vehicle | 86 (1.5%) | 60 (1.2%) |
| 1 Vehicle | 784 (13.8%) | 1,134 (23.0%) |
| 2 Vehicles | 2,245 (39.5%) | 1,838 (37.2%) |
| 3 Vehicles | 1,433 (25.2%) | 1,134 (23.0%) |
| 4 Vehicles | 492 (8.7%) | 464 (9.4%) |
| 5 or more Vehicles | 644 (11.3%) | 308 (6.2%) |
| Total | 5,684 (100.0%) | 4,938 (100.0%) |
Commute Time in Marina
The most frequently occuring commute durations in Marina are 20 to 24 minutes (2,732 commuters, 27.2%), 15 to 19 minutes (1,360 commuters, 13.6%), and 10 to 14 minutes (1,327 commuters, 13.2%).
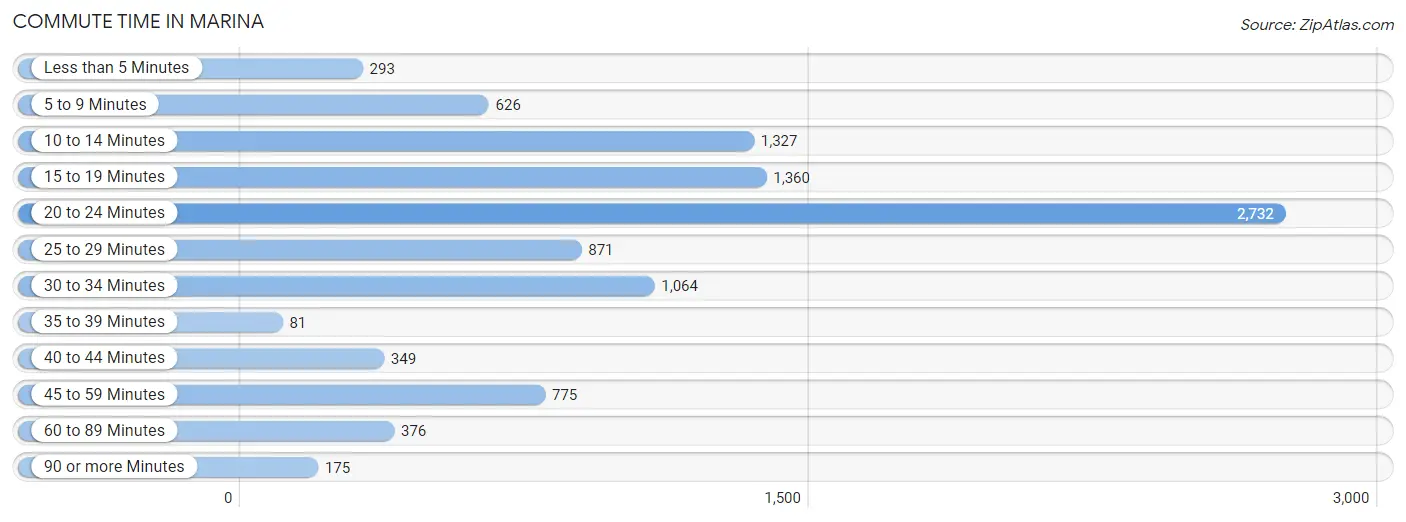
| Commute Time | # Commuters | % Commuters |
| Less than 5 Minutes | 293 | 2.9% |
| 5 to 9 Minutes | 626 | 6.2% |
| 10 to 14 Minutes | 1,327 | 13.2% |
| 15 to 19 Minutes | 1,360 | 13.6% |
| 20 to 24 Minutes | 2,732 | 27.2% |
| 25 to 29 Minutes | 871 | 8.7% |
| 30 to 34 Minutes | 1,064 | 10.6% |
| 35 to 39 Minutes | 81 | 0.8% |
| 40 to 44 Minutes | 349 | 3.5% |
| 45 to 59 Minutes | 775 | 7.7% |
| 60 to 89 Minutes | 376 | 3.7% |
| 90 or more Minutes | 175 | 1.7% |
Commute Time by Sex in Marina
The most common commute times in Marina are 20 to 24 minutes (1,783 commuters, 32.7%) for males and 20 to 24 minutes (949 commuters, 20.7%) for females.
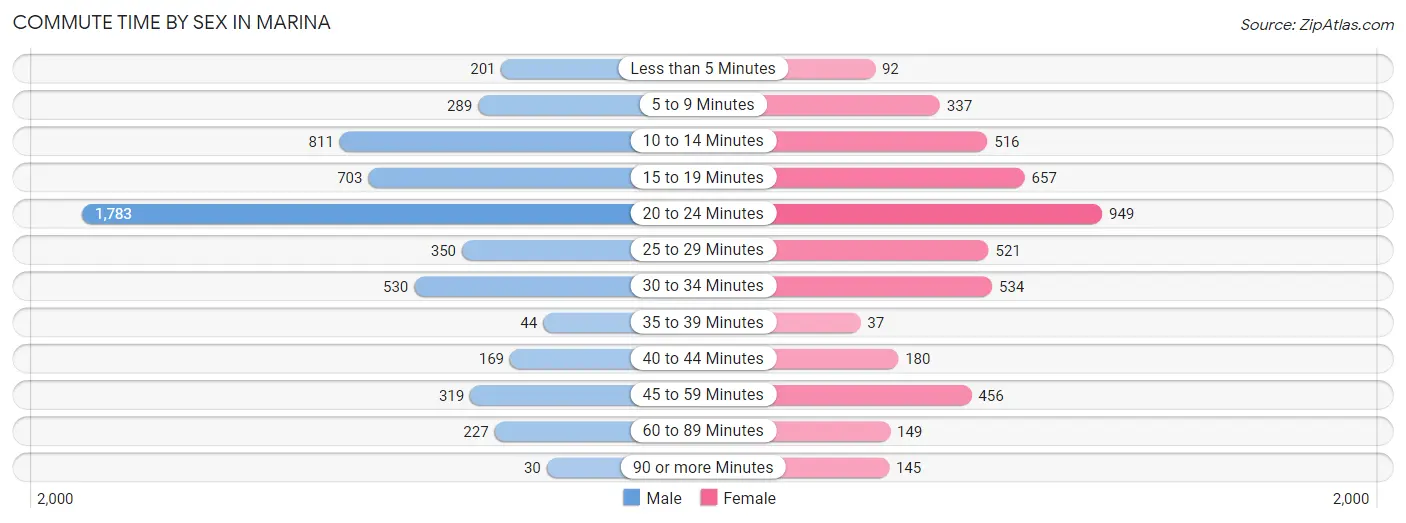
| Commute Time | Male | Female |
| Less than 5 Minutes | 201 (3.7%) | 92 (2.0%) |
| 5 to 9 Minutes | 289 (5.3%) | 337 (7.4%) |
| 10 to 14 Minutes | 811 (14.9%) | 516 (11.3%) |
| 15 to 19 Minutes | 703 (12.9%) | 657 (14.4%) |
| 20 to 24 Minutes | 1,783 (32.7%) | 949 (20.7%) |
| 25 to 29 Minutes | 350 (6.4%) | 521 (11.4%) |
| 30 to 34 Minutes | 530 (9.7%) | 534 (11.7%) |
| 35 to 39 Minutes | 44 (0.8%) | 37 (0.8%) |
| 40 to 44 Minutes | 169 (3.1%) | 180 (3.9%) |
| 45 to 59 Minutes | 319 (5.9%) | 456 (10.0%) |
| 60 to 89 Minutes | 227 (4.2%) | 149 (3.3%) |
| 90 or more Minutes | 30 (0.5%) | 145 (3.2%) |
Time of Departure to Work by Sex in Marina
The most frequent times of departure to work in Marina are 7:00 AM to 7:29 AM (890, 16.3%) for males and 7:00 AM to 7:29 AM (955, 20.9%) for females.
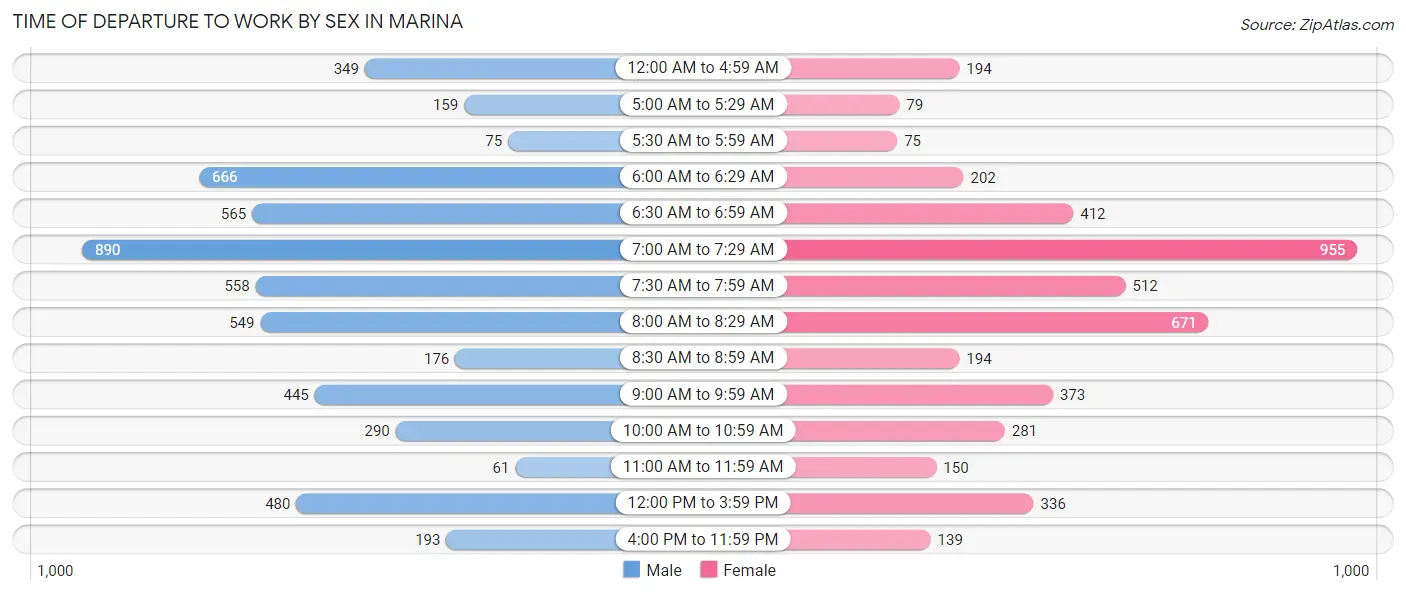
| Time of Departure | Male | Female |
| 12:00 AM to 4:59 AM | 349 (6.4%) | 194 (4.2%) |
| 5:00 AM to 5:29 AM | 159 (2.9%) | 79 (1.7%) |
| 5:30 AM to 5:59 AM | 75 (1.4%) | 75 (1.6%) |
| 6:00 AM to 6:29 AM | 666 (12.2%) | 202 (4.4%) |
| 6:30 AM to 6:59 AM | 565 (10.4%) | 412 (9.0%) |
| 7:00 AM to 7:29 AM | 890 (16.3%) | 955 (20.9%) |
| 7:30 AM to 7:59 AM | 558 (10.2%) | 512 (11.2%) |
| 8:00 AM to 8:29 AM | 549 (10.1%) | 671 (14.7%) |
| 8:30 AM to 8:59 AM | 176 (3.2%) | 194 (4.2%) |
| 9:00 AM to 9:59 AM | 445 (8.2%) | 373 (8.2%) |
| 10:00 AM to 10:59 AM | 290 (5.3%) | 281 (6.1%) |
| 11:00 AM to 11:59 AM | 61 (1.1%) | 150 (3.3%) |
| 12:00 PM to 3:59 PM | 480 (8.8%) | 336 (7.3%) |
| 4:00 PM to 11:59 PM | 193 (3.5%) | 139 (3.0%) |
| Total | 5,456 (100.0%) | 4,573 (100.0%) |
Housing Occupancy in Marina
Occupancy by Ownership in Marina
Of the total 7,797 dwellings in Marina, owner-occupied units account for 3,168 (40.6%), while renter-occupied units make up 4,629 (59.4%).
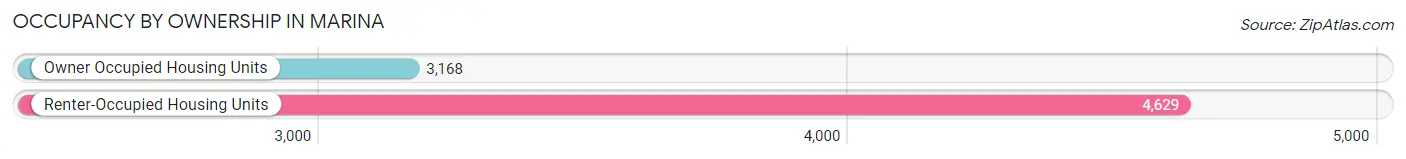
| Occupancy | # Housing Units | % Housing Units |
| Owner Occupied Housing Units | 3,168 | 40.6% |
| Renter-Occupied Housing Units | 4,629 | 59.4% |
| Total Occupied Housing Units | 7,797 | 100.0% |
Occupancy by Household Size in Marina
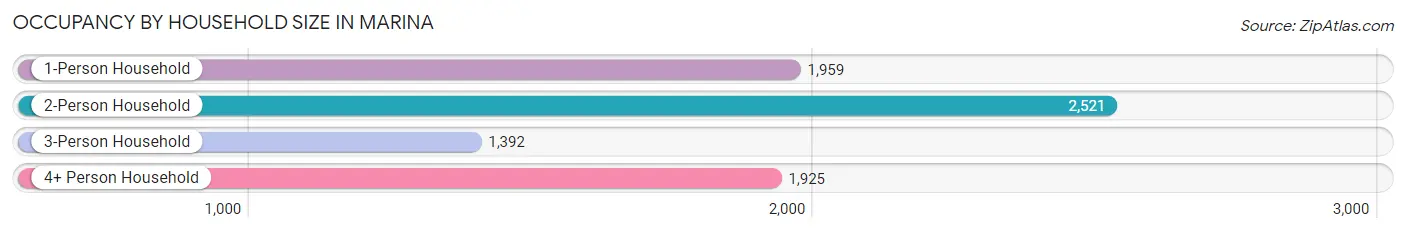
| Household Size | # Housing Units | % Housing Units |
| 1-Person Household | 1,959 | 25.1% |
| 2-Person Household | 2,521 | 32.3% |
| 3-Person Household | 1,392 | 17.8% |
| 4+ Person Household | 1,925 | 24.7% |
| Total Housing Units | 7,797 | 100.0% |
Occupancy by Ownership by Household Size in Marina
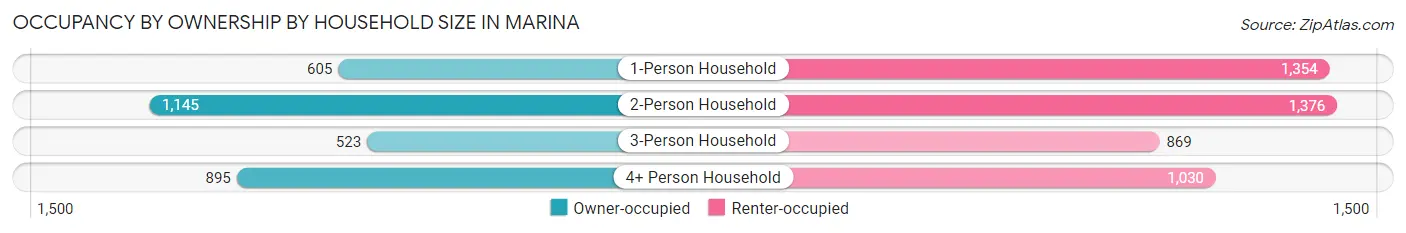
| Household Size | Owner-occupied | Renter-occupied |
| 1-Person Household | 605 (30.9%) | 1,354 (69.1%) |
| 2-Person Household | 1,145 (45.4%) | 1,376 (54.6%) |
| 3-Person Household | 523 (37.6%) | 869 (62.4%) |
| 4+ Person Household | 895 (46.5%) | 1,030 (53.5%) |
| Total Housing Units | 3,168 (40.6%) | 4,629 (59.4%) |
Occupancy by Educational Attainment in Marina
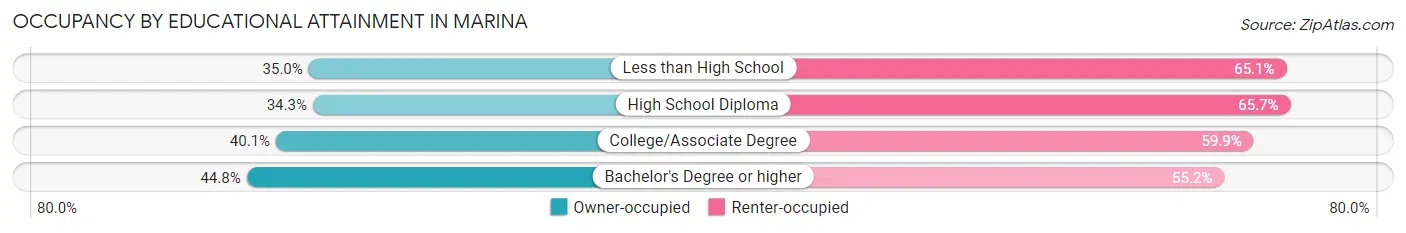
| Household Size | Owner-occupied | Renter-occupied |
| Less than High School | 259 (34.9%) | 482 (65.0%) |
| High School Diploma | 380 (34.3%) | 728 (65.7%) |
| College/Associate Degree | 1,173 (40.1%) | 1,749 (59.9%) |
| Bachelor's Degree or higher | 1,356 (44.8%) | 1,670 (55.2%) |
Occupancy by Age of Householder in Marina
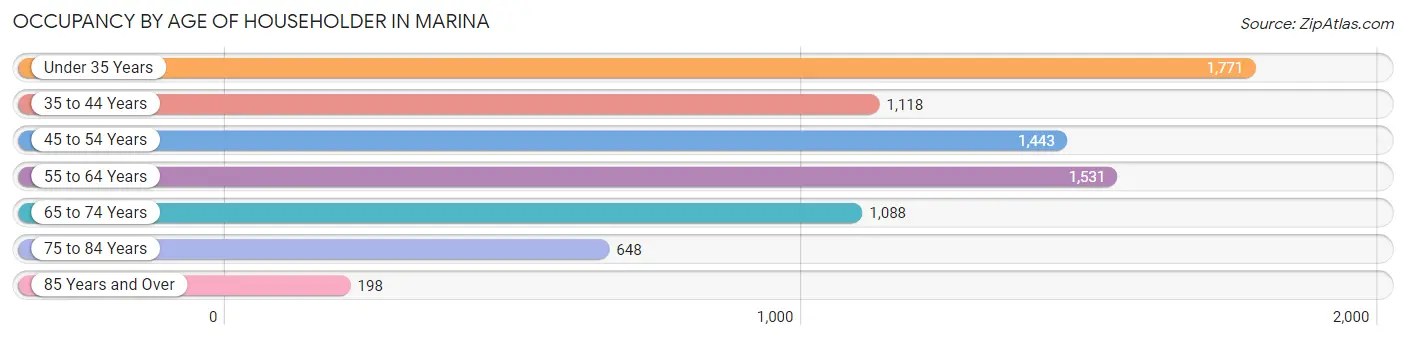
| Age Bracket | # Households | % Households |
| Under 35 Years | 1,771 | 22.7% |
| 35 to 44 Years | 1,118 | 14.3% |
| 45 to 54 Years | 1,443 | 18.5% |
| 55 to 64 Years | 1,531 | 19.6% |
| 65 to 74 Years | 1,088 | 14.0% |
| 75 to 84 Years | 648 | 8.3% |
| 85 Years and Over | 198 | 2.5% |
| Total | 7,797 | 100.0% |
Housing Finances in Marina
Median Income by Occupancy in Marina
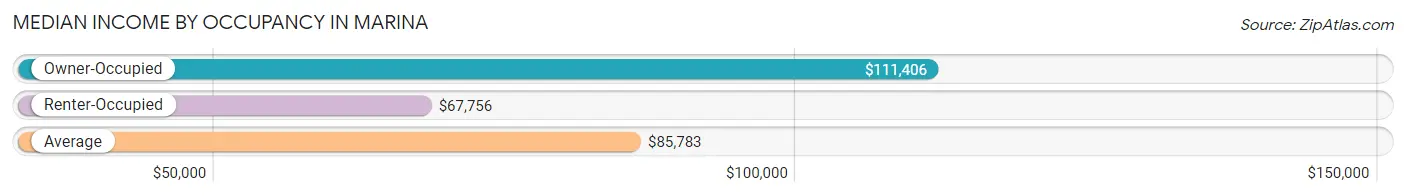
| Occupancy Type | # Households | Median Income |
| Owner-Occupied | 3,168 (40.6%) | $111,406 |
| Renter-Occupied | 4,629 (59.4%) | $67,756 |
| Average | 7,797 (100.0%) | $85,783 |
Occupancy by Householder Income Bracket in Marina
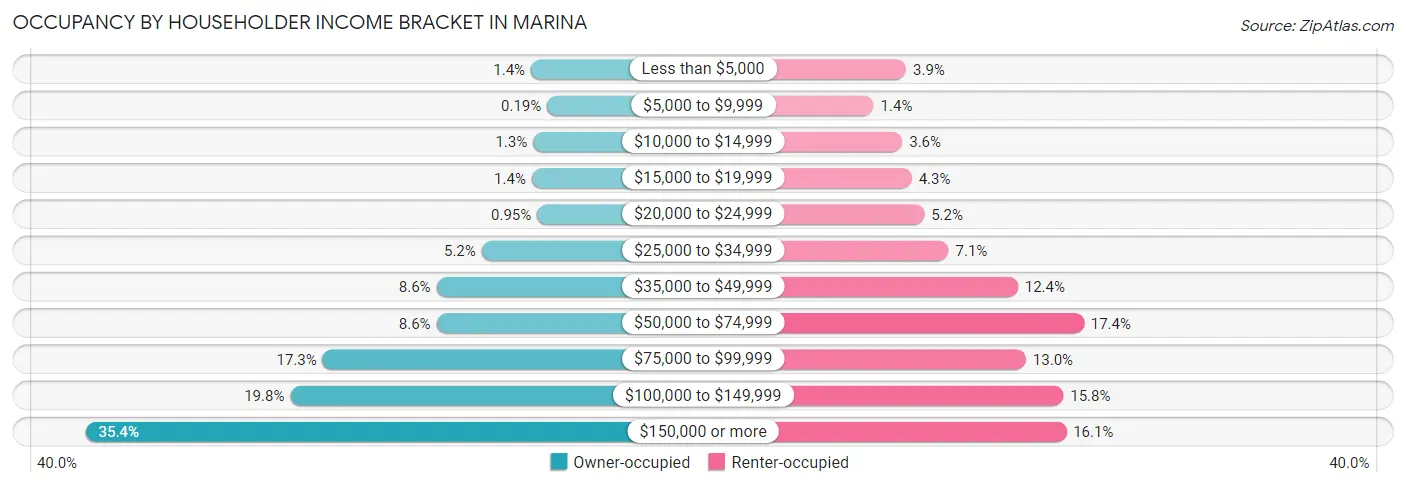
| Income Bracket | Owner-occupied | Renter-occupied |
| Less than $5,000 | 45 (1.4%) | 178 (3.8%) |
| $5,000 to $9,999 | 6 (0.2%) | 64 (1.4%) |
| $10,000 to $14,999 | 40 (1.3%) | 165 (3.6%) |
| $15,000 to $19,999 | 43 (1.4%) | 198 (4.3%) |
| $20,000 to $24,999 | 30 (0.9%) | 242 (5.2%) |
| $25,000 to $34,999 | 164 (5.2%) | 328 (7.1%) |
| $35,000 to $49,999 | 273 (8.6%) | 572 (12.4%) |
| $50,000 to $74,999 | 273 (8.6%) | 805 (17.4%) |
| $75,000 to $99,999 | 548 (17.3%) | 601 (13.0%) |
| $100,000 to $149,999 | 626 (19.8%) | 733 (15.8%) |
| $150,000 or more | 1,120 (35.3%) | 743 (16.1%) |
| Total | 3,168 (100.0%) | 4,629 (100.0%) |
Monthly Housing Cost Tiers in Marina
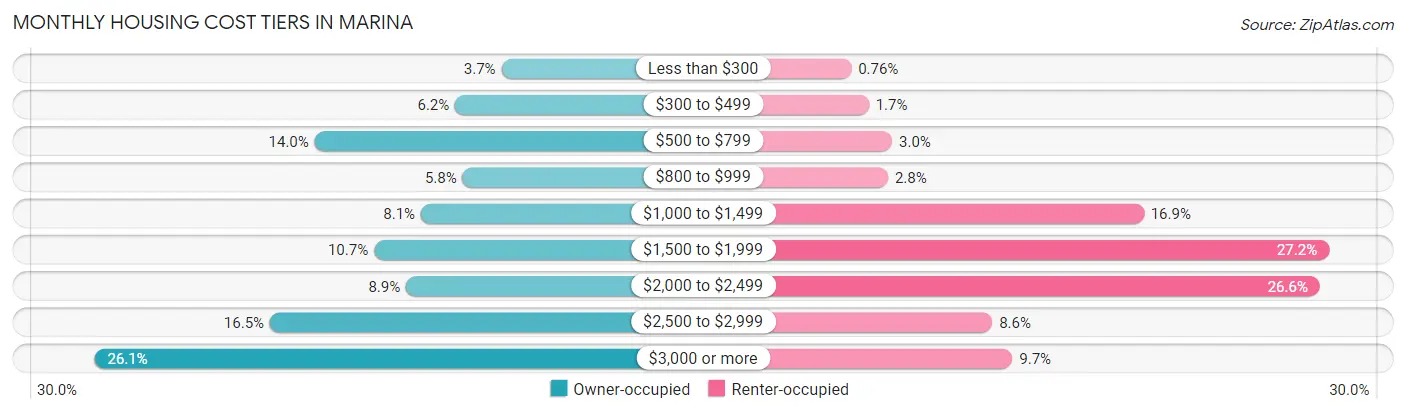
| Monthly Cost | Owner-occupied | Renter-occupied |
| Less than $300 | 116 (3.7%) | 35 (0.8%) |
| $300 to $499 | 197 (6.2%) | 80 (1.7%) |
| $500 to $799 | 443 (14.0%) | 140 (3.0%) |
| $800 to $999 | 184 (5.8%) | 129 (2.8%) |
| $1,000 to $1,499 | 257 (8.1%) | 783 (16.9%) |
| $1,500 to $1,999 | 339 (10.7%) | 1,257 (27.2%) |
| $2,000 to $2,499 | 283 (8.9%) | 1,233 (26.6%) |
| $2,500 to $2,999 | 521 (16.5%) | 396 (8.6%) |
| $3,000 or more | 828 (26.1%) | 447 (9.7%) |
| Total | 3,168 (100.0%) | 4,629 (100.0%) |
Physical Housing Characteristics in Marina
Housing Structures in Marina
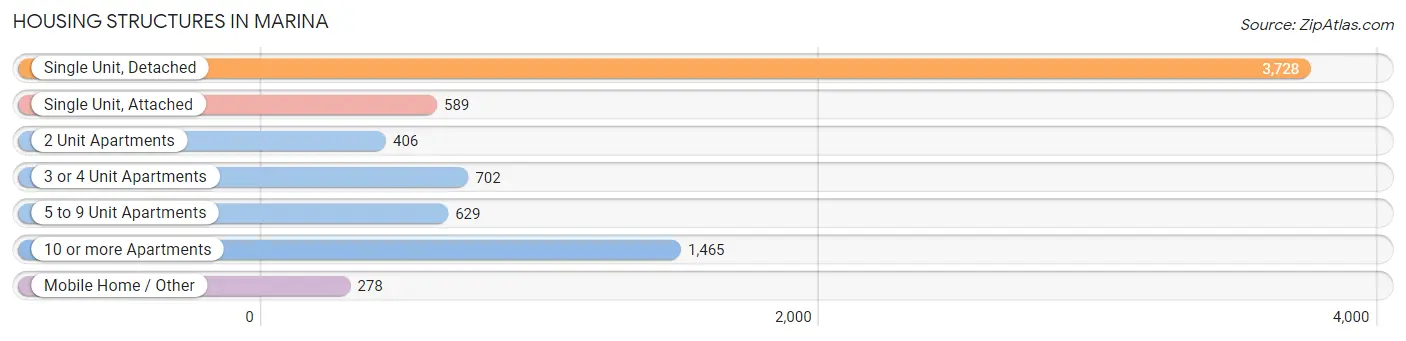
| Structure Type | # Housing Units | % Housing Units |
| Single Unit, Detached | 3,728 | 47.8% |
| Single Unit, Attached | 589 | 7.5% |
| 2 Unit Apartments | 406 | 5.2% |
| 3 or 4 Unit Apartments | 702 | 9.0% |
| 5 to 9 Unit Apartments | 629 | 8.1% |
| 10 or more Apartments | 1,465 | 18.8% |
| Mobile Home / Other | 278 | 3.6% |
| Total | 7,797 | 100.0% |
Housing Structures by Occupancy in Marina
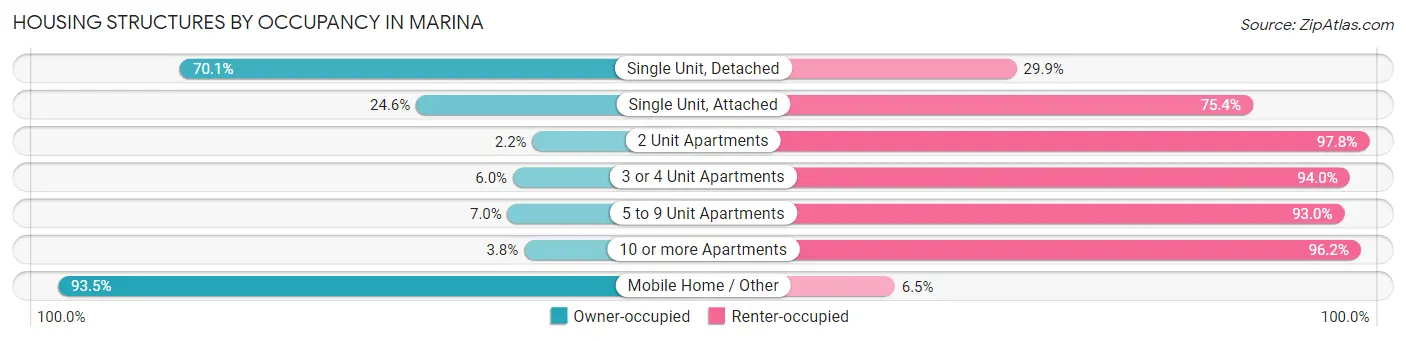
| Structure Type | Owner-occupied | Renter-occupied |
| Single Unit, Detached | 2,612 (70.1%) | 1,116 (29.9%) |
| Single Unit, Attached | 145 (24.6%) | 444 (75.4%) |
| 2 Unit Apartments | 9 (2.2%) | 397 (97.8%) |
| 3 or 4 Unit Apartments | 42 (6.0%) | 660 (94.0%) |
| 5 to 9 Unit Apartments | 44 (7.0%) | 585 (93.0%) |
| 10 or more Apartments | 56 (3.8%) | 1,409 (96.2%) |
| Mobile Home / Other | 260 (93.5%) | 18 (6.5%) |
| Total | 3,168 (40.6%) | 4,629 (59.4%) |
Housing Structures by Number of Rooms in Marina
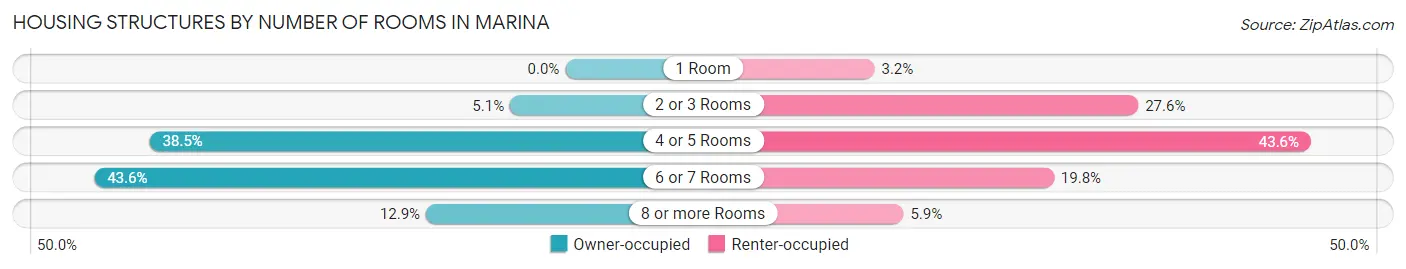
| Number of Rooms | Owner-occupied | Renter-occupied |
| 1 Room | 0 (0.0%) | 148 (3.2%) |
| 2 or 3 Rooms | 162 (5.1%) | 1,277 (27.6%) |
| 4 or 5 Rooms | 1,218 (38.5%) | 2,016 (43.5%) |
| 6 or 7 Rooms | 1,380 (43.6%) | 916 (19.8%) |
| 8 or more Rooms | 408 (12.9%) | 272 (5.9%) |
| Total | 3,168 (100.0%) | 4,629 (100.0%) |
Housing Structure by Heating Type in Marina
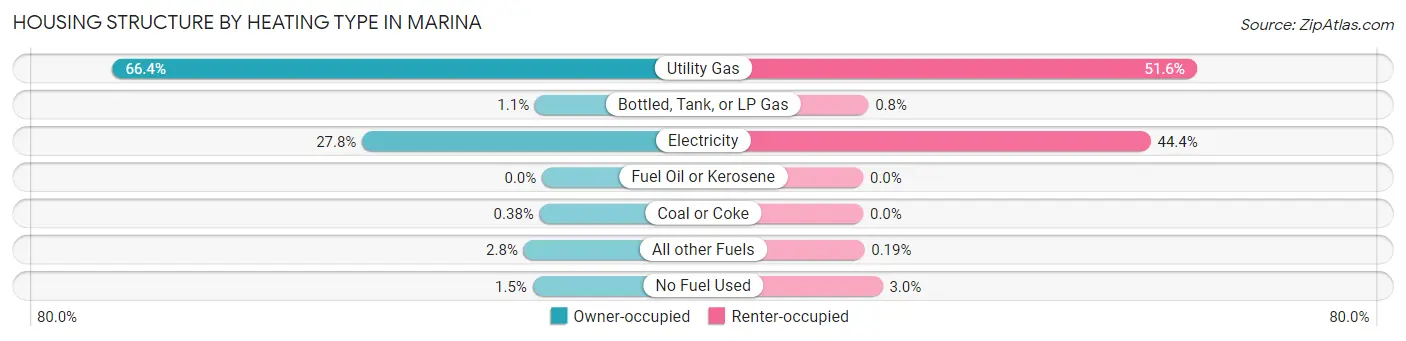
| Heating Type | Owner-occupied | Renter-occupied |
| Utility Gas | 2,104 (66.4%) | 2,387 (51.6%) |
| Bottled, Tank, or LP Gas | 35 (1.1%) | 37 (0.8%) |
| Electricity | 881 (27.8%) | 2,057 (44.4%) |
| Fuel Oil or Kerosene | 0 (0.0%) | 0 (0.0%) |
| Coal or Coke | 12 (0.4%) | 0 (0.0%) |
| All other Fuels | 90 (2.8%) | 9 (0.2%) |
| No Fuel Used | 46 (1.5%) | 139 (3.0%) |
| Total | 3,168 (100.0%) | 4,629 (100.0%) |
Household Vehicle Usage in Marina
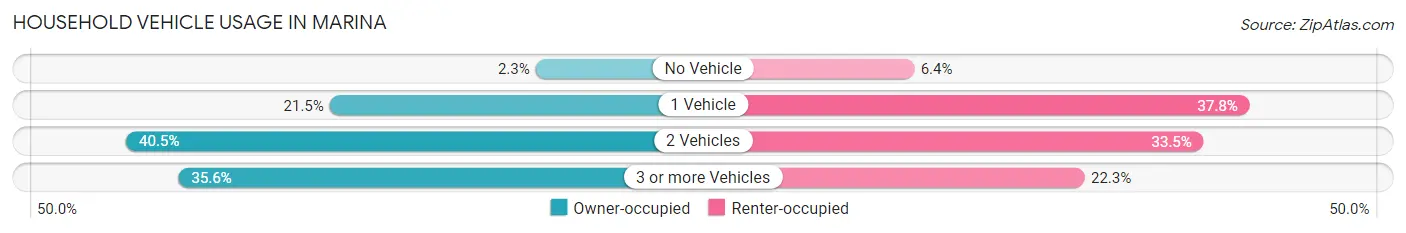
| Vehicles per Household | Owner-occupied | Renter-occupied |
| No Vehicle | 73 (2.3%) | 297 (6.4%) |
| 1 Vehicle | 682 (21.5%) | 1,749 (37.8%) |
| 2 Vehicles | 1,284 (40.5%) | 1,550 (33.5%) |
| 3 or more Vehicles | 1,129 (35.6%) | 1,033 (22.3%) |
| Total | 3,168 (100.0%) | 4,629 (100.0%) |
Real Estate & Mortgages in Marina
Real Estate and Mortgage Overview in Marina
| Characteristic | Without Mortgage | With Mortgage |
| Housing Units | 1,077 | 2,091 |
| Median Property Value | $645,500 | $686,000 |
| Median Household Income | $92,071 | $901 |
| Monthly Housing Costs | $591 | $828 |
| Real Estate Taxes | $3,310 | $31 |
Property Value by Mortgage Status in Marina
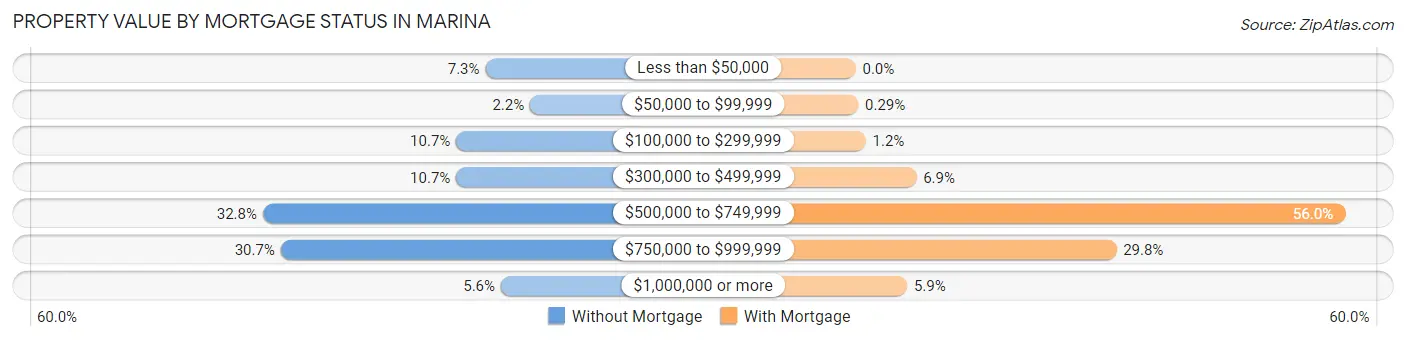
| Property Value | Without Mortgage | With Mortgage |
| Less than $50,000 | 79 (7.3%) | 0 (0.0%) |
| $50,000 to $99,999 | 24 (2.2%) | 6 (0.3%) |
| $100,000 to $299,999 | 115 (10.7%) | 24 (1.1%) |
| $300,000 to $499,999 | 115 (10.7%) | 145 (6.9%) |
| $500,000 to $749,999 | 353 (32.8%) | 1,170 (55.9%) |
| $750,000 to $999,999 | 331 (30.7%) | 623 (29.8%) |
| $1,000,000 or more | 60 (5.6%) | 123 (5.9%) |
| Total | 1,077 (100.0%) | 2,091 (100.0%) |
Household Income by Mortgage Status in Marina
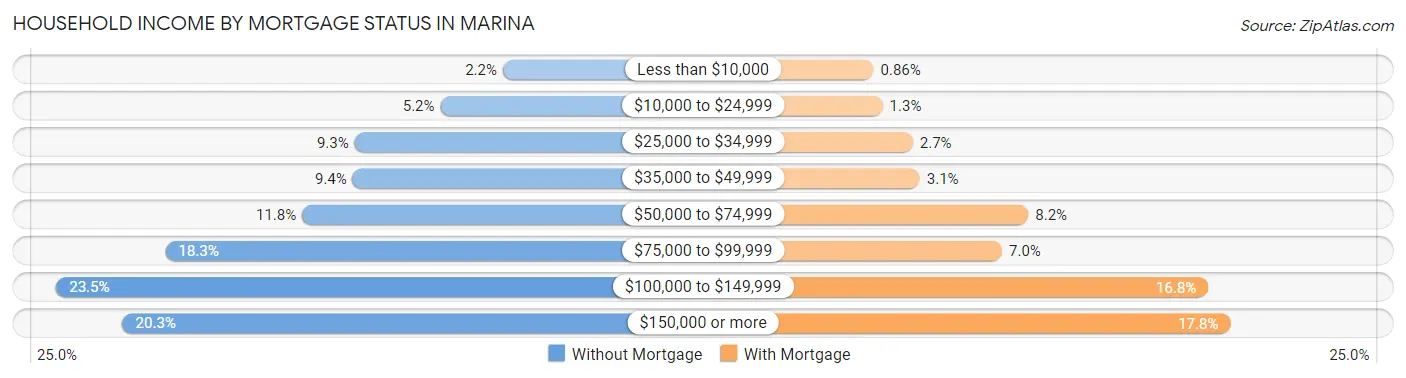
| Household Income | Without Mortgage | With Mortgage |
| Less than $10,000 | 24 (2.2%) | 18 (0.9%) |
| $10,000 to $24,999 | 56 (5.2%) | 27 (1.3%) |
| $25,000 to $34,999 | 100 (9.3%) | 57 (2.7%) |
| $35,000 to $49,999 | 101 (9.4%) | 64 (3.1%) |
| $50,000 to $74,999 | 127 (11.8%) | 172 (8.2%) |
| $75,000 to $99,999 | 197 (18.3%) | 146 (7.0%) |
| $100,000 to $149,999 | 253 (23.5%) | 351 (16.8%) |
| $150,000 or more | 219 (20.3%) | 373 (17.8%) |
| Total | 1,077 (100.0%) | 2,091 (100.0%) |
Property Value to Household Income Ratio in Marina
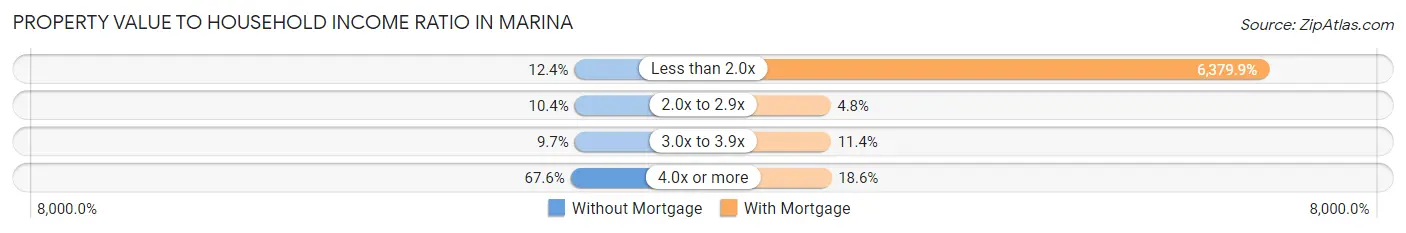
| Value-to-Income Ratio | Without Mortgage | With Mortgage |
| Less than 2.0x | 133 (12.3%) | 133,403 (6,379.9%) |
| 2.0x to 2.9x | 112 (10.4%) | 101 (4.8%) |
| 3.0x to 3.9x | 104 (9.7%) | 238 (11.4%) |
| 4.0x or more | 728 (67.6%) | 389 (18.6%) |
| Total | 1,077 (100.0%) | 2,091 (100.0%) |
Real Estate Taxes by Mortgage Status in Marina
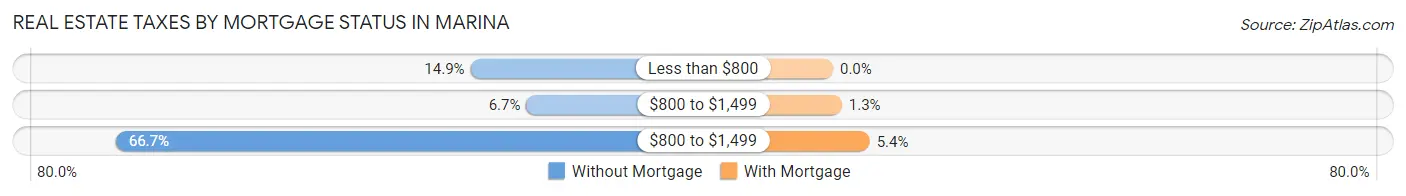
| Property Taxes | Without Mortgage | With Mortgage |
| Less than $800 | 160 (14.9%) | 0 (0.0%) |
| $800 to $1,499 | 72 (6.7%) | 27 (1.3%) |
| $800 to $1,499 | 718 (66.7%) | 112 (5.4%) |
| Total | 1,077 (100.0%) | 2,091 (100.0%) |
Health & Disability in Marina
Health Insurance Coverage by Age in Marina
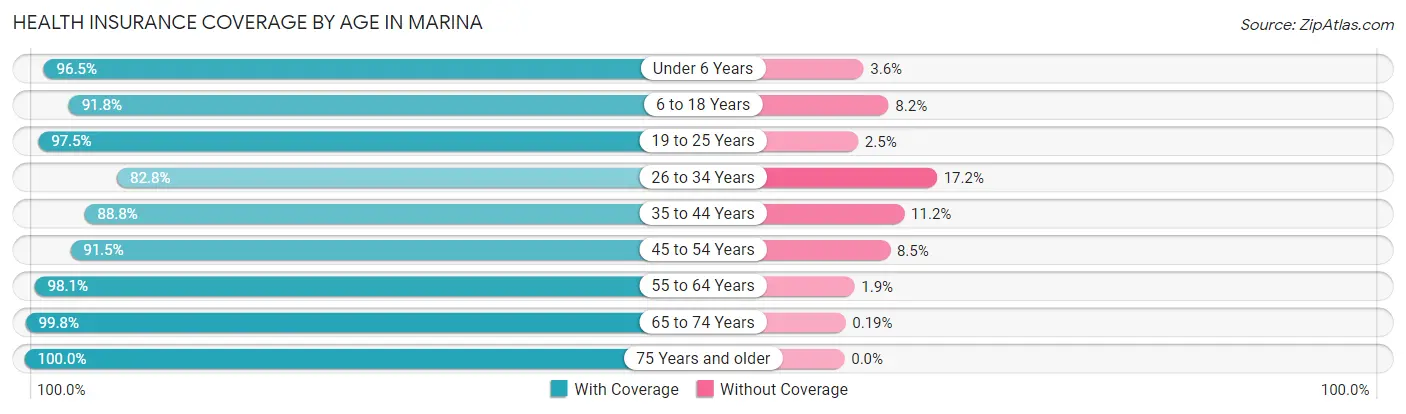
| Age Bracket | With Coverage | Without Coverage |
| Under 6 Years | 1,440 (96.5%) | 53 (3.5%) |
| 6 to 18 Years | 3,188 (91.8%) | 286 (8.2%) |
| 19 to 25 Years | 2,842 (97.5%) | 74 (2.5%) |
| 26 to 34 Years | 2,323 (82.8%) | 484 (17.2%) |
| 35 to 44 Years | 2,397 (88.8%) | 301 (11.2%) |
| 45 to 54 Years | 2,232 (91.5%) | 208 (8.5%) |
| 55 to 64 Years | 2,615 (98.1%) | 50 (1.9%) |
| 65 to 74 Years | 2,110 (99.8%) | 4 (0.2%) |
| 75 Years and older | 1,500 (100.0%) | 0 (0.0%) |
| Total | 20,647 (93.4%) | 1,460 (6.6%) |
Health Insurance Coverage by Citizenship Status in Marina
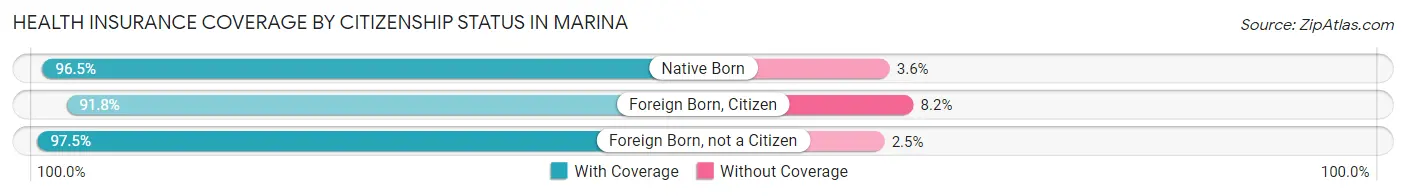
| Citizenship Status | With Coverage | Without Coverage |
| Native Born | 1,440 (96.5%) | 53 (3.5%) |
| Foreign Born, Citizen | 3,188 (91.8%) | 286 (8.2%) |
| Foreign Born, not a Citizen | 2,842 (97.5%) | 74 (2.5%) |
Health Insurance Coverage by Household Income in Marina
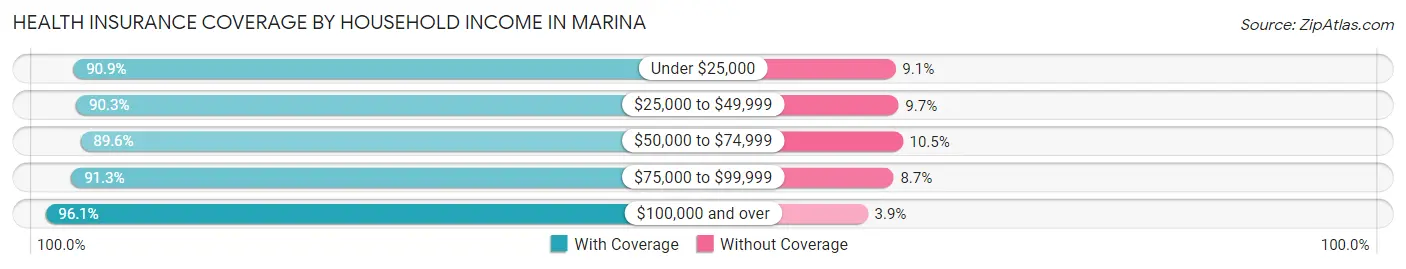
| Household Income | With Coverage | Without Coverage |
| Under $25,000 | 1,606 (90.9%) | 161 (9.1%) |
| $25,000 to $49,999 | 2,746 (90.3%) | 294 (9.7%) |
| $50,000 to $74,999 | 2,391 (89.5%) | 279 (10.4%) |
| $75,000 to $99,999 | 3,132 (91.3%) | 300 (8.7%) |
| $100,000 and over | 9,475 (96.1%) | 383 (3.9%) |
Public vs Private Health Insurance Coverage by Age in Marina
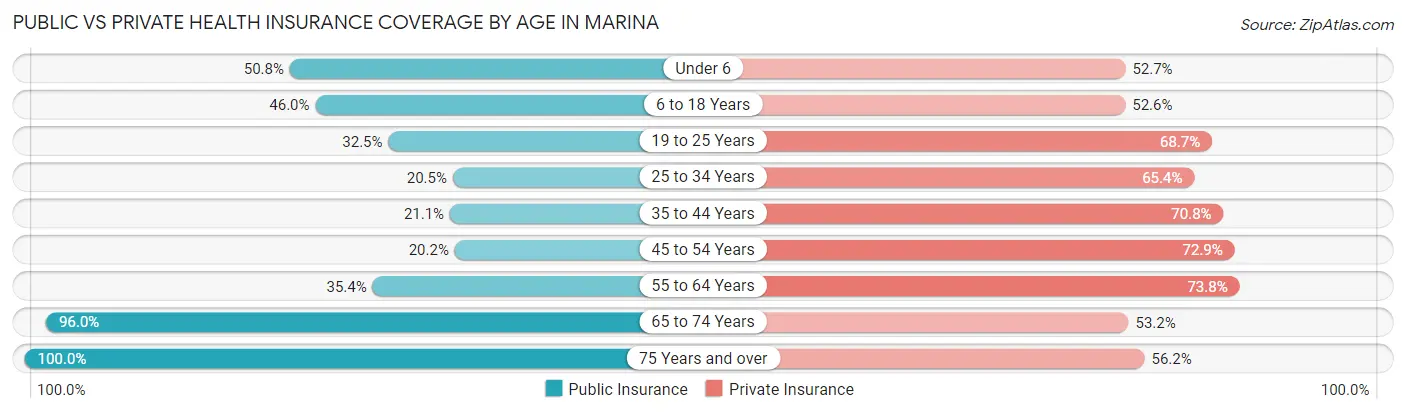
| Age Bracket | Public Insurance | Private Insurance |
| Under 6 | 758 (50.8%) | 786 (52.6%) |
| 6 to 18 Years | 1,599 (46.0%) | 1,828 (52.6%) |
| 19 to 25 Years | 947 (32.5%) | 2,004 (68.7%) |
| 25 to 34 Years | 576 (20.5%) | 1,836 (65.4%) |
| 35 to 44 Years | 568 (21.0%) | 1,911 (70.8%) |
| 45 to 54 Years | 492 (20.2%) | 1,779 (72.9%) |
| 55 to 64 Years | 944 (35.4%) | 1,967 (73.8%) |
| 65 to 74 Years | 2,030 (96.0%) | 1,125 (53.2%) |
| 75 Years and over | 1,500 (100.0%) | 843 (56.2%) |
| Total | 9,414 (42.6%) | 14,079 (63.7%) |
Disability Status by Sex by Age in Marina
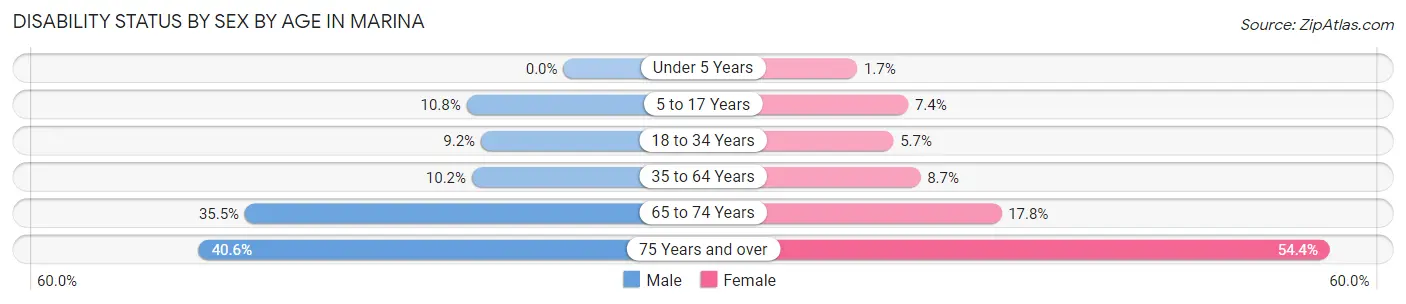
| Age Bracket | Male | Female |
| Under 5 Years | 0 (0.0%) | 9 (1.7%) |
| 5 to 17 Years | 172 (10.8%) | 128 (7.4%) |
| 18 to 34 Years | 286 (9.2%) | 170 (5.7%) |
| 35 to 64 Years | 382 (10.2%) | 354 (8.7%) |
| 65 to 74 Years | 400 (35.5%) | 175 (17.7%) |
| 75 Years and over | 231 (40.6%) | 506 (54.3%) |
Disability Class by Sex by Age in Marina
Disability Class: Hearing Difficulty
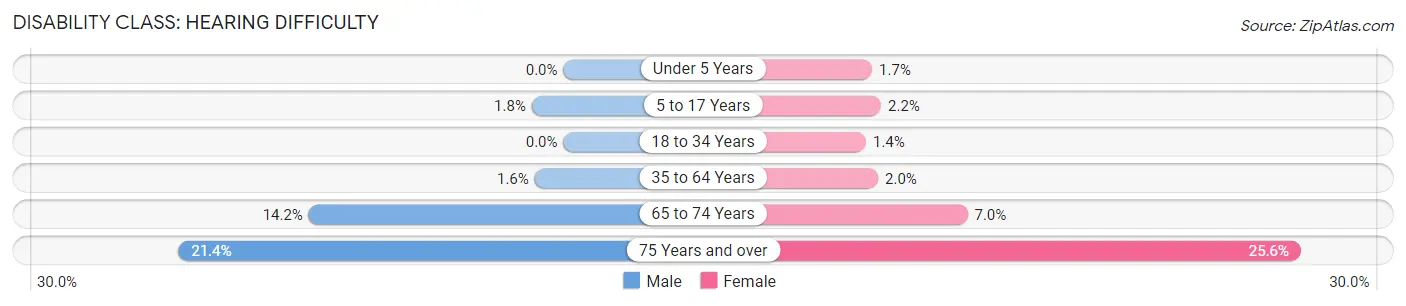
| Age Bracket | Male | Female |
| Under 5 Years | 0 (0.0%) | 9 (1.7%) |
| 5 to 17 Years | 28 (1.8%) | 38 (2.2%) |
| 18 to 34 Years | 0 (0.0%) | 40 (1.3%) |
| 35 to 64 Years | 60 (1.6%) | 82 (2.0%) |
| 65 to 74 Years | 160 (14.2%) | 69 (7.0%) |
| 75 Years and over | 122 (21.4%) | 238 (25.6%) |
Disability Class: Vision Difficulty
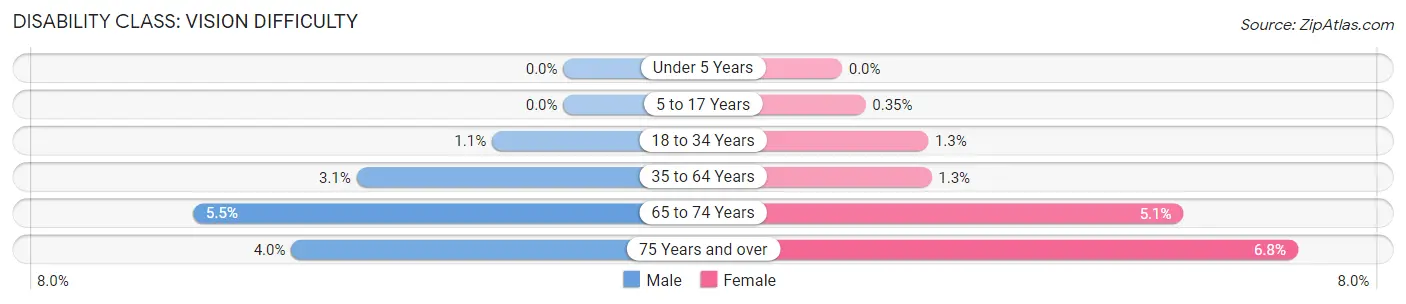
| Age Bracket | Male | Female |
| Under 5 Years | 0 (0.0%) | 0 (0.0%) |
| 5 to 17 Years | 0 (0.0%) | 6 (0.4%) |
| 18 to 34 Years | 33 (1.1%) | 38 (1.3%) |
| 35 to 64 Years | 115 (3.1%) | 54 (1.3%) |
| 65 to 74 Years | 62 (5.5%) | 50 (5.1%) |
| 75 Years and over | 23 (4.0%) | 63 (6.8%) |
Disability Class: Cognitive Difficulty
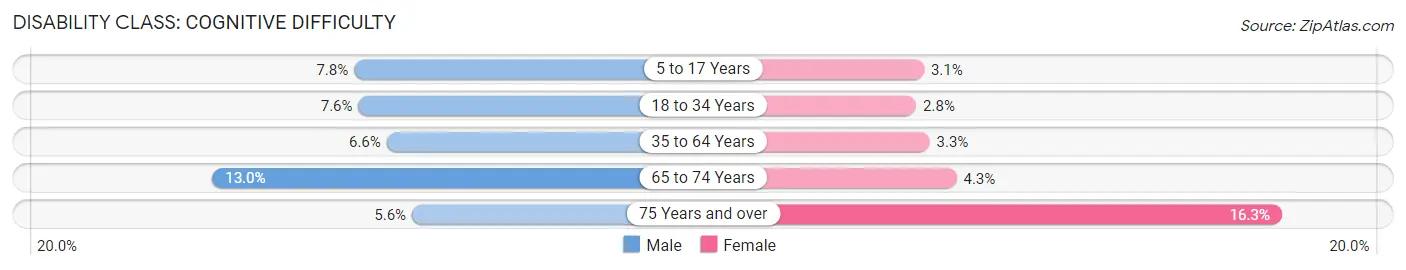
| Age Bracket | Male | Female |
| 5 to 17 Years | 124 (7.8%) | 53 (3.0%) |
| 18 to 34 Years | 237 (7.6%) | 82 (2.8%) |
| 35 to 64 Years | 246 (6.6%) | 132 (3.3%) |
| 65 to 74 Years | 147 (13.0%) | 42 (4.3%) |
| 75 Years and over | 32 (5.6%) | 152 (16.3%) |
Disability Class: Ambulatory Difficulty
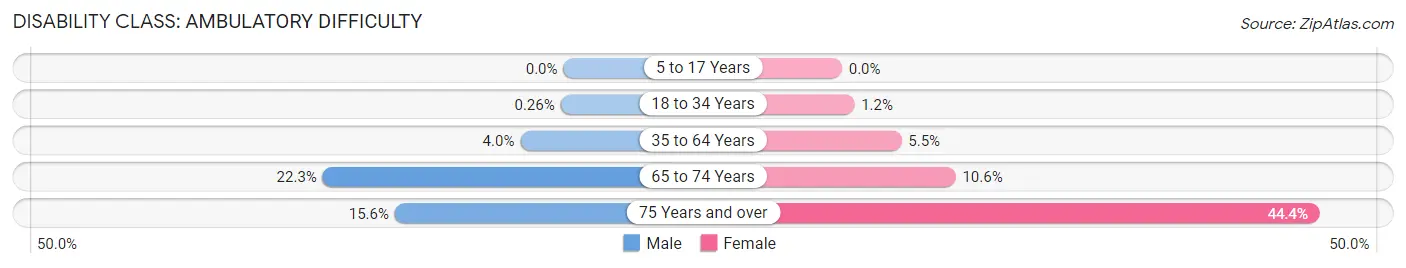
| Age Bracket | Male | Female |
| 5 to 17 Years | 0 (0.0%) | 0 (0.0%) |
| 18 to 34 Years | 8 (0.3%) | 34 (1.1%) |
| 35 to 64 Years | 150 (4.0%) | 224 (5.5%) |
| 65 to 74 Years | 252 (22.3%) | 104 (10.5%) |
| 75 Years and over | 89 (15.6%) | 413 (44.4%) |
Disability Class: Self-Care Difficulty
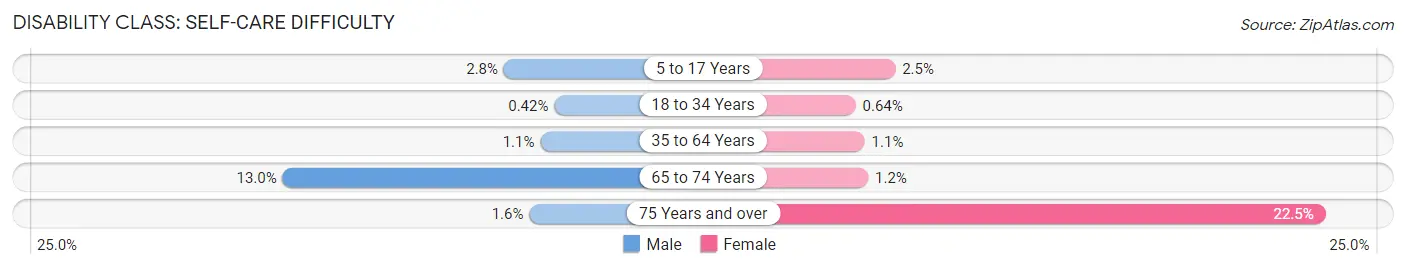
| Age Bracket | Male | Female |
| 5 to 17 Years | 44 (2.8%) | 43 (2.5%) |
| 18 to 34 Years | 13 (0.4%) | 19 (0.6%) |
| 35 to 64 Years | 40 (1.1%) | 43 (1.1%) |
| 65 to 74 Years | 147 (13.0%) | 12 (1.2%) |
| 75 Years and over | 9 (1.6%) | 209 (22.5%) |
Technology Access in Marina
Computing Device Access in Marina
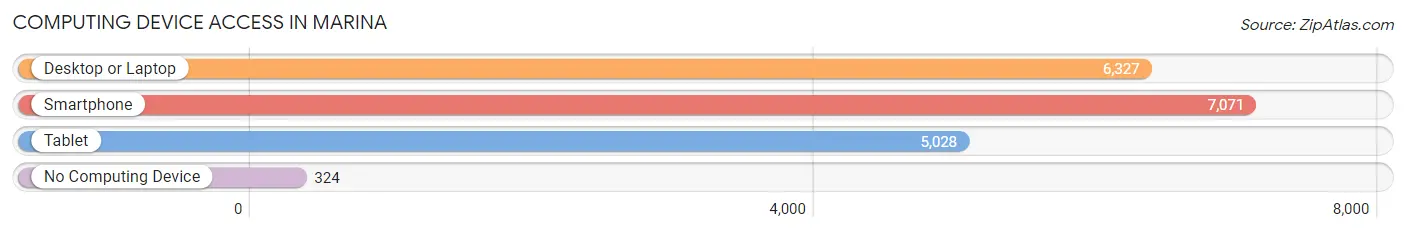
| Device Type | # Households | % Households |
| Desktop or Laptop | 6,327 | 81.1% |
| Smartphone | 7,071 | 90.7% |
| Tablet | 5,028 | 64.5% |
| No Computing Device | 324 | 4.2% |
| Total | 7,797 | 100.0% |
Internet Access in Marina
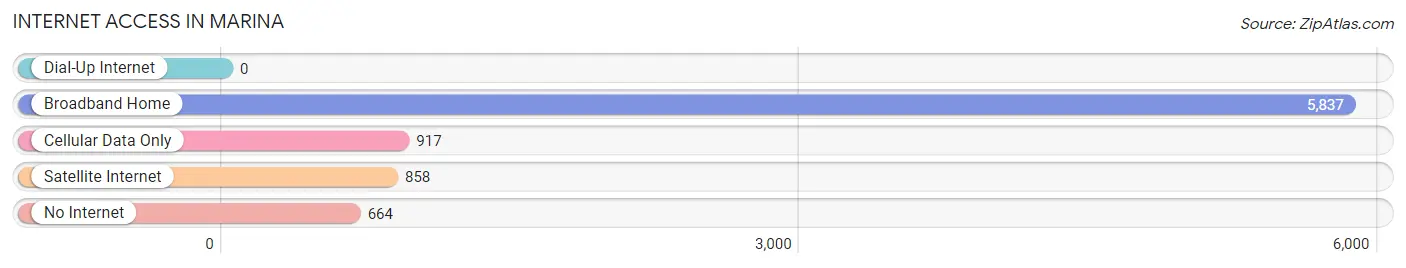
| Internet Type | # Households | % Households |
| Dial-Up Internet | 0 | 0.0% |
| Broadband Home | 5,837 | 74.9% |
| Cellular Data Only | 917 | 11.8% |
| Satellite Internet | 858 | 11.0% |
| No Internet | 664 | 8.5% |
| Total | 7,797 | 100.0% |
Marina Summary
Marina, California is a small city located in Monterey County, California. It is situated on the Monterey Bay, just south of the city of Monterey. The city was incorporated in 1975 and has a population of approximately 20,000 people.
Geography
Marina is located on the Monterey Bay, just south of the city of Monterey. The city is bordered by the Salinas River to the east, the Pacific Ocean to the west, and the Santa Lucia Mountains to the south. The city is located in a temperate climate zone, with mild temperatures year-round. The average annual temperature is around 60°F (15°C). The city is also located in a seismically active area, and is prone to earthquakes.
Economy
Marina’s economy is largely based on tourism and agriculture. The city is home to several tourist attractions, including the Monterey Bay Aquarium, Fisherman’s Wharf, and the Monterey Bay National Marine Sanctuary. The city is also home to several wineries, and is a popular destination for wine tasting. Agriculture is also a major part of the local economy, with the city being home to several farms and ranches.
Demographics
As of the 2010 census, the population of Marina was 20,000 people. The racial makeup of the city was 57.3% White, 1.3% African American, 0.7% Native American, 2.2% Asian, 0.2% Pacific Islander, and 37.5% from other races. The median household income was $50,000, and the median family income was $54,000. The per capita income was $20,000.
Conclusion
Marina, California is a small city located in Monterey County, California. It is situated on the Monterey Bay, just south of the city of Monterey. The city was incorporated in 1975 and has a population of approximately 20,000 people. The city’s economy is largely based on tourism and agriculture, and the city is home to several tourist attractions and wineries. The population of Marina is diverse, with the racial makeup of the city being 57.3% White, 1.3% African American, 0.7% Native American, 2.2% Asian, 0.2% Pacific Islander, and 37.5% from other races. The median household income was $50,000, and the median family income was $54,000. The per capita income was $20,000.
Common Questions
What is Per Capita Income in Marina?
Per Capita income in Marina is $38,806.
What is the Median Family Income in Marina?
Median Family Income in Marina is $96,657.
What is the Median Household income in Marina?
Median Household Income in Marina is $85,783.
What is Income or Wage Gap in Marina?
Income or Wage Gap in Marina is 25.6%.
Women in Marina earn 74.4 cents for every dollar earned by a man.
What is Family Income Deficit in Marina?
Family Income Deficit in Marina is $12,564.
Families that are below poverty line in Marina earn $12,564 less on average than the poverty threshold level.
What is Inequality or Gini Index in Marina?
Inequality or Gini Index in Marina is 0.44.
What is the Total Population of Marina?
Total Population of Marina is 22,253.
What is the Total Male Population of Marina?
Total Male Population of Marina is 11,040.
What is the Total Female Population of Marina?
Total Female Population of Marina is 11,213.
What is the Ratio of Males per 100 Females in Marina?
There are 98.46 Males per 100 Females in Marina.
What is the Ratio of Females per 100 Males in Marina?
There are 101.57 Females per 100 Males in Marina.
What is the Median Population Age in Marina?
Median Population Age in Marina is 36.0 Years.
What is the Average Family Size in Marina
Average Family Size in Marina is 3.2 People.
What is the Average Household Size in Marina
Average Household Size in Marina is 2.7 People.
How Large is the Labor Force in Marina?
There are 12,079 People in the Labor Forcein in Marina.
What is the Percentage of People in the Labor Force in Marina?
67.0% of People are in the Labor Force in Marina.
What is the Unemployment Rate in Marina?
Unemployment Rate in Marina is 5.9%.