Santa Barbara, CA Map & Demographics
Santa Barbara Map
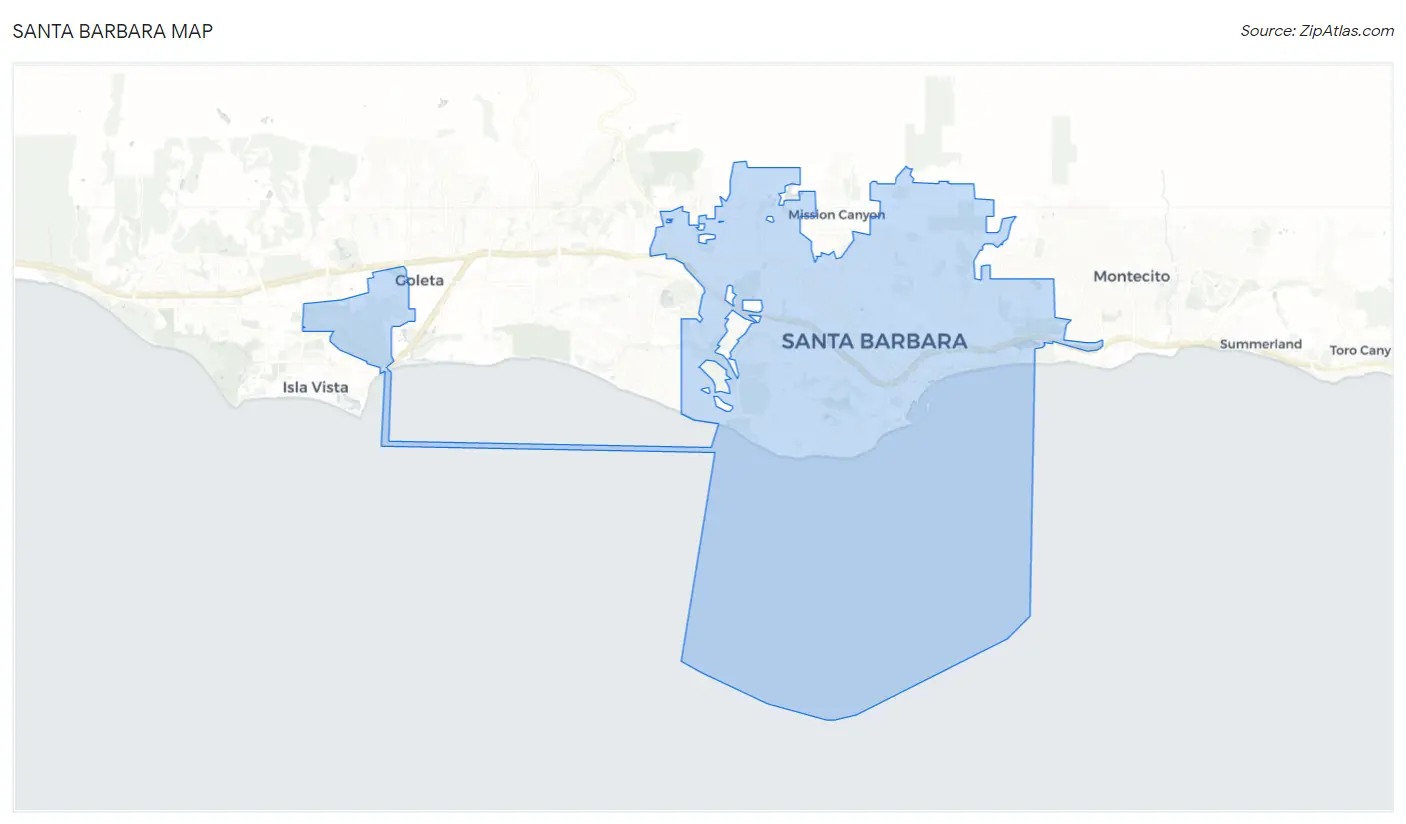
Santa Barbara Overview
$58,989
PER CAPITA INCOME
$132,500
AVG FAMILY INCOME
$98,346
AVG HOUSEHOLD INCOME
22.7%
WAGE / INCOME GAP [ % ]
77.3¢/ $1
WAGE / INCOME GAP [ $ ]
$9,957
FAMILY INCOME DEFICIT
0.49
INEQUALITY / GINI INDEX
88,640
TOTAL POPULATION
43,886
MALE POPULATION
44,754
FEMALE POPULATION
98.06
MALES / 100 FEMALES
101.98
FEMALES / 100 MALES
39.6
MEDIAN AGE
3.0
AVG FAMILY SIZE
2.4
AVG HOUSEHOLD SIZE
48,990
LABOR FORCE [ PEOPLE ]
64.9%
PERCENT IN LABOR FORCE
4.4%
UNEMPLOYMENT RATE
Santa Barbara Area Codes
Income in Santa Barbara
Income Overview in Santa Barbara
Per Capita Income in Santa Barbara is $58,989, while median incomes of families and households are $132,500 and $98,346 respectively.
| Characteristic | Number | Measure |
| Per Capita Income | 88,640 | $58,989 |
| Median Family Income | 19,444 | $132,500 |
| Mean Family Income | 19,444 | $174,073 |
| Median Household Income | 36,233 | $98,346 |
| Mean Household Income | 36,233 | $144,135 |
| Income Deficit | 19,444 | $9,957 |
| Wage / Income Gap (%) | 88,640 | 22.71% |
| Wage / Income Gap ($) | 88,640 | 77.29¢ per $1 |
| Gini / Inequality Index | 88,640 | 0.49 |
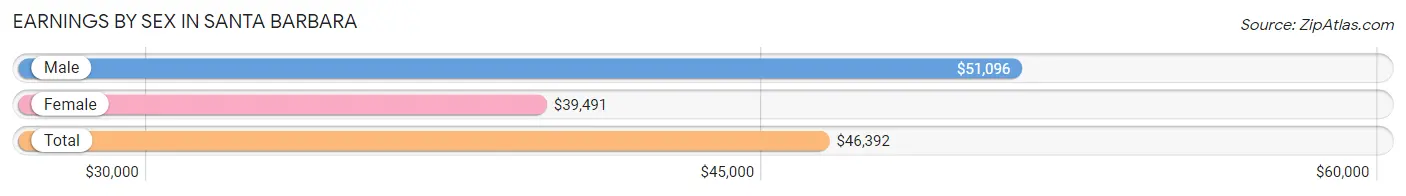
Earnings by Sex in Santa Barbara
Average Earnings in Santa Barbara are $46,392, $51,096 for men and $39,491 for women, a difference of 22.7%.
| Sex | Number | Average Earnings |
| Male | 27,465 (53.1%) | $51,096 |
| Female | 24,238 (46.9%) | $39,491 |
| Total | 51,703 (100.0%) | $46,392 |
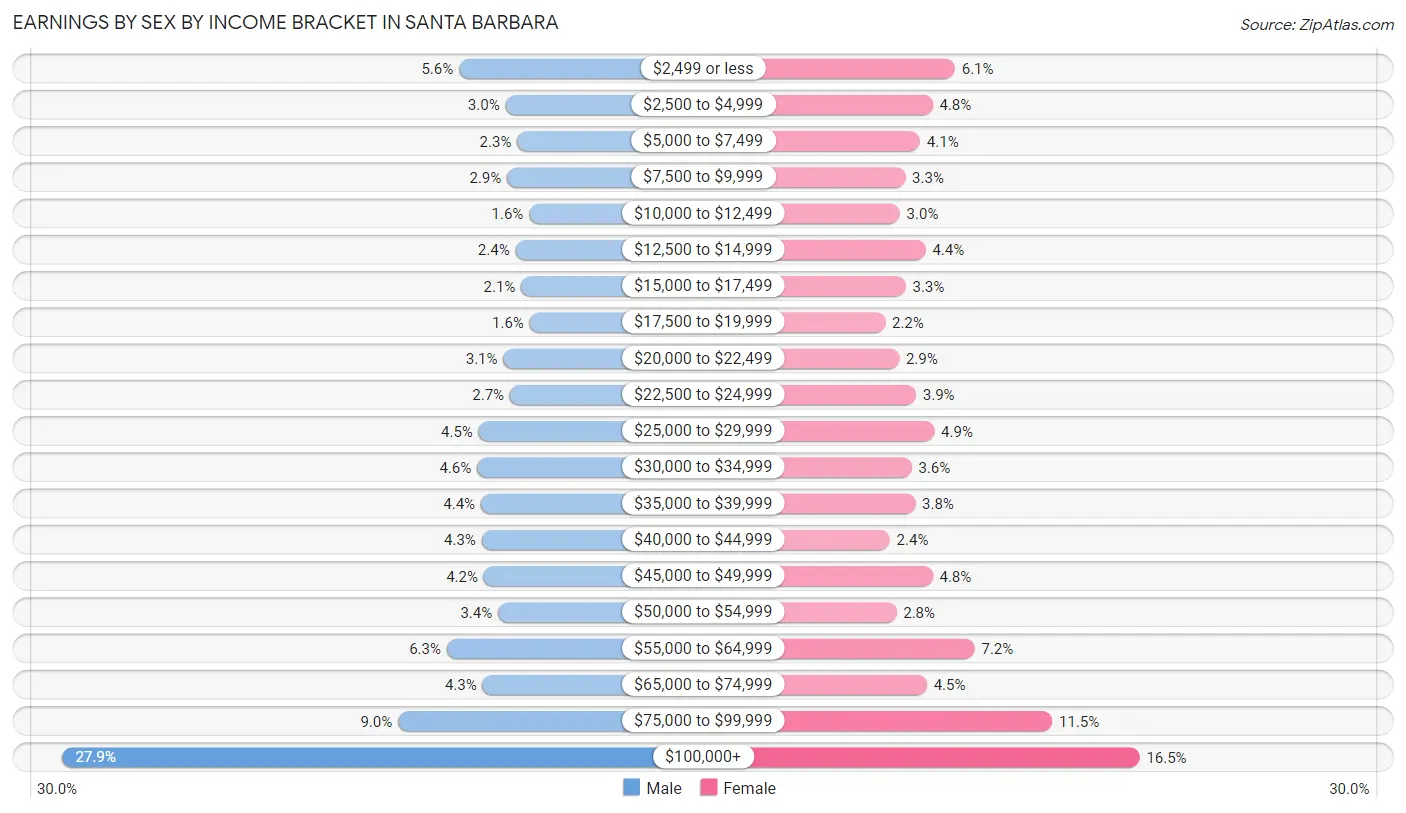
Earnings by Sex by Income Bracket in Santa Barbara
The most common earnings brackets in Santa Barbara are $100,000+ for men (7,654 | 27.9%) and $100,000+ for women (3,986 | 16.5%).
| Income | Male | Female |
| $2,499 or less | 1,533 (5.6%) | 1,472 (6.1%) |
| $2,500 to $4,999 | 815 (3.0%) | 1,168 (4.8%) |
| $5,000 to $7,499 | 635 (2.3%) | 995 (4.1%) |
| $7,500 to $9,999 | 791 (2.9%) | 796 (3.3%) |
| $10,000 to $12,499 | 451 (1.6%) | 721 (3.0%) |
| $12,500 to $14,999 | 661 (2.4%) | 1,072 (4.4%) |
| $15,000 to $17,499 | 575 (2.1%) | 799 (3.3%) |
| $17,500 to $19,999 | 442 (1.6%) | 521 (2.1%) |
| $20,000 to $22,499 | 848 (3.1%) | 710 (2.9%) |
| $22,500 to $24,999 | 748 (2.7%) | 941 (3.9%) |
| $25,000 to $29,999 | 1,230 (4.5%) | 1,191 (4.9%) |
| $30,000 to $34,999 | 1,255 (4.6%) | 883 (3.6%) |
| $35,000 to $39,999 | 1,196 (4.3%) | 930 (3.8%) |
| $40,000 to $44,999 | 1,183 (4.3%) | 583 (2.4%) |
| $45,000 to $49,999 | 1,152 (4.2%) | 1,168 (4.8%) |
| $50,000 to $54,999 | 930 (3.4%) | 675 (2.8%) |
| $55,000 to $64,999 | 1,721 (6.3%) | 1,740 (7.2%) |
| $65,000 to $74,999 | 1,171 (4.3%) | 1,089 (4.5%) |
| $75,000 to $99,999 | 2,474 (9.0%) | 2,798 (11.5%) |
| $100,000+ | 7,654 (27.9%) | 3,986 (16.5%) |
| Total | 27,465 (100.0%) | 24,238 (100.0%) |
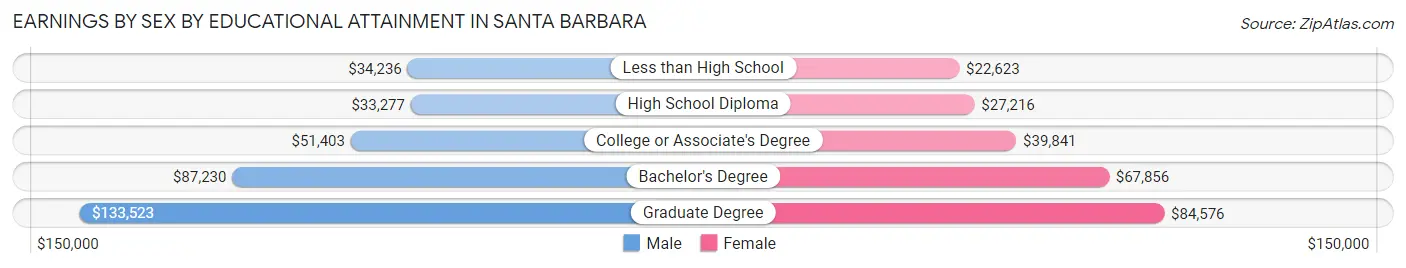
Earnings by Sex by Educational Attainment in Santa Barbara
Average earnings in Santa Barbara are $61,722 for men and $52,578 for women, a difference of 14.8%. Men with an educational attainment of graduate degree enjoy the highest average annual earnings of $133,523, while those with high school diploma education earn the least with $33,277. Women with an educational attainment of graduate degree earn the most with the average annual earnings of $84,576, while those with less than high school education have the smallest earnings of $22,623.
| Educational Attainment | Male Income | Female Income |
| Less than High School | $34,236 | $22,623 |
| High School Diploma | $33,277 | $27,216 |
| College or Associate's Degree | $51,403 | $39,841 |
| Bachelor's Degree | $87,230 | $67,856 |
| Graduate Degree | $133,523 | $84,576 |
| Total | $61,722 | $52,578 |
Family Income in Santa Barbara
Family Income Brackets in Santa Barbara
According to the Santa Barbara family income data, there are 6,008 families falling into the $200,000+ income range, which is the most common income bracket and makes up 30.9% of all families. Conversely, the $10,000 to $14,999 income bracket is the least frequent group with only 136 families (0.7%) belonging to this category.
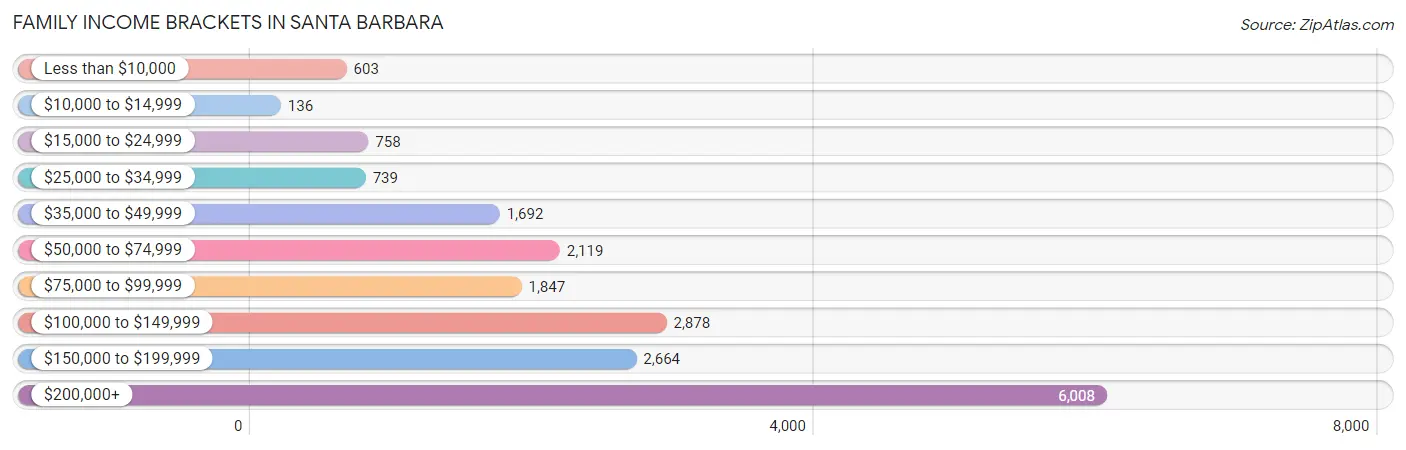
| Income Bracket | # Families | % Families |
| Less than $10,000 | 603 | 3.1% |
| $10,000 to $14,999 | 136 | 0.7% |
| $15,000 to $24,999 | 758 | 3.9% |
| $25,000 to $34,999 | 739 | 3.8% |
| $35,000 to $49,999 | 1,692 | 8.7% |
| $50,000 to $74,999 | 2,119 | 10.9% |
| $75,000 to $99,999 | 1,847 | 9.5% |
| $100,000 to $149,999 | 2,878 | 14.8% |
| $150,000 to $199,999 | 2,664 | 13.7% |
| $200,000+ | 6,008 | 30.9% |
Family Income by Famaliy Size in Santa Barbara
2-person families (10,199 | 52.4%) account for the highest median family income in Santa Barbara with $138,091 per family, while 2-person families (10,199 | 52.4%) have the highest median income of $69,046 per family member.
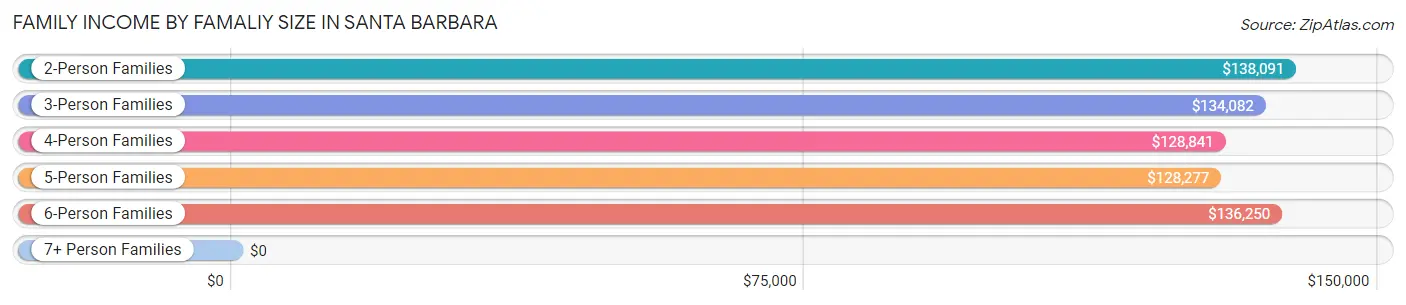
| Income Bracket | # Families | Median Income |
| 2-Person Families | 10,199 (52.4%) | $138,091 |
| 3-Person Families | 3,713 (19.1%) | $134,082 |
| 4-Person Families | 3,136 (16.1%) | $128,841 |
| 5-Person Families | 1,650 (8.5%) | $128,277 |
| 6-Person Families | 546 (2.8%) | $136,250 |
| 7+ Person Families | 200 (1.0%) | $0 |
| Total | 19,444 (100.0%) | $132,500 |
Family Income by Number of Earners in Santa Barbara
The median family income in Santa Barbara is $132,500, with families comprising 2 earners (7,873) having the highest median family income of $160,874, while families with no earners (2,823) have the lowest median family income of $84,561, accounting for 40.5% and 14.5% of families, respectively.
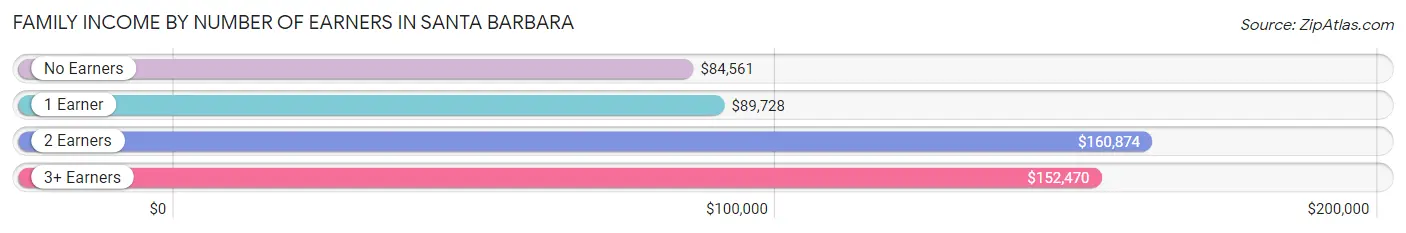
| Number of Earners | # Families | Median Income |
| No Earners | 2,823 (14.5%) | $84,561 |
| 1 Earner | 6,191 (31.8%) | $89,728 |
| 2 Earners | 7,873 (40.5%) | $160,874 |
| 3+ Earners | 2,557 (13.2%) | $152,470 |
| Total | 19,444 (100.0%) | $132,500 |
Household Income in Santa Barbara
Household Income Brackets in Santa Barbara
With 8,334 households falling in the category, the $200,000+ income range is the most frequent in Santa Barbara, accounting for 23.0% of all households. In contrast, only 942 households (2.6%) fall into the $10,000 to $14,999 income bracket, making it the least populous group.
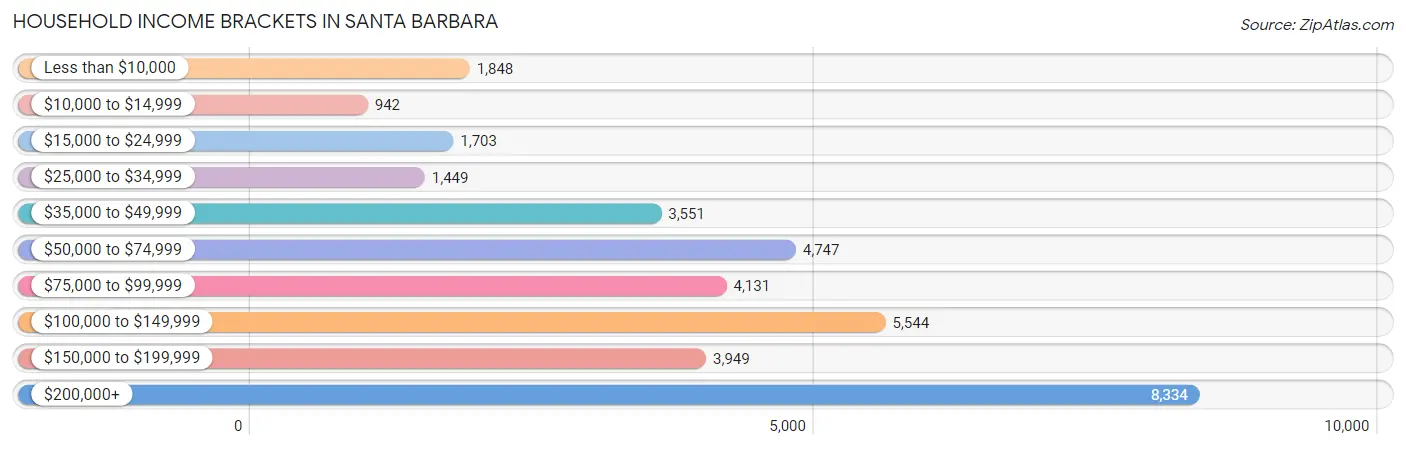
| Income Bracket | # Households | % Households |
| Less than $10,000 | 1,848 | 5.1% |
| $10,000 to $14,999 | 942 | 2.6% |
| $15,000 to $24,999 | 1,703 | 4.7% |
| $25,000 to $34,999 | 1,449 | 4.0% |
| $35,000 to $49,999 | 3,551 | 9.8% |
| $50,000 to $74,999 | 4,747 | 13.1% |
| $75,000 to $99,999 | 4,131 | 11.4% |
| $100,000 to $149,999 | 5,544 | 15.3% |
| $150,000 to $199,999 | 3,949 | 10.9% |
| $200,000+ | 8,334 | 23.0% |
Household Income by Householder Age in Santa Barbara
The median household income in Santa Barbara is $98,346, with the highest median household income of $131,021 found in the 45 to 64 years age bracket for the primary householder. A total of 11,843 households (32.7%) fall into this category. Meanwhile, the 15 to 24 years age bracket for the primary householder has the lowest median household income of $47,895, with 2,039 households (5.6%) in this group.
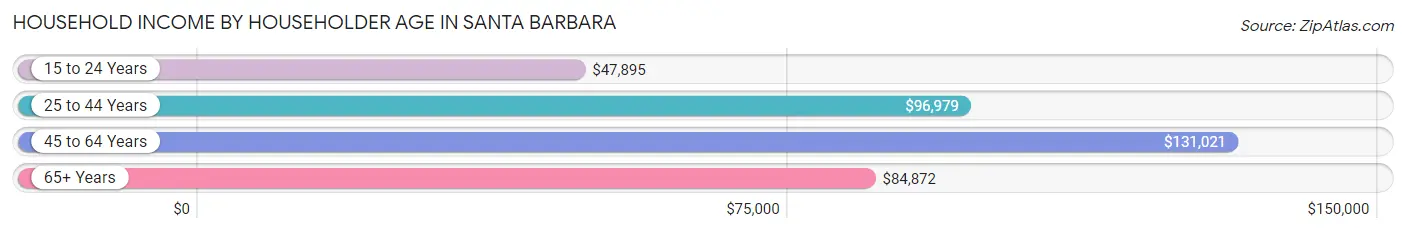
| Income Bracket | # Households | Median Income |
| 15 to 24 Years | 2,039 (5.6%) | $47,895 |
| 25 to 44 Years | 11,420 (31.5%) | $96,979 |
| 45 to 64 Years | 11,843 (32.7%) | $131,021 |
| 65+ Years | 10,931 (30.2%) | $84,872 |
| Total | 36,233 (100.0%) | $98,346 |
Poverty in Santa Barbara
Income Below Poverty by Sex and Age in Santa Barbara
With 10.3% poverty level for males and 15.7% for females among the residents of Santa Barbara, 18 to 24 year old males and 18 to 24 year old females are the most vulnerable to poverty, with 1,243 males (25.8%) and 2,358 females (42.4%) in their respective age groups living below the poverty level.
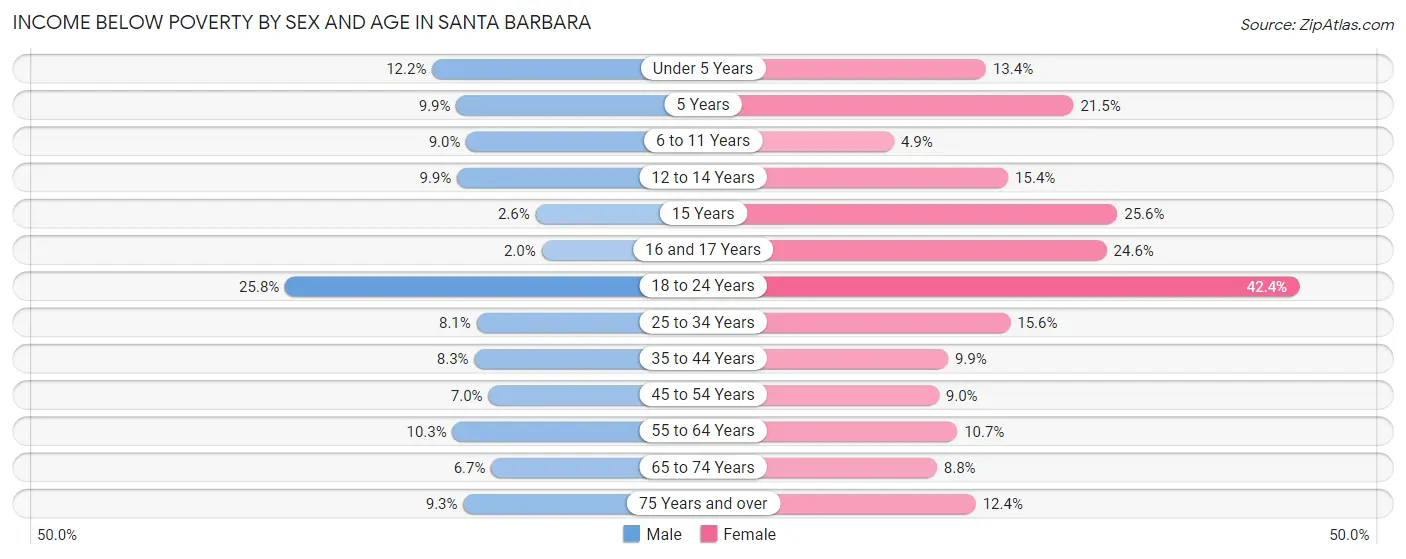
| Age Bracket | Male | Female |
| Under 5 Years | 280 (12.2%) | 242 (13.4%) |
| 5 Years | 44 (9.9%) | 86 (21.5%) |
| 6 to 11 Years | 203 (9.0%) | 91 (4.9%) |
| 12 to 14 Years | 118 (9.9%) | 214 (15.4%) |
| 15 Years | 13 (2.6%) | 123 (25.6%) |
| 16 and 17 Years | 18 (2.0%) | 204 (24.6%) |
| 18 to 24 Years | 1,243 (25.8%) | 2,358 (42.4%) |
| 25 to 34 Years | 585 (8.1%) | 1,100 (15.6%) |
| 35 to 44 Years | 436 (8.3%) | 488 (9.9%) |
| 45 to 54 Years | 360 (7.0%) | 414 (9.0%) |
| 55 to 64 Years | 570 (10.3%) | 625 (10.7%) |
| 65 to 74 Years | 311 (6.7%) | 459 (8.8%) |
| 75 Years and over | 279 (9.3%) | 530 (12.4%) |
| Total | 4,460 (10.3%) | 6,934 (15.7%) |
Income Above Poverty by Sex and Age in Santa Barbara
According to the poverty statistics in Santa Barbara, males aged 16 and 17 years and females aged 6 to 11 years are the age groups that are most secure financially, with 98.0% of males and 95.2% of females in these age groups living above the poverty line.
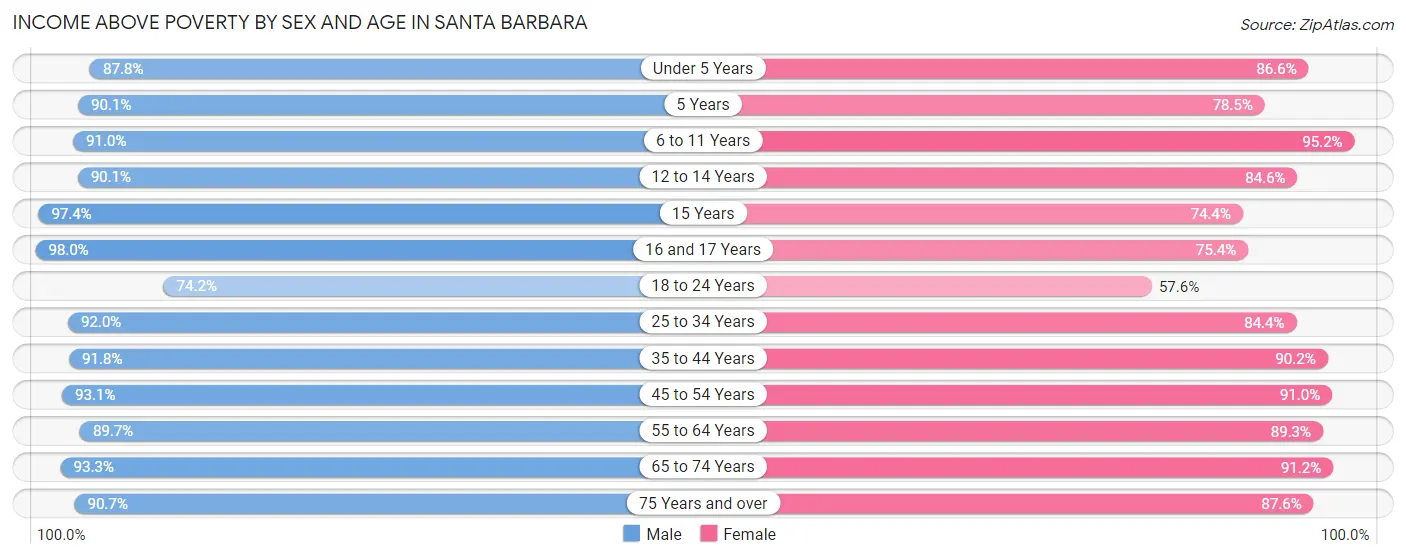
| Age Bracket | Male | Female |
| Under 5 Years | 2,021 (87.8%) | 1,567 (86.6%) |
| 5 Years | 399 (90.1%) | 314 (78.5%) |
| 6 to 11 Years | 2,051 (91.0%) | 1,784 (95.2%) |
| 12 to 14 Years | 1,079 (90.1%) | 1,172 (84.6%) |
| 15 Years | 491 (97.4%) | 358 (74.4%) |
| 16 and 17 Years | 874 (98.0%) | 626 (75.4%) |
| 18 to 24 Years | 3,571 (74.2%) | 3,201 (57.6%) |
| 25 to 34 Years | 6,682 (91.9%) | 5,935 (84.4%) |
| 35 to 44 Years | 4,850 (91.7%) | 4,464 (90.1%) |
| 45 to 54 Years | 4,818 (93.0%) | 4,181 (91.0%) |
| 55 to 64 Years | 4,976 (89.7%) | 5,210 (89.3%) |
| 65 to 74 Years | 4,341 (93.3%) | 4,744 (91.2%) |
| 75 Years and over | 2,728 (90.7%) | 3,735 (87.6%) |
| Total | 38,881 (89.7%) | 37,291 (84.3%) |
Income Below Poverty Among Married-Couple Families in Santa Barbara
The poverty statistics for married-couple families in Santa Barbara show that 3.7% or 517 of the total 14,108 families live below the poverty line. Families with 5 or more children have the highest poverty rate of 8.0%, comprising of 2 families. On the other hand, families with no children have the lowest poverty rate of 3.4%, which includes 314 families.
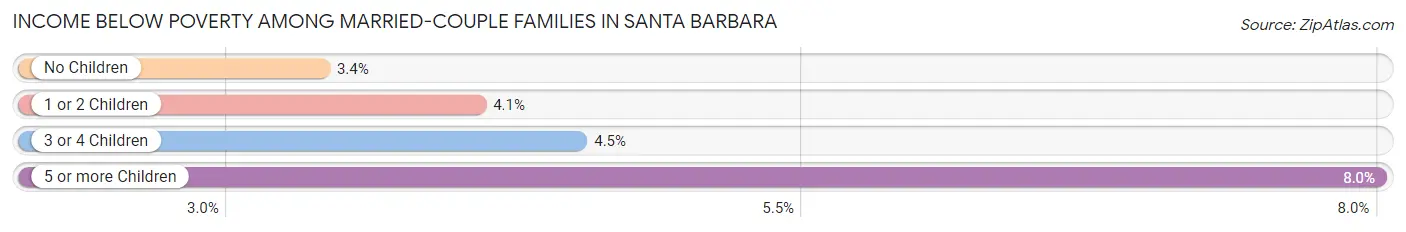
| Children | Above Poverty | Below Poverty |
| No Children | 8,922 (96.6%) | 314 (3.4%) |
| 1 or 2 Children | 3,927 (95.9%) | 167 (4.1%) |
| 3 or 4 Children | 719 (95.5%) | 34 (4.5%) |
| 5 or more Children | 23 (92.0%) | 2 (8.0%) |
| Total | 13,591 (96.3%) | 517 (3.7%) |
Income Below Poverty Among Single-Parent Households in Santa Barbara
According to the poverty data in Santa Barbara, 6.0% or 123 single-father households and 24.4% or 799 single-mother households are living below the poverty line. Among single-father households, those with no children have the highest poverty rate, with 81 households (10.2%) experiencing poverty. Likewise, among single-mother households, those with 1 or 2 children have the highest poverty rate, with 591 households (36.3%) falling below the poverty line.
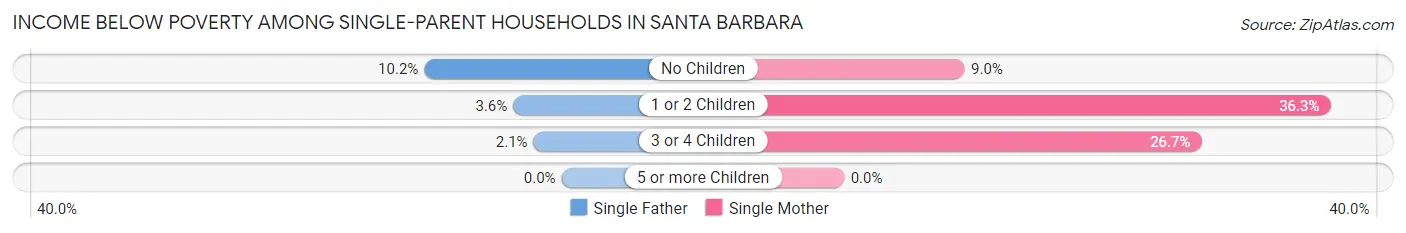
| Children | Single Father | Single Mother |
| No Children | 81 (10.2%) | 118 (9.0%) |
| 1 or 2 Children | 37 (3.6%) | 591 (36.3%) |
| 3 or 4 Children | 5 (2.1%) | 90 (26.7%) |
| 5 or more Children | 0 (0.0%) | 0 (0.0%) |
| Total | 123 (6.0%) | 799 (24.4%) |
Income Below Poverty Among Married-Couple vs Single-Parent Households in Santa Barbara
The poverty data for Santa Barbara shows that 517 of the married-couple family households (3.7%) and 922 of the single-parent households (17.3%) are living below the poverty level. Within the married-couple family households, those with 5 or more children have the highest poverty rate, with 2 households (8.0%) falling below the poverty line. Among the single-parent households, those with 1 or 2 children have the highest poverty rate, with 628 household (23.7%) living below poverty.
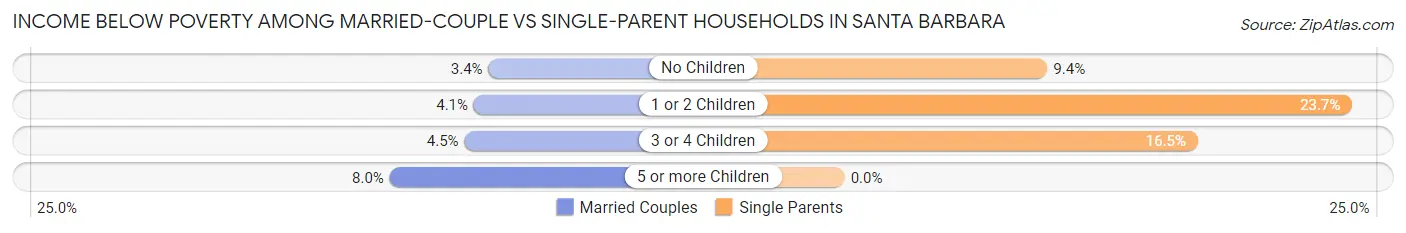
| Children | Married-Couple Families | Single-Parent Households |
| No Children | 314 (3.4%) | 199 (9.4%) |
| 1 or 2 Children | 167 (4.1%) | 628 (23.7%) |
| 3 or 4 Children | 34 (4.5%) | 95 (16.5%) |
| 5 or more Children | 2 (8.0%) | 0 (0.0%) |
| Total | 517 (3.7%) | 922 (17.3%) |
Race in Santa Barbara
The most populous races in Santa Barbara are White / Caucasian (60,429 | 68.2%), Hispanic or Latino (32,005 | 36.1%), and Some other Race (11,581 | 13.1%).
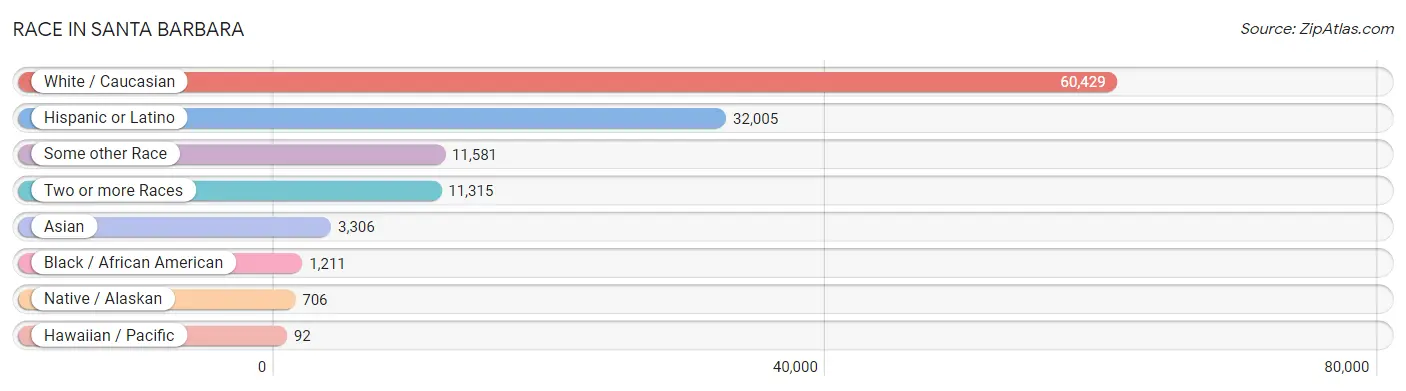
| Race | # Population | % Population |
| Asian | 3,306 | 3.7% |
| Black / African American | 1,211 | 1.4% |
| Hawaiian / Pacific | 92 | 0.1% |
| Hispanic or Latino | 32,005 | 36.1% |
| Native / Alaskan | 706 | 0.8% |
| White / Caucasian | 60,429 | 68.2% |
| Two or more Races | 11,315 | 12.8% |
| Some other Race | 11,581 | 13.1% |
| Total | 88,640 | 100.0% |
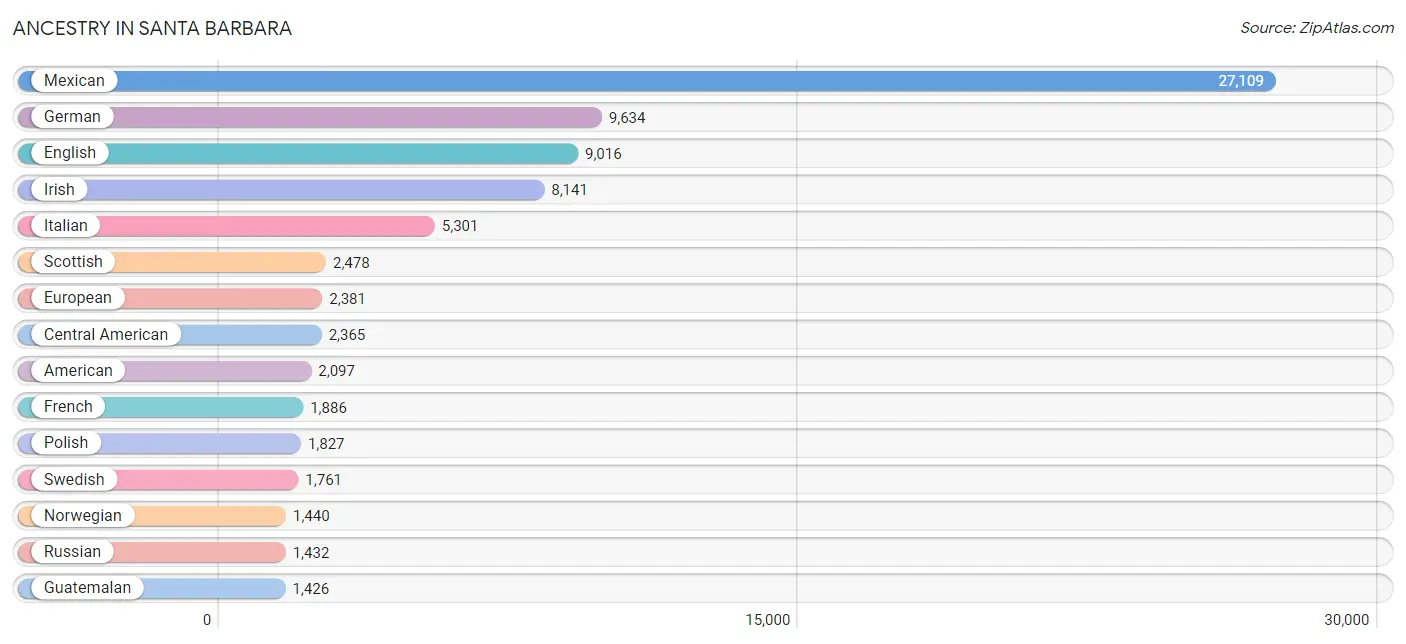
Ancestry in Santa Barbara
The most populous ancestries reported in Santa Barbara are Mexican (27,109 | 30.6%), German (9,634 | 10.9%), English (9,016 | 10.2%), Irish (8,141 | 9.2%), and Italian (5,301 | 6.0%), together accounting for 66.8% of all Santa Barbara residents.
| Ancestry | # Population | % Population |
| Afghan | 79 | 0.1% |
| African | 129 | 0.2% |
| American | 2,097 | 2.4% |
| Apache | 191 | 0.2% |
| Arab | 664 | 0.7% |
| Argentinean | 220 | 0.3% |
| Armenian | 199 | 0.2% |
| Australian | 23 | 0.0% |
| Austrian | 145 | 0.2% |
| Bahamian | 5 | 0.0% |
| Bangladeshi | 10 | 0.0% |
| Basque | 106 | 0.1% |
| Belgian | 135 | 0.2% |
| Belizean | 10 | 0.0% |
| Bhutanese | 553 | 0.6% |
| Blackfeet | 8 | 0.0% |
| Brazilian | 141 | 0.2% |
| British | 1,297 | 1.5% |
| Bulgarian | 247 | 0.3% |
| Burmese | 480 | 0.5% |
| Canadian | 258 | 0.3% |
| Carpatho Rusyn | 16 | 0.0% |
| Celtic | 8 | 0.0% |
| Central American | 2,365 | 2.7% |
| Central American Indian | 93 | 0.1% |
| Cherokee | 57 | 0.1% |
| Chilean | 62 | 0.1% |
| Chippewa | 23 | 0.0% |
| Choctaw | 10 | 0.0% |
| Colombian | 176 | 0.2% |
| Costa Rican | 41 | 0.1% |
| Creek | 25 | 0.0% |
| Croatian | 106 | 0.1% |
| Cuban | 119 | 0.1% |
| Czech | 349 | 0.4% |
| Czechoslovakian | 116 | 0.1% |
| Danish | 755 | 0.9% |
| Dominican | 29 | 0.0% |
| Dutch | 1,006 | 1.1% |
| Eastern European | 296 | 0.3% |
| Ecuadorian | 78 | 0.1% |
| Egyptian | 188 | 0.2% |
| English | 9,016 | 10.2% |
| Ethiopian | 85 | 0.1% |
| European | 2,381 | 2.7% |
| Filipino | 121 | 0.1% |
| Finnish | 138 | 0.2% |
| French | 1,886 | 2.1% |
| French Canadian | 232 | 0.3% |
| German | 9,634 | 10.9% |
| Greek | 466 | 0.5% |
| Guamanian / Chamorro | 13 | 0.0% |
| Guatemalan | 1,426 | 1.6% |
| Haitian | 24 | 0.0% |
| Honduran | 83 | 0.1% |
| Hungarian | 376 | 0.4% |
| Indian (Asian) | 898 | 1.0% |
| Indonesian | 1 | 0.0% |
| Iranian | 554 | 0.6% |
| Irish | 8,141 | 9.2% |
| Iroquois | 4 | 0.0% |
| Israeli | 120 | 0.1% |
| Italian | 5,301 | 6.0% |
| Jamaican | 30 | 0.0% |
| Japanese | 270 | 0.3% |
| Korean | 1,003 | 1.1% |
| Laotian | 84 | 0.1% |
| Latvian | 30 | 0.0% |
| Lebanese | 163 | 0.2% |
| Lithuanian | 132 | 0.2% |
| Macedonian | 29 | 0.0% |
| Mexican | 27,109 | 30.6% |
| Mexican American Indian | 373 | 0.4% |
| Moroccan | 8 | 0.0% |
| Native Hawaiian | 158 | 0.2% |
| Navajo | 21 | 0.0% |
| New Zealander | 8 | 0.0% |
| Nicaraguan | 106 | 0.1% |
| Northern European | 315 | 0.4% |
| Norwegian | 1,440 | 1.6% |
| Okinawan | 26 | 0.0% |
| Paiute | 20 | 0.0% |
| Pakistani | 116 | 0.1% |
| Palestinian | 16 | 0.0% |
| Peruvian | 165 | 0.2% |
| Polish | 1,827 | 2.1% |
| Portuguese | 340 | 0.4% |
| Potawatomi | 30 | 0.0% |
| Puerto Rican | 224 | 0.3% |
| Romanian | 86 | 0.1% |
| Russian | 1,432 | 1.6% |
| Salvadoran | 709 | 0.8% |
| Samoan | 17 | 0.0% |
| Scandinavian | 473 | 0.5% |
| Scotch-Irish | 1,135 | 1.3% |
| Scottish | 2,478 | 2.8% |
| Serbian | 9 | 0.0% |
| Sioux | 45 | 0.1% |
| Slovak | 75 | 0.1% |
| Slovene | 27 | 0.0% |
| South African | 72 | 0.1% |
| South American | 804 | 0.9% |
| South American Indian | 29 | 0.0% |
| Spaniard | 405 | 0.5% |
| Spanish | 499 | 0.6% |
| Sri Lankan | 519 | 0.6% |
| Subsaharan African | 333 | 0.4% |
| Swedish | 1,761 | 2.0% |
| Swiss | 467 | 0.5% |
| Syrian | 13 | 0.0% |
| Thai | 626 | 0.7% |
| Trinidadian and Tobagonian | 36 | 0.0% |
| Turkish | 121 | 0.1% |
| Ukrainian | 232 | 0.3% |
| Uruguayan | 9 | 0.0% |
| Welsh | 633 | 0.7% |
| Yaqui | 70 | 0.1% |
| Yugoslavian | 66 | 0.1% |
| Zimbabwean | 13 | 0.0% | View All 119 Rows |
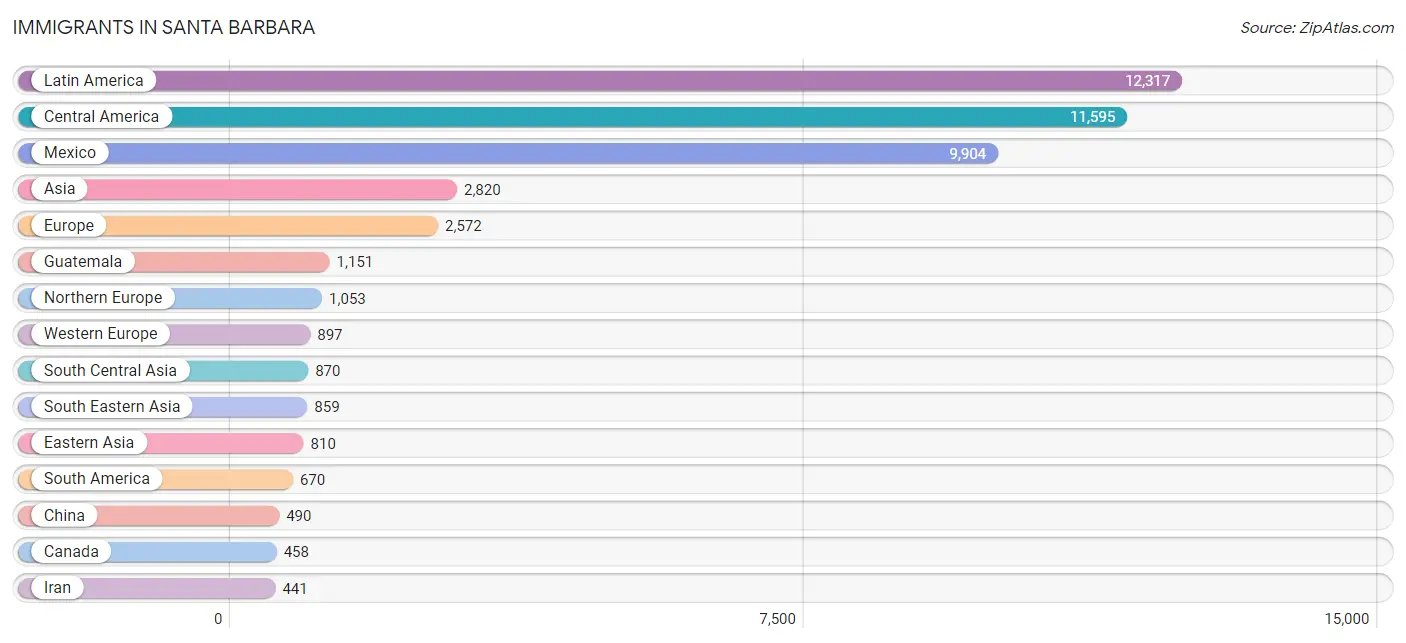
Immigrants in Santa Barbara
The most numerous immigrant groups reported in Santa Barbara came from Latin America (12,317 | 13.9%), Central America (11,595 | 13.1%), Mexico (9,904 | 11.2%), Asia (2,820 | 3.2%), and Europe (2,572 | 2.9%), together accounting for 44.2% of all Santa Barbara residents.
| Immigration Origin | # Population | % Population |
| Africa | 347 | 0.4% |
| Argentina | 237 | 0.3% |
| Asia | 2,820 | 3.2% |
| Australia | 157 | 0.2% |
| Austria | 56 | 0.1% |
| Bangladesh | 17 | 0.0% |
| Belgium | 31 | 0.0% |
| Belize | 9 | 0.0% |
| Brazil | 182 | 0.2% |
| Bulgaria | 49 | 0.1% |
| Cambodia | 149 | 0.2% |
| Canada | 458 | 0.5% |
| Caribbean | 52 | 0.1% |
| Central America | 11,595 | 13.1% |
| Chile | 8 | 0.0% |
| China | 490 | 0.5% |
| Colombia | 64 | 0.1% |
| Costa Rica | 23 | 0.0% |
| Croatia | 13 | 0.0% |
| Cuba | 35 | 0.0% |
| Czechoslovakia | 28 | 0.0% |
| Denmark | 32 | 0.0% |
| Dominican Republic | 14 | 0.0% |
| Eastern Africa | 182 | 0.2% |
| Eastern Asia | 810 | 0.9% |
| Eastern Europe | 331 | 0.4% |
| Ecuador | 40 | 0.1% |
| Egypt | 26 | 0.0% |
| El Salvador | 351 | 0.4% |
| England | 437 | 0.5% |
| Eritrea | 1 | 0.0% |
| Ethiopia | 101 | 0.1% |
| Europe | 2,572 | 2.9% |
| France | 344 | 0.4% |
| Germany | 362 | 0.4% |
| Guatemala | 1,151 | 1.3% |
| Honduras | 83 | 0.1% |
| Hong Kong | 12 | 0.0% |
| India | 313 | 0.4% |
| Indonesia | 38 | 0.0% |
| Iran | 441 | 0.5% |
| Iraq | 65 | 0.1% |
| Israel | 100 | 0.1% |
| Italy | 276 | 0.3% |
| Japan | 178 | 0.2% |
| Jordan | 22 | 0.0% |
| Kazakhstan | 31 | 0.0% |
| Kenya | 28 | 0.0% |
| Korea | 142 | 0.2% |
| Kuwait | 15 | 0.0% |
| Latin America | 12,317 | 13.9% |
| Lebanon | 27 | 0.0% |
| Mexico | 9,904 | 11.2% |
| Middle Africa | 9 | 0.0% |
| Netherlands | 21 | 0.0% |
| Nicaragua | 28 | 0.0% |
| North Macedonia | 5 | 0.0% |
| Northern Africa | 26 | 0.0% |
| Northern Europe | 1,053 | 1.2% |
| Norway | 31 | 0.0% |
| Oceania | 165 | 0.2% |
| Pakistan | 9 | 0.0% |
| Peru | 103 | 0.1% |
| Philippines | 284 | 0.3% |
| Poland | 55 | 0.1% |
| Russia | 137 | 0.2% |
| Saudi Arabia | 19 | 0.0% |
| Scotland | 10 | 0.0% |
| South Africa | 117 | 0.1% |
| South America | 670 | 0.8% |
| South Central Asia | 870 | 1.0% |
| South Eastern Asia | 859 | 1.0% |
| Southern Europe | 291 | 0.3% |
| Spain | 15 | 0.0% |
| Sri Lanka | 11 | 0.0% |
| Sweden | 273 | 0.3% |
| Switzerland | 83 | 0.1% |
| Taiwan | 128 | 0.1% |
| Thailand | 29 | 0.0% |
| Turkey | 33 | 0.0% |
| Ukraine | 24 | 0.0% |
| Venezuela | 30 | 0.0% |
| Vietnam | 358 | 0.4% |
| Western Asia | 281 | 0.3% |
| Western Europe | 897 | 1.0% |
| Zaire | 9 | 0.0% |
| Zimbabwe | 13 | 0.0% | View All 87 Rows |
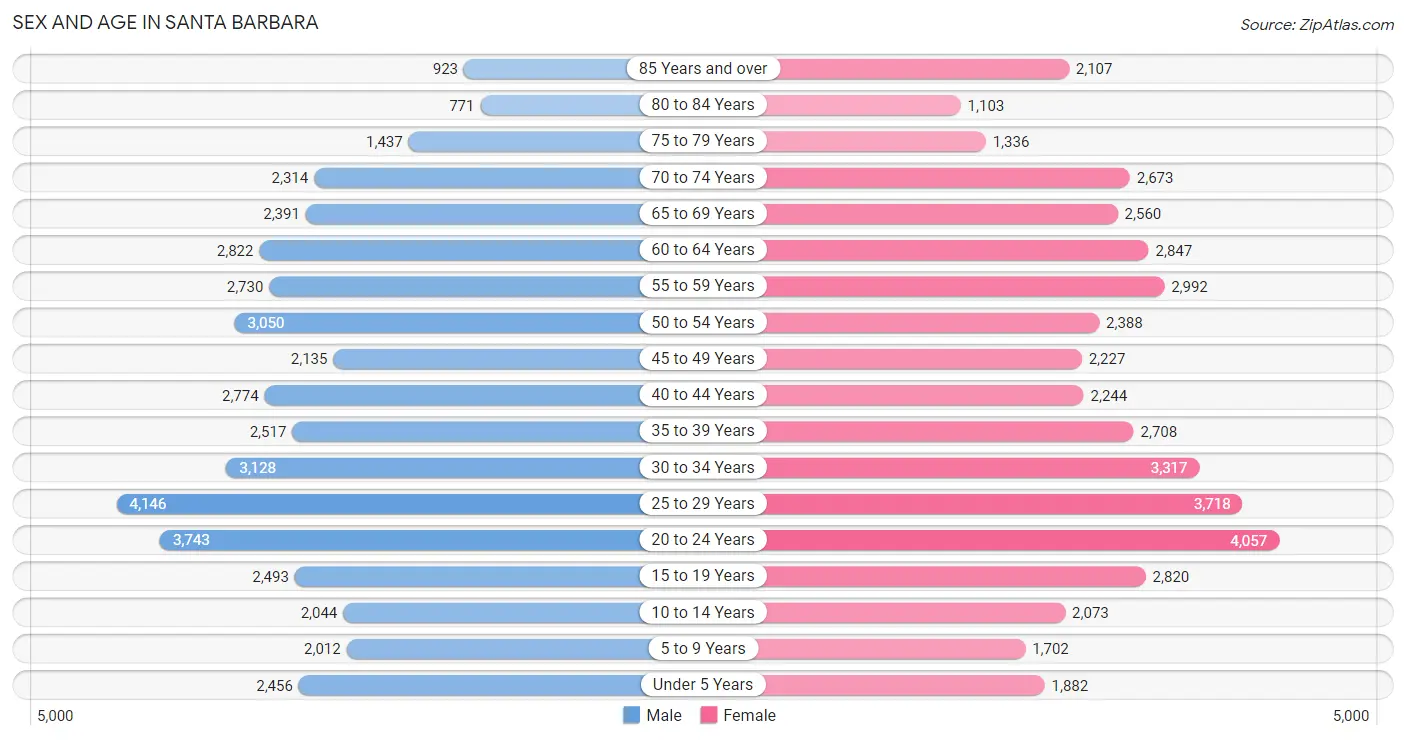
Sex and Age in Santa Barbara
Sex and Age in Santa Barbara
The most populous age groups in Santa Barbara are 25 to 29 Years (4,146 | 9.5%) for men and 20 to 24 Years (4,057 | 9.1%) for women.
| Age Bracket | Male | Female |
| Under 5 Years | 2,456 (5.6%) | 1,882 (4.2%) |
| 5 to 9 Years | 2,012 (4.6%) | 1,702 (3.8%) |
| 10 to 14 Years | 2,044 (4.7%) | 2,073 (4.6%) |
| 15 to 19 Years | 2,493 (5.7%) | 2,820 (6.3%) |
| 20 to 24 Years | 3,743 (8.5%) | 4,057 (9.1%) |
| 25 to 29 Years | 4,146 (9.5%) | 3,718 (8.3%) |
| 30 to 34 Years | 3,128 (7.1%) | 3,317 (7.4%) |
| 35 to 39 Years | 2,517 (5.7%) | 2,708 (6.0%) |
| 40 to 44 Years | 2,774 (6.3%) | 2,244 (5.0%) |
| 45 to 49 Years | 2,135 (4.9%) | 2,227 (5.0%) |
| 50 to 54 Years | 3,050 (7.0%) | 2,388 (5.3%) |
| 55 to 59 Years | 2,730 (6.2%) | 2,992 (6.7%) |
| 60 to 64 Years | 2,822 (6.4%) | 2,847 (6.4%) |
| 65 to 69 Years | 2,391 (5.4%) | 2,560 (5.7%) |
| 70 to 74 Years | 2,314 (5.3%) | 2,673 (6.0%) |
| 75 to 79 Years | 1,437 (3.3%) | 1,336 (3.0%) |
| 80 to 84 Years | 771 (1.8%) | 1,103 (2.5%) |
| 85 Years and over | 923 (2.1%) | 2,107 (4.7%) |
| Total | 43,886 (100.0%) | 44,754 (100.0%) |
Families and Households in Santa Barbara
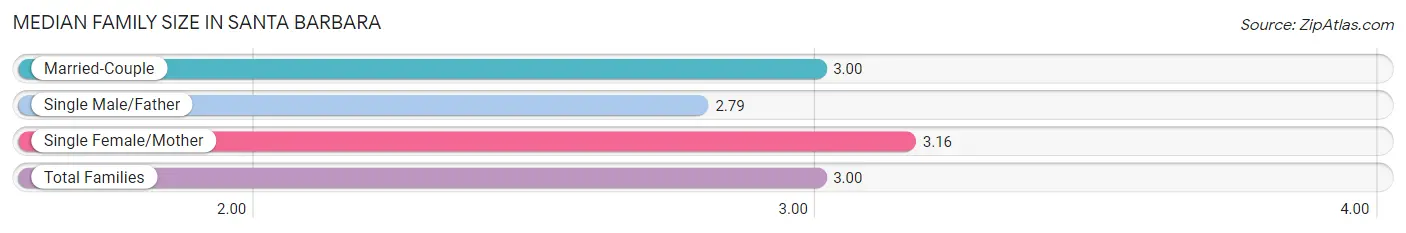
Median Family Size in Santa Barbara
The median family size in Santa Barbara is 3.00 persons per family, with single female/mother families (3,280 | 16.9%) accounting for the largest median family size of 3.16 persons per family. On the other hand, single male/father families (2,056 | 10.6%) represent the smallest median family size with 2.79 persons per family.
| Family Type | # Families | Family Size |
| Married-Couple | 14,108 (72.6%) | 3.00 |
| Single Male/Father | 2,056 (10.6%) | 2.79 |
| Single Female/Mother | 3,280 (16.9%) | 3.16 |
| Total Families | 19,444 (100.0%) | 3.00 |
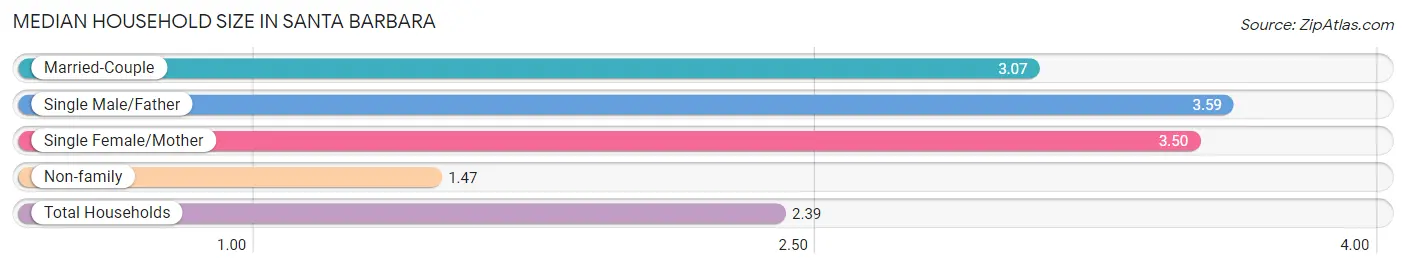
Median Household Size in Santa Barbara
The median household size in Santa Barbara is 2.39 persons per household, with single male/father households (2,056 | 5.7%) accounting for the largest median household size of 3.59 persons per household. non-family households (16,789 | 46.3%) represent the smallest median household size with 1.47 persons per household.
| Household Type | # Households | Household Size |
| Married-Couple | 14,108 (38.9%) | 3.07 |
| Single Male/Father | 2,056 (5.7%) | 3.59 |
| Single Female/Mother | 3,280 (9.0%) | 3.50 |
| Non-family | 16,789 (46.3%) | 1.47 |
| Total Households | 36,233 (100.0%) | 2.39 |
Household Size by Marriage Status in Santa Barbara
Out of a total of 36,233 households in Santa Barbara, 19,444 (53.7%) are family households, while 16,789 (46.3%) are nonfamily households. The most numerous type of family households are 2-person households, comprising 8,654, and the most common type of nonfamily households are 1-person households, comprising 11,710.
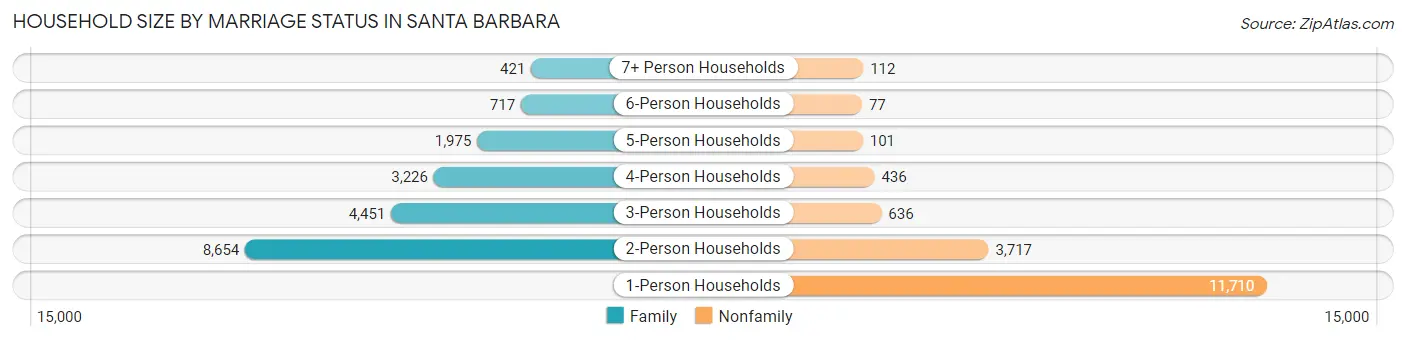
| Household Size | Family Households | Nonfamily Households |
| 1-Person Households | - | 11,710 (32.3%) |
| 2-Person Households | 8,654 (23.9%) | 3,717 (10.3%) |
| 3-Person Households | 4,451 (12.3%) | 636 (1.8%) |
| 4-Person Households | 3,226 (8.9%) | 436 (1.2%) |
| 5-Person Households | 1,975 (5.4%) | 101 (0.3%) |
| 6-Person Households | 717 (2.0%) | 77 (0.2%) |
| 7+ Person Households | 421 (1.2%) | 112 (0.3%) |
| Total | 19,444 (53.7%) | 16,789 (46.3%) |
Female Fertility in Santa Barbara
Fertility by Age in Santa Barbara
Average fertility rate in Santa Barbara is 36.0 births per 1,000 women. Women in the age bracket of 35 to 50 years have the highest fertility rate with 41.0 births per 1,000 women. Women in the age bracket of 20 to 34 years acount for 56.0% of all women with births.
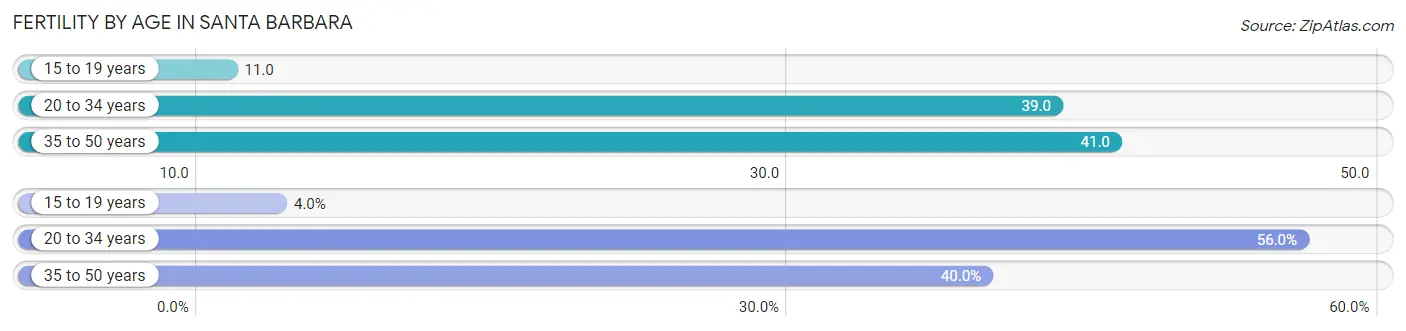
| Age Bracket | Women with Births | Births / 1,000 Women |
| 15 to 19 years | 31 (4.0%) | 11.0 |
| 20 to 34 years | 432 (56.0%) | 39.0 |
| 35 to 50 years | 308 (40.0%) | 41.0 |
| Total | 771 (100.0%) | 36.0 |
Fertility by Age by Marriage Status in Santa Barbara
75.9% of women with births (771) in Santa Barbara are married. The highest percentage of unmarried women with births falls into 15 to 19 years age bracket with 100.0% of them unmarried at the time of birth, while the lowest percentage of unmarried women with births belong to 35 to 50 years age bracket with 12.3% of them unmarried.
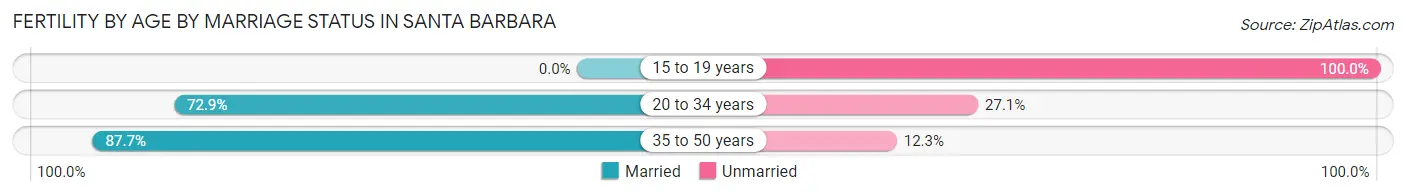
| Age Bracket | Married | Unmarried |
| 15 to 19 years | 0 (0.0%) | 31 (100.0%) |
| 20 to 34 years | 315 (72.9%) | 117 (27.1%) |
| 35 to 50 years | 270 (87.7%) | 38 (12.3%) |
| Total | 585 (75.9%) | 186 (24.1%) |
Fertility by Education in Santa Barbara
Average fertility rate in Santa Barbara is 36.0 births per 1,000 women. Women with the education attainment of bachelor's degree have the highest fertility rate of 52.0 births per 1,000 women, while women with the education attainment of graduate degree have the lowest fertility at 23.0 births per 1,000 women. Women with the education attainment of bachelor's degree represent 40.7% of all women with births.
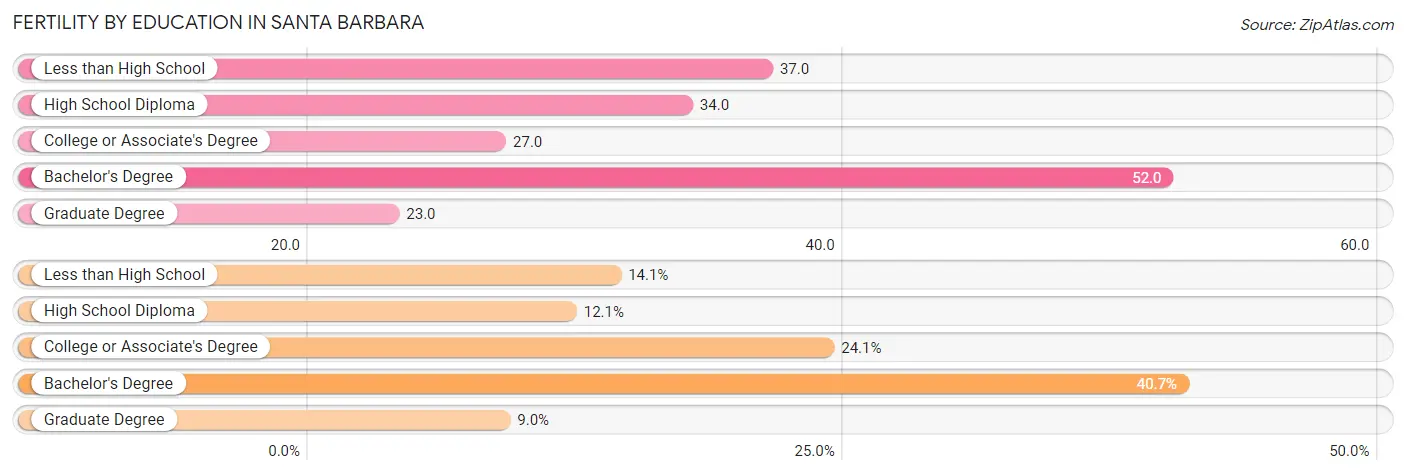
| Educational Attainment | Women with Births | Births / 1,000 Women |
| Less than High School | 109 (14.1%) | 37.0 |
| High School Diploma | 93 (12.1%) | 34.0 |
| College or Associate's Degree | 186 (24.1%) | 27.0 |
| Bachelor's Degree | 314 (40.7%) | 52.0 |
| Graduate Degree | 69 (8.9%) | 23.0 |
| Total | 771 (100.0%) | 36.0 |
Fertility by Education by Marriage Status in Santa Barbara
24.1% of women with births in Santa Barbara are unmarried. Women with the educational attainment of bachelor's degree are most likely to be married with 95.5% of them married at childbirth, while women with the educational attainment of high school diploma are least likely to be married with 53.8% of them unmarried at childbirth.
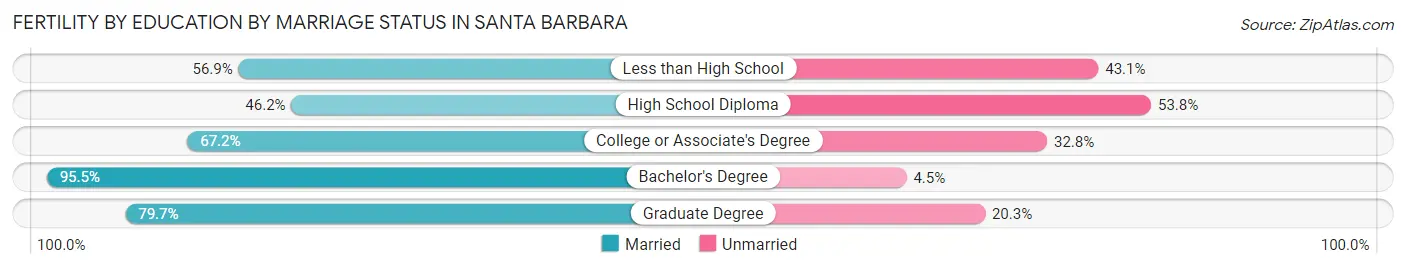
| Educational Attainment | Married | Unmarried |
| Less than High School | 62 (56.9%) | 47 (43.1%) |
| High School Diploma | 43 (46.2%) | 50 (53.8%) |
| College or Associate's Degree | 125 (67.2%) | 61 (32.8%) |
| Bachelor's Degree | 300 (95.5%) | 14 (4.5%) |
| Graduate Degree | 55 (79.7%) | 14 (20.3%) |
| Total | 585 (75.9%) | 186 (24.1%) |
Employment Characteristics in Santa Barbara
Employment by Class of Employer in Santa Barbara
Among the 45,397 employed individuals in Santa Barbara, private company employees (27,964 | 61.6%), not-for-profit organizations (5,229 | 11.5%), and self-employed (not incorporated) (3,922 | 8.6%) make up the most common classes of employment.
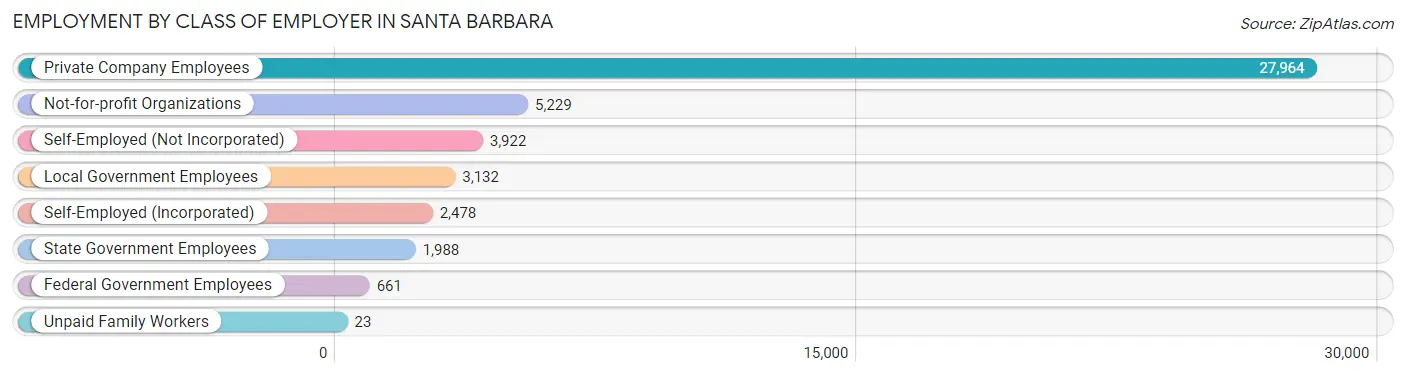
| Employer Class | # Employees | % Employees |
| Private Company Employees | 27,964 | 61.6% |
| Self-Employed (Incorporated) | 2,478 | 5.5% |
| Self-Employed (Not Incorporated) | 3,922 | 8.6% |
| Not-for-profit Organizations | 5,229 | 11.5% |
| Local Government Employees | 3,132 | 6.9% |
| State Government Employees | 1,988 | 4.4% |
| Federal Government Employees | 661 | 1.5% |
| Unpaid Family Workers | 23 | 0.1% |
| Total | 45,397 | 100.0% |
Employment Status by Age in Santa Barbara
According to the labor force statistics for Santa Barbara, out of the total population over 16 years of age (75,486), 64.9% or 48,990 individuals are in the labor force, with 4.4% or 2,156 of them unemployed. The age group with the highest labor force participation rate is 30 to 34 years, with 90.6% or 5,839 individuals in the labor force. Within the labor force, the 75 years and over age range has the highest percentage of unemployed individuals, with 10.5% or 60 of them being unemployed.
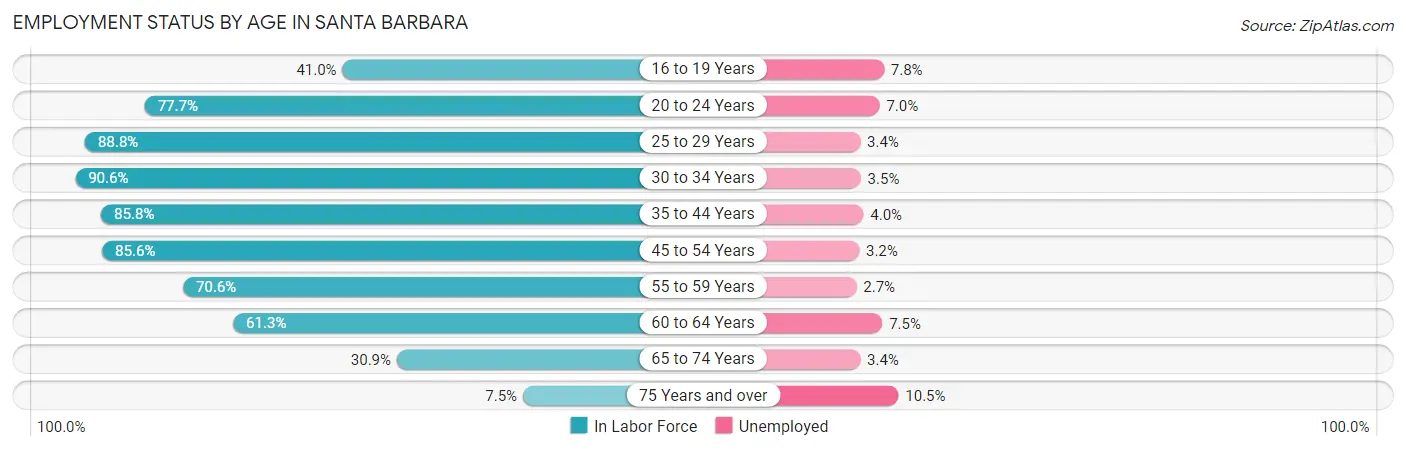
| Age Bracket | In Labor Force | Unemployed |
| 16 to 19 Years | 1,774 (41.0%) | 138 (7.8%) |
| 20 to 24 Years | 6,061 (77.7%) | 424 (7.0%) |
| 25 to 29 Years | 6,983 (88.8%) | 237 (3.4%) |
| 30 to 34 Years | 5,839 (90.6%) | 204 (3.5%) |
| 35 to 44 Years | 8,788 (85.8%) | 352 (4.0%) |
| 45 to 54 Years | 8,389 (85.6%) | 268 (3.2%) |
| 55 to 59 Years | 4,040 (70.6%) | 109 (2.7%) |
| 60 to 64 Years | 3,475 (61.3%) | 261 (7.5%) |
| 65 to 74 Years | 3,071 (30.9%) | 104 (3.4%) |
| 75 Years and over | 576 (7.5%) | 60 (10.5%) |
| Total | 48,990 (64.9%) | 2,156 (4.4%) |
Employment Status by Educational Attainment in Santa Barbara
According to labor force statistics for Santa Barbara, 82.0% of individuals (37,509) out of the total population between 25 and 64 years of age (45,743) are in the labor force, with 3.8% or 1,425 of them being unemployed. The group with the highest labor force participation rate are those with the educational attainment of bachelor's degree or higher, with 86.0% or 19,571 individuals in the labor force. Within the labor force, individuals with high school diploma education have the highest percentage of unemployment, with 9.7% or 399 of them being unemployed.
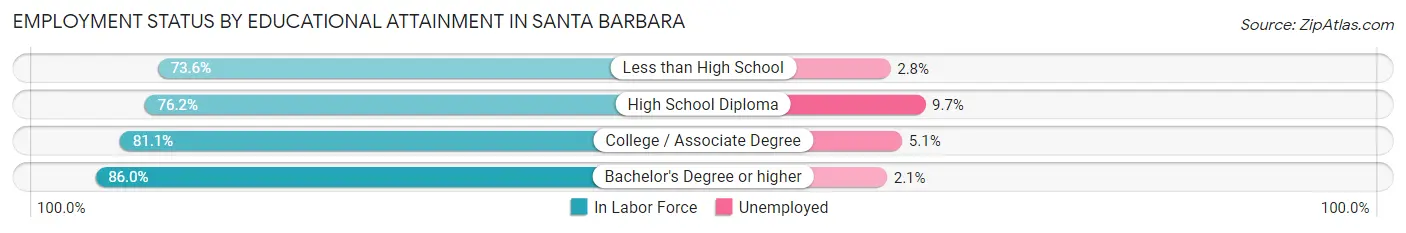
| Educational Attainment | In Labor Force | Unemployed |
| Less than High School | 4,308 (73.6%) | 164 (2.8%) |
| High School Diploma | 4,113 (76.2%) | 524 (9.7%) |
| College / Associate Degree | 9,518 (81.1%) | 599 (5.1%) |
| Bachelor's Degree or higher | 19,571 (86.0%) | 478 (2.1%) |
| Total | 37,509 (82.0%) | 1,738 (3.8%) |
Employment Occupations by Sex in Santa Barbara
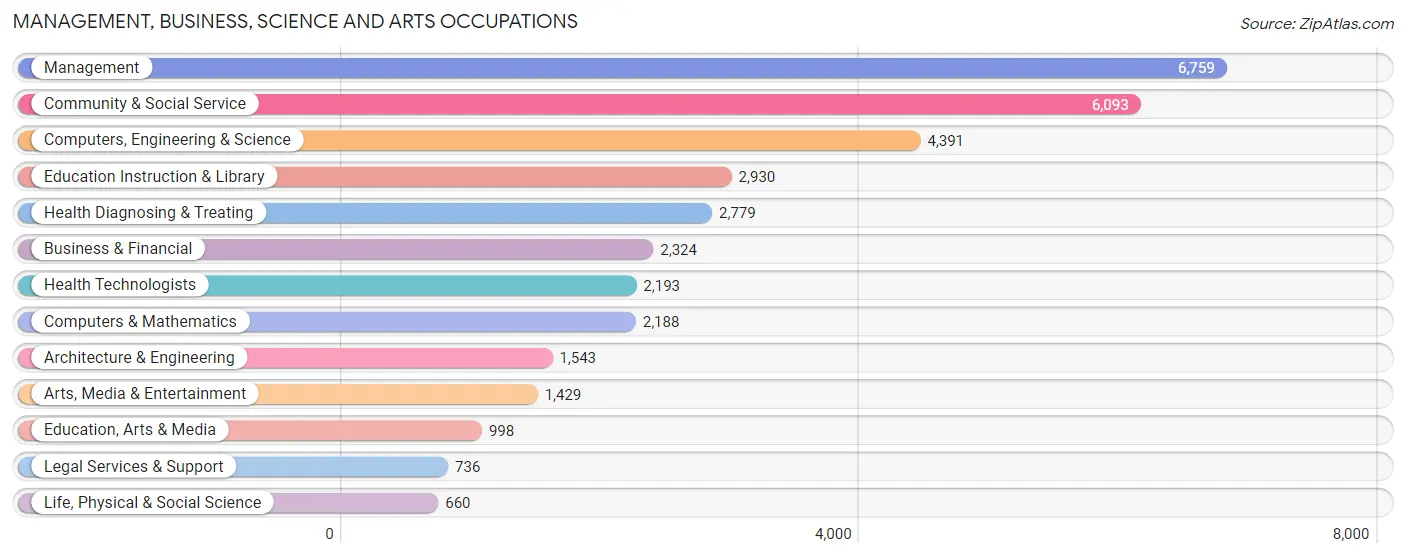
Management, Business, Science and Arts Occupations
The most common Management, Business, Science and Arts occupations in Santa Barbara are Management (6,759 | 14.4%), Community & Social Service (6,093 | 13.0%), Computers, Engineering & Science (4,391 | 9.4%), Education Instruction & Library (2,930 | 6.3%), and Health Diagnosing & Treating (2,779 | 5.9%).
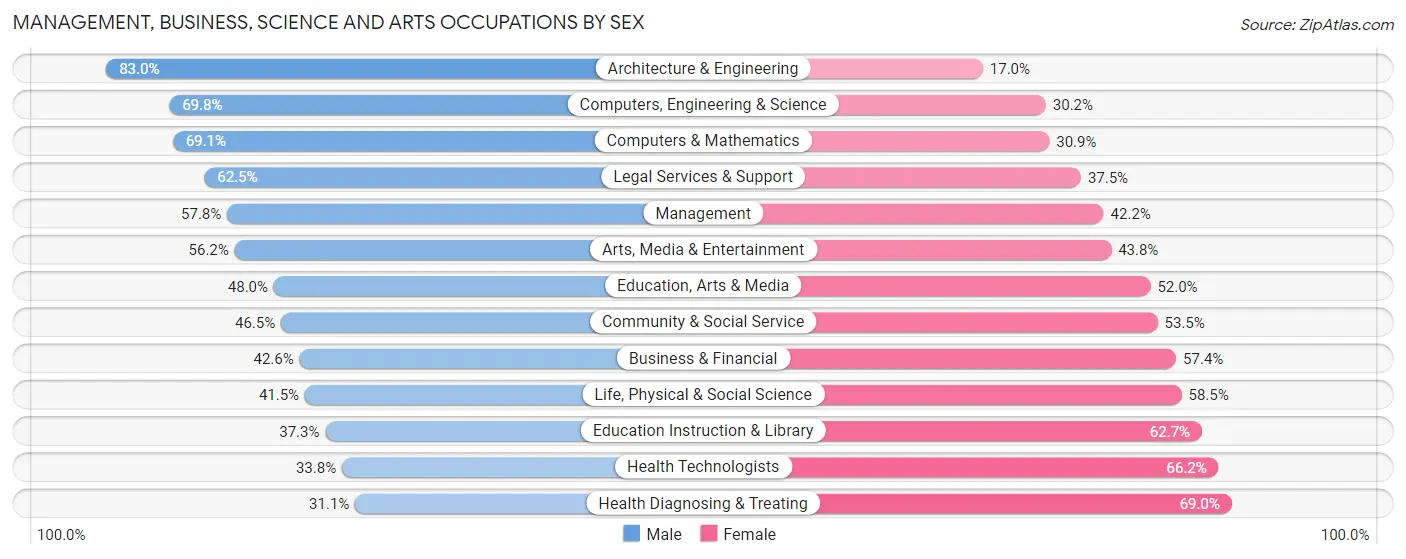
Management, Business, Science and Arts Occupations by Sex
Within the Management, Business, Science and Arts occupations in Santa Barbara, the most male-oriented occupations are Architecture & Engineering (83.0%), Computers, Engineering & Science (69.8%), and Computers & Mathematics (69.1%), while the most female-oriented occupations are Health Diagnosing & Treating (69.0%), Health Technologists (66.2%), and Education Instruction & Library (62.7%).
| Occupation | Male | Female |
| Management | 3,904 (57.8%) | 2,855 (42.2%) |
| Business & Financial | 991 (42.6%) | 1,333 (57.4%) |
| Computers, Engineering & Science | 3,066 (69.8%) | 1,325 (30.2%) |
| Computers & Mathematics | 1,512 (69.1%) | 676 (30.9%) |
| Architecture & Engineering | 1,280 (83.0%) | 263 (17.0%) |
| Life, Physical & Social Science | 274 (41.5%) | 386 (58.5%) |
| Community & Social Service | 2,834 (46.5%) | 3,259 (53.5%) |
| Education, Arts & Media | 479 (48.0%) | 519 (52.0%) |
| Legal Services & Support | 460 (62.5%) | 276 (37.5%) |
| Education Instruction & Library | 1,092 (37.3%) | 1,838 (62.7%) |
| Arts, Media & Entertainment | 803 (56.2%) | 626 (43.8%) |
| Health Diagnosing & Treating | 863 (31.0%) | 1,916 (69.0%) |
| Health Technologists | 741 (33.8%) | 1,452 (66.2%) |
| Total (Category) | 11,658 (52.2%) | 10,688 (47.8%) |
| Total (Overall) | 24,957 (53.3%) | 21,843 (46.7%) |
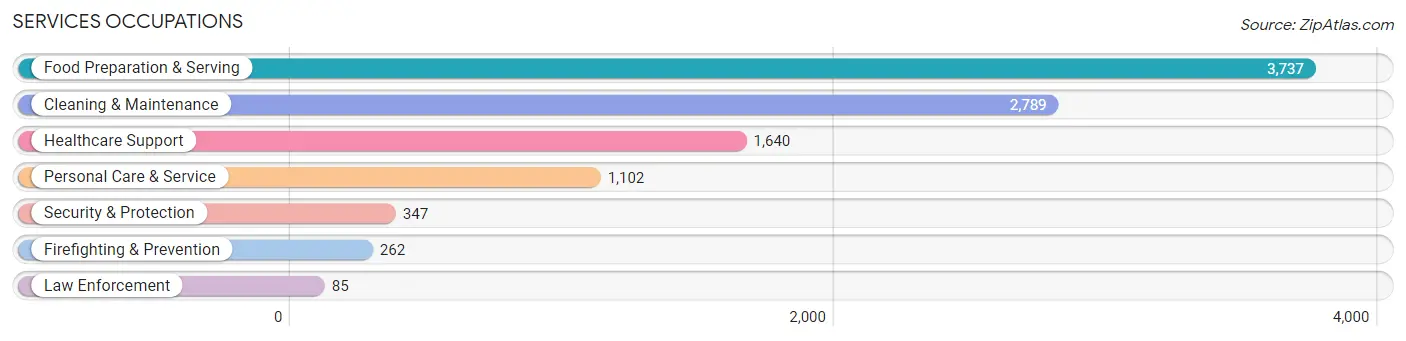
Services Occupations
The most common Services occupations in Santa Barbara are Food Preparation & Serving (3,737 | 8.0%), Cleaning & Maintenance (2,789 | 6.0%), Healthcare Support (1,640 | 3.5%), Personal Care & Service (1,102 | 2.4%), and Security & Protection (347 | 0.7%).
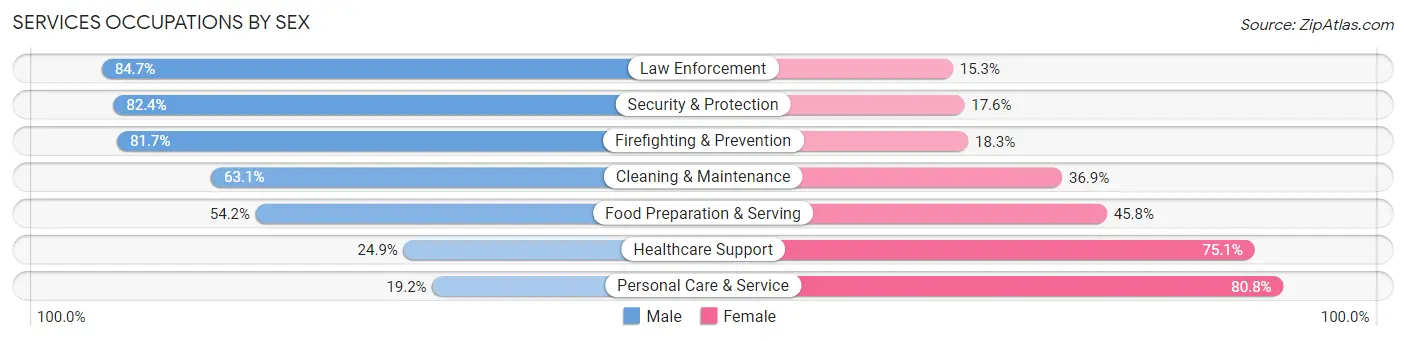
Services Occupations by Sex
Within the Services occupations in Santa Barbara, the most male-oriented occupations are Law Enforcement (84.7%), Security & Protection (82.4%), and Firefighting & Prevention (81.7%), while the most female-oriented occupations are Personal Care & Service (80.8%), Healthcare Support (75.1%), and Food Preparation & Serving (45.8%).
| Occupation | Male | Female |
| Healthcare Support | 409 (24.9%) | 1,231 (75.1%) |
| Security & Protection | 286 (82.4%) | 61 (17.6%) |
| Firefighting & Prevention | 214 (81.7%) | 48 (18.3%) |
| Law Enforcement | 72 (84.7%) | 13 (15.3%) |
| Food Preparation & Serving | 2,026 (54.2%) | 1,711 (45.8%) |
| Cleaning & Maintenance | 1,759 (63.1%) | 1,030 (36.9%) |
| Personal Care & Service | 212 (19.2%) | 890 (80.8%) |
| Total (Category) | 4,692 (48.8%) | 4,923 (51.2%) |
| Total (Overall) | 24,957 (53.3%) | 21,843 (46.7%) |
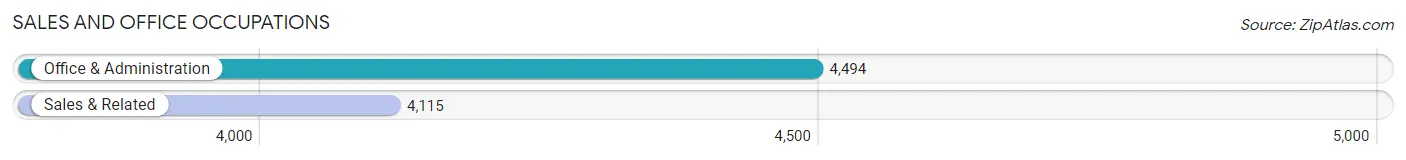
Sales and Office Occupations
The most common Sales and Office occupations in Santa Barbara are Office & Administration (4,494 | 9.6%), and Sales & Related (4,115 | 8.8%).
Sales and Office Occupations by Sex
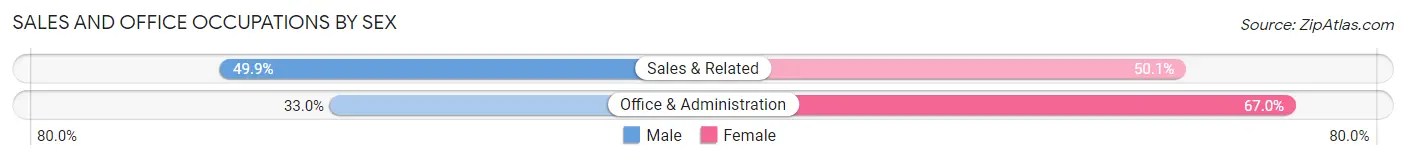
| Occupation | Male | Female |
| Sales & Related | 2,054 (49.9%) | 2,061 (50.1%) |
| Office & Administration | 1,484 (33.0%) | 3,010 (67.0%) |
| Total (Category) | 3,538 (41.1%) | 5,071 (58.9%) |
| Total (Overall) | 24,957 (53.3%) | 21,843 (46.7%) |
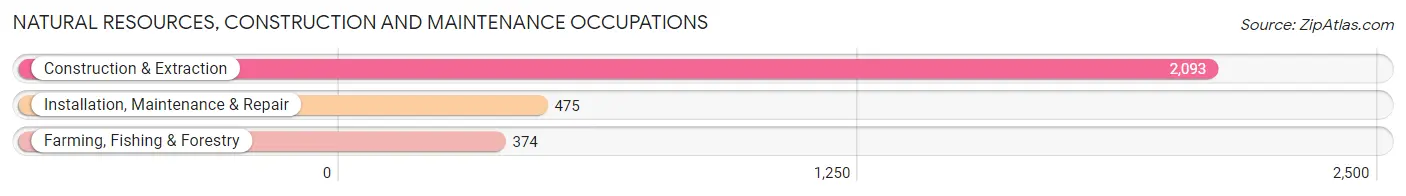
Natural Resources, Construction and Maintenance Occupations
The most common Natural Resources, Construction and Maintenance occupations in Santa Barbara are Construction & Extraction (2,093 | 4.5%), Installation, Maintenance & Repair (475 | 1.0%), and Farming, Fishing & Forestry (374 | 0.8%).
Natural Resources, Construction and Maintenance Occupations by Sex
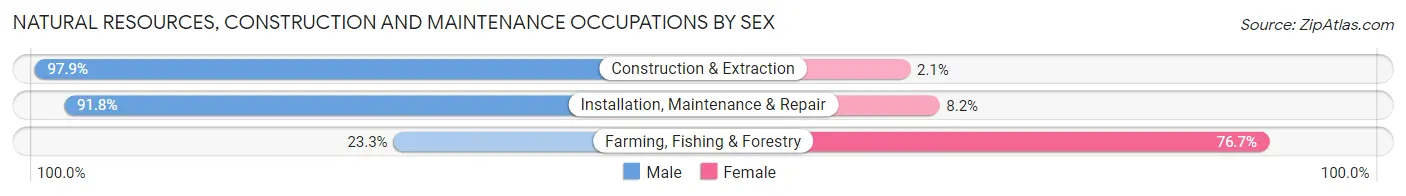
| Occupation | Male | Female |
| Farming, Fishing & Forestry | 87 (23.3%) | 287 (76.7%) |
| Construction & Extraction | 2,049 (97.9%) | 44 (2.1%) |
| Installation, Maintenance & Repair | 436 (91.8%) | 39 (8.2%) |
| Total (Category) | 2,572 (87.4%) | 370 (12.6%) |
| Total (Overall) | 24,957 (53.3%) | 21,843 (46.7%) |
Production, Transportation and Moving Occupations
The most common Production, Transportation and Moving occupations in Santa Barbara are Production (1,162 | 2.5%), Material Moving (1,075 | 2.3%), and Transportation (1,051 | 2.2%).
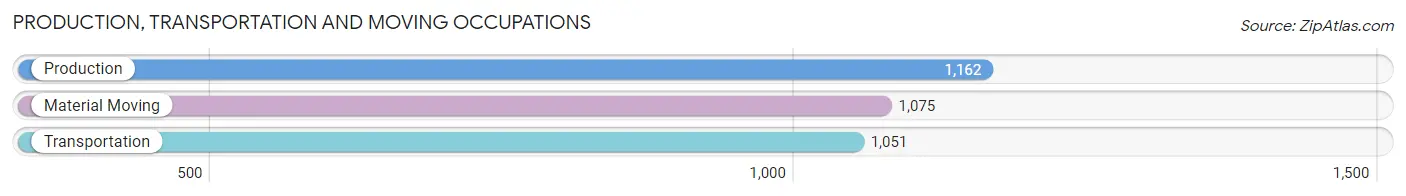
Production, Transportation and Moving Occupations by Sex
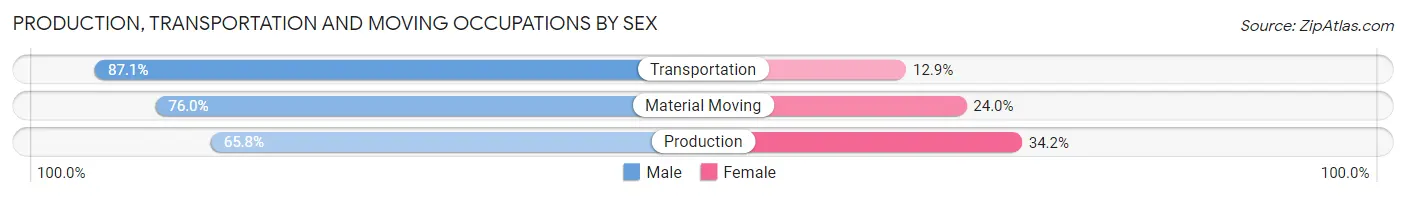
| Occupation | Male | Female |
| Production | 765 (65.8%) | 397 (34.2%) |
| Transportation | 915 (87.1%) | 136 (12.9%) |
| Material Moving | 817 (76.0%) | 258 (24.0%) |
| Total (Category) | 2,497 (75.9%) | 791 (24.1%) |
| Total (Overall) | 24,957 (53.3%) | 21,843 (46.7%) |
Employment Industries by Sex in Santa Barbara
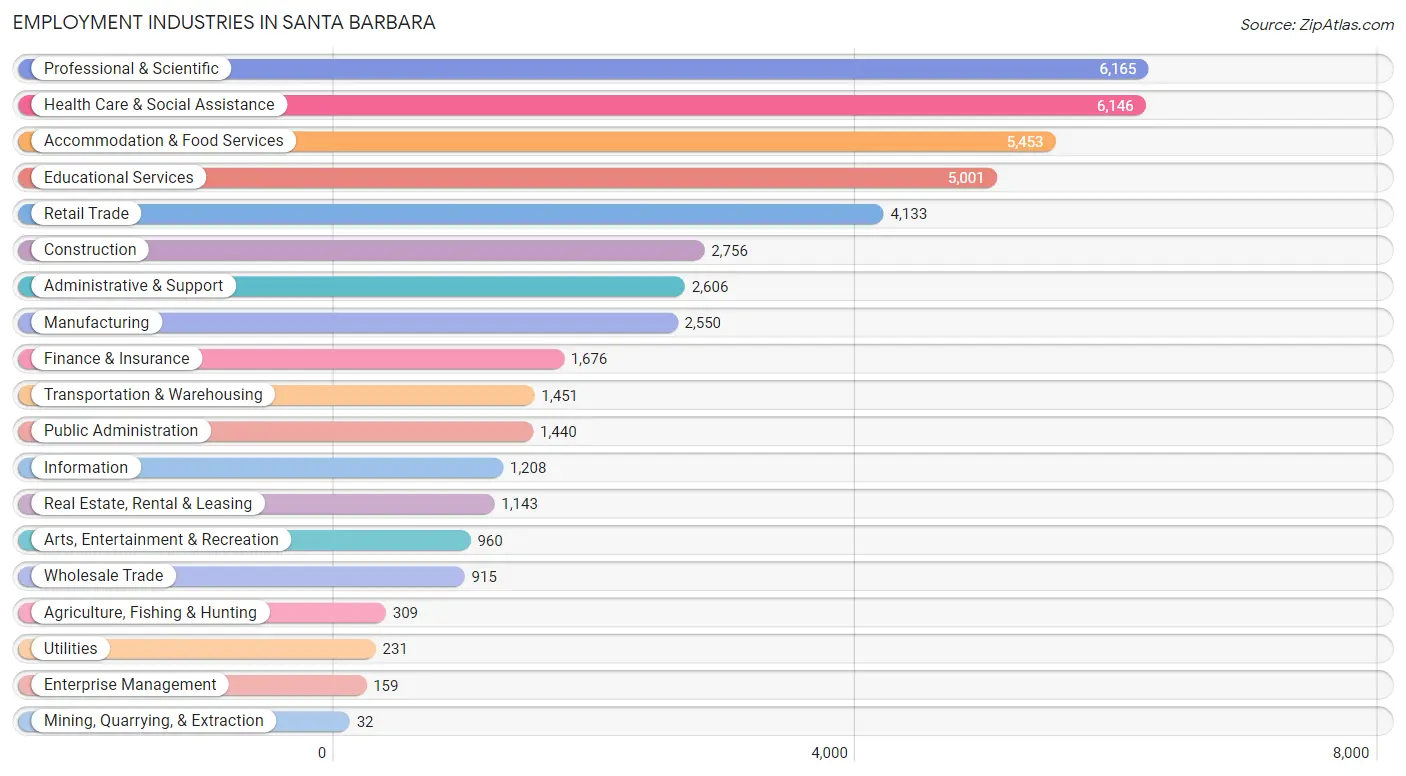
Employment Industries in Santa Barbara
The major employment industries in Santa Barbara include Professional & Scientific (6,165 | 13.2%), Health Care & Social Assistance (6,146 | 13.1%), Accommodation & Food Services (5,453 | 11.7%), Educational Services (5,001 | 10.7%), and Retail Trade (4,133 | 8.8%).
Employment Industries by Sex in Santa Barbara
The Santa Barbara industries that see more men than women are Mining, Quarrying, & Extraction (100.0%), Construction (89.4%), and Enterprise Management (87.4%), whereas the industries that tend to have a higher number of women are Health Care & Social Assistance (71.3%), Educational Services (59.4%), and Finance & Insurance (54.8%).
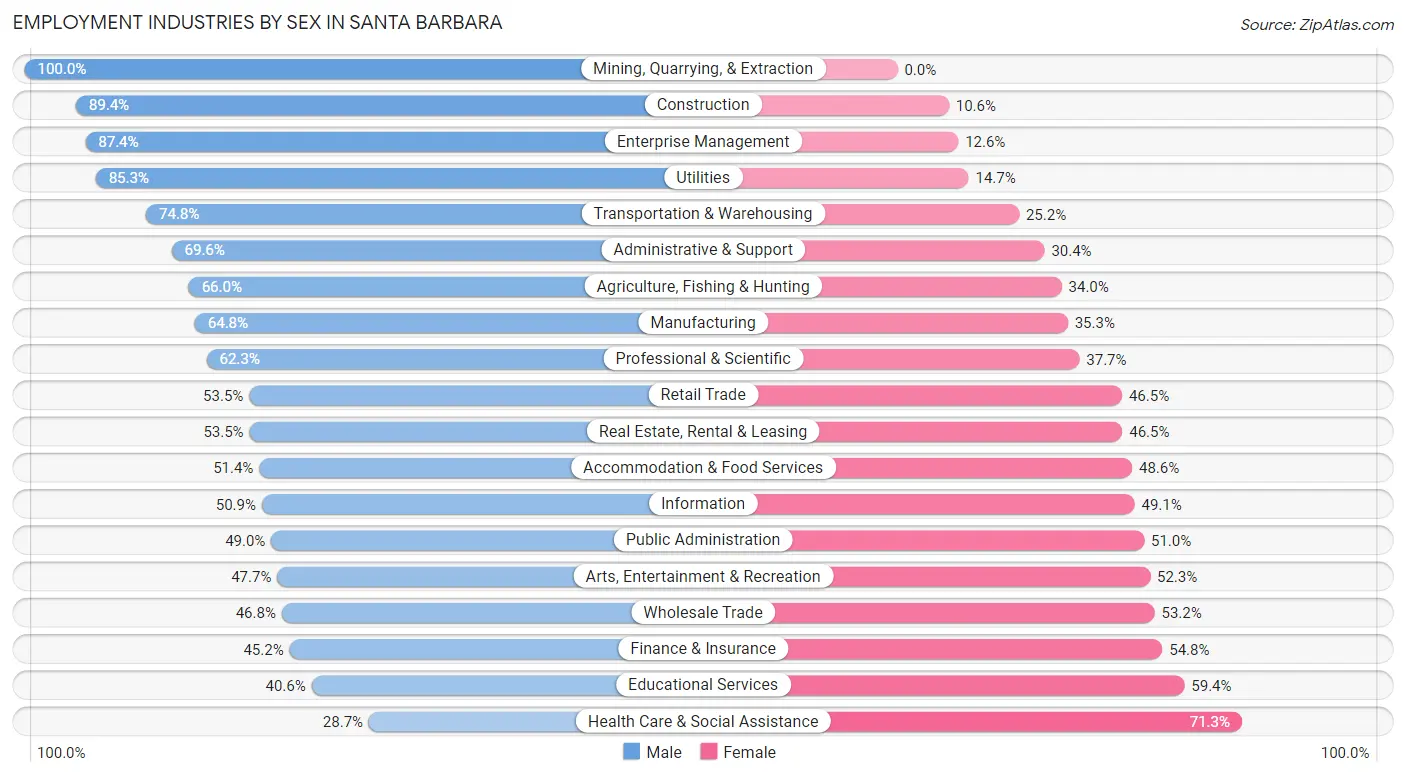
| Industry | Male | Female |
| Agriculture, Fishing & Hunting | 204 (66.0%) | 105 (34.0%) |
| Mining, Quarrying, & Extraction | 32 (100.0%) | 0 (0.0%) |
| Construction | 2,463 (89.4%) | 293 (10.6%) |
| Manufacturing | 1,651 (64.7%) | 899 (35.2%) |
| Wholesale Trade | 428 (46.8%) | 487 (53.2%) |
| Retail Trade | 2,212 (53.5%) | 1,921 (46.5%) |
| Transportation & Warehousing | 1,086 (74.8%) | 365 (25.2%) |
| Utilities | 197 (85.3%) | 34 (14.7%) |
| Information | 615 (50.9%) | 593 (49.1%) |
| Finance & Insurance | 757 (45.2%) | 919 (54.8%) |
| Real Estate, Rental & Leasing | 611 (53.5%) | 532 (46.5%) |
| Professional & Scientific | 3,843 (62.3%) | 2,322 (37.7%) |
| Enterprise Management | 139 (87.4%) | 20 (12.6%) |
| Administrative & Support | 1,813 (69.6%) | 793 (30.4%) |
| Educational Services | 2,031 (40.6%) | 2,970 (59.4%) |
| Health Care & Social Assistance | 1,766 (28.7%) | 4,380 (71.3%) |
| Arts, Entertainment & Recreation | 458 (47.7%) | 502 (52.3%) |
| Accommodation & Food Services | 2,805 (51.4%) | 2,648 (48.6%) |
| Public Administration | 705 (49.0%) | 735 (51.0%) |
| Total | 24,957 (53.3%) | 21,843 (46.7%) |
Education in Santa Barbara
School Enrollment in Santa Barbara
The most common levels of schooling among the 20,544 students in Santa Barbara are college / undergraduate (6,951 | 33.8%), high school (3,646 | 17.7%), and middle school (3,267 | 15.9%).
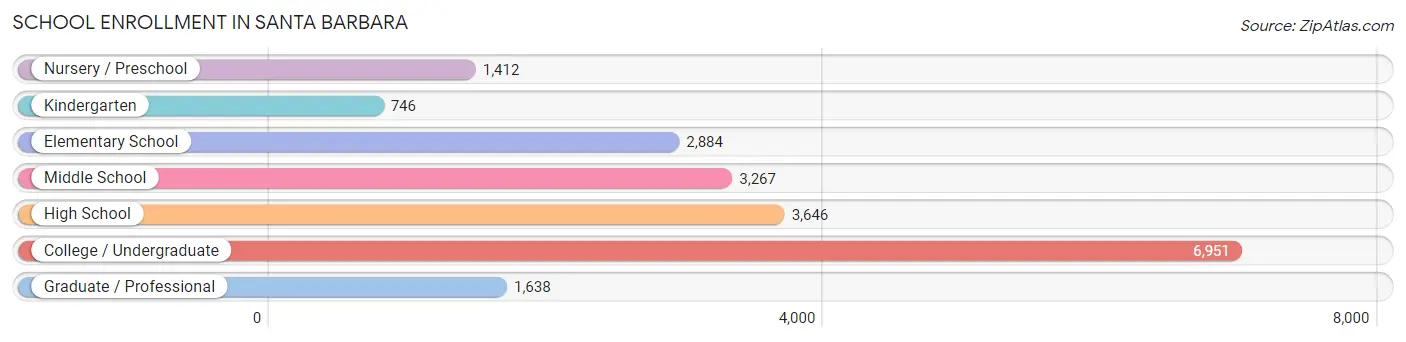
| School Level | # Students | % Students |
| Nursery / Preschool | 1,412 | 6.9% |
| Kindergarten | 746 | 3.6% |
| Elementary School | 2,884 | 14.0% |
| Middle School | 3,267 | 15.9% |
| High School | 3,646 | 17.7% |
| College / Undergraduate | 6,951 | 33.8% |
| Graduate / Professional | 1,638 | 8.0% |
| Total | 20,544 | 100.0% |
School Enrollment by Age by Funding Source in Santa Barbara
Out of a total of 20,544 students who are enrolled in schools in Santa Barbara, 3,082 (15.0%) attend a private institution, while the remaining 17,462 (85.0%) are enrolled in public schools. The age group of 3 to 4 year olds has the highest likelihood of being enrolled in private schools, with 534 (44.3% in the age bracket) enrolled. Conversely, the age group of 15 to 17 year olds has the lowest likelihood of being enrolled in a private school, with 2,556 (96.4% in the age bracket) attending a public institution.
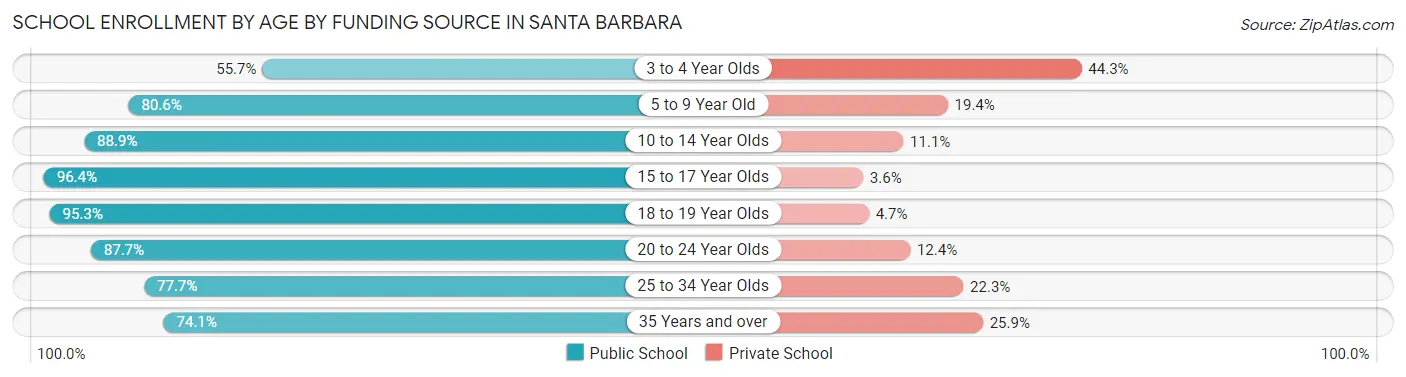
| Age Bracket | Public School | Private School |
| 3 to 4 Year Olds | 672 (55.7%) | 534 (44.3%) |
| 5 to 9 Year Old | 2,812 (80.6%) | 675 (19.4%) |
| 10 to 14 Year Olds | 3,634 (88.9%) | 453 (11.1%) |
| 15 to 17 Year Olds | 2,556 (96.4%) | 95 (3.6%) |
| 18 to 19 Year Olds | 1,902 (95.3%) | 93 (4.7%) |
| 20 to 24 Year Olds | 3,528 (87.6%) | 497 (12.3%) |
| 25 to 34 Year Olds | 1,495 (77.7%) | 428 (22.3%) |
| 35 Years and over | 867 (74.1%) | 303 (25.9%) |
| Total | 17,462 (85.0%) | 3,082 (15.0%) |
Educational Attainment by Field of Study in Santa Barbara
Social sciences (4,951 | 14.0%), business (4,051 | 11.5%), bio, nature & agricultural (3,102 | 8.8%), liberal arts & history (2,855 | 8.1%), and visual & performing arts (2,829 | 8.0%) are the most common fields of study among 35,305 individuals in Santa Barbara who have obtained a bachelor's degree or higher.
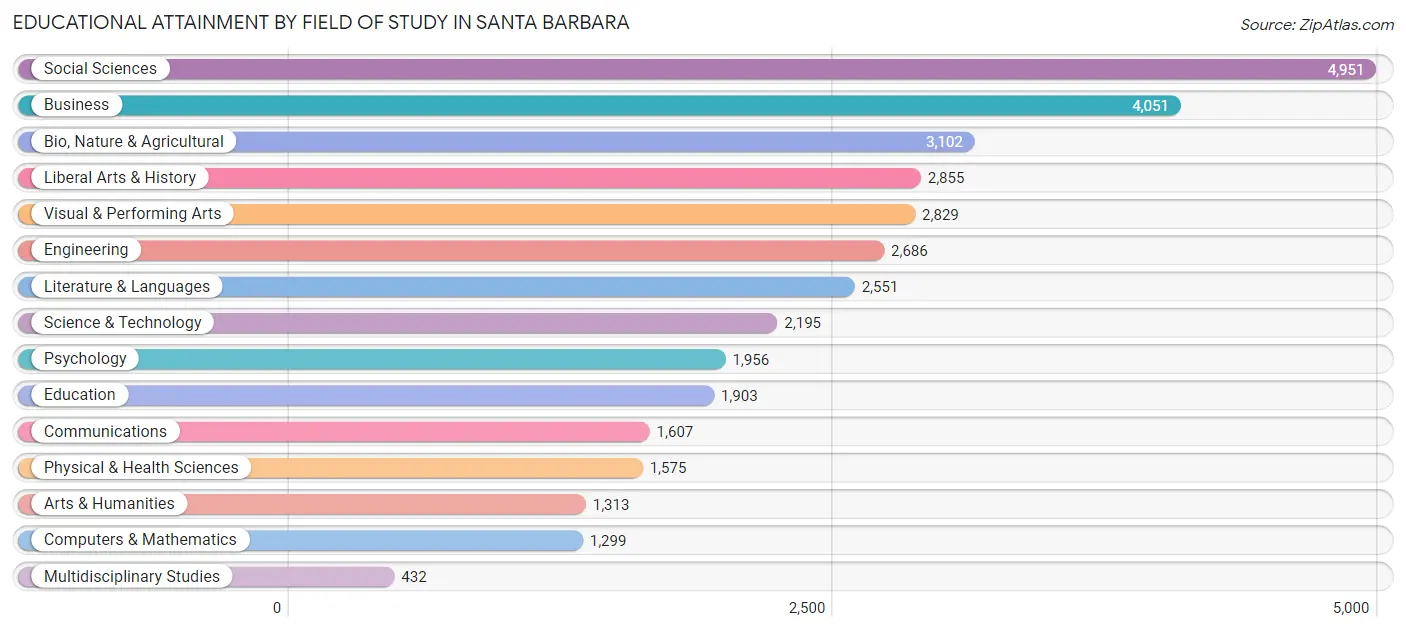
| Field of Study | # Graduates | % Graduates |
| Computers & Mathematics | 1,299 | 3.7% |
| Bio, Nature & Agricultural | 3,102 | 8.8% |
| Physical & Health Sciences | 1,575 | 4.5% |
| Psychology | 1,956 | 5.5% |
| Social Sciences | 4,951 | 14.0% |
| Engineering | 2,686 | 7.6% |
| Multidisciplinary Studies | 432 | 1.2% |
| Science & Technology | 2,195 | 6.2% |
| Business | 4,051 | 11.5% |
| Education | 1,903 | 5.4% |
| Literature & Languages | 2,551 | 7.2% |
| Liberal Arts & History | 2,855 | 8.1% |
| Visual & Performing Arts | 2,829 | 8.0% |
| Communications | 1,607 | 4.5% |
| Arts & Humanities | 1,313 | 3.7% |
| Total | 35,305 | 100.0% |
Transportation & Commute in Santa Barbara
Vehicle Availability by Sex in Santa Barbara
The most prevalent vehicle ownership categories in Santa Barbara are males with 2 vehicles (9,916, accounting for 40.8%) and females with 2 vehicles (8,077, making up 47.3%).
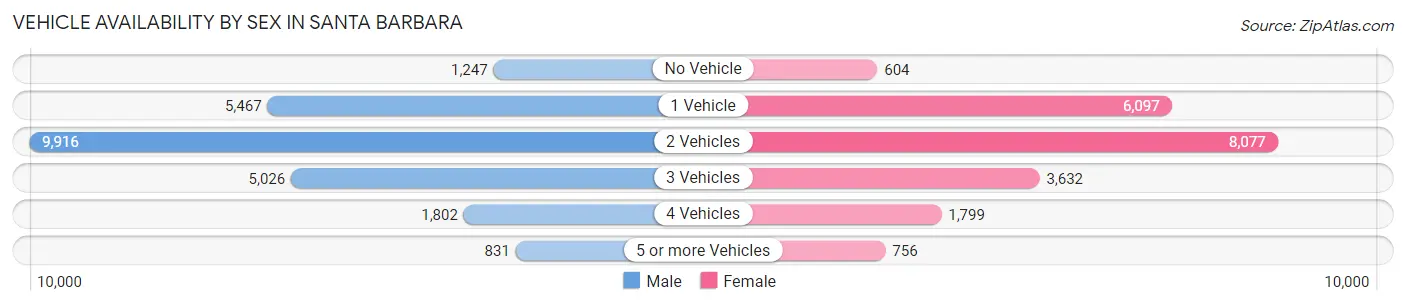
| Vehicles Available | Male | Female |
| No Vehicle | 1,247 (5.1%) | 604 (2.9%) |
| 1 Vehicle | 5,467 (22.5%) | 6,097 (29.1%) |
| 2 Vehicles | 9,916 (40.8%) | 8,077 (38.5%) |
| 3 Vehicles | 5,026 (20.7%) | 3,632 (17.3%) |
| 4 Vehicles | 1,802 (7.4%) | 1,799 (8.6%) |
| 5 or more Vehicles | 831 (3.4%) | 756 (3.6%) |
| Total | 24,289 (100.0%) | 20,965 (100.0%) |
Commute Time in Santa Barbara
The most frequently occuring commute durations in Santa Barbara are 10 to 14 minutes (10,626 commuters, 27.5%), 15 to 19 minutes (8,834 commuters, 22.8%), and 5 to 9 minutes (6,488 commuters, 16.8%).
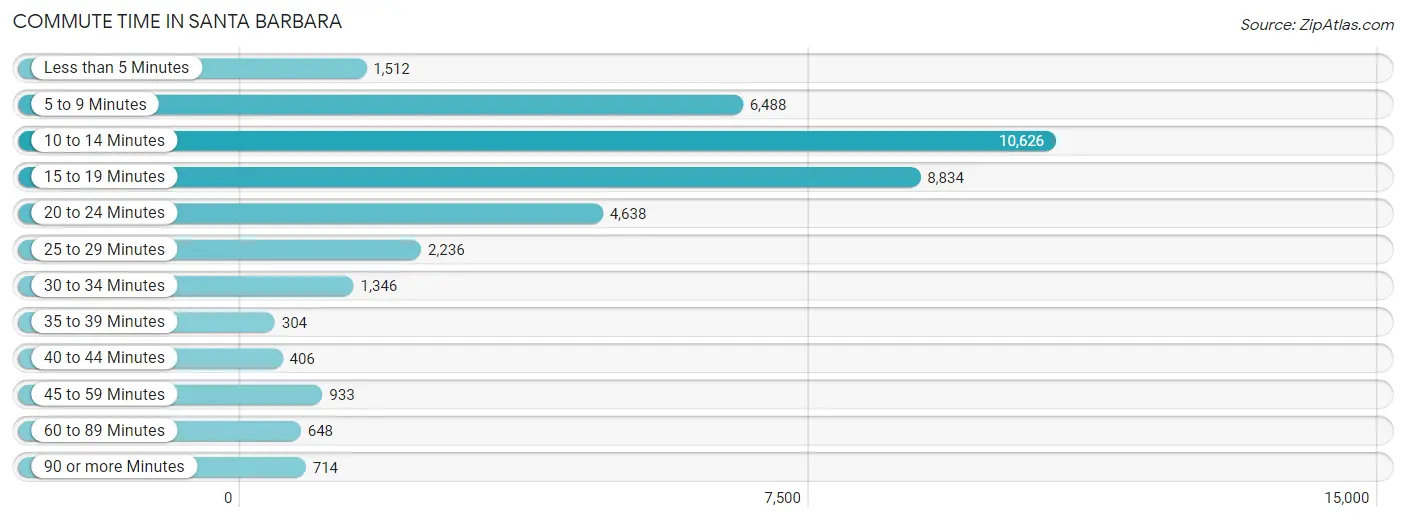
| Commute Time | # Commuters | % Commuters |
| Less than 5 Minutes | 1,512 | 3.9% |
| 5 to 9 Minutes | 6,488 | 16.8% |
| 10 to 14 Minutes | 10,626 | 27.5% |
| 15 to 19 Minutes | 8,834 | 22.8% |
| 20 to 24 Minutes | 4,638 | 12.0% |
| 25 to 29 Minutes | 2,236 | 5.8% |
| 30 to 34 Minutes | 1,346 | 3.5% |
| 35 to 39 Minutes | 304 | 0.8% |
| 40 to 44 Minutes | 406 | 1.1% |
| 45 to 59 Minutes | 933 | 2.4% |
| 60 to 89 Minutes | 648 | 1.7% |
| 90 or more Minutes | 714 | 1.8% |
Commute Time by Sex in Santa Barbara
The most common commute times in Santa Barbara are 10 to 14 minutes (5,479 commuters, 25.9%) for males and 10 to 14 minutes (5,147 commuters, 29.3%) for females.
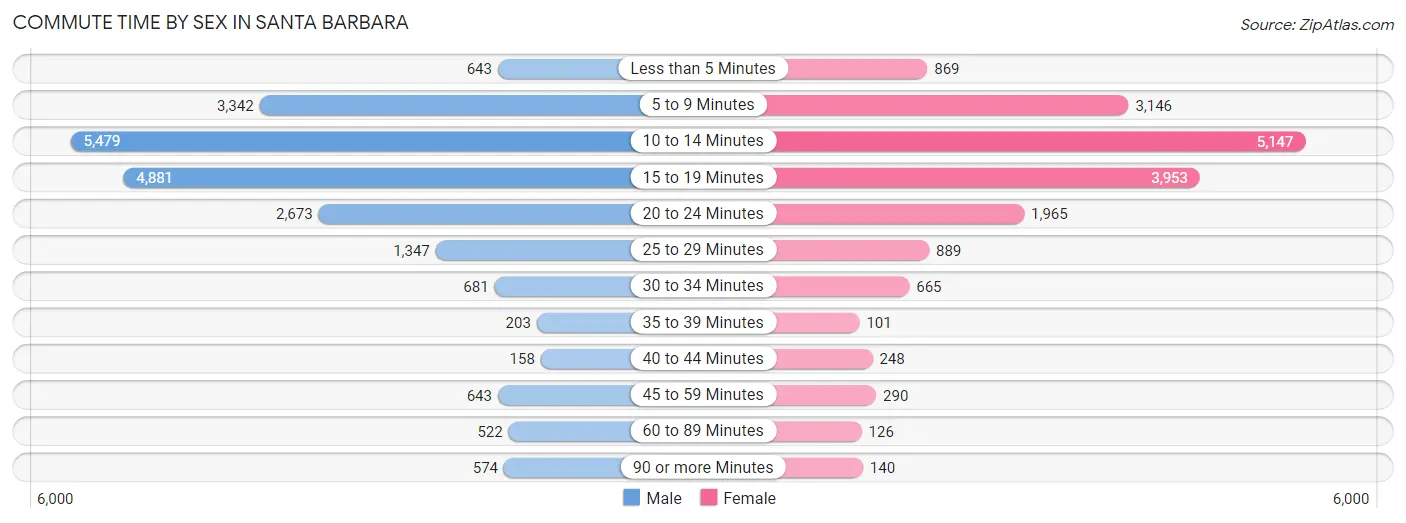
| Commute Time | Male | Female |
| Less than 5 Minutes | 643 (3.0%) | 869 (5.0%) |
| 5 to 9 Minutes | 3,342 (15.8%) | 3,146 (17.9%) |
| 10 to 14 Minutes | 5,479 (25.9%) | 5,147 (29.3%) |
| 15 to 19 Minutes | 4,881 (23.1%) | 3,953 (22.5%) |
| 20 to 24 Minutes | 2,673 (12.6%) | 1,965 (11.2%) |
| 25 to 29 Minutes | 1,347 (6.4%) | 889 (5.1%) |
| 30 to 34 Minutes | 681 (3.2%) | 665 (3.8%) |
| 35 to 39 Minutes | 203 (1.0%) | 101 (0.6%) |
| 40 to 44 Minutes | 158 (0.7%) | 248 (1.4%) |
| 45 to 59 Minutes | 643 (3.0%) | 290 (1.7%) |
| 60 to 89 Minutes | 522 (2.5%) | 126 (0.7%) |
| 90 or more Minutes | 574 (2.7%) | 140 (0.8%) |
Time of Departure to Work by Sex in Santa Barbara
The most frequent times of departure to work in Santa Barbara are 8:00 AM to 8:29 AM (3,628, 17.2%) for males and 8:00 AM to 8:29 AM (3,162, 18.0%) for females.
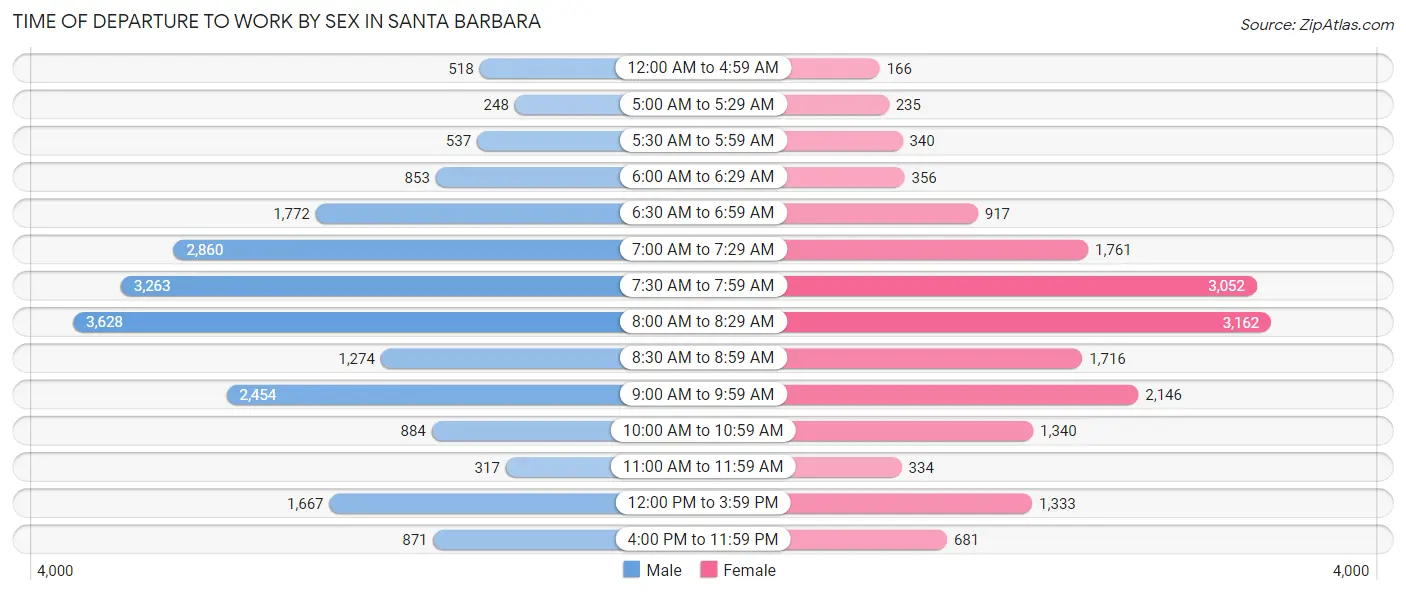
| Time of Departure | Male | Female |
| 12:00 AM to 4:59 AM | 518 (2.5%) | 166 (0.9%) |
| 5:00 AM to 5:29 AM | 248 (1.2%) | 235 (1.3%) |
| 5:30 AM to 5:59 AM | 537 (2.5%) | 340 (1.9%) |
| 6:00 AM to 6:29 AM | 853 (4.0%) | 356 (2.0%) |
| 6:30 AM to 6:59 AM | 1,772 (8.4%) | 917 (5.2%) |
| 7:00 AM to 7:29 AM | 2,860 (13.5%) | 1,761 (10.0%) |
| 7:30 AM to 7:59 AM | 3,263 (15.4%) | 3,052 (17.4%) |
| 8:00 AM to 8:29 AM | 3,628 (17.2%) | 3,162 (18.0%) |
| 8:30 AM to 8:59 AM | 1,274 (6.0%) | 1,716 (9.8%) |
| 9:00 AM to 9:59 AM | 2,454 (11.6%) | 2,146 (12.2%) |
| 10:00 AM to 10:59 AM | 884 (4.2%) | 1,340 (7.6%) |
| 11:00 AM to 11:59 AM | 317 (1.5%) | 334 (1.9%) |
| 12:00 PM to 3:59 PM | 1,667 (7.9%) | 1,333 (7.6%) |
| 4:00 PM to 11:59 PM | 871 (4.1%) | 681 (3.9%) |
| Total | 21,146 (100.0%) | 17,539 (100.0%) |
Housing Occupancy in Santa Barbara
Occupancy by Ownership in Santa Barbara
Of the total 36,233 dwellings in Santa Barbara, owner-occupied units account for 14,819 (40.9%), while renter-occupied units make up 21,414 (59.1%).
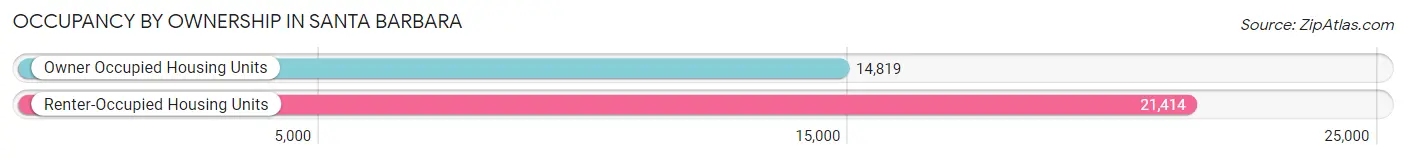
| Occupancy | # Housing Units | % Housing Units |
| Owner Occupied Housing Units | 14,819 | 40.9% |
| Renter-Occupied Housing Units | 21,414 | 59.1% |
| Total Occupied Housing Units | 36,233 | 100.0% |
Occupancy by Household Size in Santa Barbara
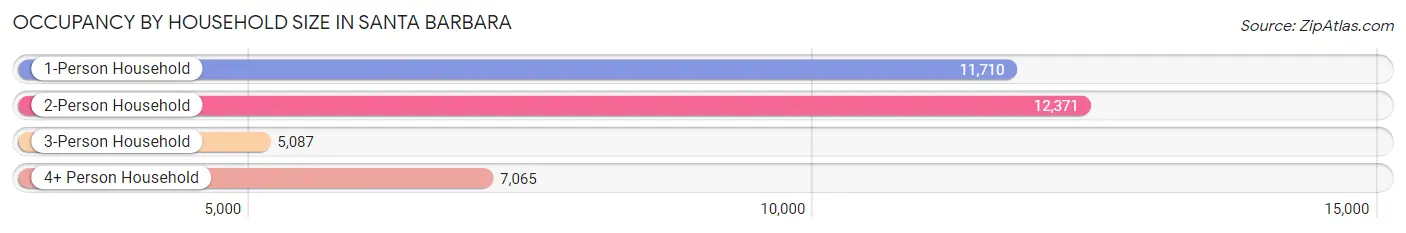
| Household Size | # Housing Units | % Housing Units |
| 1-Person Household | 11,710 | 32.3% |
| 2-Person Household | 12,371 | 34.1% |
| 3-Person Household | 5,087 | 14.0% |
| 4+ Person Household | 7,065 | 19.5% |
| Total Housing Units | 36,233 | 100.0% |
Occupancy by Ownership by Household Size in Santa Barbara
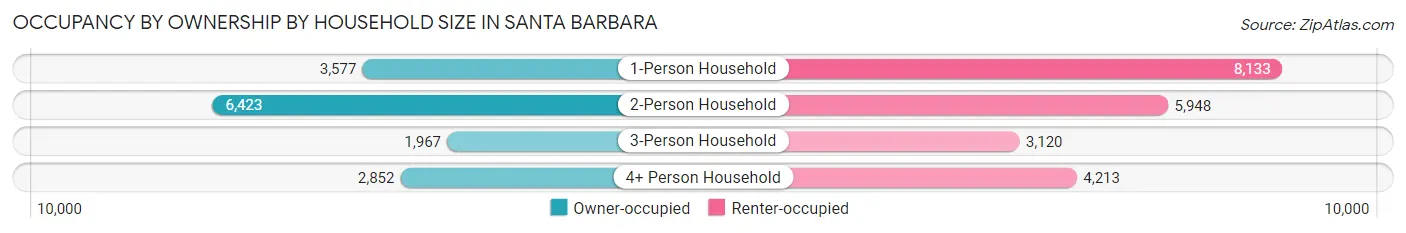
| Household Size | Owner-occupied | Renter-occupied |
| 1-Person Household | 3,577 (30.5%) | 8,133 (69.5%) |
| 2-Person Household | 6,423 (51.9%) | 5,948 (48.1%) |
| 3-Person Household | 1,967 (38.7%) | 3,120 (61.3%) |
| 4+ Person Household | 2,852 (40.4%) | 4,213 (59.6%) |
| Total Housing Units | 14,819 (40.9%) | 21,414 (59.1%) |
Occupancy by Educational Attainment in Santa Barbara
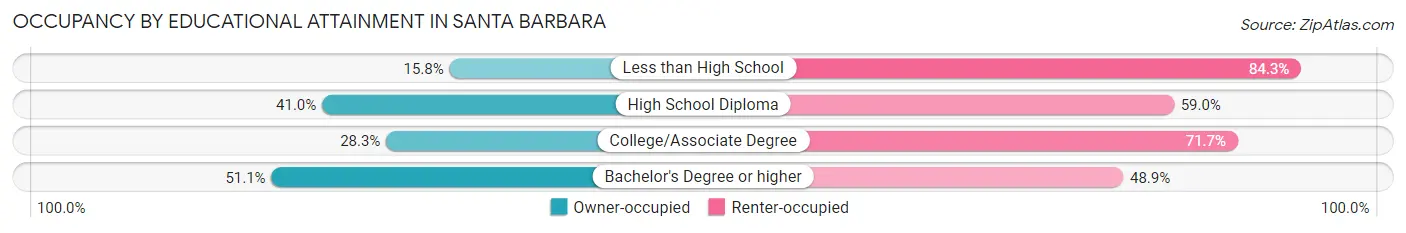
| Household Size | Owner-occupied | Renter-occupied |
| Less than High School | 455 (15.8%) | 2,434 (84.3%) |
| High School Diploma | 1,351 (41.0%) | 1,943 (59.0%) |
| College/Associate Degree | 2,900 (28.3%) | 7,345 (71.7%) |
| Bachelor's Degree or higher | 10,113 (51.1%) | 9,692 (48.9%) |
Occupancy by Age of Householder in Santa Barbara
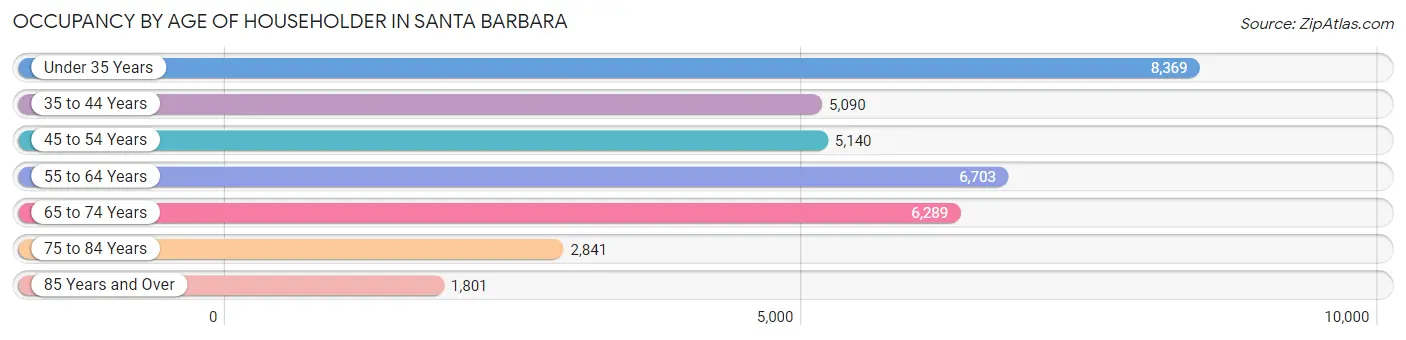
| Age Bracket | # Households | % Households |
| Under 35 Years | 8,369 | 23.1% |
| 35 to 44 Years | 5,090 | 14.1% |
| 45 to 54 Years | 5,140 | 14.2% |
| 55 to 64 Years | 6,703 | 18.5% |
| 65 to 74 Years | 6,289 | 17.4% |
| 75 to 84 Years | 2,841 | 7.8% |
| 85 Years and Over | 1,801 | 5.0% |
| Total | 36,233 | 100.0% |
Housing Finances in Santa Barbara
Median Income by Occupancy in Santa Barbara
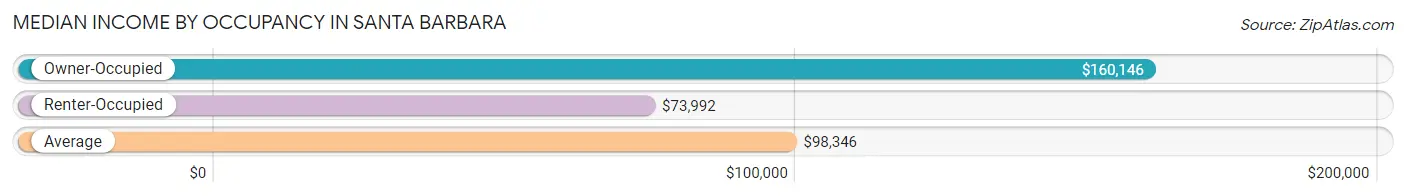
| Occupancy Type | # Households | Median Income |
| Owner-Occupied | 14,819 (40.9%) | $160,146 |
| Renter-Occupied | 21,414 (59.1%) | $73,992 |
| Average | 36,233 (100.0%) | $98,346 |
Occupancy by Householder Income Bracket in Santa Barbara
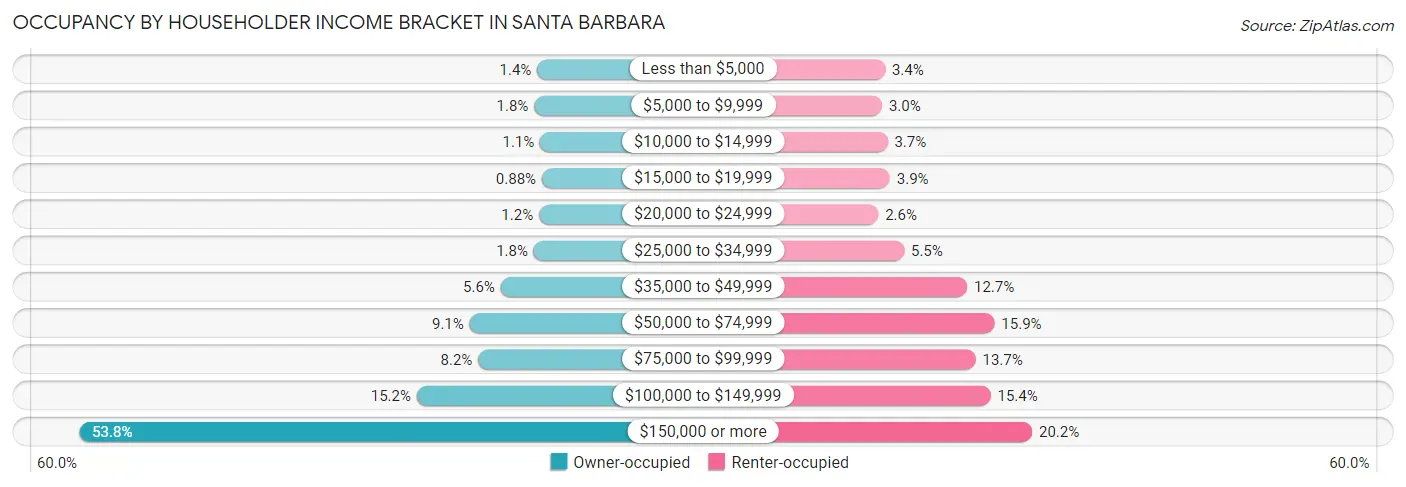
| Income Bracket | Owner-occupied | Renter-occupied |
| Less than $5,000 | 211 (1.4%) | 720 (3.4%) |
| $5,000 to $9,999 | 261 (1.8%) | 646 (3.0%) |
| $10,000 to $14,999 | 160 (1.1%) | 782 (3.6%) |
| $15,000 to $19,999 | 130 (0.9%) | 840 (3.9%) |
| $20,000 to $24,999 | 179 (1.2%) | 555 (2.6%) |
| $25,000 to $34,999 | 268 (1.8%) | 1,186 (5.5%) |
| $35,000 to $49,999 | 829 (5.6%) | 2,728 (12.7%) |
| $50,000 to $74,999 | 1,354 (9.1%) | 3,398 (15.9%) |
| $75,000 to $99,999 | 1,209 (8.2%) | 2,935 (13.7%) |
| $100,000 to $149,999 | 2,249 (15.2%) | 3,305 (15.4%) |
| $150,000 or more | 7,969 (53.8%) | 4,319 (20.2%) |
| Total | 14,819 (100.0%) | 21,414 (100.0%) |
Monthly Housing Cost Tiers in Santa Barbara
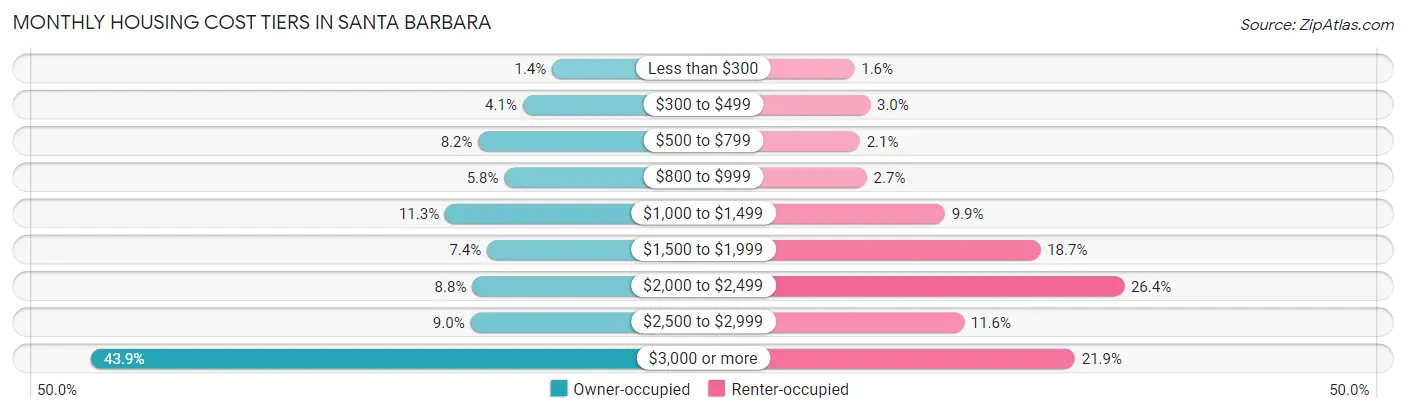
| Monthly Cost | Owner-occupied | Renter-occupied |
| Less than $300 | 214 (1.4%) | 332 (1.5%) |
| $300 to $499 | 614 (4.1%) | 643 (3.0%) |
| $500 to $799 | 1,219 (8.2%) | 438 (2.1%) |
| $800 to $999 | 866 (5.8%) | 577 (2.7%) |
| $1,000 to $1,499 | 1,674 (11.3%) | 2,115 (9.9%) |
| $1,500 to $1,999 | 1,101 (7.4%) | 3,999 (18.7%) |
| $2,000 to $2,499 | 1,303 (8.8%) | 5,649 (26.4%) |
| $2,500 to $2,999 | 1,326 (8.9%) | 2,491 (11.6%) |
| $3,000 or more | 6,502 (43.9%) | 4,678 (21.8%) |
| Total | 14,819 (100.0%) | 21,414 (100.0%) |
Physical Housing Characteristics in Santa Barbara
Housing Structures in Santa Barbara
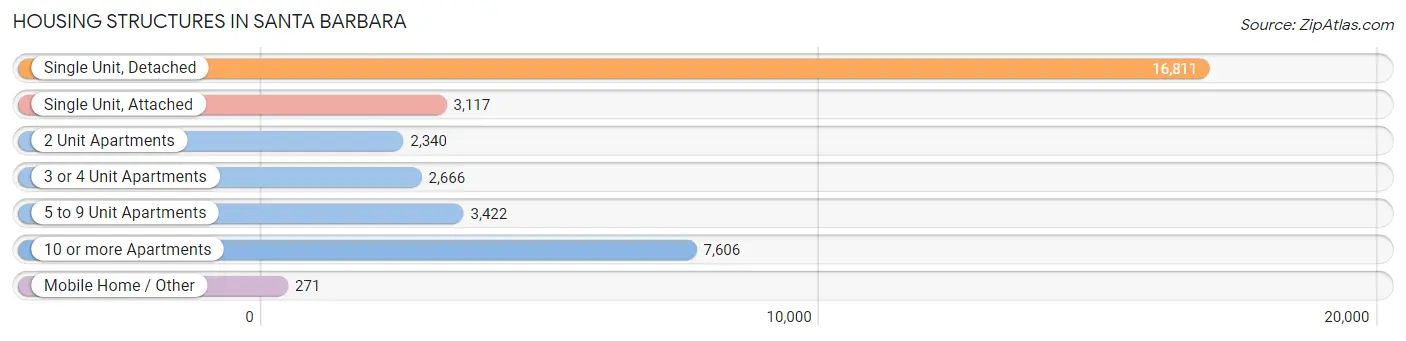
| Structure Type | # Housing Units | % Housing Units |
| Single Unit, Detached | 16,811 | 46.4% |
| Single Unit, Attached | 3,117 | 8.6% |
| 2 Unit Apartments | 2,340 | 6.5% |
| 3 or 4 Unit Apartments | 2,666 | 7.4% |
| 5 to 9 Unit Apartments | 3,422 | 9.4% |
| 10 or more Apartments | 7,606 | 21.0% |
| Mobile Home / Other | 271 | 0.7% |
| Total | 36,233 | 100.0% |
Housing Structures by Occupancy in Santa Barbara
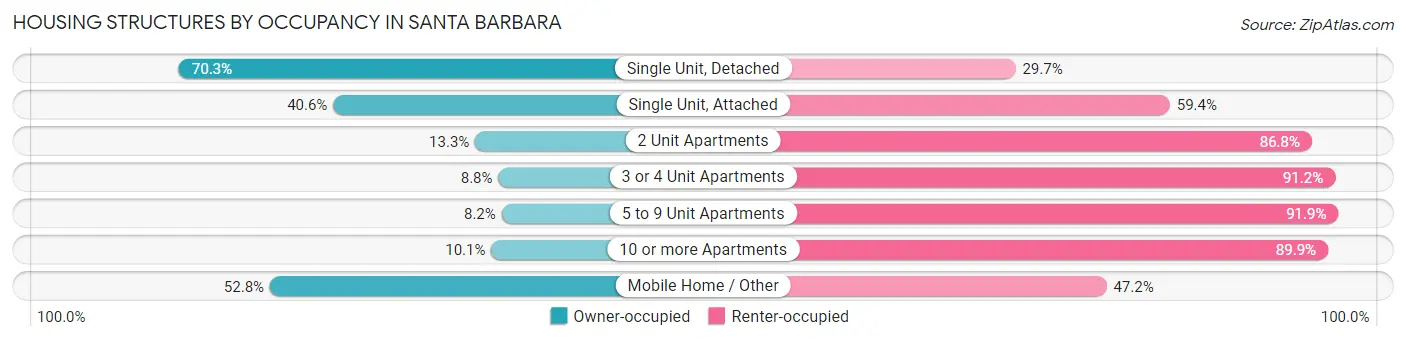
| Structure Type | Owner-occupied | Renter-occupied |
| Single Unit, Detached | 11,817 (70.3%) | 4,994 (29.7%) |
| Single Unit, Attached | 1,265 (40.6%) | 1,852 (59.4%) |
| 2 Unit Apartments | 310 (13.3%) | 2,030 (86.8%) |
| 3 or 4 Unit Apartments | 234 (8.8%) | 2,432 (91.2%) |
| 5 to 9 Unit Apartments | 279 (8.2%) | 3,143 (91.8%) |
| 10 or more Apartments | 771 (10.1%) | 6,835 (89.9%) |
| Mobile Home / Other | 143 (52.8%) | 128 (47.2%) |
| Total | 14,819 (40.9%) | 21,414 (59.1%) |
Housing Structures by Number of Rooms in Santa Barbara
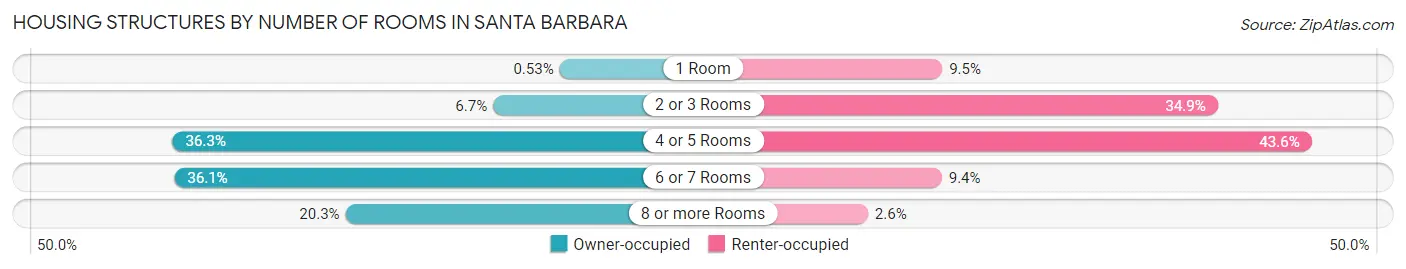
| Number of Rooms | Owner-occupied | Renter-occupied |
| 1 Room | 78 (0.5%) | 2,025 (9.5%) |
| 2 or 3 Rooms | 990 (6.7%) | 7,478 (34.9%) |
| 4 or 5 Rooms | 5,382 (36.3%) | 9,339 (43.6%) |
| 6 or 7 Rooms | 5,356 (36.1%) | 2,017 (9.4%) |
| 8 or more Rooms | 3,013 (20.3%) | 555 (2.6%) |
| Total | 14,819 (100.0%) | 21,414 (100.0%) |
Housing Structure by Heating Type in Santa Barbara
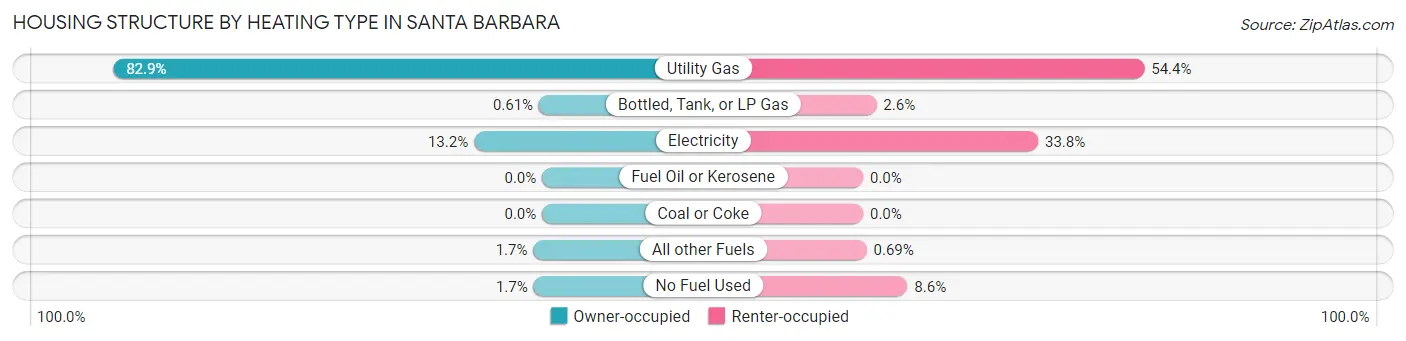
| Heating Type | Owner-occupied | Renter-occupied |
| Utility Gas | 12,280 (82.9%) | 11,638 (54.3%) |
| Bottled, Tank, or LP Gas | 91 (0.6%) | 553 (2.6%) |
| Electricity | 1,950 (13.2%) | 7,240 (33.8%) |
| Fuel Oil or Kerosene | 0 (0.0%) | 0 (0.0%) |
| Coal or Coke | 0 (0.0%) | 0 (0.0%) |
| All other Fuels | 252 (1.7%) | 148 (0.7%) |
| No Fuel Used | 246 (1.7%) | 1,835 (8.6%) |
| Total | 14,819 (100.0%) | 21,414 (100.0%) |
Household Vehicle Usage in Santa Barbara
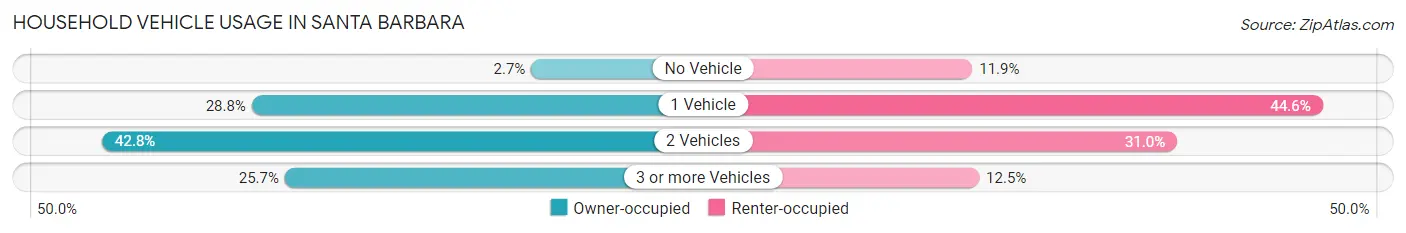
| Vehicles per Household | Owner-occupied | Renter-occupied |
| No Vehicle | 402 (2.7%) | 2,546 (11.9%) |
| 1 Vehicle | 4,268 (28.8%) | 9,546 (44.6%) |
| 2 Vehicles | 6,339 (42.8%) | 6,638 (31.0%) |
| 3 or more Vehicles | 3,810 (25.7%) | 2,684 (12.5%) |
| Total | 14,819 (100.0%) | 21,414 (100.0%) |
Real Estate & Mortgages in Santa Barbara
Real Estate and Mortgage Overview in Santa Barbara
| Characteristic | Without Mortgage | With Mortgage |
| Housing Units | 5,283 | 9,536 |
| Median Property Value | $1,337,200 | $1,351,100 |
| Median Household Income | $123,523 | $5,662 |
| Monthly Housing Costs | $958 | $6,391 |
| Real Estate Taxes | $4,965 | $92 |
Property Value by Mortgage Status in Santa Barbara
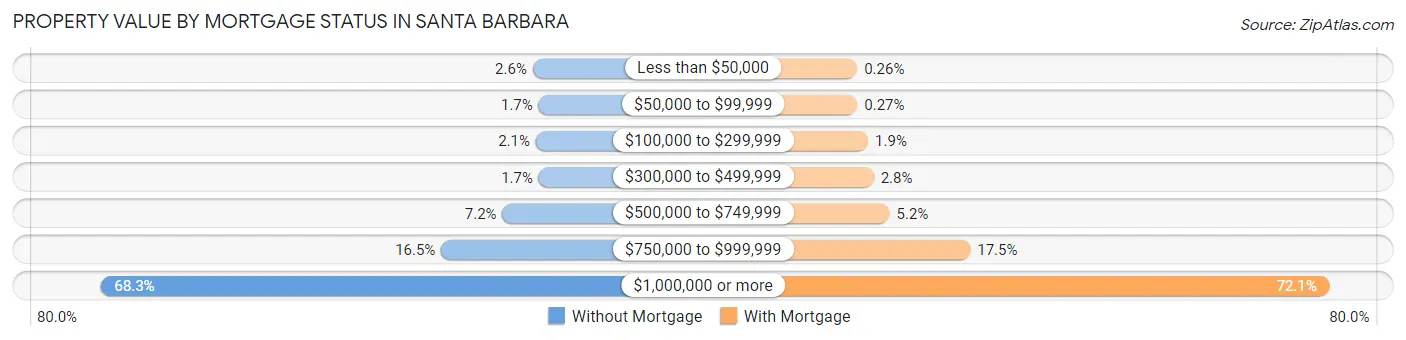
| Property Value | Without Mortgage | With Mortgage |
| Less than $50,000 | 136 (2.6%) | 25 (0.3%) |
| $50,000 to $99,999 | 88 (1.7%) | 26 (0.3%) |
| $100,000 to $299,999 | 111 (2.1%) | 183 (1.9%) |
| $300,000 to $499,999 | 87 (1.7%) | 264 (2.8%) |
| $500,000 to $749,999 | 380 (7.2%) | 495 (5.2%) |
| $750,000 to $999,999 | 873 (16.5%) | 1,668 (17.5%) |
| $1,000,000 or more | 3,608 (68.3%) | 6,875 (72.1%) |
| Total | 5,283 (100.0%) | 9,536 (100.0%) |
Household Income by Mortgage Status in Santa Barbara
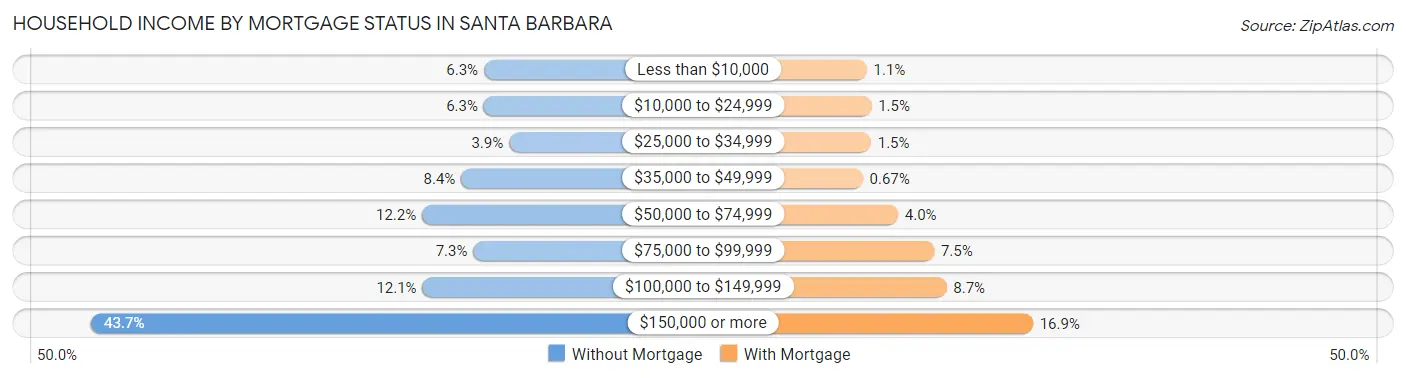
| Household Income | Without Mortgage | With Mortgage |
| Less than $10,000 | 330 (6.2%) | 100 (1.1%) |
| $10,000 to $24,999 | 331 (6.3%) | 142 (1.5%) |
| $25,000 to $34,999 | 204 (3.9%) | 138 (1.5%) |
| $35,000 to $49,999 | 445 (8.4%) | 64 (0.7%) |
| $50,000 to $74,999 | 642 (12.1%) | 384 (4.0%) |
| $75,000 to $99,999 | 384 (7.3%) | 712 (7.5%) |
| $100,000 to $149,999 | 640 (12.1%) | 825 (8.6%) |
| $150,000 or more | 2,307 (43.7%) | 1,609 (16.9%) |
| Total | 5,283 (100.0%) | 9,536 (100.0%) |
Property Value to Household Income Ratio in Santa Barbara
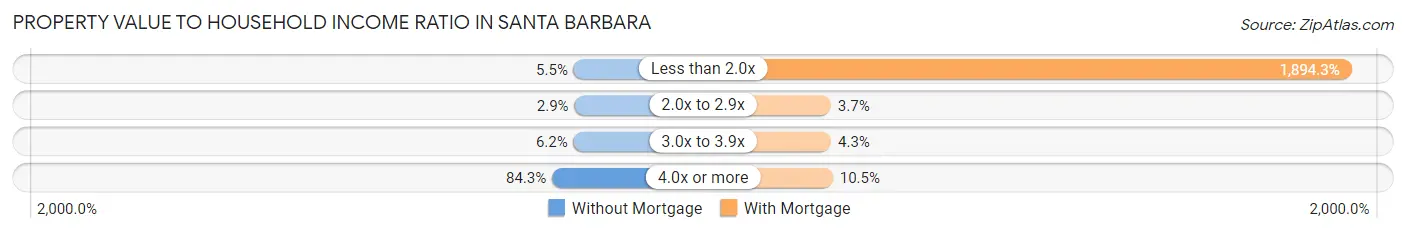
| Value-to-Income Ratio | Without Mortgage | With Mortgage |
| Less than 2.0x | 288 (5.4%) | 180,642 (1,894.3%) |
| 2.0x to 2.9x | 151 (2.9%) | 348 (3.6%) |
| 3.0x to 3.9x | 327 (6.2%) | 408 (4.3%) |
| 4.0x or more | 4,451 (84.3%) | 997 (10.5%) |
| Total | 5,283 (100.0%) | 9,536 (100.0%) |
Real Estate Taxes by Mortgage Status in Santa Barbara
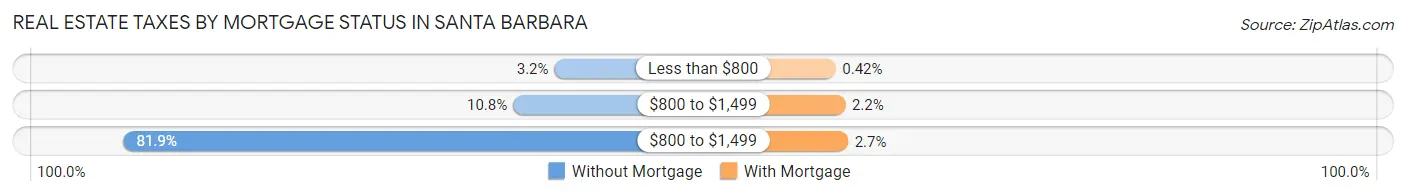
| Property Taxes | Without Mortgage | With Mortgage |
| Less than $800 | 171 (3.2%) | 40 (0.4%) |
| $800 to $1,499 | 570 (10.8%) | 208 (2.2%) |
| $800 to $1,499 | 4,328 (81.9%) | 256 (2.7%) |
| Total | 5,283 (100.0%) | 9,536 (100.0%) |
Health & Disability in Santa Barbara
Health Insurance Coverage by Age in Santa Barbara
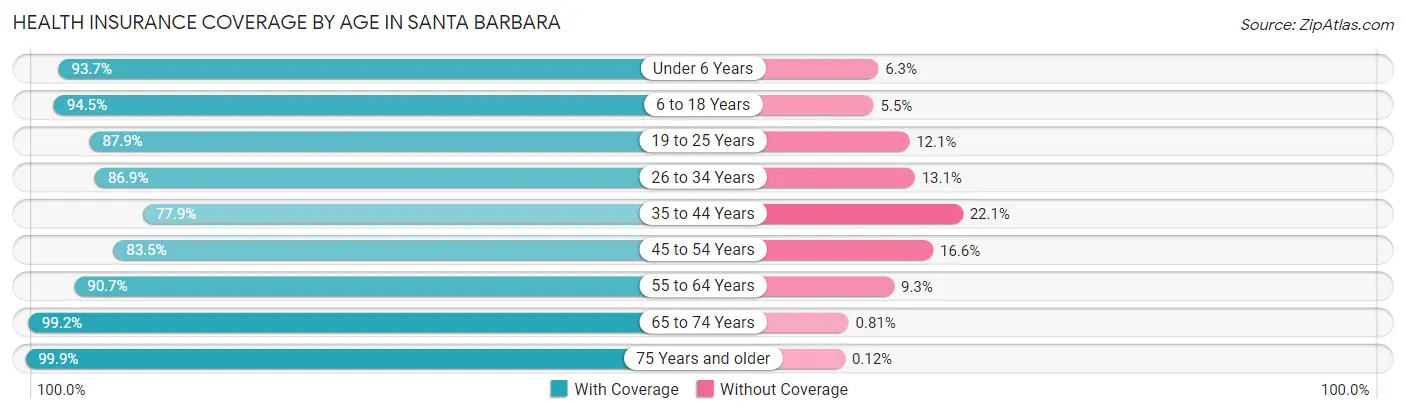
| Age Bracket | With Coverage | Without Coverage |
| Under 6 Years | 4,858 (93.7%) | 329 (6.3%) |
| 6 to 18 Years | 10,323 (94.5%) | 596 (5.5%) |
| 19 to 25 Years | 9,452 (87.9%) | 1,301 (12.1%) |
| 26 to 34 Years | 11,012 (86.9%) | 1,664 (13.1%) |
| 35 to 44 Years | 7,977 (77.9%) | 2,261 (22.1%) |
| 45 to 54 Years | 8,156 (83.5%) | 1,617 (16.6%) |
| 55 to 64 Years | 10,326 (90.7%) | 1,055 (9.3%) |
| 65 to 74 Years | 9,775 (99.2%) | 80 (0.8%) |
| 75 Years and older | 7,263 (99.9%) | 9 (0.1%) |
| Total | 79,142 (89.9%) | 8,912 (10.1%) |
Health Insurance Coverage by Citizenship Status in Santa Barbara
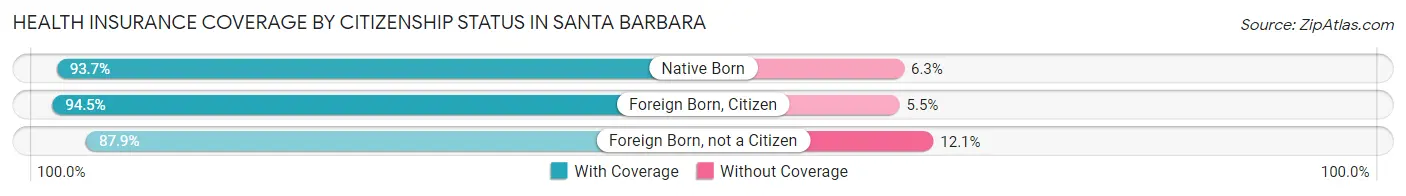
| Citizenship Status | With Coverage | Without Coverage |
| Native Born | 4,858 (93.7%) | 329 (6.3%) |
| Foreign Born, Citizen | 10,323 (94.5%) | 596 (5.5%) |
| Foreign Born, not a Citizen | 9,452 (87.9%) | 1,301 (12.1%) |
Health Insurance Coverage by Household Income in Santa Barbara
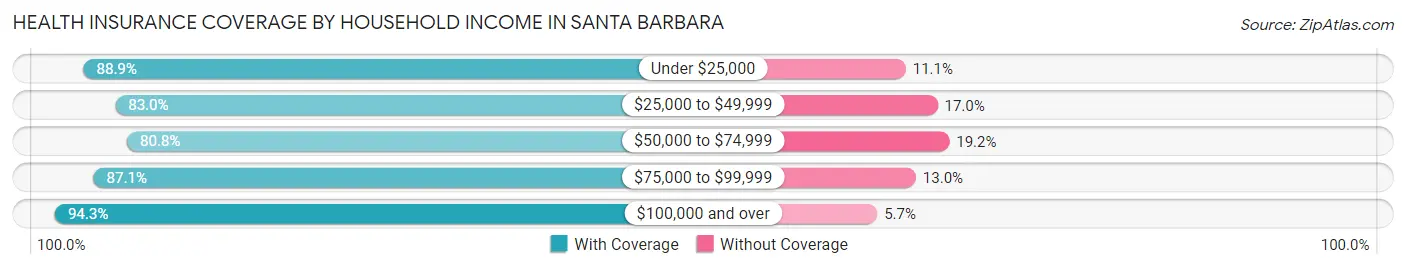
| Household Income | With Coverage | Without Coverage |
| Under $25,000 | 6,503 (88.9%) | 809 (11.1%) |
| $25,000 to $49,999 | 9,108 (83.0%) | 1,865 (17.0%) |
| $50,000 to $74,999 | 8,507 (80.8%) | 2,023 (19.2%) |
| $75,000 to $99,999 | 9,099 (87.1%) | 1,354 (13.0%) |
| $100,000 and over | 44,712 (94.3%) | 2,704 (5.7%) |
Public vs Private Health Insurance Coverage by Age in Santa Barbara
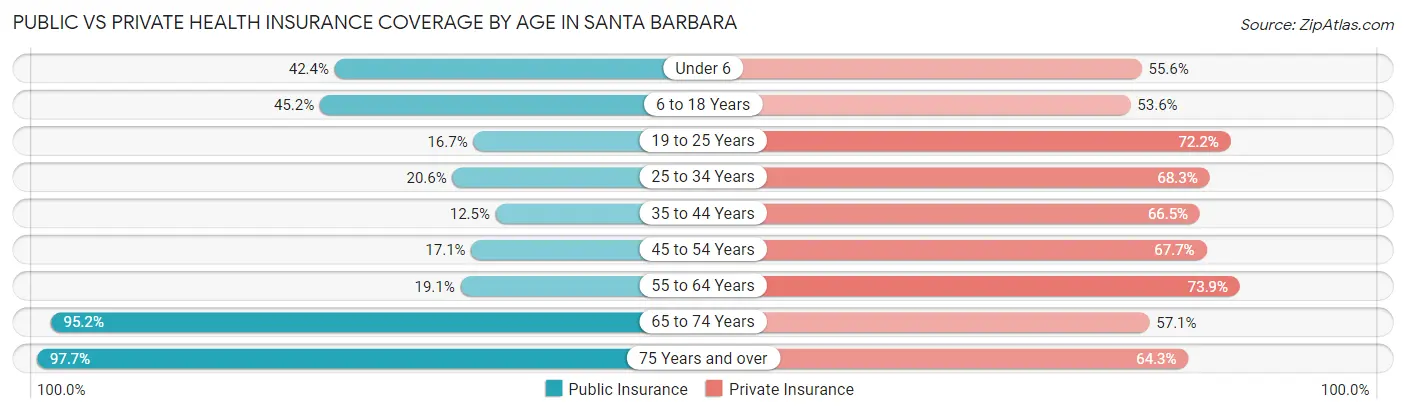
| Age Bracket | Public Insurance | Private Insurance |
| Under 6 | 2,201 (42.4%) | 2,886 (55.6%) |
| 6 to 18 Years | 4,931 (45.2%) | 5,849 (53.6%) |
| 19 to 25 Years | 1,794 (16.7%) | 7,760 (72.2%) |
| 25 to 34 Years | 2,608 (20.6%) | 8,651 (68.2%) |
| 35 to 44 Years | 1,284 (12.5%) | 6,805 (66.5%) |
| 45 to 54 Years | 1,668 (17.1%) | 6,613 (67.7%) |
| 55 to 64 Years | 2,171 (19.1%) | 8,408 (73.9%) |
| 65 to 74 Years | 9,380 (95.2%) | 5,626 (57.1%) |
| 75 Years and over | 7,106 (97.7%) | 4,677 (64.3%) |
| Total | 33,143 (37.6%) | 57,275 (65.0%) |
Disability Status by Sex by Age in Santa Barbara
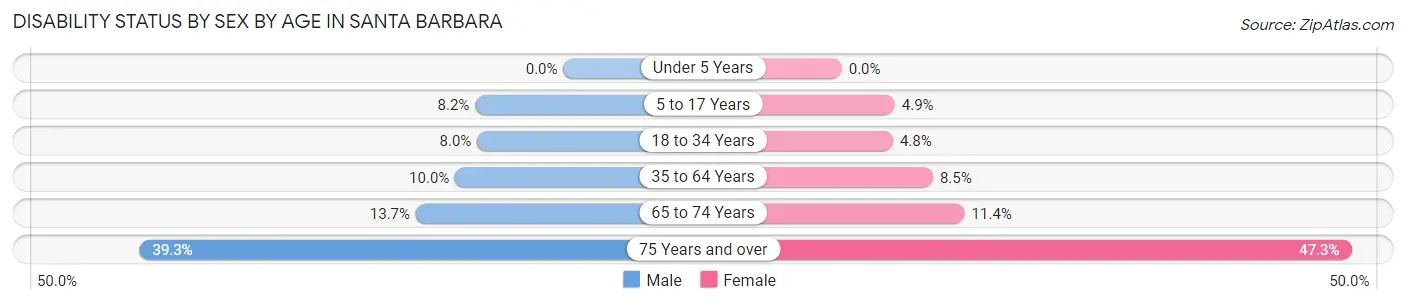
| Age Bracket | Male | Female |
| Under 5 Years | 0 (0.0%) | 0 (0.0%) |
| 5 to 17 Years | 446 (8.2%) | 250 (4.9%) |
| 18 to 34 Years | 965 (8.0%) | 599 (4.8%) |
| 35 to 64 Years | 1,607 (10.0%) | 1,302 (8.5%) |
| 65 to 74 Years | 637 (13.7%) | 593 (11.4%) |
| 75 Years and over | 1,183 (39.3%) | 2,017 (47.3%) |
Disability Class by Sex by Age in Santa Barbara
Disability Class: Hearing Difficulty
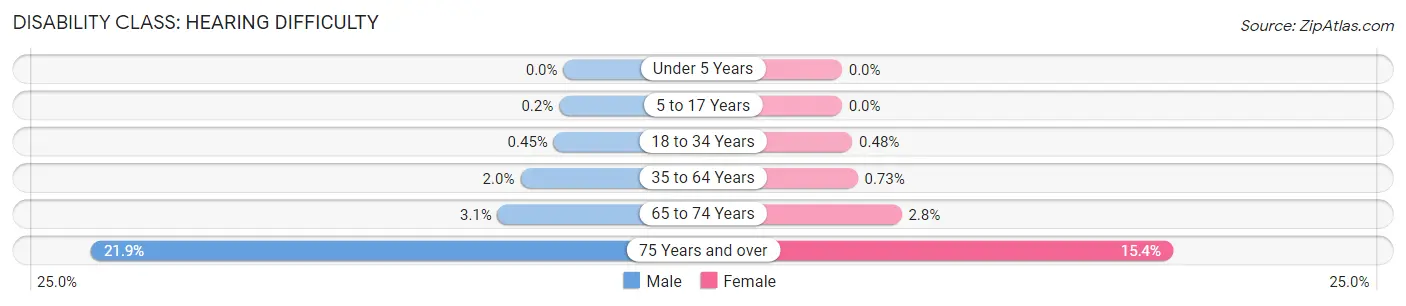
| Age Bracket | Male | Female |
| Under 5 Years | 0 (0.0%) | 0 (0.0%) |
| 5 to 17 Years | 11 (0.2%) | 0 (0.0%) |
| 18 to 34 Years | 54 (0.4%) | 61 (0.5%) |
| 35 to 64 Years | 320 (2.0%) | 113 (0.7%) |
| 65 to 74 Years | 142 (3.0%) | 144 (2.8%) |
| 75 Years and over | 659 (21.9%) | 655 (15.4%) |
Disability Class: Vision Difficulty
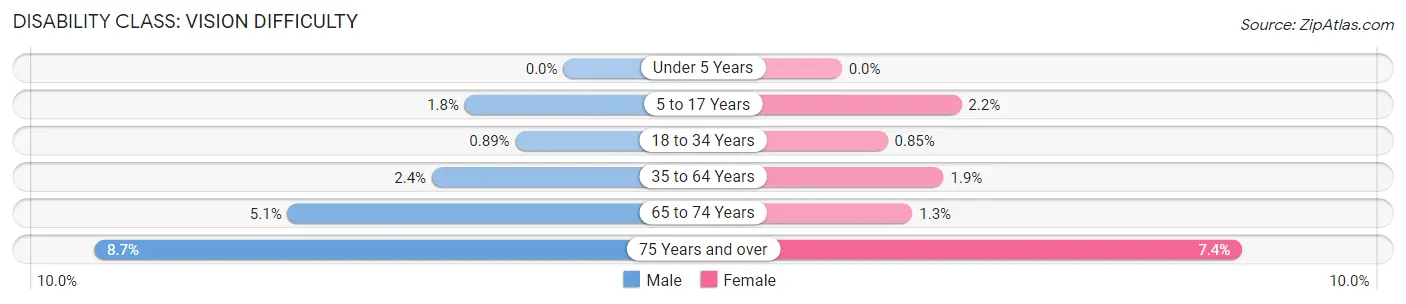
| Age Bracket | Male | Female |
| Under 5 Years | 0 (0.0%) | 0 (0.0%) |
| 5 to 17 Years | 100 (1.8%) | 113 (2.2%) |
| 18 to 34 Years | 107 (0.9%) | 107 (0.9%) |
| 35 to 64 Years | 391 (2.4%) | 291 (1.9%) |
| 65 to 74 Years | 238 (5.1%) | 68 (1.3%) |
| 75 Years and over | 262 (8.7%) | 317 (7.4%) |
Disability Class: Cognitive Difficulty
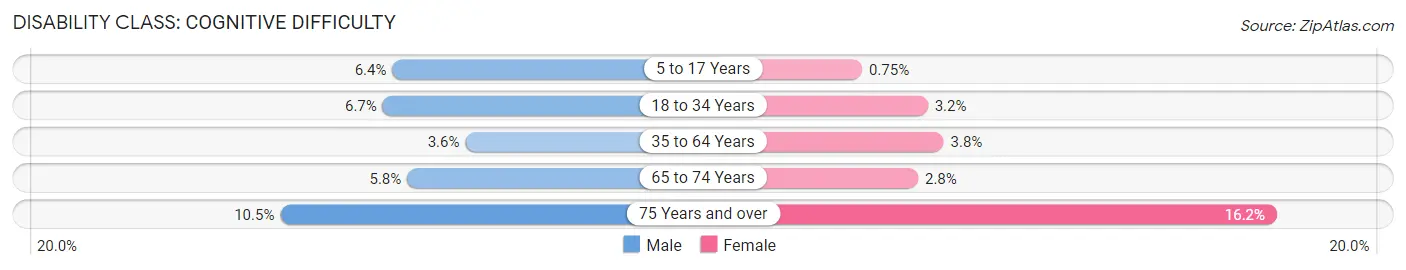
| Age Bracket | Male | Female |
| 5 to 17 Years | 346 (6.4%) | 38 (0.7%) |
| 18 to 34 Years | 809 (6.7%) | 402 (3.2%) |
| 35 to 64 Years | 583 (3.6%) | 582 (3.8%) |
| 65 to 74 Years | 270 (5.8%) | 147 (2.8%) |
| 75 Years and over | 316 (10.5%) | 689 (16.2%) |
Disability Class: Ambulatory Difficulty
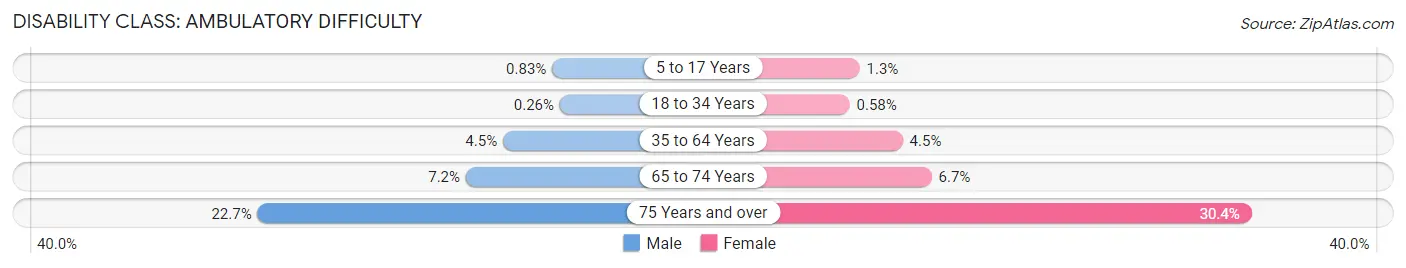
| Age Bracket | Male | Female |
| 5 to 17 Years | 45 (0.8%) | 67 (1.3%) |
| 18 to 34 Years | 31 (0.3%) | 73 (0.6%) |
| 35 to 64 Years | 717 (4.5%) | 696 (4.5%) |
| 65 to 74 Years | 337 (7.2%) | 347 (6.7%) |
| 75 Years and over | 683 (22.7%) | 1,298 (30.4%) |
Disability Class: Self-Care Difficulty
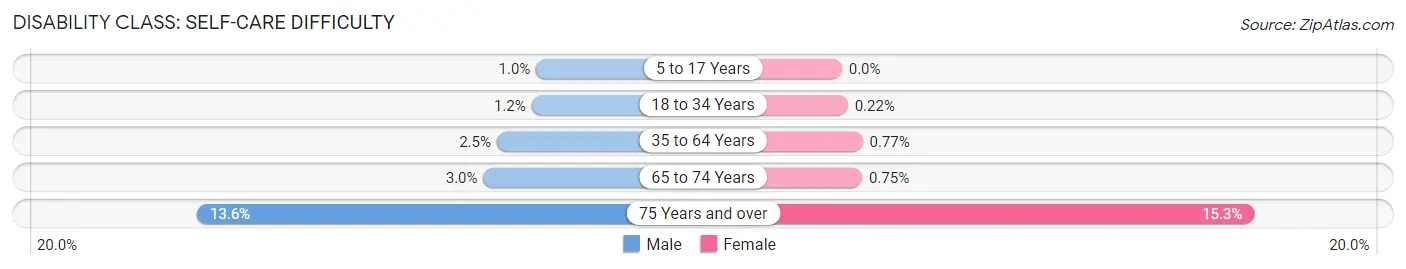
| Age Bracket | Male | Female |
| 5 to 17 Years | 55 (1.0%) | 0 (0.0%) |
| 18 to 34 Years | 142 (1.2%) | 28 (0.2%) |
| 35 to 64 Years | 396 (2.5%) | 119 (0.8%) |
| 65 to 74 Years | 138 (3.0%) | 39 (0.7%) |
| 75 Years and over | 409 (13.6%) | 653 (15.3%) |
Technology Access in Santa Barbara
Computing Device Access in Santa Barbara
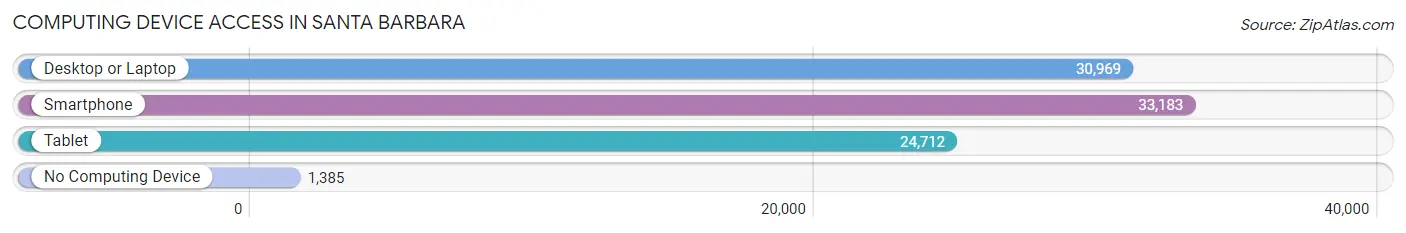
| Device Type | # Households | % Households |
| Desktop or Laptop | 30,969 | 85.5% |
| Smartphone | 33,183 | 91.6% |
| Tablet | 24,712 | 68.2% |
| No Computing Device | 1,385 | 3.8% |
| Total | 36,233 | 100.0% |
Internet Access in Santa Barbara
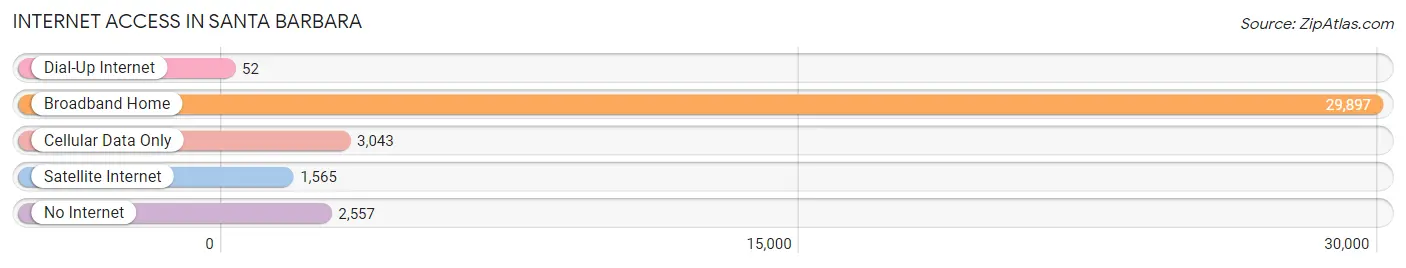
| Internet Type | # Households | % Households |
| Dial-Up Internet | 52 | 0.1% |
| Broadband Home | 29,897 | 82.5% |
| Cellular Data Only | 3,043 | 8.4% |
| Satellite Internet | 1,565 | 4.3% |
| No Internet | 2,557 | 7.1% |
| Total | 36,233 | 100.0% |
Santa Barbara Summary
Santa Barbara, California is a city located in the Central Coast region of the state, approximately 90 miles northwest of Los Angeles. It is the county seat of Santa Barbara County and is known for its Mediterranean climate, beautiful beaches, and stunning mountain views. The city has a population of approximately 92,000 people and is a popular tourist destination.
History
Santa Barbara was first inhabited by the Chumash people, who lived in the area for thousands of years before the arrival of Europeans. The first Europeans to explore the area were Spanish explorers, who arrived in the late 18th century. The city was founded in 1782 by Spanish missionaries, who named it after Saint Barbara. The city was part of Mexico until 1848, when it became part of the United States after the Mexican-American War.
In the late 19th century, Santa Barbara became a popular tourist destination, and the city’s economy was largely based on tourism. The city was also known for its oil industry, which began in the early 20th century. In 1925, a major earthquake destroyed much of the city, but it was quickly rebuilt.
Geography
Santa Barbara is located on the Pacific Coast of California, approximately 90 miles northwest of Los Angeles. The city is situated on a coastal plain, with the Santa Ynez Mountains to the north and the Santa Monica Mountains to the south. The city is bordered by the Pacific Ocean to the west and the Santa Ynez Valley to the east.
The climate in Santa Barbara is Mediterranean, with mild temperatures year-round. The average high temperature in the summer is around 75 degrees Fahrenheit, and the average low temperature in the winter is around 50 degrees Fahrenheit.
Economy
Santa Barbara’s economy is largely based on tourism, with many visitors coming to the city to enjoy its beaches, mountains, and Mediterranean climate. The city is also home to several large companies, including Raytheon, Deckers Outdoor Corporation, and Santa Barbara Bank & Trust.
The city’s economy is also supported by its oil industry, which began in the early 20th century. The city is home to several oil refineries, and the oil industry is a major employer in the area.
Demographics
As of the 2010 census, Santa Barbara had a population of 92,325 people. The racial makeup of the city was 75.3% White, 2.2% African American, 0.7% Native American, 8.2% Asian, 0.2% Pacific Islander, 8.7% from other races, and 4.7% from two or more races. Hispanic or Latino of any race were 24.6% of the population.
The median household income in Santa Barbara was $63,945, and the median family income was $77,837. The per capita income was $37,845. About 11.2% of the population was below the poverty line.
Santa Barbara is a diverse city, with a variety of cultures and backgrounds represented. The city is home to a large Hispanic population, as well as a significant number of Asian and Pacific Islander residents. The city is also home to a large number of students, as it is home to the University of California, Santa Barbara.
Common Questions
What is Per Capita Income in Santa Barbara?
Per Capita income in Santa Barbara is $58,989.
What is the Median Family Income in Santa Barbara?
Median Family Income in Santa Barbara is $132,500.
What is the Median Household income in Santa Barbara?
Median Household Income in Santa Barbara is $98,346.
What is Income or Wage Gap in Santa Barbara?
Income or Wage Gap in Santa Barbara is 22.7%.
Women in Santa Barbara earn 77.3 cents for every dollar earned by a man.
What is Family Income Deficit in Santa Barbara?
Family Income Deficit in Santa Barbara is $9,957.
Families that are below poverty line in Santa Barbara earn $9,957 less on average than the poverty threshold level.
What is Inequality or Gini Index in Santa Barbara?
Inequality or Gini Index in Santa Barbara is 0.49.
What is the Total Population of Santa Barbara?
Total Population of Santa Barbara is 88,640.
What is the Total Male Population of Santa Barbara?
Total Male Population of Santa Barbara is 43,886.
What is the Total Female Population of Santa Barbara?
Total Female Population of Santa Barbara is 44,754.
What is the Ratio of Males per 100 Females in Santa Barbara?
There are 98.06 Males per 100 Females in Santa Barbara.
What is the Ratio of Females per 100 Males in Santa Barbara?
There are 101.98 Females per 100 Males in Santa Barbara.
What is the Median Population Age in Santa Barbara?
Median Population Age in Santa Barbara is 39.6 Years.
What is the Average Family Size in Santa Barbara
Average Family Size in Santa Barbara is 3.0 People.
What is the Average Household Size in Santa Barbara
Average Household Size in Santa Barbara is 2.4 People.
How Large is the Labor Force in Santa Barbara?
There are 48,990 People in the Labor Forcein in Santa Barbara.
What is the Percentage of People in the Labor Force in Santa Barbara?
64.9% of People are in the Labor Force in Santa Barbara.
What is the Unemployment Rate in Santa Barbara?
Unemployment Rate in Santa Barbara is 4.4%.