Rosemont, CA Map & Demographics
Rosemont Map
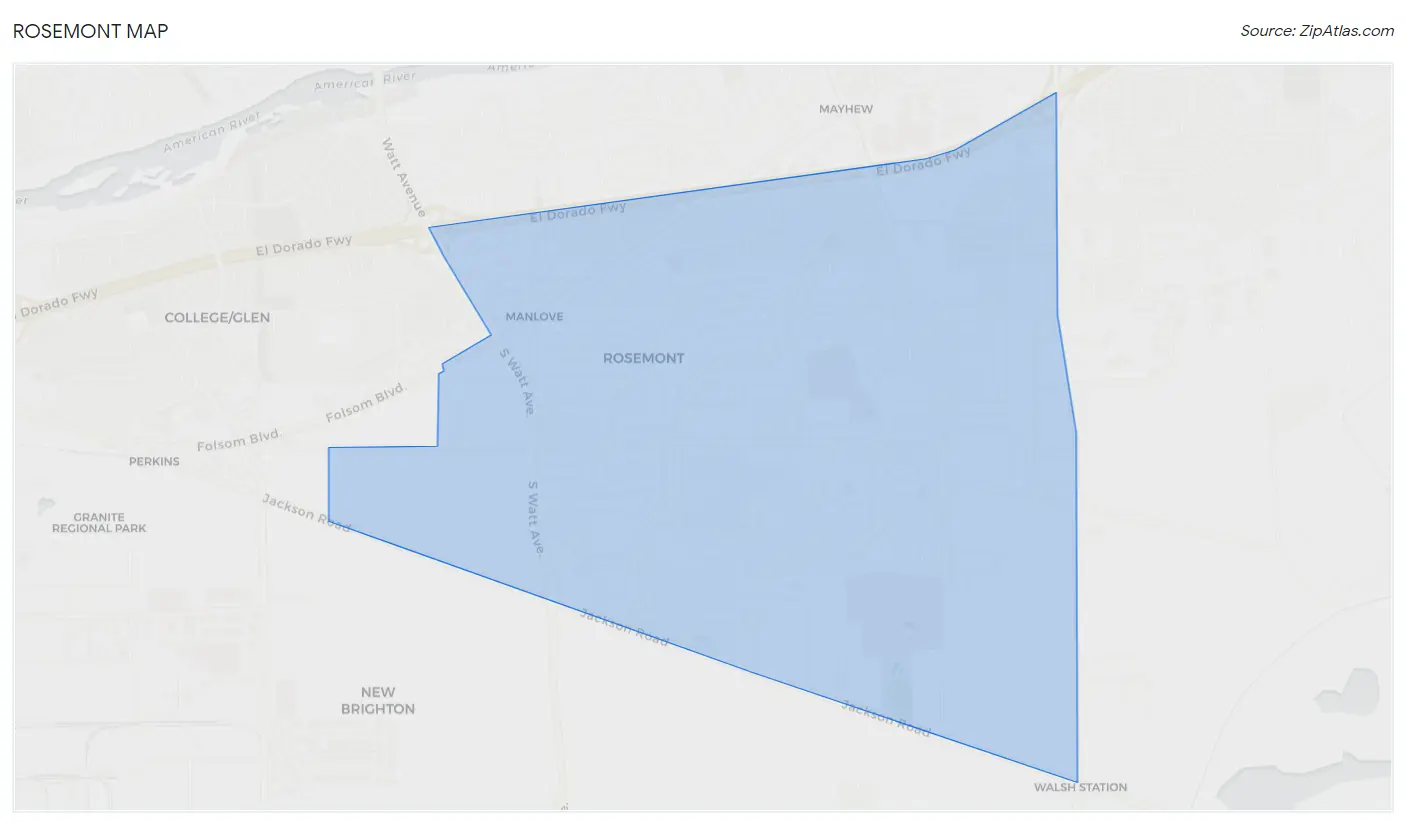
Rosemont Overview
$38,701
PER CAPITA INCOME
$98,136
AVG FAMILY INCOME
$86,818
AVG HOUSEHOLD INCOME
21.3%
WAGE / INCOME GAP [ % ]
78.7¢/ $1
WAGE / INCOME GAP [ $ ]
$10,216
FAMILY INCOME DEFICIT
0.39
INEQUALITY / GINI INDEX
23,845
TOTAL POPULATION
10,975
MALE POPULATION
12,870
FEMALE POPULATION
85.28
MALES / 100 FEMALES
117.27
FEMALES / 100 MALES
36.0
MEDIAN AGE
3.2
AVG FAMILY SIZE
2.7
AVG HOUSEHOLD SIZE
12,511
LABOR FORCE [ PEOPLE ]
66.1%
PERCENT IN LABOR FORCE
6.9%
UNEMPLOYMENT RATE
Income in Rosemont
Income Overview in Rosemont
Per Capita Income in Rosemont is $38,701, while median incomes of families and households are $98,136 and $86,818 respectively.
| Characteristic | Number | Measure |
| Per Capita Income | 23,845 | $38,701 |
| Median Family Income | 5,585 | $98,136 |
| Mean Family Income | 5,585 | $111,102 |
| Median Household Income | 8,813 | $86,818 |
| Mean Household Income | 8,813 | $101,412 |
| Income Deficit | 5,585 | $10,216 |
| Wage / Income Gap (%) | 23,845 | 21.26% |
| Wage / Income Gap ($) | 23,845 | 78.74¢ per $1 |
| Gini / Inequality Index | 23,845 | 0.39 |
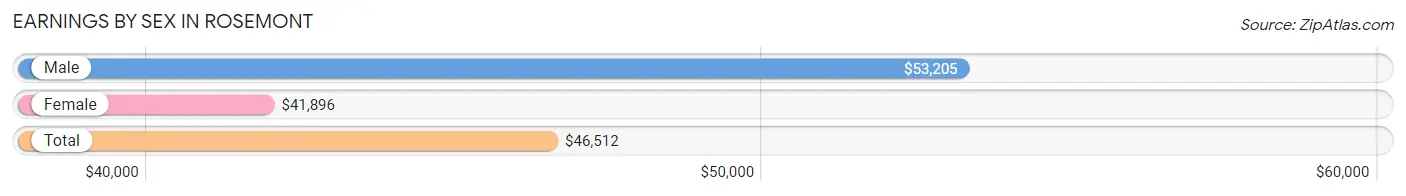
Earnings by Sex in Rosemont
Average Earnings in Rosemont are $46,512, $53,205 for men and $41,896 for women, a difference of 21.3%.
| Sex | Number | Average Earnings |
| Male | 6,003 (47.2%) | $53,205 |
| Female | 6,720 (52.8%) | $41,896 |
| Total | 12,723 (100.0%) | $46,512 |
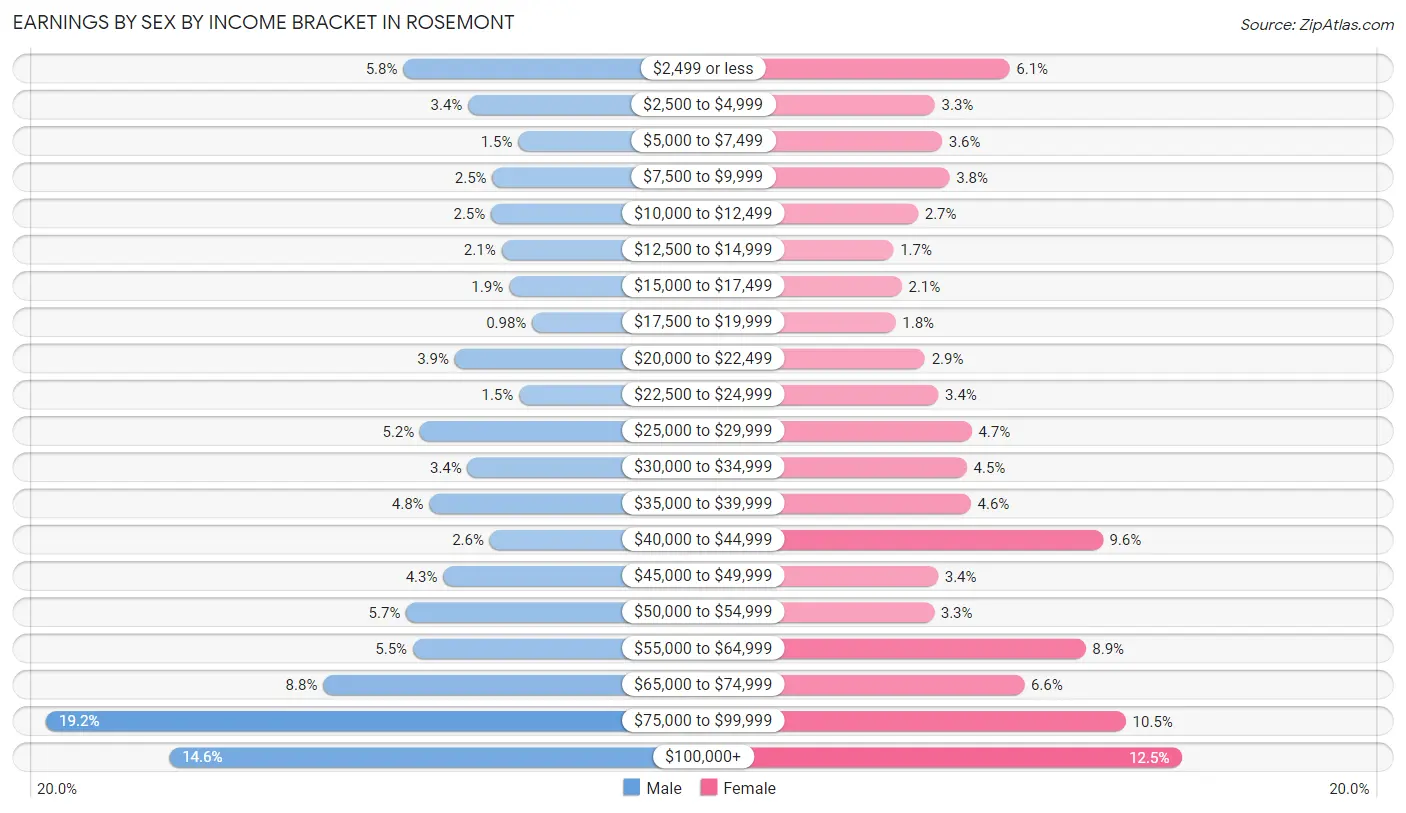
Earnings by Sex by Income Bracket in Rosemont
The most common earnings brackets in Rosemont are $75,000 to $99,999 for men (1,152 | 19.2%) and $100,000+ for women (842 | 12.5%).
| Income | Male | Female |
| $2,499 or less | 349 (5.8%) | 409 (6.1%) |
| $2,500 to $4,999 | 203 (3.4%) | 221 (3.3%) |
| $5,000 to $7,499 | 90 (1.5%) | 239 (3.6%) |
| $7,500 to $9,999 | 148 (2.5%) | 258 (3.8%) |
| $10,000 to $12,499 | 151 (2.5%) | 179 (2.7%) |
| $12,500 to $14,999 | 128 (2.1%) | 117 (1.7%) |
| $15,000 to $17,499 | 111 (1.8%) | 138 (2.1%) |
| $17,500 to $19,999 | 59 (1.0%) | 122 (1.8%) |
| $20,000 to $22,499 | 233 (3.9%) | 196 (2.9%) |
| $22,500 to $24,999 | 88 (1.5%) | 230 (3.4%) |
| $25,000 to $29,999 | 311 (5.2%) | 314 (4.7%) |
| $30,000 to $34,999 | 204 (3.4%) | 302 (4.5%) |
| $35,000 to $39,999 | 290 (4.8%) | 312 (4.6%) |
| $40,000 to $44,999 | 154 (2.6%) | 644 (9.6%) |
| $45,000 to $49,999 | 259 (4.3%) | 229 (3.4%) |
| $50,000 to $54,999 | 342 (5.7%) | 219 (3.3%) |
| $55,000 to $64,999 | 327 (5.4%) | 601 (8.9%) |
| $65,000 to $74,999 | 529 (8.8%) | 446 (6.6%) |
| $75,000 to $99,999 | 1,152 (19.2%) | 702 (10.4%) |
| $100,000+ | 875 (14.6%) | 842 (12.5%) |
| Total | 6,003 (100.0%) | 6,720 (100.0%) |
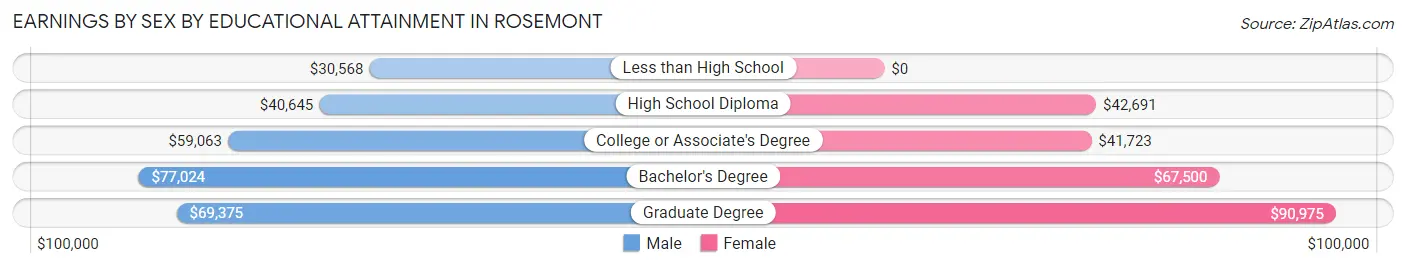
Earnings by Sex by Educational Attainment in Rosemont
Average earnings in Rosemont are $59,369 for men and $47,026 for women, a difference of 20.8%. Men with an educational attainment of bachelor's degree enjoy the highest average annual earnings of $77,024, while those with less than high school education earn the least with $30,568. Women with an educational attainment of graduate degree earn the most with the average annual earnings of $90,975, while those with college or associate's degree education have the smallest earnings of $41,723.
| Educational Attainment | Male Income | Female Income |
| Less than High School | $30,568 | $0 |
| High School Diploma | $40,645 | $42,691 |
| College or Associate's Degree | $59,063 | $41,723 |
| Bachelor's Degree | $77,024 | $67,500 |
| Graduate Degree | $69,375 | $90,975 |
| Total | $59,369 | $47,026 |
Family Income in Rosemont
Family Income Brackets in Rosemont
According to the Rosemont family income data, there are 1,547 families falling into the $100,000 to $149,999 income range, which is the most common income bracket and makes up 27.7% of all families. Conversely, the $15,000 to $24,999 income bracket is the least frequent group with only 89 families (1.6%) belonging to this category.
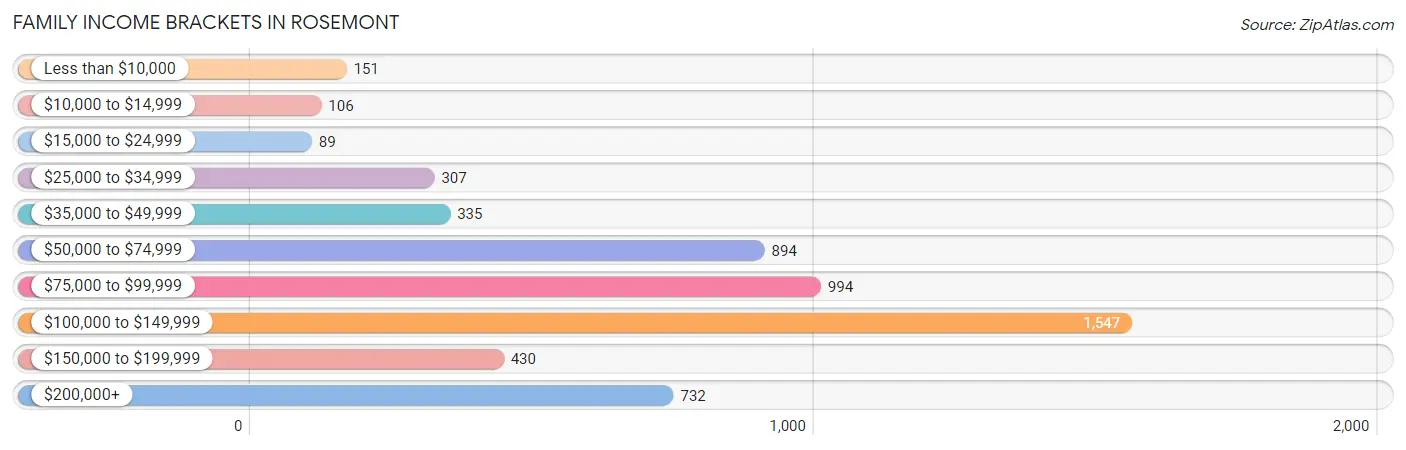
| Income Bracket | # Families | % Families |
| Less than $10,000 | 151 | 2.7% |
| $10,000 to $14,999 | 106 | 1.9% |
| $15,000 to $24,999 | 89 | 1.6% |
| $25,000 to $34,999 | 307 | 5.5% |
| $35,000 to $49,999 | 335 | 6.0% |
| $50,000 to $74,999 | 894 | 16.0% |
| $75,000 to $99,999 | 994 | 17.8% |
| $100,000 to $149,999 | 1,547 | 27.7% |
| $150,000 to $199,999 | 430 | 7.7% |
| $200,000+ | 732 | 13.1% |
Family Income by Famaliy Size in Rosemont
6-person families (225 | 4.0%) account for the highest median family income in Rosemont with $182,344 per family, while 2-person families (2,610 | 46.7%) have the highest median income of $44,146 per family member.
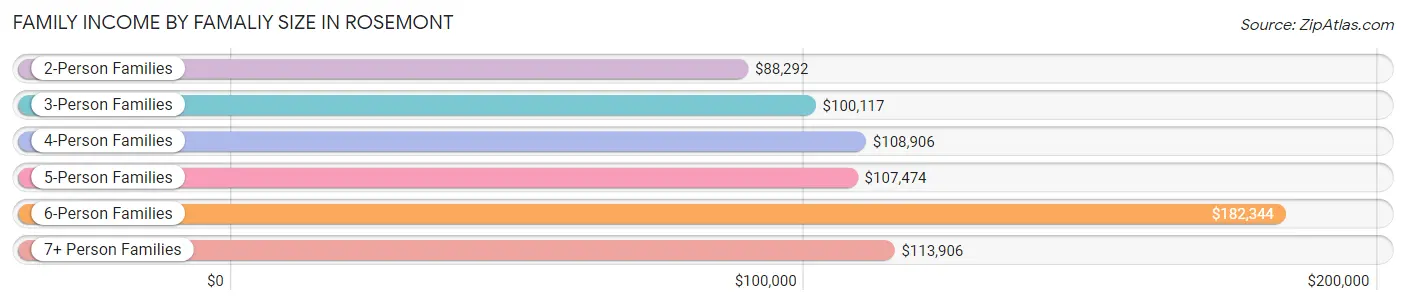
| Income Bracket | # Families | Median Income |
| 2-Person Families | 2,610 (46.7%) | $88,292 |
| 3-Person Families | 1,163 (20.8%) | $100,117 |
| 4-Person Families | 863 (15.4%) | $108,906 |
| 5-Person Families | 659 (11.8%) | $107,474 |
| 6-Person Families | 225 (4.0%) | $182,344 |
| 7+ Person Families | 65 (1.2%) | $113,906 |
| Total | 5,585 (100.0%) | $98,136 |
Family Income by Number of Earners in Rosemont
The median family income in Rosemont is $98,136, with families comprising 3+ earners (595) having the highest median family income of $167,961, while families with no earners (551) have the lowest median family income of $66,211, accounting for 10.6% and 9.9% of families, respectively.
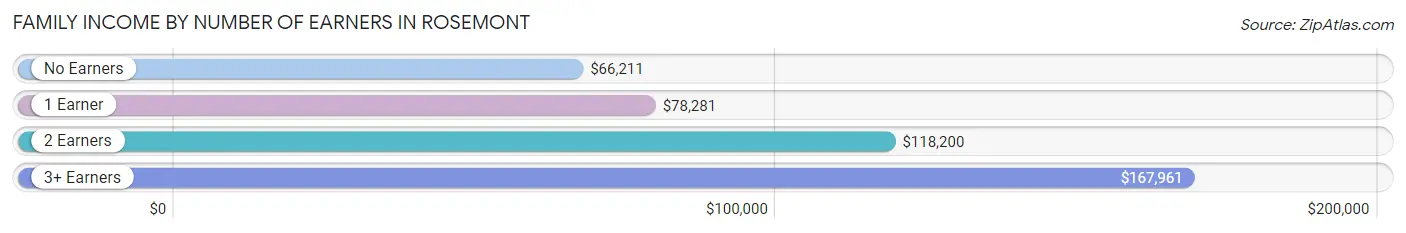
| Number of Earners | # Families | Median Income |
| No Earners | 551 (9.9%) | $66,211 |
| 1 Earner | 2,115 (37.9%) | $78,281 |
| 2 Earners | 2,324 (41.6%) | $118,200 |
| 3+ Earners | 595 (10.6%) | $167,961 |
| Total | 5,585 (100.0%) | $98,136 |
Household Income in Rosemont
Household Income Brackets in Rosemont
With 2,053 households falling in the category, the $100,000 to $149,999 income range is the most frequent in Rosemont, accounting for 23.3% of all households. In contrast, only 335 households (3.8%) fall into the $10,000 to $14,999 income bracket, making it the least populous group.
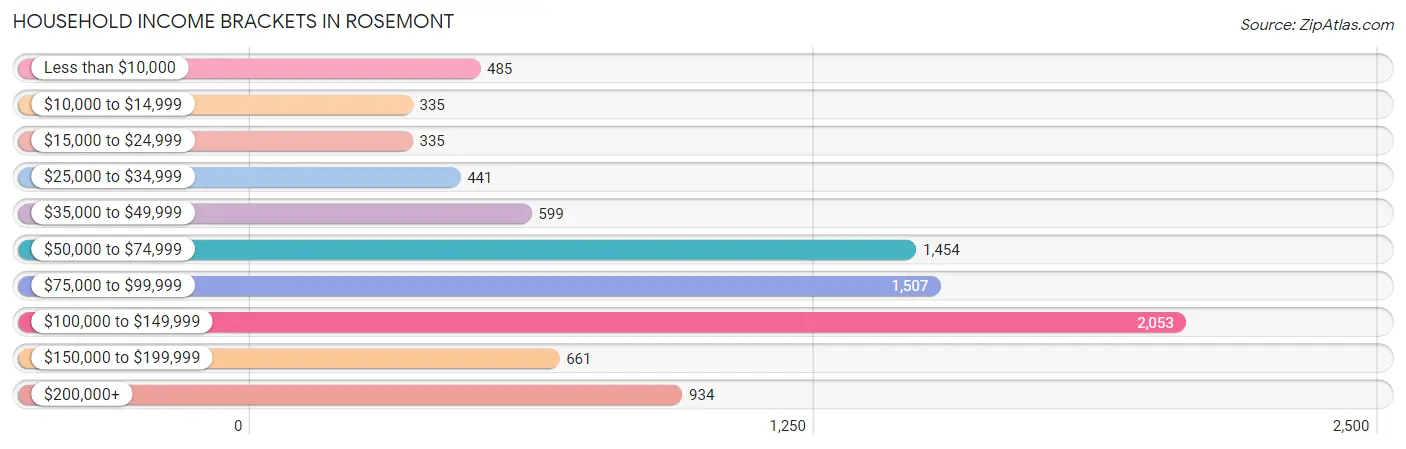
| Income Bracket | # Households | % Households |
| Less than $10,000 | 485 | 5.5% |
| $10,000 to $14,999 | 335 | 3.8% |
| $15,000 to $24,999 | 335 | 3.8% |
| $25,000 to $34,999 | 441 | 5.0% |
| $35,000 to $49,999 | 599 | 6.8% |
| $50,000 to $74,999 | 1,454 | 16.5% |
| $75,000 to $99,999 | 1,507 | 17.1% |
| $100,000 to $149,999 | 2,053 | 23.3% |
| $150,000 to $199,999 | 661 | 7.5% |
| $200,000+ | 934 | 10.6% |
Household Income by Householder Age in Rosemont
The median household income in Rosemont is $86,818, with the highest median household income of $97,451 found in the 25 to 44 years age bracket for the primary householder. A total of 3,356 households (38.1%) fall into this category. Meanwhile, the 15 to 24 years age bracket for the primary householder has the lowest median household income of $60,833, with 160 households (1.8%) in this group.
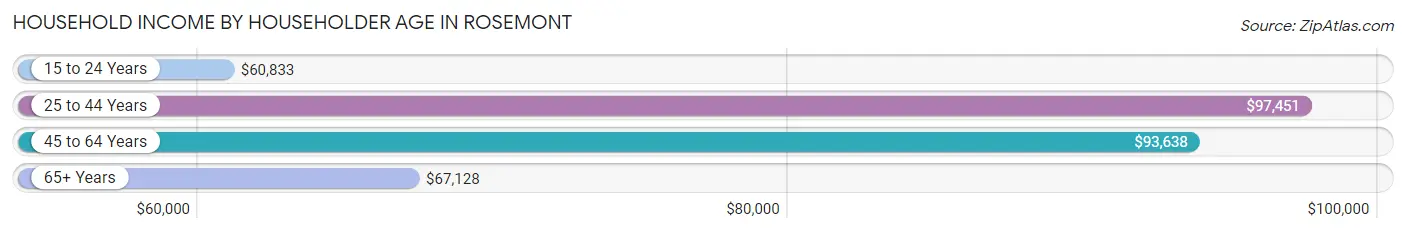
| Income Bracket | # Households | Median Income |
| 15 to 24 Years | 160 (1.8%) | $60,833 |
| 25 to 44 Years | 3,356 (38.1%) | $97,451 |
| 45 to 64 Years | 3,215 (36.5%) | $93,638 |
| 65+ Years | 2,082 (23.6%) | $67,128 |
| Total | 8,813 (100.0%) | $86,818 |
Poverty in Rosemont
Income Below Poverty by Sex and Age in Rosemont
With 11.5% poverty level for males and 13.2% for females among the residents of Rosemont, under 5 year old males and 12 to 14 year old females are the most vulnerable to poverty, with 126 males (20.1%) and 119 females (28.5%) in their respective age groups living below the poverty level.
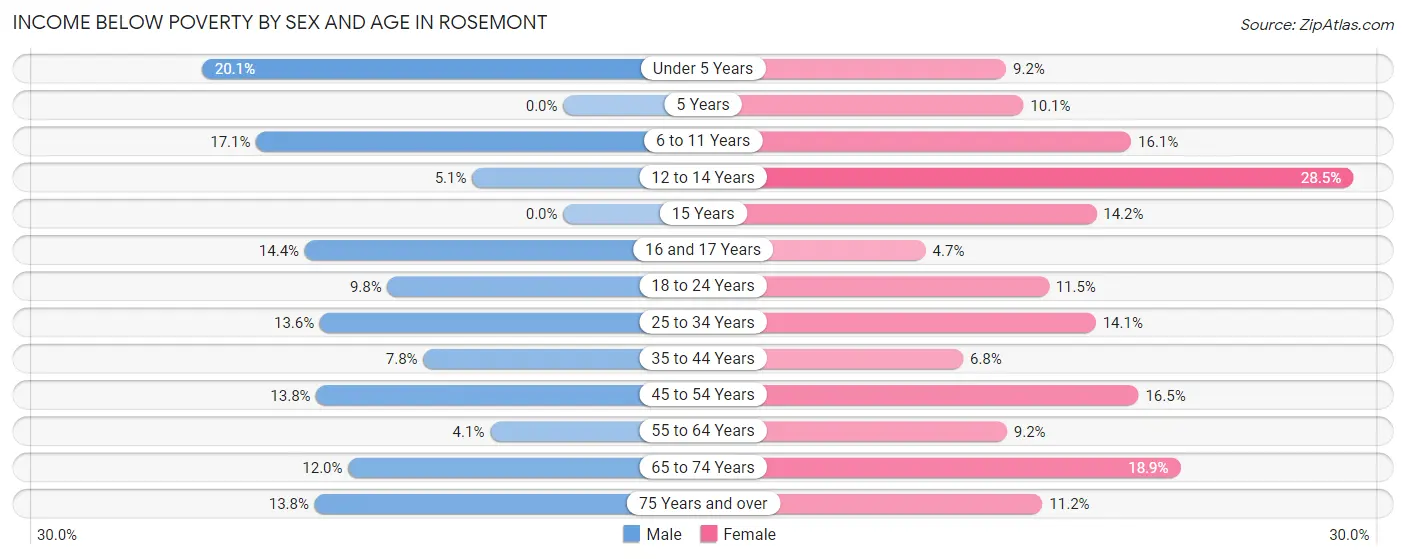
| Age Bracket | Male | Female |
| Under 5 Years | 126 (20.1%) | 78 (9.1%) |
| 5 Years | 0 (0.0%) | 9 (10.1%) |
| 6 to 11 Years | 150 (17.1%) | 177 (16.1%) |
| 12 to 14 Years | 22 (5.1%) | 119 (28.5%) |
| 15 Years | 0 (0.0%) | 18 (14.2%) |
| 16 and 17 Years | 41 (14.4%) | 12 (4.7%) |
| 18 to 24 Years | 81 (9.8%) | 122 (11.5%) |
| 25 to 34 Years | 289 (13.6%) | 284 (14.1%) |
| 35 to 44 Years | 102 (7.8%) | 120 (6.8%) |
| 45 to 54 Years | 212 (13.8%) | 316 (16.5%) |
| 55 to 64 Years | 45 (4.1%) | 112 (9.2%) |
| 65 to 74 Years | 104 (12.0%) | 232 (18.9%) |
| 75 Years and over | 79 (13.8%) | 82 (11.2%) |
| Total | 1,251 (11.5%) | 1,681 (13.2%) |
Income Above Poverty by Sex and Age in Rosemont
According to the poverty statistics in Rosemont, males aged 5 years and females aged 16 and 17 years are the age groups that are most secure financially, with 100.0% of males and 95.3% of females in these age groups living above the poverty line.
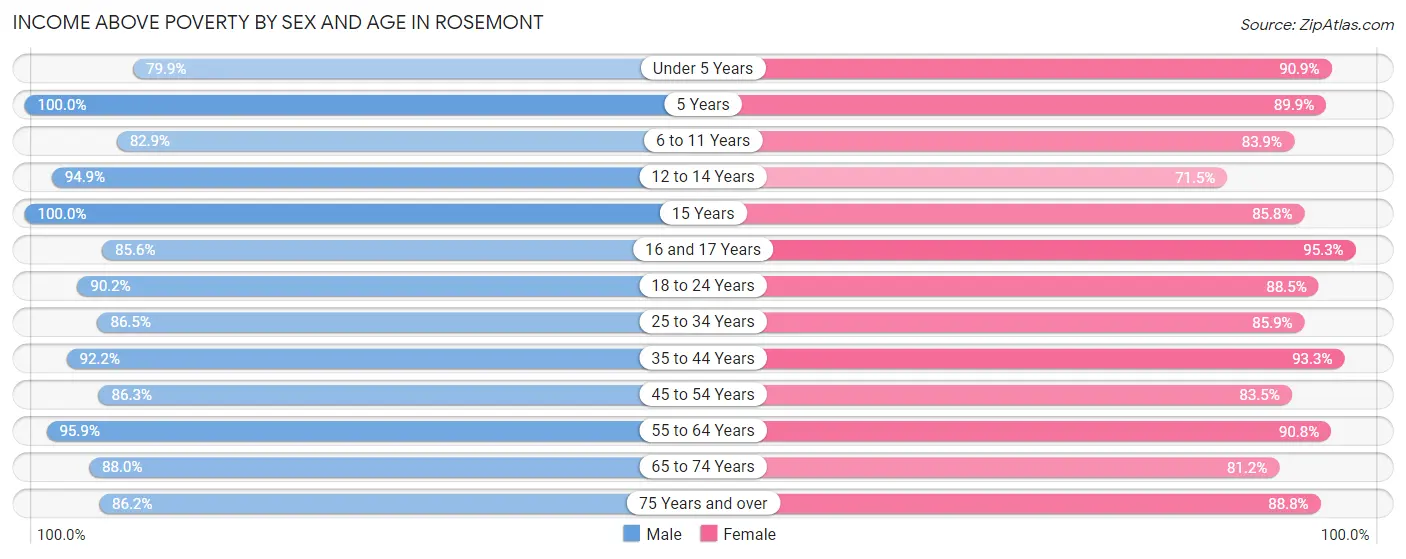
| Age Bracket | Male | Female |
| Under 5 Years | 500 (79.9%) | 774 (90.8%) |
| 5 Years | 158 (100.0%) | 80 (89.9%) |
| 6 to 11 Years | 727 (82.9%) | 922 (83.9%) |
| 12 to 14 Years | 412 (94.9%) | 299 (71.5%) |
| 15 Years | 135 (100.0%) | 109 (85.8%) |
| 16 and 17 Years | 244 (85.6%) | 245 (95.3%) |
| 18 to 24 Years | 746 (90.2%) | 937 (88.5%) |
| 25 to 34 Years | 1,844 (86.5%) | 1,724 (85.9%) |
| 35 to 44 Years | 1,208 (92.2%) | 1,658 (93.2%) |
| 45 to 54 Years | 1,330 (86.3%) | 1,597 (83.5%) |
| 55 to 64 Years | 1,061 (95.9%) | 1,107 (90.8%) |
| 65 to 74 Years | 765 (88.0%) | 999 (81.1%) |
| 75 Years and over | 492 (86.2%) | 652 (88.8%) |
| Total | 9,622 (88.5%) | 11,103 (86.9%) |
Income Below Poverty Among Married-Couple Families in Rosemont
The poverty statistics for married-couple families in Rosemont show that 7.6% or 275 of the total 3,605 families live below the poverty line. Families with 1 or 2 children have the highest poverty rate of 16.8%, comprising of 214 families. On the other hand, families with 5 or more children have the lowest poverty rate of 0.0%, which includes 0 families.
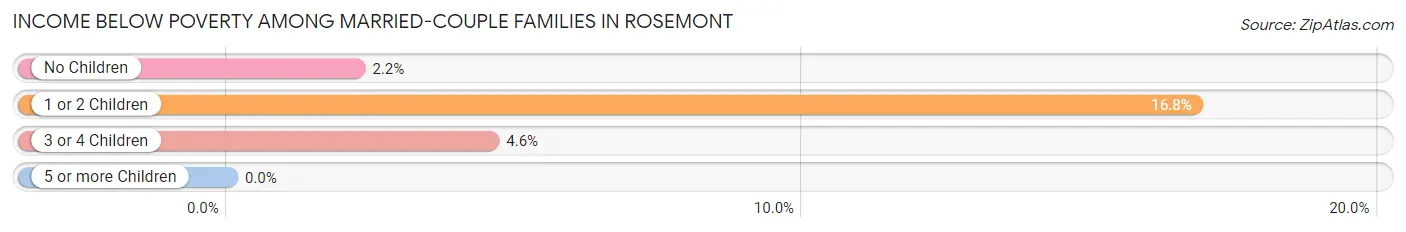
| Children | Above Poverty | Below Poverty |
| No Children | 1,804 (97.8%) | 41 (2.2%) |
| 1 or 2 Children | 1,059 (83.2%) | 214 (16.8%) |
| 3 or 4 Children | 420 (95.5%) | 20 (4.5%) |
| 5 or more Children | 47 (100.0%) | 0 (0.0%) |
| Total | 3,330 (92.4%) | 275 (7.6%) |
Income Below Poverty Among Single-Parent Households in Rosemont
According to the poverty data in Rosemont, 5.8% or 32 single-father households and 8.0% or 114 single-mother households are living below the poverty line. Among single-father households, those with 3 or 4 children have the highest poverty rate, with 4 households (19.1%) experiencing poverty. Likewise, among single-mother households, those with 5 or more children have the highest poverty rate, with 7 households (100.0%) falling below the poverty line.
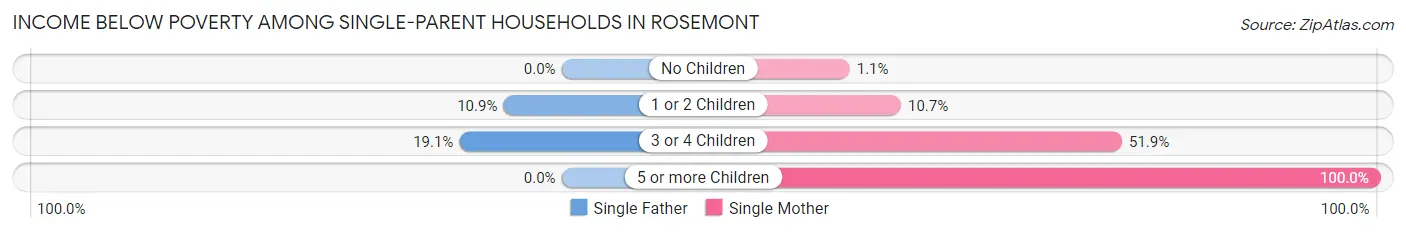
| Children | Single Father | Single Mother |
| No Children | 0 (0.0%) | 8 (1.1%) |
| 1 or 2 Children | 28 (10.8%) | 71 (10.7%) |
| 3 or 4 Children | 4 (19.1%) | 28 (51.8%) |
| 5 or more Children | 0 (0.0%) | 7 (100.0%) |
| Total | 32 (5.8%) | 114 (8.0%) |
Income Below Poverty Among Married-Couple vs Single-Parent Households in Rosemont
The poverty data for Rosemont shows that 275 of the married-couple family households (7.6%) and 146 of the single-parent households (7.4%) are living below the poverty level. Within the married-couple family households, those with 1 or 2 children have the highest poverty rate, with 214 households (16.8%) falling below the poverty line. Among the single-parent households, those with 5 or more children have the highest poverty rate, with 7 household (100.0%) living below poverty.
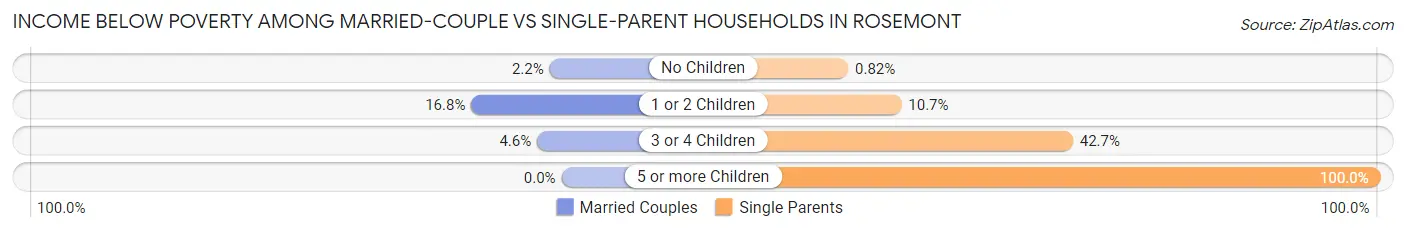
| Children | Married-Couple Families | Single-Parent Households |
| No Children | 41 (2.2%) | 8 (0.8%) |
| 1 or 2 Children | 214 (16.8%) | 99 (10.7%) |
| 3 or 4 Children | 20 (4.5%) | 32 (42.7%) |
| 5 or more Children | 0 (0.0%) | 7 (100.0%) |
| Total | 275 (7.6%) | 146 (7.4%) |
Race in Rosemont
The most populous races in Rosemont are White / Caucasian (11,736 | 49.2%), Hispanic or Latino (4,656 | 19.5%), and Black / African American (3,648 | 15.3%).
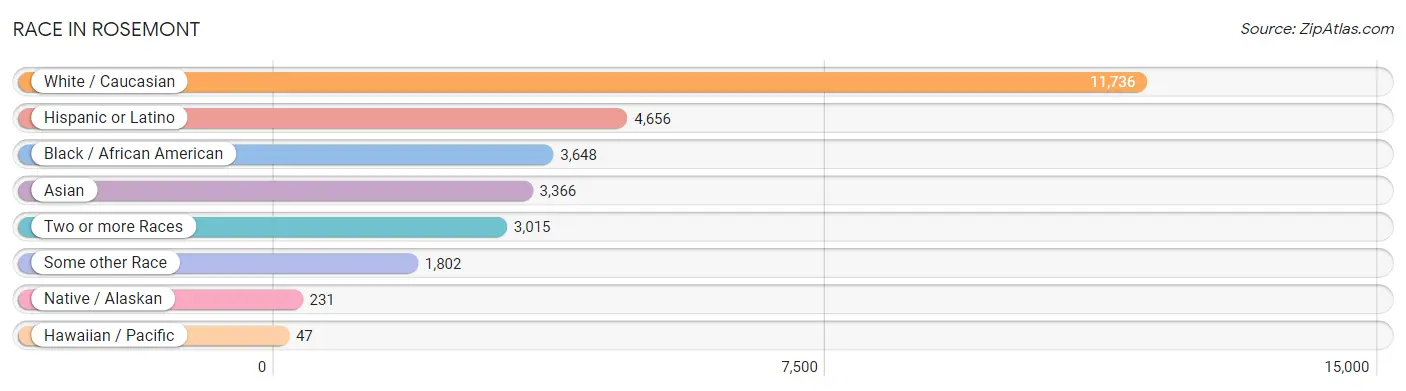
| Race | # Population | % Population |
| Asian | 3,366 | 14.1% |
| Black / African American | 3,648 | 15.3% |
| Hawaiian / Pacific | 47 | 0.2% |
| Hispanic or Latino | 4,656 | 19.5% |
| Native / Alaskan | 231 | 1.0% |
| White / Caucasian | 11,736 | 49.2% |
| Two or more Races | 3,015 | 12.6% |
| Some other Race | 1,802 | 7.6% |
| Total | 23,845 | 100.0% |
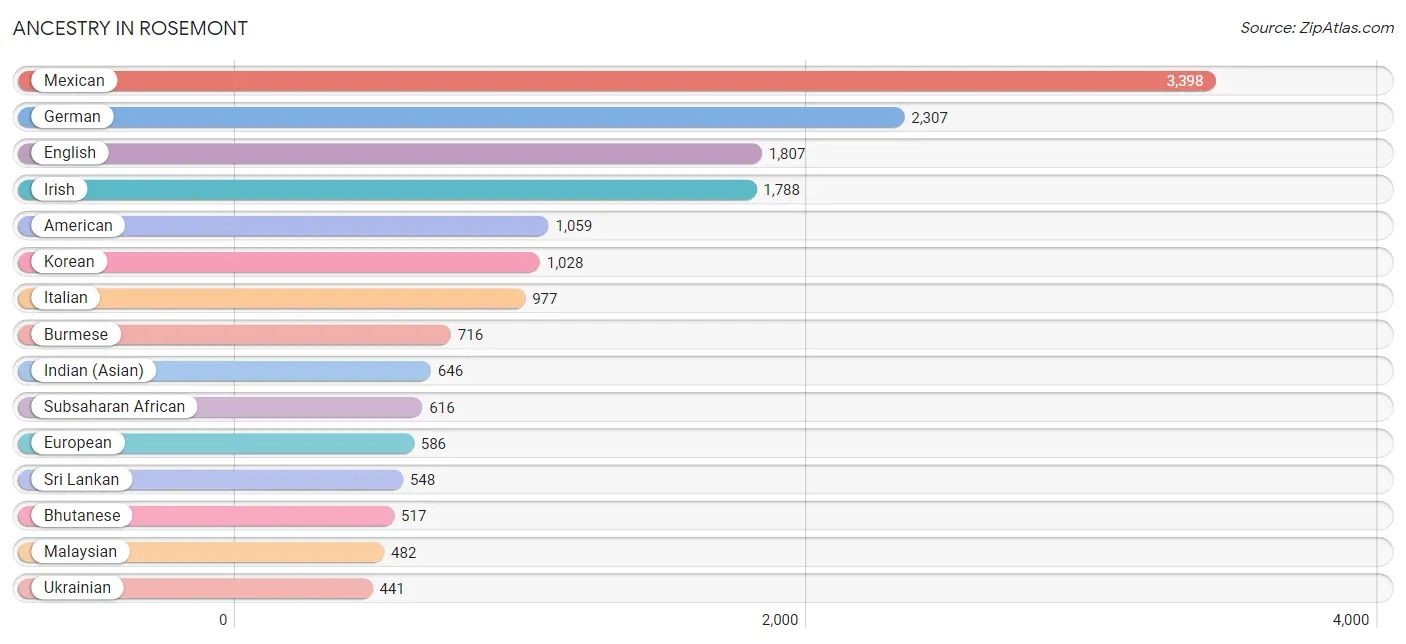
Ancestry in Rosemont
The most populous ancestries reported in Rosemont are Mexican (3,398 | 14.2%), German (2,307 | 9.7%), English (1,807 | 7.6%), Irish (1,788 | 7.5%), and American (1,059 | 4.4%), together accounting for 43.4% of all Rosemont residents.
| Ancestry | # Population | % Population |
| African | 309 | 1.3% |
| American | 1,059 | 4.4% |
| Apache | 6 | 0.0% |
| Arab | 283 | 1.2% |
| Armenian | 54 | 0.2% |
| Assyrian / Chaldean / Syriac | 35 | 0.2% |
| Bangladeshi | 176 | 0.7% |
| Basque | 31 | 0.1% |
| Bhutanese | 517 | 2.2% |
| Blackfeet | 122 | 0.5% |
| British | 29 | 0.1% |
| Burmese | 716 | 3.0% |
| Canadian | 19 | 0.1% |
| Cape Verdean | 19 | 0.1% |
| Central American | 352 | 1.5% |
| Central American Indian | 58 | 0.2% |
| Cherokee | 133 | 0.6% |
| Chickasaw | 9 | 0.0% |
| Chilean | 31 | 0.1% |
| Chippewa | 35 | 0.2% |
| Choctaw | 6 | 0.0% |
| Colombian | 11 | 0.1% |
| Croatian | 34 | 0.1% |
| Cuban | 13 | 0.1% |
| Czech | 10 | 0.0% |
| Danish | 23 | 0.1% |
| Dutch | 117 | 0.5% |
| Eastern European | 39 | 0.2% |
| Egyptian | 22 | 0.1% |
| English | 1,807 | 7.6% |
| Ethiopian | 50 | 0.2% |
| European | 586 | 2.5% |
| Finnish | 9 | 0.0% |
| French | 236 | 1.0% |
| French Canadian | 15 | 0.1% |
| German | 2,307 | 9.7% |
| Greek | 47 | 0.2% |
| Guatemalan | 296 | 1.2% |
| Haitian | 13 | 0.1% |
| Hopi | 8 | 0.0% |
| Hungarian | 42 | 0.2% |
| Indian (Asian) | 646 | 2.7% |
| Iranian | 163 | 0.7% |
| Irish | 1,788 | 7.5% |
| Israeli | 3 | 0.0% |
| Italian | 977 | 4.1% |
| Jamaican | 45 | 0.2% |
| Japanese | 9 | 0.0% |
| Korean | 1,028 | 4.3% |
| Lithuanian | 12 | 0.1% |
| Malaysian | 482 | 2.0% |
| Maltese | 8 | 0.0% |
| Mexican | 3,398 | 14.2% |
| Mexican American Indian | 75 | 0.3% |
| Moroccan | 11 | 0.1% |
| Native Hawaiian | 59 | 0.3% |
| Navajo | 12 | 0.1% |
| Nicaraguan | 26 | 0.1% |
| Nigerian | 57 | 0.2% |
| Northern European | 71 | 0.3% |
| Norwegian | 176 | 0.7% |
| Pakistani | 123 | 0.5% |
| Palestinian | 19 | 0.1% |
| Peruvian | 27 | 0.1% |
| Polish | 161 | 0.7% |
| Portuguese | 423 | 1.8% |
| Puerto Rican | 251 | 1.1% |
| Romanian | 376 | 1.6% |
| Russian | 171 | 0.7% |
| Salvadoran | 30 | 0.1% |
| Samoan | 56 | 0.2% |
| Scandinavian | 19 | 0.1% |
| Scotch-Irish | 136 | 0.6% |
| Scottish | 308 | 1.3% |
| Seminole | 56 | 0.2% |
| Slavic | 24 | 0.1% |
| Slovak | 75 | 0.3% |
| South American | 173 | 0.7% |
| South American Indian | 16 | 0.1% |
| Spaniard | 231 | 1.0% |
| Spanish | 122 | 0.5% |
| Spanish American Indian | 11 | 0.1% |
| Sri Lankan | 548 | 2.3% |
| Subsaharan African | 616 | 2.6% |
| Sudanese | 62 | 0.3% |
| Swedish | 254 | 1.1% |
| Swiss | 82 | 0.3% |
| Syrian | 13 | 0.1% |
| Thai | 213 | 0.9% |
| Turkish | 51 | 0.2% |
| Ukrainian | 441 | 1.8% |
| Venezuelan | 104 | 0.4% |
| Welsh | 141 | 0.6% |
| Yugoslavian | 45 | 0.2% | View All 94 Rows |
Immigrants in Rosemont
The most numerous immigrant groups reported in Rosemont came from Asia (1,955 | 8.2%), Latin America (957 | 4.0%), Europe (858 | 3.6%), South Eastern Asia (806 | 3.4%), and Central America (805 | 3.4%), together accounting for 22.6% of all Rosemont residents.
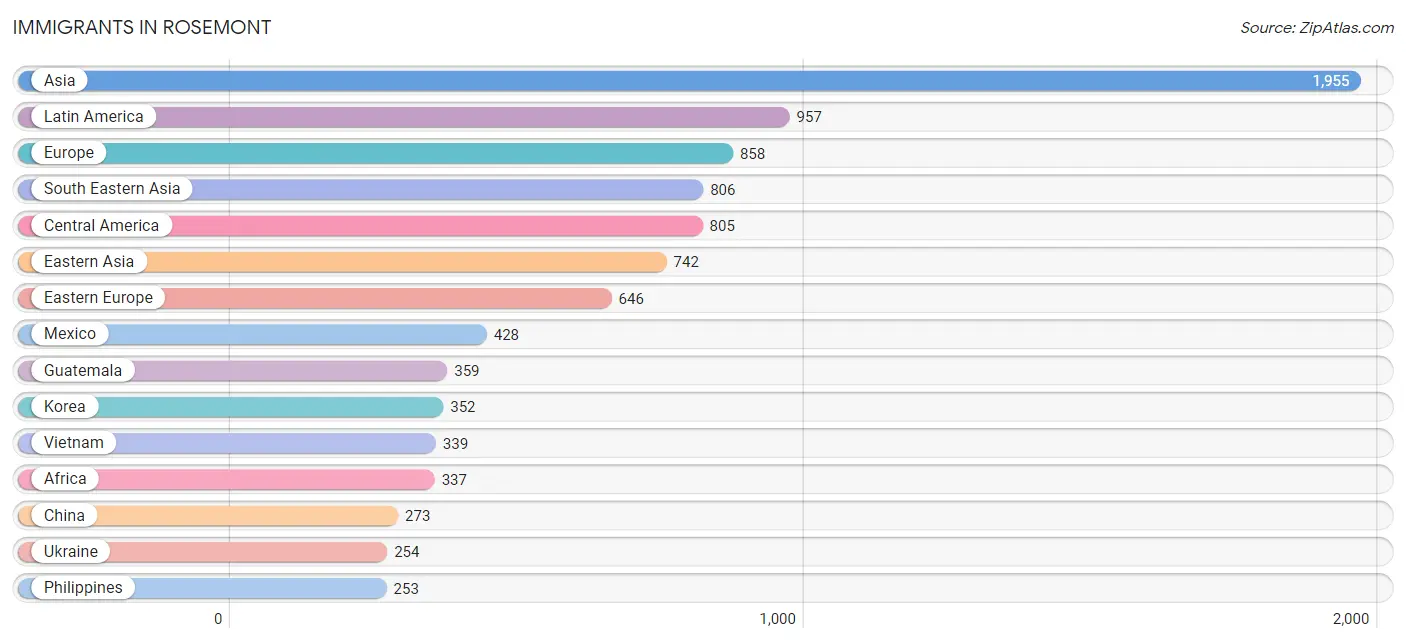
| Immigration Origin | # Population | % Population |
| Africa | 337 | 1.4% |
| Armenia | 34 | 0.1% |
| Asia | 1,955 | 8.2% |
| Belarus | 29 | 0.1% |
| Bosnia and Herzegovina | 9 | 0.0% |
| Cambodia | 9 | 0.0% |
| Canada | 22 | 0.1% |
| Caribbean | 12 | 0.1% |
| Central America | 805 | 3.4% |
| Chile | 16 | 0.1% |
| China | 273 | 1.1% |
| Colombia | 11 | 0.1% |
| Croatia | 19 | 0.1% |
| Czechoslovakia | 25 | 0.1% |
| Eastern Africa | 162 | 0.7% |
| Eastern Asia | 742 | 3.1% |
| Eastern Europe | 646 | 2.7% |
| El Salvador | 9 | 0.0% |
| England | 23 | 0.1% |
| Ethiopia | 54 | 0.2% |
| Europe | 858 | 3.6% |
| Fiji | 43 | 0.2% |
| Germany | 69 | 0.3% |
| Greece | 12 | 0.1% |
| Guatemala | 359 | 1.5% |
| Hong Kong | 7 | 0.0% |
| India | 49 | 0.2% |
| Iran | 158 | 0.7% |
| Iraq | 109 | 0.5% |
| Italy | 24 | 0.1% |
| Jamaica | 12 | 0.1% |
| Japan | 117 | 0.5% |
| Kenya | 108 | 0.4% |
| Korea | 352 | 1.5% |
| Laos | 184 | 0.8% |
| Latin America | 957 | 4.0% |
| Lebanon | 10 | 0.0% |
| Mexico | 428 | 1.8% |
| Middle Africa | 71 | 0.3% |
| Moldova | 242 | 1.0% |
| Morocco | 11 | 0.1% |
| Nicaragua | 9 | 0.0% |
| Nigeria | 13 | 0.1% |
| Northern Africa | 87 | 0.4% |
| Northern Europe | 95 | 0.4% |
| Oceania | 43 | 0.2% |
| Peru | 9 | 0.0% |
| Philippines | 253 | 1.1% |
| Poland | 8 | 0.0% |
| Romania | 8 | 0.0% |
| Russia | 52 | 0.2% |
| South Africa | 4 | 0.0% |
| South America | 140 | 0.6% |
| South Central Asia | 207 | 0.9% |
| South Eastern Asia | 806 | 3.4% |
| Southern Europe | 48 | 0.2% |
| Spain | 12 | 0.1% |
| Sudan | 22 | 0.1% |
| Taiwan | 28 | 0.1% |
| Thailand | 12 | 0.1% |
| Turkey | 47 | 0.2% |
| Ukraine | 254 | 1.1% |
| Venezuela | 104 | 0.4% |
| Vietnam | 339 | 1.4% |
| Western Africa | 13 | 0.1% |
| Western Asia | 200 | 0.8% |
| Western Europe | 69 | 0.3% |
| Zaire | 71 | 0.3% | View All 68 Rows |
Sex and Age in Rosemont
Sex and Age in Rosemont
The most populous age groups in Rosemont are 25 to 29 Years (1,093 | 10.0%) for men and 45 to 49 Years (1,267 | 9.8%) for women.
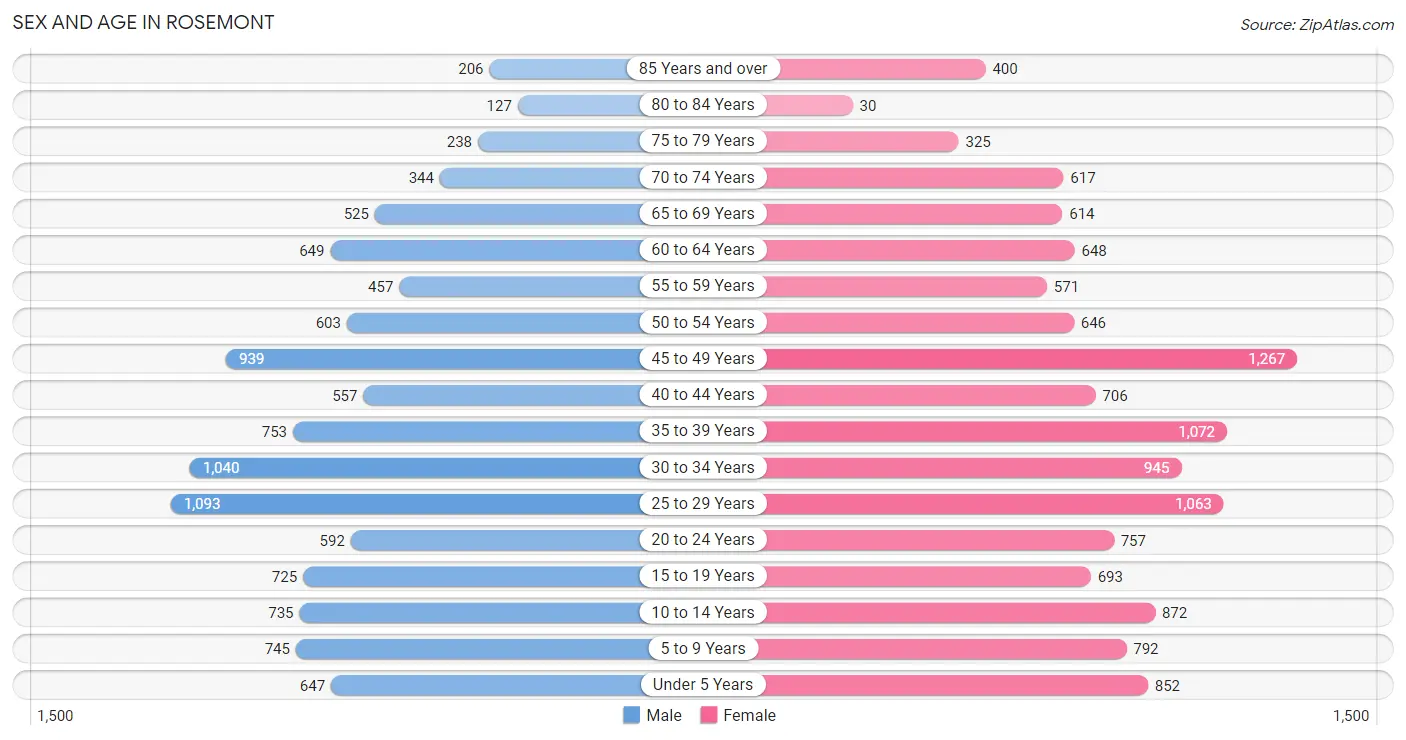
| Age Bracket | Male | Female |
| Under 5 Years | 647 (5.9%) | 852 (6.6%) |
| 5 to 9 Years | 745 (6.8%) | 792 (6.1%) |
| 10 to 14 Years | 735 (6.7%) | 872 (6.8%) |
| 15 to 19 Years | 725 (6.6%) | 693 (5.4%) |
| 20 to 24 Years | 592 (5.4%) | 757 (5.9%) |
| 25 to 29 Years | 1,093 (10.0%) | 1,063 (8.3%) |
| 30 to 34 Years | 1,040 (9.5%) | 945 (7.3%) |
| 35 to 39 Years | 753 (6.9%) | 1,072 (8.3%) |
| 40 to 44 Years | 557 (5.1%) | 706 (5.5%) |
| 45 to 49 Years | 939 (8.6%) | 1,267 (9.8%) |
| 50 to 54 Years | 603 (5.5%) | 646 (5.0%) |
| 55 to 59 Years | 457 (4.2%) | 571 (4.4%) |
| 60 to 64 Years | 649 (5.9%) | 648 (5.0%) |
| 65 to 69 Years | 525 (4.8%) | 614 (4.8%) |
| 70 to 74 Years | 344 (3.1%) | 617 (4.8%) |
| 75 to 79 Years | 238 (2.2%) | 325 (2.5%) |
| 80 to 84 Years | 127 (1.2%) | 30 (0.2%) |
| 85 Years and over | 206 (1.9%) | 400 (3.1%) |
| Total | 10,975 (100.0%) | 12,870 (100.0%) |
Families and Households in Rosemont
Median Family Size in Rosemont
The median family size in Rosemont is 3.25 persons per family, with married-couple families (3,605 | 64.5%) accounting for the largest median family size of 3.43 persons per family. On the other hand, single male/father families (555 | 9.9%) represent the smallest median family size with 2.52 persons per family.
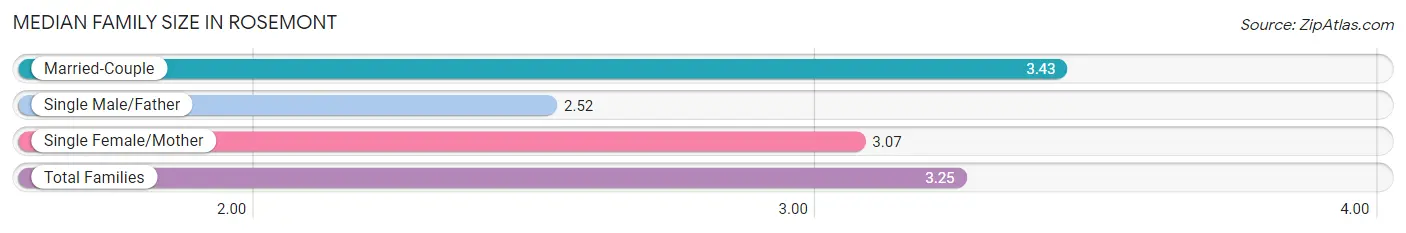
| Family Type | # Families | Family Size |
| Married-Couple | 3,605 (64.5%) | 3.43 |
| Single Male/Father | 555 (9.9%) | 2.52 |
| Single Female/Mother | 1,425 (25.5%) | 3.07 |
| Total Families | 5,585 (100.0%) | 3.25 |
Median Household Size in Rosemont
The median household size in Rosemont is 2.68 persons per household, with married-couple households (3,605 | 40.9%) accounting for the largest median household size of 3.45 persons per household. non-family households (3,228 | 36.6%) represent the smallest median household size with 1.54 persons per household.
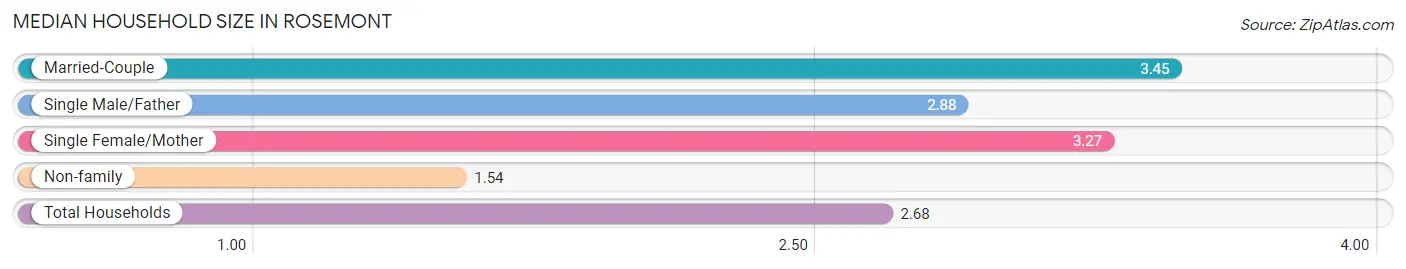
| Household Type | # Households | Household Size |
| Married-Couple | 3,605 (40.9%) | 3.45 |
| Single Male/Father | 555 (6.3%) | 2.88 |
| Single Female/Mother | 1,425 (16.2%) | 3.27 |
| Non-family | 3,228 (36.6%) | 1.54 |
| Total Households | 8,813 (100.0%) | 2.68 |
Household Size by Marriage Status in Rosemont
Out of a total of 8,813 households in Rosemont, 5,585 (63.4%) are family households, while 3,228 (36.6%) are nonfamily households. The most numerous type of family households are 2-person households, comprising 2,364, and the most common type of nonfamily households are 1-person households, comprising 2,126.
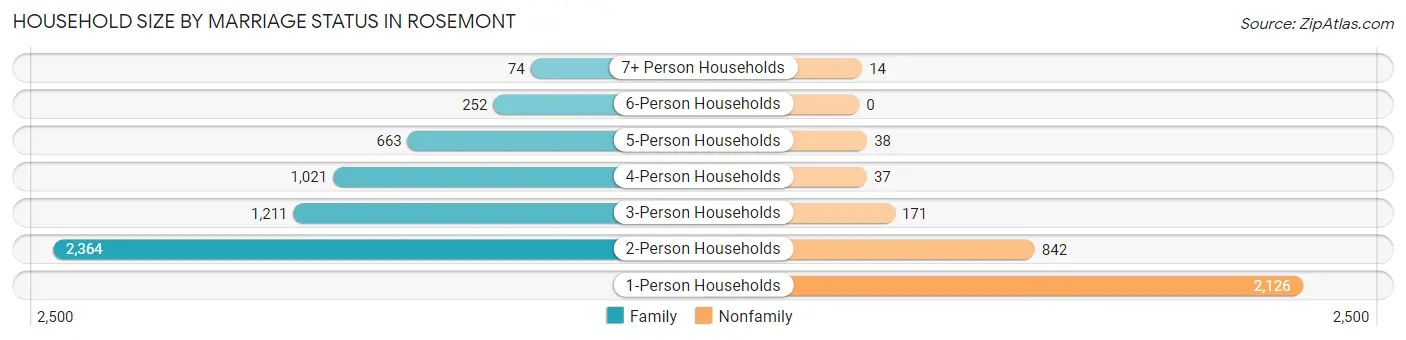
| Household Size | Family Households | Nonfamily Households |
| 1-Person Households | - | 2,126 (24.1%) |
| 2-Person Households | 2,364 (26.8%) | 842 (9.6%) |
| 3-Person Households | 1,211 (13.7%) | 171 (1.9%) |
| 4-Person Households | 1,021 (11.6%) | 37 (0.4%) |
| 5-Person Households | 663 (7.5%) | 38 (0.4%) |
| 6-Person Households | 252 (2.9%) | 0 (0.0%) |
| 7+ Person Households | 74 (0.8%) | 14 (0.2%) |
| Total | 5,585 (63.4%) | 3,228 (36.6%) |
Female Fertility in Rosemont
Fertility by Age in Rosemont
Average fertility rate in Rosemont is 44.0 births per 1,000 women. Women in the age bracket of 20 to 34 years have the highest fertility rate with 69.0 births per 1,000 women. Women in the age bracket of 20 to 34 years acount for 66.0% of all women with births.
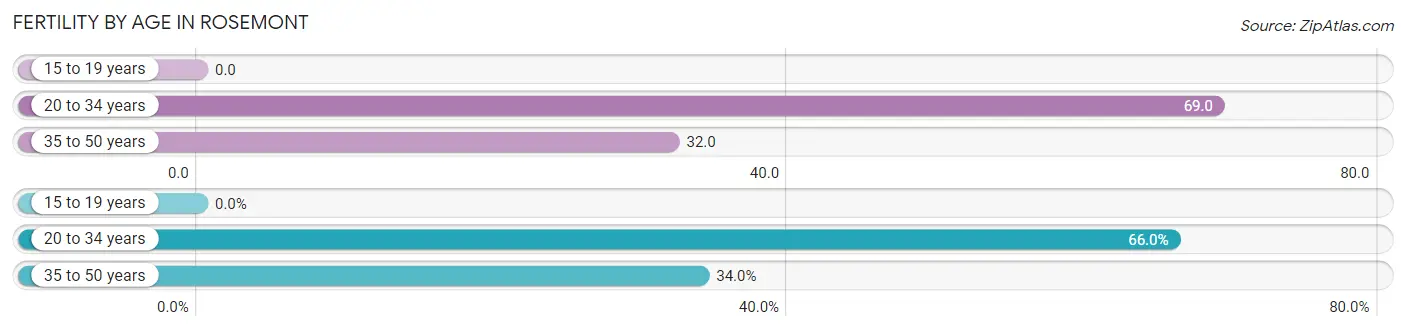
| Age Bracket | Women with Births | Births / 1,000 Women |
| 15 to 19 years | 0 (0.0%) | 0.0 |
| 20 to 34 years | 192 (66.0%) | 69.0 |
| 35 to 50 years | 99 (34.0%) | 32.0 |
| Total | 291 (100.0%) | 44.0 |
Fertility by Age by Marriage Status in Rosemont
88.3% of women with births (291) in Rosemont are married. The highest percentage of unmarried women with births falls into 20 to 34 years age bracket with 12.0% of them unmarried at the time of birth, while the lowest percentage of unmarried women with births belong to 35 to 50 years age bracket with 11.1% of them unmarried.
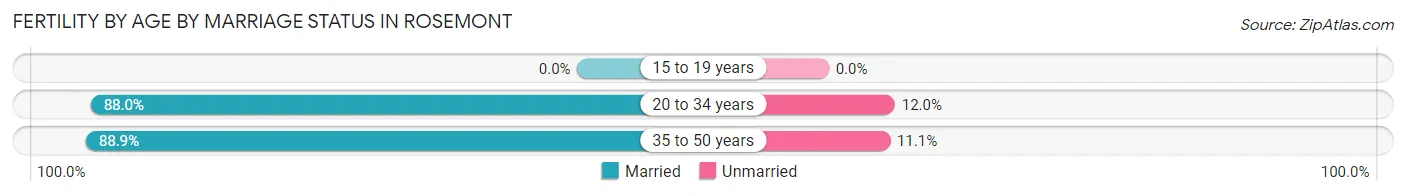
| Age Bracket | Married | Unmarried |
| 15 to 19 years | 0 (0.0%) | 0 (0.0%) |
| 20 to 34 years | 169 (88.0%) | 23 (12.0%) |
| 35 to 50 years | 88 (88.9%) | 11 (11.1%) |
| Total | 257 (88.3%) | 34 (11.7%) |
Fertility by Education in Rosemont
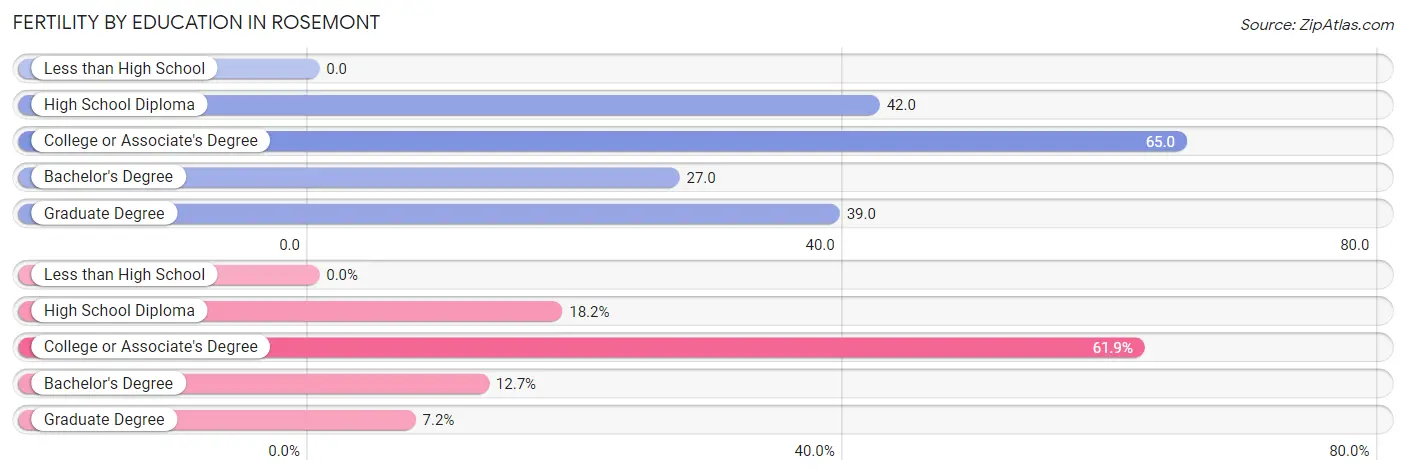
| Educational Attainment | Women with Births | Births / 1,000 Women |
| Less than High School | 0 (0.0%) | 0.0 |
| High School Diploma | 53 (18.2%) | 42.0 |
| College or Associate's Degree | 180 (61.9%) | 65.0 |
| Bachelor's Degree | 37 (12.7%) | 27.0 |
| Graduate Degree | 21 (7.2%) | 39.0 |
| Total | 291 (100.0%) | 44.0 |
Fertility by Education by Marriage Status in Rosemont
11.7% of women with births in Rosemont are unmarried. Women with the educational attainment of bachelor's degree are most likely to be married with 100.0% of them married at childbirth, while women with the educational attainment of high school diploma are least likely to be married with 20.7% of them unmarried at childbirth.
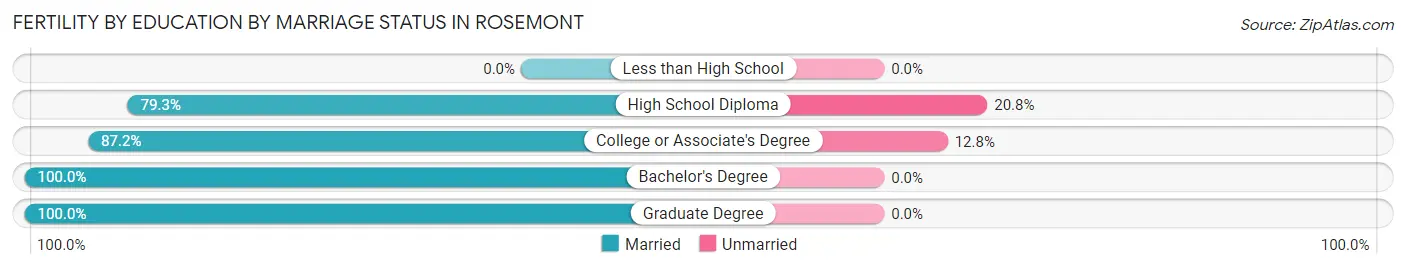
| Educational Attainment | Married | Unmarried |
| Less than High School | 0 (0.0%) | 0 (0.0%) |
| High School Diploma | 42 (79.2%) | 11 (20.7%) |
| College or Associate's Degree | 157 (87.2%) | 23 (12.8%) |
| Bachelor's Degree | 37 (100.0%) | 0 (0.0%) |
| Graduate Degree | 21 (100.0%) | 0 (0.0%) |
| Total | 257 (88.3%) | 34 (11.7%) |
Employment Characteristics in Rosemont
Employment by Class of Employer in Rosemont
Among the 11,384 employed individuals in Rosemont, private company employees (6,188 | 54.4%), state government employees (1,662 | 14.6%), and not-for-profit organizations (1,261 | 11.1%) make up the most common classes of employment.
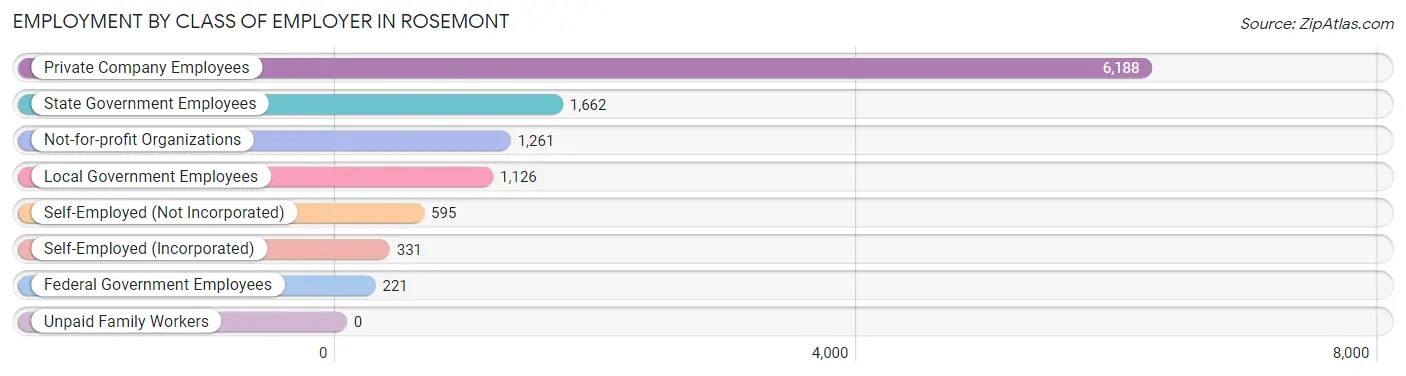
| Employer Class | # Employees | % Employees |
| Private Company Employees | 6,188 | 54.4% |
| Self-Employed (Incorporated) | 331 | 2.9% |
| Self-Employed (Not Incorporated) | 595 | 5.2% |
| Not-for-profit Organizations | 1,261 | 11.1% |
| Local Government Employees | 1,126 | 9.9% |
| State Government Employees | 1,662 | 14.6% |
| Federal Government Employees | 221 | 1.9% |
| Unpaid Family Workers | 0 | 0.0% |
| Total | 11,384 | 100.0% |
Employment Status by Age in Rosemont
According to the labor force statistics for Rosemont, out of the total population over 16 years of age (18,928), 66.1% or 12,511 individuals are in the labor force, with 6.9% or 863 of them unemployed. The age group with the highest labor force participation rate is 25 to 29 years, with 95.1% or 2,050 individuals in the labor force. Within the labor force, the 16 to 19 years age range has the highest percentage of unemployed individuals, with 27.5% or 114 of them being unemployed.
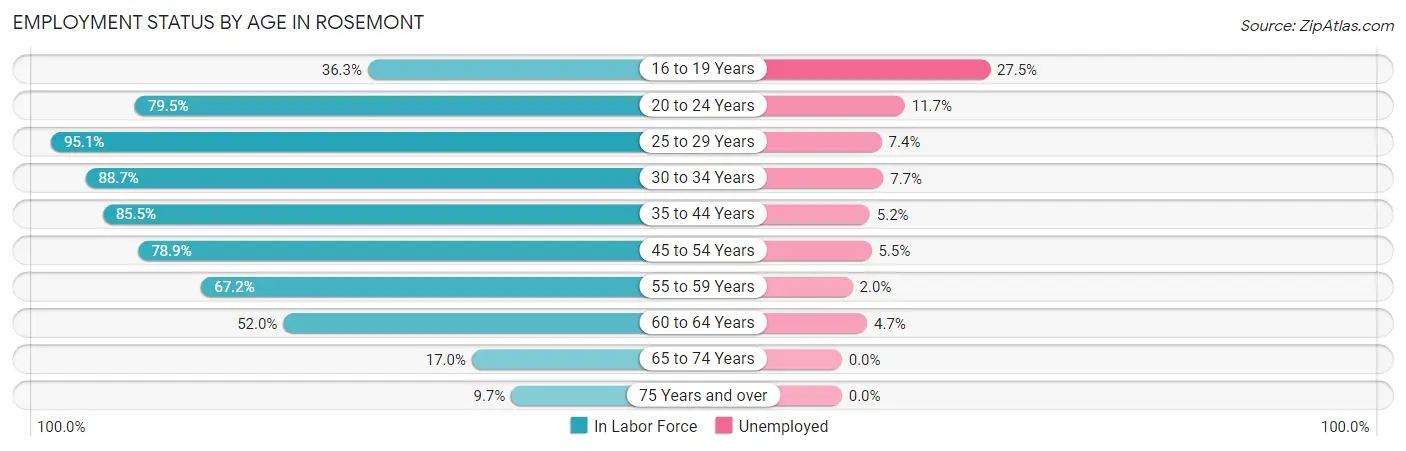
| Age Bracket | In Labor Force | Unemployed |
| 16 to 19 Years | 415 (36.3%) | 114 (27.5%) |
| 20 to 24 Years | 1,072 (79.5%) | 125 (11.7%) |
| 25 to 29 Years | 2,050 (95.1%) | 152 (7.4%) |
| 30 to 34 Years | 1,761 (88.7%) | 136 (7.7%) |
| 35 to 44 Years | 2,640 (85.5%) | 137 (5.2%) |
| 45 to 54 Years | 2,726 (78.9%) | 150 (5.5%) |
| 55 to 59 Years | 691 (67.2%) | 14 (2.0%) |
| 60 to 64 Years | 674 (52.0%) | 32 (4.7%) |
| 65 to 74 Years | 357 (17.0%) | 0 (0.0%) |
| 75 Years and over | 129 (9.7%) | 0 (0.0%) |
| Total | 12,511 (66.1%) | 863 (6.9%) |
Employment Status by Educational Attainment in Rosemont
According to labor force statistics for Rosemont, 81.0% of individuals (10,537) out of the total population between 25 and 64 years of age (13,009) are in the labor force, with 5.9% or 622 of them being unemployed. The group with the highest labor force participation rate are those with the educational attainment of bachelor's degree or higher, with 90.7% or 3,776 individuals in the labor force. Within the labor force, individuals with less than high school education have the highest percentage of unemployment, with 14.0% or 48 of them being unemployed.
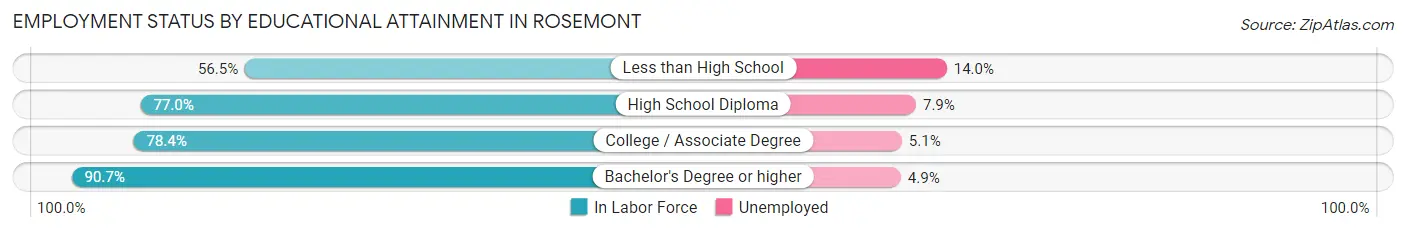
| Educational Attainment | In Labor Force | Unemployed |
| Less than High School | 342 (56.5%) | 85 (14.0%) |
| High School Diploma | 2,148 (77.0%) | 220 (7.9%) |
| College / Associate Degree | 4,274 (78.4%) | 278 (5.1%) |
| Bachelor's Degree or higher | 3,776 (90.7%) | 204 (4.9%) |
| Total | 10,537 (81.0%) | 768 (5.9%) |
Employment Occupations by Sex in Rosemont
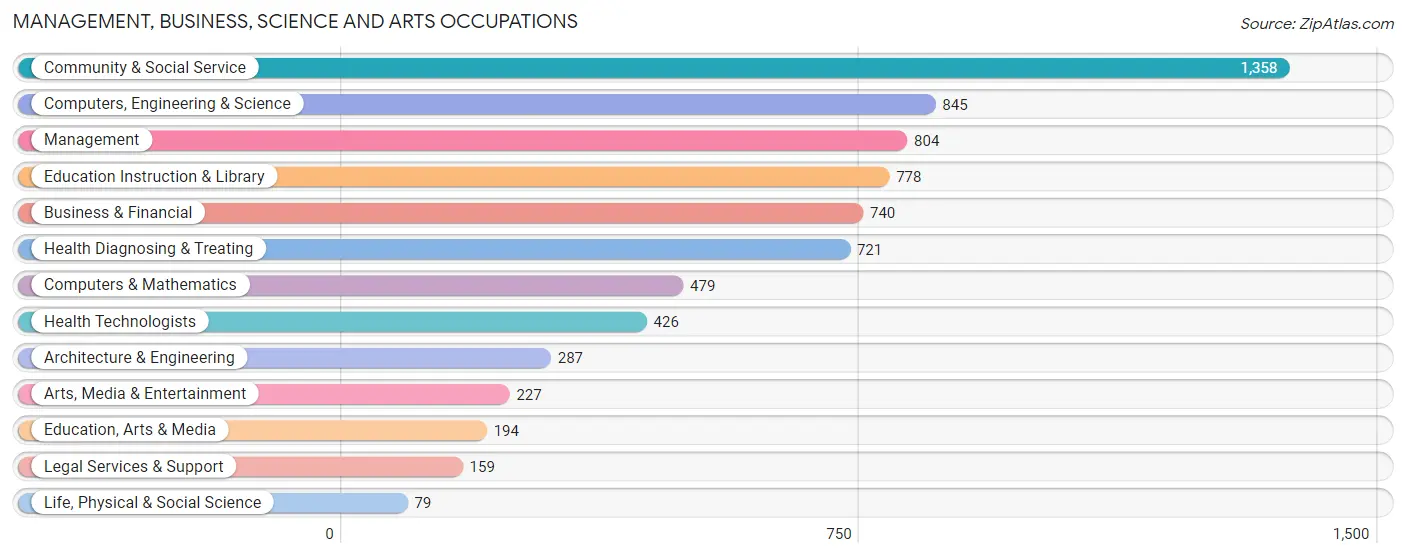
Management, Business, Science and Arts Occupations
The most common Management, Business, Science and Arts occupations in Rosemont are Community & Social Service (1,358 | 11.7%), Computers, Engineering & Science (845 | 7.3%), Management (804 | 7.0%), Education Instruction & Library (778 | 6.7%), and Business & Financial (740 | 6.4%).
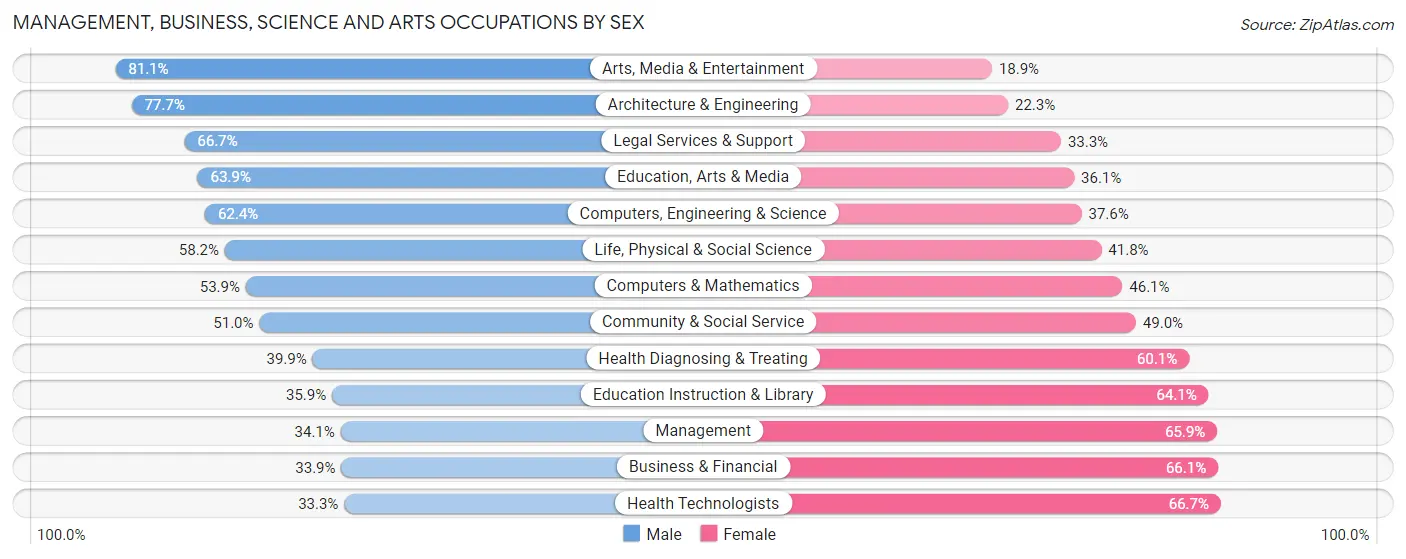
Management, Business, Science and Arts Occupations by Sex
Within the Management, Business, Science and Arts occupations in Rosemont, the most male-oriented occupations are Arts, Media & Entertainment (81.1%), Architecture & Engineering (77.7%), and Legal Services & Support (66.7%), while the most female-oriented occupations are Health Technologists (66.7%), Business & Financial (66.1%), and Management (65.9%).
| Occupation | Male | Female |
| Management | 274 (34.1%) | 530 (65.9%) |
| Business & Financial | 251 (33.9%) | 489 (66.1%) |
| Computers, Engineering & Science | 527 (62.4%) | 318 (37.6%) |
| Computers & Mathematics | 258 (53.9%) | 221 (46.1%) |
| Architecture & Engineering | 223 (77.7%) | 64 (22.3%) |
| Life, Physical & Social Science | 46 (58.2%) | 33 (41.8%) |
| Community & Social Service | 693 (51.0%) | 665 (49.0%) |
| Education, Arts & Media | 124 (63.9%) | 70 (36.1%) |
| Legal Services & Support | 106 (66.7%) | 53 (33.3%) |
| Education Instruction & Library | 279 (35.9%) | 499 (64.1%) |
| Arts, Media & Entertainment | 184 (81.1%) | 43 (18.9%) |
| Health Diagnosing & Treating | 288 (39.9%) | 433 (60.1%) |
| Health Technologists | 142 (33.3%) | 284 (66.7%) |
| Total (Category) | 2,033 (45.5%) | 2,435 (54.5%) |
| Total (Overall) | 5,544 (47.9%) | 6,026 (52.1%) |
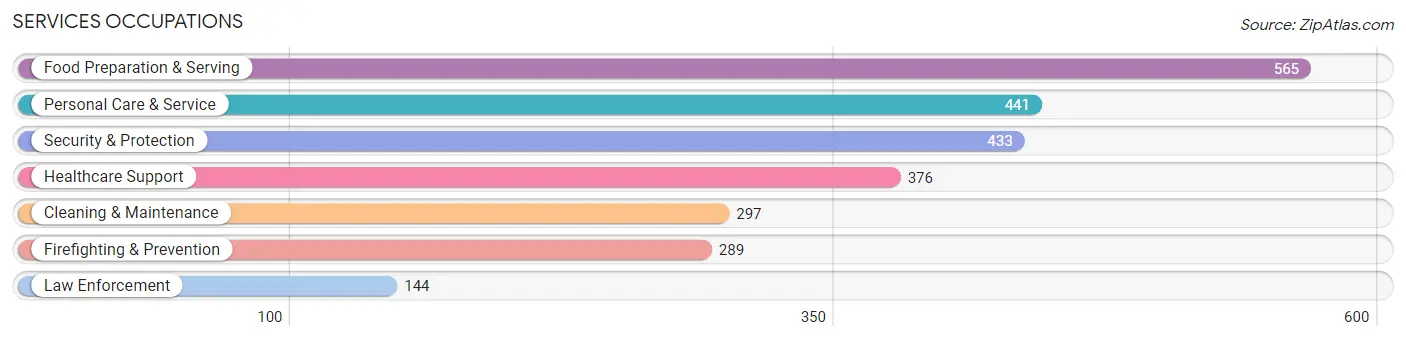
Services Occupations
The most common Services occupations in Rosemont are Food Preparation & Serving (565 | 4.9%), Personal Care & Service (441 | 3.8%), Security & Protection (433 | 3.7%), Healthcare Support (376 | 3.3%), and Cleaning & Maintenance (297 | 2.6%).
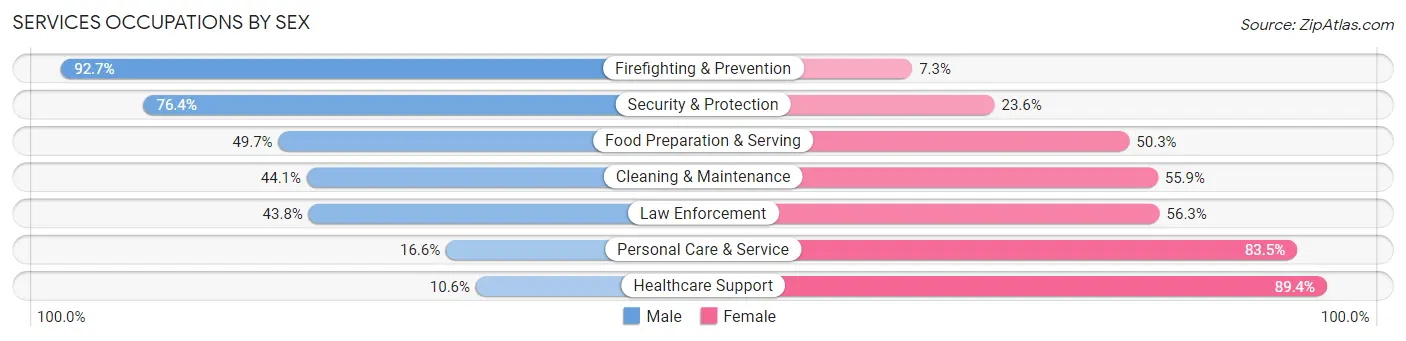
Services Occupations by Sex
Within the Services occupations in Rosemont, the most male-oriented occupations are Firefighting & Prevention (92.7%), Security & Protection (76.4%), and Food Preparation & Serving (49.7%), while the most female-oriented occupations are Healthcare Support (89.4%), Personal Care & Service (83.5%), and Law Enforcement (56.2%).
| Occupation | Male | Female |
| Healthcare Support | 40 (10.6%) | 336 (89.4%) |
| Security & Protection | 331 (76.4%) | 102 (23.6%) |
| Firefighting & Prevention | 268 (92.7%) | 21 (7.3%) |
| Law Enforcement | 63 (43.8%) | 81 (56.2%) |
| Food Preparation & Serving | 281 (49.7%) | 284 (50.3%) |
| Cleaning & Maintenance | 131 (44.1%) | 166 (55.9%) |
| Personal Care & Service | 73 (16.6%) | 368 (83.5%) |
| Total (Category) | 856 (40.5%) | 1,256 (59.5%) |
| Total (Overall) | 5,544 (47.9%) | 6,026 (52.1%) |
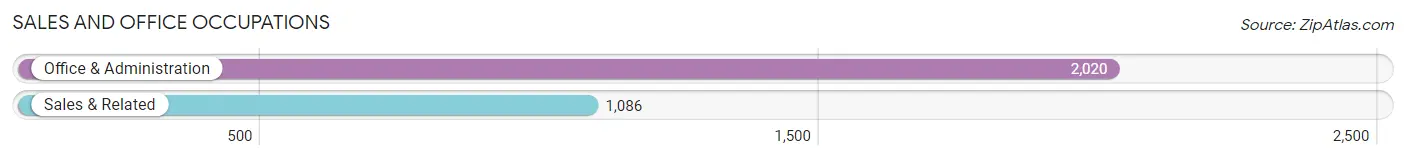
Sales and Office Occupations
The most common Sales and Office occupations in Rosemont are Office & Administration (2,020 | 17.5%), and Sales & Related (1,086 | 9.4%).
Sales and Office Occupations by Sex
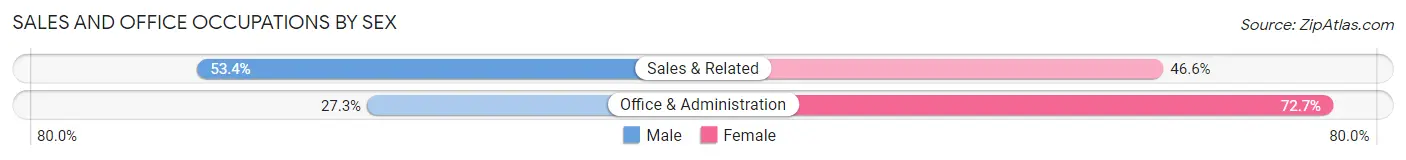
| Occupation | Male | Female |
| Sales & Related | 580 (53.4%) | 506 (46.6%) |
| Office & Administration | 552 (27.3%) | 1,468 (72.7%) |
| Total (Category) | 1,132 (36.4%) | 1,974 (63.5%) |
| Total (Overall) | 5,544 (47.9%) | 6,026 (52.1%) |
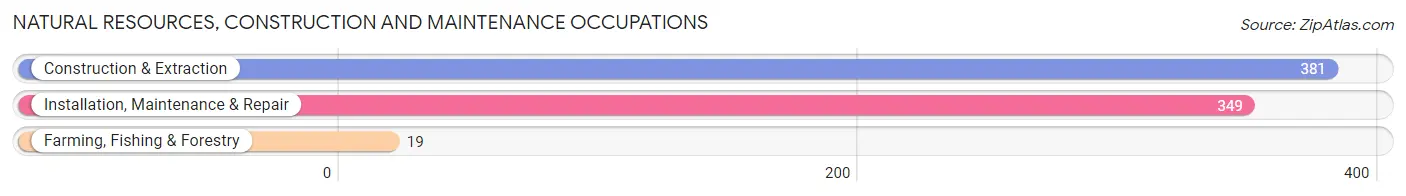
Natural Resources, Construction and Maintenance Occupations
The most common Natural Resources, Construction and Maintenance occupations in Rosemont are Construction & Extraction (381 | 3.3%), Installation, Maintenance & Repair (349 | 3.0%), and Farming, Fishing & Forestry (19 | 0.2%).
Natural Resources, Construction and Maintenance Occupations by Sex
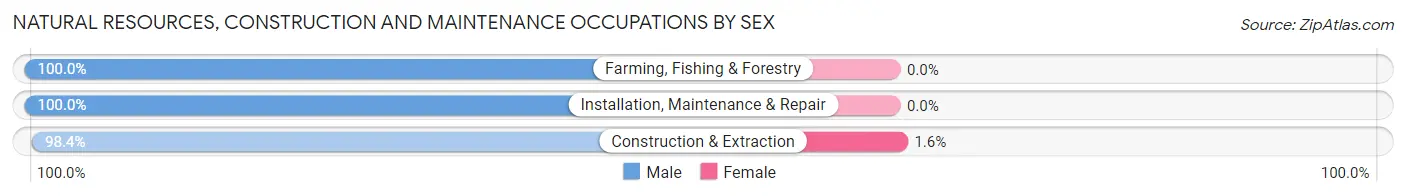
| Occupation | Male | Female |
| Farming, Fishing & Forestry | 19 (100.0%) | 0 (0.0%) |
| Construction & Extraction | 375 (98.4%) | 6 (1.6%) |
| Installation, Maintenance & Repair | 349 (100.0%) | 0 (0.0%) |
| Total (Category) | 743 (99.2%) | 6 (0.8%) |
| Total (Overall) | 5,544 (47.9%) | 6,026 (52.1%) |
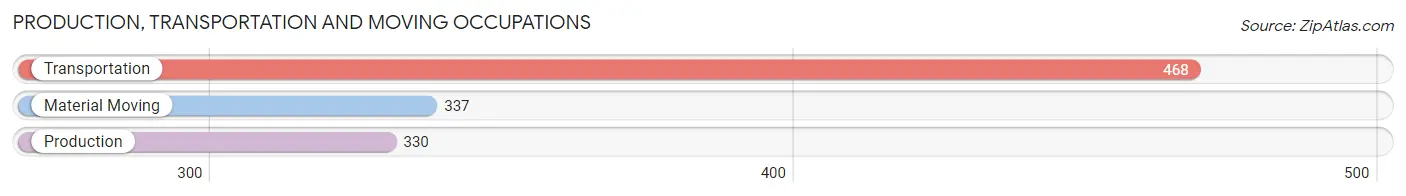
Production, Transportation and Moving Occupations
The most common Production, Transportation and Moving occupations in Rosemont are Transportation (468 | 4.0%), Material Moving (337 | 2.9%), and Production (330 | 2.9%).
Production, Transportation and Moving Occupations by Sex
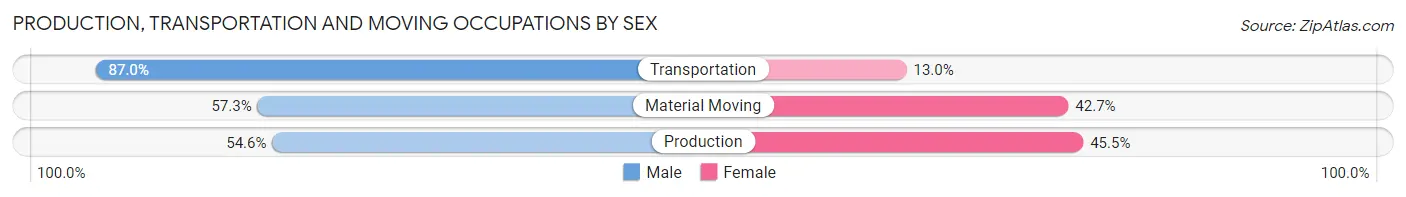
| Occupation | Male | Female |
| Production | 180 (54.5%) | 150 (45.5%) |
| Transportation | 407 (87.0%) | 61 (13.0%) |
| Material Moving | 193 (57.3%) | 144 (42.7%) |
| Total (Category) | 780 (68.7%) | 355 (31.3%) |
| Total (Overall) | 5,544 (47.9%) | 6,026 (52.1%) |
Employment Industries by Sex in Rosemont
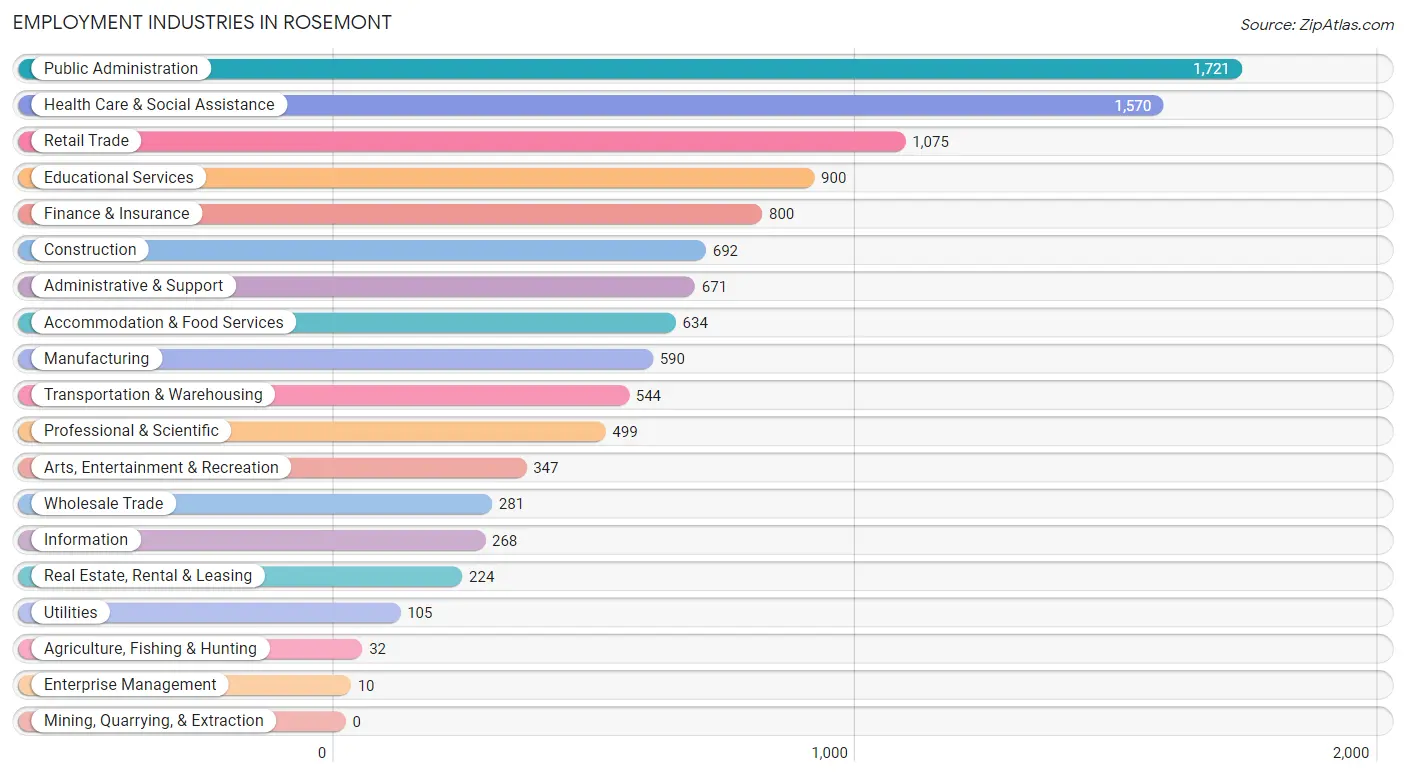
Employment Industries in Rosemont
The major employment industries in Rosemont include Public Administration (1,721 | 14.9%), Health Care & Social Assistance (1,570 | 13.6%), Retail Trade (1,075 | 9.3%), Educational Services (900 | 7.8%), and Finance & Insurance (800 | 6.9%).
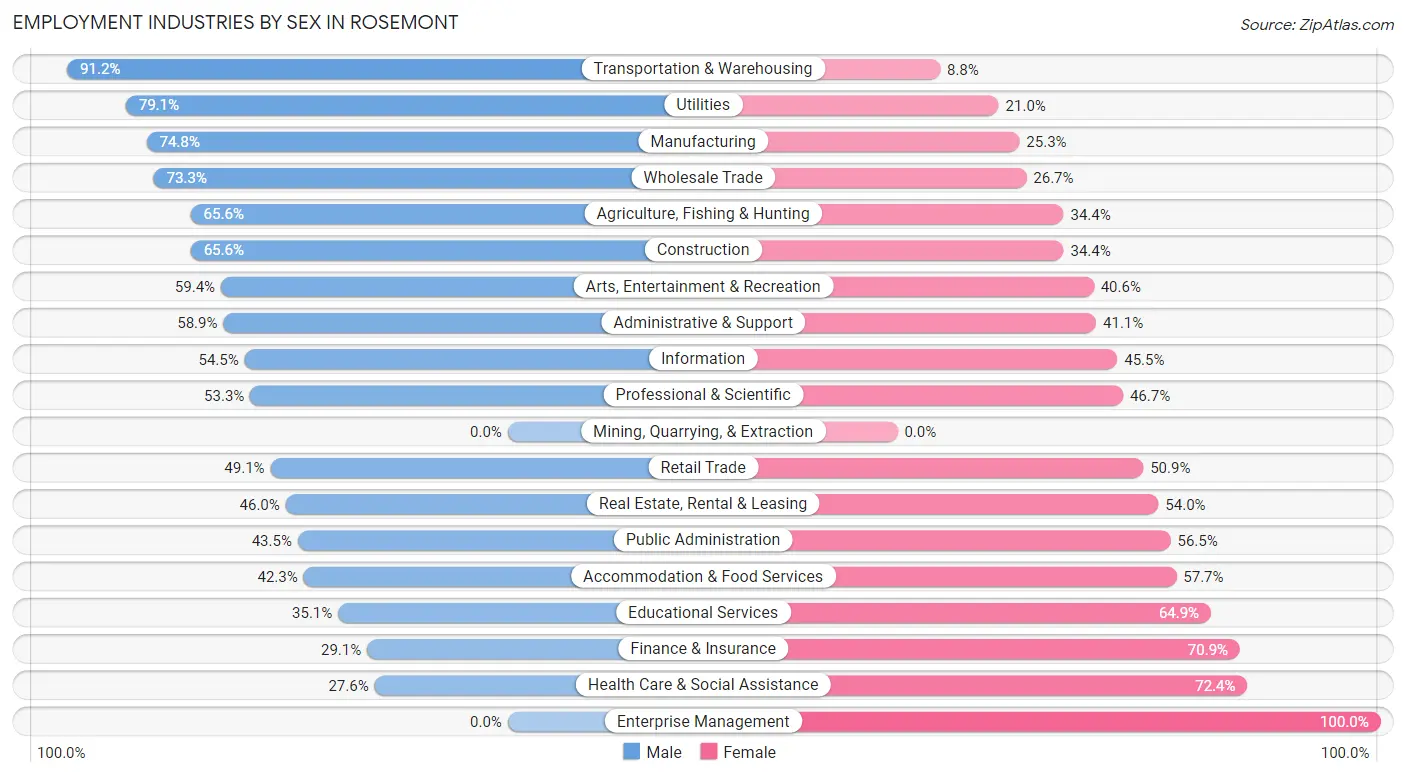
Employment Industries by Sex in Rosemont
The Rosemont industries that see more men than women are Transportation & Warehousing (91.2%), Utilities (79.0%), and Manufacturing (74.8%), whereas the industries that tend to have a higher number of women are Enterprise Management (100.0%), Health Care & Social Assistance (72.4%), and Finance & Insurance (70.9%).
| Industry | Male | Female |
| Agriculture, Fishing & Hunting | 21 (65.6%) | 11 (34.4%) |
| Mining, Quarrying, & Extraction | 0 (0.0%) | 0 (0.0%) |
| Construction | 454 (65.6%) | 238 (34.4%) |
| Manufacturing | 441 (74.8%) | 149 (25.3%) |
| Wholesale Trade | 206 (73.3%) | 75 (26.7%) |
| Retail Trade | 528 (49.1%) | 547 (50.9%) |
| Transportation & Warehousing | 496 (91.2%) | 48 (8.8%) |
| Utilities | 83 (79.0%) | 22 (20.9%) |
| Information | 146 (54.5%) | 122 (45.5%) |
| Finance & Insurance | 233 (29.1%) | 567 (70.9%) |
| Real Estate, Rental & Leasing | 103 (46.0%) | 121 (54.0%) |
| Professional & Scientific | 266 (53.3%) | 233 (46.7%) |
| Enterprise Management | 0 (0.0%) | 10 (100.0%) |
| Administrative & Support | 395 (58.9%) | 276 (41.1%) |
| Educational Services | 316 (35.1%) | 584 (64.9%) |
| Health Care & Social Assistance | 433 (27.6%) | 1,137 (72.4%) |
| Arts, Entertainment & Recreation | 206 (59.4%) | 141 (40.6%) |
| Accommodation & Food Services | 268 (42.3%) | 366 (57.7%) |
| Public Administration | 748 (43.5%) | 973 (56.5%) |
| Total | 5,544 (47.9%) | 6,026 (52.1%) |
Education in Rosemont
School Enrollment in Rosemont
The most common levels of schooling among the 5,682 students in Rosemont are college / undergraduate (1,607 | 28.3%), elementary school (1,263 | 22.2%), and middle school (1,108 | 19.5%).
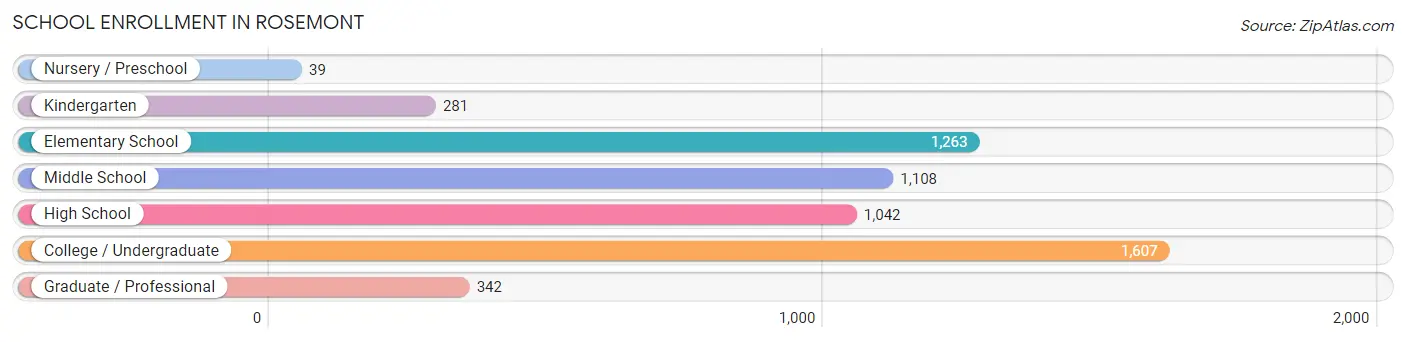
| School Level | # Students | % Students |
| Nursery / Preschool | 39 | 0.7% |
| Kindergarten | 281 | 5.0% |
| Elementary School | 1,263 | 22.2% |
| Middle School | 1,108 | 19.5% |
| High School | 1,042 | 18.3% |
| College / Undergraduate | 1,607 | 28.3% |
| Graduate / Professional | 342 | 6.0% |
| Total | 5,682 | 100.0% |
School Enrollment by Age by Funding Source in Rosemont
Out of a total of 5,682 students who are enrolled in schools in Rosemont, 693 (12.2%) attend a private institution, while the remaining 4,989 (87.8%) are enrolled in public schools. The age group of 35 years and over has the highest likelihood of being enrolled in private schools, with 146 (35.3% in the age bracket) enrolled. Conversely, the age group of 3 to 4 year olds has the lowest likelihood of being enrolled in a private school, with 22 (100.0% in the age bracket) attending a public institution.
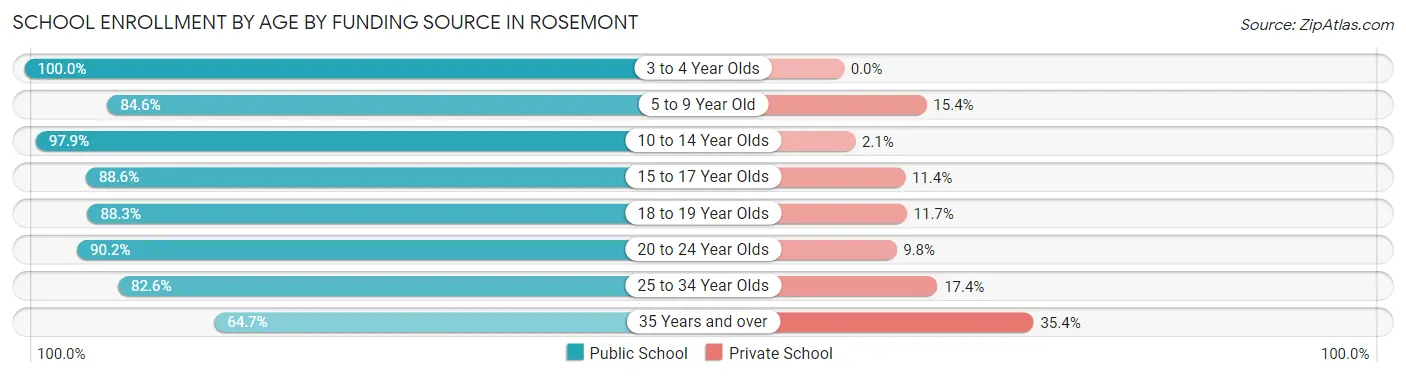
| Age Bracket | Public School | Private School |
| 3 to 4 Year Olds | 22 (100.0%) | 0 (0.0%) |
| 5 to 9 Year Old | 1,197 (84.6%) | 218 (15.4%) |
| 10 to 14 Year Olds | 1,345 (97.9%) | 29 (2.1%) |
| 15 to 17 Year Olds | 737 (88.6%) | 95 (11.4%) |
| 18 to 19 Year Olds | 324 (88.3%) | 43 (11.7%) |
| 20 to 24 Year Olds | 654 (90.2%) | 71 (9.8%) |
| 25 to 34 Year Olds | 441 (82.6%) | 93 (17.4%) |
| 35 Years and over | 267 (64.6%) | 146 (35.3%) |
| Total | 4,989 (87.8%) | 693 (12.2%) |
Educational Attainment by Field of Study in Rosemont
Business (742 | 14.5%), arts & humanities (708 | 13.8%), social sciences (633 | 12.3%), science & technology (462 | 9.0%), and engineering (455 | 8.9%) are the most common fields of study among 5,126 individuals in Rosemont who have obtained a bachelor's degree or higher.
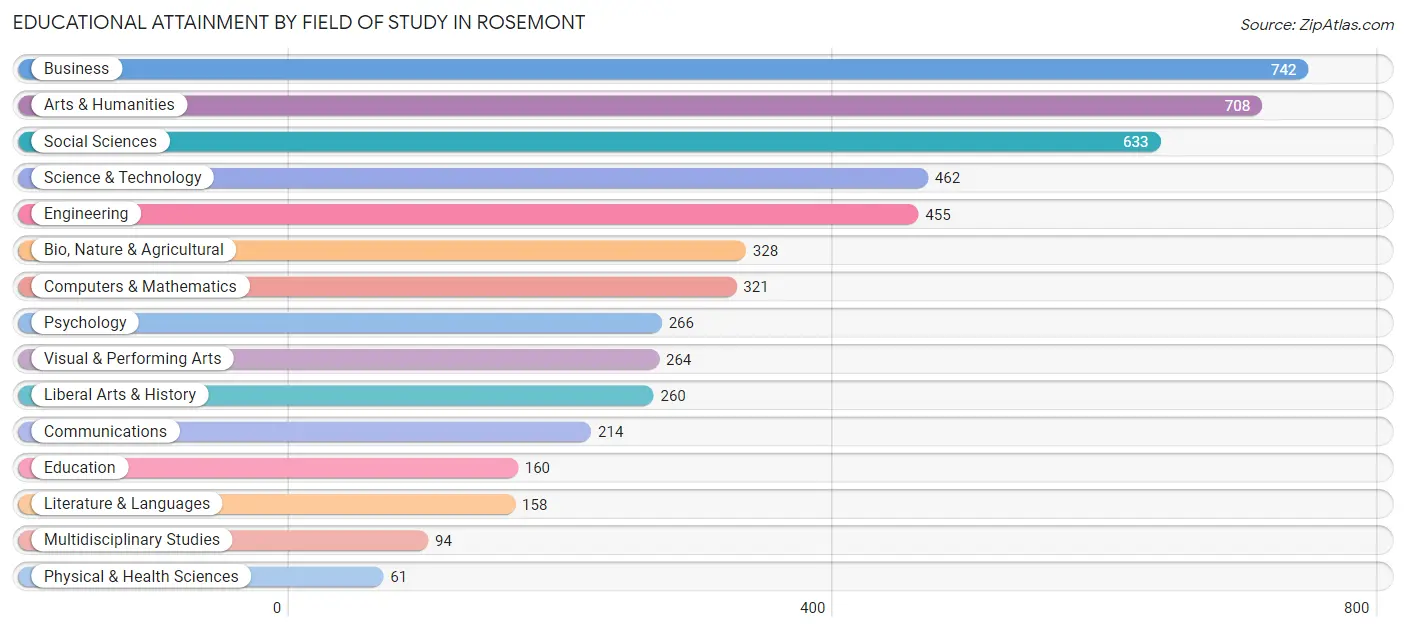
| Field of Study | # Graduates | % Graduates |
| Computers & Mathematics | 321 | 6.3% |
| Bio, Nature & Agricultural | 328 | 6.4% |
| Physical & Health Sciences | 61 | 1.2% |
| Psychology | 266 | 5.2% |
| Social Sciences | 633 | 12.3% |
| Engineering | 455 | 8.9% |
| Multidisciplinary Studies | 94 | 1.8% |
| Science & Technology | 462 | 9.0% |
| Business | 742 | 14.5% |
| Education | 160 | 3.1% |
| Literature & Languages | 158 | 3.1% |
| Liberal Arts & History | 260 | 5.1% |
| Visual & Performing Arts | 264 | 5.1% |
| Communications | 214 | 4.2% |
| Arts & Humanities | 708 | 13.8% |
| Total | 5,126 | 100.0% |
Transportation & Commute in Rosemont
Vehicle Availability by Sex in Rosemont
The most prevalent vehicle ownership categories in Rosemont are males with 2 vehicles (2,740, accounting for 50.1%) and females with 2 vehicles (2,530, making up 46.5%).
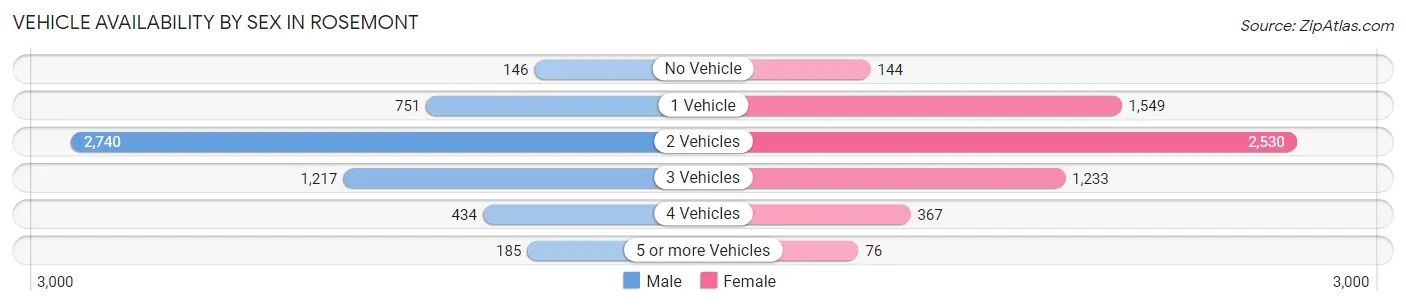
| Vehicles Available | Male | Female |
| No Vehicle | 146 (2.7%) | 144 (2.4%) |
| 1 Vehicle | 751 (13.7%) | 1,549 (26.3%) |
| 2 Vehicles | 2,740 (50.1%) | 2,530 (42.9%) |
| 3 Vehicles | 1,217 (22.2%) | 1,233 (20.9%) |
| 4 Vehicles | 434 (7.9%) | 367 (6.2%) |
| 5 or more Vehicles | 185 (3.4%) | 76 (1.3%) |
| Total | 5,473 (100.0%) | 5,899 (100.0%) |
Commute Time in Rosemont
The most frequently occuring commute durations in Rosemont are 20 to 24 minutes (2,053 commuters, 20.4%), 30 to 34 minutes (1,831 commuters, 18.2%), and 15 to 19 minutes (1,671 commuters, 16.6%).
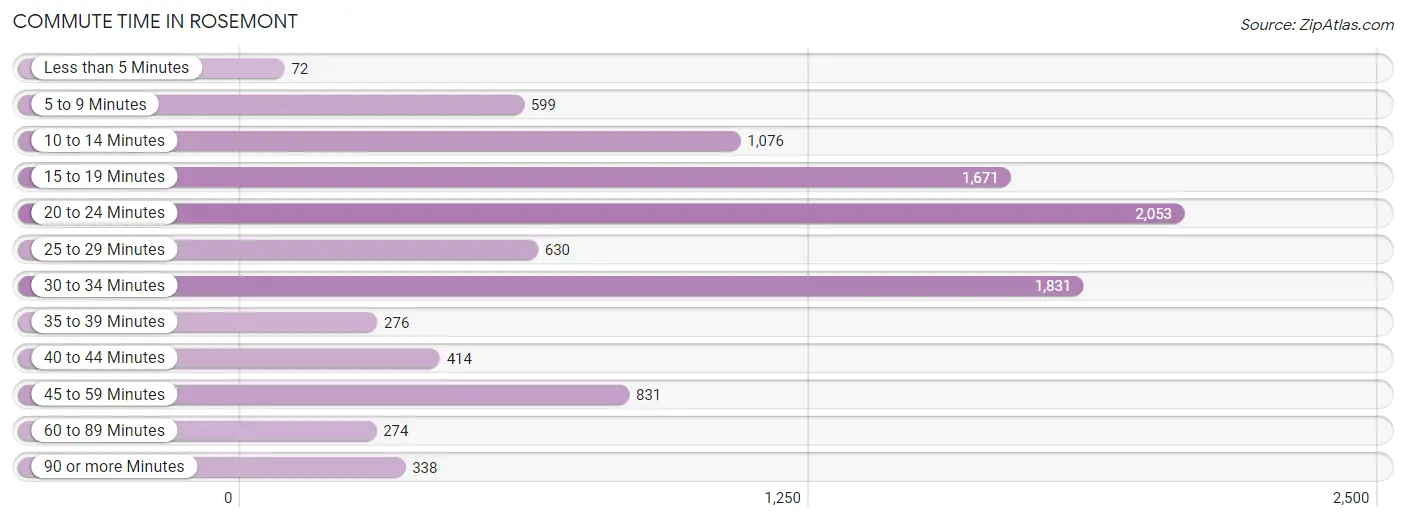
| Commute Time | # Commuters | % Commuters |
| Less than 5 Minutes | 72 | 0.7% |
| 5 to 9 Minutes | 599 | 5.9% |
| 10 to 14 Minutes | 1,076 | 10.7% |
| 15 to 19 Minutes | 1,671 | 16.6% |
| 20 to 24 Minutes | 2,053 | 20.4% |
| 25 to 29 Minutes | 630 | 6.3% |
| 30 to 34 Minutes | 1,831 | 18.2% |
| 35 to 39 Minutes | 276 | 2.7% |
| 40 to 44 Minutes | 414 | 4.1% |
| 45 to 59 Minutes | 831 | 8.3% |
| 60 to 89 Minutes | 274 | 2.7% |
| 90 or more Minutes | 338 | 3.4% |
Commute Time by Sex in Rosemont
The most common commute times in Rosemont are 30 to 34 minutes (910 commuters, 18.3%) for males and 20 to 24 minutes (1,204 commuters, 23.6%) for females.
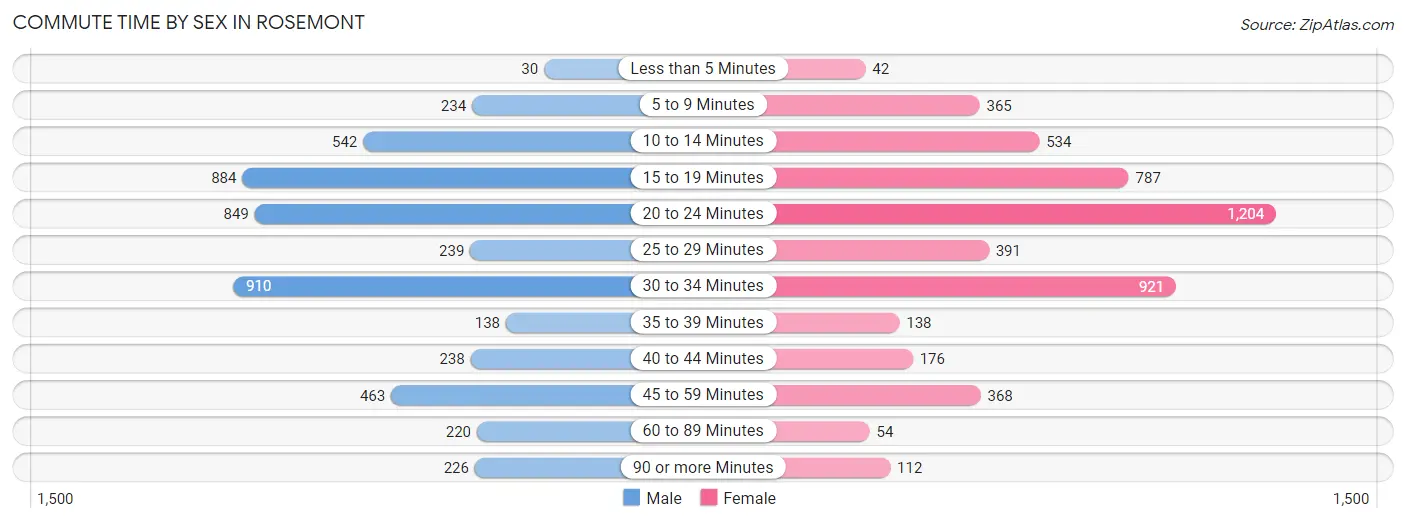
| Commute Time | Male | Female |
| Less than 5 Minutes | 30 (0.6%) | 42 (0.8%) |
| 5 to 9 Minutes | 234 (4.7%) | 365 (7.2%) |
| 10 to 14 Minutes | 542 (10.9%) | 534 (10.5%) |
| 15 to 19 Minutes | 884 (17.8%) | 787 (15.5%) |
| 20 to 24 Minutes | 849 (17.1%) | 1,204 (23.6%) |
| 25 to 29 Minutes | 239 (4.8%) | 391 (7.7%) |
| 30 to 34 Minutes | 910 (18.3%) | 921 (18.1%) |
| 35 to 39 Minutes | 138 (2.8%) | 138 (2.7%) |
| 40 to 44 Minutes | 238 (4.8%) | 176 (3.5%) |
| 45 to 59 Minutes | 463 (9.3%) | 368 (7.2%) |
| 60 to 89 Minutes | 220 (4.4%) | 54 (1.1%) |
| 90 or more Minutes | 226 (4.5%) | 112 (2.2%) |
Time of Departure to Work by Sex in Rosemont
The most frequent times of departure to work in Rosemont are 6:30 AM to 6:59 AM (678, 13.6%) for males and 8:00 AM to 8:29 AM (867, 17.0%) for females.
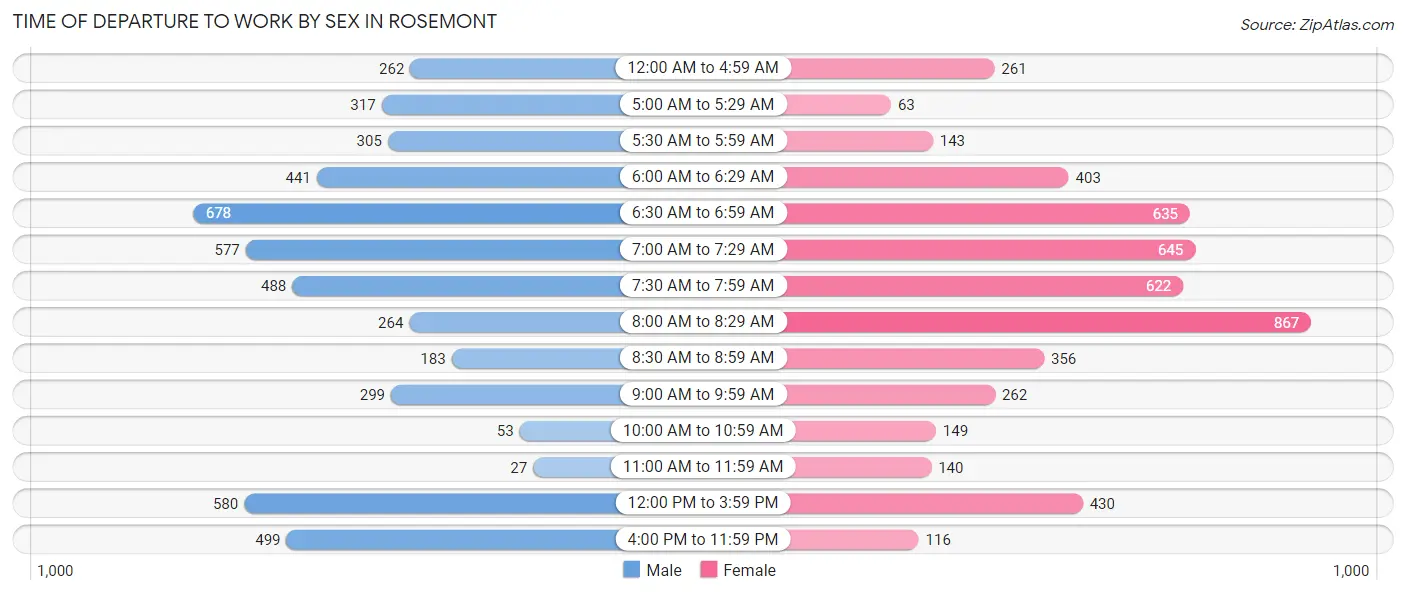
| Time of Departure | Male | Female |
| 12:00 AM to 4:59 AM | 262 (5.3%) | 261 (5.1%) |
| 5:00 AM to 5:29 AM | 317 (6.4%) | 63 (1.2%) |
| 5:30 AM to 5:59 AM | 305 (6.1%) | 143 (2.8%) |
| 6:00 AM to 6:29 AM | 441 (8.9%) | 403 (7.9%) |
| 6:30 AM to 6:59 AM | 678 (13.6%) | 635 (12.5%) |
| 7:00 AM to 7:29 AM | 577 (11.6%) | 645 (12.7%) |
| 7:30 AM to 7:59 AM | 488 (9.8%) | 622 (12.2%) |
| 8:00 AM to 8:29 AM | 264 (5.3%) | 867 (17.0%) |
| 8:30 AM to 8:59 AM | 183 (3.7%) | 356 (7.0%) |
| 9:00 AM to 9:59 AM | 299 (6.0%) | 262 (5.1%) |
| 10:00 AM to 10:59 AM | 53 (1.1%) | 149 (2.9%) |
| 11:00 AM to 11:59 AM | 27 (0.5%) | 140 (2.8%) |
| 12:00 PM to 3:59 PM | 580 (11.7%) | 430 (8.4%) |
| 4:00 PM to 11:59 PM | 499 (10.0%) | 116 (2.3%) |
| Total | 4,973 (100.0%) | 5,092 (100.0%) |
Housing Occupancy in Rosemont
Occupancy by Ownership in Rosemont
Of the total 8,813 dwellings in Rosemont, owner-occupied units account for 5,229 (59.3%), while renter-occupied units make up 3,584 (40.7%).
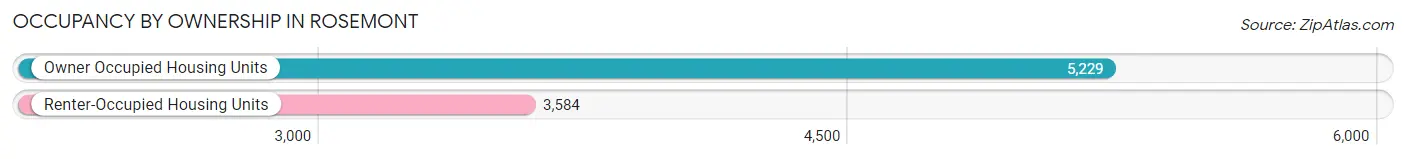
| Occupancy | # Housing Units | % Housing Units |
| Owner Occupied Housing Units | 5,229 | 59.3% |
| Renter-Occupied Housing Units | 3,584 | 40.7% |
| Total Occupied Housing Units | 8,813 | 100.0% |
Occupancy by Household Size in Rosemont
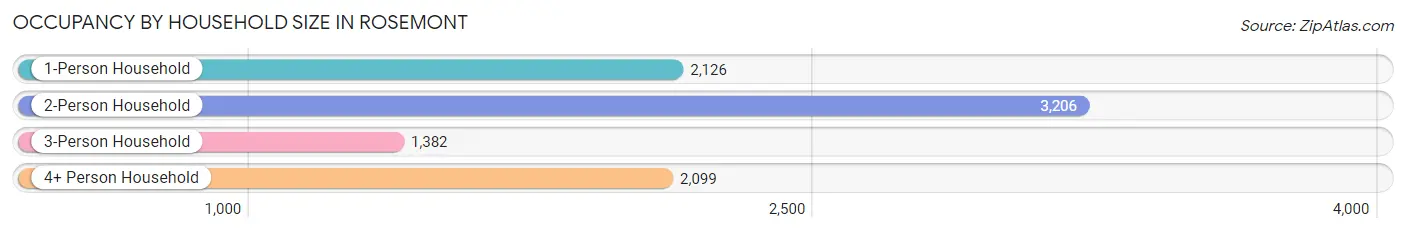
| Household Size | # Housing Units | % Housing Units |
| 1-Person Household | 2,126 | 24.1% |
| 2-Person Household | 3,206 | 36.4% |
| 3-Person Household | 1,382 | 15.7% |
| 4+ Person Household | 2,099 | 23.8% |
| Total Housing Units | 8,813 | 100.0% |
Occupancy by Ownership by Household Size in Rosemont
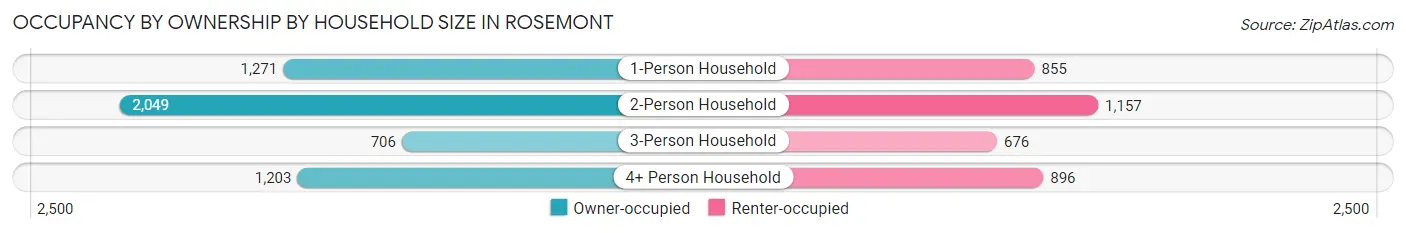
| Household Size | Owner-occupied | Renter-occupied |
| 1-Person Household | 1,271 (59.8%) | 855 (40.2%) |
| 2-Person Household | 2,049 (63.9%) | 1,157 (36.1%) |
| 3-Person Household | 706 (51.1%) | 676 (48.9%) |
| 4+ Person Household | 1,203 (57.3%) | 896 (42.7%) |
| Total Housing Units | 5,229 (59.3%) | 3,584 (40.7%) |
Occupancy by Educational Attainment in Rosemont
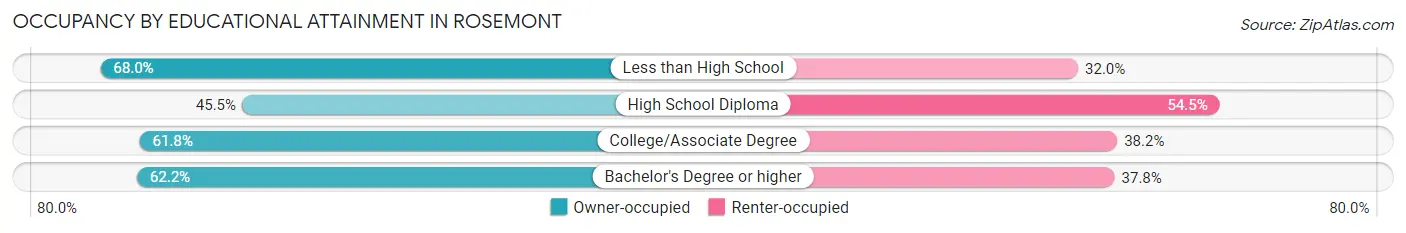
| Household Size | Owner-occupied | Renter-occupied |
| Less than High School | 314 (68.0%) | 148 (32.0%) |
| High School Diploma | 715 (45.5%) | 855 (54.5%) |
| College/Associate Degree | 2,395 (61.8%) | 1,483 (38.2%) |
| Bachelor's Degree or higher | 1,805 (62.2%) | 1,098 (37.8%) |
Occupancy by Age of Householder in Rosemont
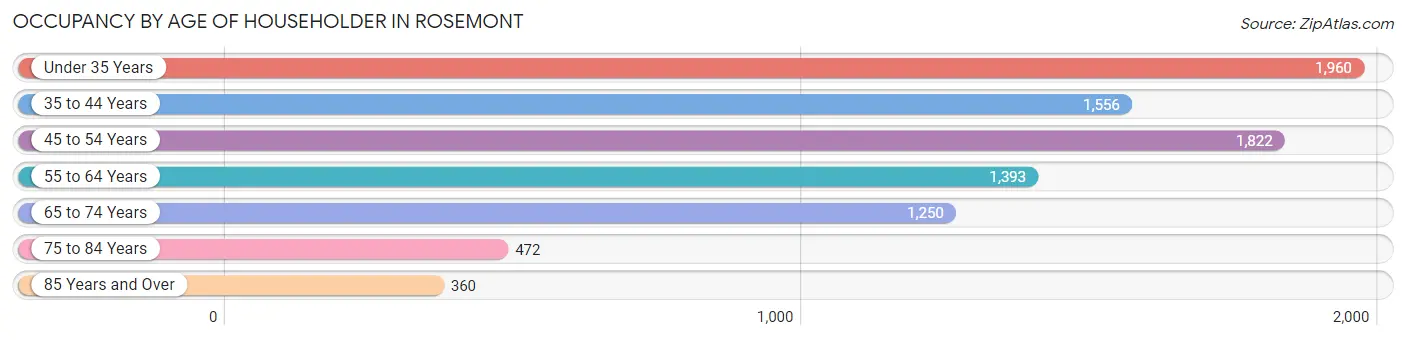
| Age Bracket | # Households | % Households |
| Under 35 Years | 1,960 | 22.2% |
| 35 to 44 Years | 1,556 | 17.7% |
| 45 to 54 Years | 1,822 | 20.7% |
| 55 to 64 Years | 1,393 | 15.8% |
| 65 to 74 Years | 1,250 | 14.2% |
| 75 to 84 Years | 472 | 5.4% |
| 85 Years and Over | 360 | 4.1% |
| Total | 8,813 | 100.0% |
Housing Finances in Rosemont
Median Income by Occupancy in Rosemont
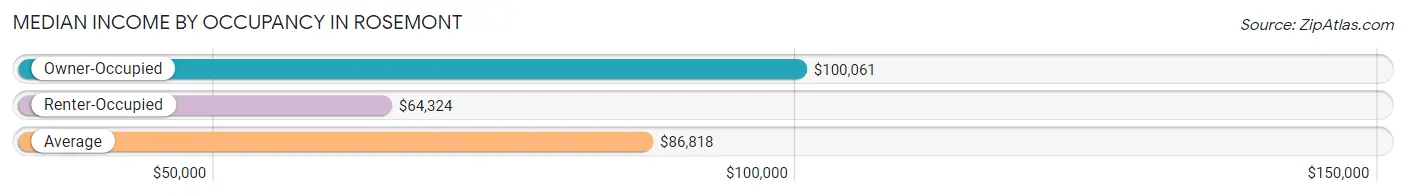
| Occupancy Type | # Households | Median Income |
| Owner-Occupied | 5,229 (59.3%) | $100,061 |
| Renter-Occupied | 3,584 (40.7%) | $64,324 |
| Average | 8,813 (100.0%) | $86,818 |
Occupancy by Householder Income Bracket in Rosemont
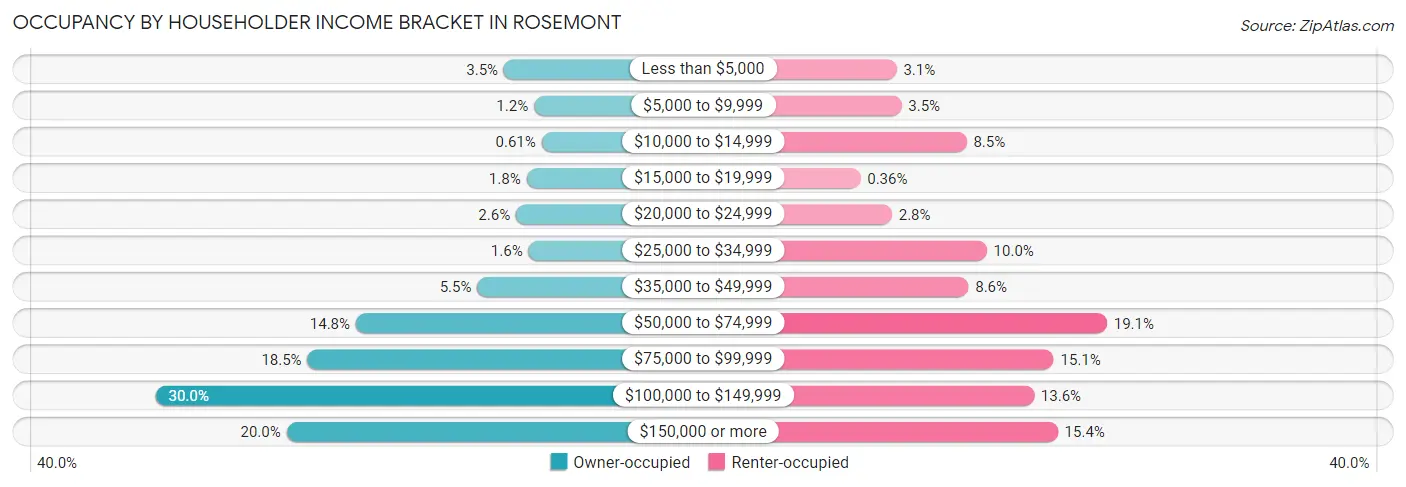
| Income Bracket | Owner-occupied | Renter-occupied |
| Less than $5,000 | 182 (3.5%) | 112 (3.1%) |
| $5,000 to $9,999 | 62 (1.2%) | 125 (3.5%) |
| $10,000 to $14,999 | 32 (0.6%) | 303 (8.5%) |
| $15,000 to $19,999 | 92 (1.8%) | 13 (0.4%) |
| $20,000 to $24,999 | 134 (2.6%) | 99 (2.8%) |
| $25,000 to $34,999 | 84 (1.6%) | 358 (10.0%) |
| $35,000 to $49,999 | 288 (5.5%) | 308 (8.6%) |
| $50,000 to $74,999 | 772 (14.8%) | 686 (19.1%) |
| $75,000 to $99,999 | 965 (18.4%) | 541 (15.1%) |
| $100,000 to $149,999 | 1,570 (30.0%) | 487 (13.6%) |
| $150,000 or more | 1,048 (20.0%) | 552 (15.4%) |
| Total | 5,229 (100.0%) | 3,584 (100.0%) |
Monthly Housing Cost Tiers in Rosemont
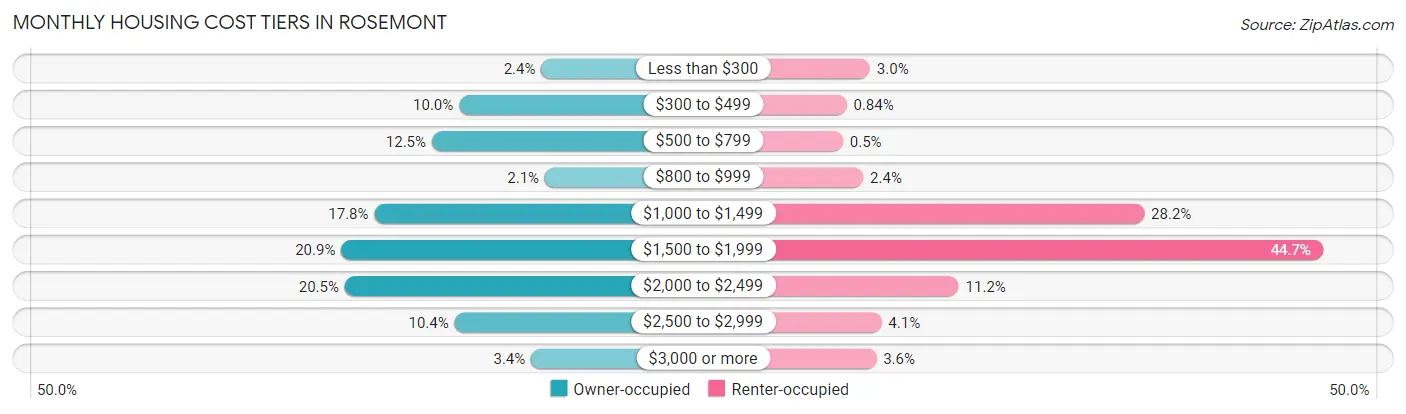
| Monthly Cost | Owner-occupied | Renter-occupied |
| Less than $300 | 127 (2.4%) | 107 (3.0%) |
| $300 to $499 | 523 (10.0%) | 30 (0.8%) |
| $500 to $799 | 654 (12.5%) | 18 (0.5%) |
| $800 to $999 | 110 (2.1%) | 85 (2.4%) |
| $1,000 to $1,499 | 931 (17.8%) | 1,012 (28.2%) |
| $1,500 to $1,999 | 1,090 (20.8%) | 1,601 (44.7%) |
| $2,000 to $2,499 | 1,073 (20.5%) | 400 (11.2%) |
| $2,500 to $2,999 | 545 (10.4%) | 145 (4.1%) |
| $3,000 or more | 176 (3.4%) | 128 (3.6%) |
| Total | 5,229 (100.0%) | 3,584 (100.0%) |
Physical Housing Characteristics in Rosemont
Housing Structures in Rosemont
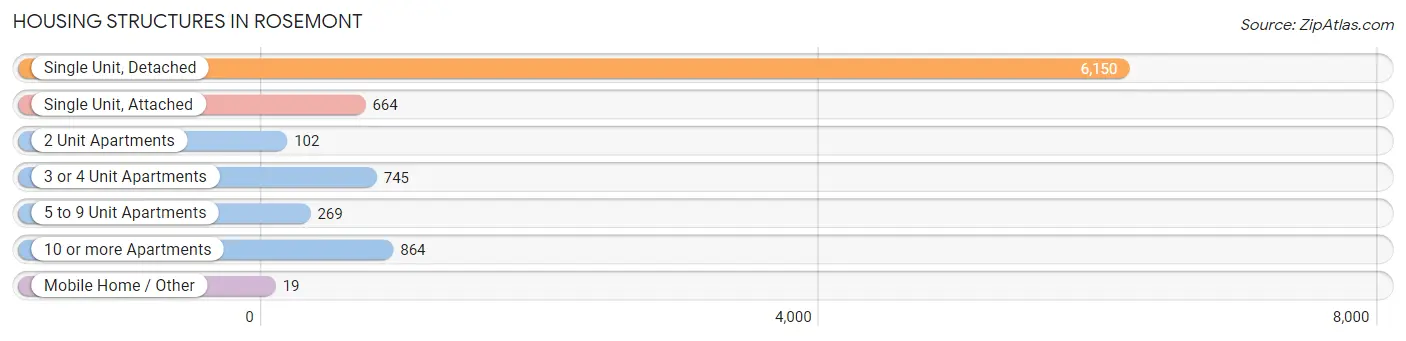
| Structure Type | # Housing Units | % Housing Units |
| Single Unit, Detached | 6,150 | 69.8% |
| Single Unit, Attached | 664 | 7.5% |
| 2 Unit Apartments | 102 | 1.2% |
| 3 or 4 Unit Apartments | 745 | 8.5% |
| 5 to 9 Unit Apartments | 269 | 3.0% |
| 10 or more Apartments | 864 | 9.8% |
| Mobile Home / Other | 19 | 0.2% |
| Total | 8,813 | 100.0% |
Housing Structures by Occupancy in Rosemont
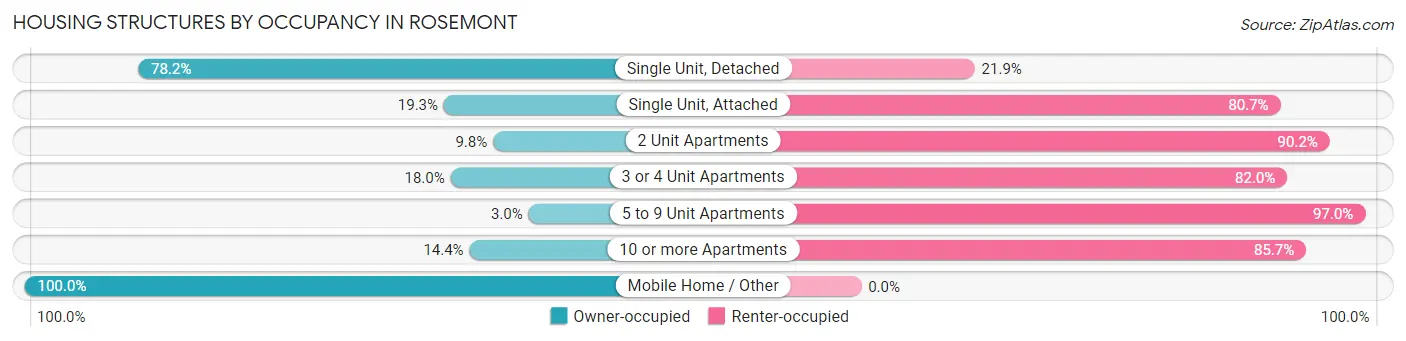
| Structure Type | Owner-occupied | Renter-occupied |
| Single Unit, Detached | 4,806 (78.1%) | 1,344 (21.8%) |
| Single Unit, Attached | 128 (19.3%) | 536 (80.7%) |
| 2 Unit Apartments | 10 (9.8%) | 92 (90.2%) |
| 3 or 4 Unit Apartments | 134 (18.0%) | 611 (82.0%) |
| 5 to 9 Unit Apartments | 8 (3.0%) | 261 (97.0%) |
| 10 or more Apartments | 124 (14.3%) | 740 (85.7%) |
| Mobile Home / Other | 19 (100.0%) | 0 (0.0%) |
| Total | 5,229 (59.3%) | 3,584 (40.7%) |
Housing Structures by Number of Rooms in Rosemont
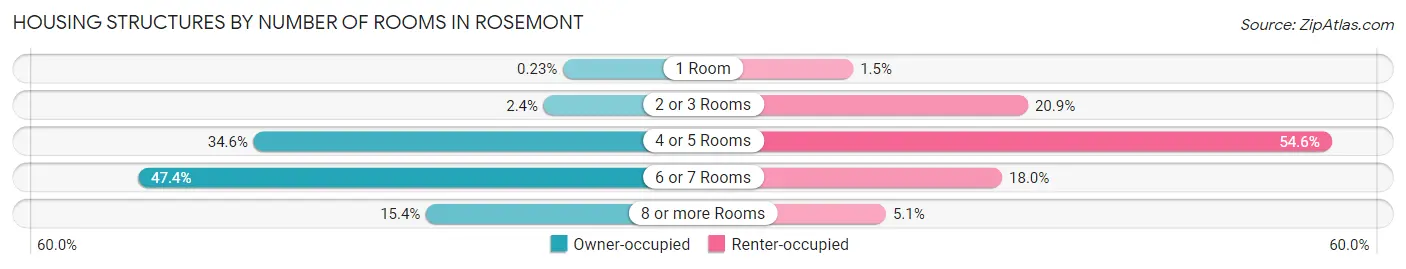
| Number of Rooms | Owner-occupied | Renter-occupied |
| 1 Room | 12 (0.2%) | 53 (1.5%) |
| 2 or 3 Rooms | 124 (2.4%) | 748 (20.9%) |
| 4 or 5 Rooms | 1,807 (34.6%) | 1,955 (54.5%) |
| 6 or 7 Rooms | 2,479 (47.4%) | 645 (18.0%) |
| 8 or more Rooms | 807 (15.4%) | 183 (5.1%) |
| Total | 5,229 (100.0%) | 3,584 (100.0%) |
Housing Structure by Heating Type in Rosemont
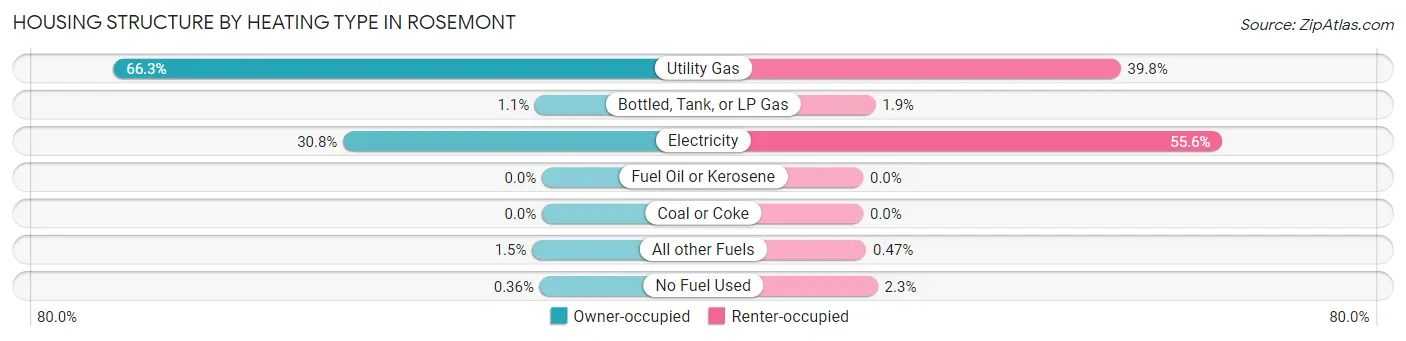
| Heating Type | Owner-occupied | Renter-occupied |
| Utility Gas | 3,466 (66.3%) | 1,427 (39.8%) |
| Bottled, Tank, or LP Gas | 57 (1.1%) | 68 (1.9%) |
| Electricity | 1,608 (30.7%) | 1,991 (55.5%) |
| Fuel Oil or Kerosene | 0 (0.0%) | 0 (0.0%) |
| Coal or Coke | 0 (0.0%) | 0 (0.0%) |
| All other Fuels | 79 (1.5%) | 17 (0.5%) |
| No Fuel Used | 19 (0.4%) | 81 (2.3%) |
| Total | 5,229 (100.0%) | 3,584 (100.0%) |
Household Vehicle Usage in Rosemont
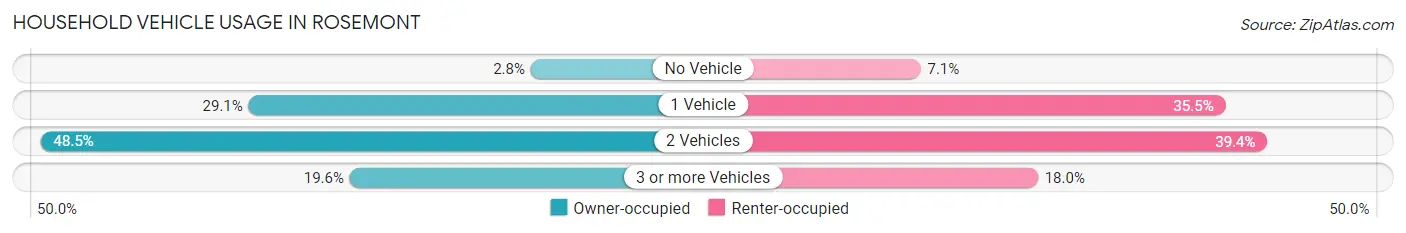
| Vehicles per Household | Owner-occupied | Renter-occupied |
| No Vehicle | 144 (2.8%) | 253 (7.1%) |
| 1 Vehicle | 1,521 (29.1%) | 1,273 (35.5%) |
| 2 Vehicles | 2,537 (48.5%) | 1,413 (39.4%) |
| 3 or more Vehicles | 1,027 (19.6%) | 645 (18.0%) |
| Total | 5,229 (100.0%) | 3,584 (100.0%) |
Real Estate & Mortgages in Rosemont
Real Estate and Mortgage Overview in Rosemont
| Characteristic | Without Mortgage | With Mortgage |
| Housing Units | 1,263 | 3,966 |
| Median Property Value | $380,100 | $412,900 |
| Median Household Income | $83,423 | $877 |
| Monthly Housing Costs | $502 | $176 |
| Real Estate Taxes | $1,872 | $70 |
Property Value by Mortgage Status in Rosemont
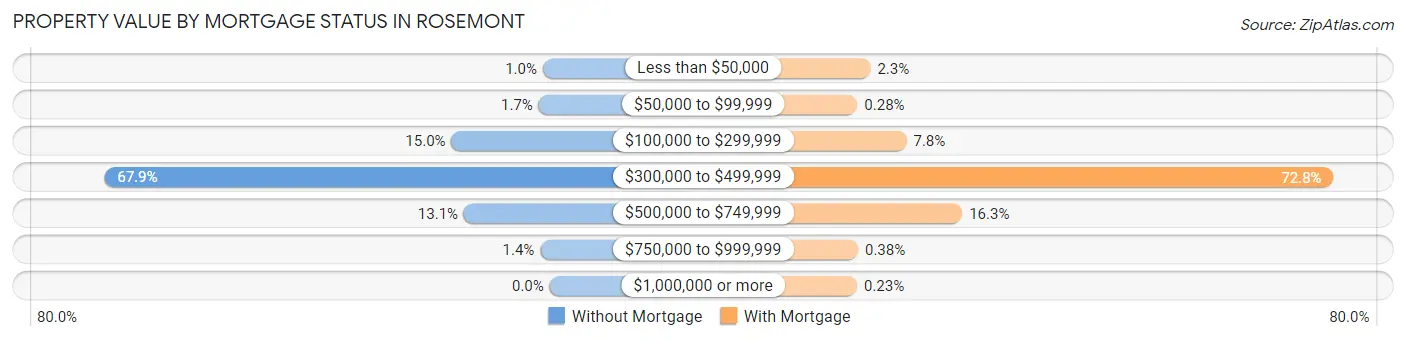
| Property Value | Without Mortgage | With Mortgage |
| Less than $50,000 | 13 (1.0%) | 90 (2.3%) |
| $50,000 to $99,999 | 21 (1.7%) | 11 (0.3%) |
| $100,000 to $299,999 | 189 (15.0%) | 308 (7.8%) |
| $300,000 to $499,999 | 857 (67.8%) | 2,888 (72.8%) |
| $500,000 to $749,999 | 165 (13.1%) | 645 (16.3%) |
| $750,000 to $999,999 | 18 (1.4%) | 15 (0.4%) |
| $1,000,000 or more | 0 (0.0%) | 9 (0.2%) |
| Total | 1,263 (100.0%) | 3,966 (100.0%) |
Household Income by Mortgage Status in Rosemont
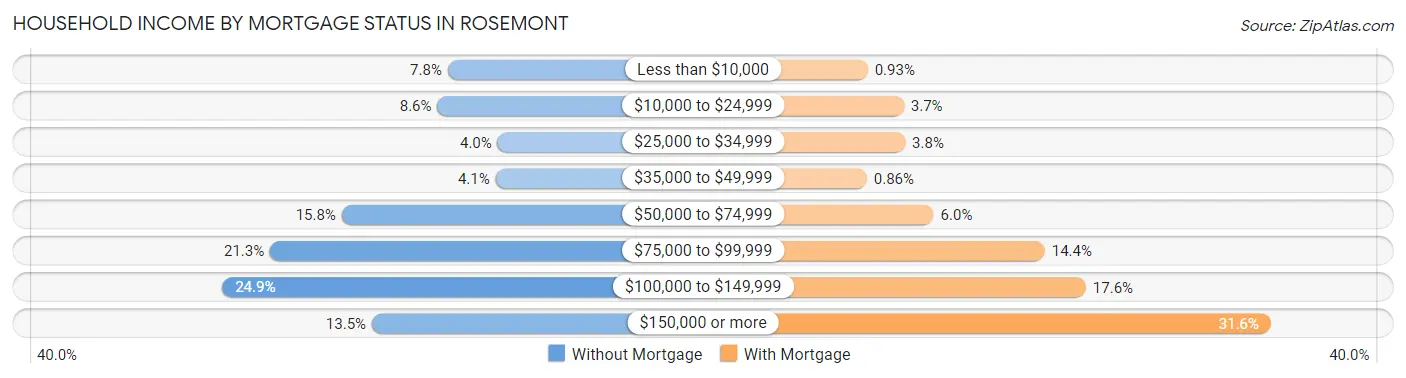
| Household Income | Without Mortgage | With Mortgage |
| Less than $10,000 | 98 (7.8%) | 37 (0.9%) |
| $10,000 to $24,999 | 108 (8.6%) | 146 (3.7%) |
| $25,000 to $34,999 | 50 (4.0%) | 150 (3.8%) |
| $35,000 to $49,999 | 52 (4.1%) | 34 (0.9%) |
| $50,000 to $74,999 | 200 (15.8%) | 236 (5.9%) |
| $75,000 to $99,999 | 269 (21.3%) | 572 (14.4%) |
| $100,000 to $149,999 | 315 (24.9%) | 696 (17.5%) |
| $150,000 or more | 171 (13.5%) | 1,255 (31.6%) |
| Total | 1,263 (100.0%) | 3,966 (100.0%) |
Property Value to Household Income Ratio in Rosemont
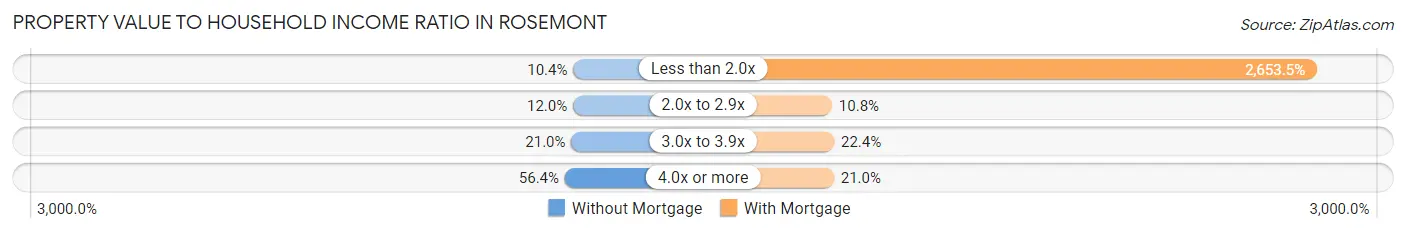
| Value-to-Income Ratio | Without Mortgage | With Mortgage |
| Less than 2.0x | 131 (10.4%) | 105,236 (2,653.5%) |
| 2.0x to 2.9x | 152 (12.0%) | 430 (10.8%) |
| 3.0x to 3.9x | 265 (21.0%) | 890 (22.4%) |
| 4.0x or more | 712 (56.4%) | 834 (21.0%) |
| Total | 1,263 (100.0%) | 3,966 (100.0%) |
Real Estate Taxes by Mortgage Status in Rosemont
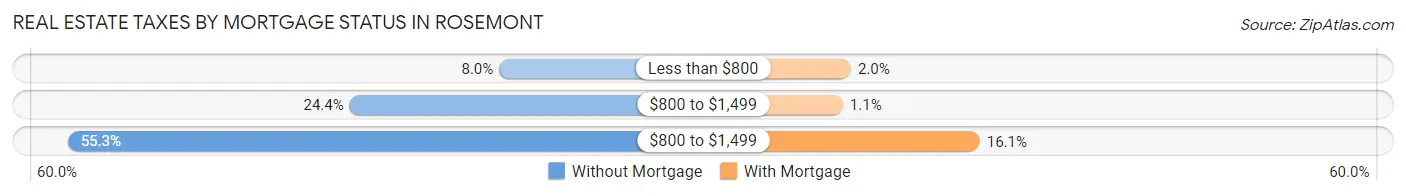
| Property Taxes | Without Mortgage | With Mortgage |
| Less than $800 | 101 (8.0%) | 78 (2.0%) |
| $800 to $1,499 | 308 (24.4%) | 43 (1.1%) |
| $800 to $1,499 | 698 (55.3%) | 638 (16.1%) |
| Total | 1,263 (100.0%) | 3,966 (100.0%) |
Health & Disability in Rosemont
Health Insurance Coverage by Age in Rosemont
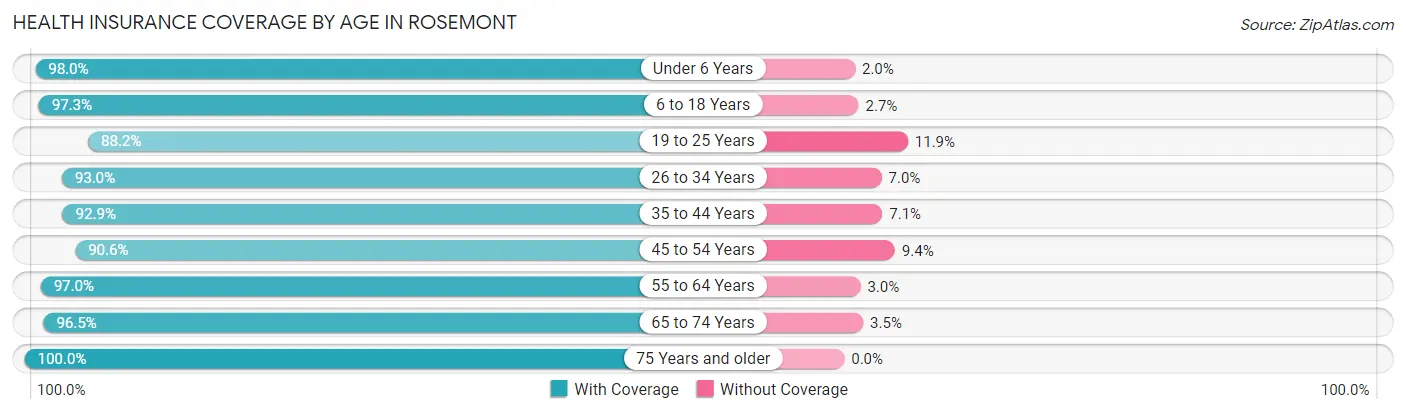
| Age Bracket | With Coverage | Without Coverage |
| Under 6 Years | 1,711 (98.0%) | 35 (2.0%) |
| 6 to 18 Years | 3,923 (97.3%) | 107 (2.7%) |
| 19 to 25 Years | 1,771 (88.1%) | 238 (11.8%) |
| 26 to 34 Years | 3,407 (93.0%) | 255 (7.0%) |
| 35 to 44 Years | 2,813 (92.9%) | 215 (7.1%) |
| 45 to 54 Years | 3,129 (90.6%) | 326 (9.4%) |
| 55 to 64 Years | 2,255 (97.0%) | 70 (3.0%) |
| 65 to 74 Years | 2,026 (96.5%) | 74 (3.5%) |
| 75 Years and older | 1,305 (100.0%) | 0 (0.0%) |
| Total | 22,340 (94.4%) | 1,320 (5.6%) |
Health Insurance Coverage by Citizenship Status in Rosemont
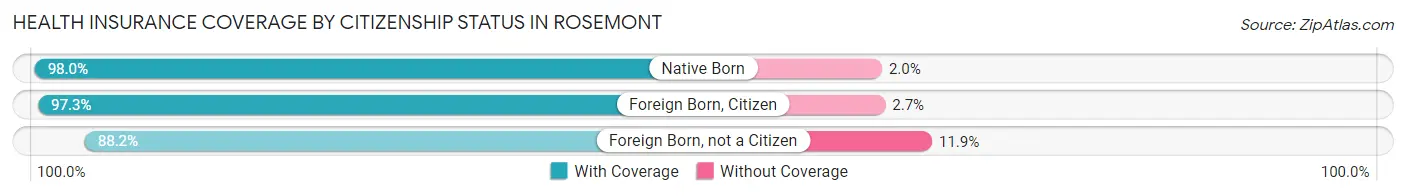
| Citizenship Status | With Coverage | Without Coverage |
| Native Born | 1,711 (98.0%) | 35 (2.0%) |
| Foreign Born, Citizen | 3,923 (97.3%) | 107 (2.7%) |
| Foreign Born, not a Citizen | 1,771 (88.1%) | 238 (11.8%) |
Health Insurance Coverage by Household Income in Rosemont
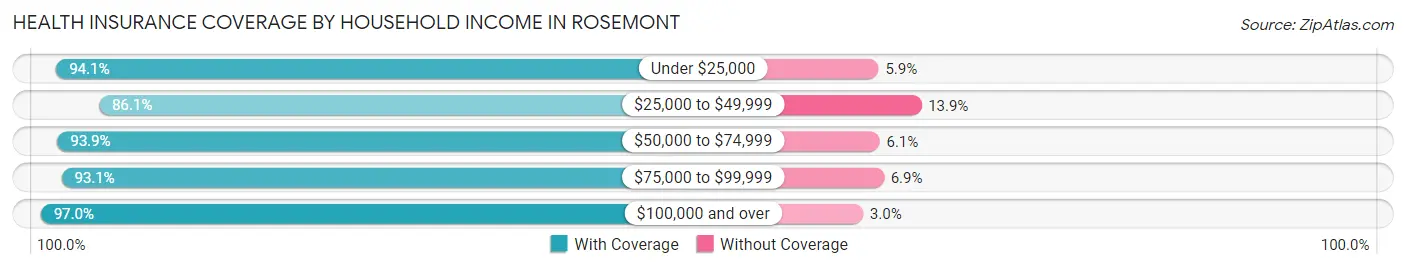
| Household Income | With Coverage | Without Coverage |
| Under $25,000 | 1,839 (94.1%) | 116 (5.9%) |
| $25,000 to $49,999 | 2,142 (86.1%) | 347 (13.9%) |
| $50,000 to $74,999 | 3,454 (93.9%) | 226 (6.1%) |
| $75,000 to $99,999 | 3,597 (93.1%) | 267 (6.9%) |
| $100,000 and over | 11,229 (97.0%) | 350 (3.0%) |
Public vs Private Health Insurance Coverage by Age in Rosemont
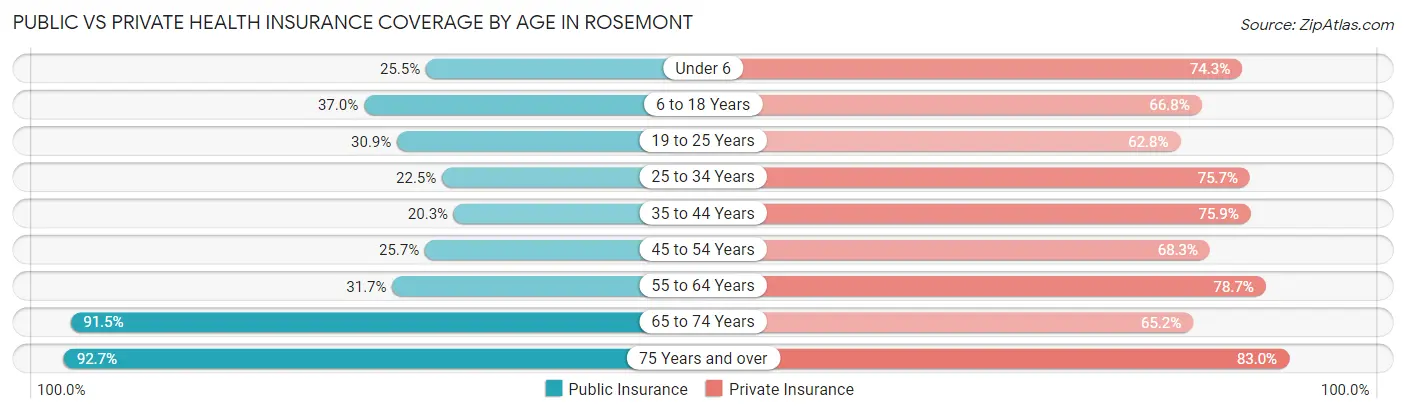
| Age Bracket | Public Insurance | Private Insurance |
| Under 6 | 445 (25.5%) | 1,297 (74.3%) |
| 6 to 18 Years | 1,491 (37.0%) | 2,691 (66.8%) |
| 19 to 25 Years | 620 (30.9%) | 1,262 (62.8%) |
| 25 to 34 Years | 824 (22.5%) | 2,773 (75.7%) |
| 35 to 44 Years | 615 (20.3%) | 2,297 (75.9%) |
| 45 to 54 Years | 887 (25.7%) | 2,360 (68.3%) |
| 55 to 64 Years | 738 (31.7%) | 1,829 (78.7%) |
| 65 to 74 Years | 1,922 (91.5%) | 1,369 (65.2%) |
| 75 Years and over | 1,210 (92.7%) | 1,083 (83.0%) |
| Total | 8,752 (37.0%) | 16,961 (71.7%) |
Disability Status by Sex by Age in Rosemont
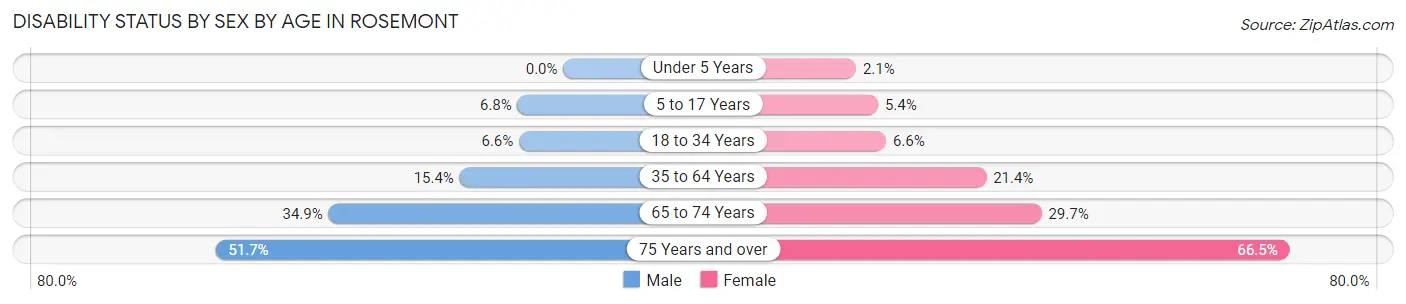
| Age Bracket | Male | Female |
| Under 5 Years | 0 (0.0%) | 18 (2.1%) |
| 5 to 17 Years | 129 (6.8%) | 110 (5.4%) |
| 18 to 34 Years | 194 (6.6%) | 200 (6.6%) |
| 35 to 64 Years | 609 (15.4%) | 1,040 (21.4%) |
| 65 to 74 Years | 303 (34.9%) | 365 (29.6%) |
| 75 Years and over | 295 (51.7%) | 488 (66.5%) |
Disability Class by Sex by Age in Rosemont
Disability Class: Hearing Difficulty
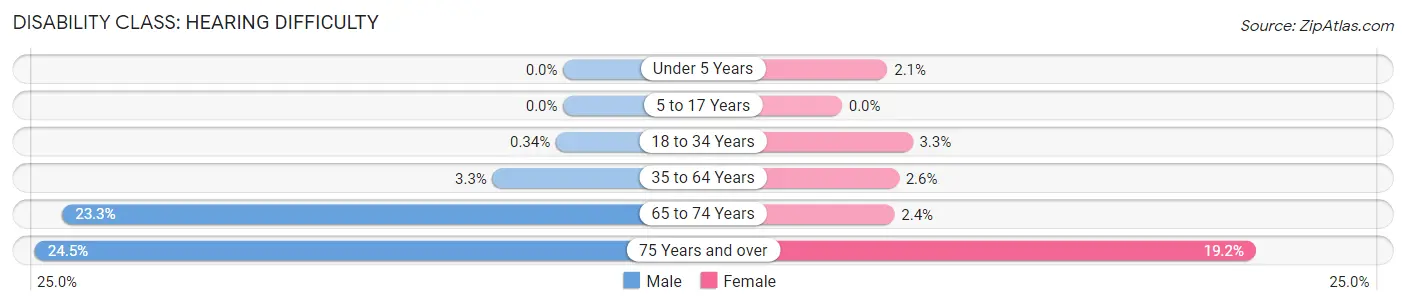
| Age Bracket | Male | Female |
| Under 5 Years | 0 (0.0%) | 18 (2.1%) |
| 5 to 17 Years | 0 (0.0%) | 0 (0.0%) |
| 18 to 34 Years | 10 (0.3%) | 100 (3.3%) |
| 35 to 64 Years | 130 (3.3%) | 128 (2.6%) |
| 65 to 74 Years | 202 (23.3%) | 30 (2.4%) |
| 75 Years and over | 140 (24.5%) | 141 (19.2%) |
Disability Class: Vision Difficulty
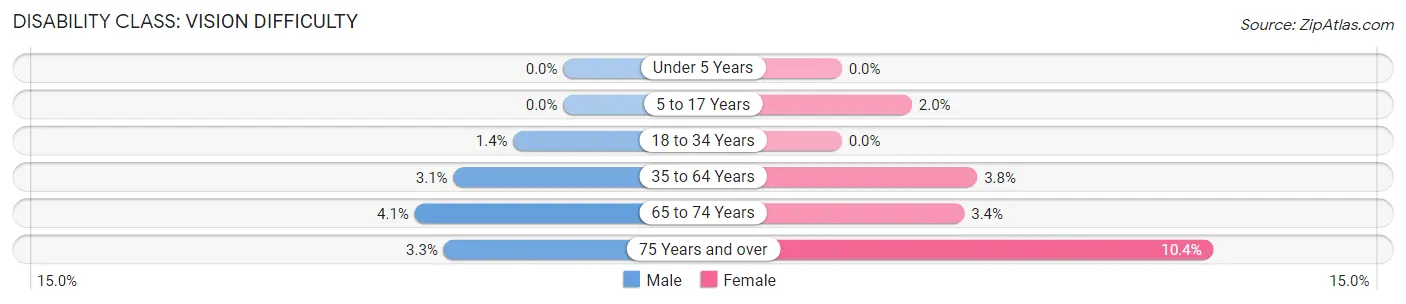
| Age Bracket | Male | Female |
| Under 5 Years | 0 (0.0%) | 0 (0.0%) |
| 5 to 17 Years | 0 (0.0%) | 40 (1.9%) |
| 18 to 34 Years | 41 (1.4%) | 0 (0.0%) |
| 35 to 64 Years | 121 (3.1%) | 183 (3.8%) |
| 65 to 74 Years | 36 (4.1%) | 42 (3.4%) |
| 75 Years and over | 19 (3.3%) | 76 (10.3%) |
Disability Class: Cognitive Difficulty
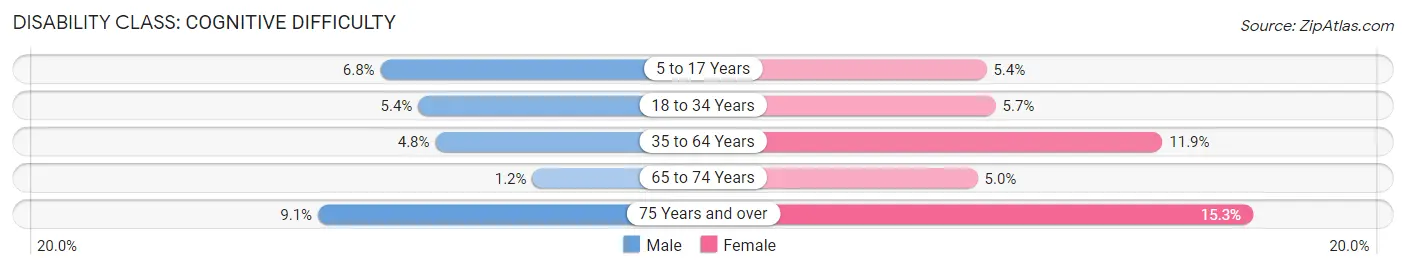
| Age Bracket | Male | Female |
| 5 to 17 Years | 129 (6.8%) | 110 (5.4%) |
| 18 to 34 Years | 159 (5.4%) | 174 (5.7%) |
| 35 to 64 Years | 188 (4.8%) | 577 (11.9%) |
| 65 to 74 Years | 10 (1.1%) | 62 (5.0%) |
| 75 Years and over | 52 (9.1%) | 112 (15.3%) |
Disability Class: Ambulatory Difficulty
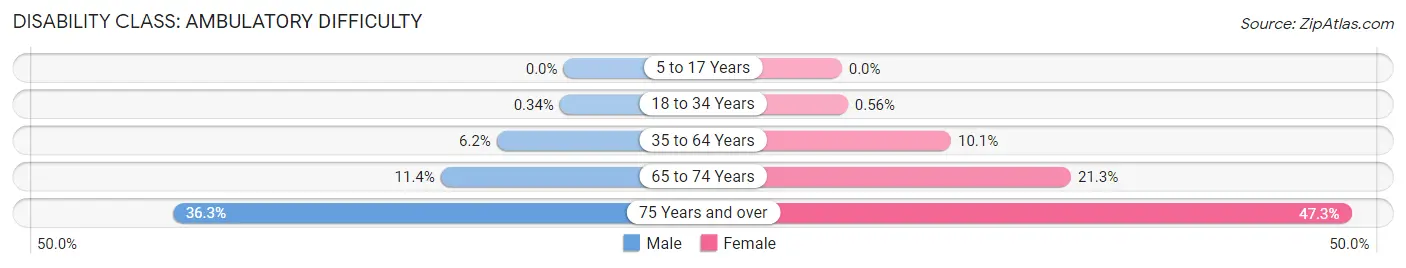
| Age Bracket | Male | Female |
| 5 to 17 Years | 0 (0.0%) | 0 (0.0%) |
| 18 to 34 Years | 10 (0.3%) | 17 (0.6%) |
| 35 to 64 Years | 245 (6.2%) | 492 (10.1%) |
| 65 to 74 Years | 99 (11.4%) | 262 (21.3%) |
| 75 Years and over | 207 (36.2%) | 347 (47.3%) |
Disability Class: Self-Care Difficulty
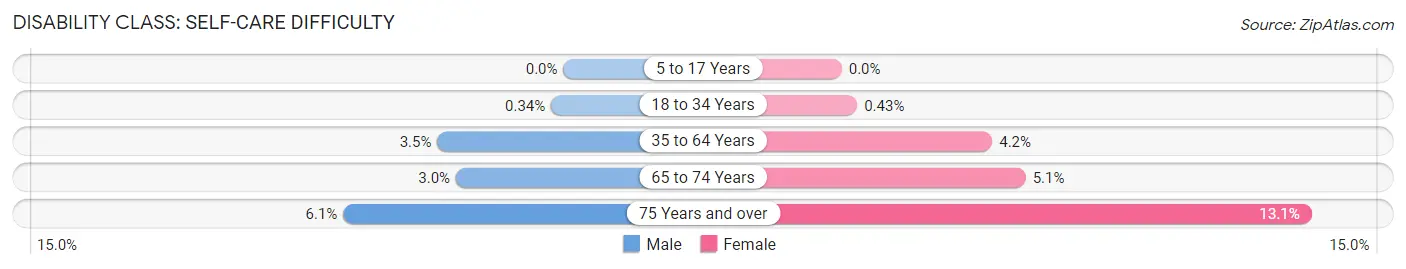
| Age Bracket | Male | Female |
| 5 to 17 Years | 0 (0.0%) | 0 (0.0%) |
| 18 to 34 Years | 10 (0.3%) | 13 (0.4%) |
| 35 to 64 Years | 139 (3.5%) | 203 (4.2%) |
| 65 to 74 Years | 26 (3.0%) | 63 (5.1%) |
| 75 Years and over | 35 (6.1%) | 96 (13.1%) |
Technology Access in Rosemont
Computing Device Access in Rosemont
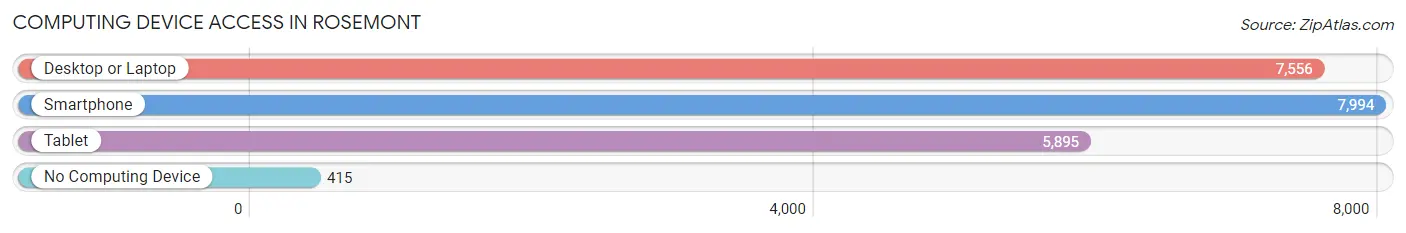
| Device Type | # Households | % Households |
| Desktop or Laptop | 7,556 | 85.7% |
| Smartphone | 7,994 | 90.7% |
| Tablet | 5,895 | 66.9% |
| No Computing Device | 415 | 4.7% |
| Total | 8,813 | 100.0% |
Internet Access in Rosemont
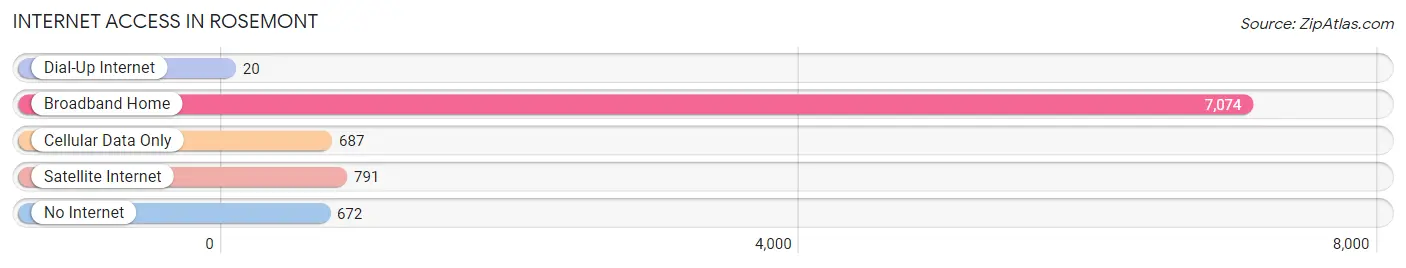
| Internet Type | # Households | % Households |
| Dial-Up Internet | 20 | 0.2% |
| Broadband Home | 7,074 | 80.3% |
| Cellular Data Only | 687 | 7.8% |
| Satellite Internet | 791 | 9.0% |
| No Internet | 672 | 7.6% |
| Total | 8,813 | 100.0% |
Rosemont Summary
Rosemont is a census-designated place (CDP) located in Sacramento County, California. It is situated in the foothills of the Sierra Nevada Mountains, approximately 20 miles northeast of Sacramento. The population of Rosemont was 8,717 at the 2010 census.
History
The area that is now Rosemont was originally inhabited by the Maidu Indians. The first non-native settlers arrived in the area in the 1850s. The area was originally known as “Rosemont Station”, named after the Rosemont post office that was established in 1858. The post office was named after the Rosemont family, who were early settlers in the area.
In the late 1800s, the area was a popular destination for gold miners. The Rosemont Mining Company was established in 1892 and operated until the early 1900s. The area was also home to several fruit orchards and vineyards.
In the early 1900s, the area began to develop into a residential community. The Rosemont School District was established in 1912 and the Rosemont Community Church was founded in 1915. The Rosemont Fire Protection District was established in 1921.
Geography
Rosemont is located at 38°41'25"N 121°17'45"W (38.690278, -121.295833). It is situated in the foothills of the Sierra Nevada Mountains, approximately 20 miles northeast of Sacramento. The elevation of Rosemont is 545 feet above sea level.
The CDP has a total area of 4.2 square miles, all of which is land. The terrain is mostly flat, with some rolling hills. The climate is mild, with hot summers and cool winters.
Economy
The economy of Rosemont is largely based on agriculture and tourism. The area is home to several wineries and vineyards, as well as several fruit orchards. The area is also popular with tourists, who come to enjoy the scenic views and outdoor activities.
The median household income in Rosemont is $63,944, and the median family income is $76,944. The unemployment rate is 4.2%.
Demographics
As of the 2010 census, there were 8,717 people, 3,093 households, and 2,323 families residing in Rosemont. The population density was 2,092.3 people per square mile. The racial makeup of Rosemont was 77.2% White, 8.2% African American, 0.7% Native American, 5.2% Asian, 0.2% Pacific Islander, 4.7% from other races, and 3.8% from two or more races. Hispanic or Latino of any race were 11.3% of the population.
The median age in Rosemont was 41.2 years. 22.2% of residents were under the age of 18; 7.2% were between the ages of 18 and 24; 25.2% were from 25 to 44; 28.7% were from 45 to 64; and 16.7% were 65 years of age or older. The gender makeup of Rosemont was 48.2% male and 51.8% female.
The median income for a household in Rosemont was $63,944, and the median income for a family was $76,944. The per capita income for the CDP was $30,945. About 4.2% of families and 6.2% of the population were below the poverty line, including 8.2% of those under age 18 and 4.2% of those age 65 or over.
Common Questions
What is Per Capita Income in Rosemont?
Per Capita income in Rosemont is $38,701.
What is the Median Family Income in Rosemont?
Median Family Income in Rosemont is $98,136.
What is the Median Household income in Rosemont?
Median Household Income in Rosemont is $86,818.
What is Income or Wage Gap in Rosemont?
Income or Wage Gap in Rosemont is 21.3%.
Women in Rosemont earn 78.7 cents for every dollar earned by a man.
What is Family Income Deficit in Rosemont?
Family Income Deficit in Rosemont is $10,216.
Families that are below poverty line in Rosemont earn $10,216 less on average than the poverty threshold level.
What is Inequality or Gini Index in Rosemont?
Inequality or Gini Index in Rosemont is 0.39.
What is the Total Population of Rosemont?
Total Population of Rosemont is 23,845.
What is the Total Male Population of Rosemont?
Total Male Population of Rosemont is 10,975.
What is the Total Female Population of Rosemont?
Total Female Population of Rosemont is 12,870.
What is the Ratio of Males per 100 Females in Rosemont?
There are 85.28 Males per 100 Females in Rosemont.
What is the Ratio of Females per 100 Males in Rosemont?
There are 117.27 Females per 100 Males in Rosemont.
What is the Median Population Age in Rosemont?
Median Population Age in Rosemont is 36.0 Years.
What is the Average Family Size in Rosemont
Average Family Size in Rosemont is 3.2 People.
What is the Average Household Size in Rosemont
Average Household Size in Rosemont is 2.7 People.
How Large is the Labor Force in Rosemont?
There are 12,511 People in the Labor Forcein in Rosemont.
What is the Percentage of People in the Labor Force in Rosemont?
66.1% of People are in the Labor Force in Rosemont.
What is the Unemployment Rate in Rosemont?
Unemployment Rate in Rosemont is 6.9%.