San Leandro, CA Map & Demographics
San Leandro Map
San Leandro Overview
$45,010
PER CAPITA INCOME
$113,594
AVG FAMILY INCOME
$97,141
AVG HOUSEHOLD INCOME
13.3%
WAGE / INCOME GAP [ % ]
86.7¢/ $1
WAGE / INCOME GAP [ $ ]
$11,822
FAMILY INCOME DEFICIT
0.44
INEQUALITY / GINI INDEX
89,723
TOTAL POPULATION
44,511
MALE POPULATION
45,212
FEMALE POPULATION
98.45
MALES / 100 FEMALES
101.57
FEMALES / 100 MALES
41.5
MEDIAN AGE
3.5
AVG FAMILY SIZE
2.9
AVG HOUSEHOLD SIZE
50,454
LABOR FORCE [ PEOPLE ]
65.9%
PERCENT IN LABOR FORCE
5.0%
UNEMPLOYMENT RATE
San Leandro Area Codes
Income in San Leandro
Income Overview in San Leandro
Per Capita Income in San Leandro is $45,010, while median incomes of families and households are $113,594 and $97,141 respectively.
| Characteristic | Number | Measure |
| Per Capita Income | 89,723 | $45,010 |
| Median Family Income | 20,532 | $113,594 |
| Mean Family Income | 20,532 | $143,597 |
| Median Household Income | 30,468 | $97,141 |
| Mean Household Income | 30,468 | $124,950 |
| Income Deficit | 20,532 | $11,822 |
| Wage / Income Gap (%) | 89,723 | 13.27% |
| Wage / Income Gap ($) | 89,723 | 86.73¢ per $1 |
| Gini / Inequality Index | 89,723 | 0.44 |
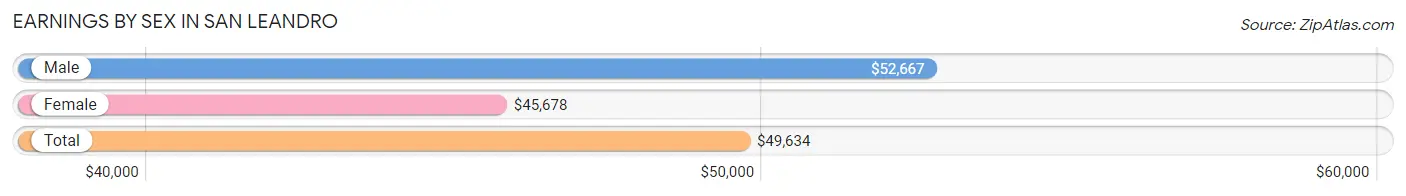
Earnings by Sex in San Leandro
Average Earnings in San Leandro are $49,634, $52,667 for men and $45,678 for women, a difference of 13.3%.
| Sex | Number | Average Earnings |
| Male | 27,036 (52.5%) | $52,667 |
| Female | 24,440 (47.5%) | $45,678 |
| Total | 51,476 (100.0%) | $49,634 |
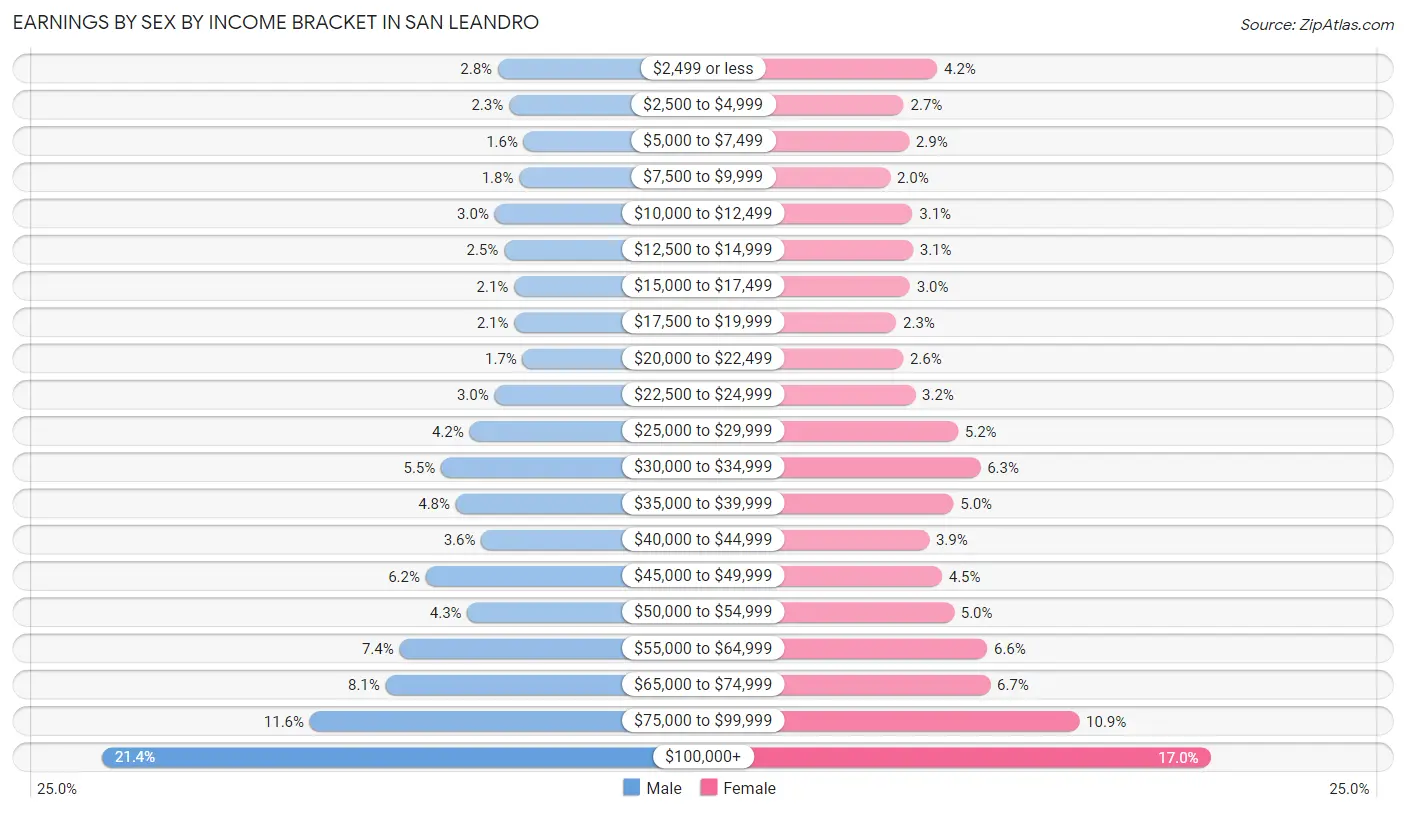
Earnings by Sex by Income Bracket in San Leandro
The most common earnings brackets in San Leandro are $100,000+ for men (5,780 | 21.4%) and $100,000+ for women (4,163 | 17.0%).
| Income | Male | Female |
| $2,499 or less | 766 (2.8%) | 1,035 (4.2%) |
| $2,500 to $4,999 | 625 (2.3%) | 651 (2.7%) |
| $5,000 to $7,499 | 439 (1.6%) | 711 (2.9%) |
| $7,500 to $9,999 | 496 (1.8%) | 493 (2.0%) |
| $10,000 to $12,499 | 805 (3.0%) | 750 (3.1%) |
| $12,500 to $14,999 | 687 (2.5%) | 754 (3.1%) |
| $15,000 to $17,499 | 559 (2.1%) | 721 (2.9%) |
| $17,500 to $19,999 | 556 (2.1%) | 565 (2.3%) |
| $20,000 to $22,499 | 451 (1.7%) | 642 (2.6%) |
| $22,500 to $24,999 | 809 (3.0%) | 782 (3.2%) |
| $25,000 to $29,999 | 1,126 (4.2%) | 1,272 (5.2%) |
| $30,000 to $34,999 | 1,484 (5.5%) | 1,527 (6.2%) |
| $35,000 to $39,999 | 1,297 (4.8%) | 1,219 (5.0%) |
| $40,000 to $44,999 | 977 (3.6%) | 941 (3.8%) |
| $45,000 to $49,999 | 1,679 (6.2%) | 1,087 (4.4%) |
| $50,000 to $54,999 | 1,153 (4.3%) | 1,225 (5.0%) |
| $55,000 to $64,999 | 2,012 (7.4%) | 1,605 (6.6%) |
| $65,000 to $74,999 | 2,188 (8.1%) | 1,639 (6.7%) |
| $75,000 to $99,999 | 3,147 (11.6%) | 2,658 (10.9%) |
| $100,000+ | 5,780 (21.4%) | 4,163 (17.0%) |
| Total | 27,036 (100.0%) | 24,440 (100.0%) |
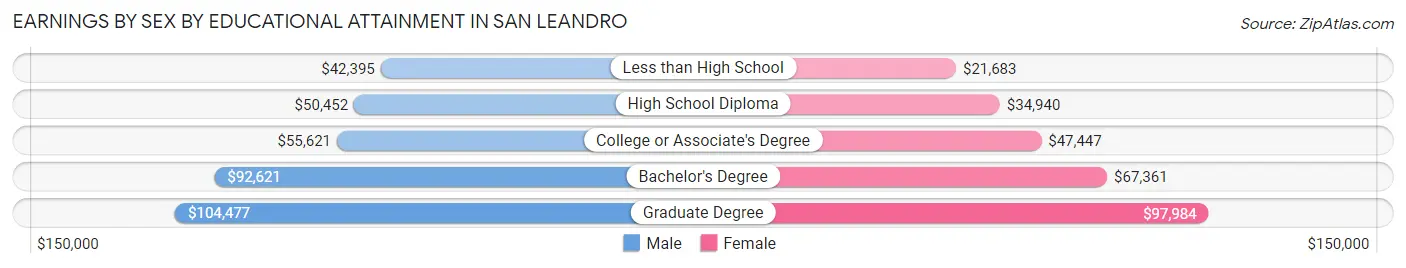
Earnings by Sex by Educational Attainment in San Leandro
Average earnings in San Leandro are $59,460 for men and $50,280 for women, a difference of 15.4%. Men with an educational attainment of graduate degree enjoy the highest average annual earnings of $104,477, while those with less than high school education earn the least with $42,395. Women with an educational attainment of graduate degree earn the most with the average annual earnings of $97,984, while those with less than high school education have the smallest earnings of $21,683.
| Educational Attainment | Male Income | Female Income |
| Less than High School | $42,395 | $21,683 |
| High School Diploma | $50,452 | $34,940 |
| College or Associate's Degree | $55,621 | $47,447 |
| Bachelor's Degree | $92,621 | $67,361 |
| Graduate Degree | $104,477 | $97,984 |
| Total | $59,460 | $50,280 |
Family Income in San Leandro
Family Income Brackets in San Leandro
According to the San Leandro family income data, there are 4,579 families falling into the $200,000+ income range, which is the most common income bracket and makes up 22.3% of all families. Conversely, the $10,000 to $14,999 income bracket is the least frequent group with only 205 families (1.0%) belonging to this category.
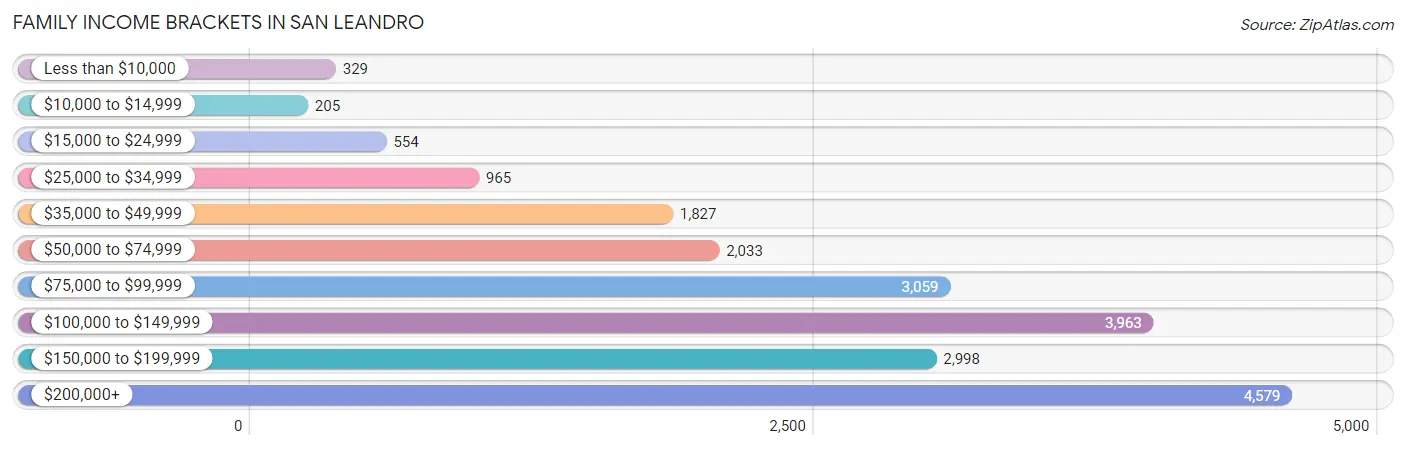
| Income Bracket | # Families | % Families |
| Less than $10,000 | 329 | 1.6% |
| $10,000 to $14,999 | 205 | 1.0% |
| $15,000 to $24,999 | 554 | 2.7% |
| $25,000 to $34,999 | 965 | 4.7% |
| $35,000 to $49,999 | 1,827 | 8.9% |
| $50,000 to $74,999 | 2,033 | 9.9% |
| $75,000 to $99,999 | 3,059 | 14.9% |
| $100,000 to $149,999 | 3,963 | 19.3% |
| $150,000 to $199,999 | 2,998 | 14.6% |
| $200,000+ | 4,579 | 22.3% |
Family Income by Famaliy Size in San Leandro
6-person families (827 | 4.0%) account for the highest median family income in San Leandro with $172,633 per family, while 2-person families (7,780 | 37.9%) have the highest median income of $49,988 per family member.
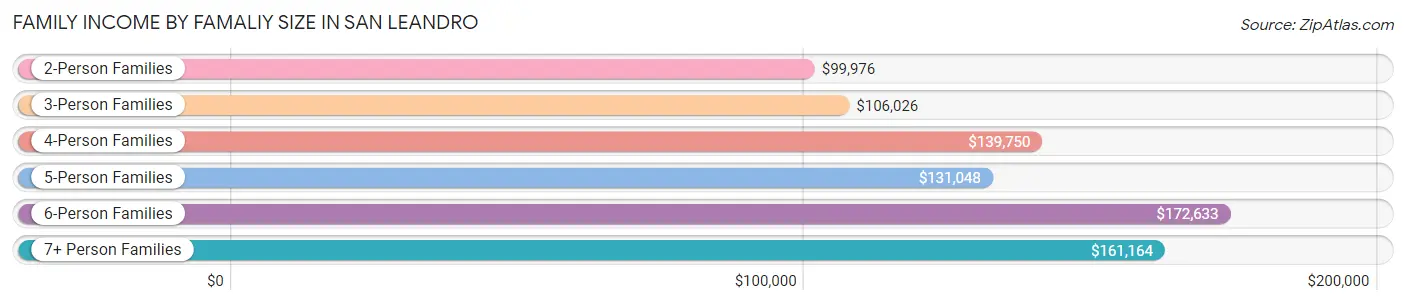
| Income Bracket | # Families | Median Income |
| 2-Person Families | 7,780 (37.9%) | $99,976 |
| 3-Person Families | 5,220 (25.4%) | $106,026 |
| 4-Person Families | 3,894 (19.0%) | $139,750 |
| 5-Person Families | 2,342 (11.4%) | $131,048 |
| 6-Person Families | 827 (4.0%) | $172,633 |
| 7+ Person Families | 469 (2.3%) | $161,164 |
| Total | 20,532 (100.0%) | $113,594 |
Family Income by Number of Earners in San Leandro
The median family income in San Leandro is $113,594, with families comprising 3+ earners (4,632) having the highest median family income of $167,600, while families with no earners (2,234) have the lowest median family income of $43,118, accounting for 22.6% and 10.9% of families, respectively.
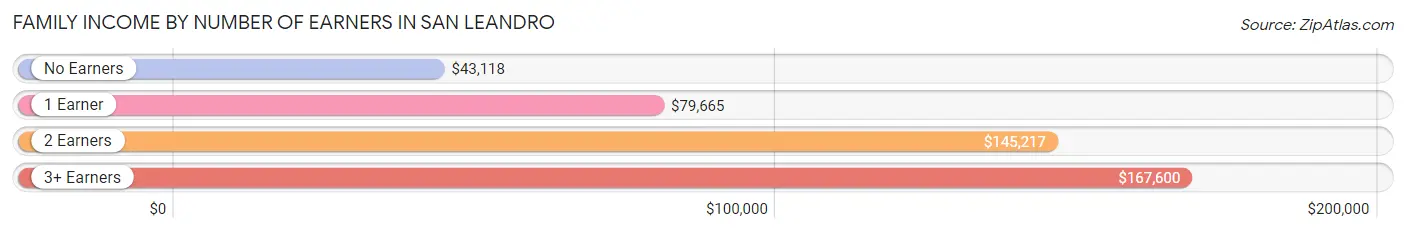
| Number of Earners | # Families | Median Income |
| No Earners | 2,234 (10.9%) | $43,118 |
| 1 Earner | 5,554 (27.1%) | $79,665 |
| 2 Earners | 8,112 (39.5%) | $145,217 |
| 3+ Earners | 4,632 (22.6%) | $167,600 |
| Total | 20,532 (100.0%) | $113,594 |
Household Income in San Leandro
Household Income Brackets in San Leandro
With 5,515 households falling in the category, the $200,000+ income range is the most frequent in San Leandro, accounting for 18.1% of all households. In contrast, only 1,005 households (3.3%) fall into the $10,000 to $14,999 income bracket, making it the least populous group.
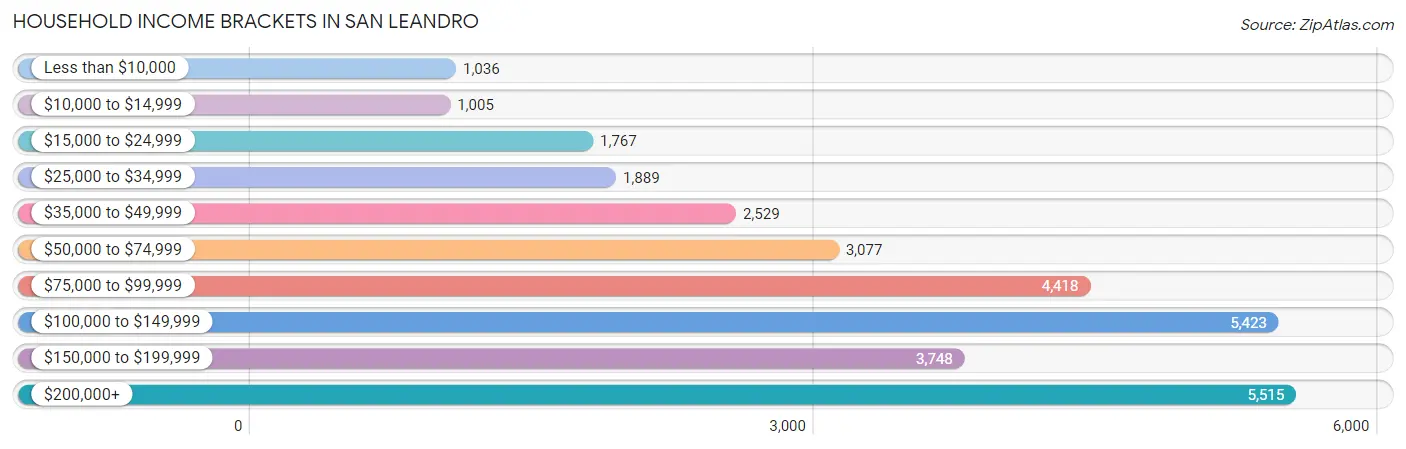
| Income Bracket | # Households | % Households |
| Less than $10,000 | 1,036 | 3.4% |
| $10,000 to $14,999 | 1,005 | 3.3% |
| $15,000 to $24,999 | 1,767 | 5.8% |
| $25,000 to $34,999 | 1,889 | 6.2% |
| $35,000 to $49,999 | 2,529 | 8.3% |
| $50,000 to $74,999 | 3,077 | 10.1% |
| $75,000 to $99,999 | 4,418 | 14.5% |
| $100,000 to $149,999 | 5,423 | 17.8% |
| $150,000 to $199,999 | 3,748 | 12.3% |
| $200,000+ | 5,515 | 18.1% |
Household Income by Householder Age in San Leandro
The median household income in San Leandro is $97,141, with the highest median household income of $122,645 found in the 25 to 44 years age bracket for the primary householder. A total of 8,832 households (29.0%) fall into this category. Meanwhile, the 15 to 24 years age bracket for the primary householder has the lowest median household income of $42,438, with 626 households (2.1%) in this group.
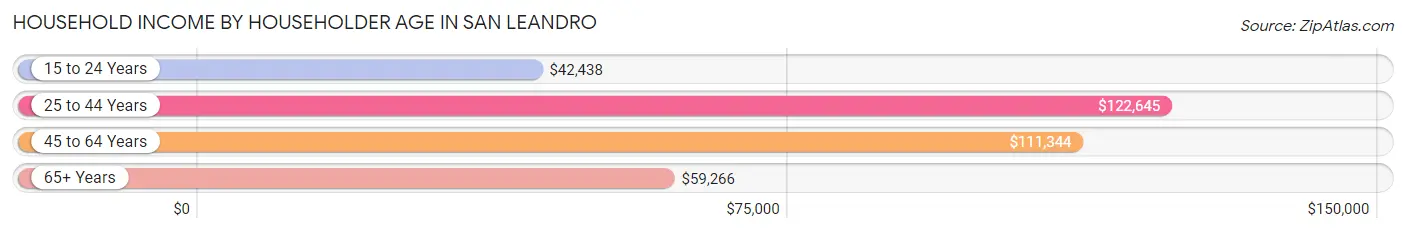
| Income Bracket | # Households | Median Income |
| 15 to 24 Years | 626 (2.1%) | $42,438 |
| 25 to 44 Years | 8,832 (29.0%) | $122,645 |
| 45 to 64 Years | 12,575 (41.3%) | $111,344 |
| 65+ Years | 8,435 (27.7%) | $59,266 |
| Total | 30,468 (100.0%) | $97,141 |
Poverty in San Leandro
Income Below Poverty by Sex and Age in San Leandro
With 7.0% poverty level for males and 9.7% for females among the residents of San Leandro, 15 year old males and 5 year old females are the most vulnerable to poverty, with 96 males (15.2%) and 65 females (19.8%) in their respective age groups living below the poverty level.
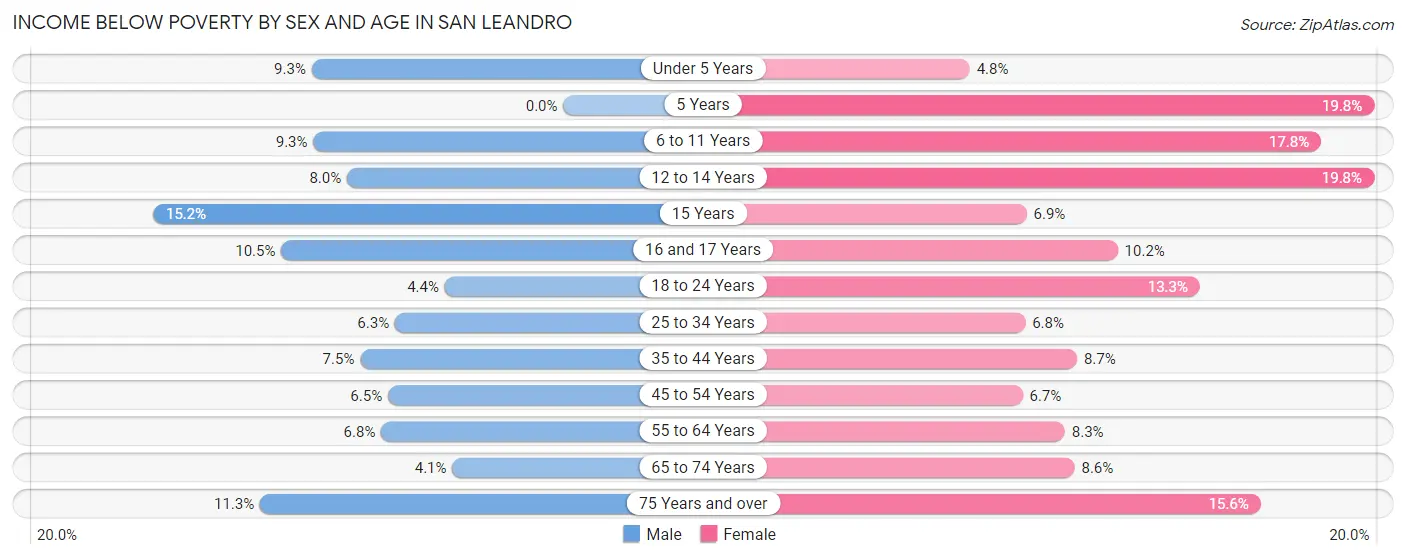
| Age Bracket | Male | Female |
| Under 5 Years | 163 (9.3%) | 81 (4.8%) |
| 5 Years | 0 (0.0%) | 65 (19.8%) |
| 6 to 11 Years | 264 (9.3%) | 404 (17.8%) |
| 12 to 14 Years | 102 (8.0%) | 188 (19.8%) |
| 15 Years | 96 (15.2%) | 43 (6.9%) |
| 16 and 17 Years | 104 (10.5%) | 122 (10.2%) |
| 18 to 24 Years | 182 (4.4%) | 497 (13.3%) |
| 25 to 34 Years | 400 (6.2%) | 452 (6.8%) |
| 35 to 44 Years | 472 (7.5%) | 502 (8.7%) |
| 45 to 54 Years | 400 (6.5%) | 453 (6.7%) |
| 55 to 64 Years | 415 (6.8%) | 546 (8.3%) |
| 65 to 74 Years | 179 (4.1%) | 366 (8.6%) |
| 75 Years and over | 328 (11.3%) | 629 (15.5%) |
| Total | 3,105 (7.0%) | 4,348 (9.7%) |
Income Above Poverty by Sex and Age in San Leandro
According to the poverty statistics in San Leandro, males aged 5 years and females aged under 5 years are the age groups that are most secure financially, with 100.0% of males and 95.3% of females in these age groups living above the poverty line.
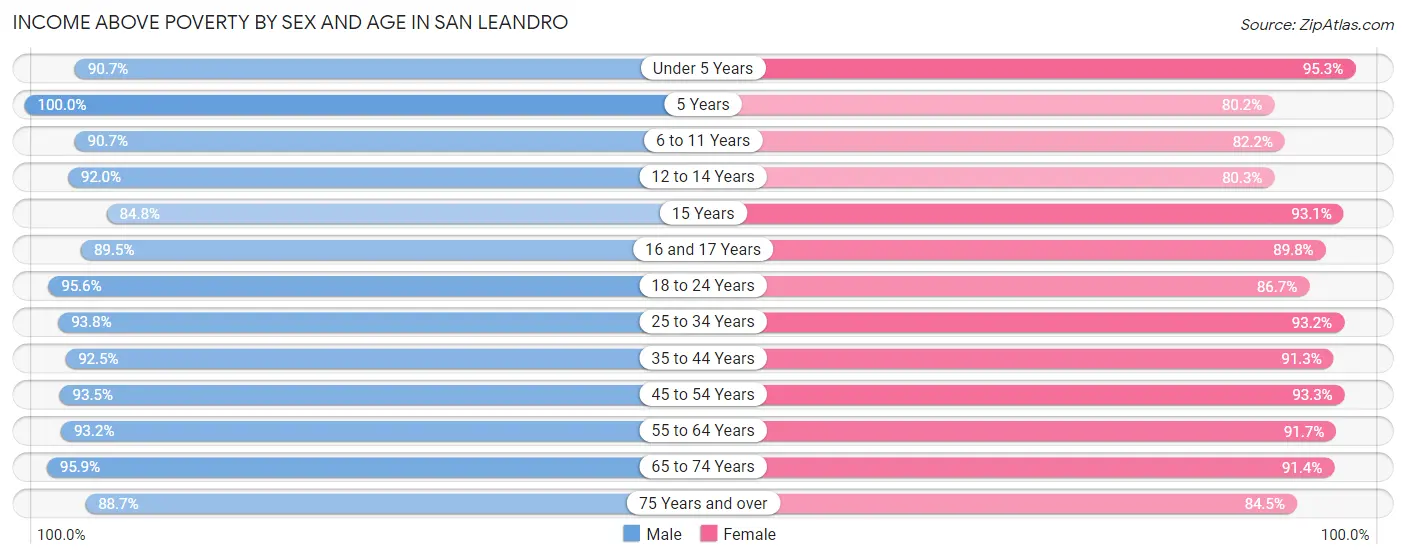
| Age Bracket | Male | Female |
| Under 5 Years | 1,583 (90.7%) | 1,623 (95.3%) |
| 5 Years | 495 (100.0%) | 264 (80.2%) |
| 6 to 11 Years | 2,581 (90.7%) | 1,867 (82.2%) |
| 12 to 14 Years | 1,169 (92.0%) | 764 (80.2%) |
| 15 Years | 534 (84.8%) | 584 (93.1%) |
| 16 and 17 Years | 889 (89.5%) | 1,069 (89.8%) |
| 18 to 24 Years | 3,954 (95.6%) | 3,244 (86.7%) |
| 25 to 34 Years | 6,000 (93.8%) | 6,187 (93.2%) |
| 35 to 44 Years | 5,789 (92.5%) | 5,251 (91.3%) |
| 45 to 54 Years | 5,742 (93.5%) | 6,297 (93.3%) |
| 55 to 64 Years | 5,725 (93.2%) | 6,049 (91.7%) |
| 65 to 74 Years | 4,169 (95.9%) | 3,870 (91.4%) |
| 75 Years and over | 2,584 (88.7%) | 3,415 (84.5%) |
| Total | 41,214 (93.0%) | 40,484 (90.3%) |
Income Below Poverty Among Married-Couple Families in San Leandro
The poverty statistics for married-couple families in San Leandro show that 3.8% or 561 of the total 14,601 families live below the poverty line. Families with 3 or 4 children have the highest poverty rate of 14.0%, comprising of 122 families. On the other hand, families with 5 or more children have the lowest poverty rate of 0.0%, which includes 0 families.
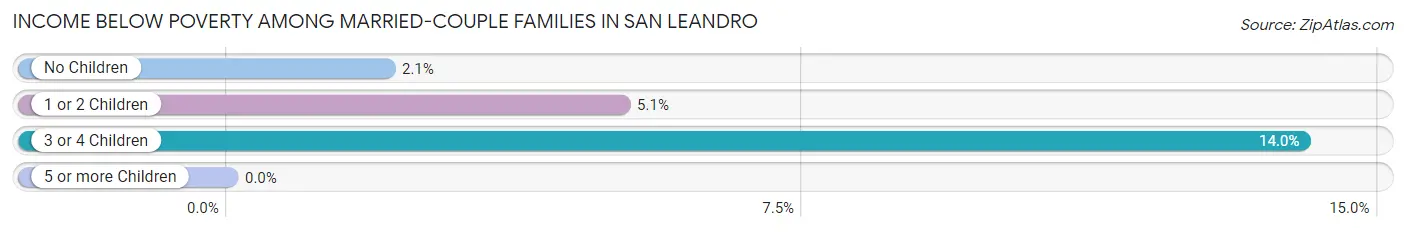
| Children | Above Poverty | Below Poverty |
| No Children | 8,326 (98.0%) | 174 (2.1%) |
| 1 or 2 Children | 4,908 (94.9%) | 265 (5.1%) |
| 3 or 4 Children | 749 (86.0%) | 122 (14.0%) |
| 5 or more Children | 57 (100.0%) | 0 (0.0%) |
| Total | 14,040 (96.2%) | 561 (3.8%) |
Income Below Poverty Among Single-Parent Households in San Leandro
According to the poverty data in San Leandro, 2.9% or 58 single-father households and 10.4% or 405 single-mother households are living below the poverty line. Among single-father households, those with 1 or 2 children have the highest poverty rate, with 28 households (2.9%) experiencing poverty. Likewise, among single-mother households, those with 3 or 4 children have the highest poverty rate, with 99 households (27.5%) falling below the poverty line.
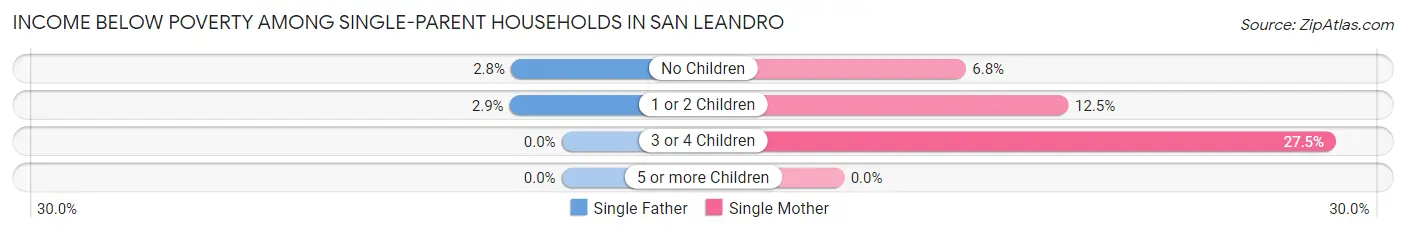
| Children | Single Father | Single Mother |
| No Children | 30 (2.8%) | 164 (6.8%) |
| 1 or 2 Children | 28 (2.9%) | 142 (12.5%) |
| 3 or 4 Children | 0 (0.0%) | 99 (27.5%) |
| 5 or more Children | 0 (0.0%) | 0 (0.0%) |
| Total | 58 (2.9%) | 405 (10.4%) |
Income Below Poverty Among Married-Couple vs Single-Parent Households in San Leandro
The poverty data for San Leandro shows that 561 of the married-couple family households (3.8%) and 463 of the single-parent households (7.8%) are living below the poverty level. Within the married-couple family households, those with 3 or 4 children have the highest poverty rate, with 122 households (14.0%) falling below the poverty line. Among the single-parent households, those with 3 or 4 children have the highest poverty rate, with 99 household (27.0%) living below poverty.
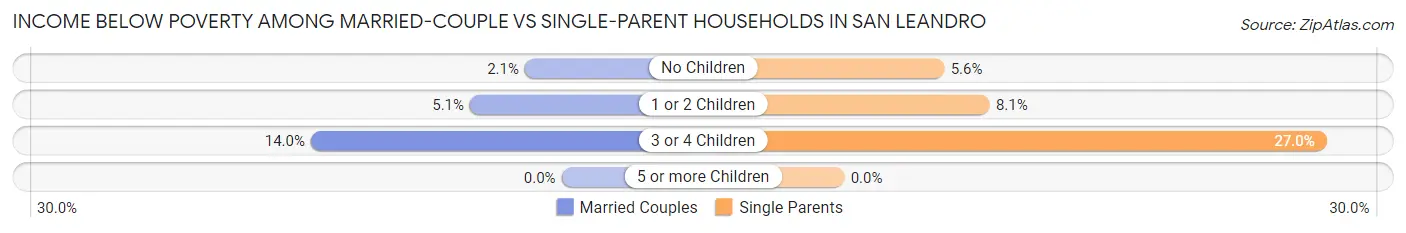
| Children | Married-Couple Families | Single-Parent Households |
| No Children | 174 (2.1%) | 194 (5.6%) |
| 1 or 2 Children | 265 (5.1%) | 170 (8.1%) |
| 3 or 4 Children | 122 (14.0%) | 99 (27.0%) |
| 5 or more Children | 0 (0.0%) | 0 (0.0%) |
| Total | 561 (3.8%) | 463 (7.8%) |
Race in San Leandro
The most populous races in San Leandro are Asian (31,285 | 34.9%), White / Caucasian (25,389 | 28.3%), and Hispanic or Latino (25,364 | 28.3%).
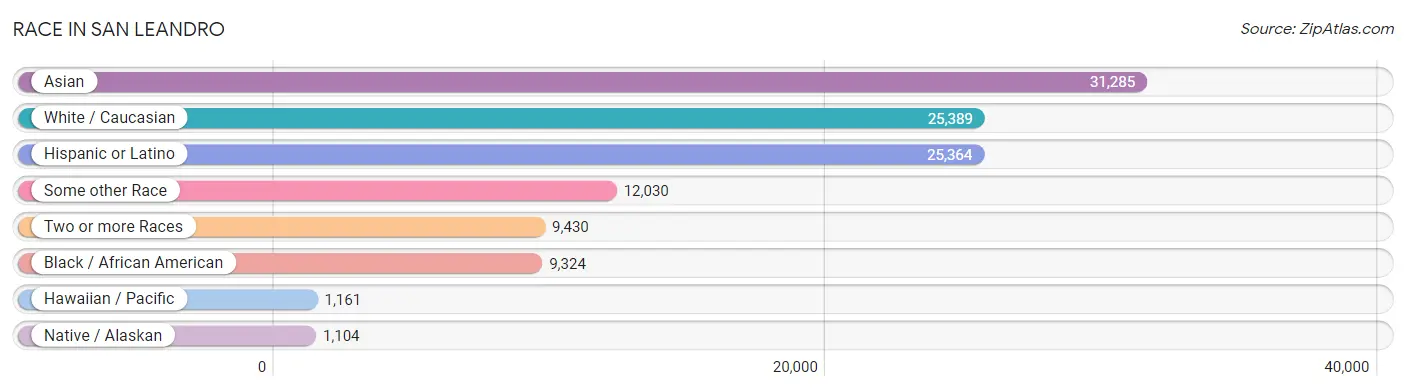
| Race | # Population | % Population |
| Asian | 31,285 | 34.9% |
| Black / African American | 9,324 | 10.4% |
| Hawaiian / Pacific | 1,161 | 1.3% |
| Hispanic or Latino | 25,364 | 28.3% |
| Native / Alaskan | 1,104 | 1.2% |
| White / Caucasian | 25,389 | 28.3% |
| Two or more Races | 9,430 | 10.5% |
| Some other Race | 12,030 | 13.4% |
| Total | 89,723 | 100.0% |
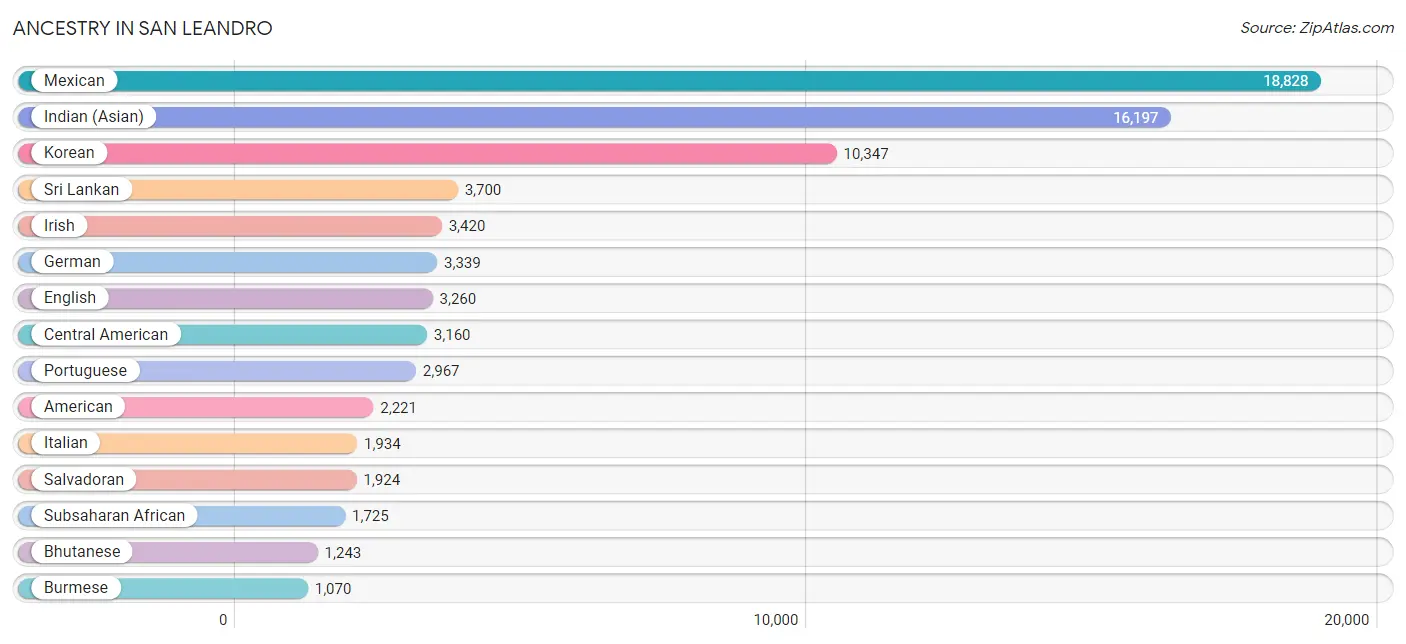
Ancestry in San Leandro
The most populous ancestries reported in San Leandro are Mexican (18,828 | 21.0%), Indian (Asian) (16,197 | 18.0%), Korean (10,347 | 11.5%), Sri Lankan (3,700 | 4.1%), and Irish (3,420 | 3.8%), together accounting for 58.5% of all San Leandro residents.
| Ancestry | # Population | % Population |
| Afghan | 189 | 0.2% |
| African | 705 | 0.8% |
| Alaska Native | 26 | 0.0% |
| American | 2,221 | 2.5% |
| Apache | 108 | 0.1% |
| Arab | 662 | 0.7% |
| Argentinean | 29 | 0.0% |
| Armenian | 24 | 0.0% |
| Australian | 18 | 0.0% |
| Austrian | 50 | 0.1% |
| Bangladeshi | 65 | 0.1% |
| Belgian | 24 | 0.0% |
| Belizean | 18 | 0.0% |
| Bhutanese | 1,243 | 1.4% |
| Brazilian | 61 | 0.1% |
| British | 220 | 0.3% |
| Bulgarian | 10 | 0.0% |
| Burmese | 1,070 | 1.2% |
| Cambodian | 134 | 0.2% |
| Canadian | 45 | 0.1% |
| Cape Verdean | 122 | 0.1% |
| Celtic | 18 | 0.0% |
| Central American | 3,160 | 3.5% |
| Central American Indian | 497 | 0.5% |
| Cherokee | 42 | 0.1% |
| Cheyenne | 11 | 0.0% |
| Chickasaw | 55 | 0.1% |
| Chilean | 261 | 0.3% |
| Choctaw | 44 | 0.1% |
| Colombian | 72 | 0.1% |
| Costa Rican | 55 | 0.1% |
| Croatian | 160 | 0.2% |
| Cuban | 42 | 0.1% |
| Czech | 81 | 0.1% |
| Czechoslovakian | 55 | 0.1% |
| Danish | 399 | 0.4% |
| Delaware | 7 | 0.0% |
| Dominican | 64 | 0.1% |
| Dutch | 379 | 0.4% |
| Eastern European | 125 | 0.1% |
| Ecuadorian | 12 | 0.0% |
| Egyptian | 191 | 0.2% |
| English | 3,260 | 3.6% |
| Ethiopian | 150 | 0.2% |
| European | 850 | 0.9% |
| Filipino | 214 | 0.2% |
| Finnish | 129 | 0.1% |
| French | 802 | 0.9% |
| French Canadian | 118 | 0.1% |
| German | 3,339 | 3.7% |
| Greek | 177 | 0.2% |
| Guamanian / Chamorro | 245 | 0.3% |
| Guatemalan | 567 | 0.6% |
| Guyanese | 27 | 0.0% |
| Honduran | 124 | 0.1% |
| Hungarian | 22 | 0.0% |
| Indian (Asian) | 16,197 | 18.0% |
| Indonesian | 176 | 0.2% |
| Iranian | 42 | 0.1% |
| Iraqi | 13 | 0.0% |
| Irish | 3,420 | 3.8% |
| Italian | 1,934 | 2.2% |
| Jamaican | 207 | 0.2% |
| Japanese | 372 | 0.4% |
| Jordanian | 30 | 0.0% |
| Kenyan | 36 | 0.0% |
| Korean | 10,347 | 11.5% |
| Laotian | 110 | 0.1% |
| Latvian | 1 | 0.0% |
| Liberian | 28 | 0.0% |
| Lithuanian | 84 | 0.1% |
| Lumbee | 15 | 0.0% |
| Malaysian | 132 | 0.2% |
| Maltese | 26 | 0.0% |
| Mexican | 18,828 | 21.0% |
| Mexican American Indian | 914 | 1.0% |
| Mongolian | 31 | 0.0% |
| Moroccan | 35 | 0.0% |
| Native Hawaiian | 352 | 0.4% |
| Navajo | 89 | 0.1% |
| Nicaraguan | 366 | 0.4% |
| Nigerian | 216 | 0.2% |
| Northern European | 95 | 0.1% |
| Norwegian | 248 | 0.3% |
| Pakistani | 133 | 0.2% |
| Palestinian | 60 | 0.1% |
| Panamanian | 124 | 0.1% |
| Peruvian | 260 | 0.3% |
| Polish | 503 | 0.6% |
| Portuguese | 2,967 | 3.3% |
| Potawatomi | 14 | 0.0% |
| Pueblo | 22 | 0.0% |
| Puerto Rican | 917 | 1.0% |
| Romanian | 10 | 0.0% |
| Russian | 352 | 0.4% |
| Salvadoran | 1,924 | 2.1% |
| Samoan | 646 | 0.7% |
| Scandinavian | 29 | 0.0% |
| Scotch-Irish | 312 | 0.4% |
| Scottish | 641 | 0.7% |
| Serbian | 22 | 0.0% |
| Shoshone | 124 | 0.1% |
| Sierra Leonean | 28 | 0.0% |
| Sioux | 8 | 0.0% |
| Slovak | 27 | 0.0% |
| Slovene | 77 | 0.1% |
| South American | 721 | 0.8% |
| Spaniard | 337 | 0.4% |
| Spanish | 651 | 0.7% |
| Spanish American | 5 | 0.0% |
| Sri Lankan | 3,700 | 4.1% |
| Subsaharan African | 1,725 | 1.9% |
| Sudanese | 221 | 0.3% |
| Swedish | 283 | 0.3% |
| Swiss | 151 | 0.2% |
| Thai | 780 | 0.9% |
| Tongan | 489 | 0.5% |
| Trinidadian and Tobagonian | 13 | 0.0% |
| Ukrainian | 98 | 0.1% |
| Ute | 21 | 0.0% |
| Venezuelan | 87 | 0.1% |
| Vietnamese | 41 | 0.1% |
| Welsh | 208 | 0.2% |
| Yaqui | 25 | 0.0% |
| Yugoslavian | 79 | 0.1% | View All 125 Rows |
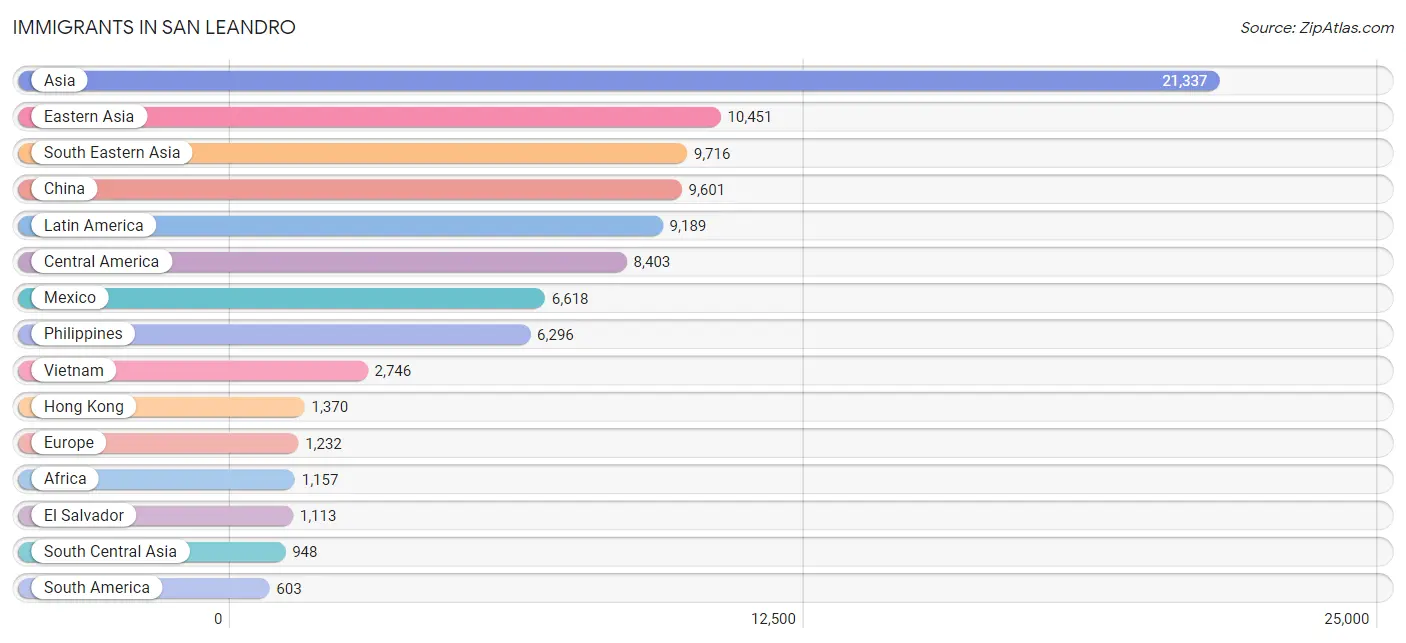
Immigrants in San Leandro
The most numerous immigrant groups reported in San Leandro came from Asia (21,337 | 23.8%), Eastern Asia (10,451 | 11.7%), South Eastern Asia (9,716 | 10.8%), China (9,601 | 10.7%), and Latin America (9,189 | 10.2%), together accounting for 67.2% of all San Leandro residents.
| Immigration Origin | # Population | % Population |
| Afghanistan | 254 | 0.3% |
| Africa | 1,157 | 1.3% |
| Argentina | 7 | 0.0% |
| Asia | 21,337 | 23.8% |
| Australia | 62 | 0.1% |
| Azores | 66 | 0.1% |
| Bangladesh | 76 | 0.1% |
| Belarus | 54 | 0.1% |
| Belize | 11 | 0.0% |
| Bosnia and Herzegovina | 42 | 0.1% |
| Brazil | 37 | 0.0% |
| Bulgaria | 10 | 0.0% |
| Cabo Verde | 11 | 0.0% |
| Cambodia | 163 | 0.2% |
| Cameroon | 42 | 0.1% |
| Canada | 157 | 0.2% |
| Caribbean | 183 | 0.2% |
| Central America | 8,403 | 9.4% |
| Chile | 135 | 0.2% |
| China | 9,601 | 10.7% |
| Colombia | 87 | 0.1% |
| Congo | 48 | 0.1% |
| Croatia | 22 | 0.0% |
| Czechoslovakia | 26 | 0.0% |
| Denmark | 23 | 0.0% |
| Dominica | 9 | 0.0% |
| Eastern Africa | 239 | 0.3% |
| Eastern Asia | 10,451 | 11.7% |
| Eastern Europe | 400 | 0.4% |
| Egypt | 142 | 0.2% |
| El Salvador | 1,113 | 1.2% |
| England | 45 | 0.1% |
| Eritrea | 91 | 0.1% |
| Ethiopia | 101 | 0.1% |
| Europe | 1,232 | 1.4% |
| Fiji | 123 | 0.1% |
| France | 74 | 0.1% |
| Germany | 84 | 0.1% |
| Ghana | 34 | 0.0% |
| Greece | 33 | 0.0% |
| Guatemala | 360 | 0.4% |
| Guyana | 7 | 0.0% |
| Honduras | 181 | 0.2% |
| Hong Kong | 1,370 | 1.5% |
| India | 335 | 0.4% |
| Indonesia | 133 | 0.2% |
| Iran | 35 | 0.0% |
| Iraq | 10 | 0.0% |
| Ireland | 50 | 0.1% |
| Israel | 27 | 0.0% |
| Italy | 51 | 0.1% |
| Jamaica | 151 | 0.2% |
| Japan | 247 | 0.3% |
| Jordan | 11 | 0.0% |
| Kenya | 47 | 0.1% |
| Korea | 525 | 0.6% |
| Laos | 37 | 0.0% |
| Latin America | 9,189 | 10.2% |
| Malaysia | 67 | 0.1% |
| Mexico | 6,618 | 7.4% |
| Middle Africa | 90 | 0.1% |
| Morocco | 35 | 0.0% |
| Nepal | 163 | 0.2% |
| Netherlands | 16 | 0.0% |
| Nicaragua | 78 | 0.1% |
| Nigeria | 323 | 0.4% |
| Northern Africa | 390 | 0.4% |
| Northern Europe | 241 | 0.3% |
| Oceania | 434 | 0.5% |
| Pakistan | 74 | 0.1% |
| Panama | 42 | 0.1% |
| Peru | 255 | 0.3% |
| Philippines | 6,296 | 7.0% |
| Poland | 77 | 0.1% |
| Portugal | 327 | 0.4% |
| Romania | 42 | 0.1% |
| Russia | 23 | 0.0% |
| Scotland | 19 | 0.0% |
| Sierra Leone | 28 | 0.0% |
| Singapore | 22 | 0.0% |
| South America | 603 | 0.7% |
| South Central Asia | 948 | 1.1% |
| South Eastern Asia | 9,716 | 10.8% |
| Southern Europe | 417 | 0.5% |
| Spain | 6 | 0.0% |
| Sri Lanka | 11 | 0.0% |
| Sudan | 213 | 0.2% |
| Sweden | 28 | 0.0% |
| Taiwan | 292 | 0.3% |
| Thailand | 92 | 0.1% |
| Trinidad and Tobago | 23 | 0.0% |
| Turkey | 7 | 0.0% |
| Ukraine | 30 | 0.0% |
| Venezuela | 75 | 0.1% |
| Vietnam | 2,746 | 3.1% |
| Western Africa | 396 | 0.4% |
| Western Asia | 189 | 0.2% |
| Western Europe | 174 | 0.2% |
| Yemen | 134 | 0.2% | View All 99 Rows |
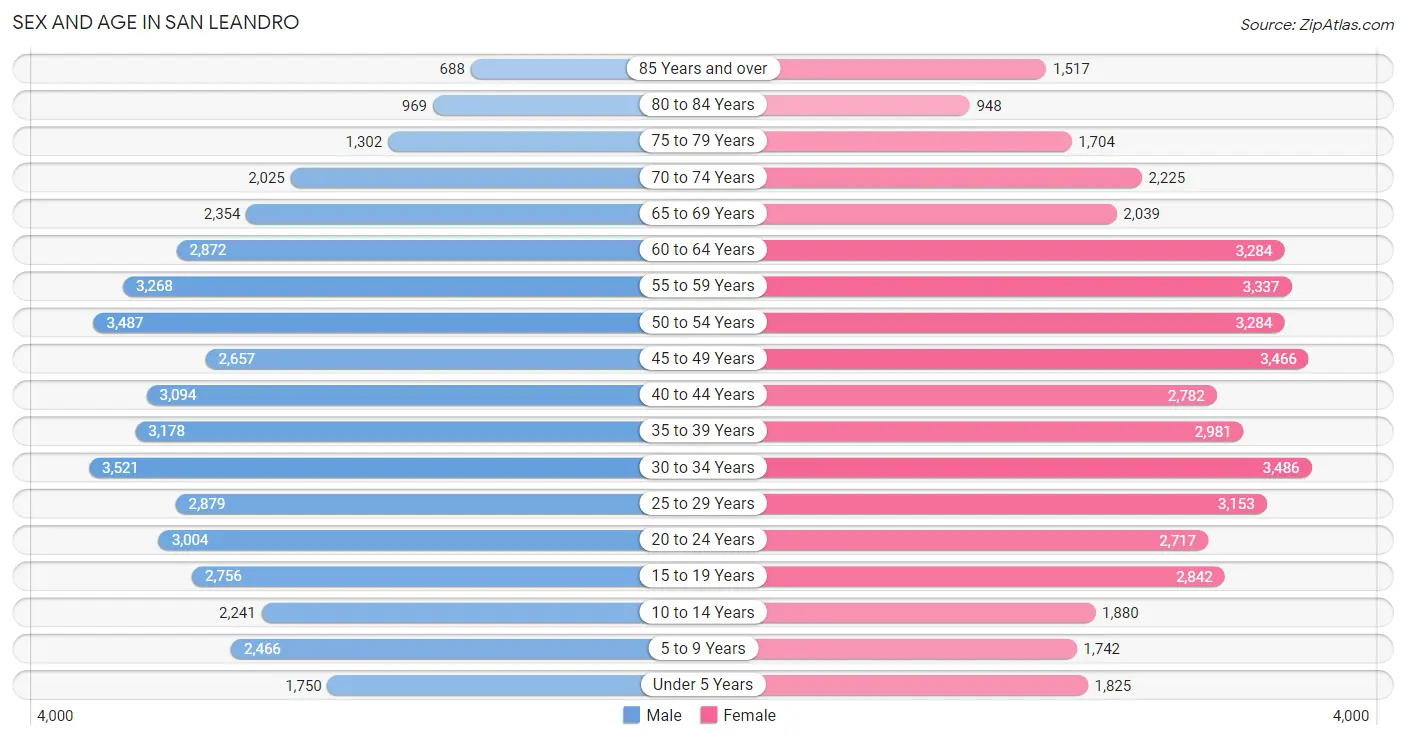
Sex and Age in San Leandro
Sex and Age in San Leandro
The most populous age groups in San Leandro are 30 to 34 Years (3,521 | 7.9%) for men and 30 to 34 Years (3,486 | 7.7%) for women.
| Age Bracket | Male | Female |
| Under 5 Years | 1,750 (3.9%) | 1,825 (4.0%) |
| 5 to 9 Years | 2,466 (5.5%) | 1,742 (3.8%) |
| 10 to 14 Years | 2,241 (5.0%) | 1,880 (4.2%) |
| 15 to 19 Years | 2,756 (6.2%) | 2,842 (6.3%) |
| 20 to 24 Years | 3,004 (6.8%) | 2,717 (6.0%) |
| 25 to 29 Years | 2,879 (6.5%) | 3,153 (7.0%) |
| 30 to 34 Years | 3,521 (7.9%) | 3,486 (7.7%) |
| 35 to 39 Years | 3,178 (7.1%) | 2,981 (6.6%) |
| 40 to 44 Years | 3,094 (7.0%) | 2,782 (6.1%) |
| 45 to 49 Years | 2,657 (6.0%) | 3,466 (7.7%) |
| 50 to 54 Years | 3,487 (7.8%) | 3,284 (7.3%) |
| 55 to 59 Years | 3,268 (7.3%) | 3,337 (7.4%) |
| 60 to 64 Years | 2,872 (6.5%) | 3,284 (7.3%) |
| 65 to 69 Years | 2,354 (5.3%) | 2,039 (4.5%) |
| 70 to 74 Years | 2,025 (4.5%) | 2,225 (4.9%) |
| 75 to 79 Years | 1,302 (2.9%) | 1,704 (3.8%) |
| 80 to 84 Years | 969 (2.2%) | 948 (2.1%) |
| 85 Years and over | 688 (1.5%) | 1,517 (3.4%) |
| Total | 44,511 (100.0%) | 45,212 (100.0%) |
Families and Households in San Leandro
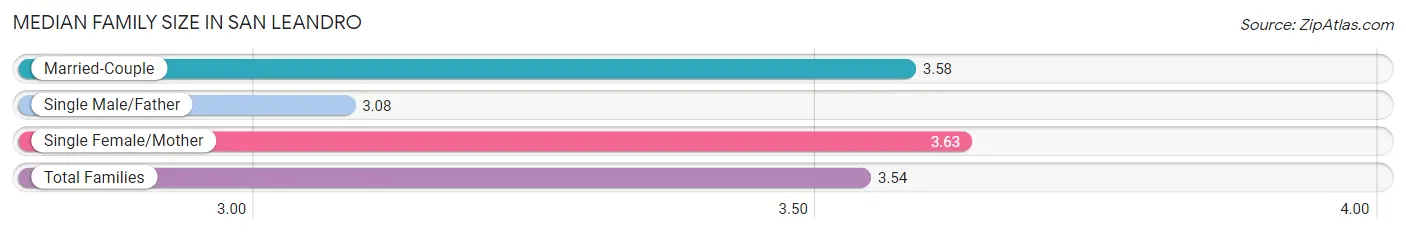
Median Family Size in San Leandro
The median family size in San Leandro is 3.54 persons per family, with single female/mother families (3,902 | 19.0%) accounting for the largest median family size of 3.63 persons per family. On the other hand, single male/father families (2,029 | 9.9%) represent the smallest median family size with 3.08 persons per family.
| Family Type | # Families | Family Size |
| Married-Couple | 14,601 (71.1%) | 3.58 |
| Single Male/Father | 2,029 (9.9%) | 3.08 |
| Single Female/Mother | 3,902 (19.0%) | 3.63 |
| Total Families | 20,532 (100.0%) | 3.54 |
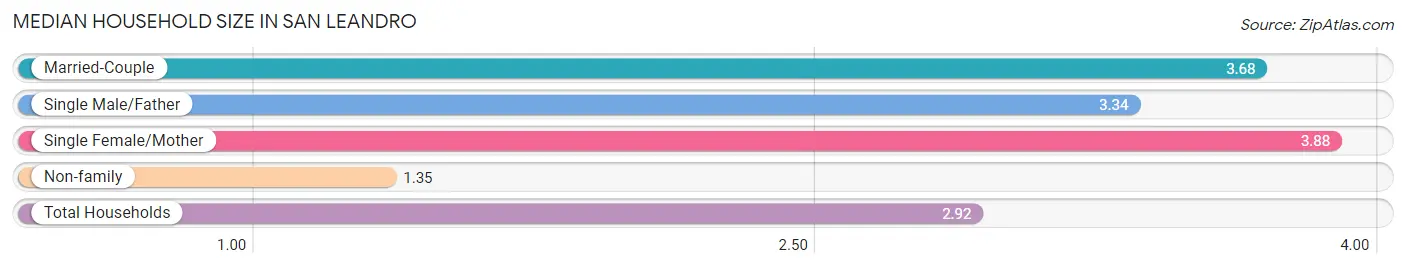
Median Household Size in San Leandro
The median household size in San Leandro is 2.92 persons per household, with single female/mother households (3,902 | 12.8%) accounting for the largest median household size of 3.88 persons per household. non-family households (9,936 | 32.6%) represent the smallest median household size with 1.35 persons per household.
| Household Type | # Households | Household Size |
| Married-Couple | 14,601 (47.9%) | 3.68 |
| Single Male/Father | 2,029 (6.7%) | 3.34 |
| Single Female/Mother | 3,902 (12.8%) | 3.88 |
| Non-family | 9,936 (32.6%) | 1.35 |
| Total Households | 30,468 (100.0%) | 2.92 |
Household Size by Marriage Status in San Leandro
Out of a total of 30,468 households in San Leandro, 20,532 (67.4%) are family households, while 9,936 (32.6%) are nonfamily households. The most numerous type of family households are 2-person households, comprising 7,114, and the most common type of nonfamily households are 1-person households, comprising 7,736.
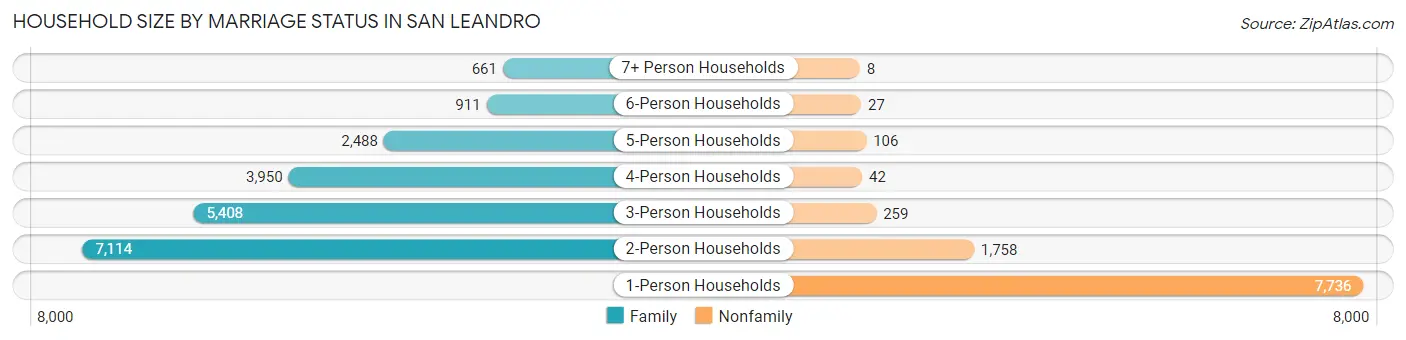
| Household Size | Family Households | Nonfamily Households |
| 1-Person Households | - | 7,736 (25.4%) |
| 2-Person Households | 7,114 (23.4%) | 1,758 (5.8%) |
| 3-Person Households | 5,408 (17.7%) | 259 (0.9%) |
| 4-Person Households | 3,950 (13.0%) | 42 (0.1%) |
| 5-Person Households | 2,488 (8.2%) | 106 (0.4%) |
| 6-Person Households | 911 (3.0%) | 27 (0.1%) |
| 7+ Person Households | 661 (2.2%) | 8 (0.0%) |
| Total | 20,532 (67.4%) | 9,936 (32.6%) |
Female Fertility in San Leandro
Fertility by Age in San Leandro
Average fertility rate in San Leandro is 48.0 births per 1,000 women. Women in the age bracket of 20 to 34 years have the highest fertility rate with 73.0 births per 1,000 women. Women in the age bracket of 20 to 34 years acount for 64.2% of all women with births.
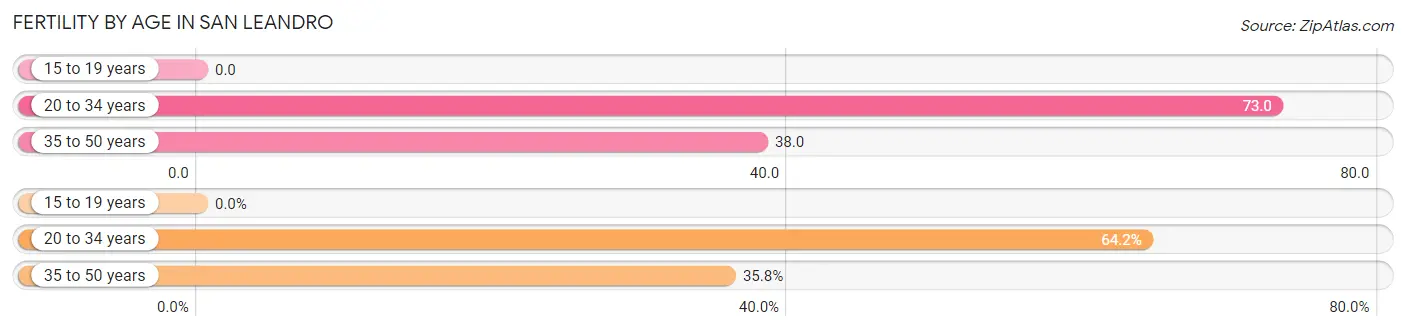
| Age Bracket | Women with Births | Births / 1,000 Women |
| 15 to 19 years | 0 (0.0%) | 0.0 |
| 20 to 34 years | 684 (64.2%) | 73.0 |
| 35 to 50 years | 382 (35.8%) | 38.0 |
| Total | 1,066 (100.0%) | 48.0 |
Fertility by Age by Marriage Status in San Leandro
65.9% of women with births (1,066) in San Leandro are married. The highest percentage of unmarried women with births falls into 20 to 34 years age bracket with 45.8% of them unmarried at the time of birth, while the lowest percentage of unmarried women with births belong to 35 to 50 years age bracket with 13.1% of them unmarried.
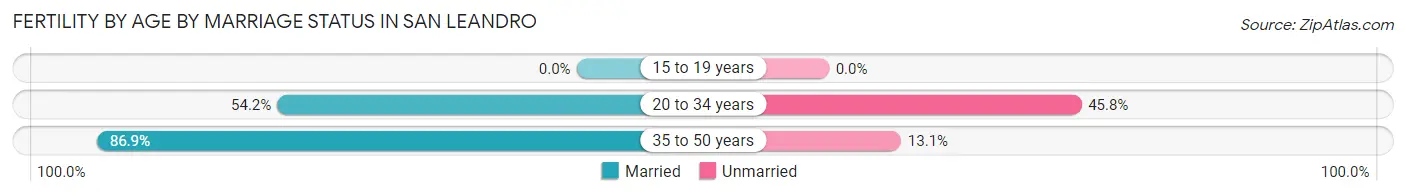
| Age Bracket | Married | Unmarried |
| 15 to 19 years | 0 (0.0%) | 0 (0.0%) |
| 20 to 34 years | 371 (54.2%) | 313 (45.8%) |
| 35 to 50 years | 332 (86.9%) | 50 (13.1%) |
| Total | 702 (65.8%) | 364 (34.2%) |
Fertility by Education in San Leandro
Average fertility rate in San Leandro is 48.0 births per 1,000 women. Women with the education attainment of bachelor's degree have the highest fertility rate of 79.0 births per 1,000 women, while women with the education attainment of less than high school have the lowest fertility at 19.0 births per 1,000 women. Women with the education attainment of bachelor's degree represent 40.5% of all women with births.
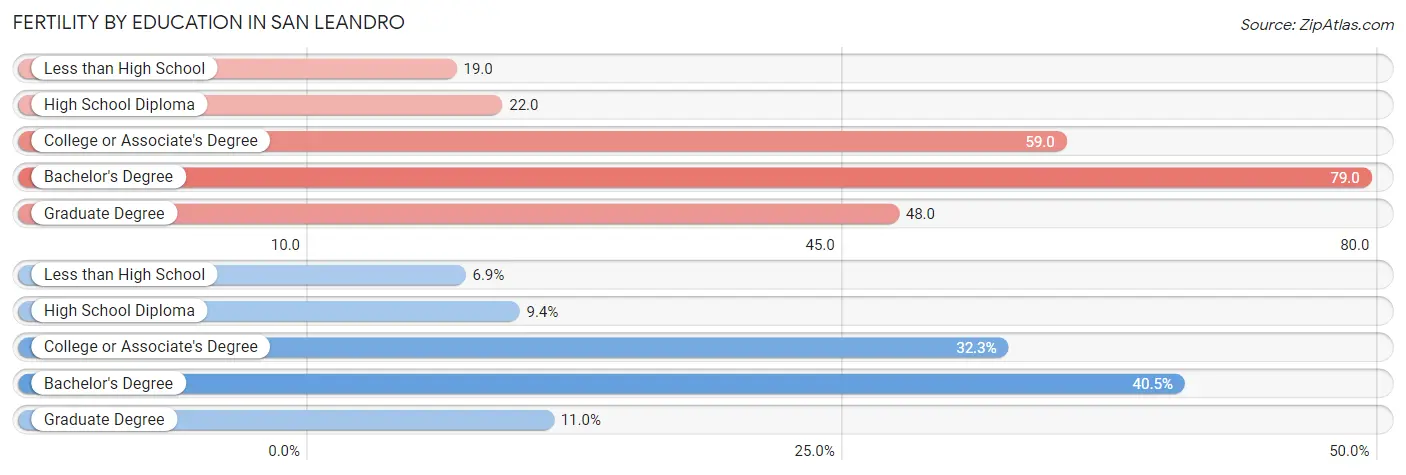
| Educational Attainment | Women with Births | Births / 1,000 Women |
| Less than High School | 73 (6.9%) | 19.0 |
| High School Diploma | 100 (9.4%) | 22.0 |
| College or Associate's Degree | 344 (32.3%) | 59.0 |
| Bachelor's Degree | 432 (40.5%) | 79.0 |
| Graduate Degree | 117 (11.0%) | 48.0 |
| Total | 1,066 (100.0%) | 48.0 |
Fertility by Education by Marriage Status in San Leandro
34.2% of women with births in San Leandro are unmarried. Women with the educational attainment of graduate degree are most likely to be married with 100.0% of them married at childbirth, while women with the educational attainment of high school diploma are least likely to be married with 85.0% of them unmarried at childbirth.
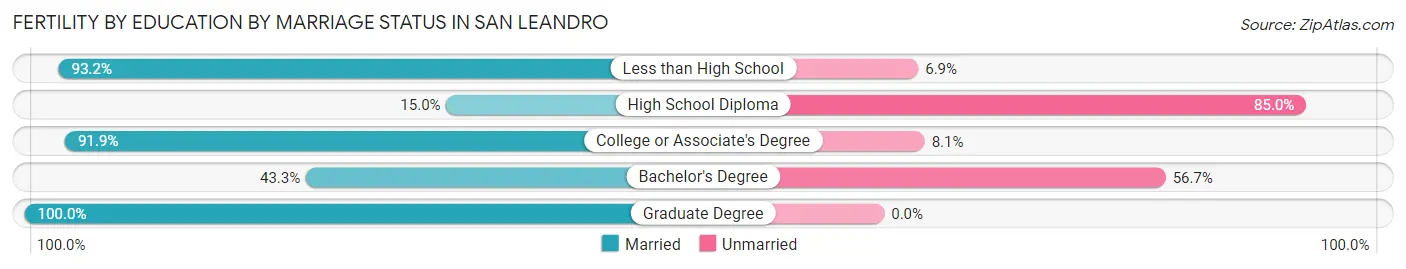
| Educational Attainment | Married | Unmarried |
| Less than High School | 68 (93.1%) | 5 (6.9%) |
| High School Diploma | 15 (15.0%) | 85 (85.0%) |
| College or Associate's Degree | 316 (91.9%) | 28 (8.1%) |
| Bachelor's Degree | 187 (43.3%) | 245 (56.7%) |
| Graduate Degree | 117 (100.0%) | 0 (0.0%) |
| Total | 702 (65.8%) | 364 (34.2%) |
Employment Characteristics in San Leandro
Employment by Class of Employer in San Leandro
Among the 46,193 employed individuals in San Leandro, private company employees (32,200 | 69.7%), local government employees (3,744 | 8.1%), and not-for-profit organizations (3,733 | 8.1%) make up the most common classes of employment.
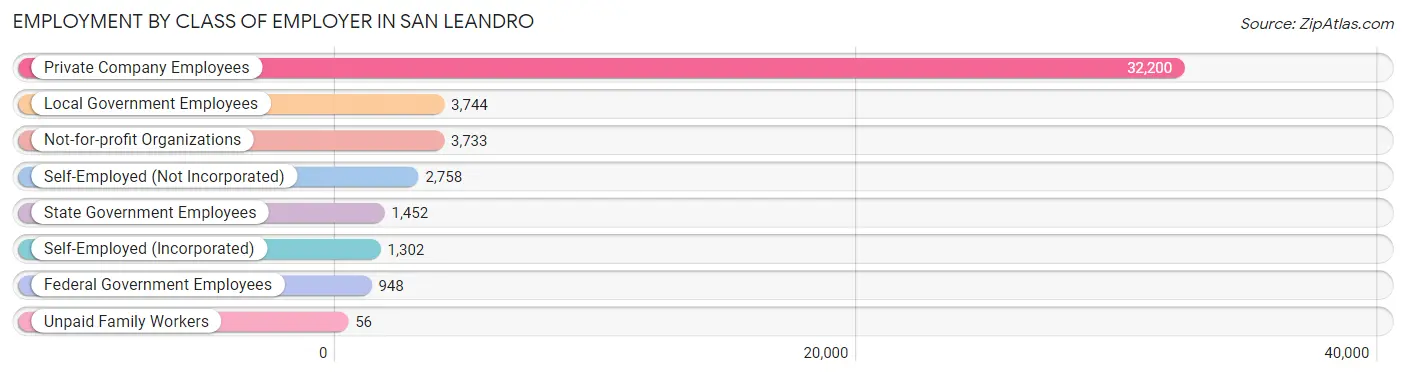
| Employer Class | # Employees | % Employees |
| Private Company Employees | 32,200 | 69.7% |
| Self-Employed (Incorporated) | 1,302 | 2.8% |
| Self-Employed (Not Incorporated) | 2,758 | 6.0% |
| Not-for-profit Organizations | 3,733 | 8.1% |
| Local Government Employees | 3,744 | 8.1% |
| State Government Employees | 1,452 | 3.1% |
| Federal Government Employees | 948 | 2.1% |
| Unpaid Family Workers | 56 | 0.1% |
| Total | 46,193 | 100.0% |
Employment Status by Age in San Leandro
According to the labor force statistics for San Leandro, out of the total population over 16 years of age (76,562), 65.9% or 50,454 individuals are in the labor force, with 5.0% or 2,523 of them unemployed. The age group with the highest labor force participation rate is 25 to 29 years, with 89.1% or 5,375 individuals in the labor force. Within the labor force, the 75 years and over age range has the highest percentage of unemployed individuals, with 12.4% or 43 of them being unemployed.
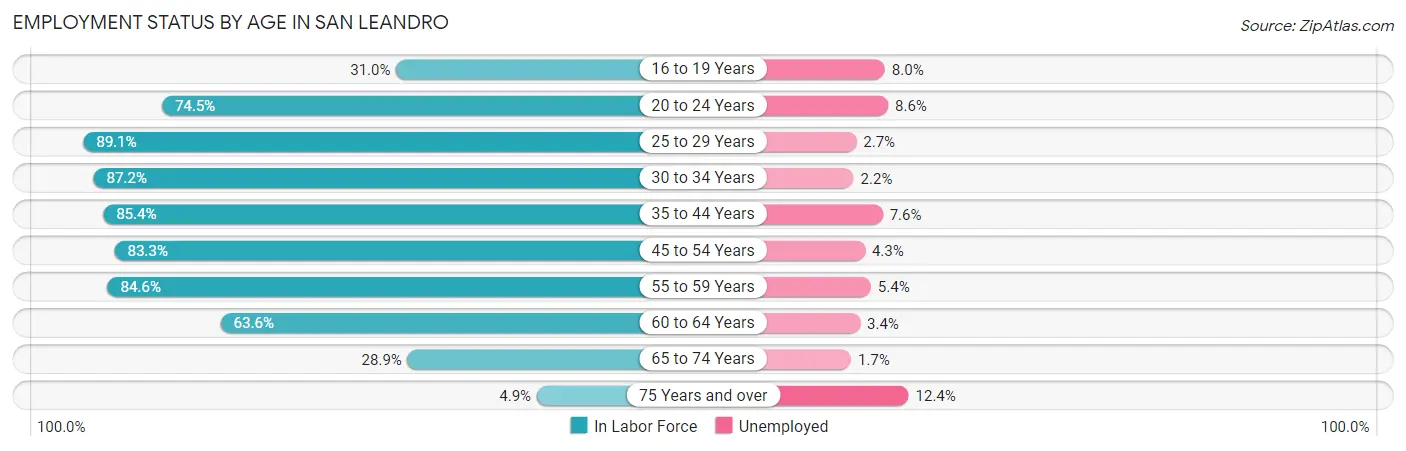
| Age Bracket | In Labor Force | Unemployed |
| 16 to 19 Years | 1,346 (31.0%) | 108 (8.0%) |
| 20 to 24 Years | 4,262 (74.5%) | 367 (8.6%) |
| 25 to 29 Years | 5,375 (89.1%) | 145 (2.7%) |
| 30 to 34 Years | 6,110 (87.2%) | 134 (2.2%) |
| 35 to 44 Years | 10,278 (85.4%) | 781 (7.6%) |
| 45 to 54 Years | 10,741 (83.3%) | 462 (4.3%) |
| 55 to 59 Years | 5,588 (84.6%) | 302 (5.4%) |
| 60 to 64 Years | 3,915 (63.6%) | 133 (3.4%) |
| 65 to 74 Years | 2,498 (28.9%) | 42 (1.7%) |
| 75 Years and over | 349 (4.9%) | 43 (12.4%) |
| Total | 50,454 (65.9%) | 2,523 (5.0%) |
Employment Status by Educational Attainment in San Leandro
According to labor force statistics for San Leandro, 82.8% of individuals (42,004) out of the total population between 25 and 64 years of age (50,729) are in the labor force, with 4.6% or 1,932 of them being unemployed. The group with the highest labor force participation rate are those with the educational attainment of bachelor's degree or higher, with 89.9% or 16,379 individuals in the labor force. Within the labor force, individuals with less than high school education have the highest percentage of unemployment, with 7.0% or 294 of them being unemployed.
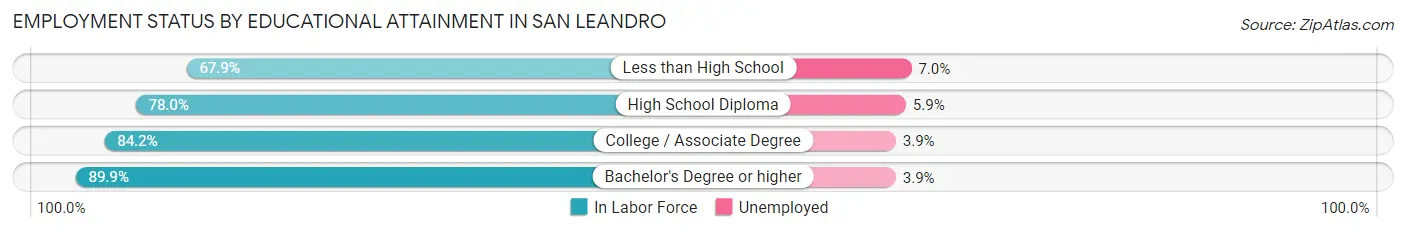
| Educational Attainment | In Labor Force | Unemployed |
| Less than High School | 4,194 (67.9%) | 432 (7.0%) |
| High School Diploma | 9,270 (78.0%) | 701 (5.9%) |
| College / Associate Degree | 12,165 (84.2%) | 563 (3.9%) |
| Bachelor's Degree or higher | 16,379 (89.9%) | 711 (3.9%) |
| Total | 42,004 (82.8%) | 2,334 (4.6%) |
Employment Occupations by Sex in San Leandro
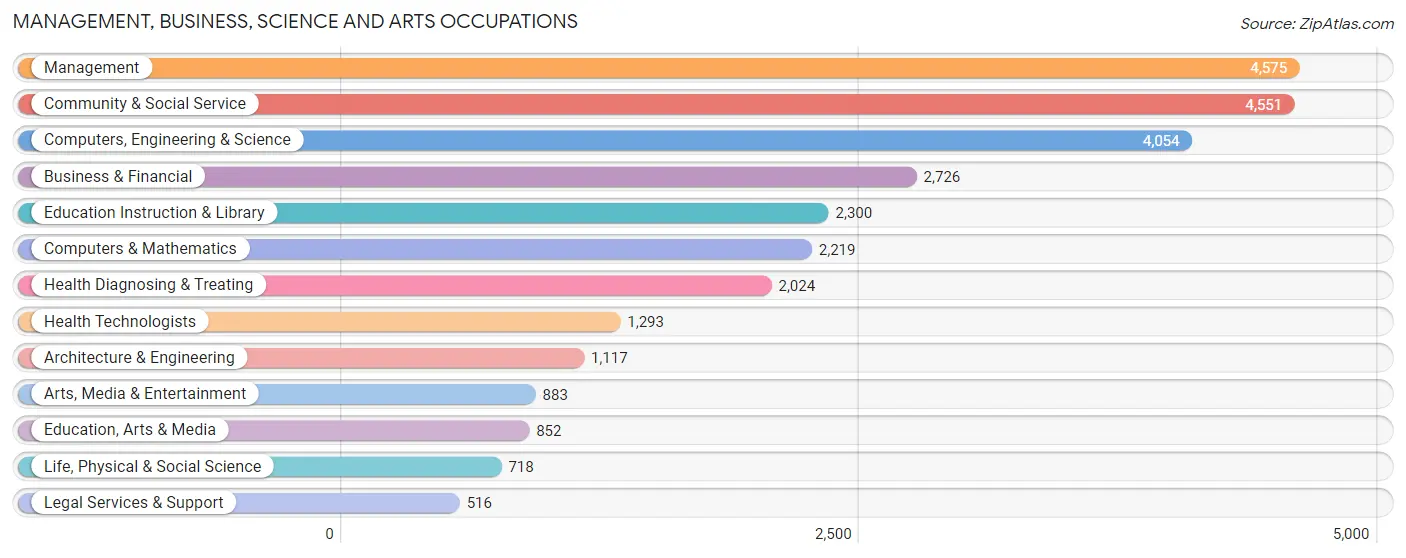
Management, Business, Science and Arts Occupations
The most common Management, Business, Science and Arts occupations in San Leandro are Management (4,575 | 9.6%), Community & Social Service (4,551 | 9.5%), Computers, Engineering & Science (4,054 | 8.5%), Business & Financial (2,726 | 5.7%), and Education Instruction & Library (2,300 | 4.8%).
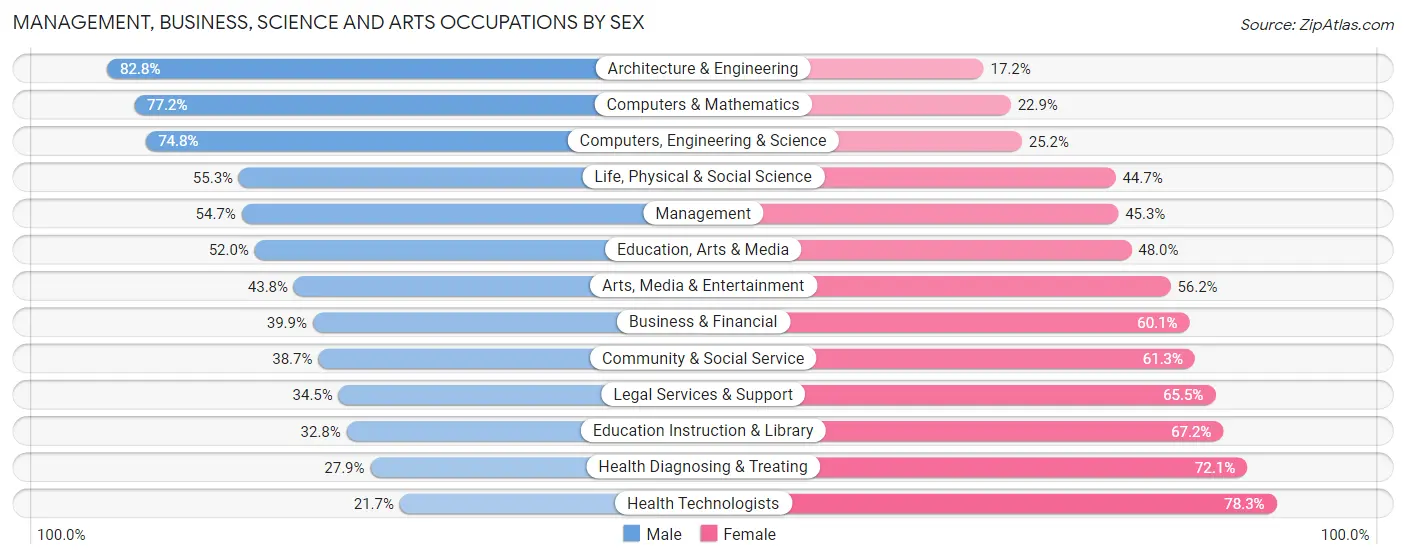
Management, Business, Science and Arts Occupations by Sex
Within the Management, Business, Science and Arts occupations in San Leandro, the most male-oriented occupations are Architecture & Engineering (82.8%), Computers & Mathematics (77.1%), and Computers, Engineering & Science (74.8%), while the most female-oriented occupations are Health Technologists (78.3%), Health Diagnosing & Treating (72.1%), and Education Instruction & Library (67.2%).
| Occupation | Male | Female |
| Management | 2,504 (54.7%) | 2,071 (45.3%) |
| Business & Financial | 1,087 (39.9%) | 1,639 (60.1%) |
| Computers, Engineering & Science | 3,034 (74.8%) | 1,020 (25.2%) |
| Computers & Mathematics | 1,712 (77.1%) | 507 (22.9%) |
| Architecture & Engineering | 925 (82.8%) | 192 (17.2%) |
| Life, Physical & Social Science | 397 (55.3%) | 321 (44.7%) |
| Community & Social Service | 1,763 (38.7%) | 2,788 (61.3%) |
| Education, Arts & Media | 443 (52.0%) | 409 (48.0%) |
| Legal Services & Support | 178 (34.5%) | 338 (65.5%) |
| Education Instruction & Library | 755 (32.8%) | 1,545 (67.2%) |
| Arts, Media & Entertainment | 387 (43.8%) | 496 (56.2%) |
| Health Diagnosing & Treating | 564 (27.9%) | 1,460 (72.1%) |
| Health Technologists | 281 (21.7%) | 1,012 (78.3%) |
| Total (Category) | 8,952 (49.9%) | 8,978 (50.1%) |
| Total (Overall) | 25,388 (53.0%) | 22,504 (47.0%) |
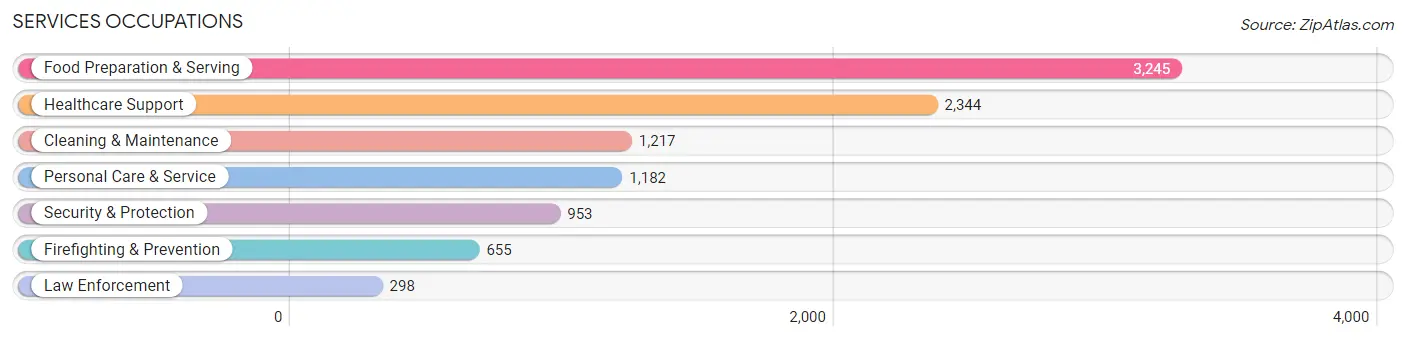
Services Occupations
The most common Services occupations in San Leandro are Food Preparation & Serving (3,245 | 6.8%), Healthcare Support (2,344 | 4.9%), Cleaning & Maintenance (1,217 | 2.5%), Personal Care & Service (1,182 | 2.5%), and Security & Protection (953 | 2.0%).
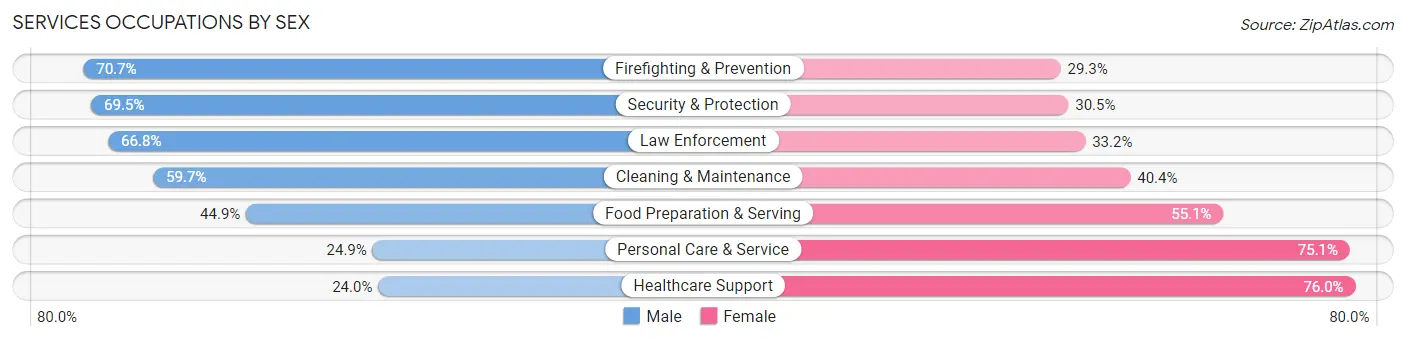
Services Occupations by Sex
Within the Services occupations in San Leandro, the most male-oriented occupations are Firefighting & Prevention (70.7%), Security & Protection (69.5%), and Law Enforcement (66.8%), while the most female-oriented occupations are Healthcare Support (76.0%), Personal Care & Service (75.1%), and Food Preparation & Serving (55.1%).
| Occupation | Male | Female |
| Healthcare Support | 562 (24.0%) | 1,782 (76.0%) |
| Security & Protection | 662 (69.5%) | 291 (30.5%) |
| Firefighting & Prevention | 463 (70.7%) | 192 (29.3%) |
| Law Enforcement | 199 (66.8%) | 99 (33.2%) |
| Food Preparation & Serving | 1,457 (44.9%) | 1,788 (55.1%) |
| Cleaning & Maintenance | 726 (59.7%) | 491 (40.4%) |
| Personal Care & Service | 294 (24.9%) | 888 (75.1%) |
| Total (Category) | 3,701 (41.4%) | 5,240 (58.6%) |
| Total (Overall) | 25,388 (53.0%) | 22,504 (47.0%) |
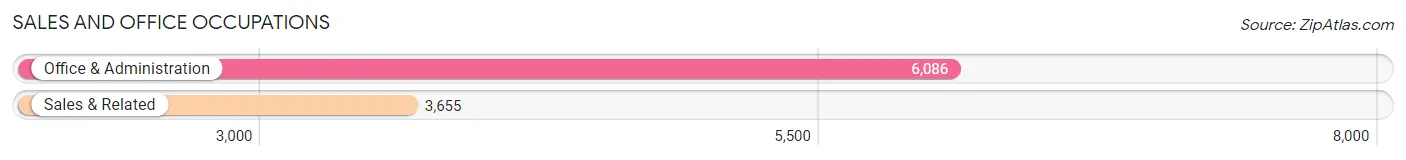
Sales and Office Occupations
The most common Sales and Office occupations in San Leandro are Office & Administration (6,086 | 12.7%), and Sales & Related (3,655 | 7.6%).
Sales and Office Occupations by Sex
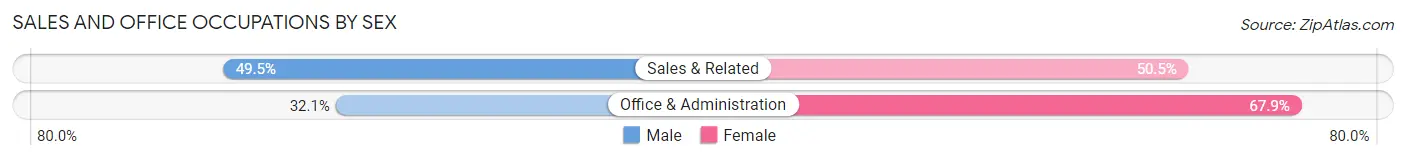
| Occupation | Male | Female |
| Sales & Related | 1,810 (49.5%) | 1,845 (50.5%) |
| Office & Administration | 1,956 (32.1%) | 4,130 (67.9%) |
| Total (Category) | 3,766 (38.7%) | 5,975 (61.3%) |
| Total (Overall) | 25,388 (53.0%) | 22,504 (47.0%) |
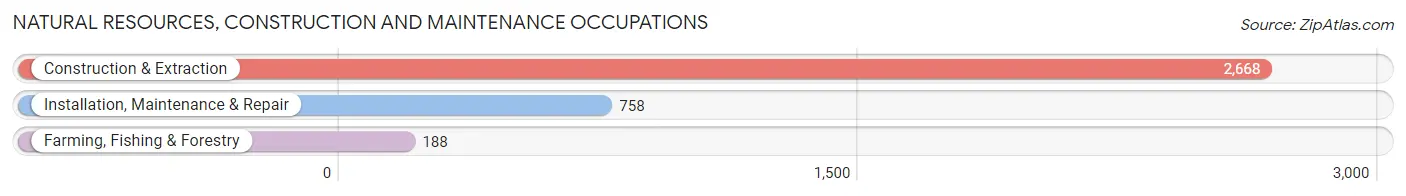
Natural Resources, Construction and Maintenance Occupations
The most common Natural Resources, Construction and Maintenance occupations in San Leandro are Construction & Extraction (2,668 | 5.6%), Installation, Maintenance & Repair (758 | 1.6%), and Farming, Fishing & Forestry (188 | 0.4%).
Natural Resources, Construction and Maintenance Occupations by Sex
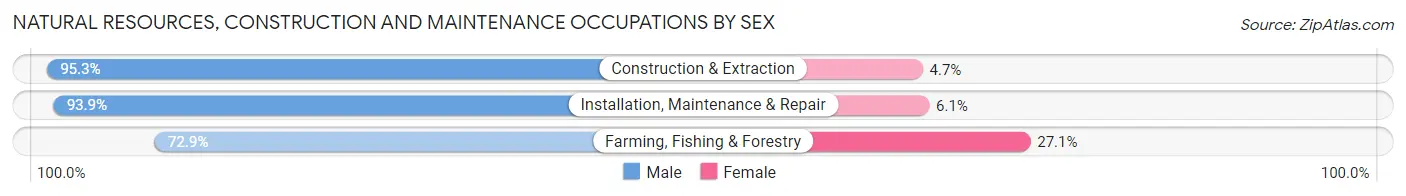
| Occupation | Male | Female |
| Farming, Fishing & Forestry | 137 (72.9%) | 51 (27.1%) |
| Construction & Extraction | 2,542 (95.3%) | 126 (4.7%) |
| Installation, Maintenance & Repair | 712 (93.9%) | 46 (6.1%) |
| Total (Category) | 3,391 (93.8%) | 223 (6.2%) |
| Total (Overall) | 25,388 (53.0%) | 22,504 (47.0%) |
Production, Transportation and Moving Occupations
The most common Production, Transportation and Moving occupations in San Leandro are Production (3,176 | 6.6%), Material Moving (2,509 | 5.2%), and Transportation (1,981 | 4.1%).
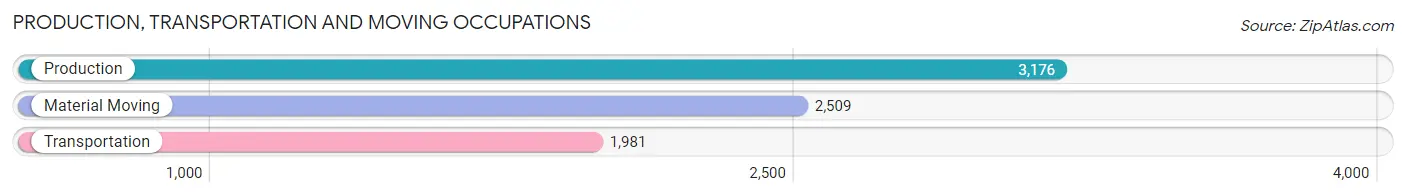
Production, Transportation and Moving Occupations by Sex
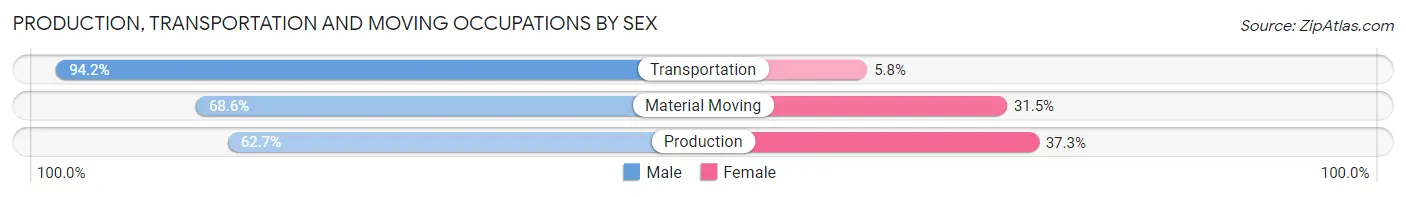
| Occupation | Male | Female |
| Production | 1,992 (62.7%) | 1,184 (37.3%) |
| Transportation | 1,866 (94.2%) | 115 (5.8%) |
| Material Moving | 1,720 (68.5%) | 789 (31.5%) |
| Total (Category) | 5,578 (72.8%) | 2,088 (27.2%) |
| Total (Overall) | 25,388 (53.0%) | 22,504 (47.0%) |
Employment Industries by Sex in San Leandro
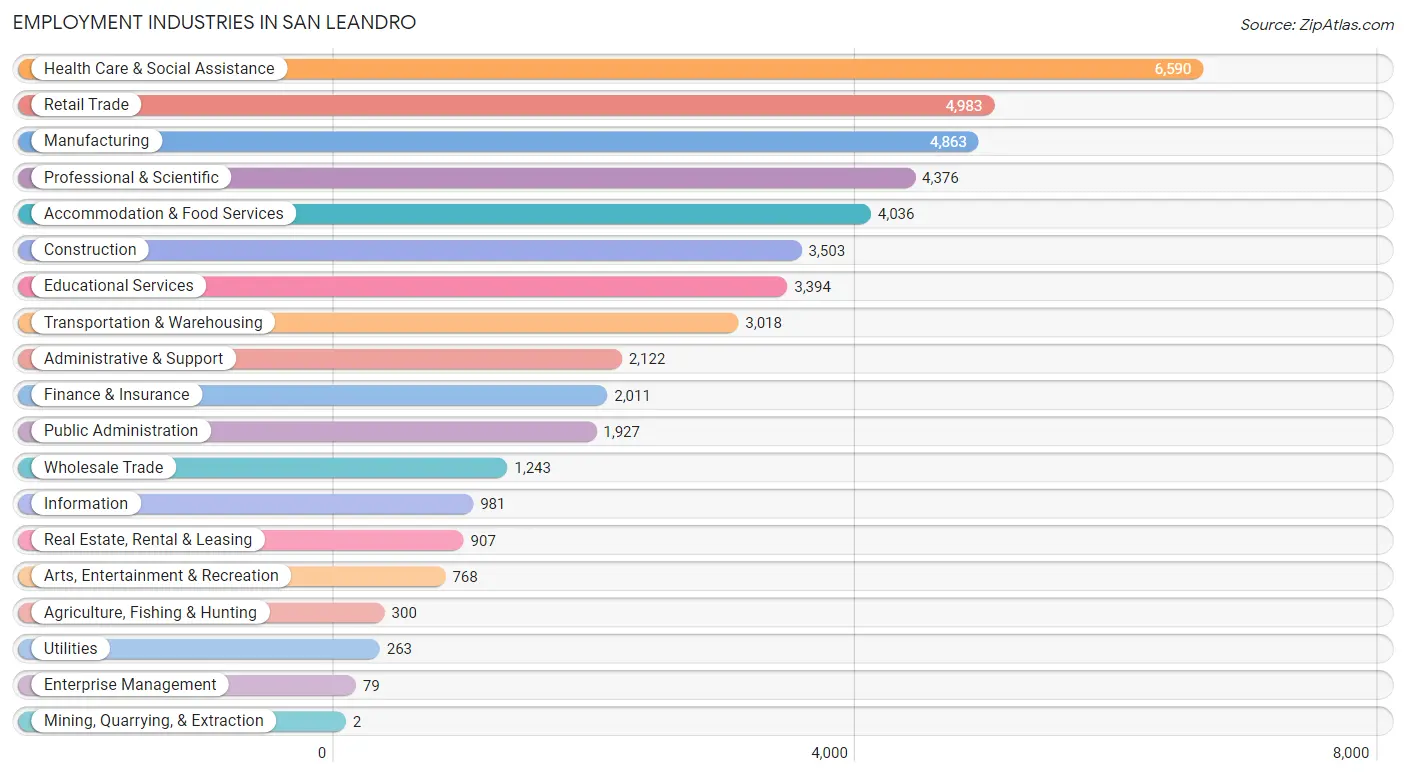
Employment Industries in San Leandro
The major employment industries in San Leandro include Health Care & Social Assistance (6,590 | 13.8%), Retail Trade (4,983 | 10.4%), Manufacturing (4,863 | 10.2%), Professional & Scientific (4,376 | 9.1%), and Accommodation & Food Services (4,036 | 8.4%).
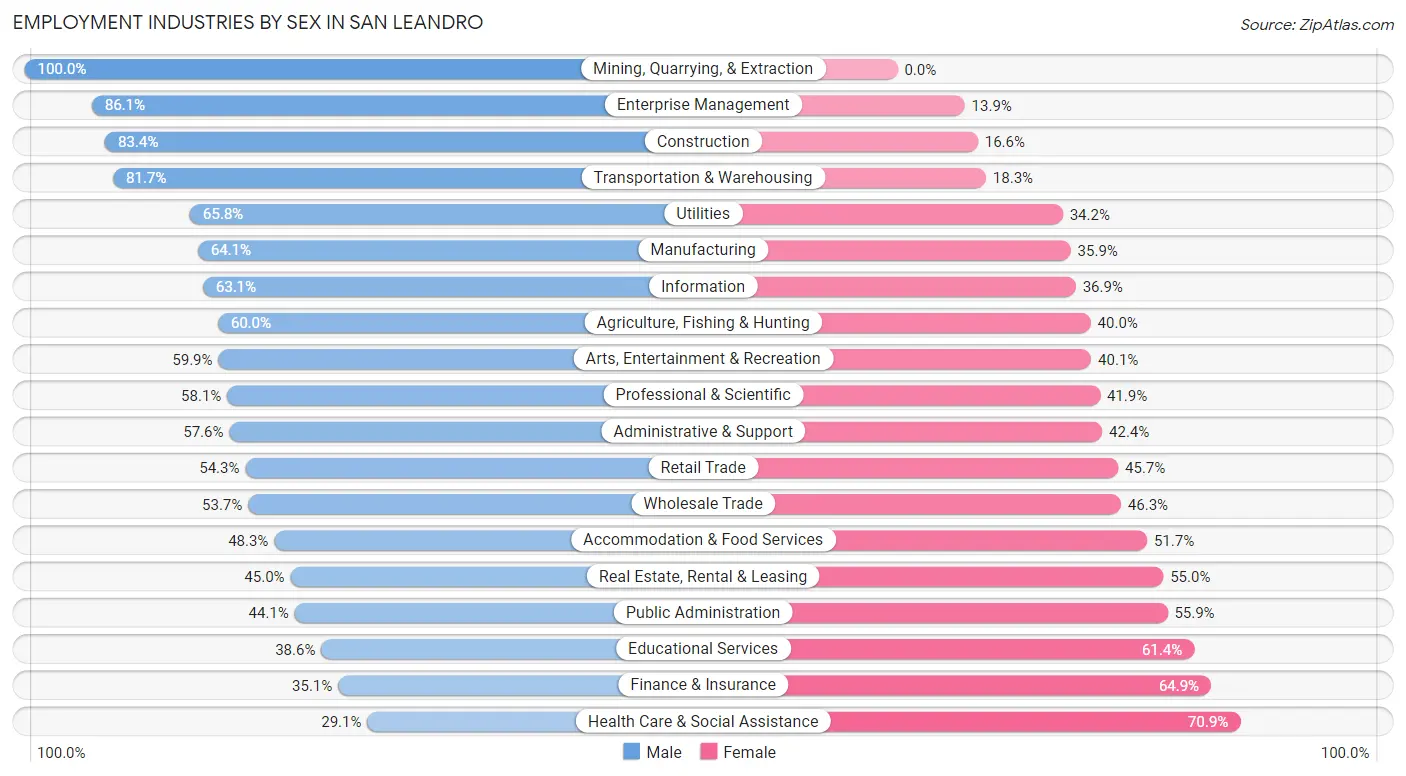
Employment Industries by Sex in San Leandro
The San Leandro industries that see more men than women are Mining, Quarrying, & Extraction (100.0%), Enterprise Management (86.1%), and Construction (83.4%), whereas the industries that tend to have a higher number of women are Health Care & Social Assistance (70.9%), Finance & Insurance (64.9%), and Educational Services (61.4%).
| Industry | Male | Female |
| Agriculture, Fishing & Hunting | 180 (60.0%) | 120 (40.0%) |
| Mining, Quarrying, & Extraction | 2 (100.0%) | 0 (0.0%) |
| Construction | 2,920 (83.4%) | 583 (16.6%) |
| Manufacturing | 3,119 (64.1%) | 1,744 (35.9%) |
| Wholesale Trade | 668 (53.7%) | 575 (46.3%) |
| Retail Trade | 2,707 (54.3%) | 2,276 (45.7%) |
| Transportation & Warehousing | 2,465 (81.7%) | 553 (18.3%) |
| Utilities | 173 (65.8%) | 90 (34.2%) |
| Information | 619 (63.1%) | 362 (36.9%) |
| Finance & Insurance | 706 (35.1%) | 1,305 (64.9%) |
| Real Estate, Rental & Leasing | 408 (45.0%) | 499 (55.0%) |
| Professional & Scientific | 2,541 (58.1%) | 1,835 (41.9%) |
| Enterprise Management | 68 (86.1%) | 11 (13.9%) |
| Administrative & Support | 1,223 (57.6%) | 899 (42.4%) |
| Educational Services | 1,310 (38.6%) | 2,084 (61.4%) |
| Health Care & Social Assistance | 1,916 (29.1%) | 4,674 (70.9%) |
| Arts, Entertainment & Recreation | 460 (59.9%) | 308 (40.1%) |
| Accommodation & Food Services | 1,951 (48.3%) | 2,085 (51.7%) |
| Public Administration | 850 (44.1%) | 1,077 (55.9%) |
| Total | 25,388 (53.0%) | 22,504 (47.0%) |
Education in San Leandro
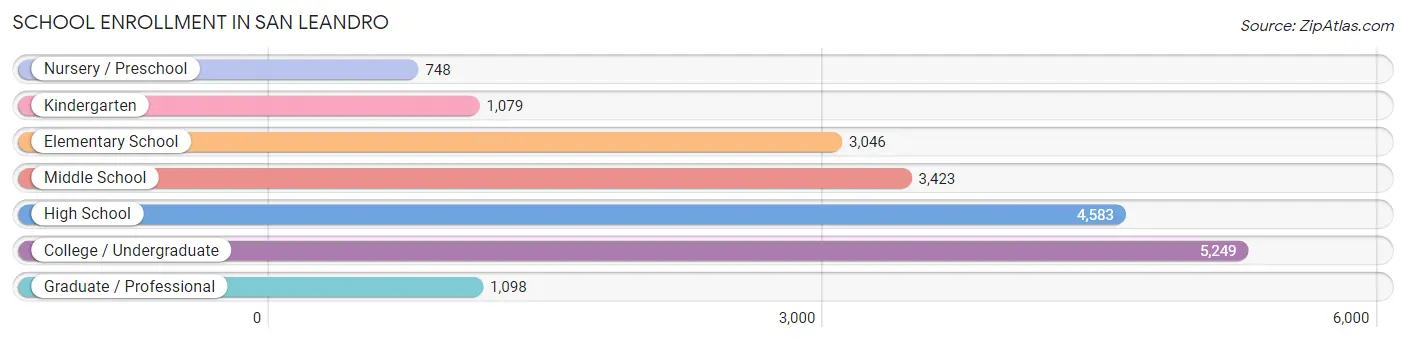
School Enrollment in San Leandro
The most common levels of schooling among the 19,226 students in San Leandro are college / undergraduate (5,249 | 27.3%), high school (4,583 | 23.8%), and middle school (3,423 | 17.8%).
| School Level | # Students | % Students |
| Nursery / Preschool | 748 | 3.9% |
| Kindergarten | 1,079 | 5.6% |
| Elementary School | 3,046 | 15.8% |
| Middle School | 3,423 | 17.8% |
| High School | 4,583 | 23.8% |
| College / Undergraduate | 5,249 | 27.3% |
| Graduate / Professional | 1,098 | 5.7% |
| Total | 19,226 | 100.0% |
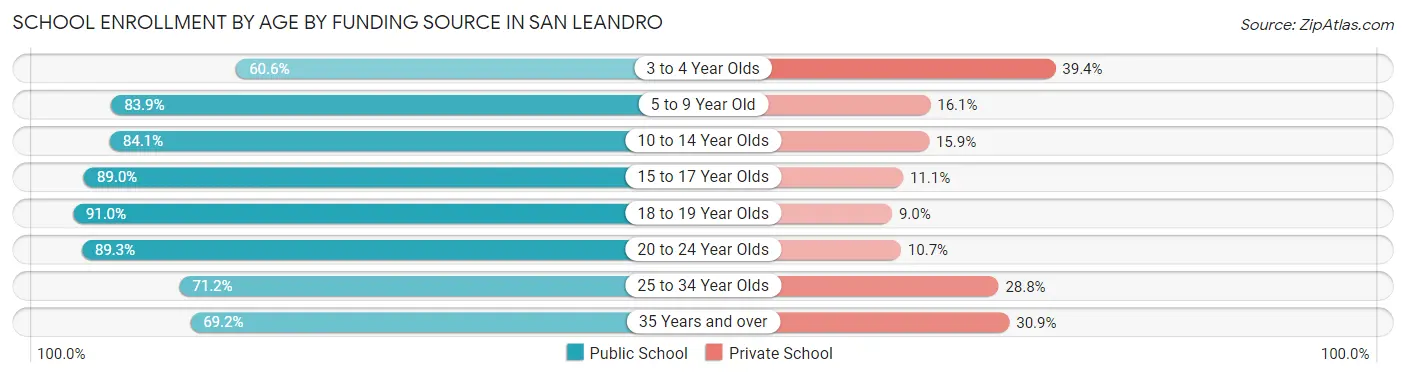
School Enrollment by Age by Funding Source in San Leandro
Out of a total of 19,226 students who are enrolled in schools in San Leandro, 3,249 (16.9%) attend a private institution, while the remaining 15,977 (83.1%) are enrolled in public schools. The age group of 3 to 4 year olds has the highest likelihood of being enrolled in private schools, with 222 (39.4% in the age bracket) enrolled. Conversely, the age group of 18 to 19 year olds has the lowest likelihood of being enrolled in a private school, with 1,266 (91.0% in the age bracket) attending a public institution.
| Age Bracket | Public School | Private School |
| 3 to 4 Year Olds | 341 (60.6%) | 222 (39.4%) |
| 5 to 9 Year Old | 3,434 (83.9%) | 661 (16.1%) |
| 10 to 14 Year Olds | 3,367 (84.1%) | 636 (15.9%) |
| 15 to 17 Year Olds | 2,995 (88.9%) | 372 (11.1%) |
| 18 to 19 Year Olds | 1,266 (91.0%) | 125 (9.0%) |
| 20 to 24 Year Olds | 2,338 (89.3%) | 279 (10.7%) |
| 25 to 34 Year Olds | 1,239 (71.2%) | 502 (28.8%) |
| 35 Years and over | 1,002 (69.2%) | 447 (30.8%) |
| Total | 15,977 (83.1%) | 3,249 (16.9%) |
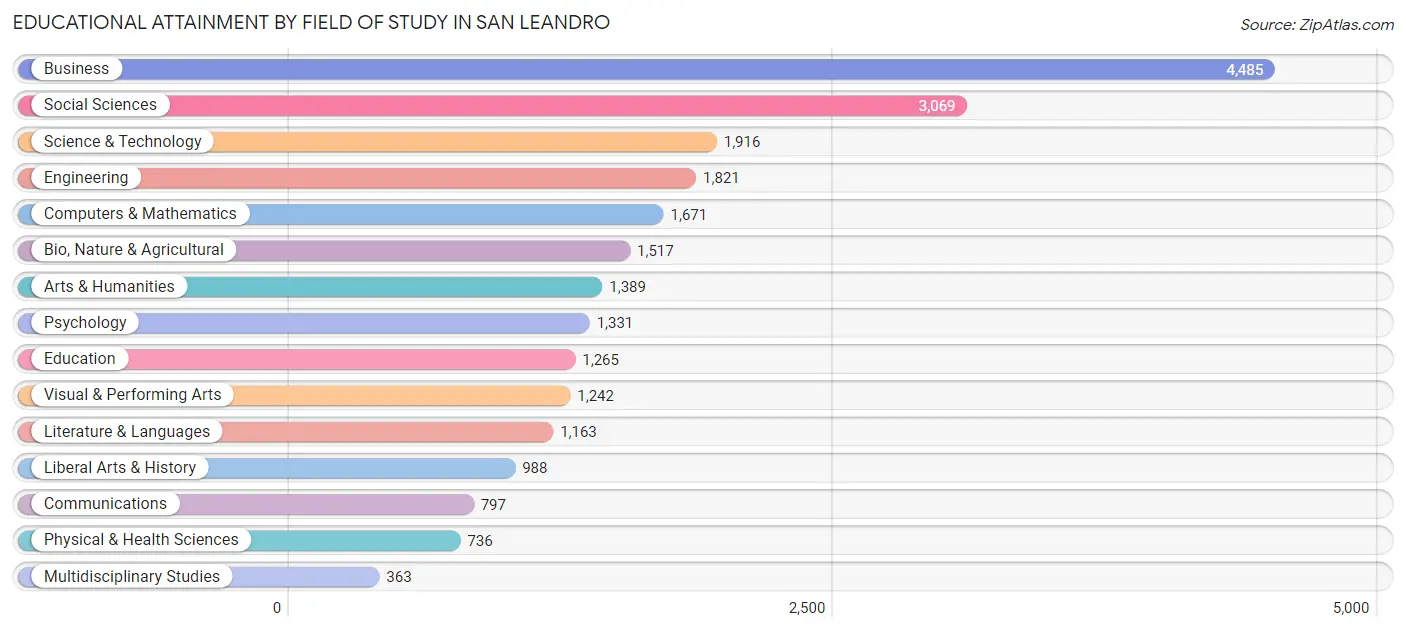
Educational Attainment by Field of Study in San Leandro
Business (4,485 | 18.9%), social sciences (3,069 | 12.9%), science & technology (1,916 | 8.1%), engineering (1,821 | 7.7%), and computers & mathematics (1,671 | 7.0%) are the most common fields of study among 23,753 individuals in San Leandro who have obtained a bachelor's degree or higher.
| Field of Study | # Graduates | % Graduates |
| Computers & Mathematics | 1,671 | 7.0% |
| Bio, Nature & Agricultural | 1,517 | 6.4% |
| Physical & Health Sciences | 736 | 3.1% |
| Psychology | 1,331 | 5.6% |
| Social Sciences | 3,069 | 12.9% |
| Engineering | 1,821 | 7.7% |
| Multidisciplinary Studies | 363 | 1.5% |
| Science & Technology | 1,916 | 8.1% |
| Business | 4,485 | 18.9% |
| Education | 1,265 | 5.3% |
| Literature & Languages | 1,163 | 4.9% |
| Liberal Arts & History | 988 | 4.2% |
| Visual & Performing Arts | 1,242 | 5.2% |
| Communications | 797 | 3.4% |
| Arts & Humanities | 1,389 | 5.9% |
| Total | 23,753 | 100.0% |
Transportation & Commute in San Leandro
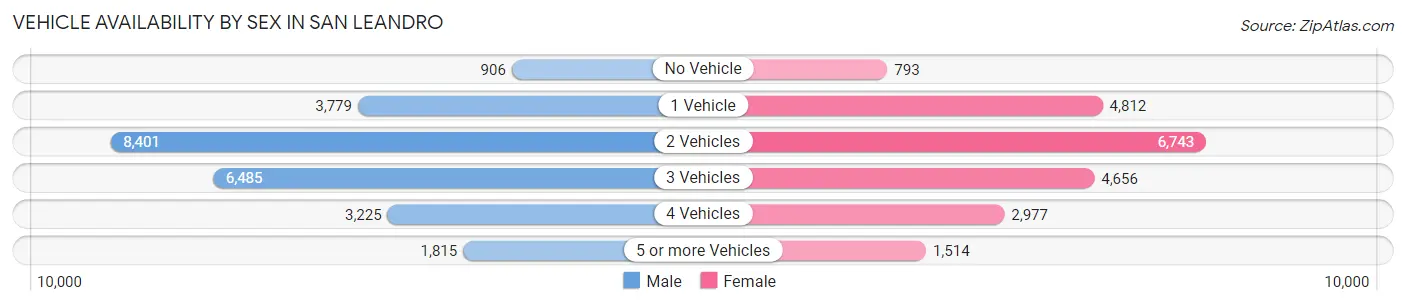
Vehicle Availability by Sex in San Leandro
The most prevalent vehicle ownership categories in San Leandro are males with 2 vehicles (8,401, accounting for 34.1%) and females with 2 vehicles (6,743, making up 39.1%).
| Vehicles Available | Male | Female |
| No Vehicle | 906 (3.7%) | 793 (3.7%) |
| 1 Vehicle | 3,779 (15.3%) | 4,812 (22.4%) |
| 2 Vehicles | 8,401 (34.1%) | 6,743 (31.4%) |
| 3 Vehicles | 6,485 (26.4%) | 4,656 (21.7%) |
| 4 Vehicles | 3,225 (13.1%) | 2,977 (13.9%) |
| 5 or more Vehicles | 1,815 (7.4%) | 1,514 (7.0%) |
| Total | 24,611 (100.0%) | 21,495 (100.0%) |
Commute Time in San Leandro
The most frequently occuring commute durations in San Leandro are 30 to 34 minutes (6,842 commuters, 16.7%), 45 to 59 minutes (5,263 commuters, 12.8%), and 15 to 19 minutes (4,954 commuters, 12.1%).
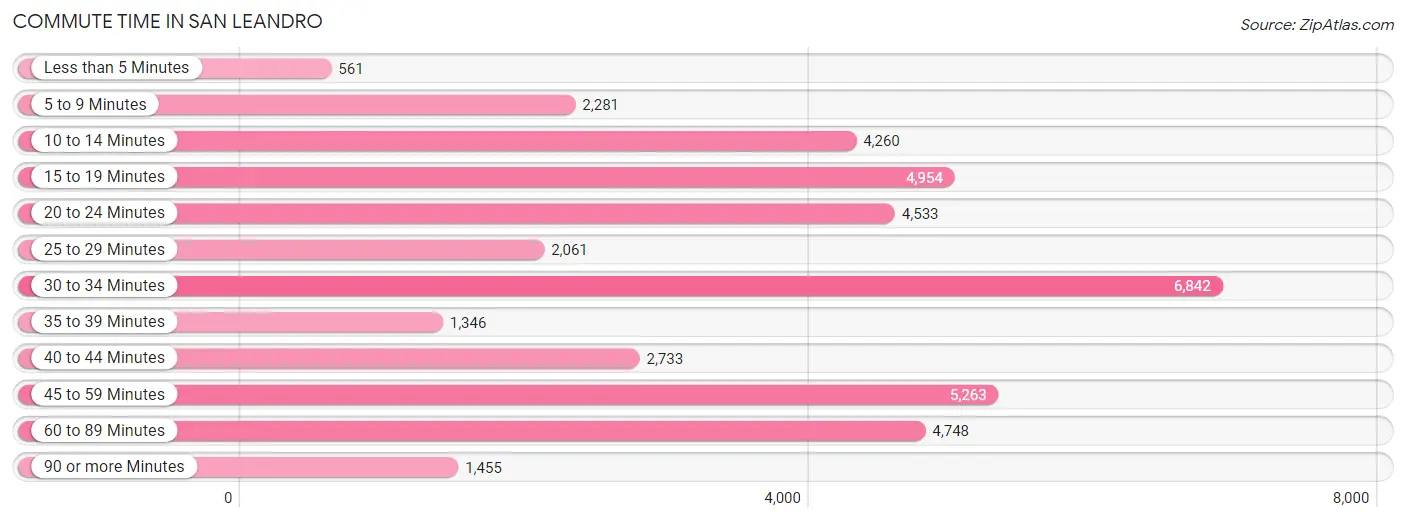
| Commute Time | # Commuters | % Commuters |
| Less than 5 Minutes | 561 | 1.4% |
| 5 to 9 Minutes | 2,281 | 5.6% |
| 10 to 14 Minutes | 4,260 | 10.4% |
| 15 to 19 Minutes | 4,954 | 12.1% |
| 20 to 24 Minutes | 4,533 | 11.1% |
| 25 to 29 Minutes | 2,061 | 5.0% |
| 30 to 34 Minutes | 6,842 | 16.7% |
| 35 to 39 Minutes | 1,346 | 3.3% |
| 40 to 44 Minutes | 2,733 | 6.7% |
| 45 to 59 Minutes | 5,263 | 12.8% |
| 60 to 89 Minutes | 4,748 | 11.6% |
| 90 or more Minutes | 1,455 | 3.5% |
Commute Time by Sex in San Leandro
The most common commute times in San Leandro are 30 to 34 minutes (3,850 commuters, 17.4%) for males and 30 to 34 minutes (2,992 commuters, 15.9%) for females.
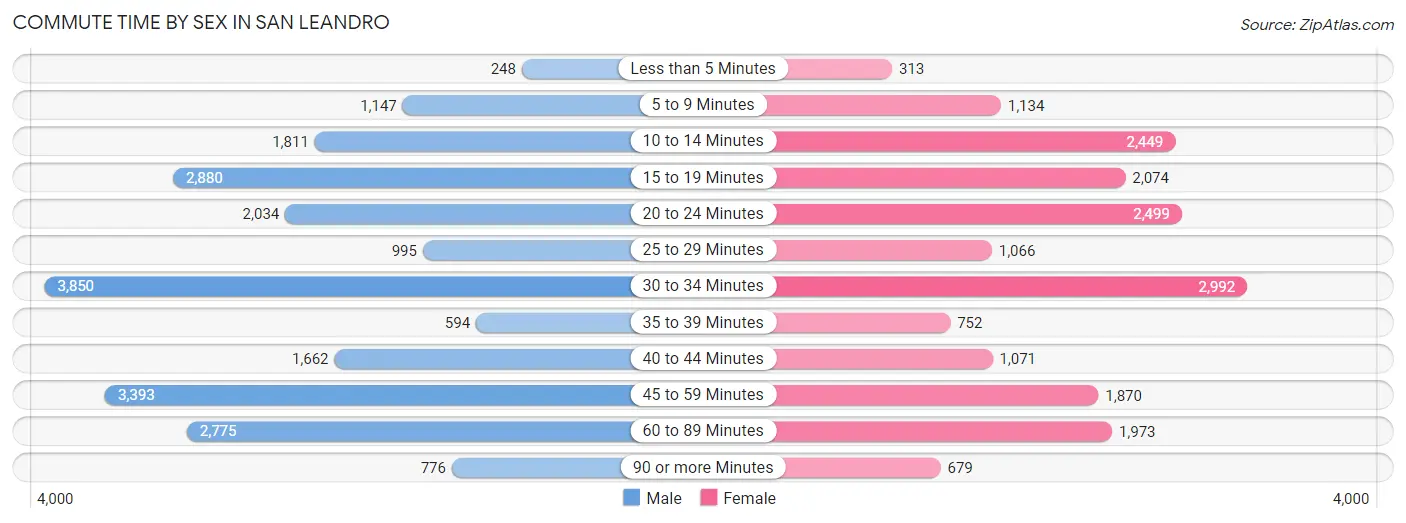
| Commute Time | Male | Female |
| Less than 5 Minutes | 248 (1.1%) | 313 (1.7%) |
| 5 to 9 Minutes | 1,147 (5.2%) | 1,134 (6.0%) |
| 10 to 14 Minutes | 1,811 (8.2%) | 2,449 (13.0%) |
| 15 to 19 Minutes | 2,880 (13.0%) | 2,074 (11.0%) |
| 20 to 24 Minutes | 2,034 (9.2%) | 2,499 (13.2%) |
| 25 to 29 Minutes | 995 (4.5%) | 1,066 (5.7%) |
| 30 to 34 Minutes | 3,850 (17.4%) | 2,992 (15.9%) |
| 35 to 39 Minutes | 594 (2.7%) | 752 (4.0%) |
| 40 to 44 Minutes | 1,662 (7.5%) | 1,071 (5.7%) |
| 45 to 59 Minutes | 3,393 (15.3%) | 1,870 (9.9%) |
| 60 to 89 Minutes | 2,775 (12.5%) | 1,973 (10.4%) |
| 90 or more Minutes | 776 (3.5%) | 679 (3.6%) |
Time of Departure to Work by Sex in San Leandro
The most frequent times of departure to work in San Leandro are 7:00 AM to 7:29 AM (2,479, 11.2%) for males and 7:00 AM to 7:29 AM (3,104, 16.5%) for females.
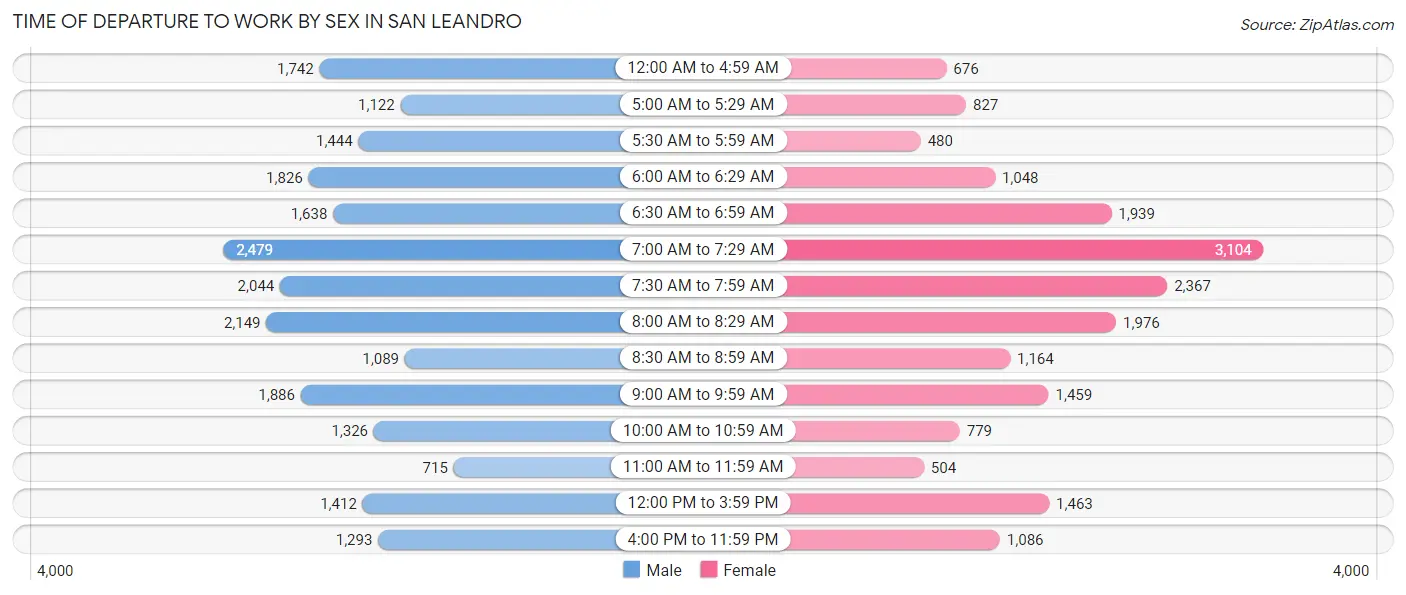
| Time of Departure | Male | Female |
| 12:00 AM to 4:59 AM | 1,742 (7.9%) | 676 (3.6%) |
| 5:00 AM to 5:29 AM | 1,122 (5.1%) | 827 (4.4%) |
| 5:30 AM to 5:59 AM | 1,444 (6.5%) | 480 (2.5%) |
| 6:00 AM to 6:29 AM | 1,826 (8.2%) | 1,048 (5.6%) |
| 6:30 AM to 6:59 AM | 1,638 (7.4%) | 1,939 (10.3%) |
| 7:00 AM to 7:29 AM | 2,479 (11.2%) | 3,104 (16.5%) |
| 7:30 AM to 7:59 AM | 2,044 (9.2%) | 2,367 (12.5%) |
| 8:00 AM to 8:29 AM | 2,149 (9.7%) | 1,976 (10.5%) |
| 8:30 AM to 8:59 AM | 1,089 (4.9%) | 1,164 (6.2%) |
| 9:00 AM to 9:59 AM | 1,886 (8.5%) | 1,459 (7.7%) |
| 10:00 AM to 10:59 AM | 1,326 (6.0%) | 779 (4.1%) |
| 11:00 AM to 11:59 AM | 715 (3.2%) | 504 (2.7%) |
| 12:00 PM to 3:59 PM | 1,412 (6.4%) | 1,463 (7.7%) |
| 4:00 PM to 11:59 PM | 1,293 (5.8%) | 1,086 (5.8%) |
| Total | 22,165 (100.0%) | 18,872 (100.0%) |
Housing Occupancy in San Leandro
Occupancy by Ownership in San Leandro
Of the total 30,468 dwellings in San Leandro, owner-occupied units account for 17,647 (57.9%), while renter-occupied units make up 12,821 (42.1%).
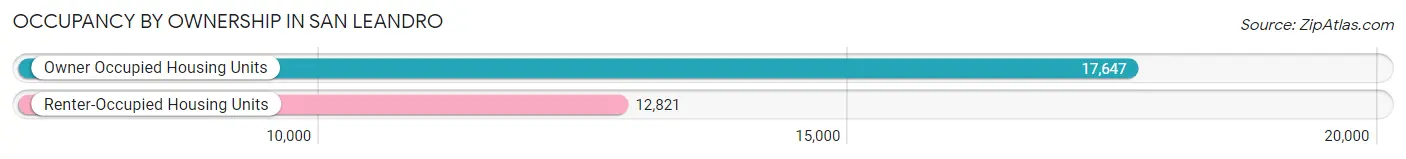
| Occupancy | # Housing Units | % Housing Units |
| Owner Occupied Housing Units | 17,647 | 57.9% |
| Renter-Occupied Housing Units | 12,821 | 42.1% |
| Total Occupied Housing Units | 30,468 | 100.0% |
Occupancy by Household Size in San Leandro
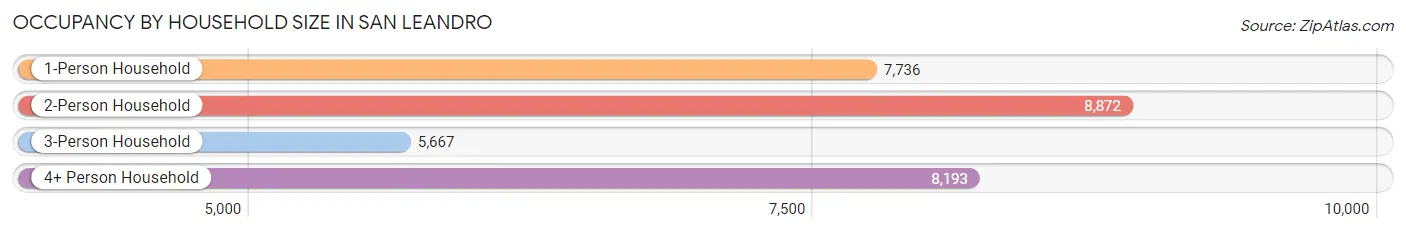
| Household Size | # Housing Units | % Housing Units |
| 1-Person Household | 7,736 | 25.4% |
| 2-Person Household | 8,872 | 29.1% |
| 3-Person Household | 5,667 | 18.6% |
| 4+ Person Household | 8,193 | 26.9% |
| Total Housing Units | 30,468 | 100.0% |
Occupancy by Ownership by Household Size in San Leandro
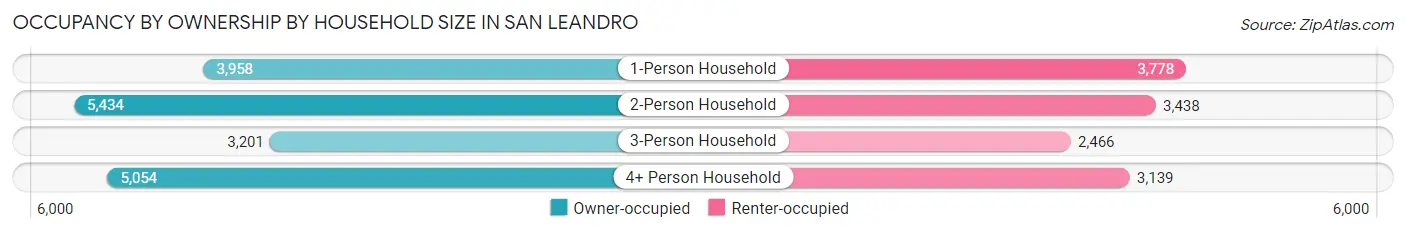
| Household Size | Owner-occupied | Renter-occupied |
| 1-Person Household | 3,958 (51.2%) | 3,778 (48.8%) |
| 2-Person Household | 5,434 (61.3%) | 3,438 (38.8%) |
| 3-Person Household | 3,201 (56.5%) | 2,466 (43.5%) |
| 4+ Person Household | 5,054 (61.7%) | 3,139 (38.3%) |
| Total Housing Units | 17,647 (57.9%) | 12,821 (42.1%) |
Occupancy by Educational Attainment in San Leandro
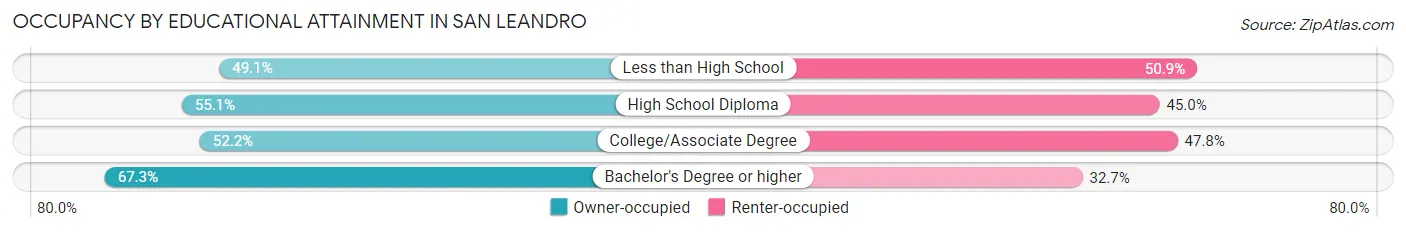
| Household Size | Owner-occupied | Renter-occupied |
| Less than High School | 1,925 (49.1%) | 1,995 (50.9%) |
| High School Diploma | 3,463 (55.0%) | 2,828 (45.0%) |
| College/Associate Degree | 4,733 (52.2%) | 4,336 (47.8%) |
| Bachelor's Degree or higher | 7,526 (67.3%) | 3,662 (32.7%) |
Occupancy by Age of Householder in San Leandro
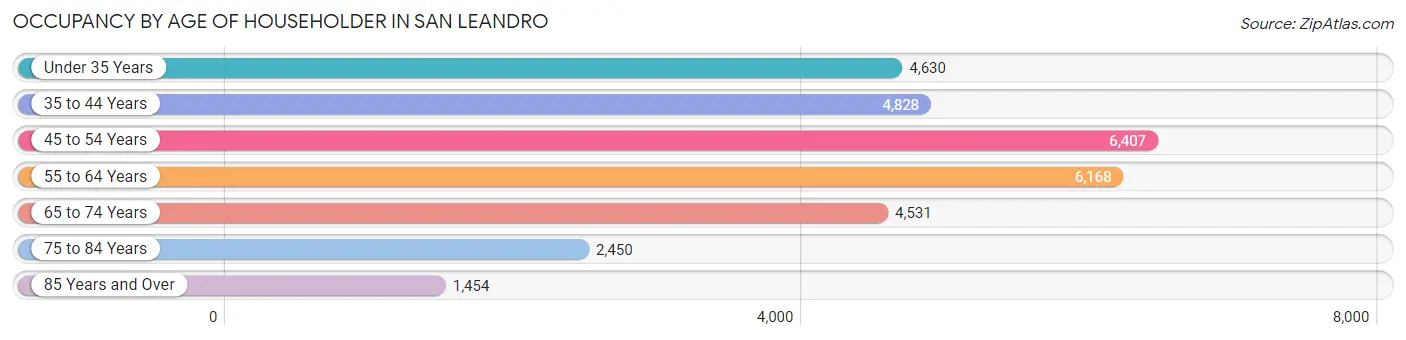
| Age Bracket | # Households | % Households |
| Under 35 Years | 4,630 | 15.2% |
| 35 to 44 Years | 4,828 | 15.9% |
| 45 to 54 Years | 6,407 | 21.0% |
| 55 to 64 Years | 6,168 | 20.2% |
| 65 to 74 Years | 4,531 | 14.9% |
| 75 to 84 Years | 2,450 | 8.0% |
| 85 Years and Over | 1,454 | 4.8% |
| Total | 30,468 | 100.0% |
Housing Finances in San Leandro
Median Income by Occupancy in San Leandro
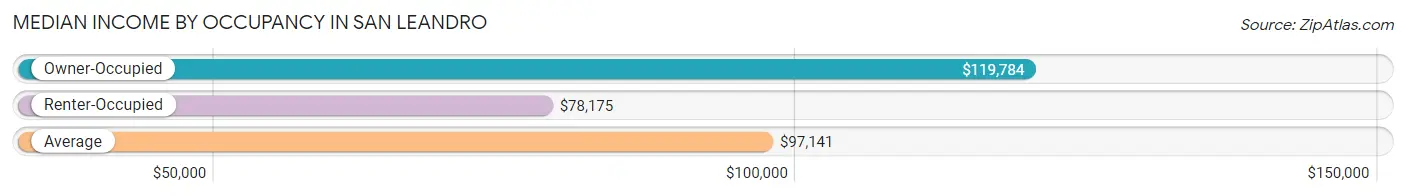
| Occupancy Type | # Households | Median Income |
| Owner-Occupied | 17,647 (57.9%) | $119,784 |
| Renter-Occupied | 12,821 (42.1%) | $78,175 |
| Average | 30,468 (100.0%) | $97,141 |
Occupancy by Householder Income Bracket in San Leandro
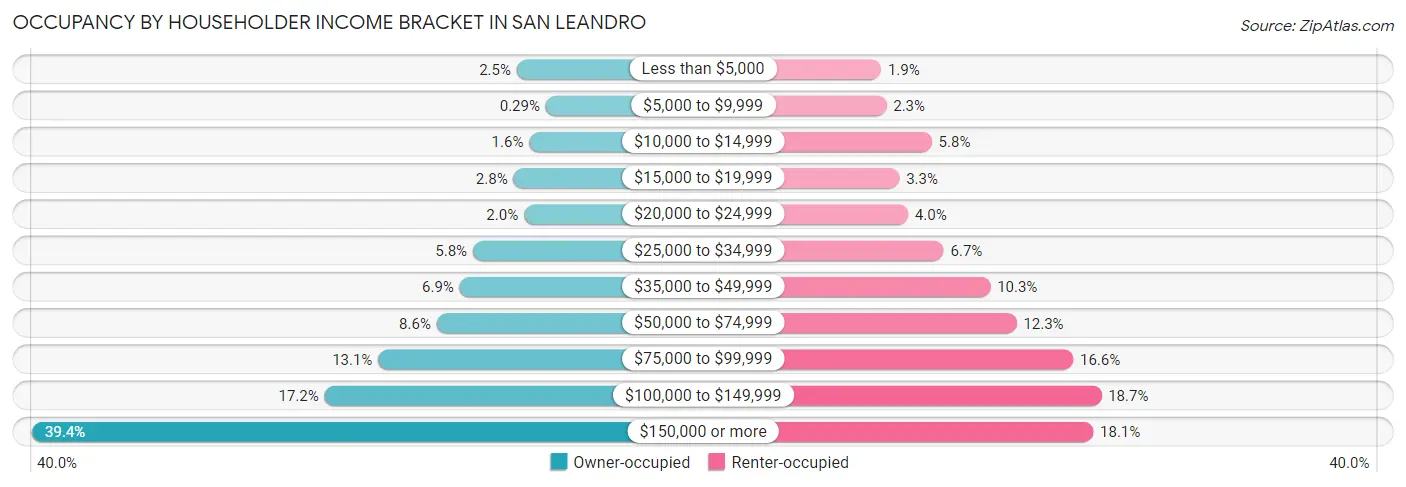
| Income Bracket | Owner-occupied | Renter-occupied |
| Less than $5,000 | 441 (2.5%) | 249 (1.9%) |
| $5,000 to $9,999 | 52 (0.3%) | 300 (2.3%) |
| $10,000 to $14,999 | 274 (1.5%) | 743 (5.8%) |
| $15,000 to $19,999 | 486 (2.8%) | 427 (3.3%) |
| $20,000 to $24,999 | 344 (1.9%) | 511 (4.0%) |
| $25,000 to $34,999 | 1,031 (5.8%) | 860 (6.7%) |
| $35,000 to $49,999 | 1,209 (6.9%) | 1,315 (10.3%) |
| $50,000 to $74,999 | 1,518 (8.6%) | 1,572 (12.3%) |
| $75,000 to $99,999 | 2,305 (13.1%) | 2,124 (16.6%) |
| $100,000 to $149,999 | 3,027 (17.2%) | 2,400 (18.7%) |
| $150,000 or more | 6,960 (39.4%) | 2,320 (18.1%) |
| Total | 17,647 (100.0%) | 12,821 (100.0%) |
Monthly Housing Cost Tiers in San Leandro
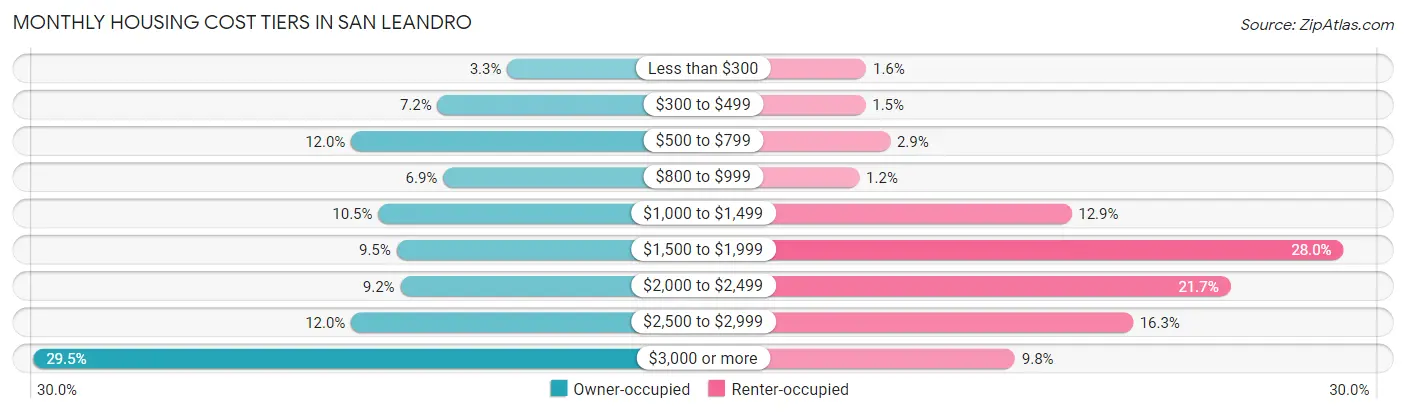
| Monthly Cost | Owner-occupied | Renter-occupied |
| Less than $300 | 590 (3.3%) | 202 (1.6%) |
| $300 to $499 | 1,268 (7.2%) | 198 (1.5%) |
| $500 to $799 | 2,111 (12.0%) | 372 (2.9%) |
| $800 to $999 | 1,214 (6.9%) | 154 (1.2%) |
| $1,000 to $1,499 | 1,846 (10.5%) | 1,657 (12.9%) |
| $1,500 to $1,999 | 1,668 (9.5%) | 3,583 (28.0%) |
| $2,000 to $2,499 | 1,630 (9.2%) | 2,783 (21.7%) |
| $2,500 to $2,999 | 2,111 (12.0%) | 2,091 (16.3%) |
| $3,000 or more | 5,209 (29.5%) | 1,256 (9.8%) |
| Total | 17,647 (100.0%) | 12,821 (100.0%) |
Physical Housing Characteristics in San Leandro
Housing Structures in San Leandro
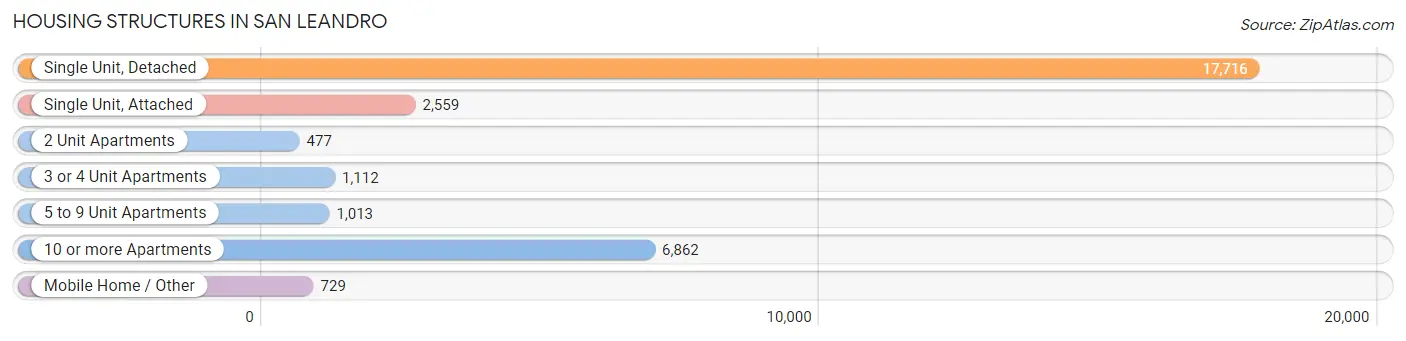
| Structure Type | # Housing Units | % Housing Units |
| Single Unit, Detached | 17,716 | 58.2% |
| Single Unit, Attached | 2,559 | 8.4% |
| 2 Unit Apartments | 477 | 1.6% |
| 3 or 4 Unit Apartments | 1,112 | 3.6% |
| 5 to 9 Unit Apartments | 1,013 | 3.3% |
| 10 or more Apartments | 6,862 | 22.5% |
| Mobile Home / Other | 729 | 2.4% |
| Total | 30,468 | 100.0% |
Housing Structures by Occupancy in San Leandro
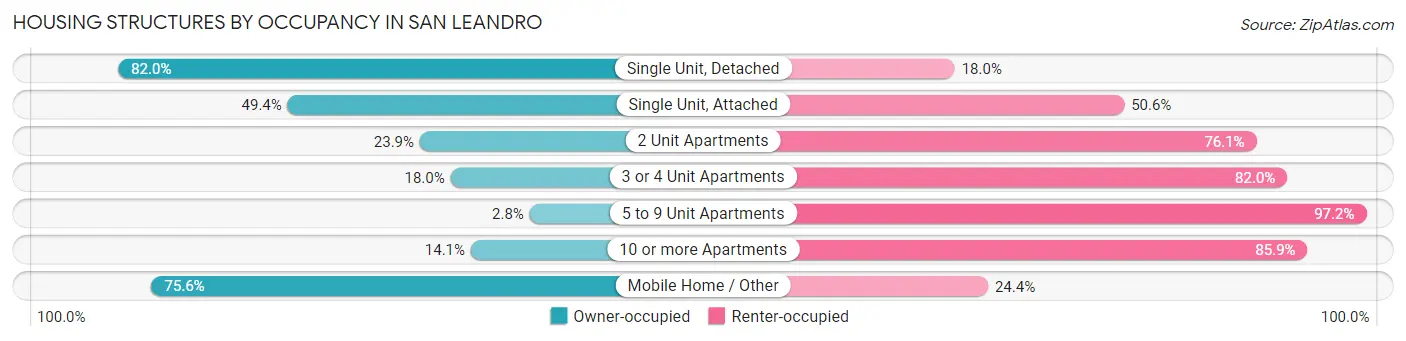
| Structure Type | Owner-occupied | Renter-occupied |
| Single Unit, Detached | 14,525 (82.0%) | 3,191 (18.0%) |
| Single Unit, Attached | 1,263 (49.4%) | 1,296 (50.6%) |
| 2 Unit Apartments | 114 (23.9%) | 363 (76.1%) |
| 3 or 4 Unit Apartments | 200 (18.0%) | 912 (82.0%) |
| 5 to 9 Unit Apartments | 28 (2.8%) | 985 (97.2%) |
| 10 or more Apartments | 966 (14.1%) | 5,896 (85.9%) |
| Mobile Home / Other | 551 (75.6%) | 178 (24.4%) |
| Total | 17,647 (57.9%) | 12,821 (42.1%) |
Housing Structures by Number of Rooms in San Leandro
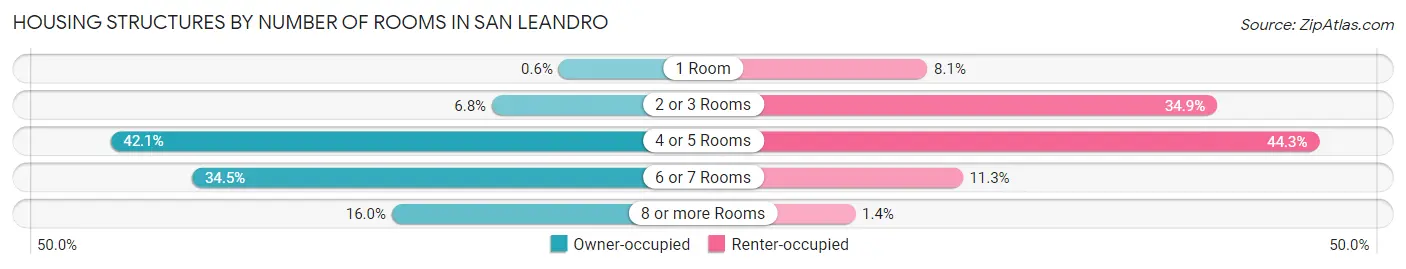
| Number of Rooms | Owner-occupied | Renter-occupied |
| 1 Room | 105 (0.6%) | 1,035 (8.1%) |
| 2 or 3 Rooms | 1,196 (6.8%) | 4,471 (34.9%) |
| 4 or 5 Rooms | 7,424 (42.1%) | 5,683 (44.3%) |
| 6 or 7 Rooms | 6,091 (34.5%) | 1,452 (11.3%) |
| 8 or more Rooms | 2,831 (16.0%) | 180 (1.4%) |
| Total | 17,647 (100.0%) | 12,821 (100.0%) |
Housing Structure by Heating Type in San Leandro
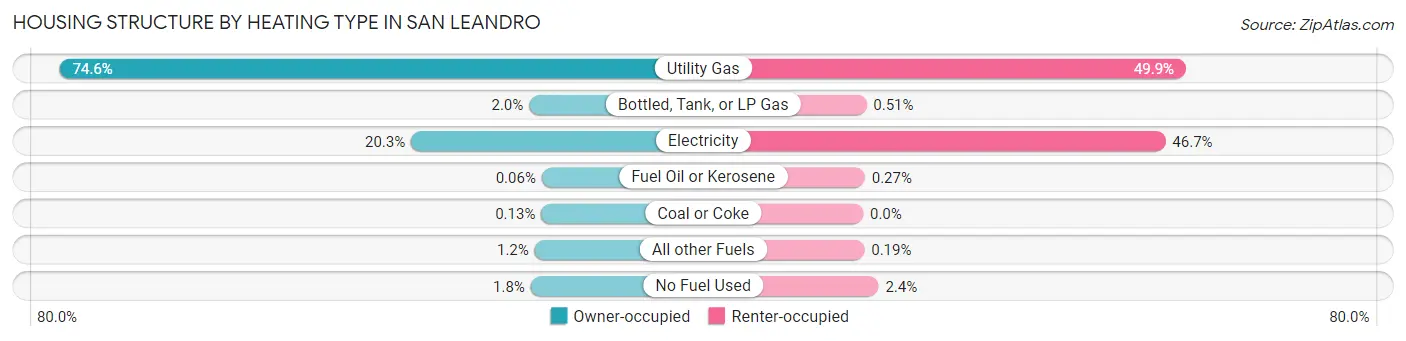
| Heating Type | Owner-occupied | Renter-occupied |
| Utility Gas | 13,167 (74.6%) | 6,399 (49.9%) |
| Bottled, Tank, or LP Gas | 355 (2.0%) | 65 (0.5%) |
| Electricity | 3,575 (20.3%) | 5,993 (46.7%) |
| Fuel Oil or Kerosene | 10 (0.1%) | 34 (0.3%) |
| Coal or Coke | 23 (0.1%) | 0 (0.0%) |
| All other Fuels | 205 (1.2%) | 25 (0.2%) |
| No Fuel Used | 312 (1.8%) | 305 (2.4%) |
| Total | 17,647 (100.0%) | 12,821 (100.0%) |
Household Vehicle Usage in San Leandro
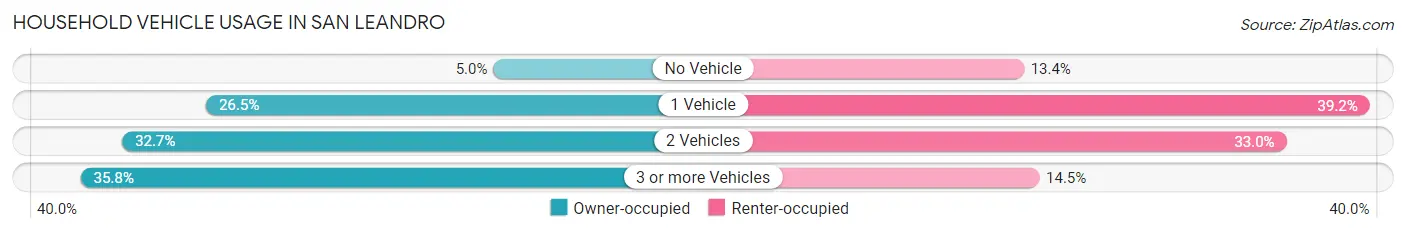
| Vehicles per Household | Owner-occupied | Renter-occupied |
| No Vehicle | 883 (5.0%) | 1,712 (13.4%) |
| 1 Vehicle | 4,668 (26.5%) | 5,023 (39.2%) |
| 2 Vehicles | 5,774 (32.7%) | 4,227 (33.0%) |
| 3 or more Vehicles | 6,322 (35.8%) | 1,859 (14.5%) |
| Total | 17,647 (100.0%) | 12,821 (100.0%) |
Real Estate & Mortgages in San Leandro
Real Estate and Mortgage Overview in San Leandro
| Characteristic | Without Mortgage | With Mortgage |
| Housing Units | 6,465 | 11,182 |
| Median Property Value | $736,300 | $791,800 |
| Median Household Income | $79,426 | $5,438 |
| Monthly Housing Costs | $733 | $5,193 |
| Real Estate Taxes | $4,220 | $159 |
Property Value by Mortgage Status in San Leandro
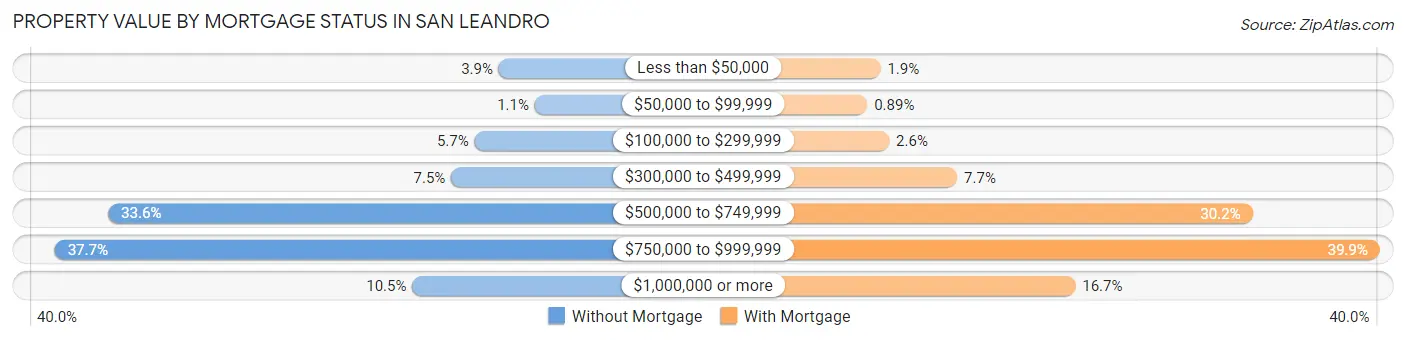
| Property Value | Without Mortgage | With Mortgage |
| Less than $50,000 | 250 (3.9%) | 212 (1.9%) |
| $50,000 to $99,999 | 73 (1.1%) | 99 (0.9%) |
| $100,000 to $299,999 | 370 (5.7%) | 286 (2.6%) |
| $300,000 to $499,999 | 485 (7.5%) | 866 (7.7%) |
| $500,000 to $749,999 | 2,174 (33.6%) | 3,381 (30.2%) |
| $750,000 to $999,999 | 2,437 (37.7%) | 4,466 (39.9%) |
| $1,000,000 or more | 676 (10.5%) | 1,872 (16.7%) |
| Total | 6,465 (100.0%) | 11,182 (100.0%) |
Household Income by Mortgage Status in San Leandro
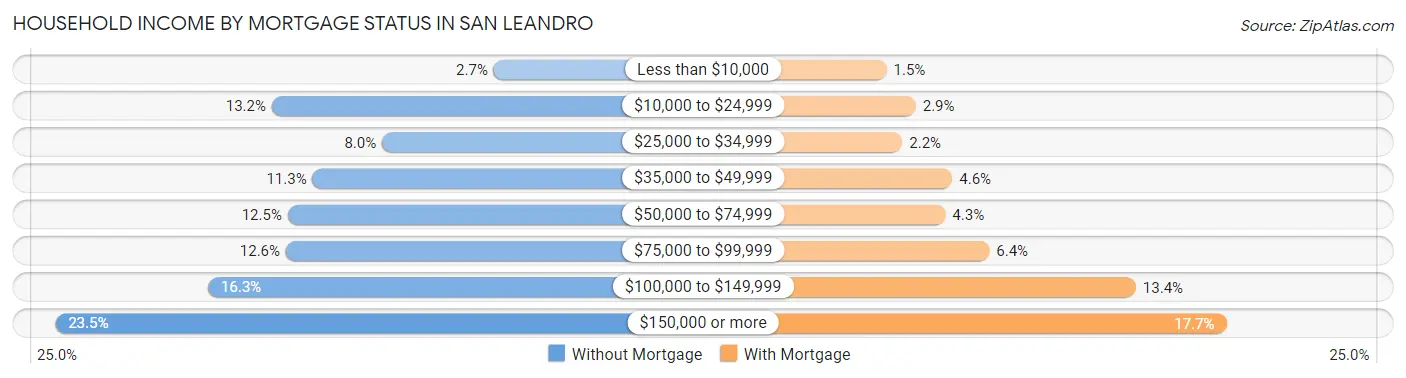
| Household Income | Without Mortgage | With Mortgage |
| Less than $10,000 | 172 (2.7%) | 166 (1.5%) |
| $10,000 to $24,999 | 855 (13.2%) | 321 (2.9%) |
| $25,000 to $34,999 | 516 (8.0%) | 249 (2.2%) |
| $35,000 to $49,999 | 730 (11.3%) | 515 (4.6%) |
| $50,000 to $74,999 | 806 (12.5%) | 479 (4.3%) |
| $75,000 to $99,999 | 812 (12.6%) | 712 (6.4%) |
| $100,000 to $149,999 | 1,052 (16.3%) | 1,493 (13.4%) |
| $150,000 or more | 1,522 (23.5%) | 1,975 (17.7%) |
| Total | 6,465 (100.0%) | 11,182 (100.0%) |
Property Value to Household Income Ratio in San Leandro
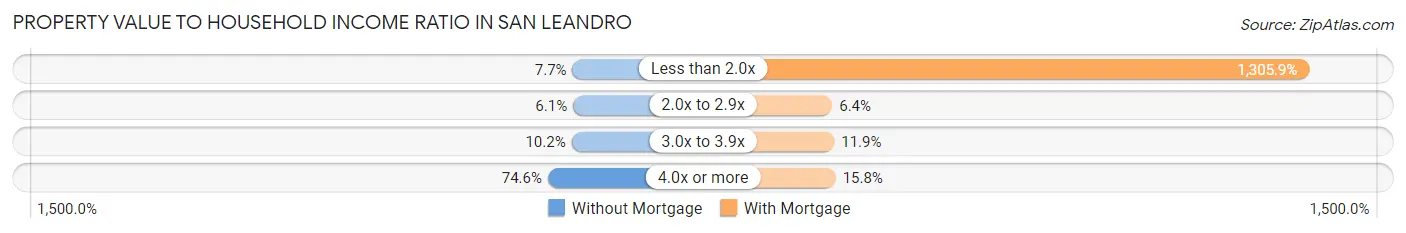
| Value-to-Income Ratio | Without Mortgage | With Mortgage |
| Less than 2.0x | 496 (7.7%) | 146,021 (1,305.9%) |
| 2.0x to 2.9x | 396 (6.1%) | 717 (6.4%) |
| 3.0x to 3.9x | 658 (10.2%) | 1,330 (11.9%) |
| 4.0x or more | 4,824 (74.6%) | 1,766 (15.8%) |
| Total | 6,465 (100.0%) | 11,182 (100.0%) |
Real Estate Taxes by Mortgage Status in San Leandro
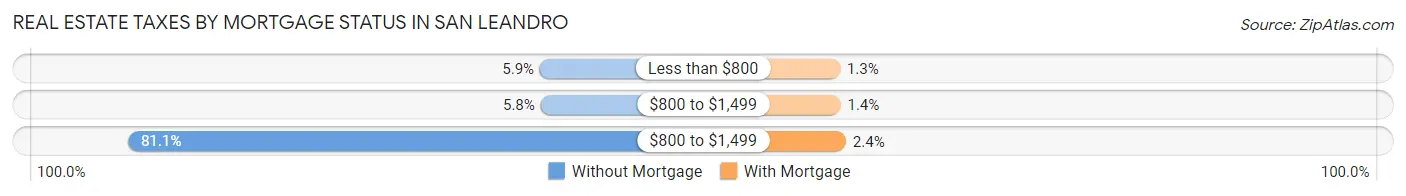
| Property Taxes | Without Mortgage | With Mortgage |
| Less than $800 | 380 (5.9%) | 141 (1.3%) |
| $800 to $1,499 | 372 (5.8%) | 153 (1.4%) |
| $800 to $1,499 | 5,244 (81.1%) | 263 (2.4%) |
| Total | 6,465 (100.0%) | 11,182 (100.0%) |
Health & Disability in San Leandro
Health Insurance Coverage by Age in San Leandro
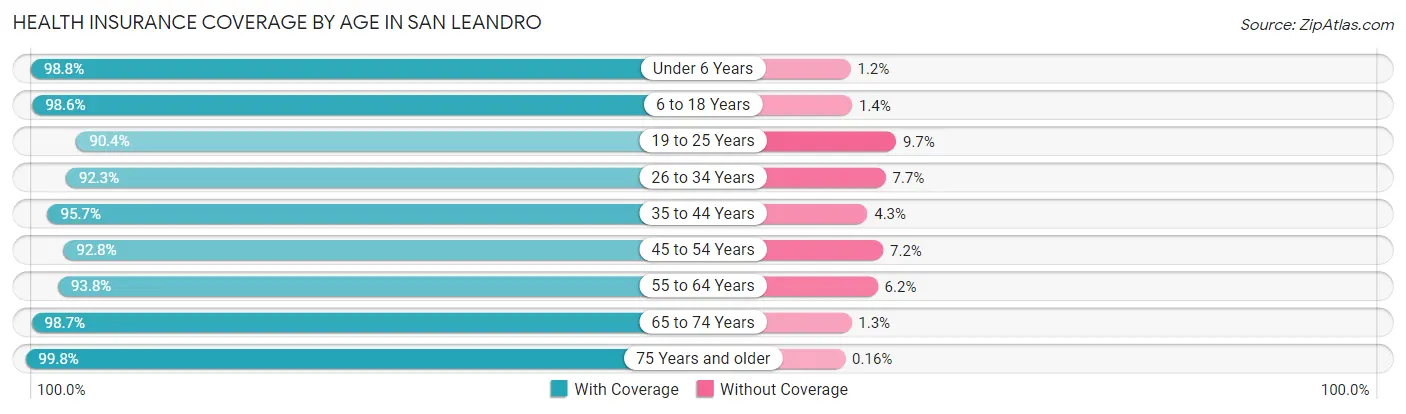
| Age Bracket | With Coverage | Without Coverage |
| Under 6 Years | 4,352 (98.8%) | 51 (1.2%) |
| 6 to 18 Years | 12,180 (98.6%) | 177 (1.4%) |
| 19 to 25 Years | 7,162 (90.3%) | 765 (9.7%) |
| 26 to 34 Years | 10,639 (92.3%) | 886 (7.7%) |
| 35 to 44 Years | 11,489 (95.7%) | 515 (4.3%) |
| 45 to 54 Years | 11,958 (92.8%) | 934 (7.2%) |
| 55 to 64 Years | 11,943 (93.8%) | 792 (6.2%) |
| 65 to 74 Years | 8,471 (98.7%) | 113 (1.3%) |
| 75 Years and older | 6,945 (99.8%) | 11 (0.2%) |
| Total | 85,139 (95.3%) | 4,244 (4.8%) |
Health Insurance Coverage by Citizenship Status in San Leandro
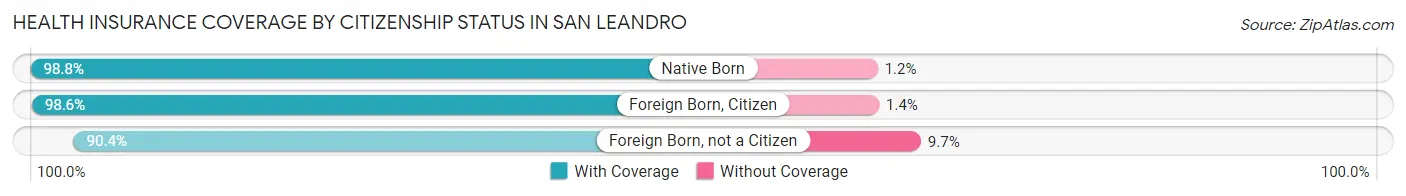
| Citizenship Status | With Coverage | Without Coverage |
| Native Born | 4,352 (98.8%) | 51 (1.2%) |
| Foreign Born, Citizen | 12,180 (98.6%) | 177 (1.4%) |
| Foreign Born, not a Citizen | 7,162 (90.3%) | 765 (9.7%) |
Health Insurance Coverage by Household Income in San Leandro
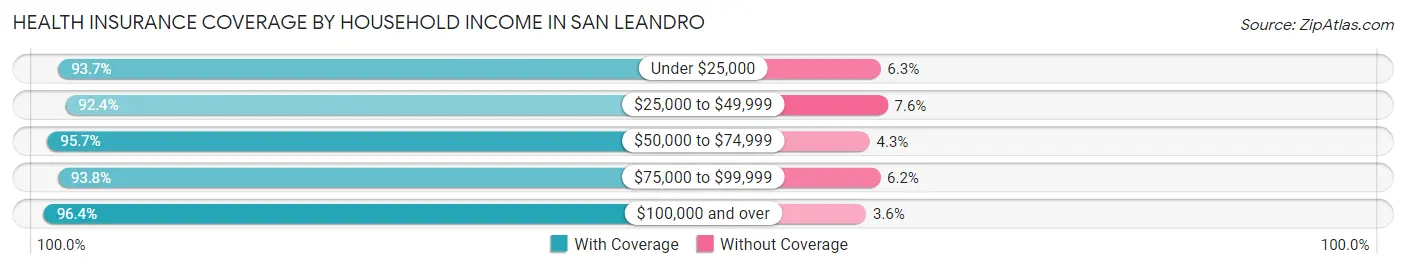
| Household Income | With Coverage | Without Coverage |
| Under $25,000 | 5,621 (93.7%) | 378 (6.3%) |
| $25,000 to $49,999 | 9,295 (92.4%) | 769 (7.6%) |
| $50,000 to $74,999 | 7,770 (95.7%) | 347 (4.3%) |
| $75,000 to $99,999 | 12,229 (93.8%) | 814 (6.2%) |
| $100,000 and over | 49,895 (96.4%) | 1,858 (3.6%) |
Public vs Private Health Insurance Coverage by Age in San Leandro
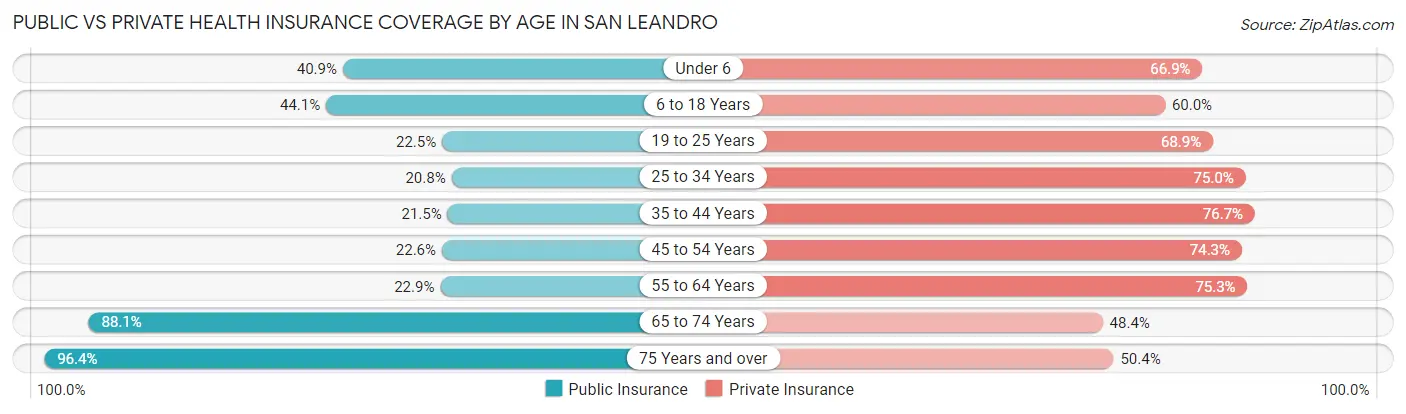
| Age Bracket | Public Insurance | Private Insurance |
| Under 6 | 1,802 (40.9%) | 2,947 (66.9%) |
| 6 to 18 Years | 5,443 (44.1%) | 7,412 (60.0%) |
| 19 to 25 Years | 1,784 (22.5%) | 5,462 (68.9%) |
| 25 to 34 Years | 2,393 (20.8%) | 8,639 (75.0%) |
| 35 to 44 Years | 2,581 (21.5%) | 9,204 (76.7%) |
| 45 to 54 Years | 2,907 (22.6%) | 9,572 (74.3%) |
| 55 to 64 Years | 2,910 (22.9%) | 9,588 (75.3%) |
| 65 to 74 Years | 7,566 (88.1%) | 4,156 (48.4%) |
| 75 Years and over | 6,703 (96.4%) | 3,508 (50.4%) |
| Total | 34,089 (38.1%) | 60,488 (67.7%) |
Disability Status by Sex by Age in San Leandro
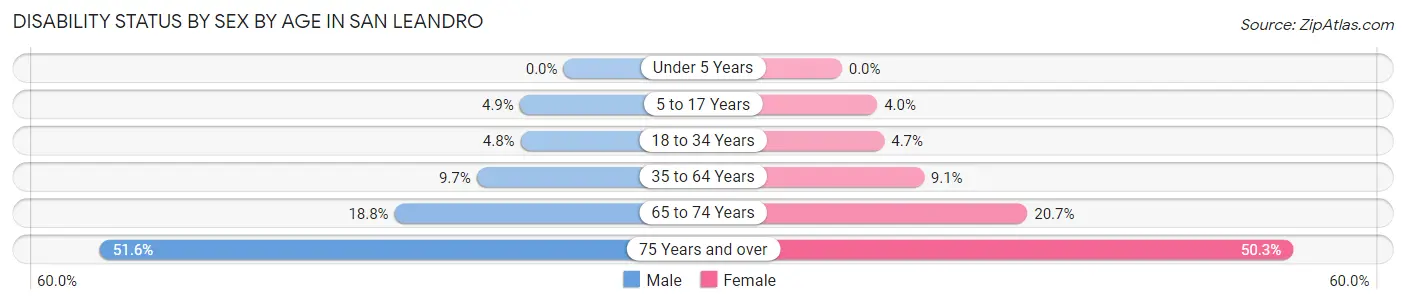
| Age Bracket | Male | Female |
| Under 5 Years | 0 (0.0%) | 0 (0.0%) |
| 5 to 17 Years | 308 (4.9%) | 215 (4.0%) |
| 18 to 34 Years | 503 (4.8%) | 489 (4.7%) |
| 35 to 64 Years | 1,794 (9.7%) | 1,745 (9.1%) |
| 65 to 74 Years | 818 (18.8%) | 875 (20.7%) |
| 75 Years and over | 1,503 (51.6%) | 2,032 (50.2%) |
Disability Class by Sex by Age in San Leandro
Disability Class: Hearing Difficulty
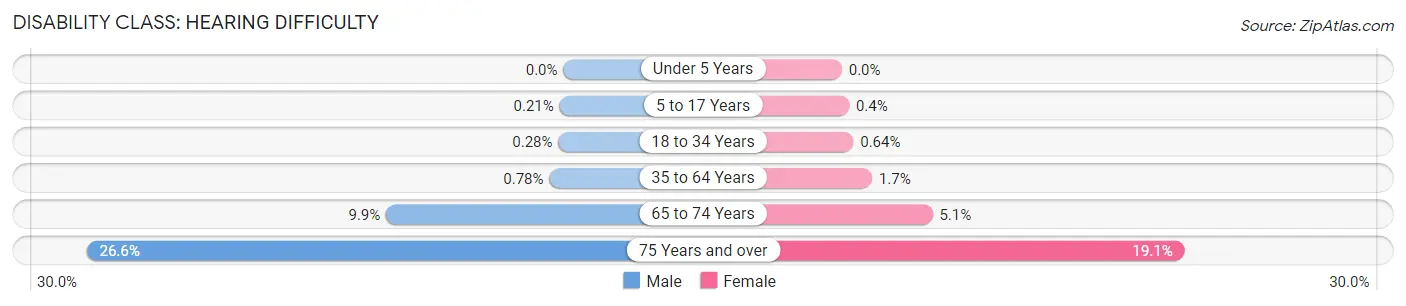
| Age Bracket | Male | Female |
| Under 5 Years | 0 (0.0%) | 0 (0.0%) |
| 5 to 17 Years | 13 (0.2%) | 22 (0.4%) |
| 18 to 34 Years | 29 (0.3%) | 66 (0.6%) |
| 35 to 64 Years | 145 (0.8%) | 320 (1.7%) |
| 65 to 74 Years | 429 (9.9%) | 214 (5.1%) |
| 75 Years and over | 773 (26.6%) | 772 (19.1%) |
Disability Class: Vision Difficulty
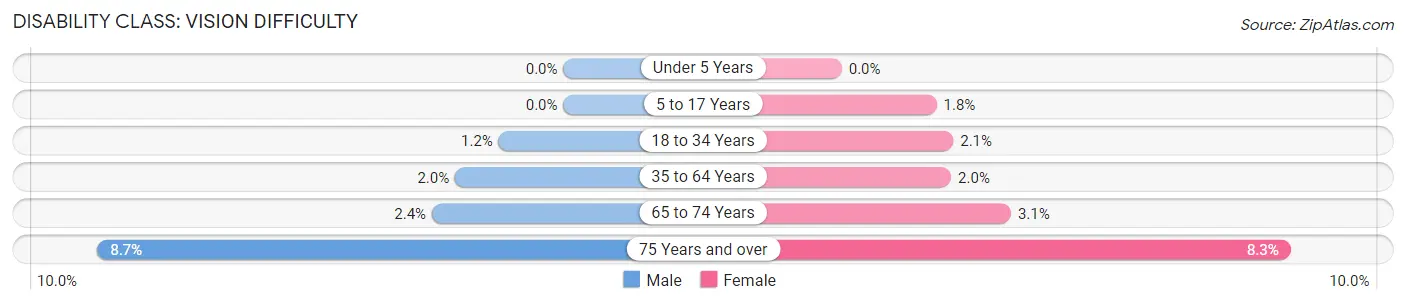
| Age Bracket | Male | Female |
| Under 5 Years | 0 (0.0%) | 0 (0.0%) |
| 5 to 17 Years | 0 (0.0%) | 96 (1.8%) |
| 18 to 34 Years | 126 (1.2%) | 214 (2.1%) |
| 35 to 64 Years | 372 (2.0%) | 387 (2.0%) |
| 65 to 74 Years | 106 (2.4%) | 133 (3.1%) |
| 75 Years and over | 252 (8.6%) | 337 (8.3%) |
Disability Class: Cognitive Difficulty
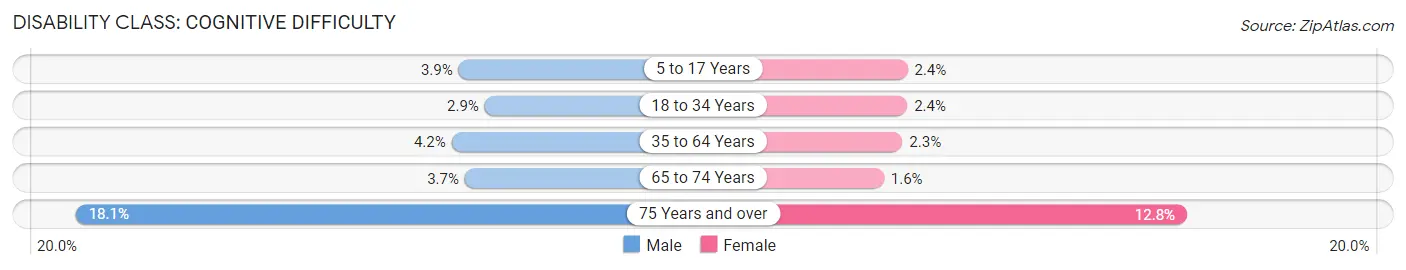
| Age Bracket | Male | Female |
| 5 to 17 Years | 246 (3.9%) | 133 (2.4%) |
| 18 to 34 Years | 307 (2.9%) | 251 (2.4%) |
| 35 to 64 Years | 770 (4.2%) | 430 (2.2%) |
| 65 to 74 Years | 159 (3.7%) | 66 (1.6%) |
| 75 Years and over | 527 (18.1%) | 518 (12.8%) |
Disability Class: Ambulatory Difficulty
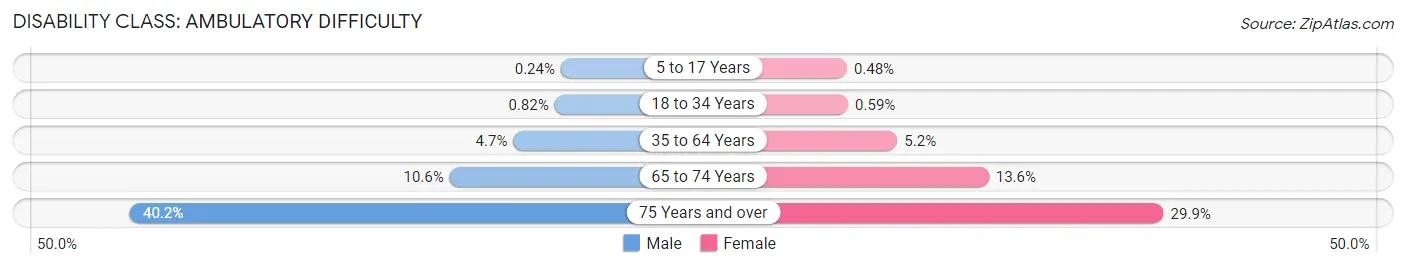
| Age Bracket | Male | Female |
| 5 to 17 Years | 15 (0.2%) | 26 (0.5%) |
| 18 to 34 Years | 86 (0.8%) | 61 (0.6%) |
| 35 to 64 Years | 862 (4.6%) | 984 (5.2%) |
| 65 to 74 Years | 459 (10.6%) | 578 (13.6%) |
| 75 Years and over | 1,171 (40.2%) | 1,208 (29.9%) |
Disability Class: Self-Care Difficulty
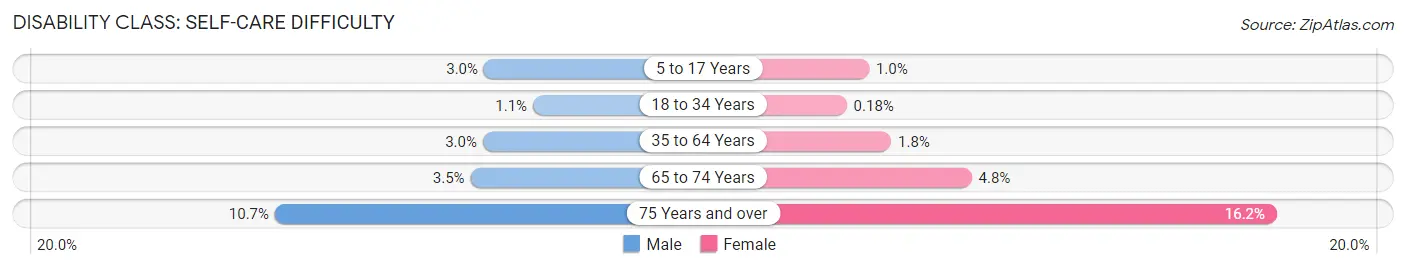
| Age Bracket | Male | Female |
| 5 to 17 Years | 187 (2.9%) | 55 (1.0%) |
| 18 to 34 Years | 119 (1.1%) | 19 (0.2%) |
| 35 to 64 Years | 554 (3.0%) | 350 (1.8%) |
| 65 to 74 Years | 150 (3.5%) | 204 (4.8%) |
| 75 Years and over | 312 (10.7%) | 653 (16.2%) |
Technology Access in San Leandro
Computing Device Access in San Leandro
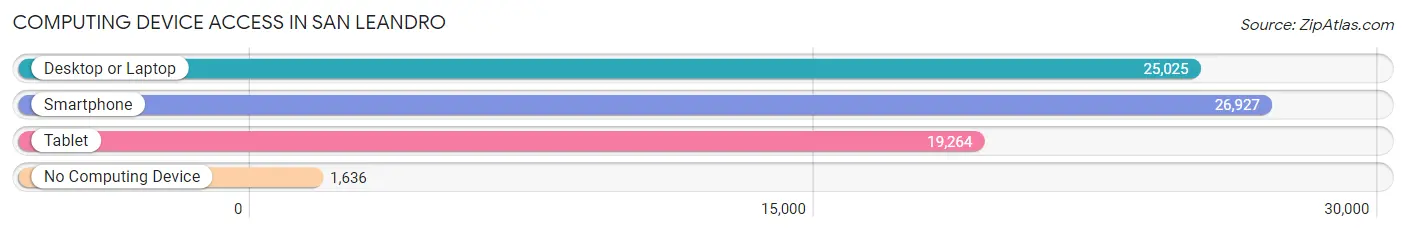
| Device Type | # Households | % Households |
| Desktop or Laptop | 25,025 | 82.1% |
| Smartphone | 26,927 | 88.4% |
| Tablet | 19,264 | 63.2% |
| No Computing Device | 1,636 | 5.4% |
| Total | 30,468 | 100.0% |
Internet Access in San Leandro
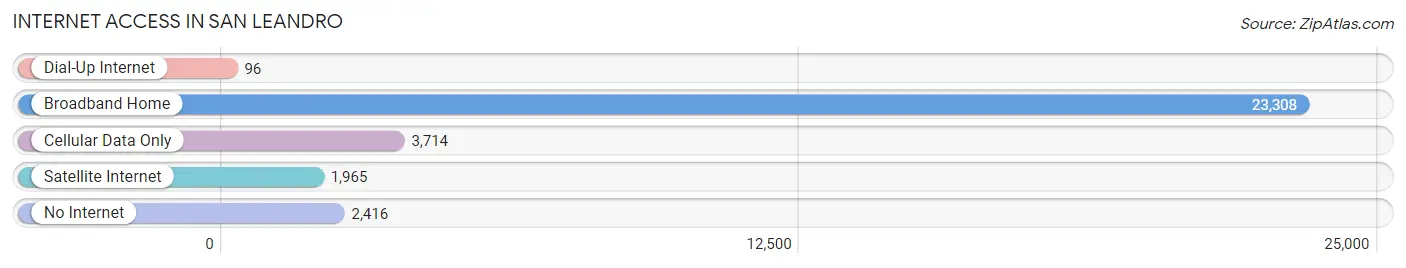
| Internet Type | # Households | % Households |
| Dial-Up Internet | 96 | 0.3% |
| Broadband Home | 23,308 | 76.5% |
| Cellular Data Only | 3,714 | 12.2% |
| Satellite Internet | 1,965 | 6.5% |
| No Internet | 2,416 | 7.9% |
| Total | 30,468 | 100.0% |
San Leandro Summary
San Leandro is a city located in Alameda County, California, United States. It is situated along the eastern shore of San Francisco Bay, between Oakland and Hayward. As of the 2010 census, the city had a population of 84,950. It is the largest city in the East Bay region of the San Francisco Bay Area, and the fifth most populous city in the Bay Area.
History
San Leandro was first inhabited by the Ohlone people, who lived in the area for thousands of years. The first European settlers arrived in the area in the late 1700s, and the city was officially incorporated in 1872.
The city was originally known as the "Town of San Leandro," and was a major agricultural center for the region. The city was also home to a number of industries, including the San Leandro Brick Company, which produced bricks for many of the buildings in the city.
In the 1950s, San Leandro began to experience a population boom, as many people moved to the city from other parts of the Bay Area. This growth continued into the 1960s and 1970s, and the city's population more than doubled during this time.
Geography
San Leandro is located in the East Bay region of the San Francisco Bay Area, and is situated along the eastern shore of San Francisco Bay. The city covers an area of 14.9 square miles, and is bordered by Oakland to the north, Hayward to the south, and Castro Valley to the east.
The city is located at an elevation of 39 feet above sea level, and is located in a Mediterranean climate zone. The city experiences mild winters and warm summers, with temperatures rarely dropping below freezing.
Economy
San Leandro is home to a number of major employers, including Kaiser Permanente, Safeway, and the San Leandro Unified School District. The city is also home to a number of smaller businesses, including a number of restaurants, retail stores, and manufacturing companies.
The city is also home to a number of industrial parks, which are home to a number of technology and manufacturing companies. The city is also home to a number of shopping centers, including Bayfair Mall and the San Leandro Marketplace.
Demographics
As of the 2010 census, the city had a population of 84,950. The racial makeup of the city was 44.3% White, 24.3% African American, 0.7% Native American, 16.2% Asian, 0.4% Pacific Islander, 8.2% from other races, and 5.1% from two or more races. Hispanic or Latino of any race were 20.2% of the population.
The median household income in the city was $63,837, and the median family income was $72,945. The per capita income in the city was $27,845. About 11.3% of the population was below the poverty line.
Common Questions
What is Per Capita Income in San Leandro?
Per Capita income in San Leandro is $45,010.
What is the Median Family Income in San Leandro?
Median Family Income in San Leandro is $113,594.
What is the Median Household income in San Leandro?
Median Household Income in San Leandro is $97,141.
What is Income or Wage Gap in San Leandro?
Income or Wage Gap in San Leandro is 13.3%.
Women in San Leandro earn 86.7 cents for every dollar earned by a man.
What is Family Income Deficit in San Leandro?
Family Income Deficit in San Leandro is $11,822.
Families that are below poverty line in San Leandro earn $11,822 less on average than the poverty threshold level.
What is Inequality or Gini Index in San Leandro?
Inequality or Gini Index in San Leandro is 0.44.
What is the Total Population of San Leandro?
Total Population of San Leandro is 89,723.
What is the Total Male Population of San Leandro?
Total Male Population of San Leandro is 44,511.
What is the Total Female Population of San Leandro?
Total Female Population of San Leandro is 45,212.
What is the Ratio of Males per 100 Females in San Leandro?
There are 98.45 Males per 100 Females in San Leandro.
What is the Ratio of Females per 100 Males in San Leandro?
There are 101.57 Females per 100 Males in San Leandro.
What is the Median Population Age in San Leandro?
Median Population Age in San Leandro is 41.5 Years.
What is the Average Family Size in San Leandro
Average Family Size in San Leandro is 3.5 People.
What is the Average Household Size in San Leandro
Average Household Size in San Leandro is 2.9 People.
How Large is the Labor Force in San Leandro?
There are 50,454 People in the Labor Forcein in San Leandro.
What is the Percentage of People in the Labor Force in San Leandro?
65.9% of People are in the Labor Force in San Leandro.
What is the Unemployment Rate in San Leandro?
Unemployment Rate in San Leandro is 5.0%.