Cities with the Lowest Percentage of Births to Unmarried Women over the Age of 35 in New York
RELATED REPORTS & OPTIONS
Lowest Illegitimacy | Women 35+
New York
Compare Cities
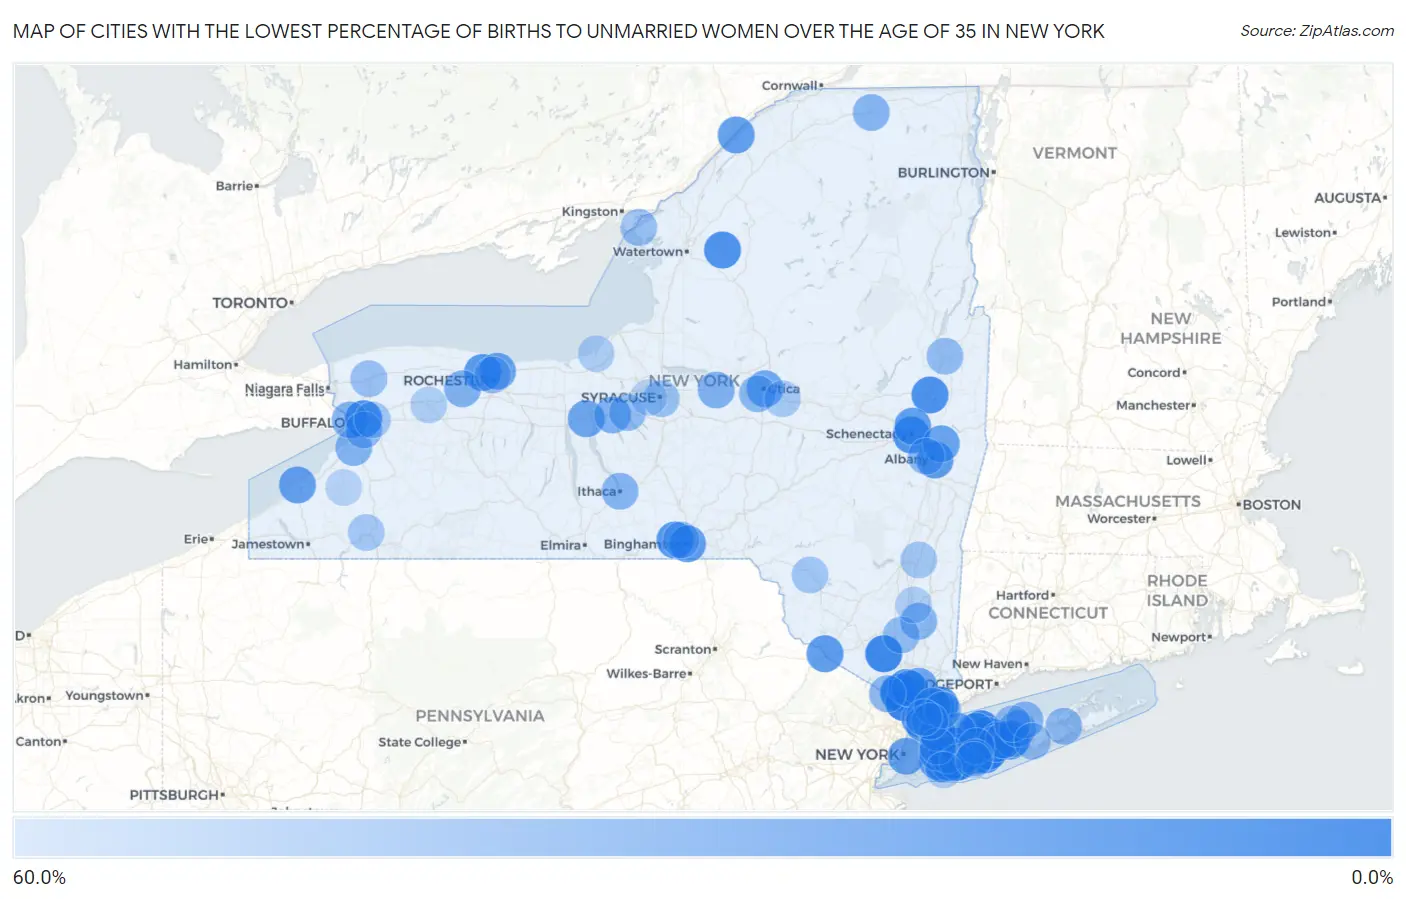
Map of Cities with the Lowest Percentage of Births to Unmarried Women over the Age of 35 in New York
60.0%
0.0%
Cities with the Lowest Percentage of Births to Unmarried Women over the Age of 35 in New York
| City | % Unmarried | vs State | vs National | |
| 1. | Spring Valley | 2.7% | 18.7%(-16.0)#1 | 20.1%(-17.4)#45 |
| 2. | Merrick | 3.4% | 18.7%(-15.3)#2 | 20.1%(-16.7)#59 |
| 3. | Pearl River | 4.3% | 18.7%(-14.4)#3 | 20.1%(-15.8)#85 |
| 4. | South Blooming Grove | 4.8% | 18.7%(-13.9)#4 | 20.1%(-15.3)#112 |
| 5. | Hicksville | 5.4% | 18.7%(-13.3)#5 | 20.1%(-14.7)#137 |
| 6. | East Northport | 6.4% | 18.7%(-12.3)#6 | 20.1%(-13.7)#180 |
| 7. | West Babylon | 7.1% | 18.7%(-11.6)#7 | 20.1%(-13.0)#213 |
| 8. | Hauppauge | 8.6% | 18.7%(-10.1)#8 | 20.1%(-11.5)#284 |
| 9. | Saratoga Springs | 10.5% | 18.7%(-8.20)#9 | 20.1%(-9.60)#370 |
| 10. | Cheektowaga | 11.3% | 18.7%(-7.40)#10 | 20.1%(-8.80)#397 |
| 11. | Rye Brook | 11.3% | 18.7%(-7.40)#11 | 20.1%(-8.80)#402 |
| 12. | Carthage | 11.3% | 18.7%(-7.40)#12 | 20.1%(-8.80)#403 |
| 13. | Harrison | 12.4% | 18.7%(-6.30)#13 | 20.1%(-7.70)#457 |
| 14. | Schenectady | 12.8% | 18.7%(-5.90)#14 | 20.1%(-7.30)#476 |
| 15. | Mineola | 12.8% | 18.7%(-5.90)#15 | 20.1%(-7.30)#482 |
| 16. | West Islip | 14.0% | 18.7%(-4.70)#16 | 20.1%(-6.10)#552 |
| 17. | Endwell | 14.6% | 18.7%(-4.10)#17 | 20.1%(-5.50)#592 |
| 18. | Yonkers | 14.7% | 18.7%(-4.00)#18 | 20.1%(-5.40)#593 |
| 19. | Bay Shore | 14.8% | 18.7%(-3.90)#19 | 20.1%(-5.30)#607 |
| 20. | Greece | 15.4% | 18.7%(-3.30)#20 | 20.1%(-4.70)#642 |
| 21. | Munsey Park | 15.4% | 18.7%(-3.30)#21 | 20.1%(-4.70)#643 |
| 22. | Uniondale | 16.2% | 18.7%(-2.50)#22 | 20.1%(-3.90)#687 |
| 23. | Commack | 16.3% | 18.7%(-2.40)#23 | 20.1%(-3.80)#695 |
| 24. | Rensselaer | 16.4% | 18.7%(-2.30)#24 | 20.1%(-3.70)#700 |
| 25. | Mount Vernon | 16.7% | 18.7%(-2.00)#25 | 20.1%(-3.40)#706 |
| 26. | Valley Stream | 17.2% | 18.7%(-1.50)#26 | 20.1%(-2.90)#739 |
| 27. | Greenlawn | 17.3% | 18.7%(-1.40)#27 | 20.1%(-2.80)#749 |
| 28. | Wantagh | 17.6% | 18.7%(-1.10)#28 | 20.1%(-2.50)#762 |
| 29. | Port Jervis | 17.6% | 18.7%(-1.10)#29 | 20.1%(-2.50)#763 |
| 30. | New City | 18.0% | 18.7%(-0.700)#30 | 20.1%(-2.10)#784 |
| 31. | New Cassel | 18.2% | 18.7%(-0.500)#31 | 20.1%(-1.90)#793 |
| 32. | Islandia | 18.2% | 18.7%(-0.500)#32 | 20.1%(-1.90)#797 |
| 33. | Binghamton | 18.5% | 18.7%(-0.200)#33 | 20.1%(-1.60)#808 |
| 34. | Holbrook | 18.6% | 18.7%(-0.100)#34 | 20.1%(-1.50)#817 |
| 35. | South Farmingdale | 18.8% | 18.7%(+0.100)#35 | 20.1%(-1.30)#828 |
| 36. | East Glenville | 18.8% | 18.7%(+0.100)#36 | 20.1%(-1.30)#829 |
| 37. | Ogdensburg | 18.9% | 18.7%(+0.200)#37 | 20.1%(-1.20)#830 |
| 38. | Central Islip | 20.0% | 18.7%(+1.30)#38 | 20.1%(-0.100)#872 |
| 39. | New York | 20.6% | 18.7%(+1.90)#39 | 20.1%(+0.500)#904 |
| 40. | Dunkirk | 20.6% | 18.7%(+1.90)#40 | 20.1%(+0.500)#909 |
| 41. | Irondequoit | 21.5% | 18.7%(+2.80)#41 | 20.1%(+1.40)#956 |
| 42. | Troy | 21.9% | 18.7%(+3.20)#42 | 20.1%(+1.80)#976 |
| 43. | East Meadow | 22.0% | 18.7%(+3.30)#43 | 20.1%(+1.90)#980 |
| 44. | Oyster Bay | 22.0% | 18.7%(+3.30)#44 | 20.1%(+1.90)#984 |
| 45. | East Rockaway | 22.4% | 18.7%(+3.70)#45 | 20.1%(+2.30)#1,004 |
| 46. | Baldwin | 22.5% | 18.7%(+3.80)#46 | 20.1%(+2.40)#1,006 |
| 47. | Ossining | 23.1% | 18.7%(+4.40)#47 | 20.1%(+3.00)#1,025 |
| 48. | Seneca Falls | 23.6% | 18.7%(+4.90)#48 | 20.1%(+3.50)#1,056 |
| 49. | Floral Park | 23.7% | 18.7%(+5.00)#49 | 20.1%(+3.60)#1,060 |
| 50. | Hempstead | 24.8% | 18.7%(+6.10)#50 | 20.1%(+4.70)#1,099 |
| 51. | Sands Point | 25.0% | 18.7%(+6.30)#51 | 20.1%(+4.90)#1,112 |
| 52. | Utica | 25.5% | 18.7%(+6.80)#52 | 20.1%(+5.40)#1,129 |
| 53. | Congers | 25.6% | 18.7%(+6.90)#53 | 20.1%(+5.50)#1,136 |
| 54. | Holtsville | 26.0% | 18.7%(+7.30)#54 | 20.1%(+5.90)#1,159 |
| 55. | White Plains | 27.6% | 18.7%(+8.90)#55 | 20.1%(+7.50)#1,229 |
| 56. | Ronkonkoma | 28.0% | 18.7%(+9.30)#56 | 20.1%(+7.90)#1,244 |
| 57. | Auburn | 30.8% | 18.7%(+12.1)#57 | 20.1%(+10.7)#1,371 |
| 58. | Churchville | 31.3% | 18.7%(+12.6)#58 | 20.1%(+11.2)#1,395 |
| 59. | Oneida | 31.5% | 18.7%(+12.8)#59 | 20.1%(+11.4)#1,402 |
| 60. | Hamburg | 32.1% | 18.7%(+13.4)#60 | 20.1%(+12.0)#1,424 |
| 61. | Buffalo | 32.2% | 18.7%(+13.5)#61 | 20.1%(+12.1)#1,426 |
| 62. | Coram | 32.2% | 18.7%(+13.5)#62 | 20.1%(+12.1)#1,427 |
| 63. | Ithaca | 33.3% | 18.7%(+14.6)#63 | 20.1%(+13.2)#1,460 |
| 64. | Rocky Point | 33.3% | 18.7%(+14.6)#64 | 20.1%(+13.2)#1,466 |
| 65. | Suffern | 33.3% | 18.7%(+14.6)#65 | 20.1%(+13.2)#1,469 |
| 66. | Myers Corner | 33.3% | 18.7%(+14.6)#66 | 20.1%(+13.2)#1,470 |
| 67. | Malone | 33.3% | 18.7%(+14.6)#67 | 20.1%(+13.2)#1,480 |
| 68. | Bellmore | 34.2% | 18.7%(+15.5)#68 | 20.1%(+14.1)#1,530 |
| 69. | Port Chester | 34.7% | 18.7%(+16.0)#69 | 20.1%(+14.6)#1,548 |
| 70. | New Hartford | 34.8% | 18.7%(+16.1)#70 | 20.1%(+14.7)#1,554 |
| 71. | Albany | 34.9% | 18.7%(+16.2)#71 | 20.1%(+14.8)#1,556 |
| 72. | West Seneca | 35.8% | 18.7%(+17.1)#72 | 20.1%(+15.7)#1,595 |
| 73. | Flanders | 36.0% | 18.7%(+17.3)#73 | 20.1%(+15.9)#1,606 |
| 74. | Wheatley Heights | 36.0% | 18.7%(+17.3)#74 | 20.1%(+15.9)#1,607 |
| 75. | Newburgh | 37.5% | 18.7%(+18.8)#75 | 20.1%(+17.4)#1,651 |
| 76. | Lake Success | 37.5% | 18.7%(+18.8)#76 | 20.1%(+17.4)#1,657 |
| 77. | Glens Falls | 37.7% | 18.7%(+19.0)#77 | 20.1%(+17.6)#1,668 |
| 78. | Skaneateles | 38.1% | 18.7%(+19.4)#78 | 20.1%(+18.0)#1,689 |
| 79. | Lockport | 40.0% | 18.7%(+21.3)#79 | 20.1%(+19.9)#1,736 |
| 80. | Terryville | 40.0% | 18.7%(+21.3)#80 | 20.1%(+19.9)#1,743 |
| 81. | Cape Vincent | 40.0% | 18.7%(+21.3)#81 | 20.1%(+19.9)#1,757 |
| 82. | Rochester | 40.1% | 18.7%(+21.4)#82 | 20.1%(+20.0)#1,763 |
| 83. | Shirley | 40.4% | 18.7%(+21.7)#83 | 20.1%(+20.3)#1,768 |
| 84. | Lindenhurst | 40.8% | 18.7%(+22.1)#84 | 20.1%(+20.7)#1,779 |
| 85. | Syracuse | 41.2% | 18.7%(+22.5)#85 | 20.1%(+21.1)#1,786 |
| 86. | Johnson City | 41.7% | 18.7%(+23.0)#86 | 20.1%(+21.6)#1,804 |
| 87. | New Rochelle | 42.2% | 18.7%(+23.5)#87 | 20.1%(+22.1)#1,814 |
| 88. | Livingston Manor | 43.8% | 18.7%(+25.1)#88 | 20.1%(+23.7)#1,866 |
| 89. | Lancaster | 44.0% | 18.7%(+25.3)#89 | 20.1%(+23.9)#1,874 |
| 90. | Red Hook | 44.4% | 18.7%(+25.7)#90 | 20.1%(+24.3)#1,890 |
| 91. | Tuckahoe | 44.9% | 18.7%(+26.2)#91 | 20.1%(+24.8)#1,903 |
| 92. | Salamanca | 45.0% | 18.7%(+26.3)#92 | 20.1%(+24.9)#1,905 |
| 93. | Frankfort | 45.5% | 18.7%(+26.8)#93 | 20.1%(+25.4)#1,923 |
| 94. | Fair Haven | 48.0% | 18.7%(+29.3)#94 | 20.1%(+27.9)#1,988 |
| 95. | Poughkeepsie | 48.2% | 18.7%(+29.5)#95 | 20.1%(+28.1)#1,992 |
| 96. | Batavia | 48.6% | 18.7%(+29.9)#96 | 20.1%(+28.5)#2,003 |
| 97. | Island Park | 49.3% | 18.7%(+30.6)#97 | 20.1%(+29.2)#2,016 |
| 98. | Copiague | 50.5% | 18.7%(+31.8)#98 | 20.1%(+30.4)#2,083 |
| 99. | Gowanda | 51.2% | 18.7%(+32.5)#99 | 20.1%(+31.1)#2,101 |
| 100. | Fairmount | 51.6% | 18.7%(+32.9)#100 | 20.1%(+31.5)#2,111 |
Common Questions
What are the Top 10 Cities with the Lowest Percentage of Births to Unmarried Women over the Age of 35 in New York?
Top 10 Cities with the Lowest Percentage of Births to Unmarried Women over the Age of 35 in New York are:
#1
2.7%
#2
3.4%
#3
4.3%
#4
4.8%
#5
5.4%
#6
6.4%
#7
7.1%
#8
8.6%
#9
10.5%
#10
11.3%
What city has the Lowest Percentage of Births to Unmarried Women over the Age of 35 in New York?
Spring Valley has the Lowest Percentage of Births to Unmarried Women over the Age of 35 in New York with 2.7%.
What is the Percentage of Births to Unmarried Women over the Age of 35 in the State of New York?
Percentage of Births to Unmarried Women over the Age of 35 in New York is 18.7%.
What is the Percentage of Births to Unmarried Women over the Age of 35 in the United States?
Percentage of Births to Unmarried Women over the Age of 35 in the United States is 20.1%.