Diamond Bar, CA Map & Demographics
Diamond Bar Map
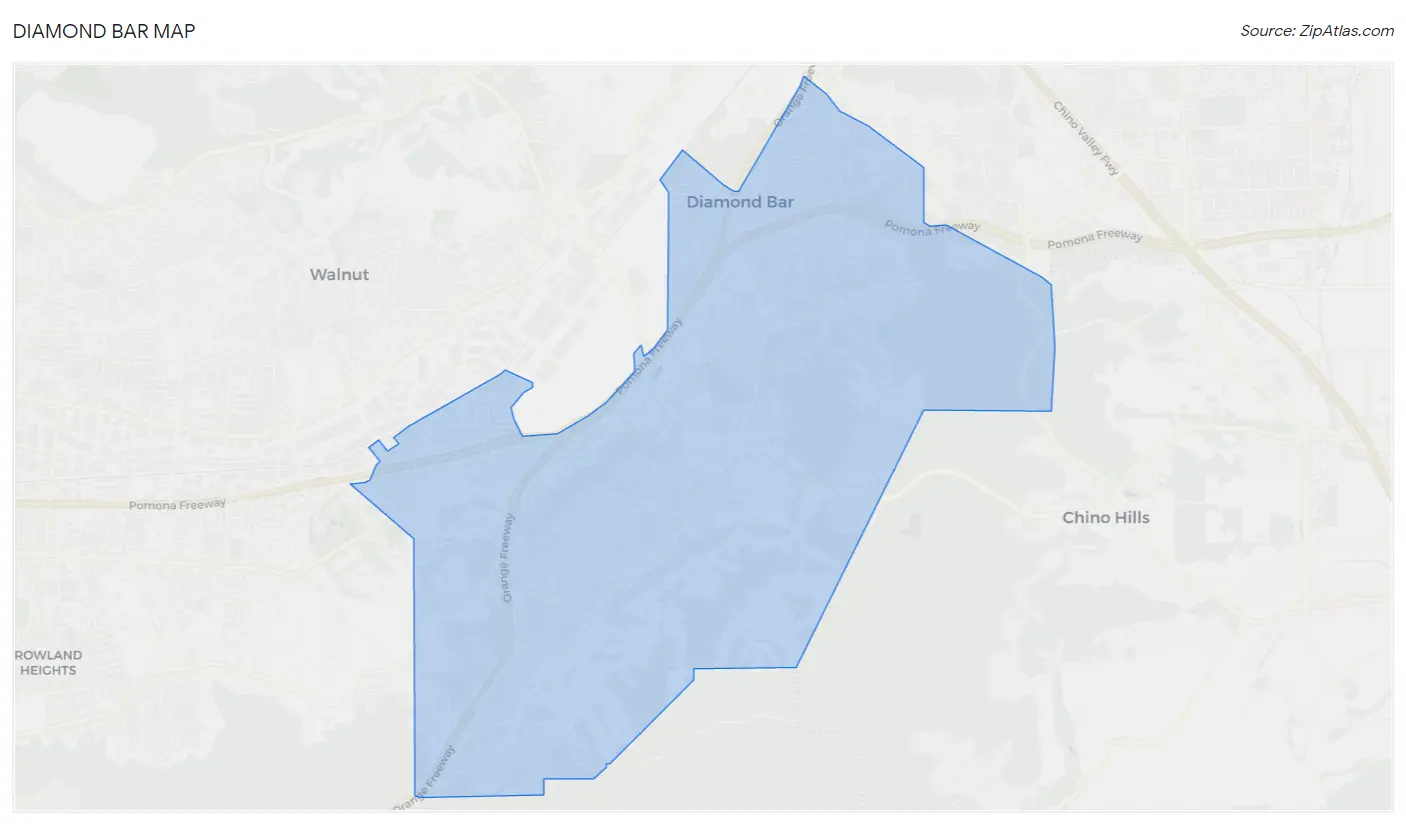
Diamond Bar Overview
$45,516
PER CAPITA INCOME
$116,683
AVG FAMILY INCOME
$106,881
AVG HOUSEHOLD INCOME
25.7%
WAGE / INCOME GAP [ % ]
74.3¢/ $1
WAGE / INCOME GAP [ $ ]
$13,626
FAMILY INCOME DEFICIT
0.45
INEQUALITY / GINI INDEX
54,534
TOTAL POPULATION
26,016
MALE POPULATION
28,518
FEMALE POPULATION
91.23
MALES / 100 FEMALES
109.62
FEMALES / 100 MALES
44.7
MEDIAN AGE
3.4
AVG FAMILY SIZE
3.0
AVG HOUSEHOLD SIZE
28,141
LABOR FORCE [ PEOPLE ]
62.0%
PERCENT IN LABOR FORCE
5.2%
UNEMPLOYMENT RATE
Diamond Bar Zip Codes
Diamond Bar Area Codes
Income in Diamond Bar
Income Overview in Diamond Bar
Per Capita Income in Diamond Bar is $45,516, while median incomes of families and households are $116,683 and $106,881 respectively.
| Characteristic | Number | Measure |
| Per Capita Income | 54,534 | $45,516 |
| Median Family Income | 14,450 | $116,683 |
| Mean Family Income | 14,450 | $145,863 |
| Median Household Income | 17,820 | $106,881 |
| Mean Household Income | 17,820 | $134,435 |
| Income Deficit | 14,450 | $13,626 |
| Wage / Income Gap (%) | 54,534 | 25.72% |
| Wage / Income Gap ($) | 54,534 | 74.28¢ per $1 |
| Gini / Inequality Index | 54,534 | 0.45 |
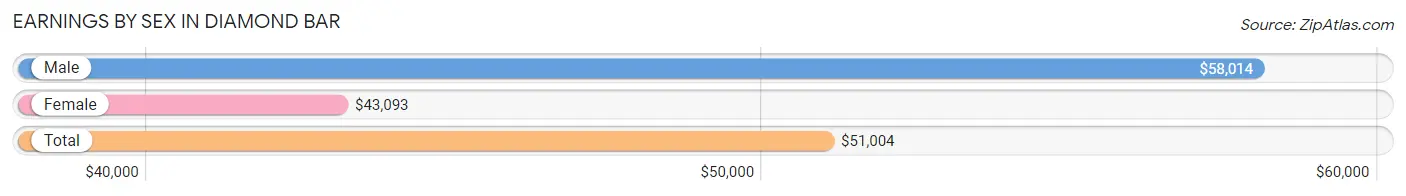
Earnings by Sex in Diamond Bar
Average Earnings in Diamond Bar are $51,004, $58,014 for men and $43,093 for women, a difference of 25.7%.
| Sex | Number | Average Earnings |
| Male | 14,895 (51.6%) | $58,014 |
| Female | 13,957 (48.4%) | $43,093 |
| Total | 28,852 (100.0%) | $51,004 |
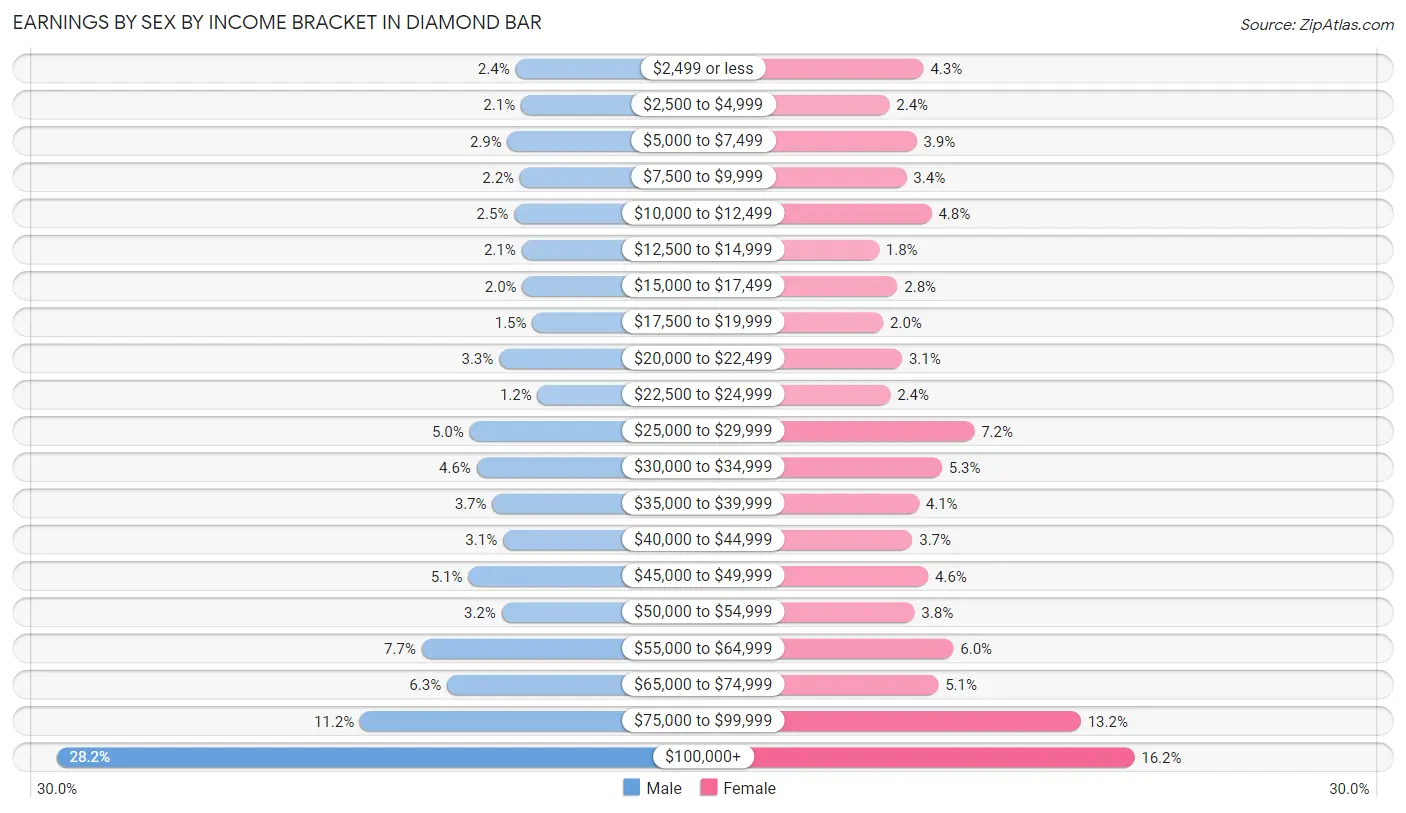
Earnings by Sex by Income Bracket in Diamond Bar
The most common earnings brackets in Diamond Bar are $100,000+ for men (4,201 | 28.2%) and $100,000+ for women (2,256 | 16.2%).
| Income | Male | Female |
| $2,499 or less | 359 (2.4%) | 602 (4.3%) |
| $2,500 to $4,999 | 313 (2.1%) | 334 (2.4%) |
| $5,000 to $7,499 | 424 (2.9%) | 547 (3.9%) |
| $7,500 to $9,999 | 322 (2.2%) | 468 (3.4%) |
| $10,000 to $12,499 | 369 (2.5%) | 665 (4.8%) |
| $12,500 to $14,999 | 309 (2.1%) | 251 (1.8%) |
| $15,000 to $17,499 | 301 (2.0%) | 396 (2.8%) |
| $17,500 to $19,999 | 217 (1.5%) | 285 (2.0%) |
| $20,000 to $22,499 | 496 (3.3%) | 432 (3.1%) |
| $22,500 to $24,999 | 174 (1.2%) | 341 (2.4%) |
| $25,000 to $29,999 | 744 (5.0%) | 999 (7.2%) |
| $30,000 to $34,999 | 684 (4.6%) | 746 (5.3%) |
| $35,000 to $39,999 | 553 (3.7%) | 565 (4.1%) |
| $40,000 to $44,999 | 463 (3.1%) | 513 (3.7%) |
| $45,000 to $49,999 | 753 (5.1%) | 638 (4.6%) |
| $50,000 to $54,999 | 475 (3.2%) | 530 (3.8%) |
| $55,000 to $64,999 | 1,144 (7.7%) | 836 (6.0%) |
| $65,000 to $74,999 | 933 (6.3%) | 718 (5.1%) |
| $75,000 to $99,999 | 1,661 (11.2%) | 1,835 (13.2%) |
| $100,000+ | 4,201 (28.2%) | 2,256 (16.2%) |
| Total | 14,895 (100.0%) | 13,957 (100.0%) |
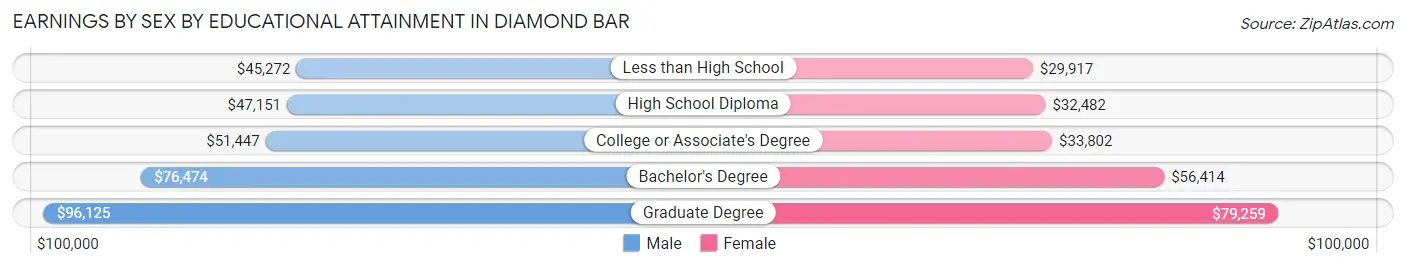
Earnings by Sex by Educational Attainment in Diamond Bar
Average earnings in Diamond Bar are $64,883 for men and $48,991 for women, a difference of 24.5%. Men with an educational attainment of graduate degree enjoy the highest average annual earnings of $96,125, while those with less than high school education earn the least with $45,272. Women with an educational attainment of graduate degree earn the most with the average annual earnings of $79,259, while those with less than high school education have the smallest earnings of $29,917.
| Educational Attainment | Male Income | Female Income |
| Less than High School | $45,272 | $29,917 |
| High School Diploma | $47,151 | $32,482 |
| College or Associate's Degree | $51,447 | $33,802 |
| Bachelor's Degree | $76,474 | $56,414 |
| Graduate Degree | $96,125 | $79,259 |
| Total | $64,883 | $48,991 |
Family Income in Diamond Bar
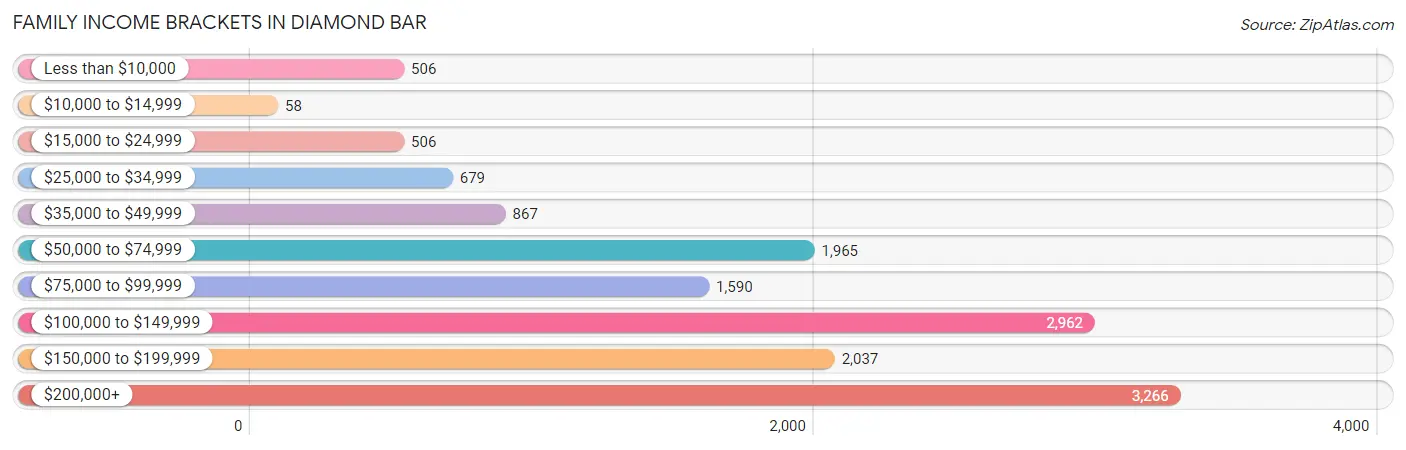
Family Income Brackets in Diamond Bar
According to the Diamond Bar family income data, there are 3,266 families falling into the $200,000+ income range, which is the most common income bracket and makes up 22.6% of all families. Conversely, the $10,000 to $14,999 income bracket is the least frequent group with only 58 families (0.4%) belonging to this category.
| Income Bracket | # Families | % Families |
| Less than $10,000 | 506 | 3.5% |
| $10,000 to $14,999 | 58 | 0.4% |
| $15,000 to $24,999 | 506 | 3.5% |
| $25,000 to $34,999 | 679 | 4.7% |
| $35,000 to $49,999 | 867 | 6.0% |
| $50,000 to $74,999 | 1,965 | 13.6% |
| $75,000 to $99,999 | 1,590 | 11.0% |
| $100,000 to $149,999 | 2,962 | 20.5% |
| $150,000 to $199,999 | 2,037 | 14.1% |
| $200,000+ | 3,266 | 22.6% |
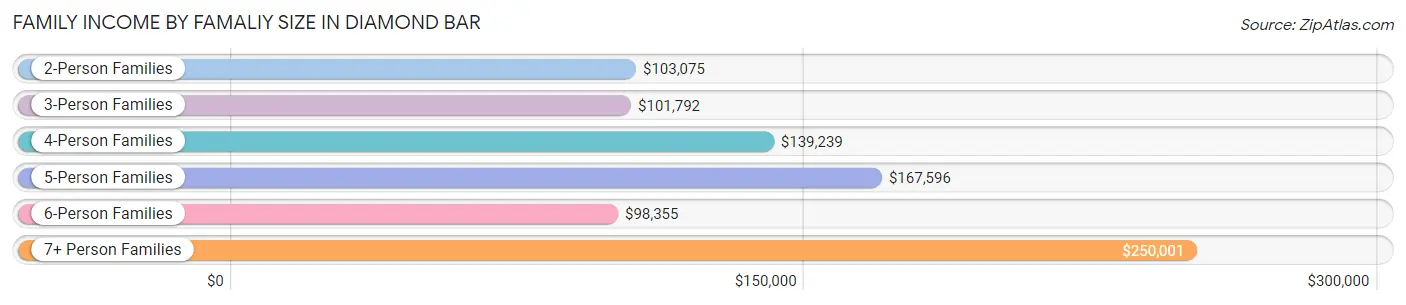
Family Income by Famaliy Size in Diamond Bar
7+ person families (170 | 1.2%) account for the highest median family income in Diamond Bar with $250,001 per family, while 2-person families (5,471 | 37.9%) have the highest median income of $51,538 per family member.
| Income Bracket | # Families | Median Income |
| 2-Person Families | 5,471 (37.9%) | $103,075 |
| 3-Person Families | 3,809 (26.4%) | $101,792 |
| 4-Person Families | 3,240 (22.4%) | $139,239 |
| 5-Person Families | 1,426 (9.9%) | $167,596 |
| 6-Person Families | 334 (2.3%) | $98,355 |
| 7+ Person Families | 170 (1.2%) | $250,001 |
| Total | 14,450 (100.0%) | $116,683 |
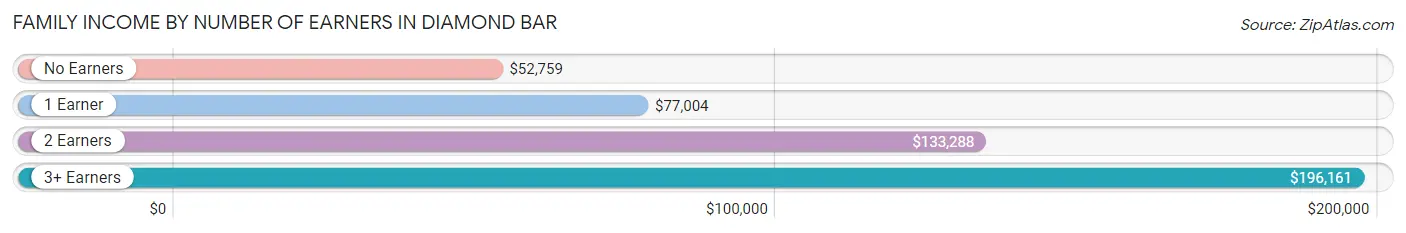
Family Income by Number of Earners in Diamond Bar
The median family income in Diamond Bar is $116,683, with families comprising 3+ earners (2,468) having the highest median family income of $196,161, while families with no earners (1,912) have the lowest median family income of $52,759, accounting for 17.1% and 13.2% of families, respectively.
| Number of Earners | # Families | Median Income |
| No Earners | 1,912 (13.2%) | $52,759 |
| 1 Earner | 4,097 (28.3%) | $77,004 |
| 2 Earners | 5,973 (41.3%) | $133,288 |
| 3+ Earners | 2,468 (17.1%) | $196,161 |
| Total | 14,450 (100.0%) | $116,683 |
Household Income in Diamond Bar
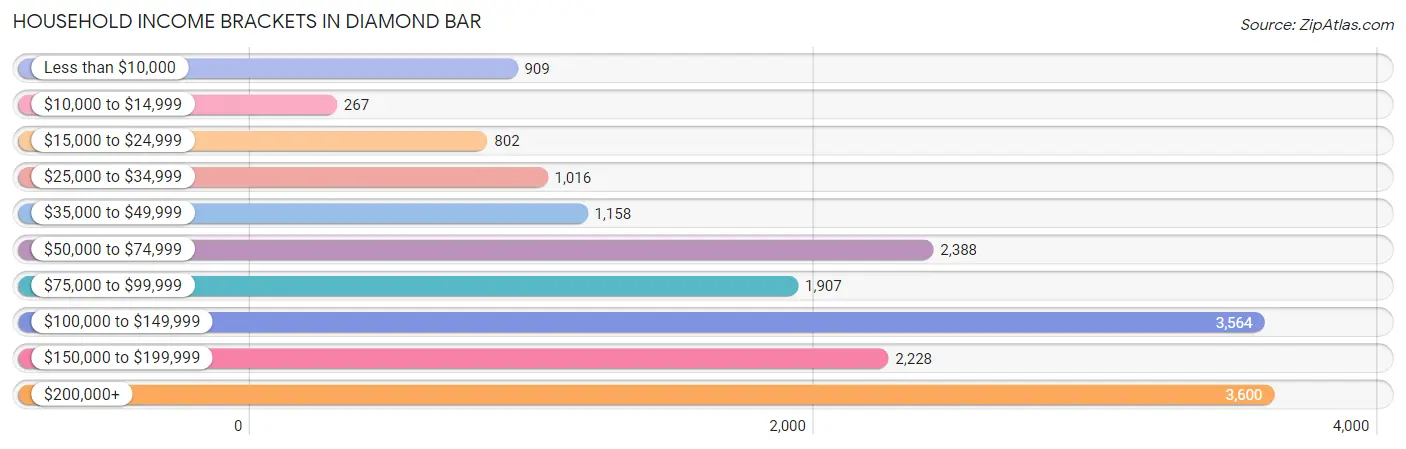
Household Income Brackets in Diamond Bar
With 3,600 households falling in the category, the $200,000+ income range is the most frequent in Diamond Bar, accounting for 20.2% of all households. In contrast, only 267 households (1.5%) fall into the $10,000 to $14,999 income bracket, making it the least populous group.
| Income Bracket | # Households | % Households |
| Less than $10,000 | 909 | 5.1% |
| $10,000 to $14,999 | 267 | 1.5% |
| $15,000 to $24,999 | 802 | 4.5% |
| $25,000 to $34,999 | 1,016 | 5.7% |
| $35,000 to $49,999 | 1,158 | 6.5% |
| $50,000 to $74,999 | 2,388 | 13.4% |
| $75,000 to $99,999 | 1,907 | 10.7% |
| $100,000 to $149,999 | 3,564 | 20.0% |
| $150,000 to $199,999 | 2,228 | 12.5% |
| $200,000+ | 3,600 | 20.2% |
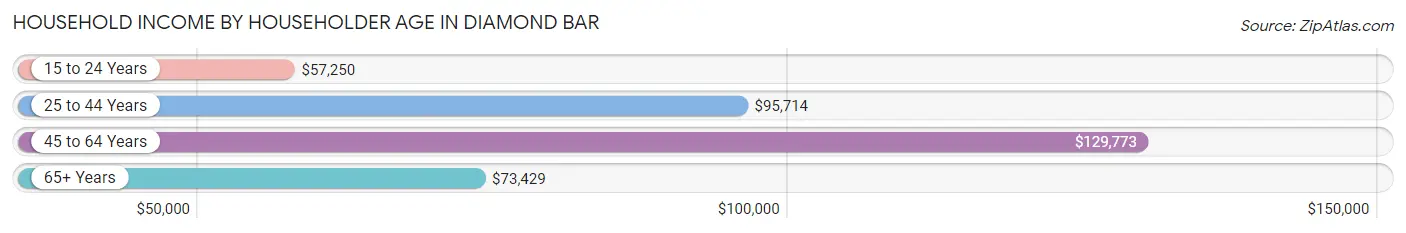
Household Income by Householder Age in Diamond Bar
The median household income in Diamond Bar is $106,881, with the highest median household income of $129,773 found in the 45 to 64 years age bracket for the primary householder. A total of 8,104 households (45.5%) fall into this category. Meanwhile, the 15 to 24 years age bracket for the primary householder has the lowest median household income of $57,250, with 248 households (1.4%) in this group.
| Income Bracket | # Households | Median Income |
| 15 to 24 Years | 248 (1.4%) | $57,250 |
| 25 to 44 Years | 4,002 (22.5%) | $95,714 |
| 45 to 64 Years | 8,104 (45.5%) | $129,773 |
| 65+ Years | 5,466 (30.7%) | $73,429 |
| Total | 17,820 (100.0%) | $106,881 |
Poverty in Diamond Bar
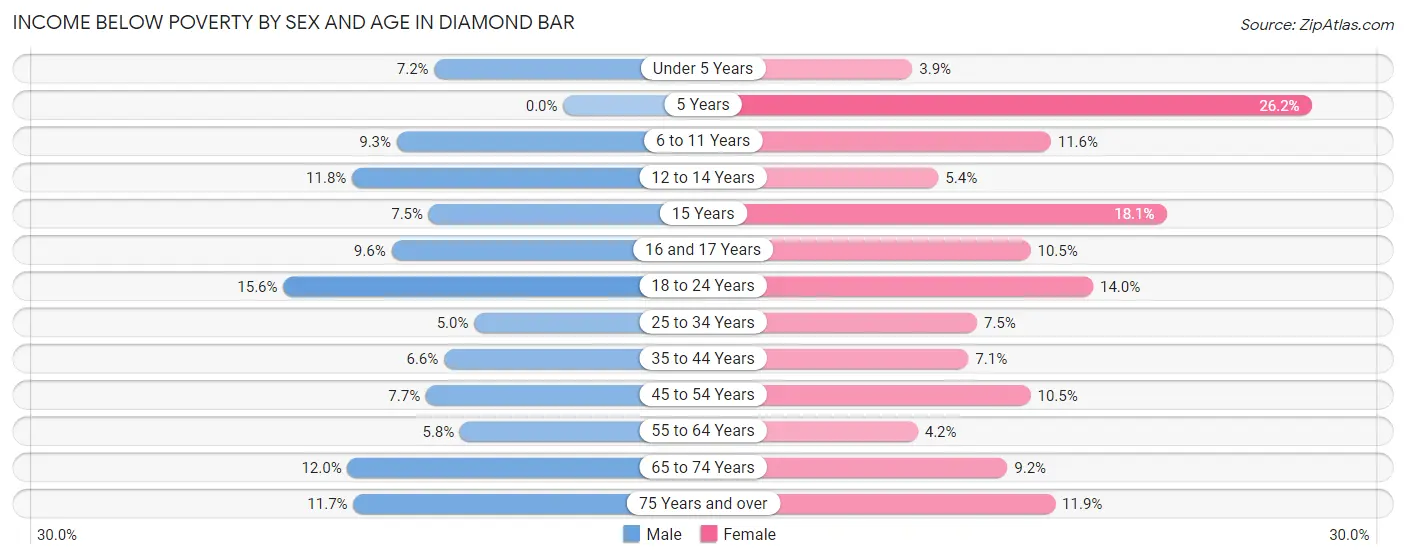
Income Below Poverty by Sex and Age in Diamond Bar
With 8.5% poverty level for males and 8.8% for females among the residents of Diamond Bar, 18 to 24 year old males and 5 year old females are the most vulnerable to poverty, with 324 males (15.6%) and 114 females (26.2%) in their respective age groups living below the poverty level.
| Age Bracket | Male | Female |
| Under 5 Years | 95 (7.2%) | 46 (3.9%) |
| 5 Years | 0 (0.0%) | 114 (26.2%) |
| 6 to 11 Years | 138 (9.3%) | 177 (11.6%) |
| 12 to 14 Years | 135 (11.8%) | 70 (5.4%) |
| 15 Years | 17 (7.5%) | 58 (18.1%) |
| 16 and 17 Years | 65 (9.6%) | 83 (10.5%) |
| 18 to 24 Years | 324 (15.6%) | 250 (14.0%) |
| 25 to 34 Years | 170 (5.0%) | 257 (7.5%) |
| 35 to 44 Years | 203 (6.6%) | 225 (7.0%) |
| 45 to 54 Years | 285 (7.6%) | 453 (10.5%) |
| 55 to 64 Years | 240 (5.8%) | 196 (4.2%) |
| 65 to 74 Years | 362 (12.0%) | 322 (9.2%) |
| 75 Years and over | 173 (11.7%) | 249 (11.9%) |
| Total | 2,207 (8.5%) | 2,500 (8.8%) |
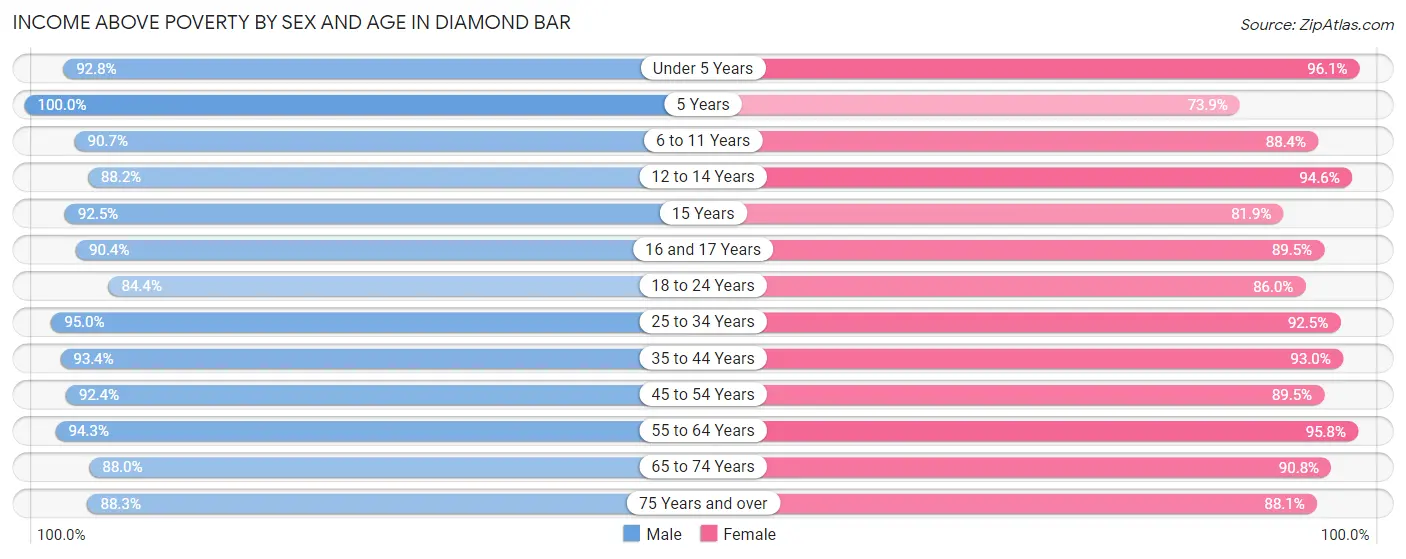
Income Above Poverty by Sex and Age in Diamond Bar
According to the poverty statistics in Diamond Bar, males aged 5 years and females aged under 5 years are the age groups that are most secure financially, with 100.0% of males and 96.1% of females in these age groups living above the poverty line.
| Age Bracket | Male | Female |
| Under 5 Years | 1,228 (92.8%) | 1,125 (96.1%) |
| 5 Years | 144 (100.0%) | 322 (73.9%) |
| 6 to 11 Years | 1,351 (90.7%) | 1,343 (88.4%) |
| 12 to 14 Years | 1,013 (88.2%) | 1,231 (94.6%) |
| 15 Years | 210 (92.5%) | 263 (81.9%) |
| 16 and 17 Years | 614 (90.4%) | 707 (89.5%) |
| 18 to 24 Years | 1,754 (84.4%) | 1,537 (86.0%) |
| 25 to 34 Years | 3,255 (95.0%) | 3,157 (92.5%) |
| 35 to 44 Years | 2,852 (93.4%) | 2,965 (92.9%) |
| 45 to 54 Years | 3,440 (92.3%) | 3,859 (89.5%) |
| 55 to 64 Years | 3,935 (94.3%) | 4,441 (95.8%) |
| 65 to 74 Years | 2,649 (88.0%) | 3,170 (90.8%) |
| 75 Years and over | 1,307 (88.3%) | 1,847 (88.1%) |
| Total | 23,752 (91.5%) | 25,967 (91.2%) |
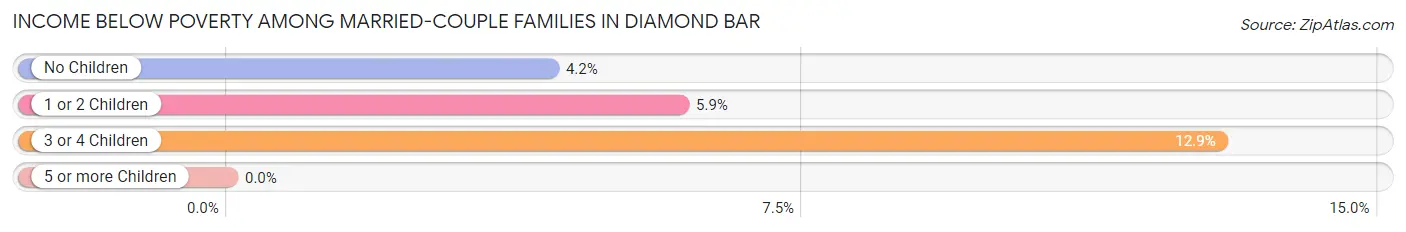
Income Below Poverty Among Married-Couple Families in Diamond Bar
The poverty statistics for married-couple families in Diamond Bar show that 5.2% or 593 of the total 11,363 families live below the poverty line. Families with 3 or 4 children have the highest poverty rate of 12.9%, comprising of 70 families. On the other hand, families with no children have the lowest poverty rate of 4.2%, which includes 283 families.
| Children | Above Poverty | Below Poverty |
| No Children | 6,465 (95.8%) | 283 (4.2%) |
| 1 or 2 Children | 3,833 (94.1%) | 240 (5.9%) |
| 3 or 4 Children | 472 (87.1%) | 70 (12.9%) |
| 5 or more Children | 0 (0.0%) | 0 (0.0%) |
| Total | 10,770 (94.8%) | 593 (5.2%) |
Income Below Poverty Among Single-Parent Households in Diamond Bar
According to the poverty data in Diamond Bar, 7.2% or 81 single-father households and 12.9% or 254 single-mother households are living below the poverty line. Among single-father households, those with 1 or 2 children have the highest poverty rate, with 36 households (8.4%) experiencing poverty. Likewise, among single-mother households, those with 5 or more children have the highest poverty rate, with 7 households (36.8%) falling below the poverty line.
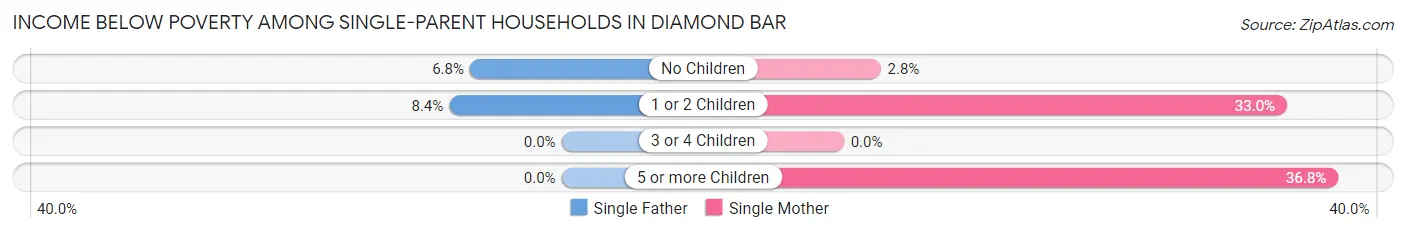
| Children | Single Father | Single Mother |
| No Children | 45 (6.8%) | 36 (2.8%) |
| 1 or 2 Children | 36 (8.4%) | 211 (33.0%) |
| 3 or 4 Children | 0 (0.0%) | 0 (0.0%) |
| 5 or more Children | 0 (0.0%) | 7 (36.8%) |
| Total | 81 (7.2%) | 254 (12.9%) |
Income Below Poverty Among Married-Couple vs Single-Parent Households in Diamond Bar
The poverty data for Diamond Bar shows that 593 of the married-couple family households (5.2%) and 335 of the single-parent households (10.8%) are living below the poverty level. Within the married-couple family households, those with 3 or 4 children have the highest poverty rate, with 70 households (12.9%) falling below the poverty line. Among the single-parent households, those with 1 or 2 children have the highest poverty rate, with 247 household (23.1%) living below poverty.
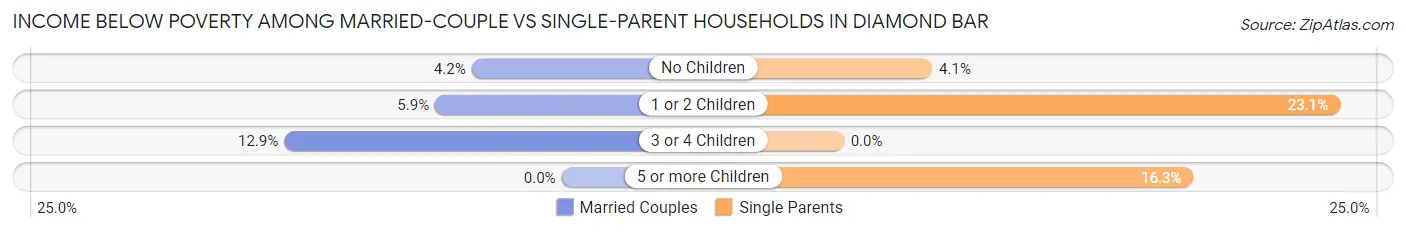
| Children | Married-Couple Families | Single-Parent Households |
| No Children | 283 (4.2%) | 81 (4.1%) |
| 1 or 2 Children | 240 (5.9%) | 247 (23.1%) |
| 3 or 4 Children | 70 (12.9%) | 0 (0.0%) |
| 5 or more Children | 0 (0.0%) | 7 (16.3%) |
| Total | 593 (5.2%) | 335 (10.8%) |
Race in Diamond Bar
The most populous races in Diamond Bar are Asian (32,390 | 59.4%), White / Caucasian (11,604 | 21.3%), and Hispanic or Latino (10,352 | 19.0%).
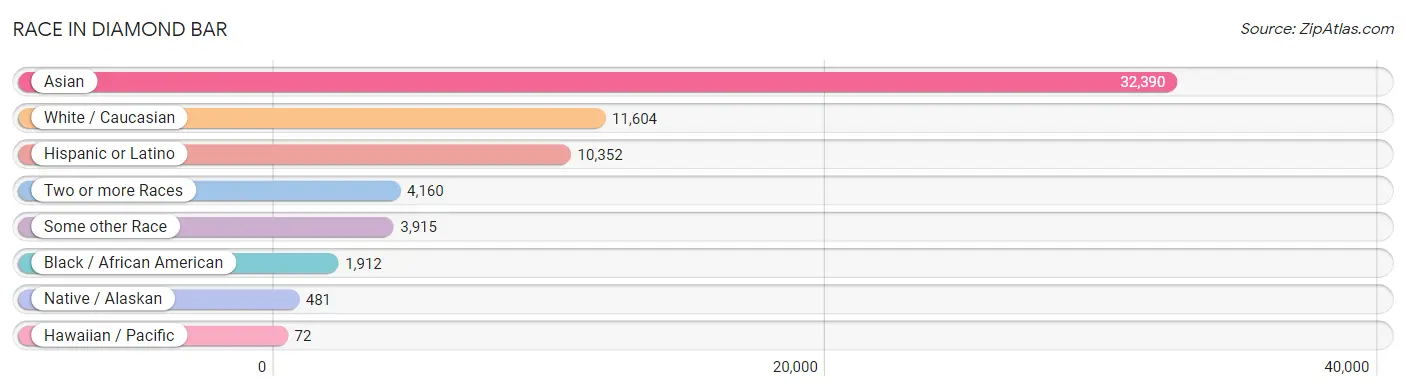
| Race | # Population | % Population |
| Asian | 32,390 | 59.4% |
| Black / African American | 1,912 | 3.5% |
| Hawaiian / Pacific | 72 | 0.1% |
| Hispanic or Latino | 10,352 | 19.0% |
| Native / Alaskan | 481 | 0.9% |
| White / Caucasian | 11,604 | 21.3% |
| Two or more Races | 4,160 | 7.6% |
| Some other Race | 3,915 | 7.2% |
| Total | 54,534 | 100.0% |
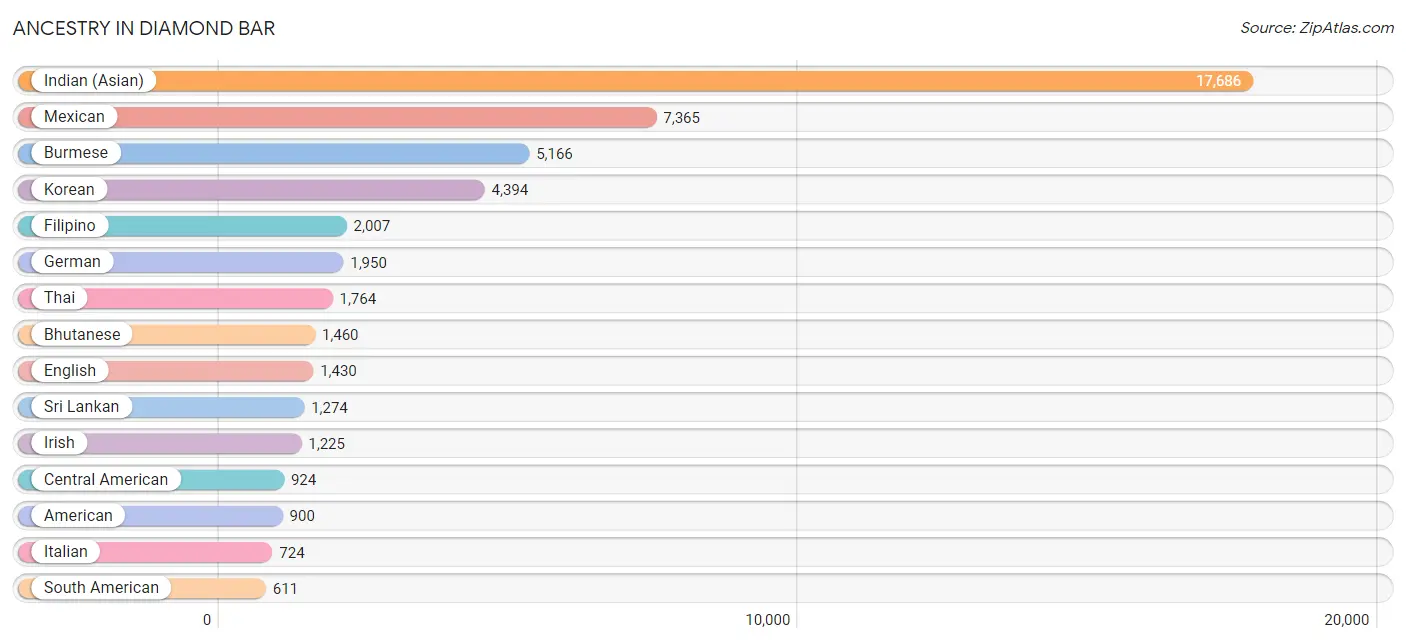
Ancestry in Diamond Bar
The most populous ancestries reported in Diamond Bar are Indian (Asian) (17,686 | 32.4%), Mexican (7,365 | 13.5%), Burmese (5,166 | 9.5%), Korean (4,394 | 8.1%), and Filipino (2,007 | 3.7%), together accounting for 67.1% of all Diamond Bar residents.
| Ancestry | # Population | % Population |
| African | 87 | 0.2% |
| American | 900 | 1.7% |
| Apache | 4 | 0.0% |
| Arab | 471 | 0.9% |
| Argentinean | 242 | 0.4% |
| Armenian | 286 | 0.5% |
| Basque | 14 | 0.0% |
| Belgian | 19 | 0.0% |
| Belizean | 23 | 0.0% |
| Bhutanese | 1,460 | 2.7% |
| British | 64 | 0.1% |
| Bulgarian | 37 | 0.1% |
| Burmese | 5,166 | 9.5% |
| Canadian | 1 | 0.0% |
| Central American | 924 | 1.7% |
| Central American Indian | 2 | 0.0% |
| Cherokee | 13 | 0.0% |
| Chilean | 48 | 0.1% |
| Choctaw | 7 | 0.0% |
| Colombian | 79 | 0.1% |
| Costa Rican | 23 | 0.0% |
| Creek | 6 | 0.0% |
| Croatian | 23 | 0.0% |
| Cuban | 291 | 0.5% |
| Czech | 40 | 0.1% |
| Czechoslovakian | 7 | 0.0% |
| Danish | 16 | 0.0% |
| Dutch | 154 | 0.3% |
| Eastern European | 51 | 0.1% |
| Ecuadorian | 50 | 0.1% |
| Egyptian | 33 | 0.1% |
| English | 1,430 | 2.6% |
| European | 504 | 0.9% |
| Filipino | 2,007 | 3.7% |
| Finnish | 23 | 0.0% |
| French | 572 | 1.1% |
| French Canadian | 91 | 0.2% |
| German | 1,950 | 3.6% |
| Greek | 211 | 0.4% |
| Guamanian / Chamorro | 43 | 0.1% |
| Guatemalan | 173 | 0.3% |
| Honduran | 156 | 0.3% |
| Hungarian | 24 | 0.0% |
| Icelander | 10 | 0.0% |
| Indian (Asian) | 17,686 | 32.4% |
| Indonesian | 312 | 0.6% |
| Iranian | 130 | 0.2% |
| Irish | 1,225 | 2.2% |
| Iroquois | 14 | 0.0% |
| Israeli | 19 | 0.0% |
| Italian | 724 | 1.3% |
| Jamaican | 63 | 0.1% |
| Japanese | 16 | 0.0% |
| Jordanian | 59 | 0.1% |
| Korean | 4,394 | 8.1% |
| Laotian | 400 | 0.7% |
| Latvian | 78 | 0.1% |
| Lebanese | 252 | 0.5% |
| Lithuanian | 12 | 0.0% |
| Mexican | 7,365 | 13.5% |
| Mexican American Indian | 484 | 0.9% |
| Native Hawaiian | 107 | 0.2% |
| Navajo | 33 | 0.1% |
| Nicaraguan | 114 | 0.2% |
| Nigerian | 12 | 0.0% |
| Northern European | 6 | 0.0% |
| Norwegian | 233 | 0.4% |
| Osage | 7 | 0.0% |
| Pakistani | 279 | 0.5% |
| Panamanian | 40 | 0.1% |
| Peruvian | 174 | 0.3% |
| Polish | 288 | 0.5% |
| Portuguese | 35 | 0.1% |
| Puerto Rican | 172 | 0.3% |
| Romanian | 23 | 0.0% |
| Russian | 167 | 0.3% |
| Salvadoran | 389 | 0.7% |
| Samoan | 24 | 0.0% |
| Scandinavian | 52 | 0.1% |
| Scotch-Irish | 107 | 0.2% |
| Scottish | 266 | 0.5% |
| Serbian | 11 | 0.0% |
| Sierra Leonean | 82 | 0.2% |
| Sioux | 37 | 0.1% |
| Slovene | 14 | 0.0% |
| South American | 611 | 1.1% |
| Spaniard | 221 | 0.4% |
| Spanish | 466 | 0.9% |
| Sri Lankan | 1,274 | 2.3% |
| Subsaharan African | 189 | 0.4% |
| Swedish | 107 | 0.2% |
| Swiss | 67 | 0.1% |
| Syrian | 66 | 0.1% |
| Thai | 1,764 | 3.2% |
| Tongan | 5 | 0.0% |
| Ukrainian | 108 | 0.2% |
| Venezuelan | 18 | 0.0% |
| Vietnamese | 218 | 0.4% |
| Welsh | 162 | 0.3% |
| Yaqui | 8 | 0.0% |
| Yugoslavian | 8 | 0.0% | View All 101 Rows |
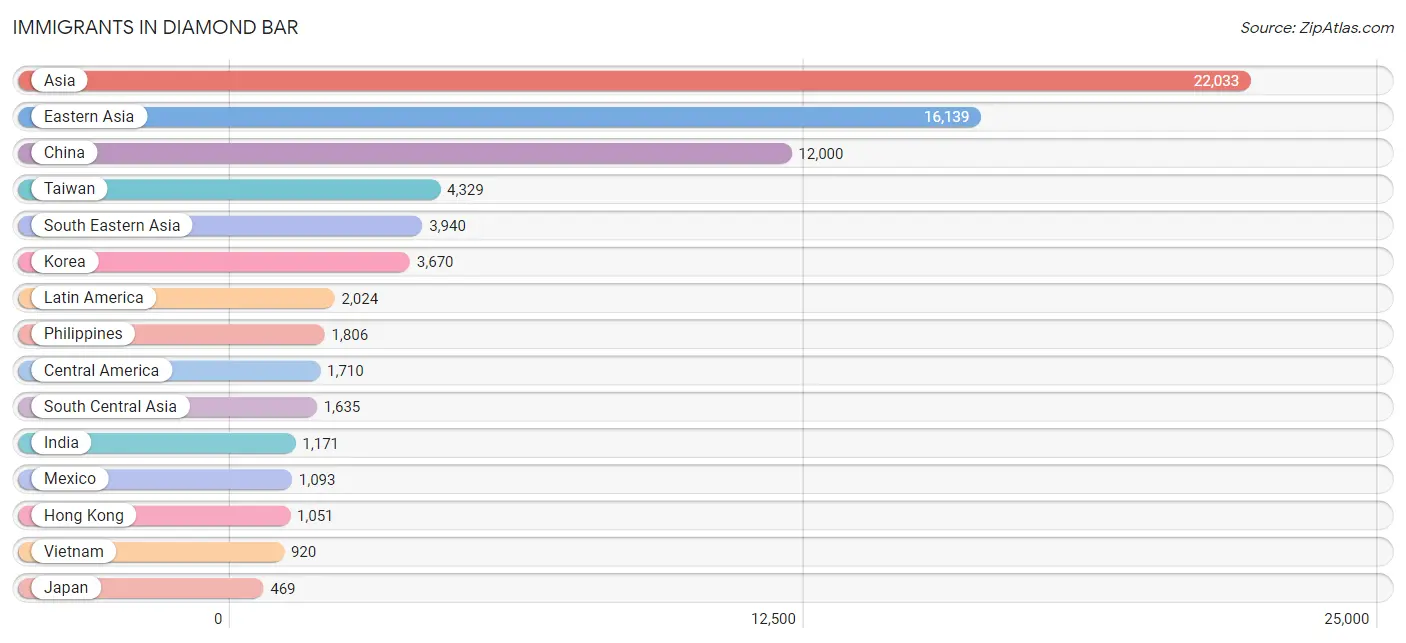
Immigrants in Diamond Bar
The most numerous immigrant groups reported in Diamond Bar came from Asia (22,033 | 40.4%), Eastern Asia (16,139 | 29.6%), China (12,000 | 22.0%), Taiwan (4,329 | 7.9%), and South Eastern Asia (3,940 | 7.2%), together accounting for 107.1% of all Diamond Bar residents.
| Immigration Origin | # Population | % Population |
| Africa | 185 | 0.3% |
| Argentina | 7 | 0.0% |
| Armenia | 8 | 0.0% |
| Asia | 22,033 | 40.4% |
| Bangladesh | 109 | 0.2% |
| Belize | 28 | 0.1% |
| Brazil | 13 | 0.0% |
| Cambodia | 2 | 0.0% |
| Canada | 156 | 0.3% |
| Caribbean | 114 | 0.2% |
| Central America | 1,710 | 3.1% |
| China | 12,000 | 22.0% |
| Colombia | 57 | 0.1% |
| Cuba | 52 | 0.1% |
| Eastern Africa | 111 | 0.2% |
| Eastern Asia | 16,139 | 29.6% |
| Eastern Europe | 68 | 0.1% |
| Egypt | 10 | 0.0% |
| El Salvador | 267 | 0.5% |
| England | 17 | 0.0% |
| Europe | 232 | 0.4% |
| France | 10 | 0.0% |
| Germany | 58 | 0.1% |
| Greece | 12 | 0.0% |
| Guatemala | 104 | 0.2% |
| Honduras | 92 | 0.2% |
| Hong Kong | 1,051 | 1.9% |
| India | 1,171 | 2.1% |
| Indonesia | 329 | 0.6% |
| Iran | 118 | 0.2% |
| Iraq | 12 | 0.0% |
| Italy | 8 | 0.0% |
| Jamaica | 62 | 0.1% |
| Japan | 469 | 0.9% |
| Jordan | 32 | 0.1% |
| Kenya | 15 | 0.0% |
| Korea | 3,670 | 6.7% |
| Laos | 61 | 0.1% |
| Latin America | 2,024 | 3.7% |
| Lebanon | 172 | 0.3% |
| Malaysia | 219 | 0.4% |
| Mexico | 1,093 | 2.0% |
| Nepal | 29 | 0.1% |
| Netherlands | 34 | 0.1% |
| Nicaragua | 103 | 0.2% |
| Nigeria | 12 | 0.0% |
| Northern Africa | 10 | 0.0% |
| Northern Europe | 28 | 0.1% |
| Oceania | 8 | 0.0% |
| Pakistan | 208 | 0.4% |
| Panama | 23 | 0.0% |
| Peru | 68 | 0.1% |
| Philippines | 1,806 | 3.3% |
| Poland | 22 | 0.0% |
| Romania | 16 | 0.0% |
| Russia | 4 | 0.0% |
| Saudi Arabia | 9 | 0.0% |
| Sierra Leone | 52 | 0.1% |
| Singapore | 54 | 0.1% |
| South America | 200 | 0.4% |
| South Central Asia | 1,635 | 3.0% |
| South Eastern Asia | 3,940 | 7.2% |
| Southern Europe | 34 | 0.1% |
| Spain | 14 | 0.0% |
| Syria | 74 | 0.1% |
| Taiwan | 4,329 | 7.9% |
| Thailand | 189 | 0.4% |
| Turkey | 12 | 0.0% |
| Ukraine | 24 | 0.0% |
| Uruguay | 25 | 0.1% |
| Venezuela | 18 | 0.0% |
| Vietnam | 920 | 1.7% |
| Western Africa | 64 | 0.1% |
| Western Asia | 319 | 0.6% |
| Western Europe | 102 | 0.2% | View All 75 Rows |
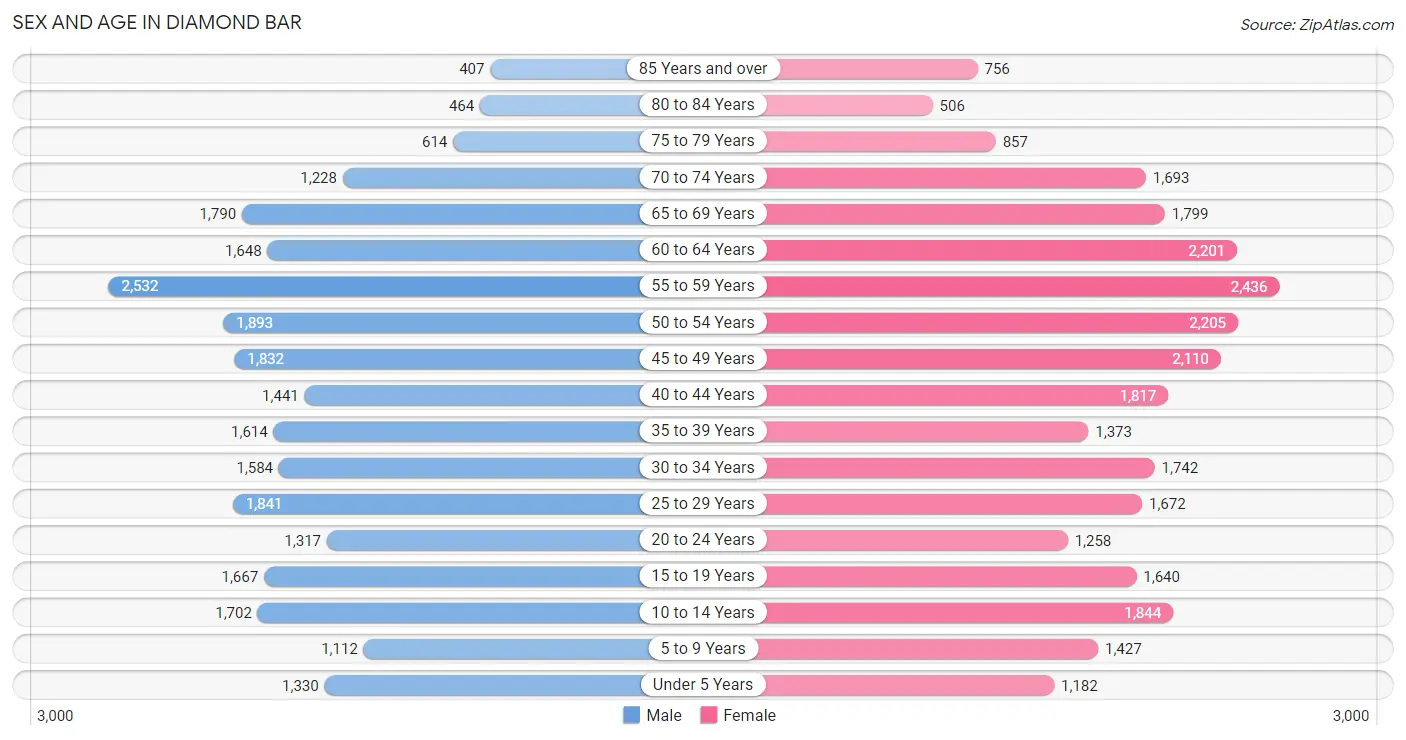
Sex and Age in Diamond Bar
Sex and Age in Diamond Bar
The most populous age groups in Diamond Bar are 55 to 59 Years (2,532 | 9.7%) for men and 55 to 59 Years (2,436 | 8.5%) for women.
| Age Bracket | Male | Female |
| Under 5 Years | 1,330 (5.1%) | 1,182 (4.1%) |
| 5 to 9 Years | 1,112 (4.3%) | 1,427 (5.0%) |
| 10 to 14 Years | 1,702 (6.5%) | 1,844 (6.5%) |
| 15 to 19 Years | 1,667 (6.4%) | 1,640 (5.8%) |
| 20 to 24 Years | 1,317 (5.1%) | 1,258 (4.4%) |
| 25 to 29 Years | 1,841 (7.1%) | 1,672 (5.9%) |
| 30 to 34 Years | 1,584 (6.1%) | 1,742 (6.1%) |
| 35 to 39 Years | 1,614 (6.2%) | 1,373 (4.8%) |
| 40 to 44 Years | 1,441 (5.5%) | 1,817 (6.4%) |
| 45 to 49 Years | 1,832 (7.0%) | 2,110 (7.4%) |
| 50 to 54 Years | 1,893 (7.3%) | 2,205 (7.7%) |
| 55 to 59 Years | 2,532 (9.7%) | 2,436 (8.5%) |
| 60 to 64 Years | 1,648 (6.3%) | 2,201 (7.7%) |
| 65 to 69 Years | 1,790 (6.9%) | 1,799 (6.3%) |
| 70 to 74 Years | 1,228 (4.7%) | 1,693 (5.9%) |
| 75 to 79 Years | 614 (2.4%) | 857 (3.0%) |
| 80 to 84 Years | 464 (1.8%) | 506 (1.8%) |
| 85 Years and over | 407 (1.6%) | 756 (2.6%) |
| Total | 26,016 (100.0%) | 28,518 (100.0%) |
Families and Households in Diamond Bar
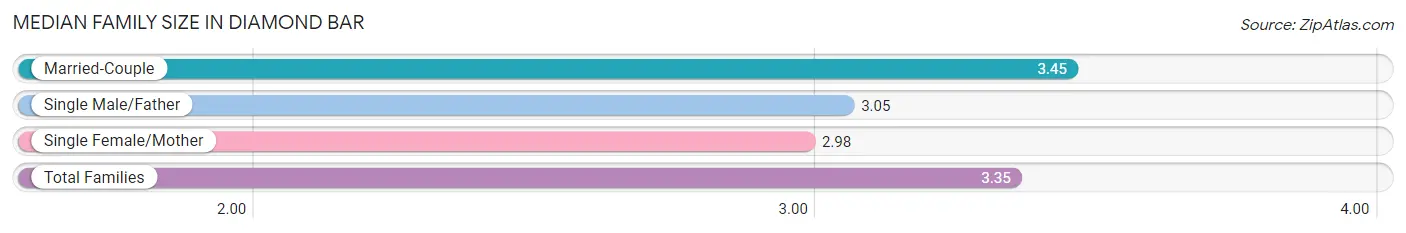
Median Family Size in Diamond Bar
The median family size in Diamond Bar is 3.35 persons per family, with married-couple families (11,363 | 78.6%) accounting for the largest median family size of 3.45 persons per family. On the other hand, single female/mother families (1,965 | 13.6%) represent the smallest median family size with 2.98 persons per family.
| Family Type | # Families | Family Size |
| Married-Couple | 11,363 (78.6%) | 3.45 |
| Single Male/Father | 1,122 (7.8%) | 3.05 |
| Single Female/Mother | 1,965 (13.6%) | 2.98 |
| Total Families | 14,450 (100.0%) | 3.35 |
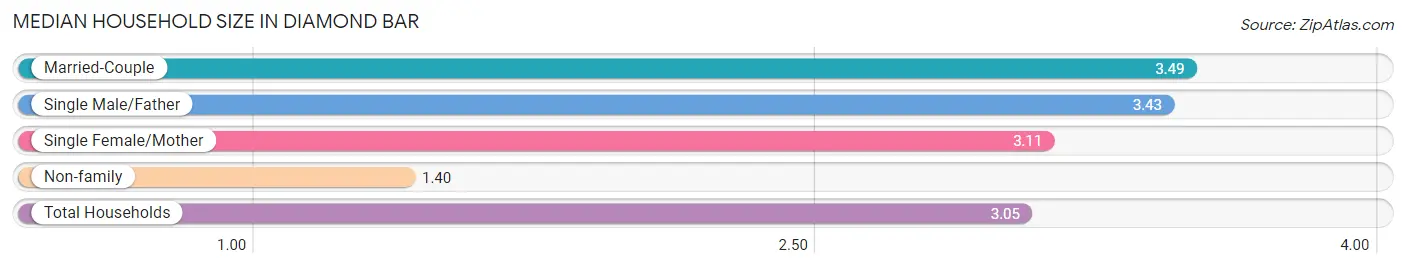
Median Household Size in Diamond Bar
The median household size in Diamond Bar is 3.05 persons per household, with married-couple households (11,363 | 63.8%) accounting for the largest median household size of 3.49 persons per household. non-family households (3,370 | 18.9%) represent the smallest median household size with 1.40 persons per household.
| Household Type | # Households | Household Size |
| Married-Couple | 11,363 (63.8%) | 3.49 |
| Single Male/Father | 1,122 (6.3%) | 3.43 |
| Single Female/Mother | 1,965 (11.0%) | 3.11 |
| Non-family | 3,370 (18.9%) | 1.40 |
| Total Households | 17,820 (100.0%) | 3.05 |
Household Size by Marriage Status in Diamond Bar
Out of a total of 17,820 households in Diamond Bar, 14,450 (81.1%) are family households, while 3,370 (18.9%) are nonfamily households. The most numerous type of family households are 2-person households, comprising 5,074, and the most common type of nonfamily households are 1-person households, comprising 2,675.
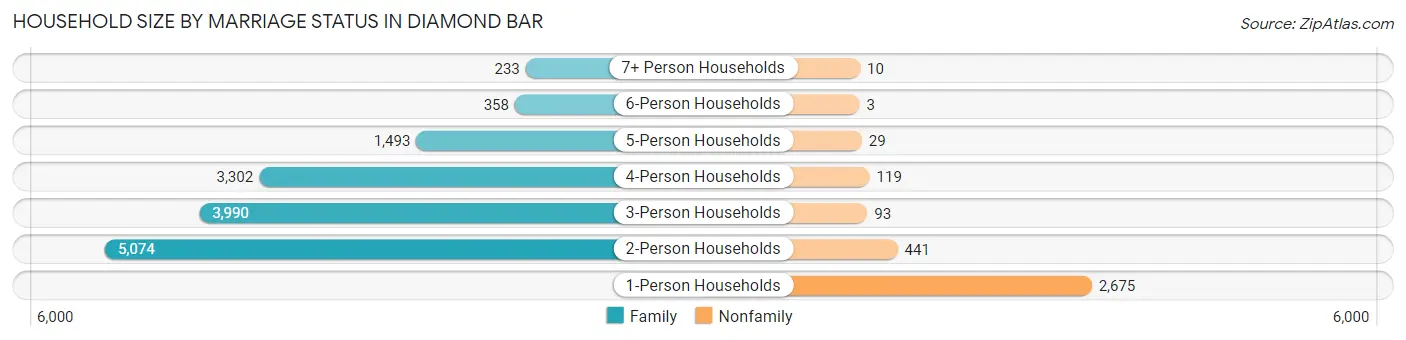
| Household Size | Family Households | Nonfamily Households |
| 1-Person Households | - | 2,675 (15.0%) |
| 2-Person Households | 5,074 (28.5%) | 441 (2.5%) |
| 3-Person Households | 3,990 (22.4%) | 93 (0.5%) |
| 4-Person Households | 3,302 (18.5%) | 119 (0.7%) |
| 5-Person Households | 1,493 (8.4%) | 29 (0.2%) |
| 6-Person Households | 358 (2.0%) | 3 (0.0%) |
| 7+ Person Households | 233 (1.3%) | 10 (0.1%) |
| Total | 14,450 (81.1%) | 3,370 (18.9%) |
Female Fertility in Diamond Bar
Fertility by Age in Diamond Bar
Average fertility rate in Diamond Bar is 35.0 births per 1,000 women. Women in the age bracket of 20 to 34 years have the highest fertility rate with 44.0 births per 1,000 women. Women in the age bracket of 35 to 50 years acount for 51.3% of all women with births.
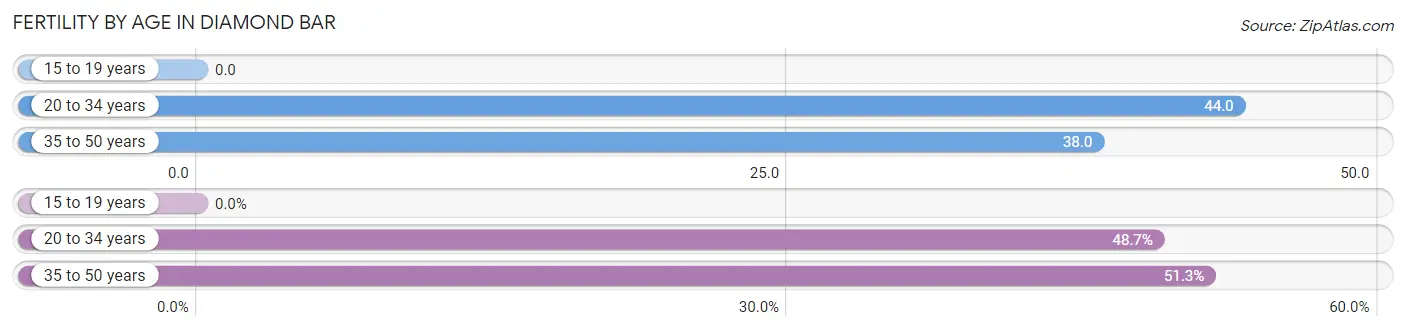
| Age Bracket | Women with Births | Births / 1,000 Women |
| 15 to 19 years | 0 (0.0%) | 0.0 |
| 20 to 34 years | 204 (48.7%) | 44.0 |
| 35 to 50 years | 215 (51.3%) | 38.0 |
| Total | 419 (100.0%) | 35.0 |
Fertility by Age by Marriage Status in Diamond Bar
78.3% of women with births (419) in Diamond Bar are married. The highest percentage of unmarried women with births falls into 20 to 34 years age bracket with 35.8% of them unmarried at the time of birth, while the lowest percentage of unmarried women with births belong to 35 to 50 years age bracket with 8.4% of them unmarried.
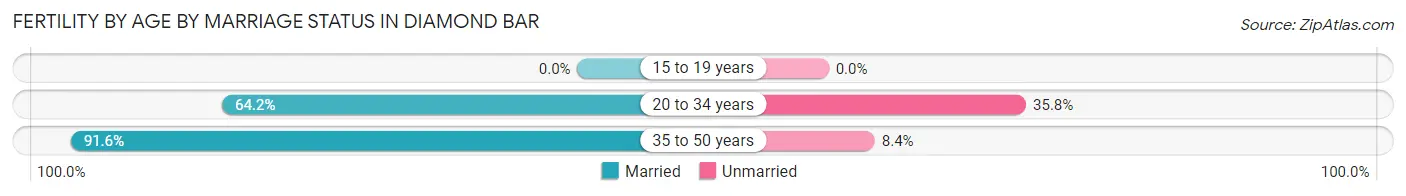
| Age Bracket | Married | Unmarried |
| 15 to 19 years | 0 (0.0%) | 0 (0.0%) |
| 20 to 34 years | 131 (64.2%) | 73 (35.8%) |
| 35 to 50 years | 197 (91.6%) | 18 (8.4%) |
| Total | 328 (78.3%) | 91 (21.7%) |
Fertility by Education in Diamond Bar
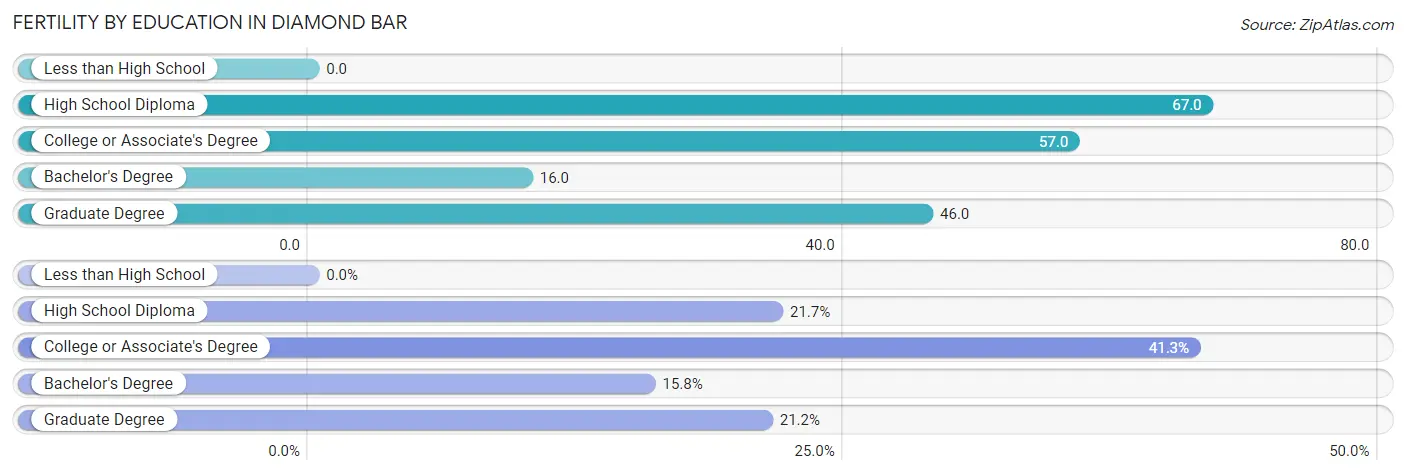
| Educational Attainment | Women with Births | Births / 1,000 Women |
| Less than High School | 0 (0.0%) | 0.0 |
| High School Diploma | 91 (21.7%) | 67.0 |
| College or Associate's Degree | 173 (41.3%) | 57.0 |
| Bachelor's Degree | 66 (15.8%) | 16.0 |
| Graduate Degree | 89 (21.2%) | 46.0 |
| Total | 419 (100.0%) | 35.0 |
Fertility by Education by Marriage Status in Diamond Bar
21.7% of women with births in Diamond Bar are unmarried. Women with the educational attainment of bachelor's degree are most likely to be married with 100.0% of them married at childbirth, while women with the educational attainment of college or associate's degree are least likely to be married with 43.3% of them unmarried at childbirth.
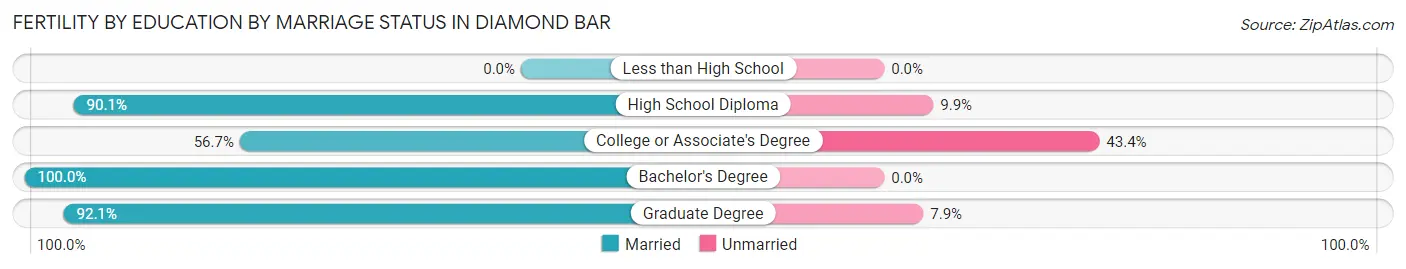
| Educational Attainment | Married | Unmarried |
| Less than High School | 0 (0.0%) | 0 (0.0%) |
| High School Diploma | 82 (90.1%) | 9 (9.9%) |
| College or Associate's Degree | 98 (56.7%) | 75 (43.3%) |
| Bachelor's Degree | 66 (100.0%) | 0 (0.0%) |
| Graduate Degree | 82 (92.1%) | 7 (7.9%) |
| Total | 328 (78.3%) | 91 (21.7%) |
Employment Characteristics in Diamond Bar
Employment by Class of Employer in Diamond Bar
Among the 26,053 employed individuals in Diamond Bar, private company employees (16,603 | 63.7%), local government employees (2,263 | 8.7%), and not-for-profit organizations (2,014 | 7.7%) make up the most common classes of employment.
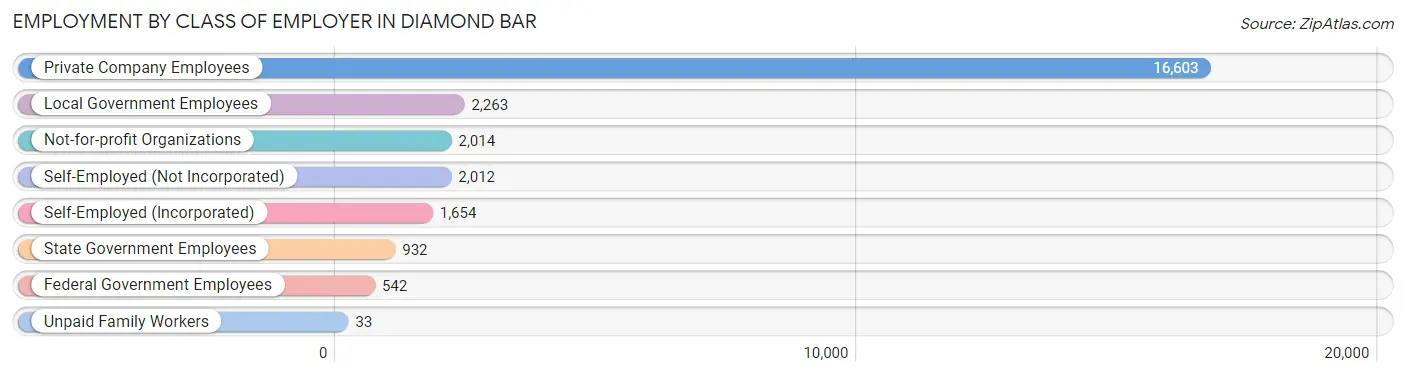
| Employer Class | # Employees | % Employees |
| Private Company Employees | 16,603 | 63.7% |
| Self-Employed (Incorporated) | 1,654 | 6.4% |
| Self-Employed (Not Incorporated) | 2,012 | 7.7% |
| Not-for-profit Organizations | 2,014 | 7.7% |
| Local Government Employees | 2,263 | 8.7% |
| State Government Employees | 932 | 3.6% |
| Federal Government Employees | 542 | 2.1% |
| Unpaid Family Workers | 33 | 0.1% |
| Total | 26,053 | 100.0% |
Employment Status by Age in Diamond Bar
According to the labor force statistics for Diamond Bar, out of the total population over 16 years of age (45,389), 62.0% or 28,141 individuals are in the labor force, with 5.2% or 1,463 of them unemployed. The age group with the highest labor force participation rate is 35 to 44 years, with 82.8% or 5,171 individuals in the labor force. Within the labor force, the 16 to 19 years age range has the highest percentage of unemployed individuals, with 11.6% or 89 of them being unemployed.
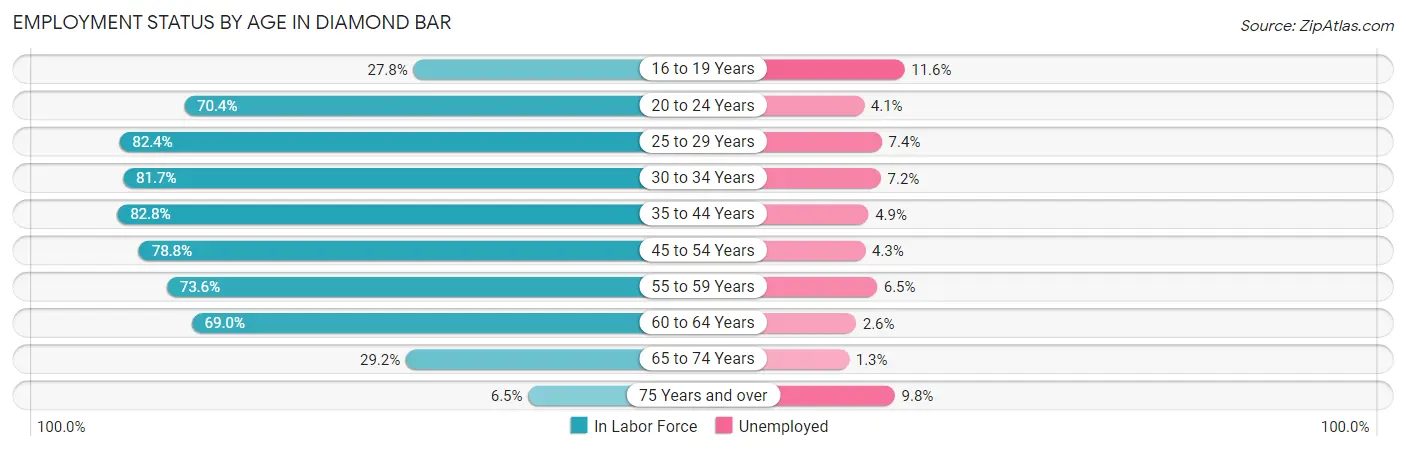
| Age Bracket | In Labor Force | Unemployed |
| 16 to 19 Years | 767 (27.8%) | 89 (11.6%) |
| 20 to 24 Years | 1,813 (70.4%) | 74 (4.1%) |
| 25 to 29 Years | 2,895 (82.4%) | 214 (7.4%) |
| 30 to 34 Years | 2,717 (81.7%) | 196 (7.2%) |
| 35 to 44 Years | 5,171 (82.8%) | 253 (4.9%) |
| 45 to 54 Years | 6,336 (78.8%) | 272 (4.3%) |
| 55 to 59 Years | 3,656 (73.6%) | 238 (6.5%) |
| 60 to 64 Years | 2,656 (69.0%) | 69 (2.6%) |
| 65 to 74 Years | 1,901 (29.2%) | 25 (1.3%) |
| 75 Years and over | 234 (6.5%) | 23 (9.8%) |
| Total | 28,141 (62.0%) | 1,463 (5.2%) |
Employment Status by Educational Attainment in Diamond Bar
According to labor force statistics for Diamond Bar, 78.3% of individuals (23,444) out of the total population between 25 and 64 years of age (29,941) are in the labor force, with 5.3% or 1,243 of them being unemployed. The group with the highest labor force participation rate are those with the educational attainment of bachelor's degree or higher, with 84.8% or 13,652 individuals in the labor force. Within the labor force, individuals with less than high school education have the highest percentage of unemployment, with 13.4% or 135 of them being unemployed.
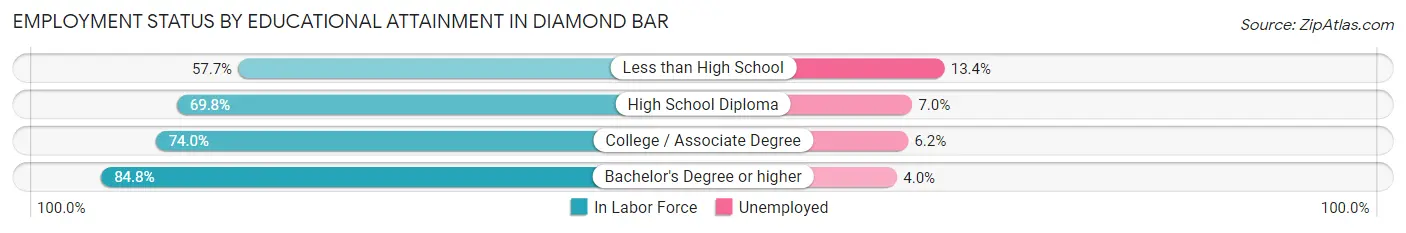
| Educational Attainment | In Labor Force | Unemployed |
| Less than High School | 1,011 (57.7%) | 235 (13.4%) |
| High School Diploma | 2,777 (69.8%) | 279 (7.0%) |
| College / Associate Degree | 6,001 (74.0%) | 503 (6.2%) |
| Bachelor's Degree or higher | 13,652 (84.8%) | 644 (4.0%) |
| Total | 23,444 (78.3%) | 1,587 (5.3%) |
Employment Occupations by Sex in Diamond Bar
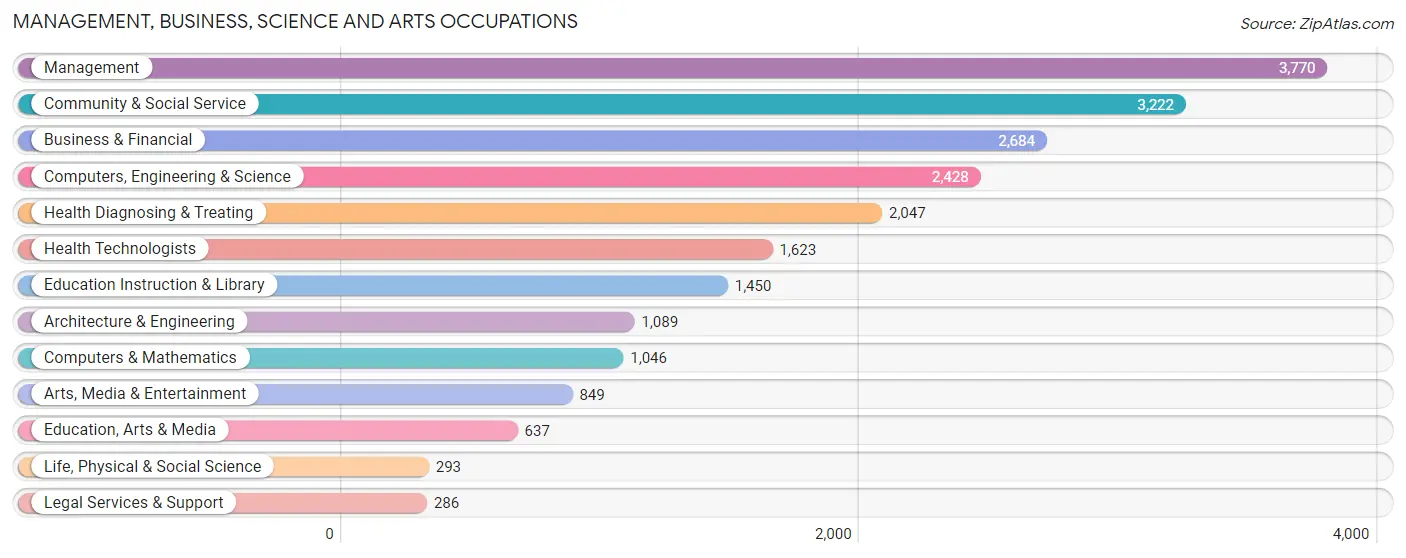
Management, Business, Science and Arts Occupations
The most common Management, Business, Science and Arts occupations in Diamond Bar are Management (3,770 | 14.1%), Community & Social Service (3,222 | 12.1%), Business & Financial (2,684 | 10.1%), Computers, Engineering & Science (2,428 | 9.1%), and Health Diagnosing & Treating (2,047 | 7.7%).
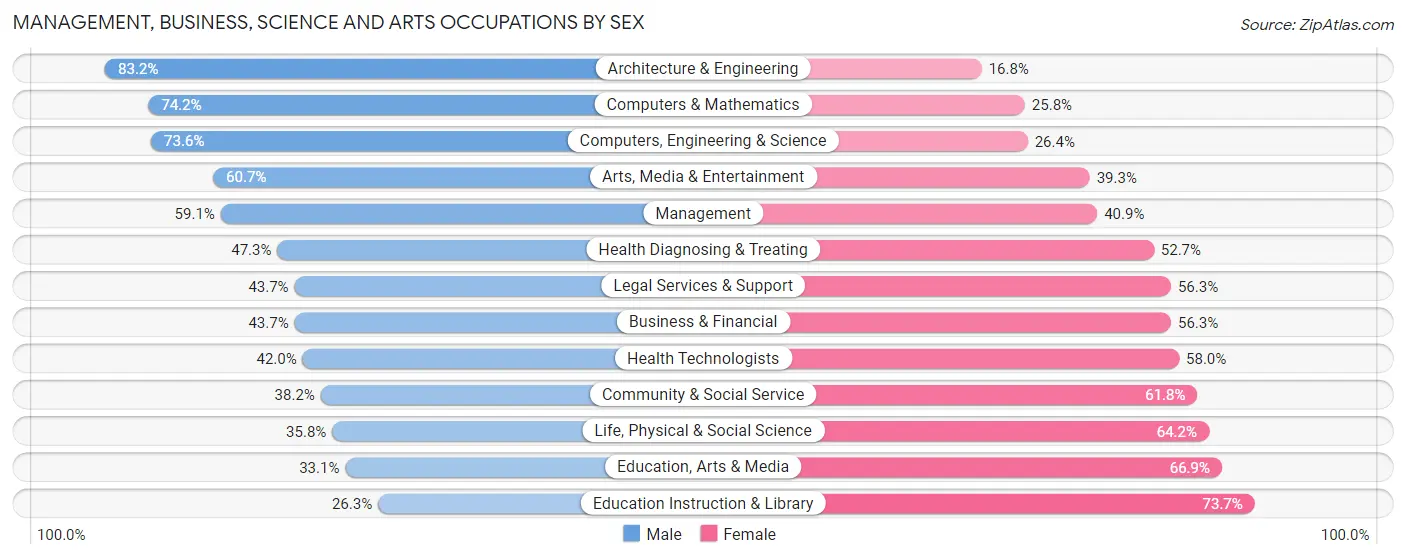
Management, Business, Science and Arts Occupations by Sex
Within the Management, Business, Science and Arts occupations in Diamond Bar, the most male-oriented occupations are Architecture & Engineering (83.2%), Computers & Mathematics (74.2%), and Computers, Engineering & Science (73.6%), while the most female-oriented occupations are Education Instruction & Library (73.7%), Education, Arts & Media (66.9%), and Life, Physical & Social Science (64.2%).
| Occupation | Male | Female |
| Management | 2,228 (59.1%) | 1,542 (40.9%) |
| Business & Financial | 1,173 (43.7%) | 1,511 (56.3%) |
| Computers, Engineering & Science | 1,787 (73.6%) | 641 (26.4%) |
| Computers & Mathematics | 776 (74.2%) | 270 (25.8%) |
| Architecture & Engineering | 906 (83.2%) | 183 (16.8%) |
| Life, Physical & Social Science | 105 (35.8%) | 188 (64.2%) |
| Community & Social Service | 1,232 (38.2%) | 1,990 (61.8%) |
| Education, Arts & Media | 211 (33.1%) | 426 (66.9%) |
| Legal Services & Support | 125 (43.7%) | 161 (56.3%) |
| Education Instruction & Library | 381 (26.3%) | 1,069 (73.7%) |
| Arts, Media & Entertainment | 515 (60.7%) | 334 (39.3%) |
| Health Diagnosing & Treating | 968 (47.3%) | 1,079 (52.7%) |
| Health Technologists | 682 (42.0%) | 941 (58.0%) |
| Total (Category) | 7,388 (52.2%) | 6,763 (47.8%) |
| Total (Overall) | 13,916 (52.2%) | 12,734 (47.8%) |
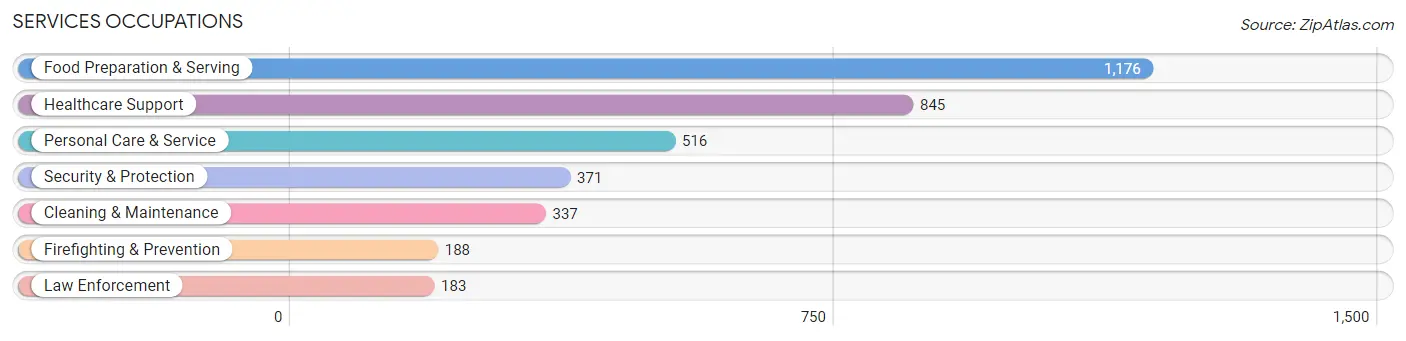
Services Occupations
The most common Services occupations in Diamond Bar are Food Preparation & Serving (1,176 | 4.4%), Healthcare Support (845 | 3.2%), Personal Care & Service (516 | 1.9%), Security & Protection (371 | 1.4%), and Cleaning & Maintenance (337 | 1.3%).
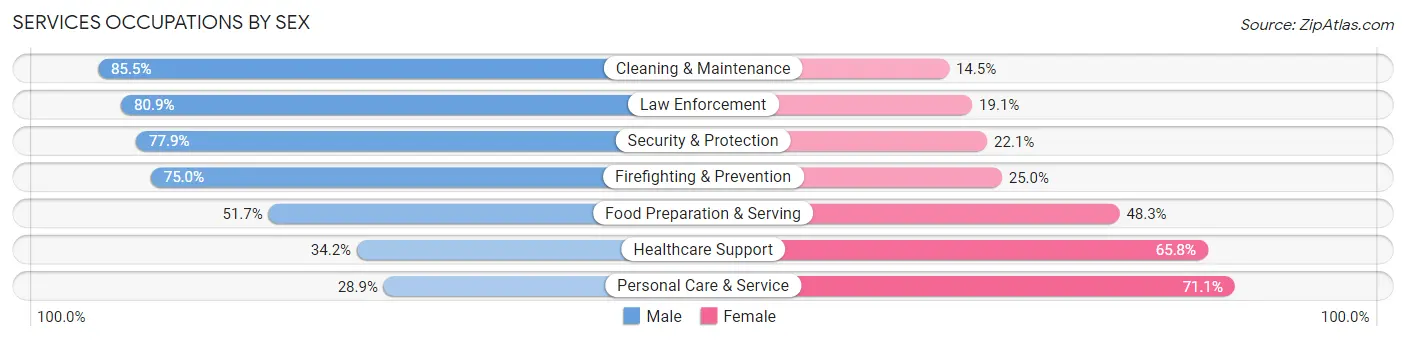
Services Occupations by Sex
Within the Services occupations in Diamond Bar, the most male-oriented occupations are Cleaning & Maintenance (85.5%), Law Enforcement (80.9%), and Security & Protection (77.9%), while the most female-oriented occupations are Personal Care & Service (71.1%), Healthcare Support (65.8%), and Food Preparation & Serving (48.3%).
| Occupation | Male | Female |
| Healthcare Support | 289 (34.2%) | 556 (65.8%) |
| Security & Protection | 289 (77.9%) | 82 (22.1%) |
| Firefighting & Prevention | 141 (75.0%) | 47 (25.0%) |
| Law Enforcement | 148 (80.9%) | 35 (19.1%) |
| Food Preparation & Serving | 608 (51.7%) | 568 (48.3%) |
| Cleaning & Maintenance | 288 (85.5%) | 49 (14.5%) |
| Personal Care & Service | 149 (28.9%) | 367 (71.1%) |
| Total (Category) | 1,623 (50.0%) | 1,622 (50.0%) |
| Total (Overall) | 13,916 (52.2%) | 12,734 (47.8%) |
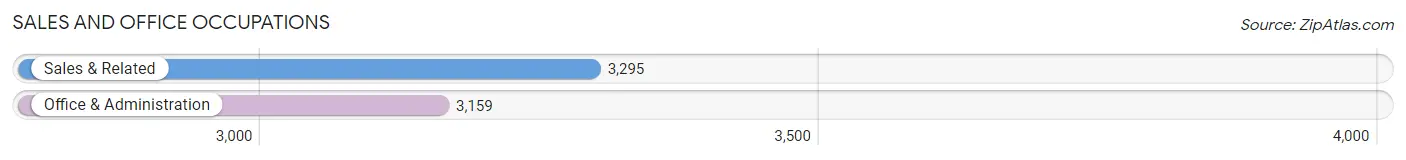
Sales and Office Occupations
The most common Sales and Office occupations in Diamond Bar are Sales & Related (3,295 | 12.4%), and Office & Administration (3,159 | 11.8%).
Sales and Office Occupations by Sex
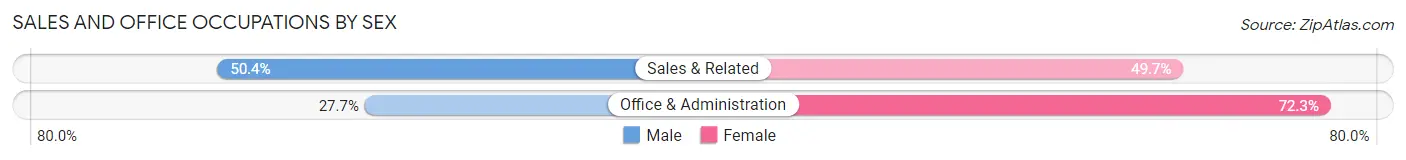
| Occupation | Male | Female |
| Sales & Related | 1,659 (50.3%) | 1,636 (49.6%) |
| Office & Administration | 874 (27.7%) | 2,285 (72.3%) |
| Total (Category) | 2,533 (39.3%) | 3,921 (60.8%) |
| Total (Overall) | 13,916 (52.2%) | 12,734 (47.8%) |
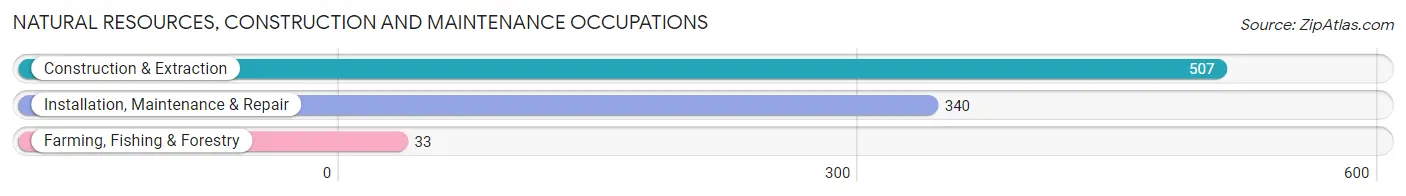
Natural Resources, Construction and Maintenance Occupations
The most common Natural Resources, Construction and Maintenance occupations in Diamond Bar are Construction & Extraction (507 | 1.9%), Installation, Maintenance & Repair (340 | 1.3%), and Farming, Fishing & Forestry (33 | 0.1%).
Natural Resources, Construction and Maintenance Occupations by Sex
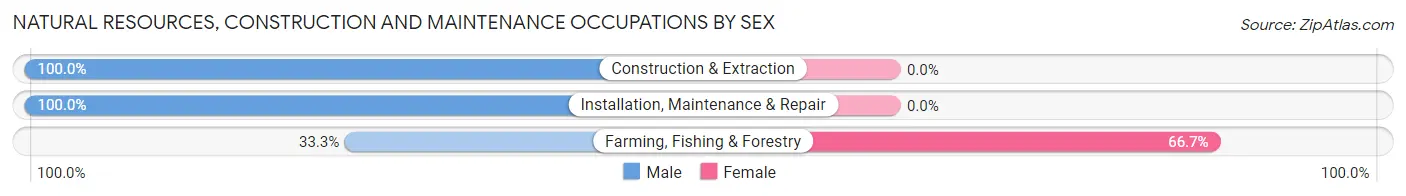
| Occupation | Male | Female |
| Farming, Fishing & Forestry | 11 (33.3%) | 22 (66.7%) |
| Construction & Extraction | 507 (100.0%) | 0 (0.0%) |
| Installation, Maintenance & Repair | 340 (100.0%) | 0 (0.0%) |
| Total (Category) | 858 (97.5%) | 22 (2.5%) |
| Total (Overall) | 13,916 (52.2%) | 12,734 (47.8%) |
Production, Transportation and Moving Occupations
The most common Production, Transportation and Moving occupations in Diamond Bar are Production (794 | 3.0%), Transportation (719 | 2.7%), and Material Moving (407 | 1.5%).
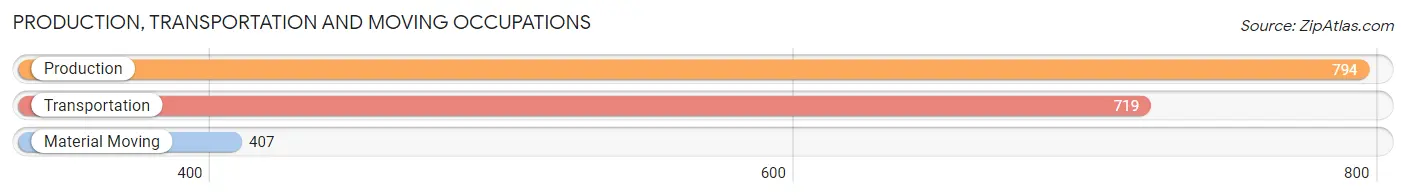
Production, Transportation and Moving Occupations by Sex
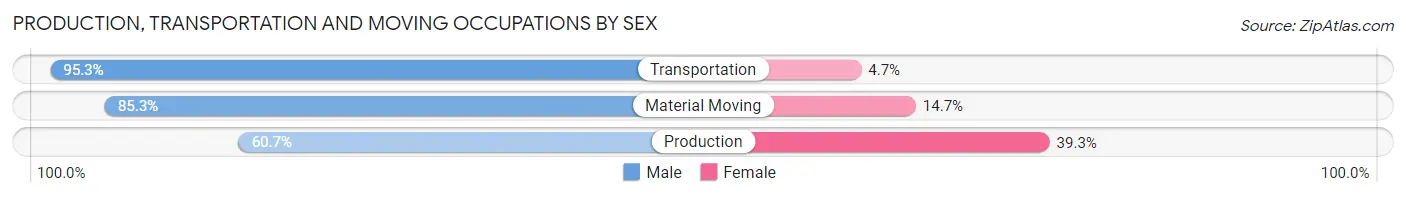
| Occupation | Male | Female |
| Production | 482 (60.7%) | 312 (39.3%) |
| Transportation | 685 (95.3%) | 34 (4.7%) |
| Material Moving | 347 (85.3%) | 60 (14.7%) |
| Total (Category) | 1,514 (78.8%) | 406 (21.1%) |
| Total (Overall) | 13,916 (52.2%) | 12,734 (47.8%) |
Employment Industries by Sex in Diamond Bar
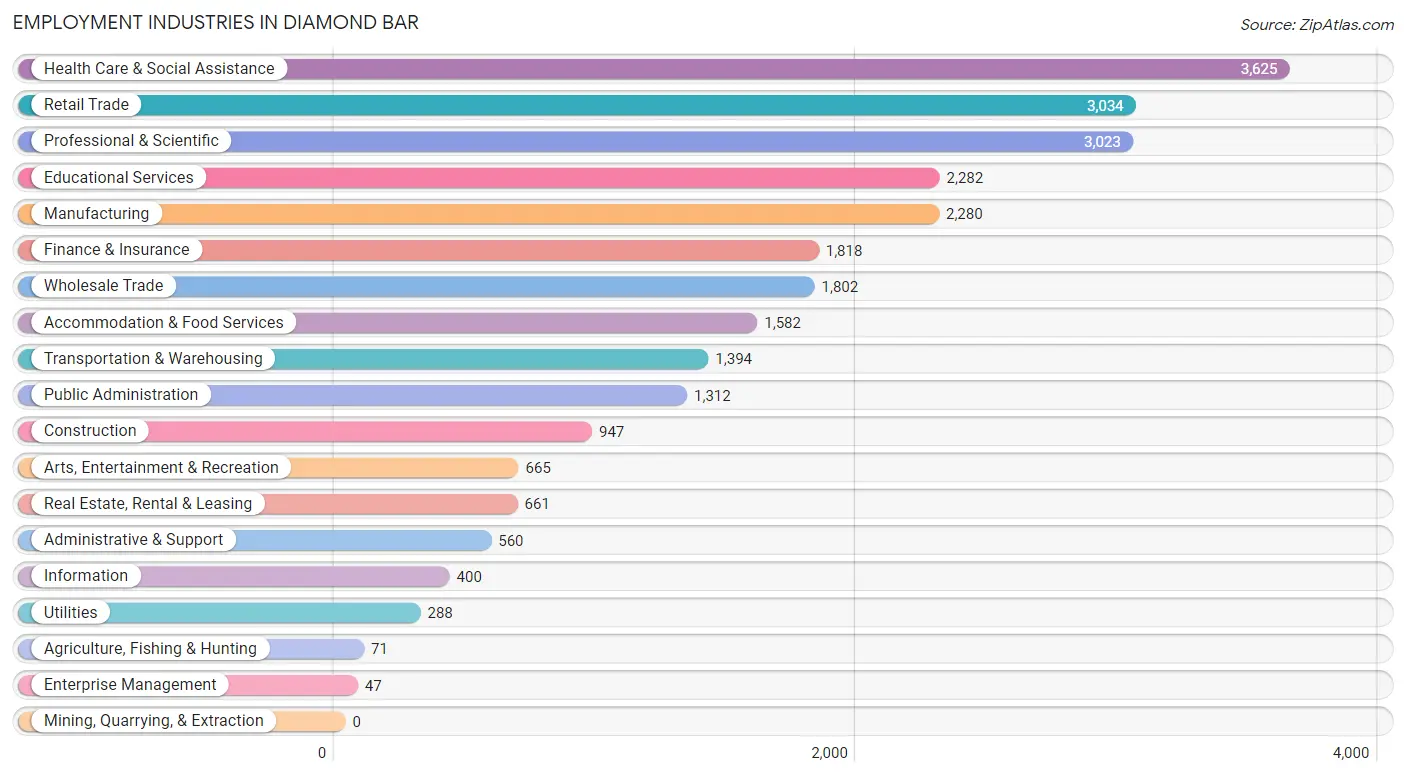
Employment Industries in Diamond Bar
The major employment industries in Diamond Bar include Health Care & Social Assistance (3,625 | 13.6%), Retail Trade (3,034 | 11.4%), Professional & Scientific (3,023 | 11.3%), Educational Services (2,282 | 8.6%), and Manufacturing (2,280 | 8.6%).
Employment Industries by Sex in Diamond Bar
The Diamond Bar industries that see more men than women are Utilities (87.5%), Construction (83.0%), and Transportation & Warehousing (74.2%), whereas the industries that tend to have a higher number of women are Health Care & Social Assistance (65.0%), Educational Services (64.1%), and Public Administration (61.0%).
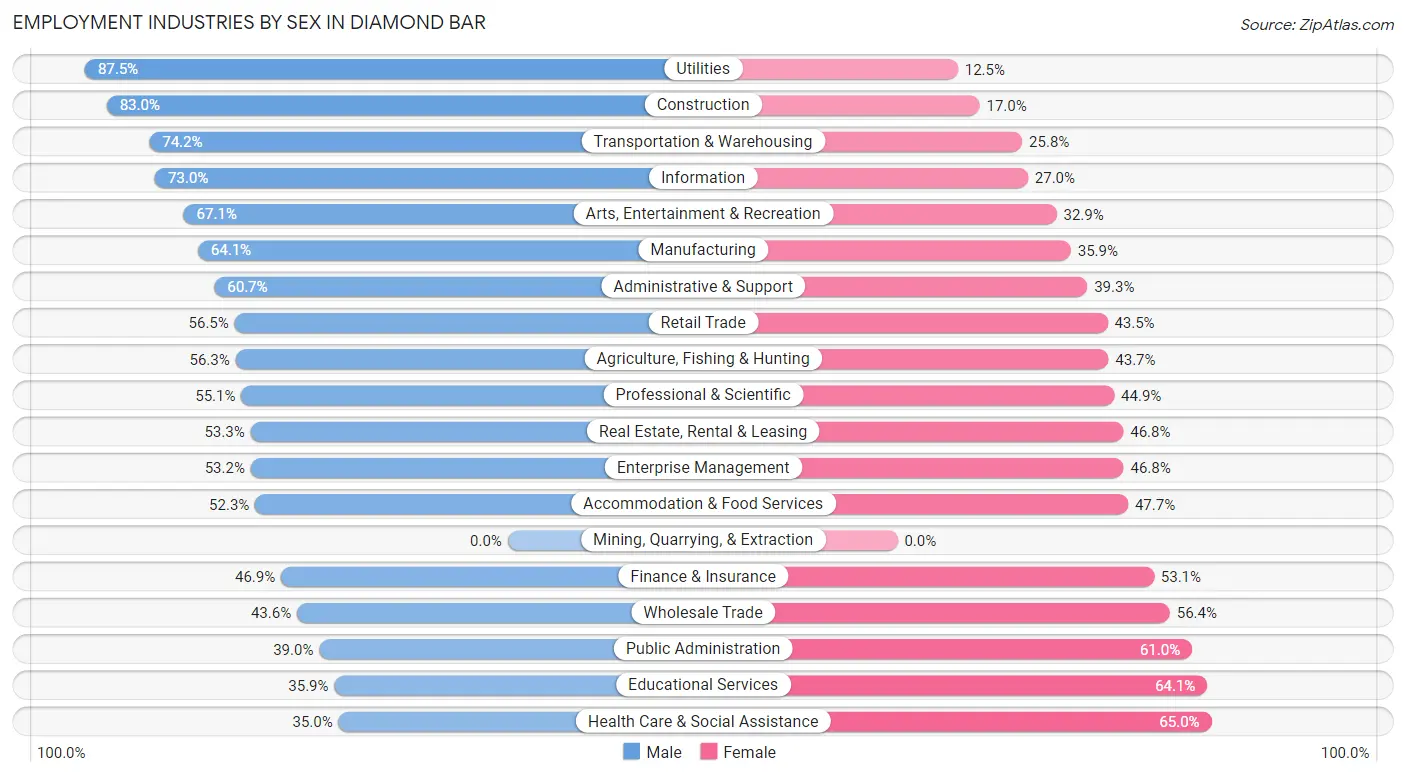
| Industry | Male | Female |
| Agriculture, Fishing & Hunting | 40 (56.3%) | 31 (43.7%) |
| Mining, Quarrying, & Extraction | 0 (0.0%) | 0 (0.0%) |
| Construction | 786 (83.0%) | 161 (17.0%) |
| Manufacturing | 1,462 (64.1%) | 818 (35.9%) |
| Wholesale Trade | 786 (43.6%) | 1,016 (56.4%) |
| Retail Trade | 1,715 (56.5%) | 1,319 (43.5%) |
| Transportation & Warehousing | 1,034 (74.2%) | 360 (25.8%) |
| Utilities | 252 (87.5%) | 36 (12.5%) |
| Information | 292 (73.0%) | 108 (27.0%) |
| Finance & Insurance | 853 (46.9%) | 965 (53.1%) |
| Real Estate, Rental & Leasing | 352 (53.2%) | 309 (46.8%) |
| Professional & Scientific | 1,667 (55.1%) | 1,356 (44.9%) |
| Enterprise Management | 25 (53.2%) | 22 (46.8%) |
| Administrative & Support | 340 (60.7%) | 220 (39.3%) |
| Educational Services | 819 (35.9%) | 1,463 (64.1%) |
| Health Care & Social Assistance | 1,269 (35.0%) | 2,356 (65.0%) |
| Arts, Entertainment & Recreation | 446 (67.1%) | 219 (32.9%) |
| Accommodation & Food Services | 827 (52.3%) | 755 (47.7%) |
| Public Administration | 512 (39.0%) | 800 (61.0%) |
| Total | 13,916 (52.2%) | 12,734 (47.8%) |
Education in Diamond Bar
School Enrollment in Diamond Bar
The most common levels of schooling among the 13,873 students in Diamond Bar are college / undergraduate (4,073 | 29.4%), middle school (2,952 | 21.3%), and high school (2,535 | 18.3%).
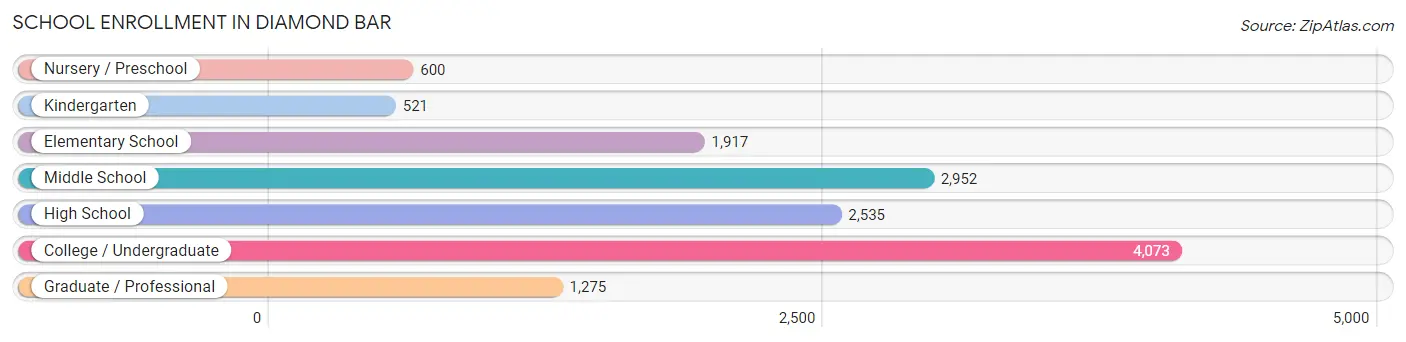
| School Level | # Students | % Students |
| Nursery / Preschool | 600 | 4.3% |
| Kindergarten | 521 | 3.8% |
| Elementary School | 1,917 | 13.8% |
| Middle School | 2,952 | 21.3% |
| High School | 2,535 | 18.3% |
| College / Undergraduate | 4,073 | 29.4% |
| Graduate / Professional | 1,275 | 9.2% |
| Total | 13,873 | 100.0% |
School Enrollment by Age by Funding Source in Diamond Bar
Out of a total of 13,873 students who are enrolled in schools in Diamond Bar, 2,039 (14.7%) attend a private institution, while the remaining 11,834 (85.3%) are enrolled in public schools. The age group of 3 to 4 year olds has the highest likelihood of being enrolled in private schools, with 339 (72.3% in the age bracket) enrolled. Conversely, the age group of 15 to 17 year olds has the lowest likelihood of being enrolled in a private school, with 1,838 (94.1% in the age bracket) attending a public institution.
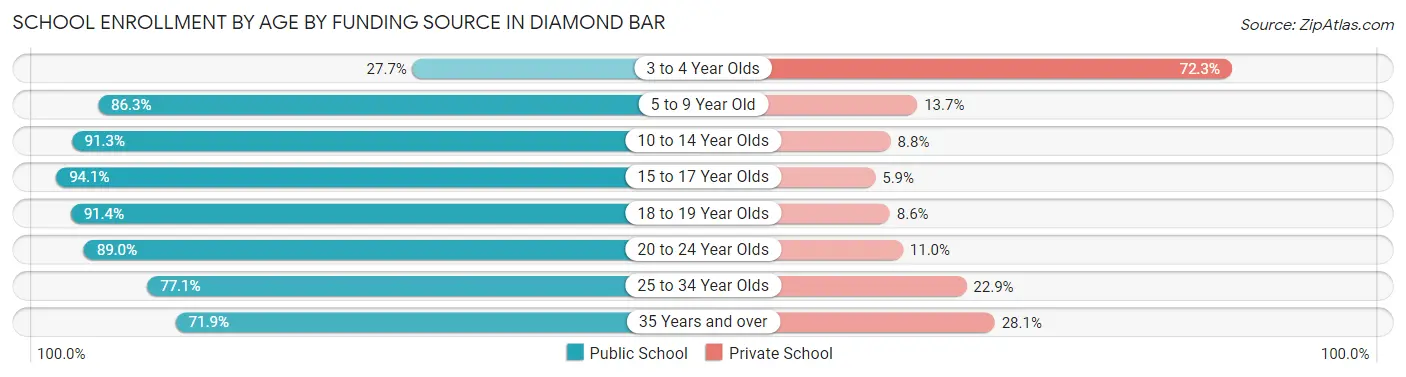
| Age Bracket | Public School | Private School |
| 3 to 4 Year Olds | 130 (27.7%) | 339 (72.3%) |
| 5 to 9 Year Old | 2,059 (86.3%) | 327 (13.7%) |
| 10 to 14 Year Olds | 3,213 (91.2%) | 308 (8.7%) |
| 15 to 17 Year Olds | 1,838 (94.1%) | 115 (5.9%) |
| 18 to 19 Year Olds | 1,116 (91.4%) | 105 (8.6%) |
| 20 to 24 Year Olds | 1,508 (89.0%) | 187 (11.0%) |
| 25 to 34 Year Olds | 1,279 (77.1%) | 379 (22.9%) |
| 35 Years and over | 697 (71.9%) | 273 (28.1%) |
| Total | 11,834 (85.3%) | 2,039 (14.7%) |
Educational Attainment by Field of Study in Diamond Bar
Business (5,477 | 25.1%), engineering (2,658 | 12.2%), science & technology (2,305 | 10.5%), social sciences (1,747 | 8.0%), and bio, nature & agricultural (1,383 | 6.3%) are the most common fields of study among 21,864 individuals in Diamond Bar who have obtained a bachelor's degree or higher.
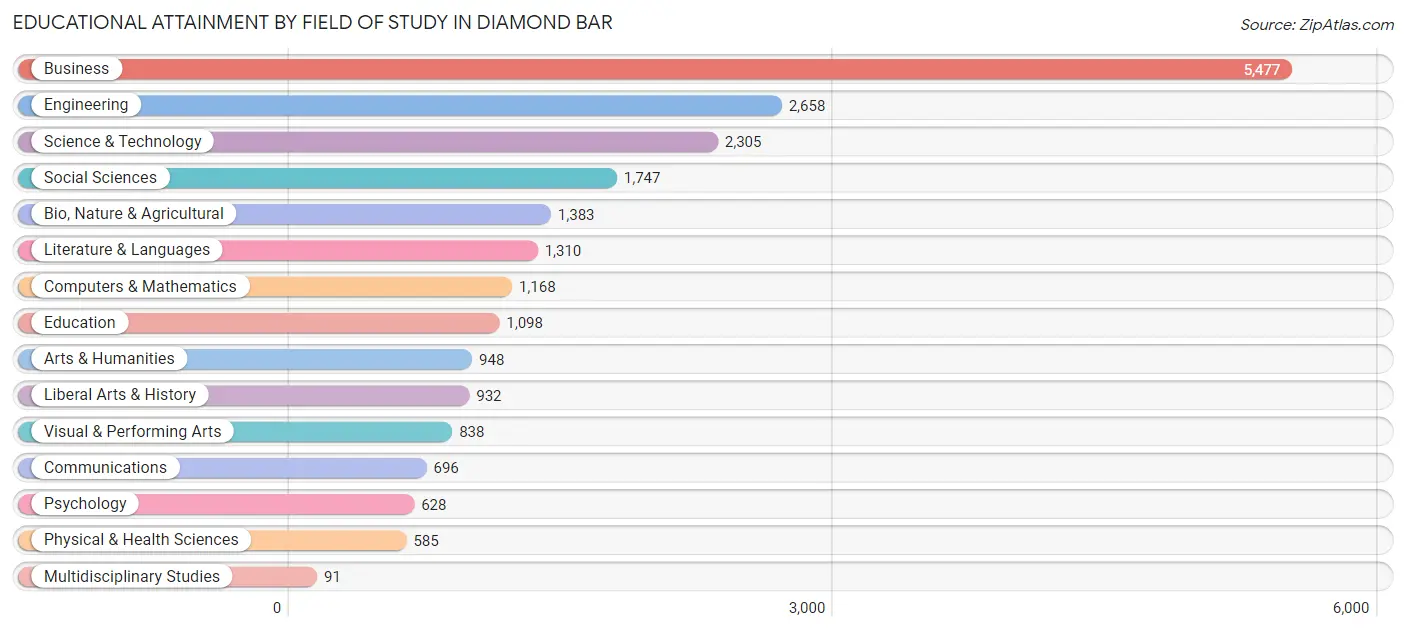
| Field of Study | # Graduates | % Graduates |
| Computers & Mathematics | 1,168 | 5.3% |
| Bio, Nature & Agricultural | 1,383 | 6.3% |
| Physical & Health Sciences | 585 | 2.7% |
| Psychology | 628 | 2.9% |
| Social Sciences | 1,747 | 8.0% |
| Engineering | 2,658 | 12.2% |
| Multidisciplinary Studies | 91 | 0.4% |
| Science & Technology | 2,305 | 10.5% |
| Business | 5,477 | 25.1% |
| Education | 1,098 | 5.0% |
| Literature & Languages | 1,310 | 6.0% |
| Liberal Arts & History | 932 | 4.3% |
| Visual & Performing Arts | 838 | 3.8% |
| Communications | 696 | 3.2% |
| Arts & Humanities | 948 | 4.3% |
| Total | 21,864 | 100.0% |
Transportation & Commute in Diamond Bar
Vehicle Availability by Sex in Diamond Bar
The most prevalent vehicle ownership categories in Diamond Bar are males with 2 vehicles (5,305, accounting for 39.2%) and females with 2 vehicles (4,850, making up 42.5%).
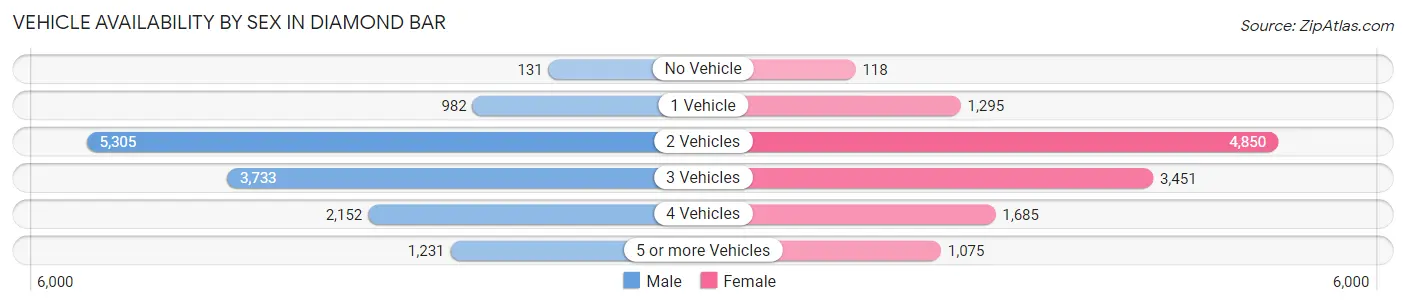
| Vehicles Available | Male | Female |
| No Vehicle | 131 (1.0%) | 118 (0.9%) |
| 1 Vehicle | 982 (7.3%) | 1,295 (10.4%) |
| 2 Vehicles | 5,305 (39.2%) | 4,850 (38.9%) |
| 3 Vehicles | 3,733 (27.6%) | 3,451 (27.7%) |
| 4 Vehicles | 2,152 (15.9%) | 1,685 (13.5%) |
| 5 or more Vehicles | 1,231 (9.1%) | 1,075 (8.6%) |
| Total | 13,534 (100.0%) | 12,474 (100.0%) |
Commute Time in Diamond Bar
The most frequently occuring commute durations in Diamond Bar are 30 to 34 minutes (3,588 commuters, 16.1%), 45 to 59 minutes (3,393 commuters, 15.2%), and 20 to 24 minutes (2,974 commuters, 13.4%).
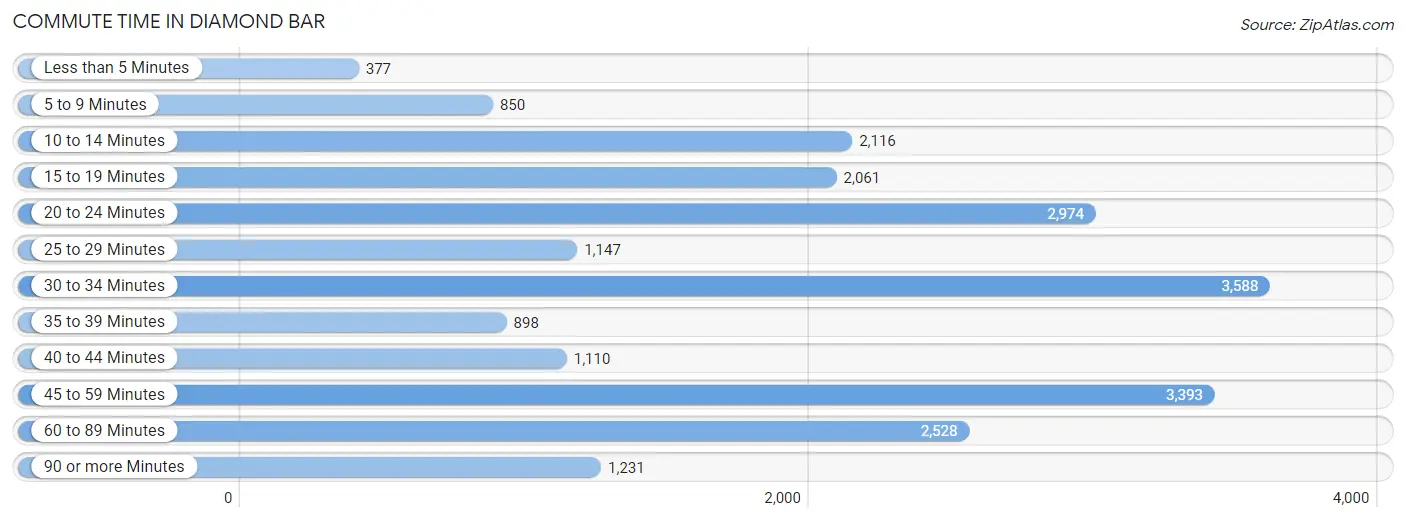
| Commute Time | # Commuters | % Commuters |
| Less than 5 Minutes | 377 | 1.7% |
| 5 to 9 Minutes | 850 | 3.8% |
| 10 to 14 Minutes | 2,116 | 9.5% |
| 15 to 19 Minutes | 2,061 | 9.2% |
| 20 to 24 Minutes | 2,974 | 13.4% |
| 25 to 29 Minutes | 1,147 | 5.1% |
| 30 to 34 Minutes | 3,588 | 16.1% |
| 35 to 39 Minutes | 898 | 4.0% |
| 40 to 44 Minutes | 1,110 | 5.0% |
| 45 to 59 Minutes | 3,393 | 15.2% |
| 60 to 89 Minutes | 2,528 | 11.4% |
| 90 or more Minutes | 1,231 | 5.5% |
Commute Time by Sex in Diamond Bar
The most common commute times in Diamond Bar are 45 to 59 minutes (1,884 commuters, 16.0%) for males and 30 to 34 minutes (1,774 commuters, 16.9%) for females.
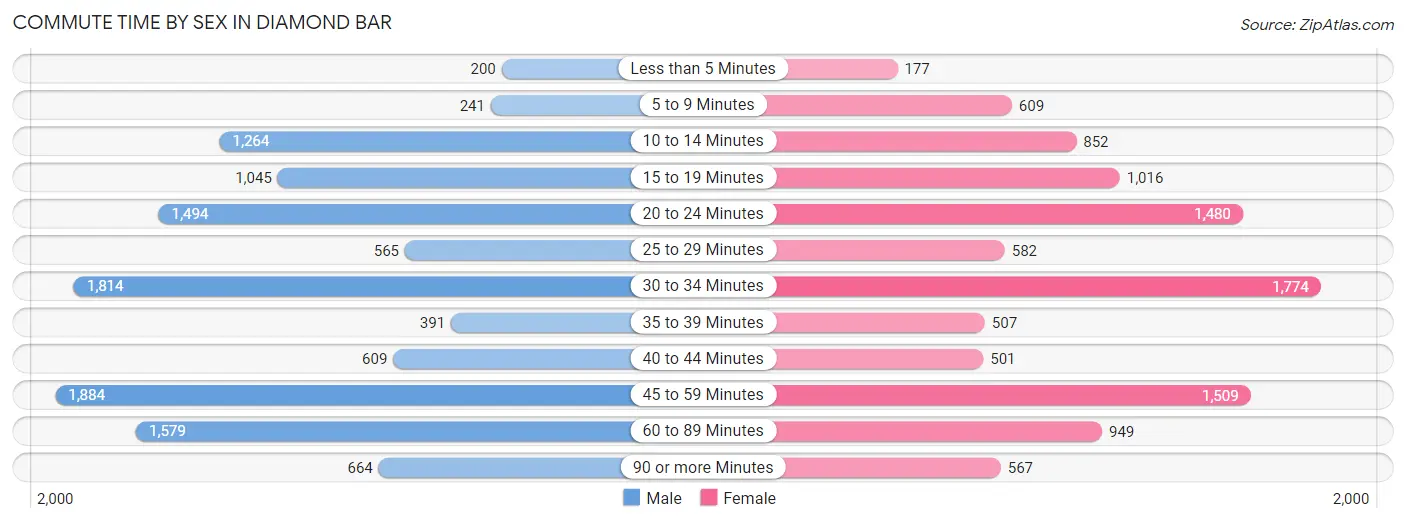
| Commute Time | Male | Female |
| Less than 5 Minutes | 200 (1.7%) | 177 (1.7%) |
| 5 to 9 Minutes | 241 (2.1%) | 609 (5.8%) |
| 10 to 14 Minutes | 1,264 (10.8%) | 852 (8.1%) |
| 15 to 19 Minutes | 1,045 (8.9%) | 1,016 (9.7%) |
| 20 to 24 Minutes | 1,494 (12.7%) | 1,480 (14.1%) |
| 25 to 29 Minutes | 565 (4.8%) | 582 (5.5%) |
| 30 to 34 Minutes | 1,814 (15.4%) | 1,774 (16.9%) |
| 35 to 39 Minutes | 391 (3.3%) | 507 (4.8%) |
| 40 to 44 Minutes | 609 (5.2%) | 501 (4.8%) |
| 45 to 59 Minutes | 1,884 (16.0%) | 1,509 (14.3%) |
| 60 to 89 Minutes | 1,579 (13.4%) | 949 (9.0%) |
| 90 or more Minutes | 664 (5.7%) | 567 (5.4%) |
Time of Departure to Work by Sex in Diamond Bar
The most frequent times of departure to work in Diamond Bar are 8:00 AM to 8:29 AM (1,697, 14.4%) for males and 8:00 AM to 8:29 AM (1,736, 16.5%) for females.
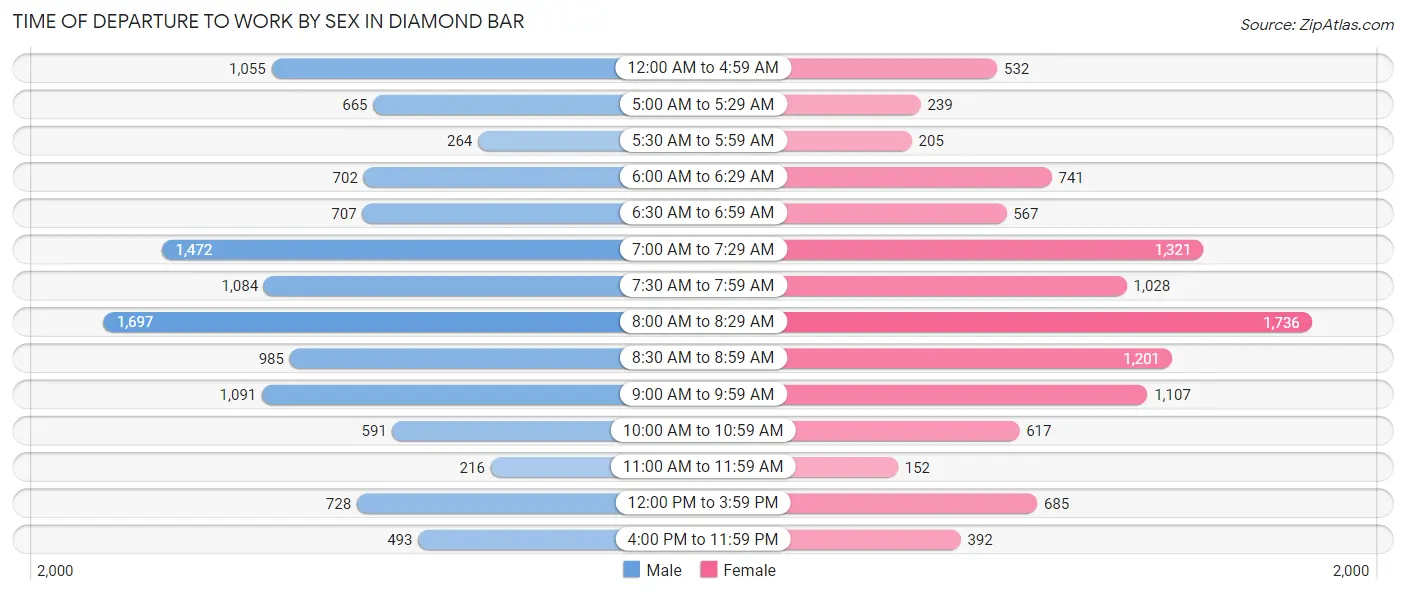
| Time of Departure | Male | Female |
| 12:00 AM to 4:59 AM | 1,055 (9.0%) | 532 (5.1%) |
| 5:00 AM to 5:29 AM | 665 (5.7%) | 239 (2.3%) |
| 5:30 AM to 5:59 AM | 264 (2.2%) | 205 (1.9%) |
| 6:00 AM to 6:29 AM | 702 (6.0%) | 741 (7.0%) |
| 6:30 AM to 6:59 AM | 707 (6.0%) | 567 (5.4%) |
| 7:00 AM to 7:29 AM | 1,472 (12.5%) | 1,321 (12.6%) |
| 7:30 AM to 7:59 AM | 1,084 (9.2%) | 1,028 (9.8%) |
| 8:00 AM to 8:29 AM | 1,697 (14.4%) | 1,736 (16.5%) |
| 8:30 AM to 8:59 AM | 985 (8.4%) | 1,201 (11.4%) |
| 9:00 AM to 9:59 AM | 1,091 (9.3%) | 1,107 (10.5%) |
| 10:00 AM to 10:59 AM | 591 (5.0%) | 617 (5.9%) |
| 11:00 AM to 11:59 AM | 216 (1.8%) | 152 (1.4%) |
| 12:00 PM to 3:59 PM | 728 (6.2%) | 685 (6.5%) |
| 4:00 PM to 11:59 PM | 493 (4.2%) | 392 (3.7%) |
| Total | 11,750 (100.0%) | 10,523 (100.0%) |
Housing Occupancy in Diamond Bar
Occupancy by Ownership in Diamond Bar
Of the total 17,820 dwellings in Diamond Bar, owner-occupied units account for 13,787 (77.4%), while renter-occupied units make up 4,033 (22.6%).
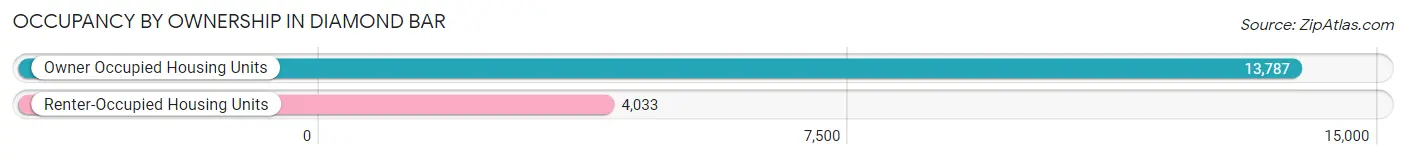
| Occupancy | # Housing Units | % Housing Units |
| Owner Occupied Housing Units | 13,787 | 77.4% |
| Renter-Occupied Housing Units | 4,033 | 22.6% |
| Total Occupied Housing Units | 17,820 | 100.0% |
Occupancy by Household Size in Diamond Bar
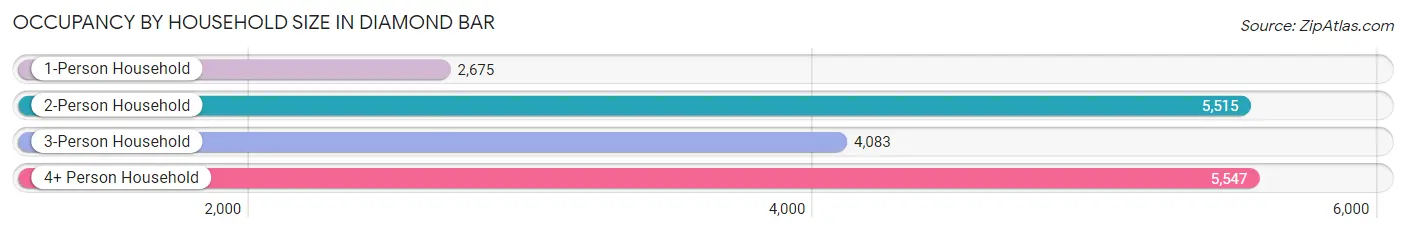
| Household Size | # Housing Units | % Housing Units |
| 1-Person Household | 2,675 | 15.0% |
| 2-Person Household | 5,515 | 30.9% |
| 3-Person Household | 4,083 | 22.9% |
| 4+ Person Household | 5,547 | 31.1% |
| Total Housing Units | 17,820 | 100.0% |
Occupancy by Ownership by Household Size in Diamond Bar
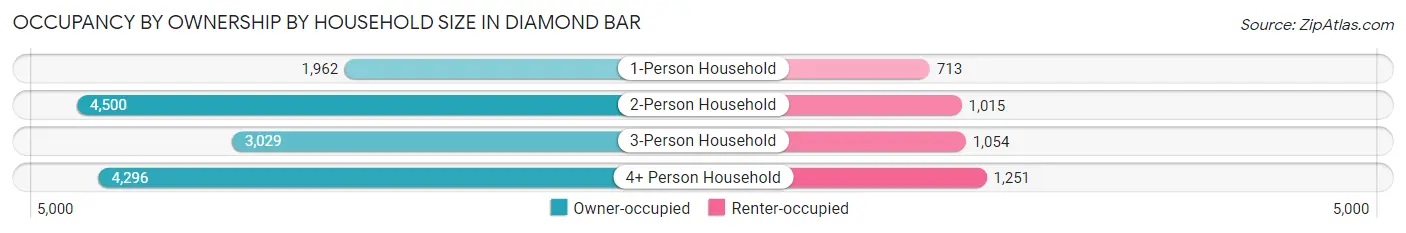
| Household Size | Owner-occupied | Renter-occupied |
| 1-Person Household | 1,962 (73.4%) | 713 (26.7%) |
| 2-Person Household | 4,500 (81.6%) | 1,015 (18.4%) |
| 3-Person Household | 3,029 (74.2%) | 1,054 (25.8%) |
| 4+ Person Household | 4,296 (77.4%) | 1,251 (22.6%) |
| Total Housing Units | 13,787 (77.4%) | 4,033 (22.6%) |
Occupancy by Educational Attainment in Diamond Bar
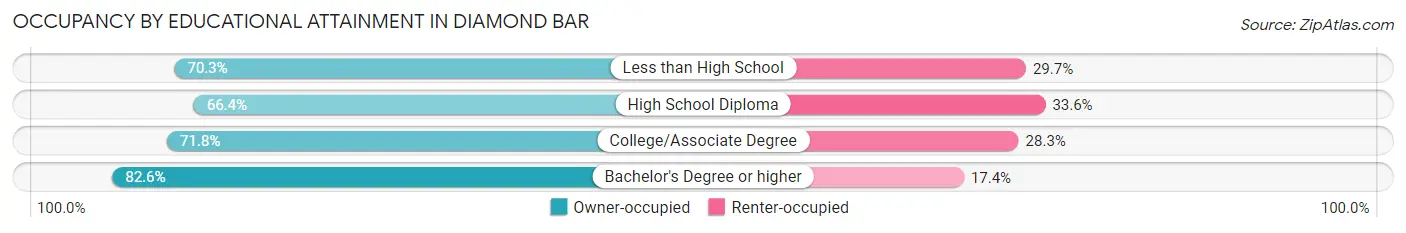
| Household Size | Owner-occupied | Renter-occupied |
| Less than High School | 710 (70.3%) | 300 (29.7%) |
| High School Diploma | 1,390 (66.4%) | 702 (33.6%) |
| College/Associate Degree | 3,109 (71.8%) | 1,224 (28.2%) |
| Bachelor's Degree or higher | 8,578 (82.6%) | 1,807 (17.4%) |
Occupancy by Age of Householder in Diamond Bar
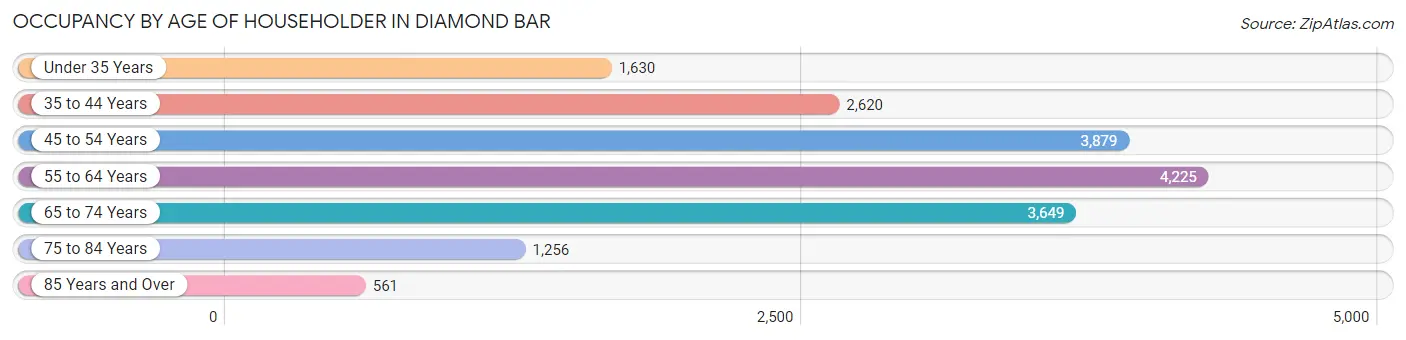
| Age Bracket | # Households | % Households |
| Under 35 Years | 1,630 | 9.1% |
| 35 to 44 Years | 2,620 | 14.7% |
| 45 to 54 Years | 3,879 | 21.8% |
| 55 to 64 Years | 4,225 | 23.7% |
| 65 to 74 Years | 3,649 | 20.5% |
| 75 to 84 Years | 1,256 | 7.0% |
| 85 Years and Over | 561 | 3.2% |
| Total | 17,820 | 100.0% |
Housing Finances in Diamond Bar
Median Income by Occupancy in Diamond Bar
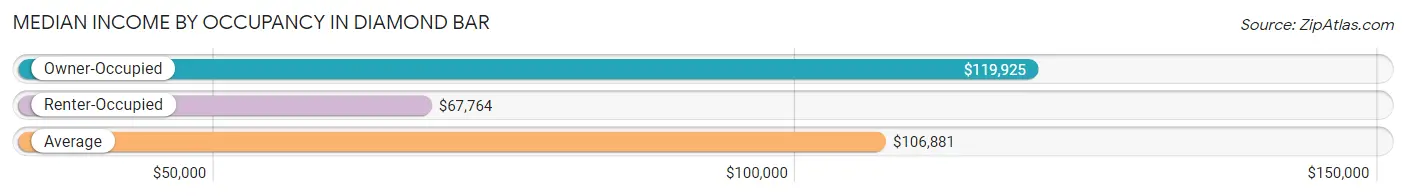
| Occupancy Type | # Households | Median Income |
| Owner-Occupied | 13,787 (77.4%) | $119,925 |
| Renter-Occupied | 4,033 (22.6%) | $67,764 |
| Average | 17,820 (100.0%) | $106,881 |
Occupancy by Householder Income Bracket in Diamond Bar
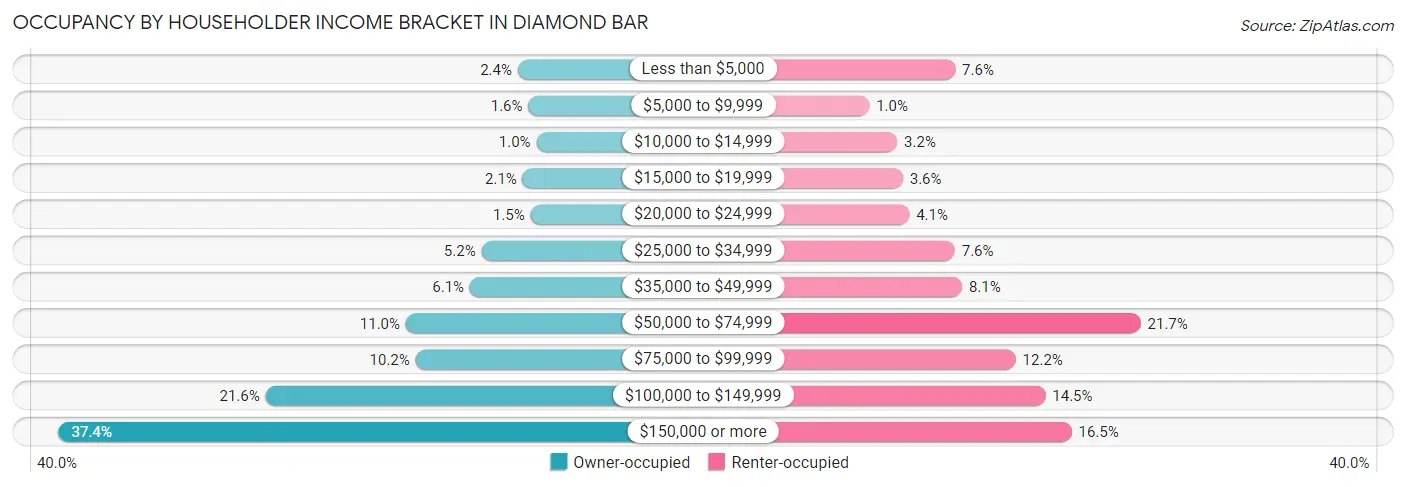
| Income Bracket | Owner-occupied | Renter-occupied |
| Less than $5,000 | 333 (2.4%) | 306 (7.6%) |
| $5,000 to $9,999 | 223 (1.6%) | 42 (1.0%) |
| $10,000 to $14,999 | 138 (1.0%) | 128 (3.2%) |
| $15,000 to $19,999 | 283 (2.1%) | 145 (3.6%) |
| $20,000 to $24,999 | 200 (1.5%) | 165 (4.1%) |
| $25,000 to $34,999 | 715 (5.2%) | 305 (7.6%) |
| $35,000 to $49,999 | 837 (6.1%) | 327 (8.1%) |
| $50,000 to $74,999 | 1,509 (11.0%) | 876 (21.7%) |
| $75,000 to $99,999 | 1,407 (10.2%) | 492 (12.2%) |
| $100,000 to $149,999 | 2,984 (21.6%) | 583 (14.5%) |
| $150,000 or more | 5,158 (37.4%) | 664 (16.5%) |
| Total | 13,787 (100.0%) | 4,033 (100.0%) |
Monthly Housing Cost Tiers in Diamond Bar
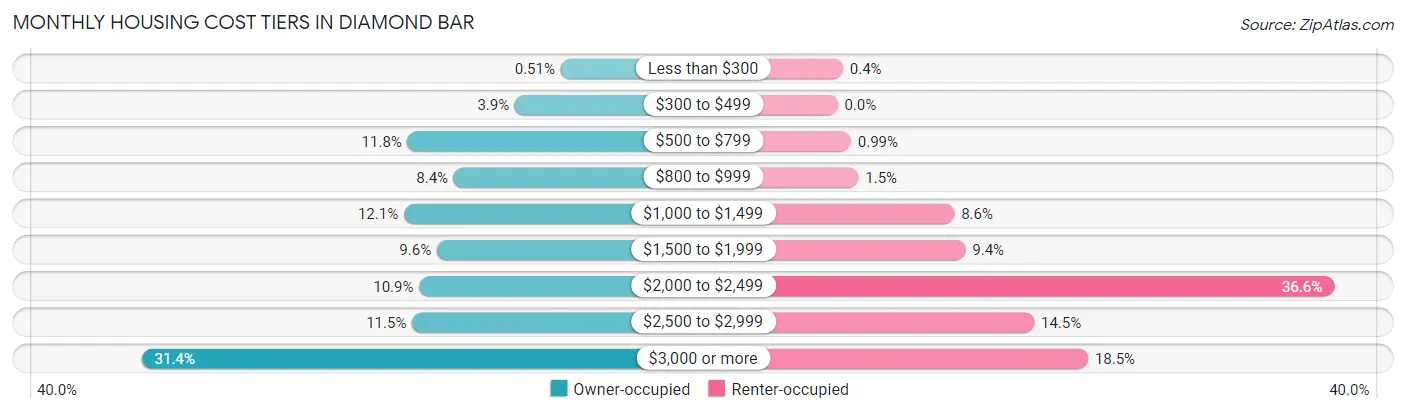
| Monthly Cost | Owner-occupied | Renter-occupied |
| Less than $300 | 70 (0.5%) | 16 (0.4%) |
| $300 to $499 | 535 (3.9%) | 0 (0.0%) |
| $500 to $799 | 1,625 (11.8%) | 40 (1.0%) |
| $800 to $999 | 1,155 (8.4%) | 62 (1.5%) |
| $1,000 to $1,499 | 1,663 (12.1%) | 347 (8.6%) |
| $1,500 to $1,999 | 1,327 (9.6%) | 380 (9.4%) |
| $2,000 to $2,499 | 1,507 (10.9%) | 1,475 (36.6%) |
| $2,500 to $2,999 | 1,579 (11.5%) | 584 (14.5%) |
| $3,000 or more | 4,326 (31.4%) | 744 (18.4%) |
| Total | 13,787 (100.0%) | 4,033 (100.0%) |
Physical Housing Characteristics in Diamond Bar
Housing Structures in Diamond Bar
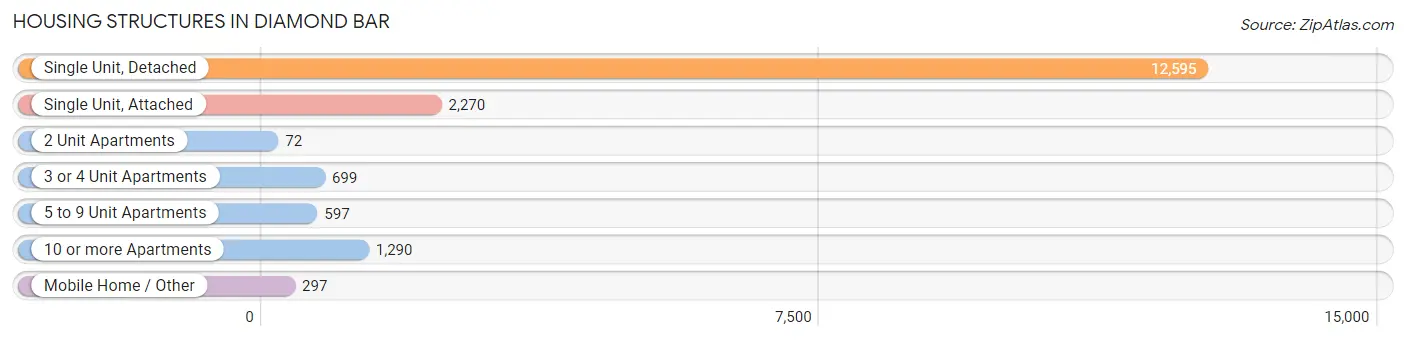
| Structure Type | # Housing Units | % Housing Units |
| Single Unit, Detached | 12,595 | 70.7% |
| Single Unit, Attached | 2,270 | 12.7% |
| 2 Unit Apartments | 72 | 0.4% |
| 3 or 4 Unit Apartments | 699 | 3.9% |
| 5 to 9 Unit Apartments | 597 | 3.4% |
| 10 or more Apartments | 1,290 | 7.2% |
| Mobile Home / Other | 297 | 1.7% |
| Total | 17,820 | 100.0% |
Housing Structures by Occupancy in Diamond Bar
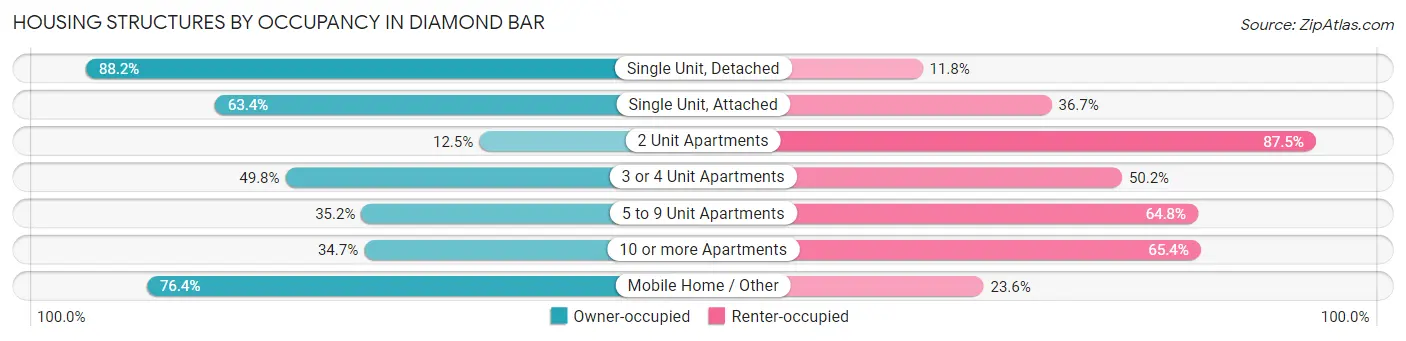
| Structure Type | Owner-occupied | Renter-occupied |
| Single Unit, Detached | 11,108 (88.2%) | 1,487 (11.8%) |
| Single Unit, Attached | 1,438 (63.3%) | 832 (36.6%) |
| 2 Unit Apartments | 9 (12.5%) | 63 (87.5%) |
| 3 or 4 Unit Apartments | 348 (49.8%) | 351 (50.2%) |
| 5 to 9 Unit Apartments | 210 (35.2%) | 387 (64.8%) |
| 10 or more Apartments | 447 (34.6%) | 843 (65.3%) |
| Mobile Home / Other | 227 (76.4%) | 70 (23.6%) |
| Total | 13,787 (77.4%) | 4,033 (22.6%) |
Housing Structures by Number of Rooms in Diamond Bar
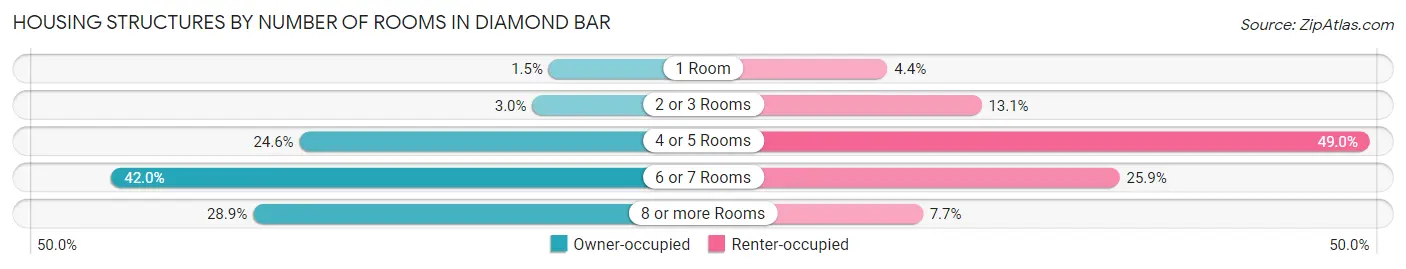
| Number of Rooms | Owner-occupied | Renter-occupied |
| 1 Room | 209 (1.5%) | 177 (4.4%) |
| 2 or 3 Rooms | 419 (3.0%) | 528 (13.1%) |
| 4 or 5 Rooms | 3,389 (24.6%) | 1,976 (49.0%) |
| 6 or 7 Rooms | 5,788 (42.0%) | 1,043 (25.9%) |
| 8 or more Rooms | 3,982 (28.9%) | 309 (7.7%) |
| Total | 13,787 (100.0%) | 4,033 (100.0%) |
Housing Structure by Heating Type in Diamond Bar
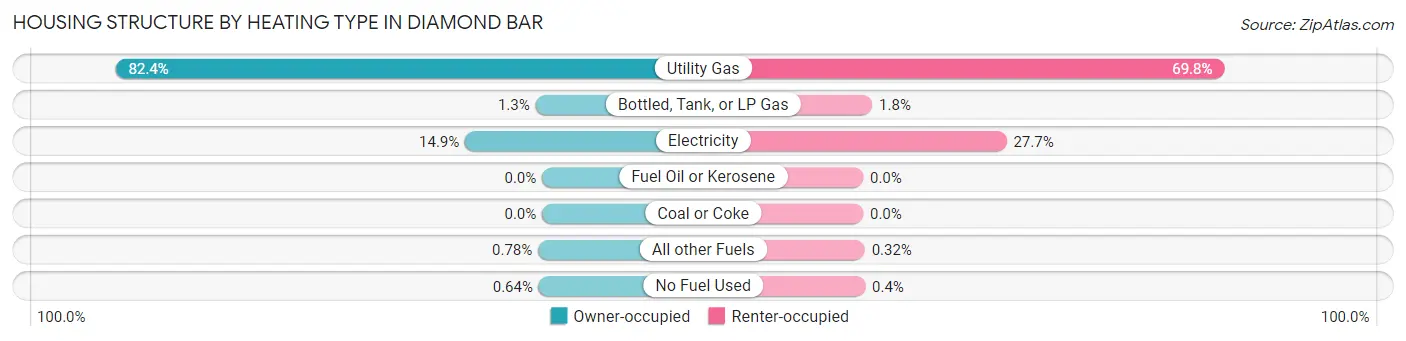
| Heating Type | Owner-occupied | Renter-occupied |
| Utility Gas | 11,366 (82.4%) | 2,815 (69.8%) |
| Bottled, Tank, or LP Gas | 174 (1.3%) | 71 (1.8%) |
| Electricity | 2,051 (14.9%) | 1,118 (27.7%) |
| Fuel Oil or Kerosene | 0 (0.0%) | 0 (0.0%) |
| Coal or Coke | 0 (0.0%) | 0 (0.0%) |
| All other Fuels | 108 (0.8%) | 13 (0.3%) |
| No Fuel Used | 88 (0.6%) | 16 (0.4%) |
| Total | 13,787 (100.0%) | 4,033 (100.0%) |
Household Vehicle Usage in Diamond Bar
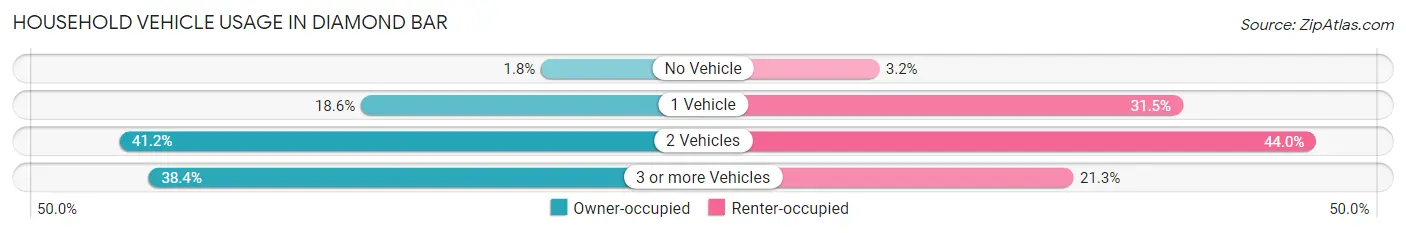
| Vehicles per Household | Owner-occupied | Renter-occupied |
| No Vehicle | 246 (1.8%) | 128 (3.2%) |
| 1 Vehicle | 2,565 (18.6%) | 1,272 (31.5%) |
| 2 Vehicles | 5,678 (41.2%) | 1,774 (44.0%) |
| 3 or more Vehicles | 5,298 (38.4%) | 859 (21.3%) |
| Total | 13,787 (100.0%) | 4,033 (100.0%) |
Real Estate & Mortgages in Diamond Bar
Real Estate and Mortgage Overview in Diamond Bar
| Characteristic | Without Mortgage | With Mortgage |
| Housing Units | 4,895 | 8,892 |
| Median Property Value | $820,300 | $833,600 |
| Median Household Income | $78,438 | $4,031 |
| Monthly Housing Costs | $856 | $4,270 |
| Real Estate Taxes | $5,322 | $94 |
Property Value by Mortgage Status in Diamond Bar
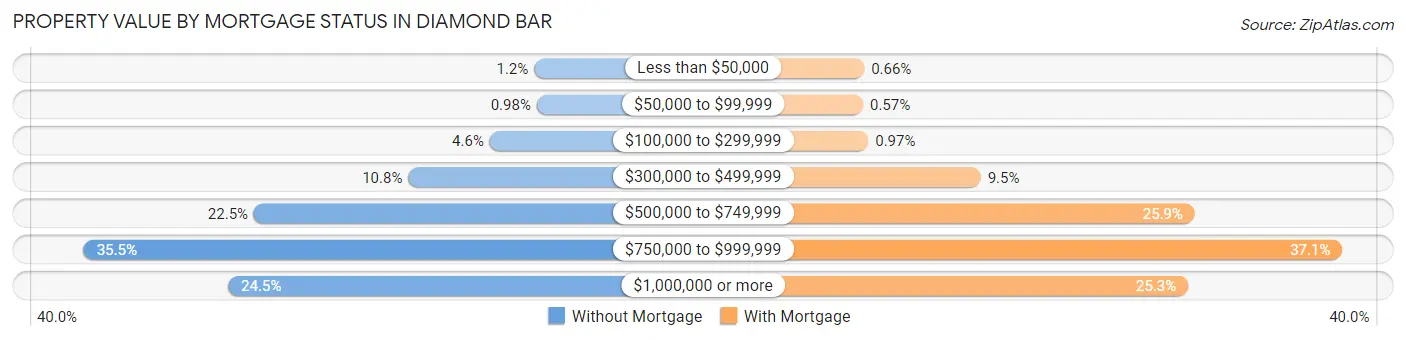
| Property Value | Without Mortgage | With Mortgage |
| Less than $50,000 | 58 (1.2%) | 59 (0.7%) |
| $50,000 to $99,999 | 48 (1.0%) | 51 (0.6%) |
| $100,000 to $299,999 | 223 (4.6%) | 86 (1.0%) |
| $300,000 to $499,999 | 527 (10.8%) | 848 (9.5%) |
| $500,000 to $749,999 | 1,103 (22.5%) | 2,299 (25.9%) |
| $750,000 to $999,999 | 1,737 (35.5%) | 3,297 (37.1%) |
| $1,000,000 or more | 1,199 (24.5%) | 2,252 (25.3%) |
| Total | 4,895 (100.0%) | 8,892 (100.0%) |
Household Income by Mortgage Status in Diamond Bar
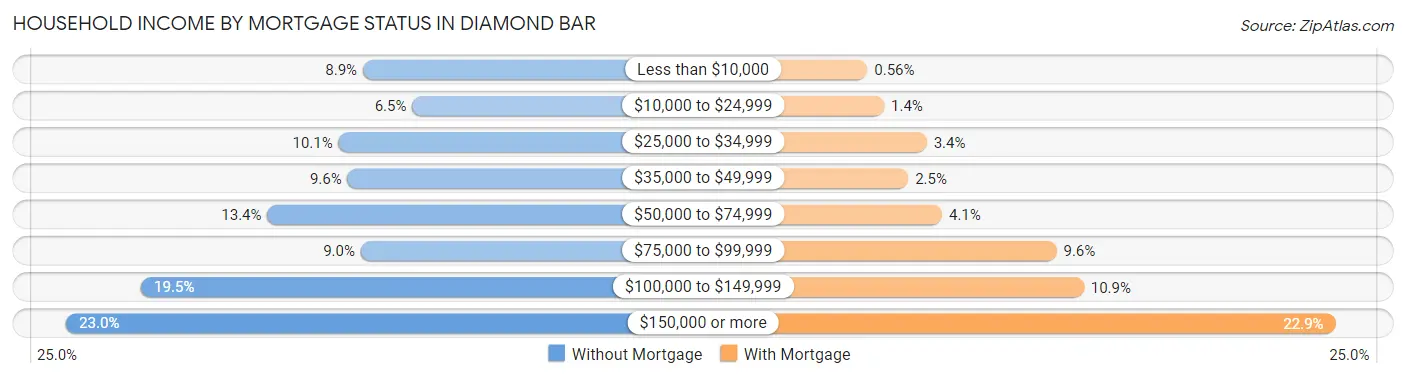
| Household Income | Without Mortgage | With Mortgage |
| Less than $10,000 | 435 (8.9%) | 50 (0.6%) |
| $10,000 to $24,999 | 320 (6.5%) | 121 (1.4%) |
| $25,000 to $34,999 | 492 (10.1%) | 301 (3.4%) |
| $35,000 to $49,999 | 471 (9.6%) | 223 (2.5%) |
| $50,000 to $74,999 | 658 (13.4%) | 366 (4.1%) |
| $75,000 to $99,999 | 440 (9.0%) | 851 (9.6%) |
| $100,000 to $149,999 | 952 (19.5%) | 967 (10.9%) |
| $150,000 or more | 1,127 (23.0%) | 2,032 (22.9%) |
| Total | 4,895 (100.0%) | 8,892 (100.0%) |
Property Value to Household Income Ratio in Diamond Bar
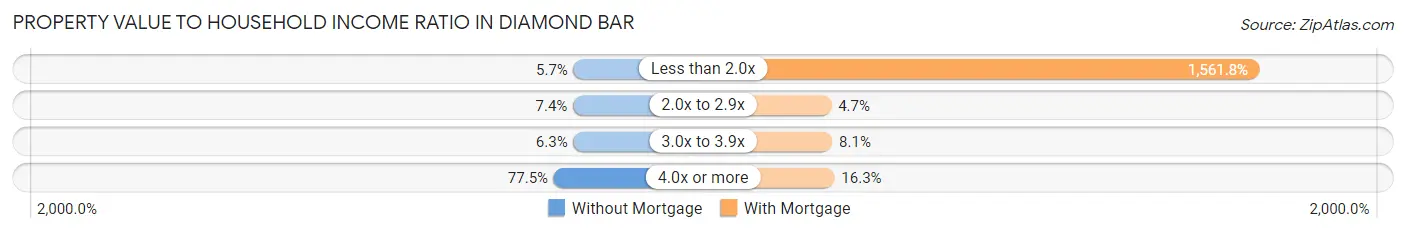
| Value-to-Income Ratio | Without Mortgage | With Mortgage |
| Less than 2.0x | 280 (5.7%) | 138,876 (1,561.8%) |
| 2.0x to 2.9x | 362 (7.4%) | 416 (4.7%) |
| 3.0x to 3.9x | 308 (6.3%) | 721 (8.1%) |
| 4.0x or more | 3,792 (77.5%) | 1,449 (16.3%) |
| Total | 4,895 (100.0%) | 8,892 (100.0%) |
Real Estate Taxes by Mortgage Status in Diamond Bar
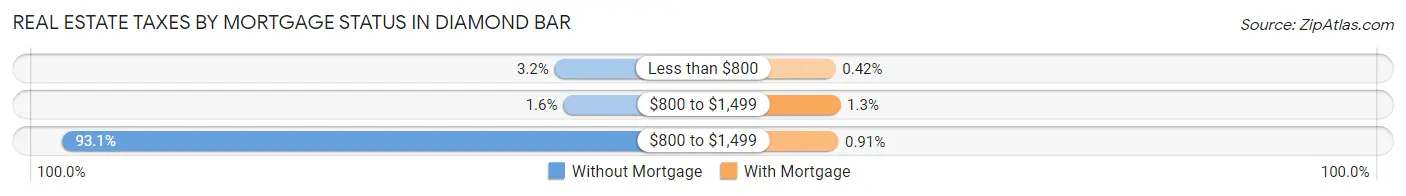
| Property Taxes | Without Mortgage | With Mortgage |
| Less than $800 | 157 (3.2%) | 37 (0.4%) |
| $800 to $1,499 | 79 (1.6%) | 116 (1.3%) |
| $800 to $1,499 | 4,556 (93.1%) | 81 (0.9%) |
| Total | 4,895 (100.0%) | 8,892 (100.0%) |
Health & Disability in Diamond Bar
Health Insurance Coverage by Age in Diamond Bar
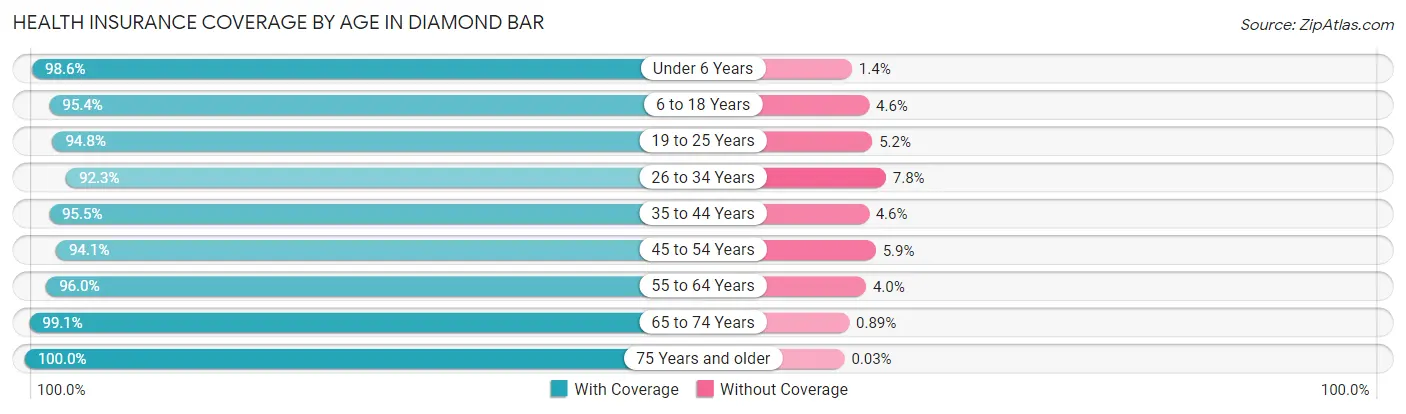
| Age Bracket | With Coverage | Without Coverage |
| Under 6 Years | 3,048 (98.6%) | 44 (1.4%) |
| 6 to 18 Years | 7,659 (95.4%) | 372 (4.6%) |
| 19 to 25 Years | 3,782 (94.8%) | 208 (5.2%) |
| 26 to 34 Years | 5,703 (92.2%) | 479 (7.7%) |
| 35 to 44 Years | 5,935 (95.5%) | 283 (4.5%) |
| 45 to 54 Years | 7,566 (94.1%) | 471 (5.9%) |
| 55 to 64 Years | 8,456 (96.0%) | 356 (4.0%) |
| 65 to 74 Years | 6,445 (99.1%) | 58 (0.9%) |
| 75 Years and older | 3,575 (100.0%) | 1 (0.0%) |
| Total | 52,169 (95.8%) | 2,272 (4.2%) |
Health Insurance Coverage by Citizenship Status in Diamond Bar
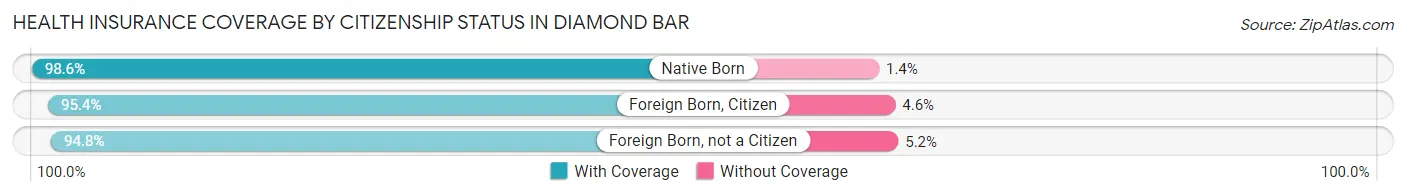
| Citizenship Status | With Coverage | Without Coverage |
| Native Born | 3,048 (98.6%) | 44 (1.4%) |
| Foreign Born, Citizen | 7,659 (95.4%) | 372 (4.6%) |
| Foreign Born, not a Citizen | 3,782 (94.8%) | 208 (5.2%) |
Health Insurance Coverage by Household Income in Diamond Bar
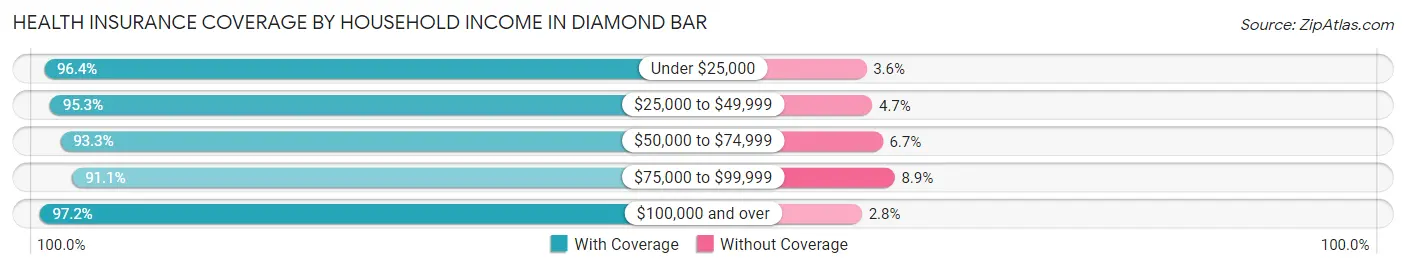
| Household Income | With Coverage | Without Coverage |
| Under $25,000 | 3,826 (96.4%) | 144 (3.6%) |
| $25,000 to $49,999 | 5,280 (95.3%) | 262 (4.7%) |
| $50,000 to $74,999 | 6,397 (93.3%) | 458 (6.7%) |
| $75,000 to $99,999 | 5,209 (91.1%) | 511 (8.9%) |
| $100,000 and over | 31,243 (97.2%) | 896 (2.8%) |
Public vs Private Health Insurance Coverage by Age in Diamond Bar
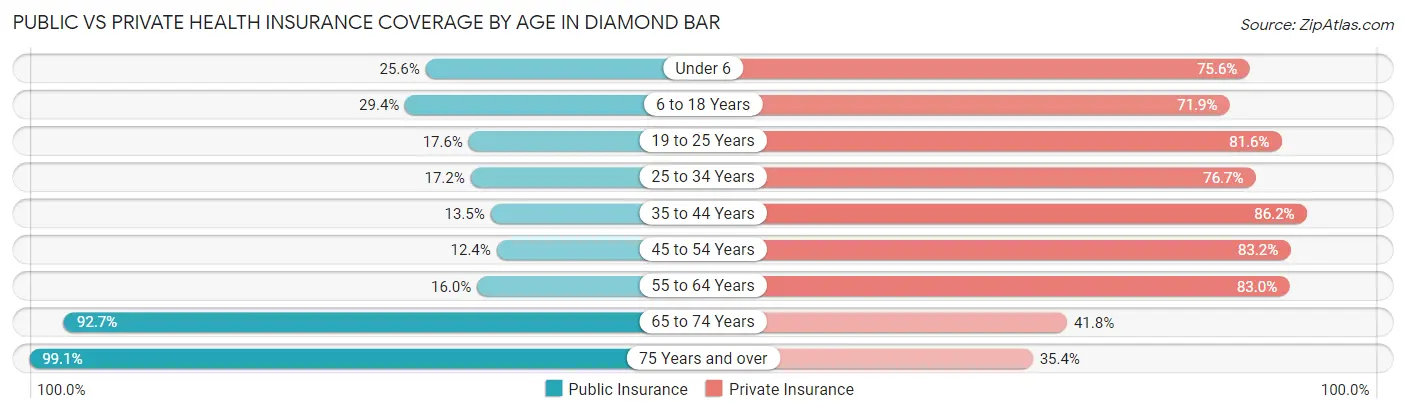
| Age Bracket | Public Insurance | Private Insurance |
| Under 6 | 791 (25.6%) | 2,338 (75.6%) |
| 6 to 18 Years | 2,358 (29.4%) | 5,777 (71.9%) |
| 19 to 25 Years | 701 (17.6%) | 3,255 (81.6%) |
| 25 to 34 Years | 1,065 (17.2%) | 4,744 (76.7%) |
| 35 to 44 Years | 840 (13.5%) | 5,362 (86.2%) |
| 45 to 54 Years | 996 (12.4%) | 6,686 (83.2%) |
| 55 to 64 Years | 1,412 (16.0%) | 7,314 (83.0%) |
| 65 to 74 Years | 6,028 (92.7%) | 2,718 (41.8%) |
| 75 Years and over | 3,545 (99.1%) | 1,267 (35.4%) |
| Total | 17,736 (32.6%) | 39,461 (72.5%) |
Disability Status by Sex by Age in Diamond Bar
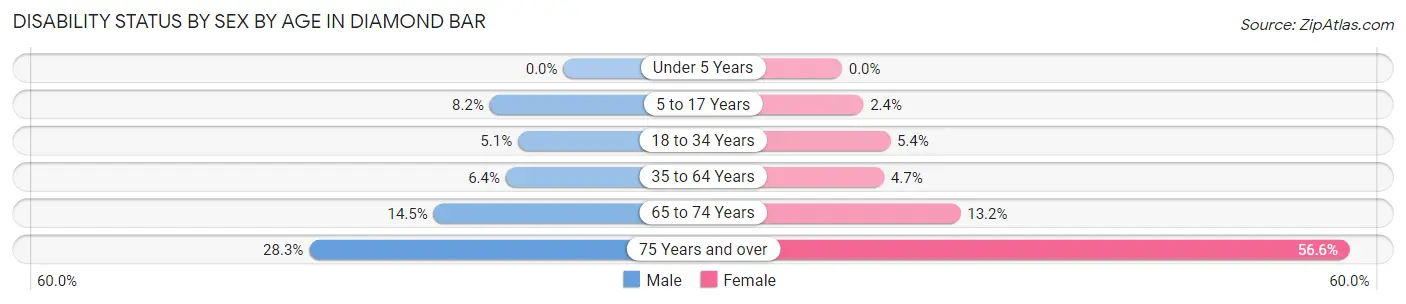
| Age Bracket | Male | Female |
| Under 5 Years | 0 (0.0%) | 0 (0.0%) |
| 5 to 17 Years | 305 (8.2%) | 104 (2.4%) |
| 18 to 34 Years | 278 (5.1%) | 279 (5.4%) |
| 35 to 64 Years | 702 (6.4%) | 568 (4.7%) |
| 65 to 74 Years | 435 (14.4%) | 461 (13.2%) |
| 75 Years and over | 419 (28.3%) | 1,186 (56.6%) |
Disability Class by Sex by Age in Diamond Bar
Disability Class: Hearing Difficulty
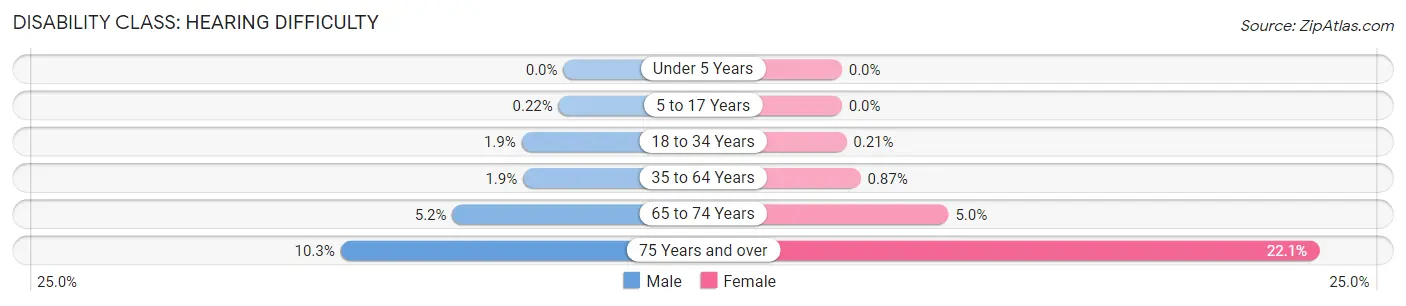
| Age Bracket | Male | Female |
| Under 5 Years | 0 (0.0%) | 0 (0.0%) |
| 5 to 17 Years | 8 (0.2%) | 0 (0.0%) |
| 18 to 34 Years | 107 (1.9%) | 11 (0.2%) |
| 35 to 64 Years | 205 (1.9%) | 105 (0.9%) |
| 65 to 74 Years | 155 (5.1%) | 173 (5.0%) |
| 75 Years and over | 153 (10.3%) | 464 (22.1%) |
Disability Class: Vision Difficulty
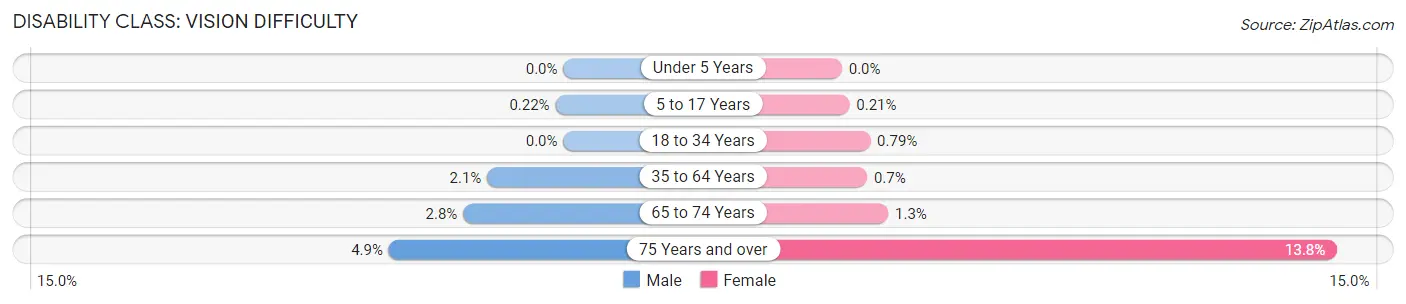
| Age Bracket | Male | Female |
| Under 5 Years | 0 (0.0%) | 0 (0.0%) |
| 5 to 17 Years | 8 (0.2%) | 9 (0.2%) |
| 18 to 34 Years | 0 (0.0%) | 41 (0.8%) |
| 35 to 64 Years | 232 (2.1%) | 85 (0.7%) |
| 65 to 74 Years | 84 (2.8%) | 45 (1.3%) |
| 75 Years and over | 72 (4.9%) | 289 (13.8%) |
Disability Class: Cognitive Difficulty
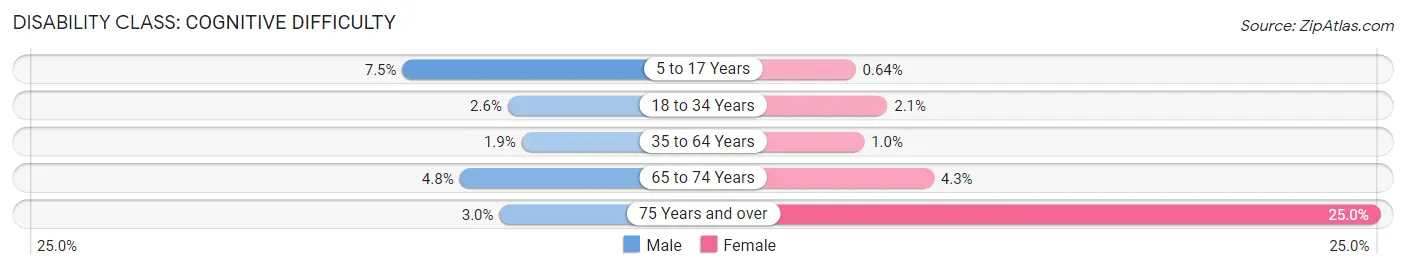
| Age Bracket | Male | Female |
| 5 to 17 Years | 278 (7.5%) | 28 (0.6%) |
| 18 to 34 Years | 142 (2.6%) | 110 (2.1%) |
| 35 to 64 Years | 213 (1.9%) | 126 (1.0%) |
| 65 to 74 Years | 145 (4.8%) | 149 (4.3%) |
| 75 Years and over | 44 (3.0%) | 524 (25.0%) |
Disability Class: Ambulatory Difficulty
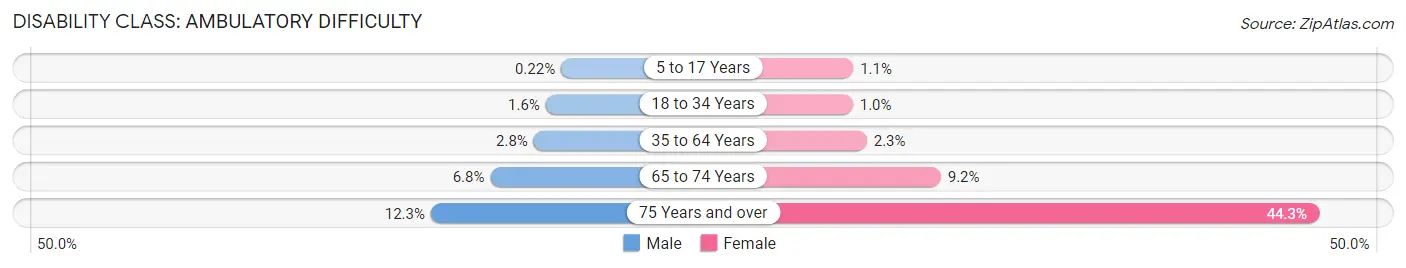
| Age Bracket | Male | Female |
| 5 to 17 Years | 8 (0.2%) | 46 (1.1%) |
| 18 to 34 Years | 90 (1.6%) | 53 (1.0%) |
| 35 to 64 Years | 301 (2.8%) | 281 (2.3%) |
| 65 to 74 Years | 204 (6.8%) | 321 (9.2%) |
| 75 Years and over | 182 (12.3%) | 928 (44.3%) |
Disability Class: Self-Care Difficulty
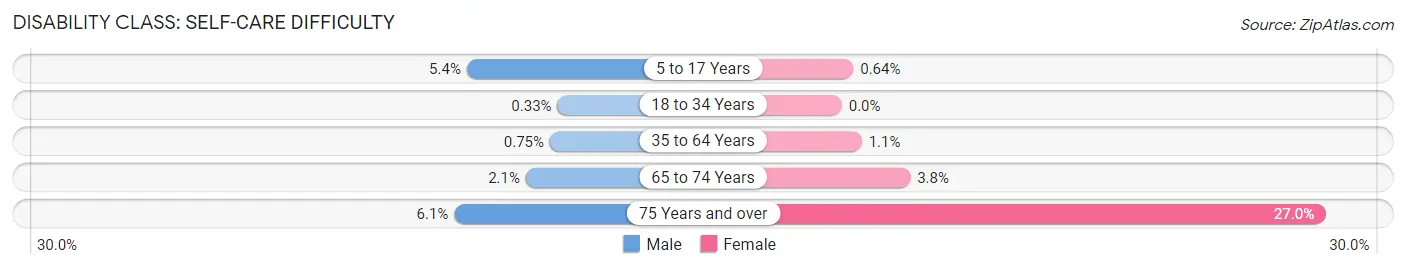
| Age Bracket | Male | Female |
| 5 to 17 Years | 200 (5.4%) | 28 (0.6%) |
| 18 to 34 Years | 18 (0.3%) | 0 (0.0%) |
| 35 to 64 Years | 82 (0.7%) | 135 (1.1%) |
| 65 to 74 Years | 63 (2.1%) | 133 (3.8%) |
| 75 Years and over | 90 (6.1%) | 565 (27.0%) |
Technology Access in Diamond Bar
Computing Device Access in Diamond Bar
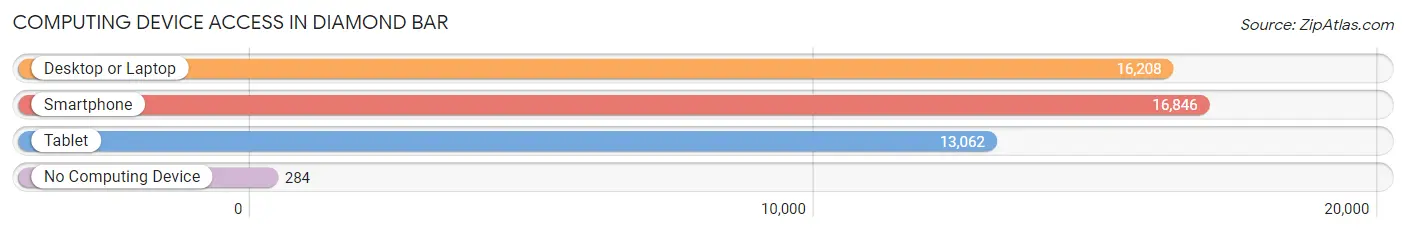
| Device Type | # Households | % Households |
| Desktop or Laptop | 16,208 | 90.9% |
| Smartphone | 16,846 | 94.5% |
| Tablet | 13,062 | 73.3% |
| No Computing Device | 284 | 1.6% |
| Total | 17,820 | 100.0% |
Internet Access in Diamond Bar
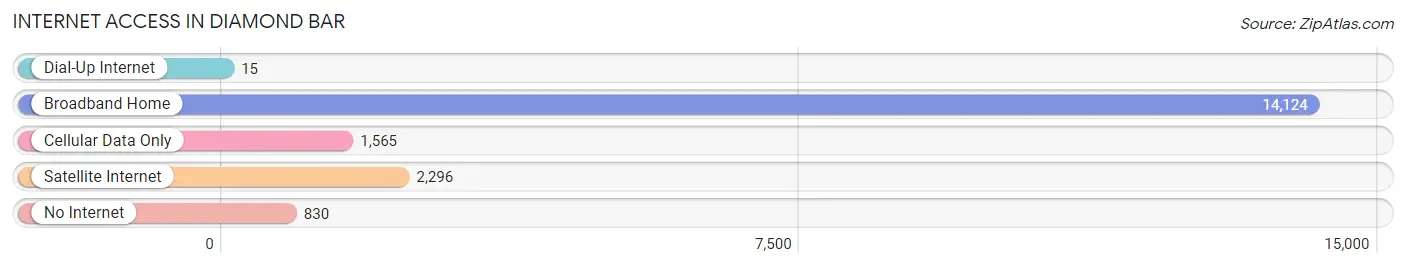
| Internet Type | # Households | % Households |
| Dial-Up Internet | 15 | 0.1% |
| Broadband Home | 14,124 | 79.3% |
| Cellular Data Only | 1,565 | 8.8% |
| Satellite Internet | 2,296 | 12.9% |
| No Internet | 830 | 4.7% |
| Total | 17,820 | 100.0% |
Diamond Bar Summary
Barstow, California is a city located in the San Gabriel Valley of Los Angeles County, California. It is located in the foothills of the San Gabriel Mountains, about 30 miles east of downtown Los Angeles. The city is bordered by the cities of Walnut, Diamond Bar, and Chino Hills. The population of Barstow was 22,639 at the 2010 census, up from 22,142 at the 2000 census.
History
The area that is now Barstow was originally inhabited by the Serrano Indians. The first Europeans to explore the area were the Spanish, who arrived in 1769. The area was part of the Rancho San Jose, a Mexican land grant given to Antonio Maria Lugo in 1842. The area was later settled by American settlers in the late 19th century. The town of Barstow was founded in 1885 by William Phipps Blake, a Civil War veteran and railroad engineer. The town was named after his friend, William Barstow Strong, who was then the president of the Atchison, Topeka and Santa Fe Railway.
Geography
Barstow is located at 34°51'25" North, 117°2'17" West (34.856944, -117.038333). According to the United States Census Bureau, the city has a total area of 28.6 square miles, of which 28.3 square miles is land and 0.3 square miles is water.
Economy
Barstow is a major transportation hub for the region. It is located at the intersection of Interstate 15 and Interstate 40, and is the closest city to the Marine Corps Logistics Base Barstow. The city is also home to the Barstow Station, a major Amtrak station. The city is also home to several major employers, including the Barstow Community College, the Barstow Unified School District, and the Barstow Community Hospital.
Demographics
As of the 2010 census, there were 22,639 people, 7,845 households, and 5,541 families residing in the city. The population density was 794.3 people per square mile. The racial makeup of the city was 63.2% White, 5.3% African American, 1.2% Native American, 1.7% Asian, 0.2% Pacific Islander, 25.2% from other races, and 3.4% from two or more races. Hispanic or Latino of any race were 51.2% of the population.
The median income for a household in the city was $37,813, and the median income for a family was $45,813. Males had a median income of $35,938 versus $27,938 for females. The per capita income for the city was $17,813. About 14.2% of families and 17.7% of the population were below the poverty line, including 25.2% of those under age 18 and 8.7% of those age 65 or over.
Common Questions
What is Per Capita Income in Diamond Bar?
Per Capita income in Diamond Bar is $45,516.
What is the Median Family Income in Diamond Bar?
Median Family Income in Diamond Bar is $116,683.
What is the Median Household income in Diamond Bar?
Median Household Income in Diamond Bar is $106,881.
What is Income or Wage Gap in Diamond Bar?
Income or Wage Gap in Diamond Bar is 25.7%.
Women in Diamond Bar earn 74.3 cents for every dollar earned by a man.
What is Family Income Deficit in Diamond Bar?
Family Income Deficit in Diamond Bar is $13,626.
Families that are below poverty line in Diamond Bar earn $13,626 less on average than the poverty threshold level.
What is Inequality or Gini Index in Diamond Bar?
Inequality or Gini Index in Diamond Bar is 0.45.
What is the Total Population of Diamond Bar?
Total Population of Diamond Bar is 54,534.
What is the Total Male Population of Diamond Bar?
Total Male Population of Diamond Bar is 26,016.
What is the Total Female Population of Diamond Bar?
Total Female Population of Diamond Bar is 28,518.
What is the Ratio of Males per 100 Females in Diamond Bar?
There are 91.23 Males per 100 Females in Diamond Bar.
What is the Ratio of Females per 100 Males in Diamond Bar?
There are 109.62 Females per 100 Males in Diamond Bar.
What is the Median Population Age in Diamond Bar?
Median Population Age in Diamond Bar is 44.7 Years.
What is the Average Family Size in Diamond Bar
Average Family Size in Diamond Bar is 3.4 People.
What is the Average Household Size in Diamond Bar
Average Household Size in Diamond Bar is 3.0 People.
How Large is the Labor Force in Diamond Bar?
There are 28,141 People in the Labor Forcein in Diamond Bar.
What is the Percentage of People in the Labor Force in Diamond Bar?
62.0% of People are in the Labor Force in Diamond Bar.
What is the Unemployment Rate in Diamond Bar?
Unemployment Rate in Diamond Bar is 5.2%.