Eastvale, CA Map & Demographics
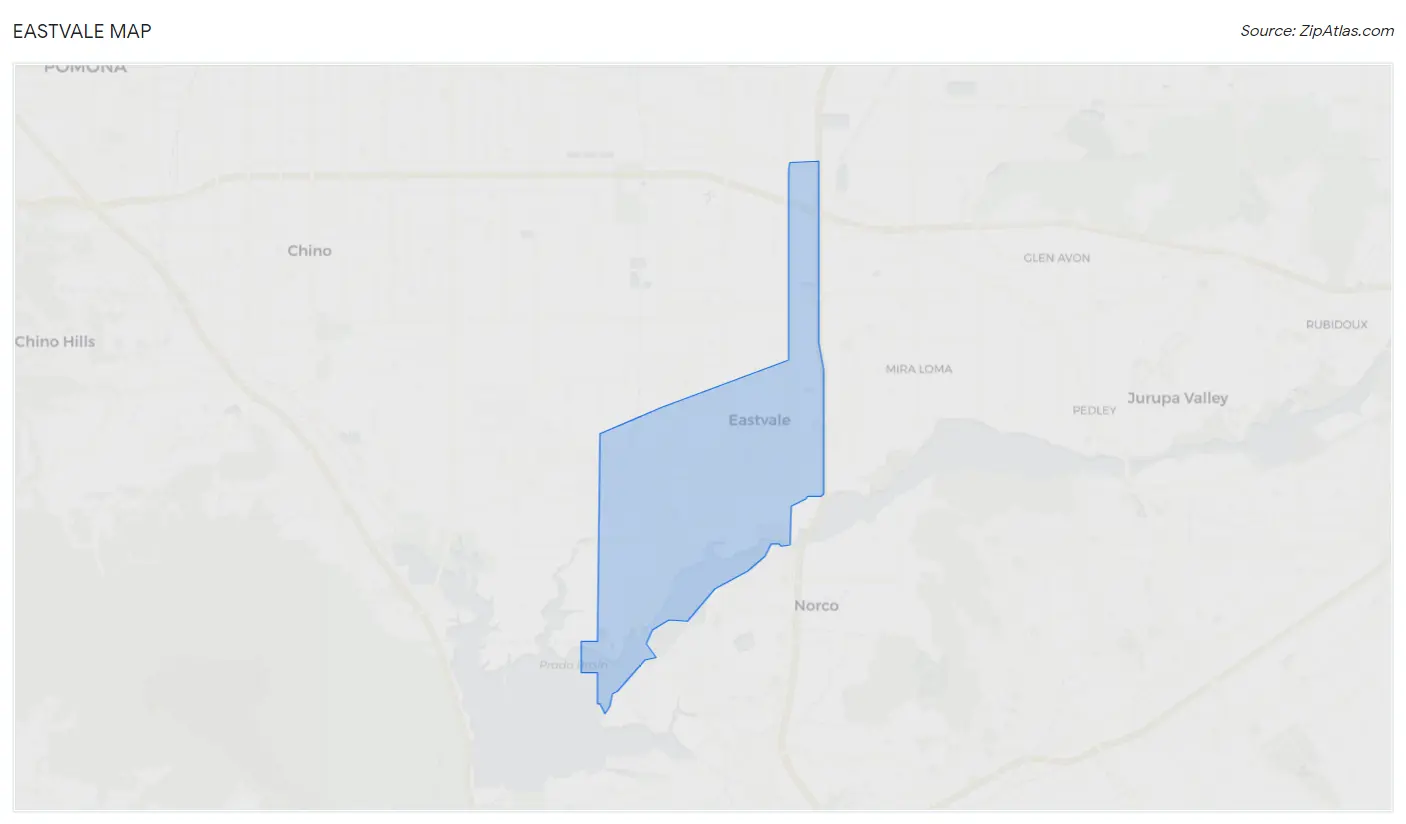
Eastvale Map
Eastvale Overview
$43,311
PER CAPITA INCOME
$153,947
AVG FAMILY INCOME
$151,615
AVG HOUSEHOLD INCOME
29.3%
WAGE / INCOME GAP [ % ]
70.7¢/ $1
WAGE / INCOME GAP [ $ ]
0.35
INEQUALITY / GINI INDEX
69,594
TOTAL POPULATION
35,042
MALE POPULATION
34,552
FEMALE POPULATION
101.42
MALES / 100 FEMALES
98.60
FEMALES / 100 MALES
34.7
MEDIAN AGE
4.2
AVG FAMILY SIZE
4.0
AVG HOUSEHOLD SIZE
36,889
LABOR FORCE [ PEOPLE ]
70.5%
PERCENT IN LABOR FORCE
4.5%
UNEMPLOYMENT RATE
Income in Eastvale
Income Overview in Eastvale
Per Capita Income in Eastvale is $43,311, while median incomes of families and households are $153,947 and $151,615 respectively.
| Characteristic | Number | Measure |
| Per Capita Income | 69,594 | $43,311 |
| Median Family Income | 15,723 | $153,947 |
| Mean Family Income | 15,723 | $169,654 |
| Median Household Income | 17,250 | $151,615 |
| Mean Household Income | 17,250 | $168,756 |
| Income Deficit | 15,723 | $0 |
| Wage / Income Gap (%) | 69,594 | 29.34% |
| Wage / Income Gap ($) | 69,594 | 70.66¢ per $1 |
| Gini / Inequality Index | 69,594 | 0.35 |
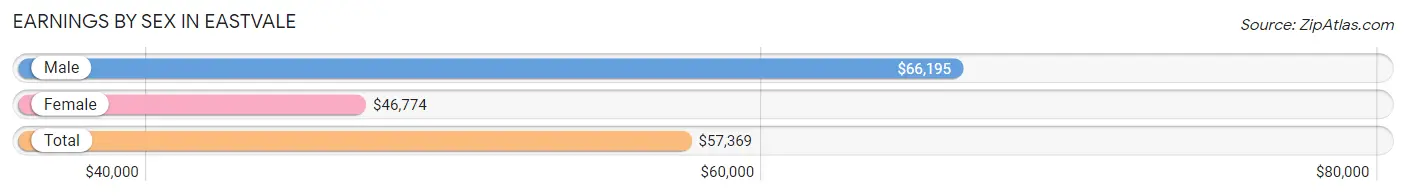
Earnings by Sex in Eastvale
Average Earnings in Eastvale are $57,369, $66,195 for men and $46,774 for women, a difference of 29.3%.
| Sex | Number | Average Earnings |
| Male | 20,956 (55.6%) | $66,195 |
| Female | 16,763 (44.4%) | $46,774 |
| Total | 37,719 (100.0%) | $57,369 |
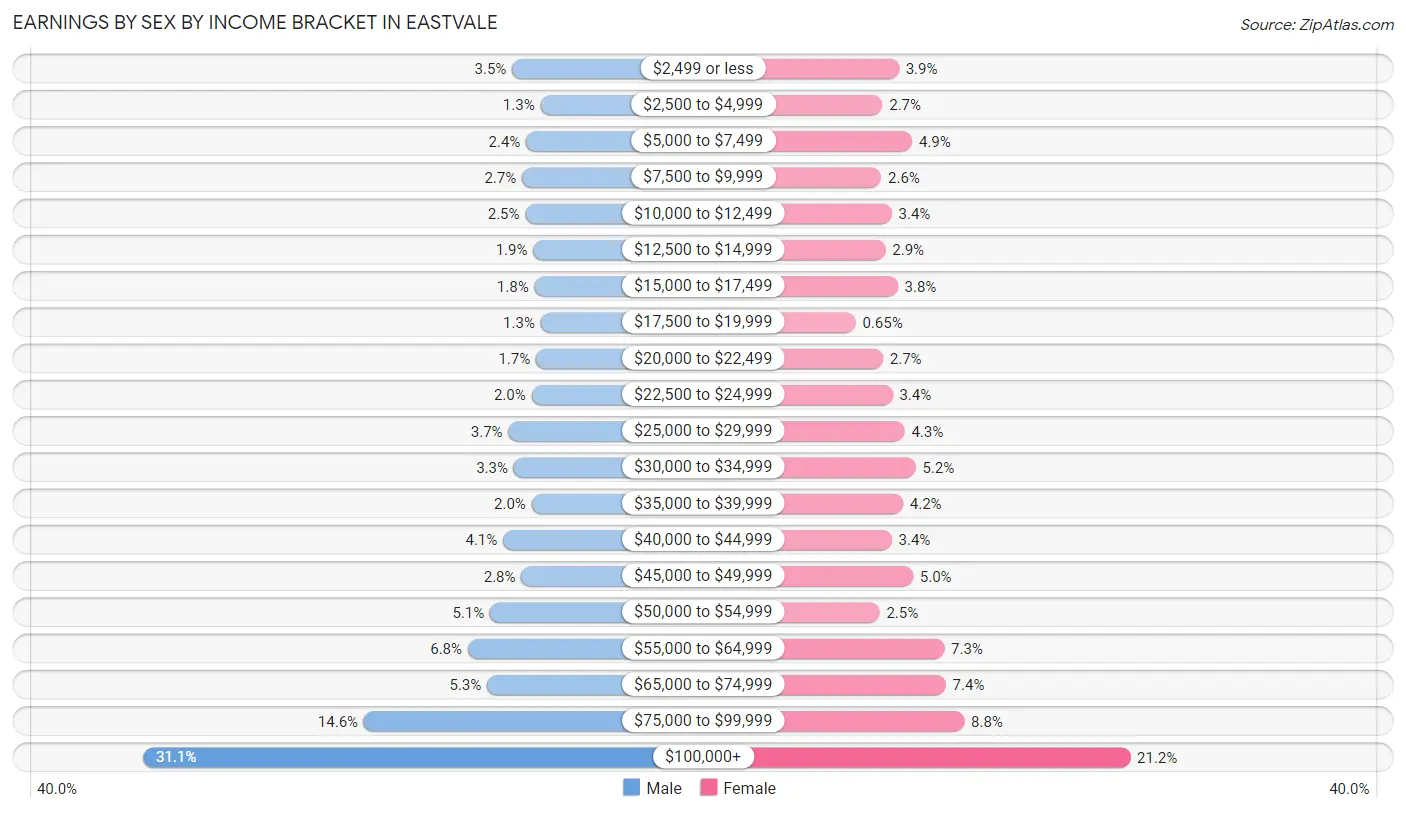
Earnings by Sex by Income Bracket in Eastvale
The most common earnings brackets in Eastvale are $100,000+ for men (6,522 | 31.1%) and $100,000+ for women (3,559 | 21.2%).
| Income | Male | Female |
| $2,499 or less | 726 (3.5%) | 652 (3.9%) |
| $2,500 to $4,999 | 281 (1.3%) | 446 (2.7%) |
| $5,000 to $7,499 | 505 (2.4%) | 820 (4.9%) |
| $7,500 to $9,999 | 571 (2.7%) | 431 (2.6%) |
| $10,000 to $12,499 | 518 (2.5%) | 564 (3.4%) |
| $12,500 to $14,999 | 394 (1.9%) | 484 (2.9%) |
| $15,000 to $17,499 | 375 (1.8%) | 639 (3.8%) |
| $17,500 to $19,999 | 277 (1.3%) | 109 (0.6%) |
| $20,000 to $22,499 | 349 (1.7%) | 452 (2.7%) |
| $22,500 to $24,999 | 421 (2.0%) | 573 (3.4%) |
| $25,000 to $29,999 | 783 (3.7%) | 724 (4.3%) |
| $30,000 to $34,999 | 700 (3.3%) | 864 (5.1%) |
| $35,000 to $39,999 | 420 (2.0%) | 704 (4.2%) |
| $40,000 to $44,999 | 868 (4.1%) | 564 (3.4%) |
| $45,000 to $49,999 | 580 (2.8%) | 830 (5.0%) |
| $50,000 to $54,999 | 1,073 (5.1%) | 411 (2.5%) |
| $55,000 to $64,999 | 1,421 (6.8%) | 1,222 (7.3%) |
| $65,000 to $74,999 | 1,119 (5.3%) | 1,242 (7.4%) |
| $75,000 to $99,999 | 3,053 (14.6%) | 1,473 (8.8%) |
| $100,000+ | 6,522 (31.1%) | 3,559 (21.2%) |
| Total | 20,956 (100.0%) | 16,763 (100.0%) |
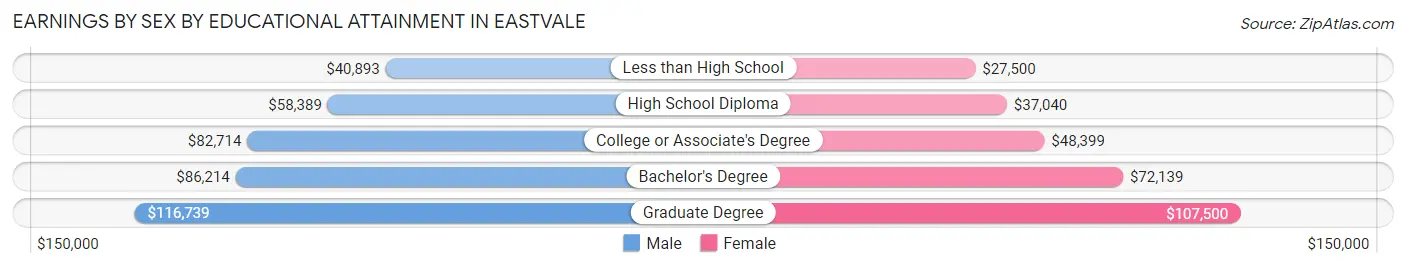
Earnings by Sex by Educational Attainment in Eastvale
Average earnings in Eastvale are $77,060 for men and $55,480 for women, a difference of 28.0%. Men with an educational attainment of graduate degree enjoy the highest average annual earnings of $116,739, while those with less than high school education earn the least with $40,893. Women with an educational attainment of graduate degree earn the most with the average annual earnings of $107,500, while those with less than high school education have the smallest earnings of $27,500.
| Educational Attainment | Male Income | Female Income |
| Less than High School | $40,893 | $27,500 |
| High School Diploma | $58,389 | $37,040 |
| College or Associate's Degree | $82,714 | $48,399 |
| Bachelor's Degree | $86,214 | $72,139 |
| Graduate Degree | $116,739 | $107,500 |
| Total | $77,060 | $55,480 |
Family Income in Eastvale
Family Income Brackets in Eastvale
According to the Eastvale family income data, there are 5,157 families falling into the $200,000+ income range, which is the most common income bracket and makes up 32.8% of all families. Conversely, the $10,000 to $14,999 income bracket is the least frequent group with only 79 families (0.5%) belonging to this category.
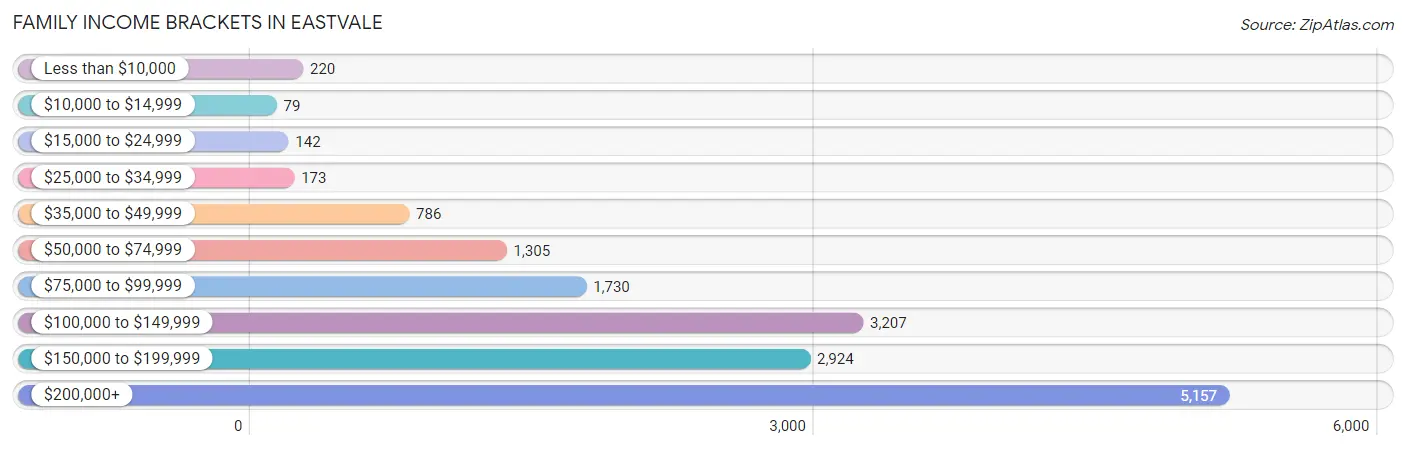
| Income Bracket | # Families | % Families |
| Less than $10,000 | 220 | 1.4% |
| $10,000 to $14,999 | 79 | 0.5% |
| $15,000 to $24,999 | 142 | 0.9% |
| $25,000 to $34,999 | 173 | 1.1% |
| $35,000 to $49,999 | 786 | 5.0% |
| $50,000 to $74,999 | 1,305 | 8.3% |
| $75,000 to $99,999 | 1,730 | 11.0% |
| $100,000 to $149,999 | 3,207 | 20.4% |
| $150,000 to $199,999 | 2,924 | 18.6% |
| $200,000+ | 5,157 | 32.8% |
Family Income by Famaliy Size in Eastvale
6-person families (1,225 | 7.8%) account for the highest median family income in Eastvale with $206,651 per family, while 2-person families (2,984 | 19.0%) have the highest median income of $59,464 per family member.
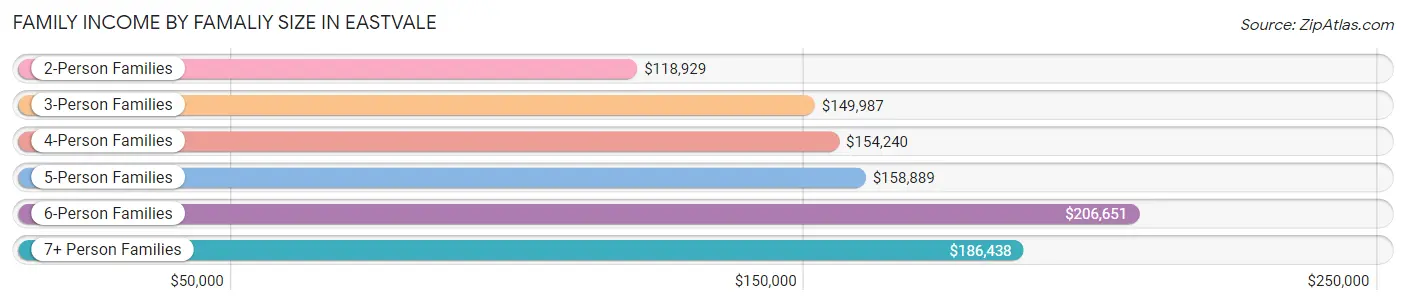
| Income Bracket | # Families | Median Income |
| 2-Person Families | 2,984 (19.0%) | $118,929 |
| 3-Person Families | 3,311 (21.1%) | $149,987 |
| 4-Person Families | 4,707 (29.9%) | $154,240 |
| 5-Person Families | 2,542 (16.2%) | $158,889 |
| 6-Person Families | 1,225 (7.8%) | $206,651 |
| 7+ Person Families | 954 (6.1%) | $186,438 |
| Total | 15,723 (100.0%) | $153,947 |
Family Income by Number of Earners in Eastvale
The median family income in Eastvale is $153,947, with families comprising 3+ earners (4,523) having the highest median family income of $191,324, while families with no earners (595) have the lowest median family income of $63,722, accounting for 28.8% and 3.8% of families, respectively.
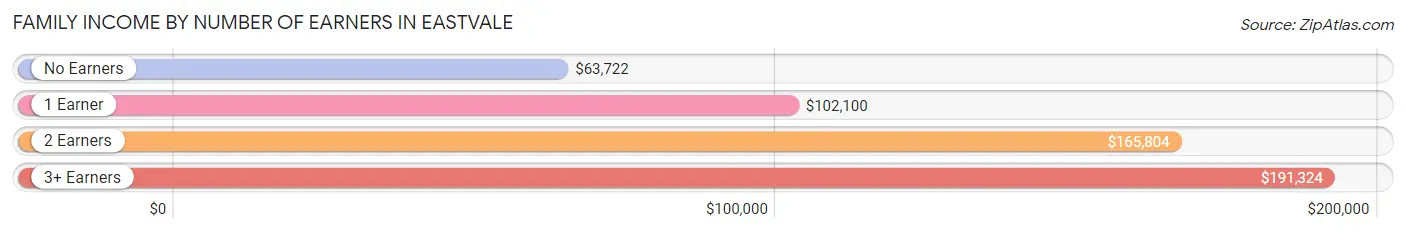
| Number of Earners | # Families | Median Income |
| No Earners | 595 (3.8%) | $63,722 |
| 1 Earner | 3,672 (23.4%) | $102,100 |
| 2 Earners | 6,933 (44.1%) | $165,804 |
| 3+ Earners | 4,523 (28.8%) | $191,324 |
| Total | 15,723 (100.0%) | $153,947 |
Household Income in Eastvale
Household Income Brackets in Eastvale
With 5,572 households falling in the category, the $200,000+ income range is the most frequent in Eastvale, accounting for 32.3% of all households. In contrast, only 121 households (0.7%) fall into the $10,000 to $14,999 income bracket, making it the least populous group.
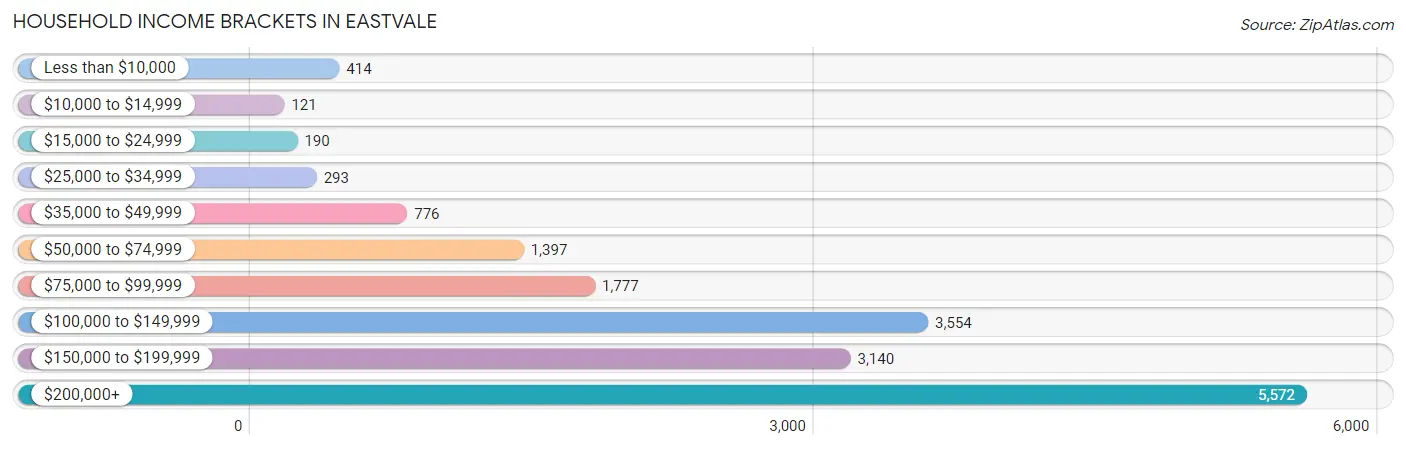
| Income Bracket | # Households | % Households |
| Less than $10,000 | 414 | 2.4% |
| $10,000 to $14,999 | 121 | 0.7% |
| $15,000 to $24,999 | 190 | 1.1% |
| $25,000 to $34,999 | 293 | 1.7% |
| $35,000 to $49,999 | 776 | 4.5% |
| $50,000 to $74,999 | 1,397 | 8.1% |
| $75,000 to $99,999 | 1,777 | 10.3% |
| $100,000 to $149,999 | 3,554 | 20.6% |
| $150,000 to $199,999 | 3,140 | 18.2% |
| $200,000+ | 5,572 | 32.3% |
Household Income by Householder Age in Eastvale
The median household income in Eastvale is $151,615, with the highest median household income of $155,997 found in the 25 to 44 years age bracket for the primary householder. A total of 7,044 households (40.8%) fall into this category. Meanwhile, the 15 to 24 years age bracket for the primary householder has the lowest median household income of $105,659, with 141 households (0.8%) in this group.
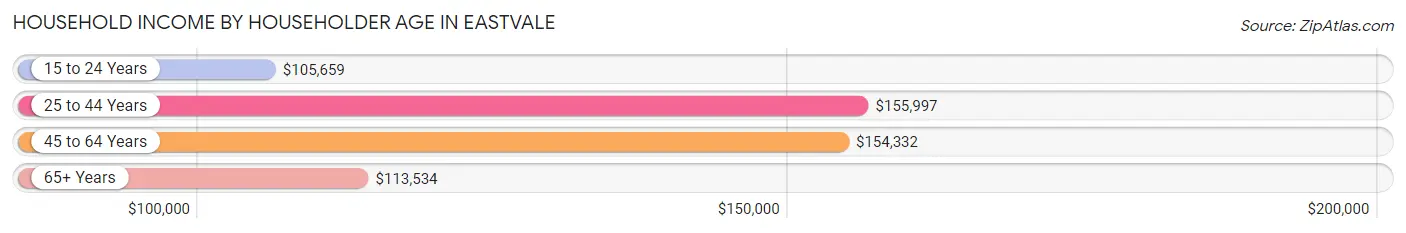
| Income Bracket | # Households | Median Income |
| 15 to 24 Years | 141 (0.8%) | $105,659 |
| 25 to 44 Years | 7,044 (40.8%) | $155,997 |
| 45 to 64 Years | 7,935 (46.0%) | $154,332 |
| 65+ Years | 2,130 (12.3%) | $113,534 |
| Total | 17,250 (100.0%) | $151,615 |
Poverty in Eastvale
Income Below Poverty by Sex and Age in Eastvale
With 3.8% poverty level for males and 4.9% for females among the residents of Eastvale, 75 year old and over males and 75 year old and over females are the most vulnerable to poverty, with 158 males (16.2%) and 175 females (14.9%) in their respective age groups living below the poverty level.
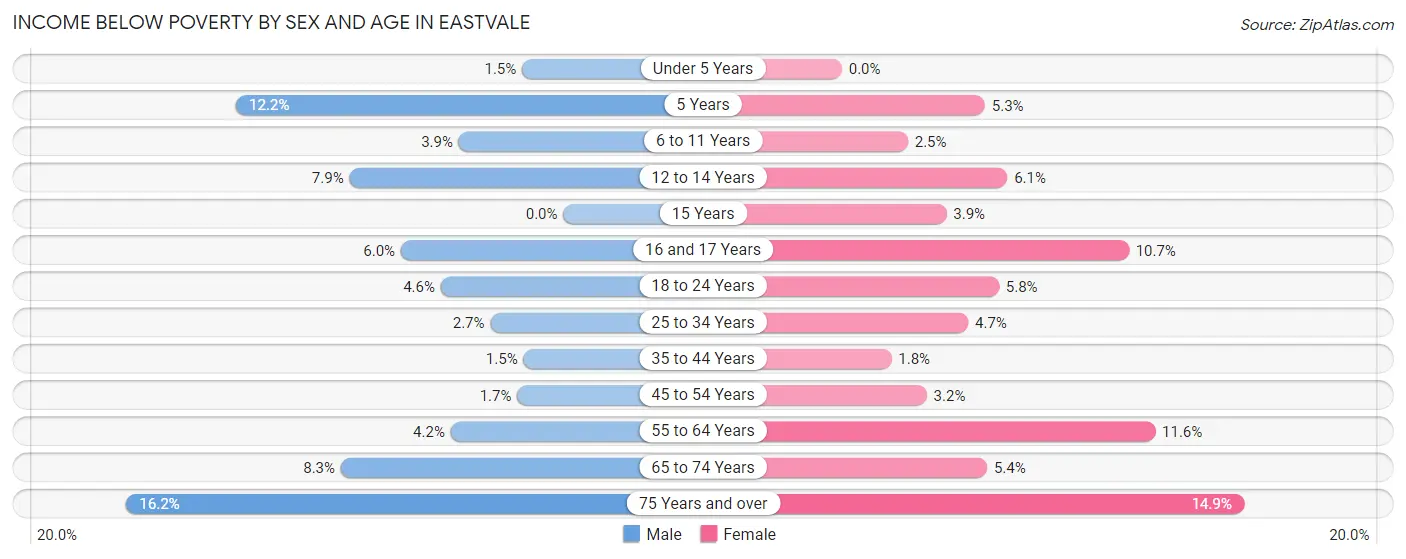
| Age Bracket | Male | Female |
| Under 5 Years | 45 (1.5%) | 0 (0.0%) |
| 5 Years | 35 (12.1%) | 33 (5.3%) |
| 6 to 11 Years | 113 (3.9%) | 78 (2.5%) |
| 12 to 14 Years | 175 (7.9%) | 114 (6.1%) |
| 15 Years | 0 (0.0%) | 17 (3.9%) |
| 16 and 17 Years | 74 (6.0%) | 132 (10.6%) |
| 18 to 24 Years | 153 (4.5%) | 176 (5.8%) |
| 25 to 34 Years | 117 (2.7%) | 219 (4.7%) |
| 35 to 44 Years | 90 (1.5%) | 105 (1.8%) |
| 45 to 54 Years | 93 (1.7%) | 170 (3.2%) |
| 55 to 64 Years | 122 (4.2%) | 362 (11.6%) |
| 65 to 74 Years | 151 (8.3%) | 101 (5.4%) |
| 75 Years and over | 158 (16.2%) | 175 (14.9%) |
| Total | 1,326 (3.8%) | 1,682 (4.9%) |
Income Above Poverty by Sex and Age in Eastvale
According to the poverty statistics in Eastvale, males aged 15 years and females aged under 5 years are the age groups that are most secure financially, with 100.0% of males and 100.0% of females in these age groups living above the poverty line.
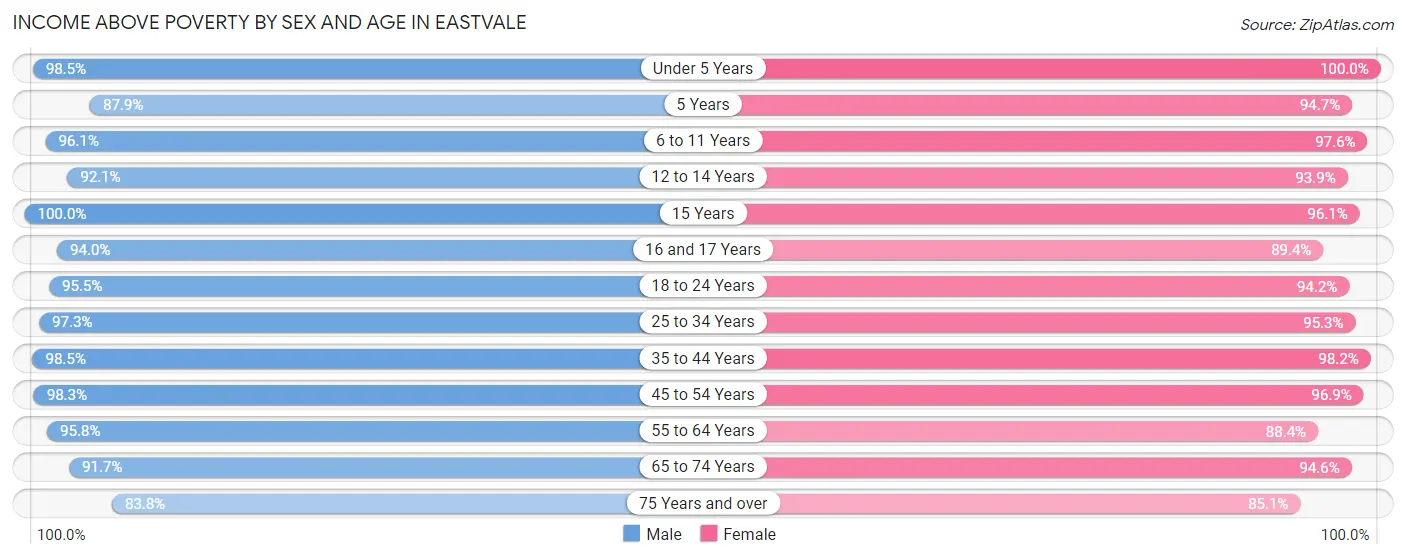
| Age Bracket | Male | Female |
| Under 5 Years | 2,898 (98.5%) | 2,144 (100.0%) |
| 5 Years | 253 (87.8%) | 589 (94.7%) |
| 6 to 11 Years | 2,802 (96.1%) | 3,111 (97.6%) |
| 12 to 14 Years | 2,028 (92.1%) | 1,743 (93.9%) |
| 15 Years | 479 (100.0%) | 421 (96.1%) |
| 16 and 17 Years | 1,154 (94.0%) | 1,108 (89.3%) |
| 18 to 24 Years | 3,208 (95.5%) | 2,841 (94.2%) |
| 25 to 34 Years | 4,205 (97.3%) | 4,450 (95.3%) |
| 35 to 44 Years | 5,980 (98.5%) | 5,608 (98.2%) |
| 45 to 54 Years | 5,333 (98.3%) | 5,223 (96.9%) |
| 55 to 64 Years | 2,796 (95.8%) | 2,750 (88.4%) |
| 65 to 74 Years | 1,676 (91.7%) | 1,772 (94.6%) |
| 75 Years and over | 816 (83.8%) | 998 (85.1%) |
| Total | 33,628 (96.2%) | 32,758 (95.1%) |
Income Below Poverty Among Married-Couple Families in Eastvale
The poverty statistics for married-couple families in Eastvale show that 2.4% or 317 of the total 13,313 families live below the poverty line. Families with no children have the highest poverty rate of 2.8%, comprising of 144 families. On the other hand, families with 5 or more children have the lowest poverty rate of 0.0%, which includes 0 families.
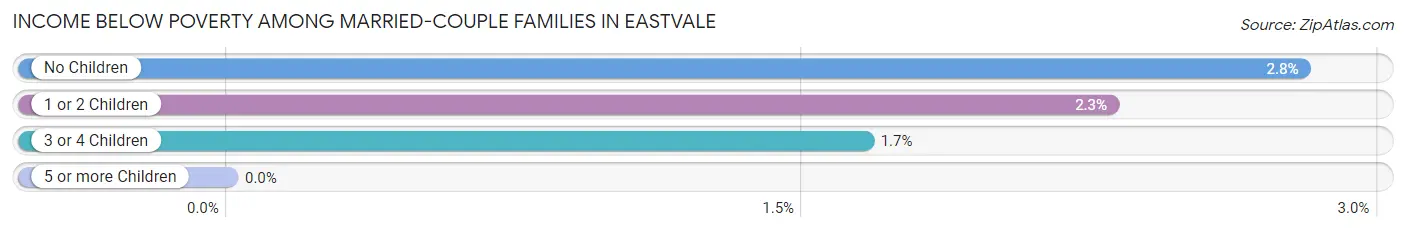
| Children | Above Poverty | Below Poverty |
| No Children | 5,001 (97.2%) | 144 (2.8%) |
| 1 or 2 Children | 6,332 (97.7%) | 149 (2.3%) |
| 3 or 4 Children | 1,423 (98.3%) | 24 (1.7%) |
| 5 or more Children | 240 (100.0%) | 0 (0.0%) |
| Total | 12,996 (97.6%) | 317 (2.4%) |
Income Below Poverty Among Single-Parent Households in Eastvale
According to the poverty data in Eastvale, 2.3% or 18 single-father households and 12.2% or 198 single-mother households are living below the poverty line. Among single-father households, those with 1 or 2 children have the highest poverty rate, with 18 households (4.4%) experiencing poverty. Likewise, among single-mother households, those with 3 or 4 children have the highest poverty rate, with 51 households (22.6%) falling below the poverty line.
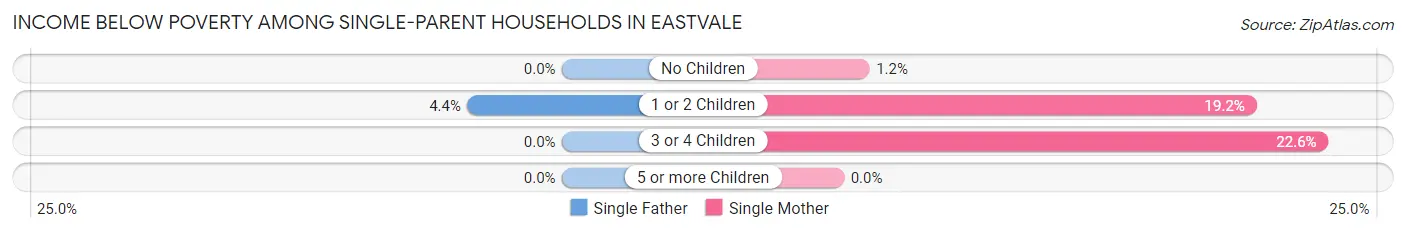
| Children | Single Father | Single Mother |
| No Children | 0 (0.0%) | 8 (1.2%) |
| 1 or 2 Children | 18 (4.4%) | 139 (19.2%) |
| 3 or 4 Children | 0 (0.0%) | 51 (22.6%) |
| 5 or more Children | 0 (0.0%) | 0 (0.0%) |
| Total | 18 (2.3%) | 198 (12.2%) |
Income Below Poverty Among Married-Couple vs Single-Parent Households in Eastvale
The poverty data for Eastvale shows that 317 of the married-couple family households (2.4%) and 216 of the single-parent households (9.0%) are living below the poverty level. Within the married-couple family households, those with no children have the highest poverty rate, with 144 households (2.8%) falling below the poverty line. Among the single-parent households, those with 3 or 4 children have the highest poverty rate, with 51 household (15.1%) living below poverty.

| Children | Married-Couple Families | Single-Parent Households |
| No Children | 144 (2.8%) | 8 (0.9%) |
| 1 or 2 Children | 149 (2.3%) | 157 (13.9%) |
| 3 or 4 Children | 24 (1.7%) | 51 (15.1%) |
| 5 or more Children | 0 (0.0%) | 0 (0.0%) |
| Total | 317 (2.4%) | 216 (9.0%) |
Race in Eastvale
The most populous races in Eastvale are Hispanic or Latino (27,442 | 39.4%), White / Caucasian (24,257 | 34.9%), and Asian (19,315 | 27.8%).
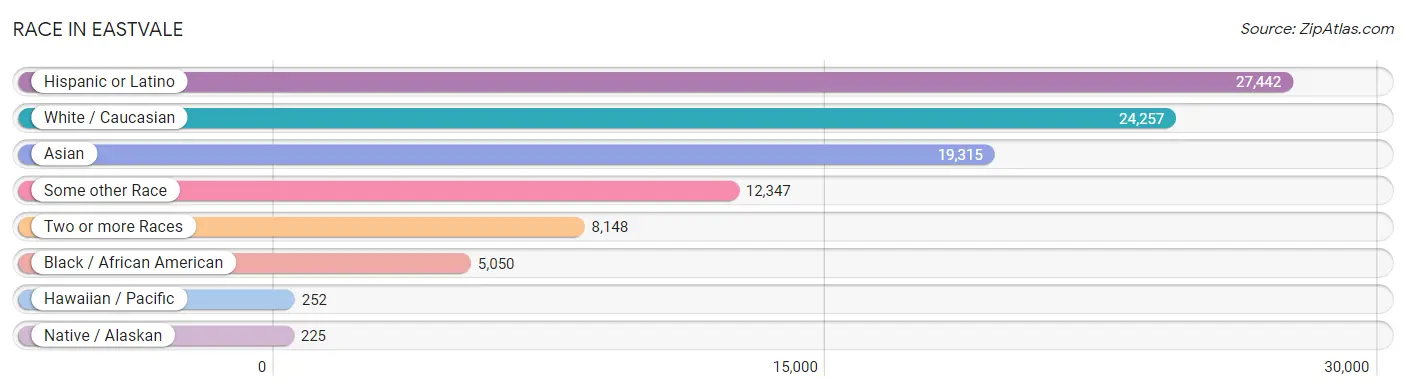
| Race | # Population | % Population |
| Asian | 19,315 | 27.8% |
| Black / African American | 5,050 | 7.3% |
| Hawaiian / Pacific | 252 | 0.4% |
| Hispanic or Latino | 27,442 | 39.4% |
| Native / Alaskan | 225 | 0.3% |
| White / Caucasian | 24,257 | 34.9% |
| Two or more Races | 8,148 | 11.7% |
| Some other Race | 12,347 | 17.7% |
| Total | 69,594 | 100.0% |
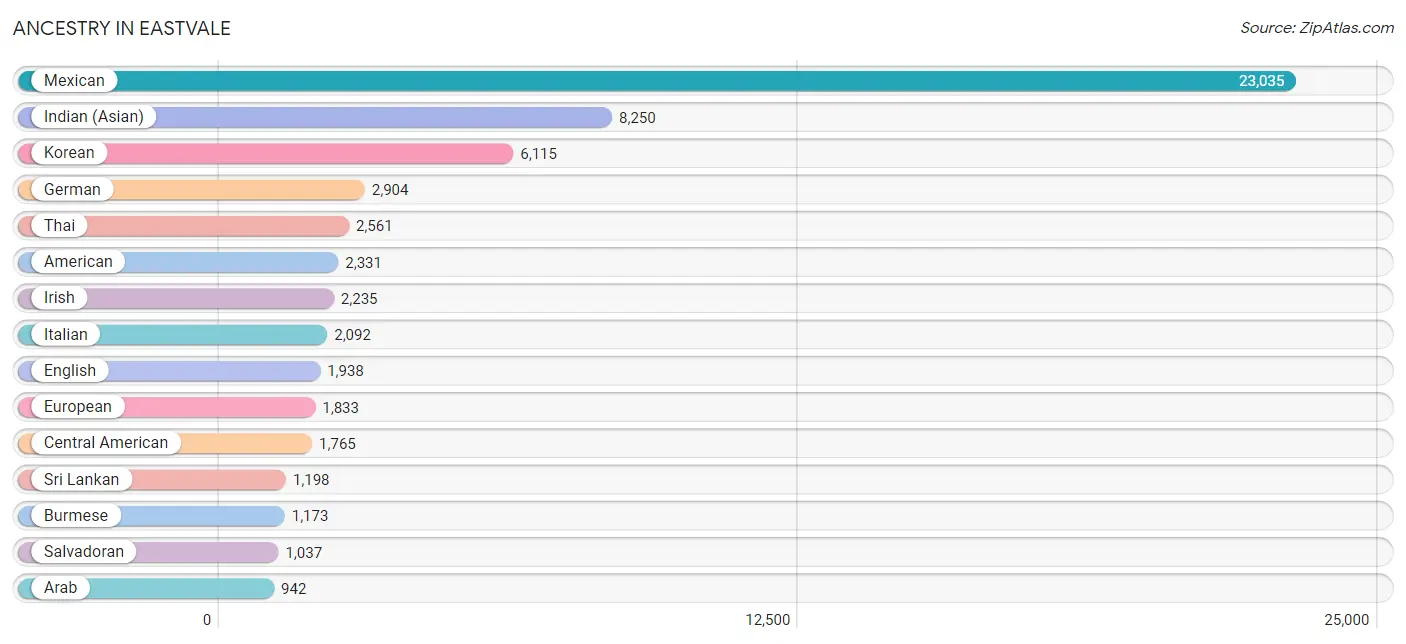
Ancestry in Eastvale
The most populous ancestries reported in Eastvale are Mexican (23,035 | 33.1%), Indian (Asian) (8,250 | 11.8%), Korean (6,115 | 8.8%), German (2,904 | 4.2%), and Thai (2,561 | 3.7%), together accounting for 61.6% of all Eastvale residents.
| Ancestry | # Population | % Population |
| African | 255 | 0.4% |
| American | 2,331 | 3.4% |
| Apache | 17 | 0.0% |
| Arab | 942 | 1.3% |
| Argentinean | 142 | 0.2% |
| Austrian | 10 | 0.0% |
| Bhutanese | 539 | 0.8% |
| Brazilian | 57 | 0.1% |
| British | 201 | 0.3% |
| Burmese | 1,173 | 1.7% |
| Canadian | 11 | 0.0% |
| Central American | 1,765 | 2.5% |
| Central American Indian | 90 | 0.1% |
| Cherokee | 356 | 0.5% |
| Chickasaw | 63 | 0.1% |
| Chilean | 123 | 0.2% |
| Choctaw | 218 | 0.3% |
| Colombian | 457 | 0.7% |
| Costa Rican | 143 | 0.2% |
| Croatian | 16 | 0.0% |
| Cuban | 240 | 0.3% |
| Czech | 31 | 0.0% |
| Danish | 59 | 0.1% |
| Dominican | 106 | 0.2% |
| Dutch | 797 | 1.1% |
| Eastern European | 70 | 0.1% |
| Ecuadorian | 140 | 0.2% |
| Egyptian | 365 | 0.5% |
| English | 1,938 | 2.8% |
| Ethiopian | 44 | 0.1% |
| European | 1,833 | 2.6% |
| Filipino | 758 | 1.1% |
| Finnish | 9 | 0.0% |
| French | 676 | 1.0% |
| French Canadian | 219 | 0.3% |
| German | 2,904 | 4.2% |
| Ghanaian | 132 | 0.2% |
| Greek | 175 | 0.3% |
| Guamanian / Chamorro | 231 | 0.3% |
| Guatemalan | 224 | 0.3% |
| Hungarian | 27 | 0.0% |
| Indian (Asian) | 8,250 | 11.8% |
| Indonesian | 83 | 0.1% |
| Iranian | 258 | 0.4% |
| Irish | 2,235 | 3.2% |
| Italian | 2,092 | 3.0% |
| Jamaican | 218 | 0.3% |
| Japanese | 403 | 0.6% |
| Korean | 6,115 | 8.8% |
| Laotian | 430 | 0.6% |
| Lebanese | 36 | 0.1% |
| Malaysian | 75 | 0.1% |
| Mexican | 23,035 | 33.1% |
| Mexican American Indian | 129 | 0.2% |
| Mongolian | 19 | 0.0% |
| Native Hawaiian | 56 | 0.1% |
| Nicaraguan | 348 | 0.5% |
| Nigerian | 84 | 0.1% |
| Norwegian | 166 | 0.2% |
| Pakistani | 41 | 0.1% |
| Peruvian | 13 | 0.0% |
| Polish | 370 | 0.5% |
| Portuguese | 323 | 0.5% |
| Puerto Rican | 819 | 1.2% |
| Romanian | 56 | 0.1% |
| Russian | 164 | 0.2% |
| Salvadoran | 1,037 | 1.5% |
| Samoan | 146 | 0.2% |
| Scandinavian | 49 | 0.1% |
| Scotch-Irish | 267 | 0.4% |
| Scottish | 283 | 0.4% |
| Sierra Leonean | 10 | 0.0% |
| Slovene | 16 | 0.0% |
| South American | 875 | 1.3% |
| Spaniard | 144 | 0.2% |
| Spanish | 80 | 0.1% |
| Sri Lankan | 1,198 | 1.7% |
| Subsaharan African | 540 | 0.8% |
| Swedish | 86 | 0.1% |
| Swiss | 11 | 0.0% |
| Syrian | 19 | 0.0% |
| Thai | 2,561 | 3.7% |
| Tongan | 25 | 0.0% |
| Trinidadian and Tobagonian | 42 | 0.1% |
| Turkish | 21 | 0.0% |
| Ugandan | 15 | 0.0% |
| Vietnamese | 58 | 0.1% |
| Welsh | 126 | 0.2% | View All 88 Rows |
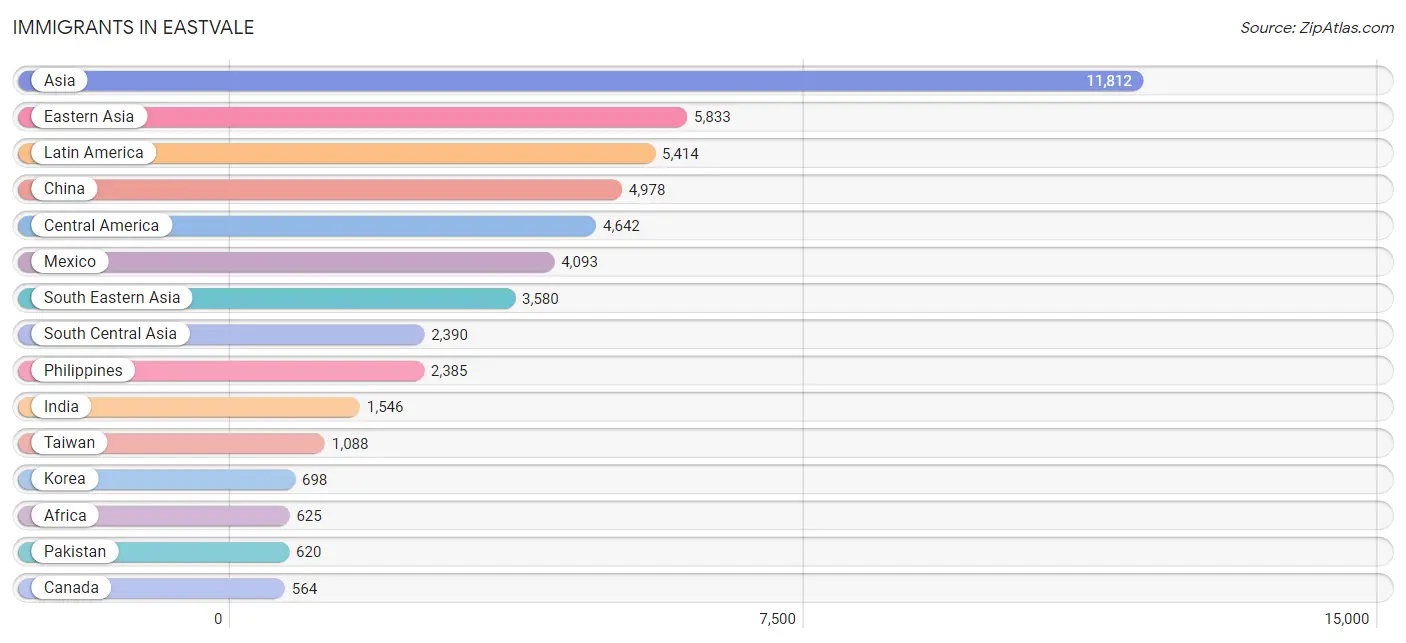
Immigrants in Eastvale
The most numerous immigrant groups reported in Eastvale came from Asia (11,812 | 17.0%), Eastern Asia (5,833 | 8.4%), Latin America (5,414 | 7.8%), China (4,978 | 7.1%), and Central America (4,642 | 6.7%), together accounting for 46.9% of all Eastvale residents.
| Immigration Origin | # Population | % Population |
| Afghanistan | 28 | 0.0% |
| Africa | 625 | 0.9% |
| Argentina | 38 | 0.1% |
| Asia | 11,812 | 17.0% |
| Australia | 21 | 0.0% |
| Azores | 57 | 0.1% |
| Bangladesh | 25 | 0.0% |
| Brazil | 16 | 0.0% |
| Cambodia | 135 | 0.2% |
| Canada | 564 | 0.8% |
| Caribbean | 322 | 0.5% |
| Central America | 4,642 | 6.7% |
| China | 4,978 | 7.1% |
| Colombia | 285 | 0.4% |
| Costa Rica | 39 | 0.1% |
| Cuba | 89 | 0.1% |
| Dominican Republic | 62 | 0.1% |
| Eastern Africa | 90 | 0.1% |
| Eastern Asia | 5,833 | 8.4% |
| Eastern Europe | 19 | 0.0% |
| Ecuador | 98 | 0.1% |
| Egypt | 285 | 0.4% |
| El Salvador | 381 | 0.5% |
| England | 34 | 0.1% |
| Ethiopia | 90 | 0.1% |
| Europe | 413 | 0.6% |
| Fiji | 15 | 0.0% |
| France | 43 | 0.1% |
| Germany | 45 | 0.1% |
| Ghana | 126 | 0.2% |
| Guatemala | 29 | 0.0% |
| Haiti | 22 | 0.0% |
| Hong Kong | 181 | 0.3% |
| India | 1,546 | 2.2% |
| Indonesia | 173 | 0.3% |
| Iran | 171 | 0.3% |
| Israel | 9 | 0.0% |
| Jamaica | 72 | 0.1% |
| Japan | 157 | 0.2% |
| Korea | 698 | 1.0% |
| Laos | 72 | 0.1% |
| Latin America | 5,414 | 7.8% |
| Malaysia | 112 | 0.2% |
| Mexico | 4,093 | 5.9% |
| Nicaragua | 100 | 0.1% |
| Nigeria | 33 | 0.1% |
| Northern Africa | 285 | 0.4% |
| Northern Europe | 235 | 0.3% |
| Norway | 99 | 0.1% |
| Oceania | 103 | 0.2% |
| Pakistan | 620 | 0.9% |
| Peru | 13 | 0.0% |
| Philippines | 2,385 | 3.4% |
| Poland | 19 | 0.0% |
| Portugal | 57 | 0.1% |
| Sierra Leone | 39 | 0.1% |
| South Africa | 52 | 0.1% |
| South America | 450 | 0.6% |
| South Central Asia | 2,390 | 3.4% |
| South Eastern Asia | 3,580 | 5.1% |
| Southern Europe | 71 | 0.1% |
| Spain | 14 | 0.0% |
| Taiwan | 1,088 | 1.6% |
| Thailand | 114 | 0.2% |
| Trinidad and Tobago | 77 | 0.1% |
| Vietnam | 530 | 0.8% |
| Western Africa | 198 | 0.3% |
| Western Asia | 9 | 0.0% |
| Western Europe | 88 | 0.1% | View All 69 Rows |
Sex and Age in Eastvale
Sex and Age in Eastvale
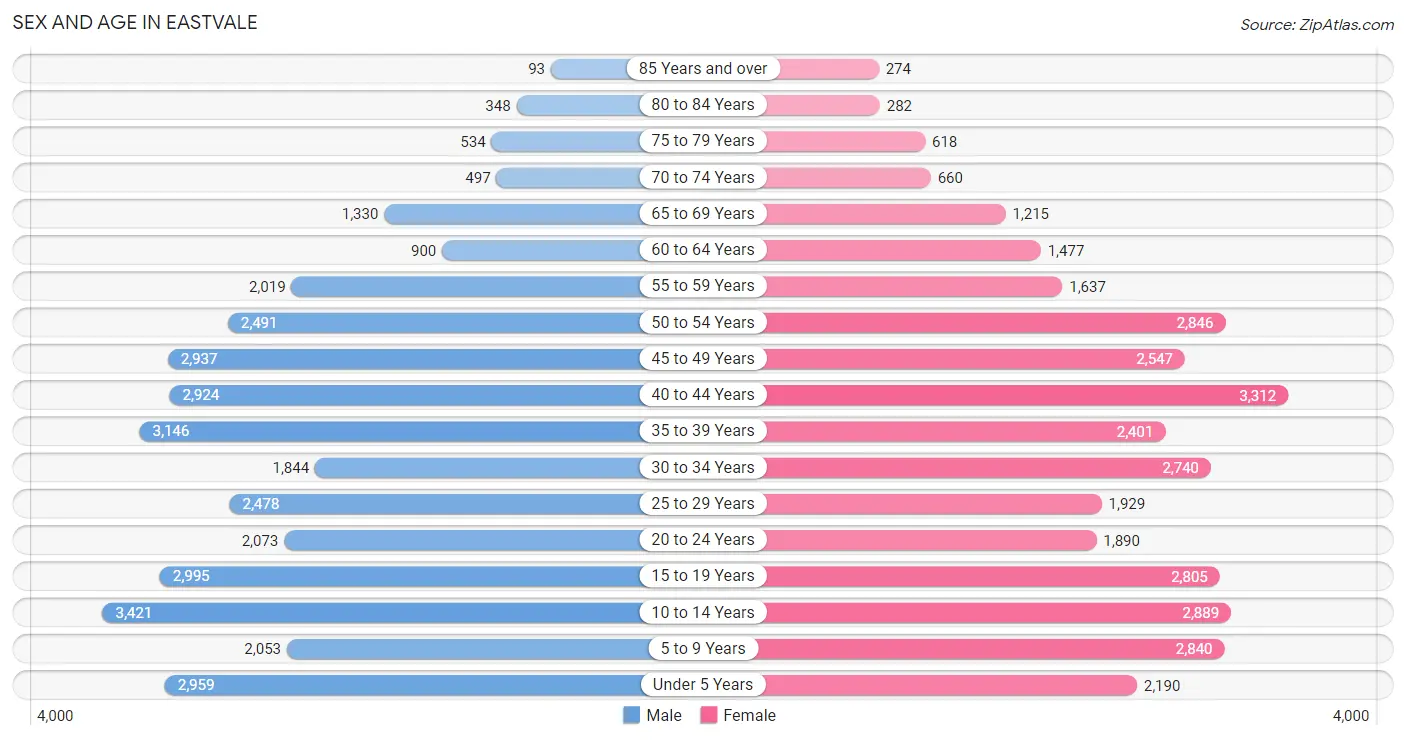
The most populous age groups in Eastvale are 10 to 14 Years (3,421 | 9.8%) for men and 40 to 44 Years (3,312 | 9.6%) for women.
| Age Bracket | Male | Female |
| Under 5 Years | 2,959 (8.4%) | 2,190 (6.3%) |
| 5 to 9 Years | 2,053 (5.9%) | 2,840 (8.2%) |
| 10 to 14 Years | 3,421 (9.8%) | 2,889 (8.4%) |
| 15 to 19 Years | 2,995 (8.6%) | 2,805 (8.1%) |
| 20 to 24 Years | 2,073 (5.9%) | 1,890 (5.5%) |
| 25 to 29 Years | 2,478 (7.1%) | 1,929 (5.6%) |
| 30 to 34 Years | 1,844 (5.3%) | 2,740 (7.9%) |
| 35 to 39 Years | 3,146 (9.0%) | 2,401 (7.0%) |
| 40 to 44 Years | 2,924 (8.3%) | 3,312 (9.6%) |
| 45 to 49 Years | 2,937 (8.4%) | 2,547 (7.4%) |
| 50 to 54 Years | 2,491 (7.1%) | 2,846 (8.2%) |
| 55 to 59 Years | 2,019 (5.8%) | 1,637 (4.7%) |
| 60 to 64 Years | 900 (2.6%) | 1,477 (4.3%) |
| 65 to 69 Years | 1,330 (3.8%) | 1,215 (3.5%) |
| 70 to 74 Years | 497 (1.4%) | 660 (1.9%) |
| 75 to 79 Years | 534 (1.5%) | 618 (1.8%) |
| 80 to 84 Years | 348 (1.0%) | 282 (0.8%) |
| 85 Years and over | 93 (0.3%) | 274 (0.8%) |
| Total | 35,042 (100.0%) | 34,552 (100.0%) |
Families and Households in Eastvale
Median Family Size in Eastvale
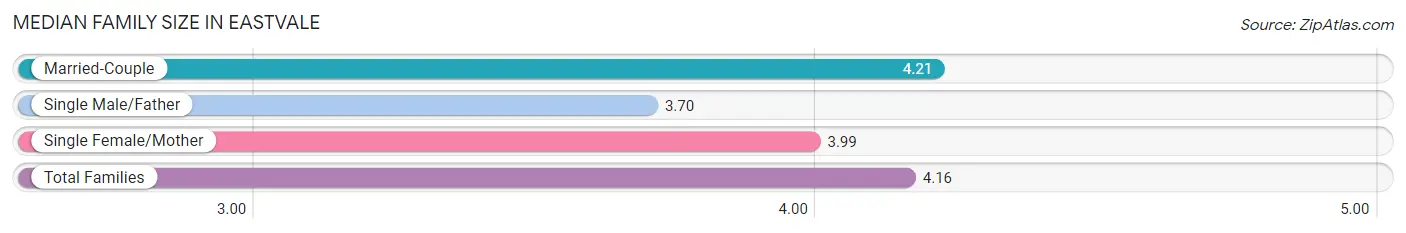
The median family size in Eastvale is 4.16 persons per family, with married-couple families (13,313 | 84.7%) accounting for the largest median family size of 4.21 persons per family. On the other hand, single male/father families (789 | 5.0%) represent the smallest median family size with 3.70 persons per family.
| Family Type | # Families | Family Size |
| Married-Couple | 13,313 (84.7%) | 4.21 |
| Single Male/Father | 789 (5.0%) | 3.70 |
| Single Female/Mother | 1,621 (10.3%) | 3.99 |
| Total Families | 15,723 (100.0%) | 4.16 |
Median Household Size in Eastvale
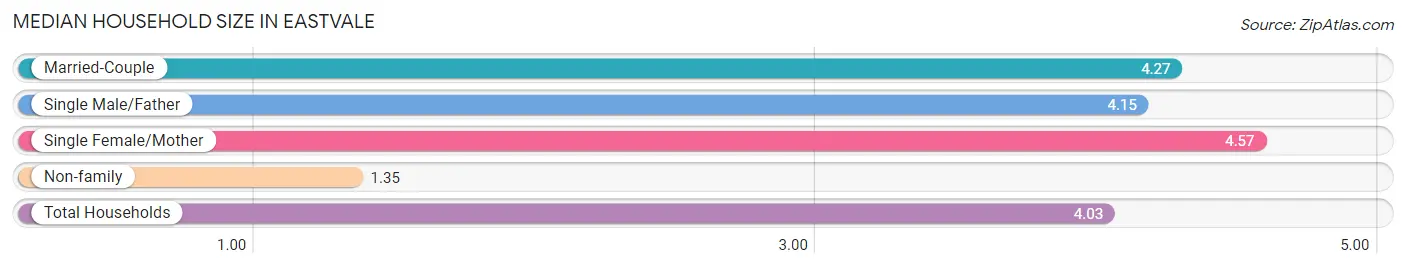
The median household size in Eastvale is 4.03 persons per household, with single female/mother households (1,621 | 9.4%) accounting for the largest median household size of 4.57 persons per household. non-family households (1,527 | 8.8%) represent the smallest median household size with 1.35 persons per household.
| Household Type | # Households | Household Size |
| Married-Couple | 13,313 (77.2%) | 4.27 |
| Single Male/Father | 789 (4.6%) | 4.15 |
| Single Female/Mother | 1,621 (9.4%) | 4.57 |
| Non-family | 1,527 (8.8%) | 1.35 |
| Total Households | 17,250 (100.0%) | 4.03 |
Household Size by Marriage Status in Eastvale
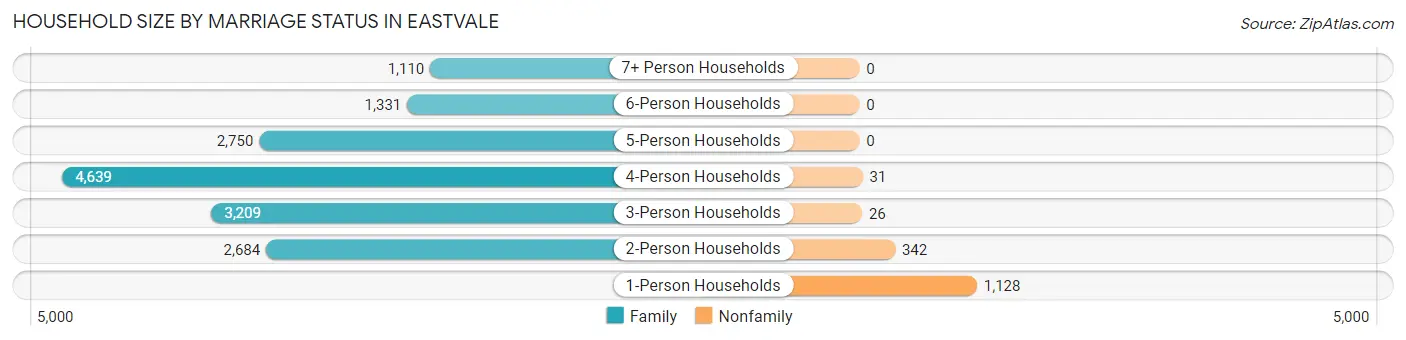
Out of a total of 17,250 households in Eastvale, 15,723 (91.1%) are family households, while 1,527 (8.8%) are nonfamily households. The most numerous type of family households are 4-person households, comprising 4,639, and the most common type of nonfamily households are 1-person households, comprising 1,128.
| Household Size | Family Households | Nonfamily Households |
| 1-Person Households | - | 1,128 (6.5%) |
| 2-Person Households | 2,684 (15.6%) | 342 (2.0%) |
| 3-Person Households | 3,209 (18.6%) | 26 (0.2%) |
| 4-Person Households | 4,639 (26.9%) | 31 (0.2%) |
| 5-Person Households | 2,750 (15.9%) | 0 (0.0%) |
| 6-Person Households | 1,331 (7.7%) | 0 (0.0%) |
| 7+ Person Households | 1,110 (6.4%) | 0 (0.0%) |
| Total | 15,723 (91.1%) | 1,527 (8.8%) |
Female Fertility in Eastvale
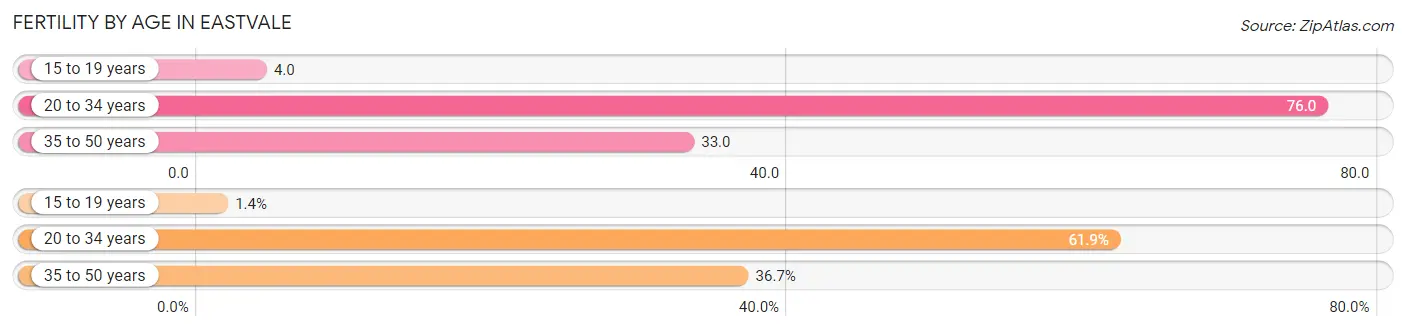
Fertility by Age in Eastvale
Average fertility rate in Eastvale is 44.0 births per 1,000 women. Women in the age bracket of 20 to 34 years have the highest fertility rate with 76.0 births per 1,000 women. Women in the age bracket of 20 to 34 years acount for 61.9% of all women with births.
| Age Bracket | Women with Births | Births / 1,000 Women |
| 15 to 19 years | 11 (1.4%) | 4.0 |
| 20 to 34 years | 498 (61.9%) | 76.0 |
| 35 to 50 years | 295 (36.7%) | 33.0 |
| Total | 804 (100.0%) | 44.0 |
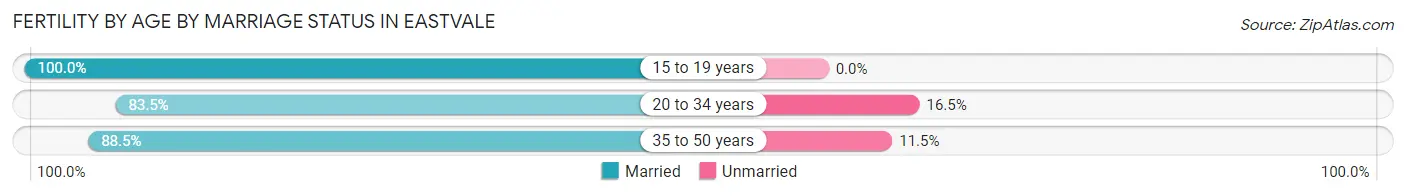
Fertility by Age by Marriage Status in Eastvale
85.6% of women with births (804) in Eastvale are married. The highest percentage of unmarried women with births falls into 20 to 34 years age bracket with 16.5% of them unmarried at the time of birth, while the lowest percentage of unmarried women with births belong to 15 to 19 years age bracket with 0.0% of them unmarried.
| Age Bracket | Married | Unmarried |
| 15 to 19 years | 11 (100.0%) | 0 (0.0%) |
| 20 to 34 years | 416 (83.5%) | 82 (16.5%) |
| 35 to 50 years | 261 (88.5%) | 34 (11.5%) |
| Total | 688 (85.6%) | 116 (14.4%) |
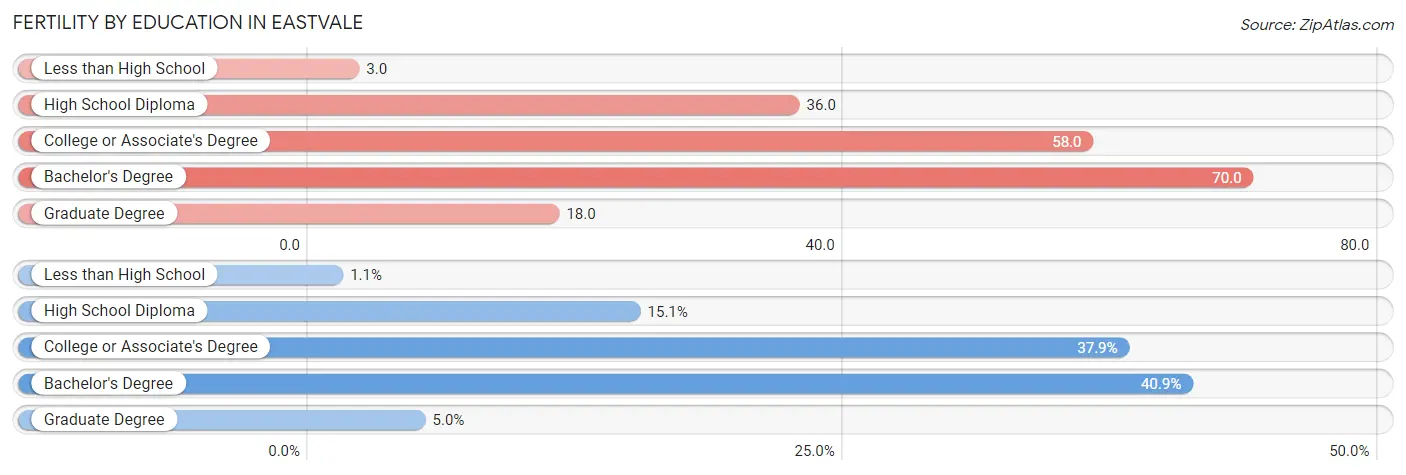
Fertility by Education in Eastvale
Average fertility rate in Eastvale is 44.0 births per 1,000 women. Women with the education attainment of bachelor's degree have the highest fertility rate of 70.0 births per 1,000 women, while women with the education attainment of less than high school have the lowest fertility at 3.0 births per 1,000 women. Women with the education attainment of bachelor's degree represent 40.9% of all women with births.
| Educational Attainment | Women with Births | Births / 1,000 Women |
| Less than High School | 9 (1.1%) | 3.0 |
| High School Diploma | 121 (15.0%) | 36.0 |
| College or Associate's Degree | 305 (37.9%) | 58.0 |
| Bachelor's Degree | 329 (40.9%) | 70.0 |
| Graduate Degree | 40 (5.0%) | 18.0 |
| Total | 804 (100.0%) | 44.0 |
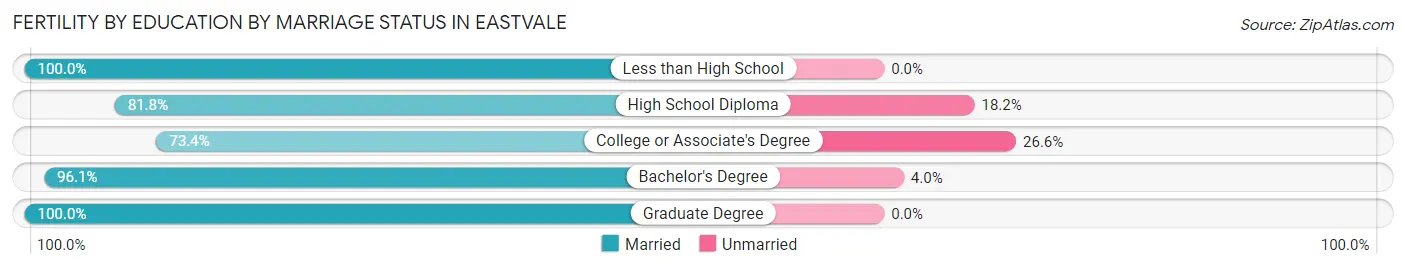
Fertility by Education by Marriage Status in Eastvale
14.4% of women with births in Eastvale are unmarried. Women with the educational attainment of less than high school are most likely to be married with 100.0% of them married at childbirth, while women with the educational attainment of college or associate's degree are least likely to be married with 26.6% of them unmarried at childbirth.
| Educational Attainment | Married | Unmarried |
| Less than High School | 9 (100.0%) | 0 (0.0%) |
| High School Diploma | 99 (81.8%) | 22 (18.2%) |
| College or Associate's Degree | 224 (73.4%) | 81 (26.6%) |
| Bachelor's Degree | 316 (96.1%) | 13 (4.0%) |
| Graduate Degree | 40 (100.0%) | 0 (0.0%) |
| Total | 688 (85.6%) | 116 (14.4%) |
Employment Characteristics in Eastvale
Employment by Class of Employer in Eastvale
Among the 34,197 employed individuals in Eastvale, private company employees (21,978 | 64.3%), local government employees (3,764 | 11.0%), and state government employees (2,097 | 6.1%) make up the most common classes of employment.
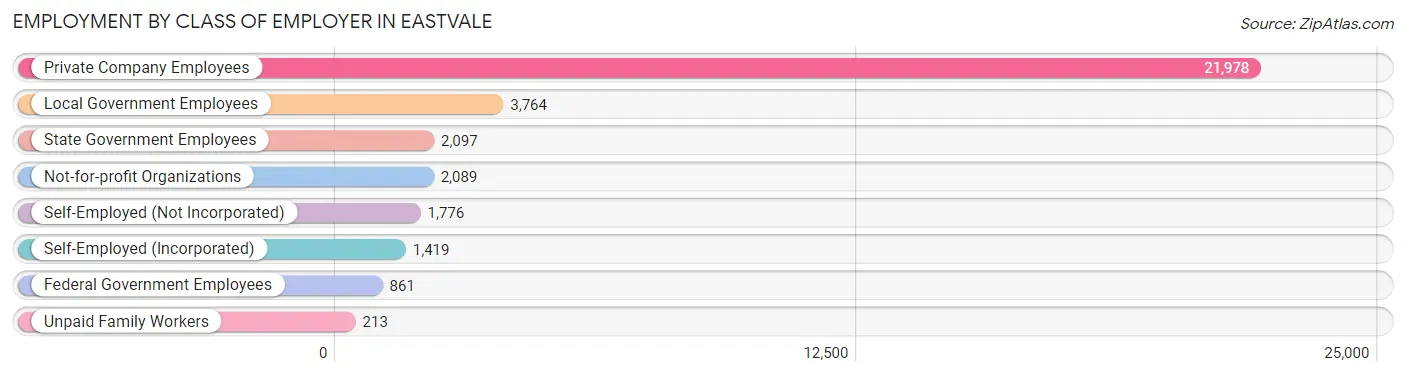
| Employer Class | # Employees | % Employees |
| Private Company Employees | 21,978 | 64.3% |
| Self-Employed (Incorporated) | 1,419 | 4.2% |
| Self-Employed (Not Incorporated) | 1,776 | 5.2% |
| Not-for-profit Organizations | 2,089 | 6.1% |
| Local Government Employees | 3,764 | 11.0% |
| State Government Employees | 2,097 | 6.1% |
| Federal Government Employees | 861 | 2.5% |
| Unpaid Family Workers | 213 | 0.6% |
| Total | 34,197 | 100.0% |
Employment Status by Age in Eastvale
According to the labor force statistics for Eastvale, out of the total population over 16 years of age (52,325), 70.5% or 36,889 individuals are in the labor force, with 4.5% or 1,660 of them unemployed. The age group with the highest labor force participation rate is 30 to 34 years, with 90.7% or 4,158 individuals in the labor force. Within the labor force, the 75 years and over age range has the highest percentage of unemployed individuals, with 24.3% or 43 of them being unemployed.
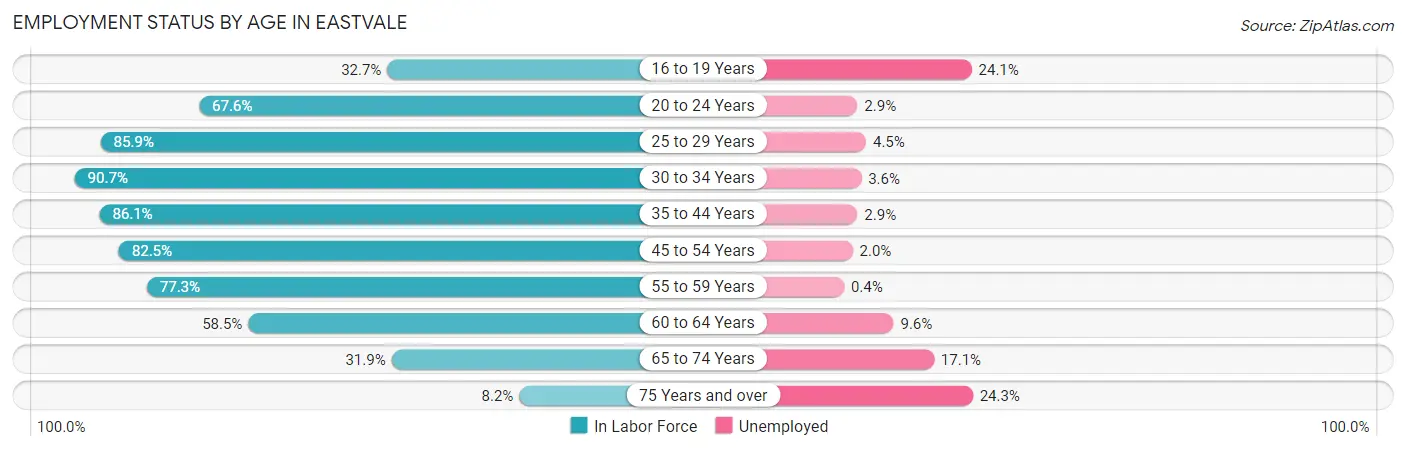
| Age Bracket | In Labor Force | Unemployed |
| 16 to 19 Years | 1,597 (32.7%) | 385 (24.1%) |
| 20 to 24 Years | 2,679 (67.6%) | 78 (2.9%) |
| 25 to 29 Years | 3,786 (85.9%) | 170 (4.5%) |
| 30 to 34 Years | 4,158 (90.7%) | 150 (3.6%) |
| 35 to 44 Years | 10,145 (86.1%) | 294 (2.9%) |
| 45 to 54 Years | 8,927 (82.5%) | 179 (2.0%) |
| 55 to 59 Years | 2,826 (77.3%) | 11 (0.4%) |
| 60 to 64 Years | 1,391 (58.5%) | 134 (9.6%) |
| 65 to 74 Years | 1,181 (31.9%) | 202 (17.1%) |
| 75 Years and over | 176 (8.2%) | 43 (24.3%) |
| Total | 36,889 (70.5%) | 1,660 (4.5%) |
Employment Status by Educational Attainment in Eastvale
According to labor force statistics for Eastvale, 83.0% of individuals (31,231) out of the total population between 25 and 64 years of age (37,628) are in the labor force, with 3.0% or 937 of them being unemployed. The group with the highest labor force participation rate are those with the educational attainment of bachelor's degree or higher, with 86.0% or 13,319 individuals in the labor force. Within the labor force, individuals with less than high school education have the highest percentage of unemployment, with 6.3% or 151 of them being unemployed.
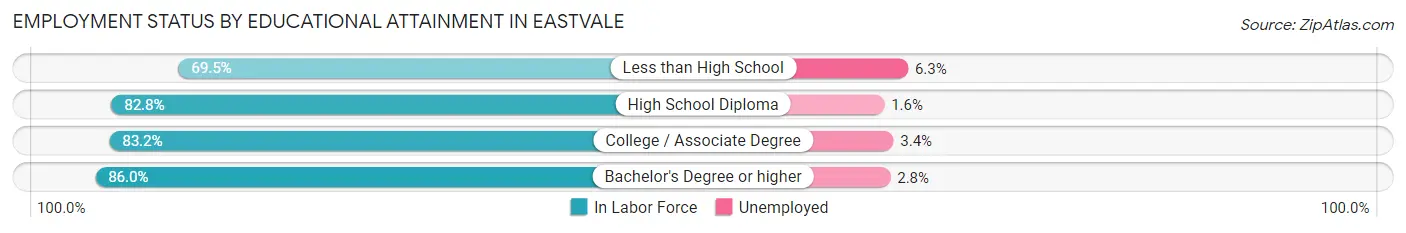
| Educational Attainment | In Labor Force | Unemployed |
| Less than High School | 2,391 (69.5%) | 217 (6.3%) |
| High School Diploma | 6,082 (82.8%) | 118 (1.6%) |
| College / Associate Degree | 9,447 (83.2%) | 386 (3.4%) |
| Bachelor's Degree or higher | 13,319 (86.0%) | 434 (2.8%) |
| Total | 31,231 (83.0%) | 1,129 (3.0%) |
Employment Occupations by Sex in Eastvale
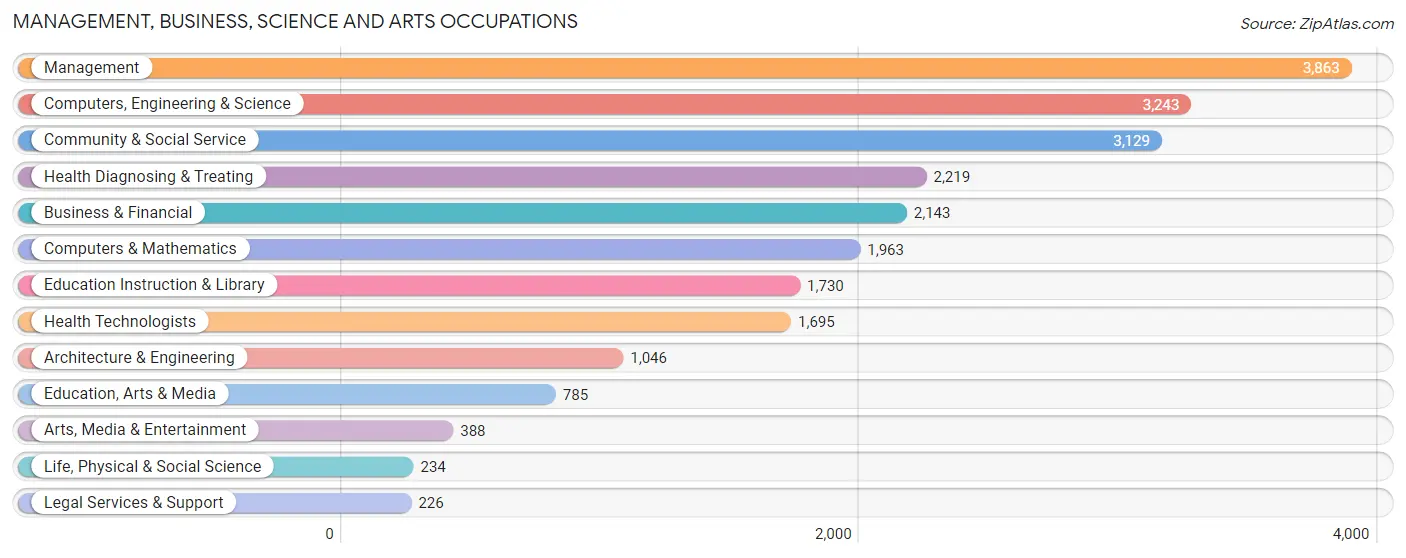
Management, Business, Science and Arts Occupations
The most common Management, Business, Science and Arts occupations in Eastvale are Management (3,863 | 11.0%), Computers, Engineering & Science (3,243 | 9.2%), Community & Social Service (3,129 | 8.9%), Health Diagnosing & Treating (2,219 | 6.3%), and Business & Financial (2,143 | 6.1%).
Management, Business, Science and Arts Occupations by Sex
Within the Management, Business, Science and Arts occupations in Eastvale, the most male-oriented occupations are Architecture & Engineering (79.3%), Computers & Mathematics (75.6%), and Computers, Engineering & Science (74.5%), while the most female-oriented occupations are Legal Services & Support (88.5%), Education Instruction & Library (70.8%), and Health Technologists (68.0%).
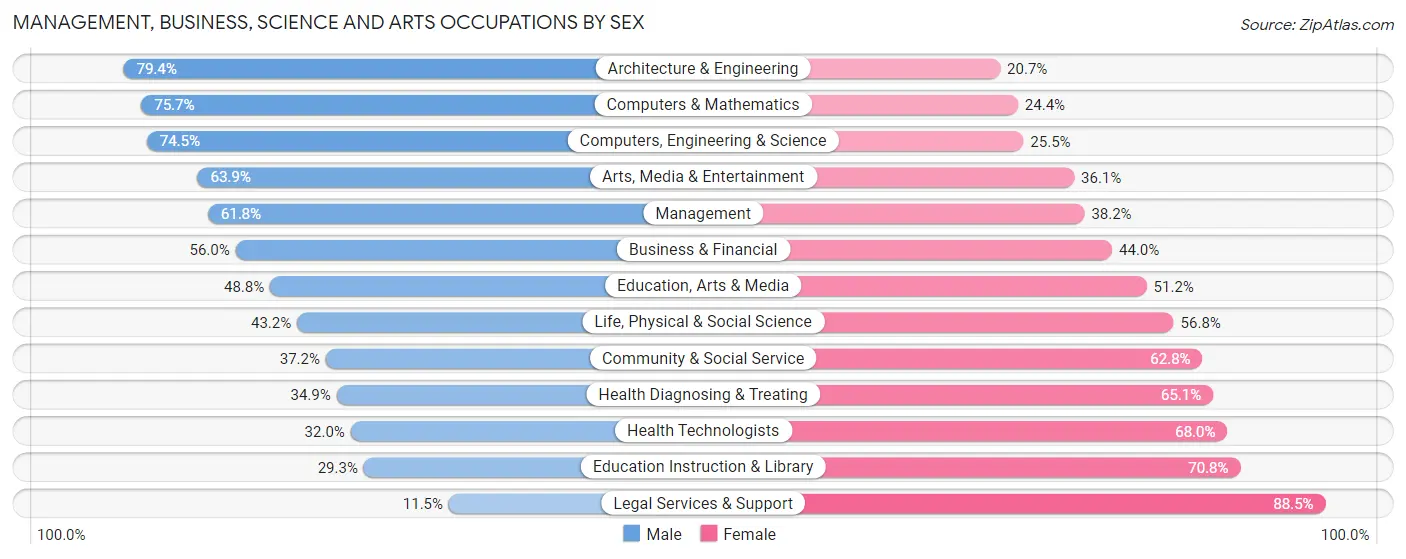
| Occupation | Male | Female |
| Management | 2,386 (61.8%) | 1,477 (38.2%) |
| Business & Financial | 1,200 (56.0%) | 943 (44.0%) |
| Computers, Engineering & Science | 2,416 (74.5%) | 827 (25.5%) |
| Computers & Mathematics | 1,485 (75.6%) | 478 (24.3%) |
| Architecture & Engineering | 830 (79.3%) | 216 (20.6%) |
| Life, Physical & Social Science | 101 (43.2%) | 133 (56.8%) |
| Community & Social Service | 1,163 (37.2%) | 1,966 (62.8%) |
| Education, Arts & Media | 383 (48.8%) | 402 (51.2%) |
| Legal Services & Support | 26 (11.5%) | 200 (88.5%) |
| Education Instruction & Library | 506 (29.2%) | 1,224 (70.8%) |
| Arts, Media & Entertainment | 248 (63.9%) | 140 (36.1%) |
| Health Diagnosing & Treating | 775 (34.9%) | 1,444 (65.1%) |
| Health Technologists | 542 (32.0%) | 1,153 (68.0%) |
| Total (Category) | 7,940 (54.4%) | 6,657 (45.6%) |
| Total (Overall) | 19,607 (55.8%) | 15,505 (44.2%) |
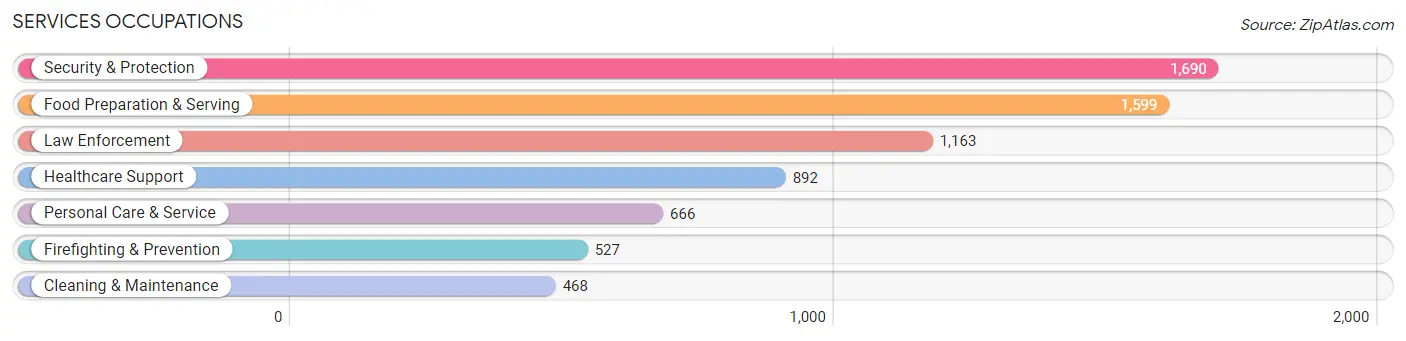
Services Occupations
The most common Services occupations in Eastvale are Security & Protection (1,690 | 4.8%), Food Preparation & Serving (1,599 | 4.5%), Law Enforcement (1,163 | 3.3%), Healthcare Support (892 | 2.5%), and Personal Care & Service (666 | 1.9%).
Services Occupations by Sex
Within the Services occupations in Eastvale, the most male-oriented occupations are Law Enforcement (79.6%), Security & Protection (76.7%), and Cleaning & Maintenance (71.8%), while the most female-oriented occupations are Personal Care & Service (82.6%), Healthcare Support (75.2%), and Food Preparation & Serving (52.8%).
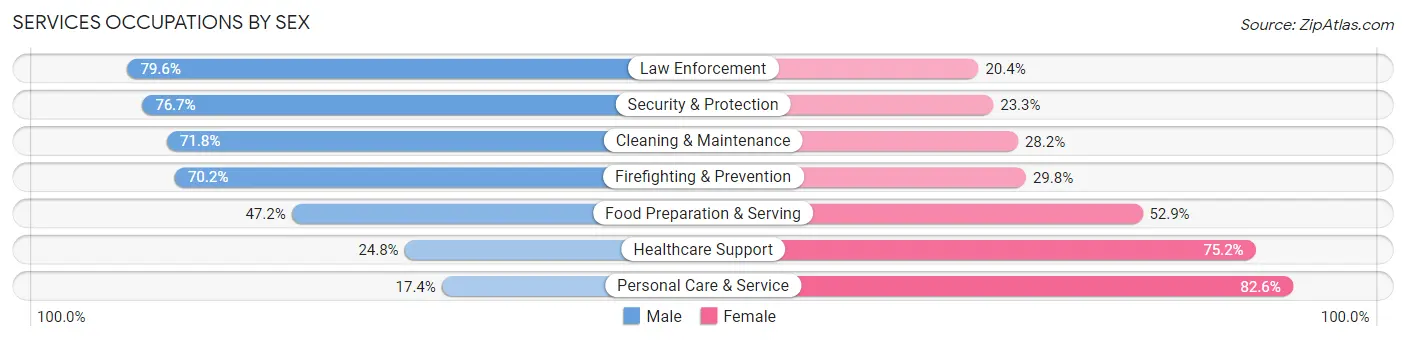
| Occupation | Male | Female |
| Healthcare Support | 221 (24.8%) | 671 (75.2%) |
| Security & Protection | 1,296 (76.7%) | 394 (23.3%) |
| Firefighting & Prevention | 370 (70.2%) | 157 (29.8%) |
| Law Enforcement | 926 (79.6%) | 237 (20.4%) |
| Food Preparation & Serving | 754 (47.1%) | 845 (52.8%) |
| Cleaning & Maintenance | 336 (71.8%) | 132 (28.2%) |
| Personal Care & Service | 116 (17.4%) | 550 (82.6%) |
| Total (Category) | 2,723 (51.2%) | 2,592 (48.8%) |
| Total (Overall) | 19,607 (55.8%) | 15,505 (44.2%) |
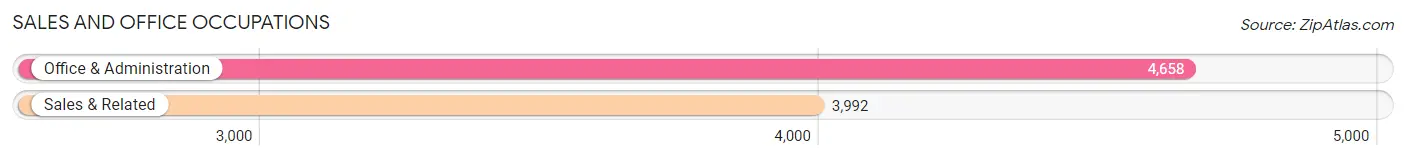
Sales and Office Occupations
The most common Sales and Office occupations in Eastvale are Office & Administration (4,658 | 13.3%), and Sales & Related (3,992 | 11.4%).
Sales and Office Occupations by Sex
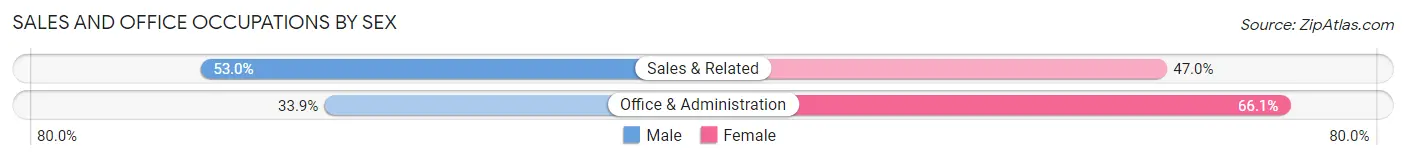
| Occupation | Male | Female |
| Sales & Related | 2,114 (53.0%) | 1,878 (47.0%) |
| Office & Administration | 1,580 (33.9%) | 3,078 (66.1%) |
| Total (Category) | 3,694 (42.7%) | 4,956 (57.3%) |
| Total (Overall) | 19,607 (55.8%) | 15,505 (44.2%) |
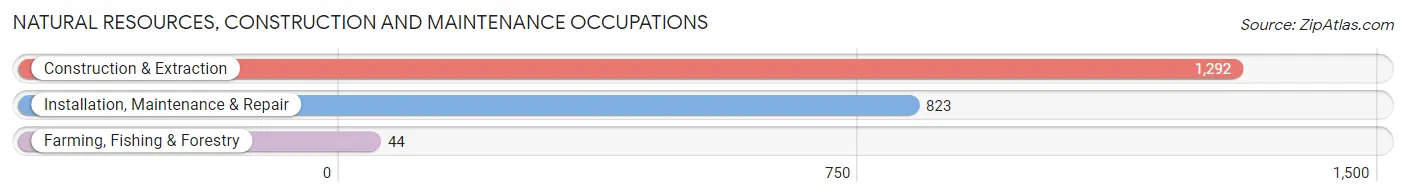
Natural Resources, Construction and Maintenance Occupations
The most common Natural Resources, Construction and Maintenance occupations in Eastvale are Construction & Extraction (1,292 | 3.7%), Installation, Maintenance & Repair (823 | 2.3%), and Farming, Fishing & Forestry (44 | 0.1%).
Natural Resources, Construction and Maintenance Occupations by Sex
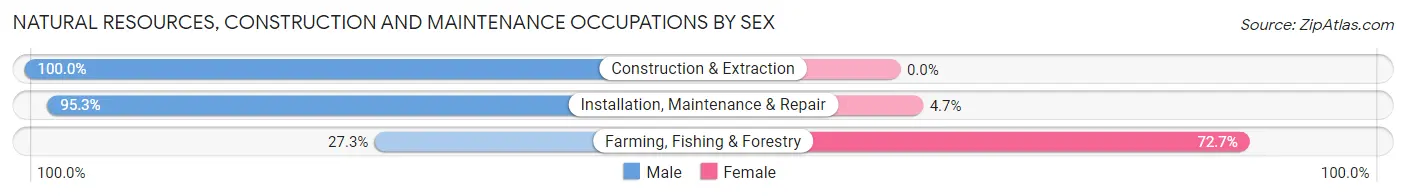
| Occupation | Male | Female |
| Farming, Fishing & Forestry | 12 (27.3%) | 32 (72.7%) |
| Construction & Extraction | 1,292 (100.0%) | 0 (0.0%) |
| Installation, Maintenance & Repair | 784 (95.3%) | 39 (4.7%) |
| Total (Category) | 2,088 (96.7%) | 71 (3.3%) |
| Total (Overall) | 19,607 (55.8%) | 15,505 (44.2%) |
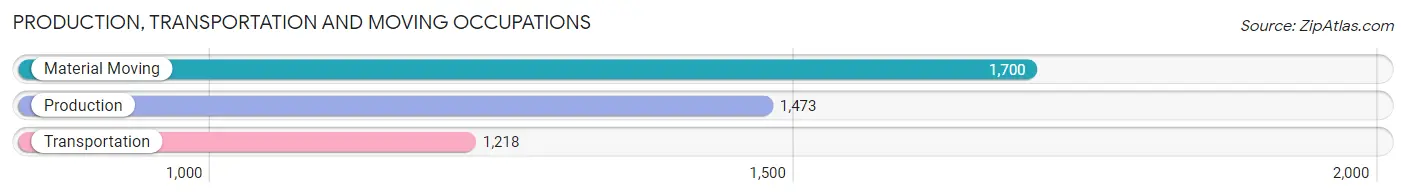
Production, Transportation and Moving Occupations
The most common Production, Transportation and Moving occupations in Eastvale are Material Moving (1,700 | 4.8%), Production (1,473 | 4.2%), and Transportation (1,218 | 3.5%).
Production, Transportation and Moving Occupations by Sex
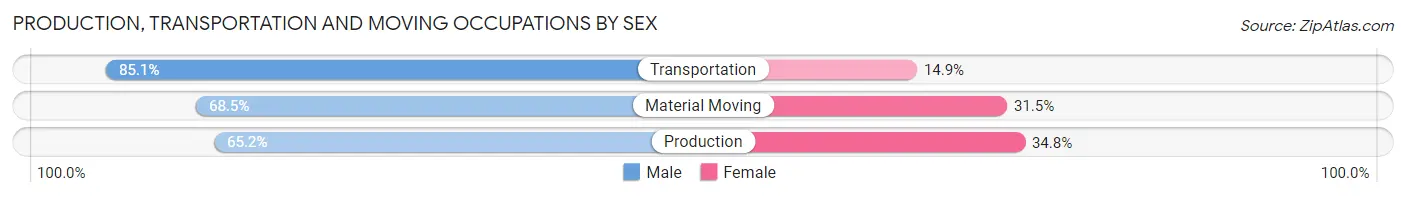
| Occupation | Male | Female |
| Production | 961 (65.2%) | 512 (34.8%) |
| Transportation | 1,036 (85.1%) | 182 (14.9%) |
| Material Moving | 1,165 (68.5%) | 535 (31.5%) |
| Total (Category) | 3,162 (72.0%) | 1,229 (28.0%) |
| Total (Overall) | 19,607 (55.8%) | 15,505 (44.2%) |
Employment Industries by Sex in Eastvale
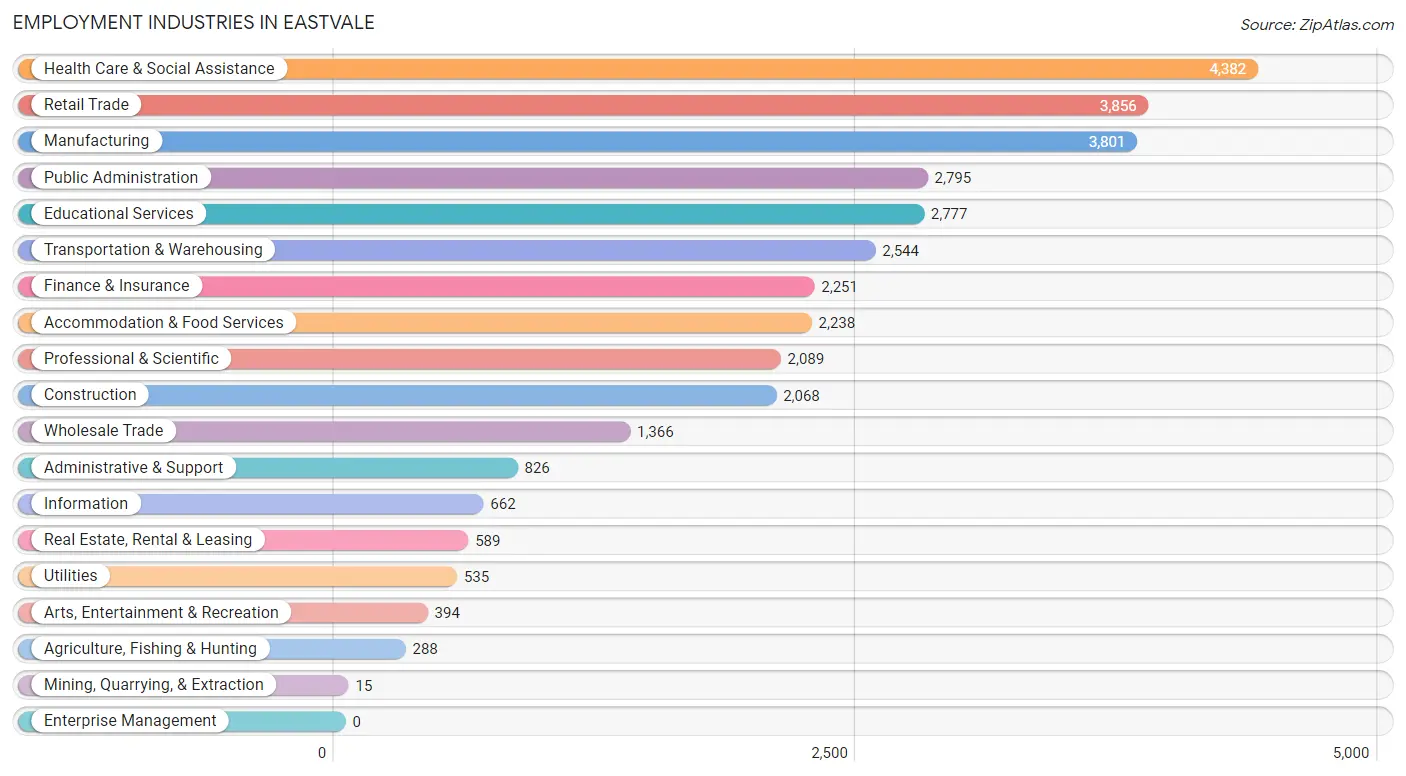
Employment Industries in Eastvale
The major employment industries in Eastvale include Health Care & Social Assistance (4,382 | 12.5%), Retail Trade (3,856 | 11.0%), Manufacturing (3,801 | 10.8%), Public Administration (2,795 | 8.0%), and Educational Services (2,777 | 7.9%).
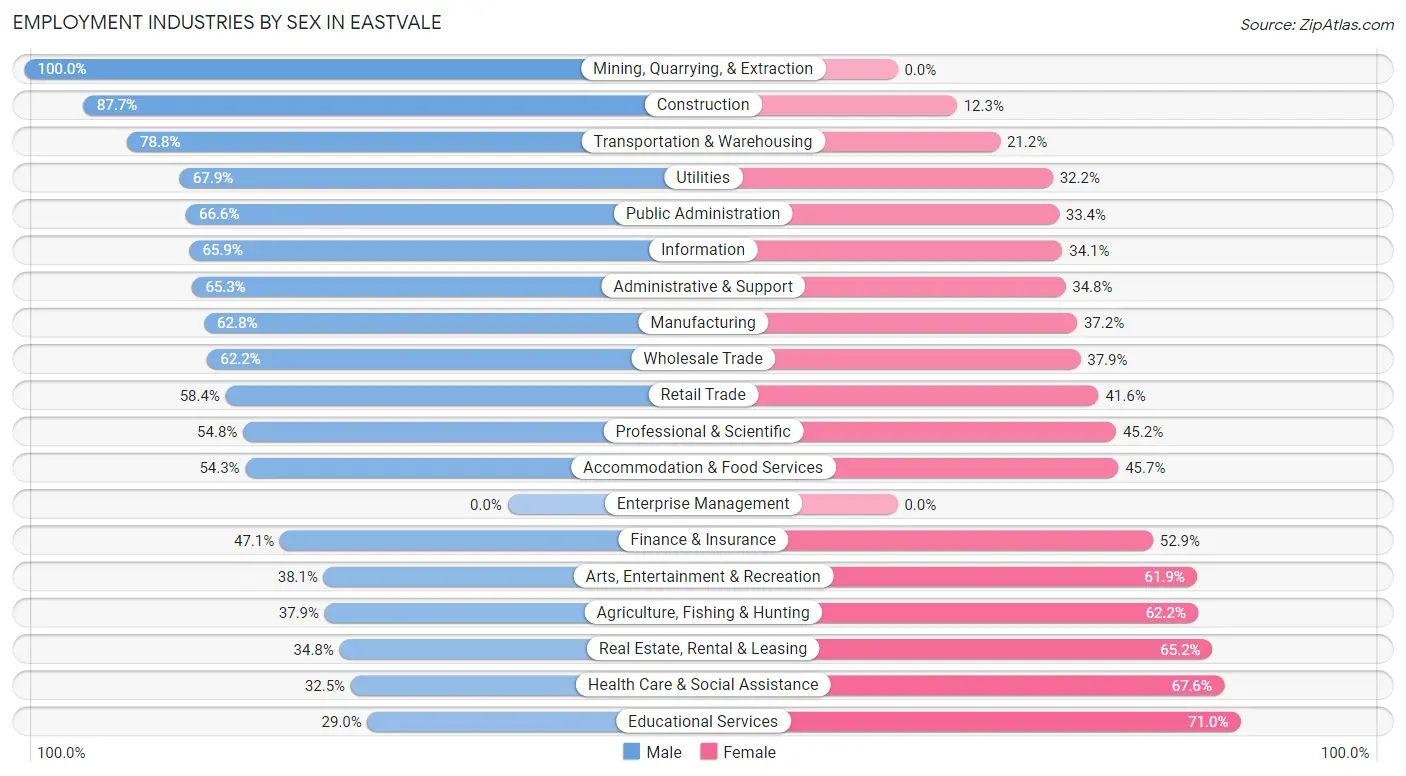
Employment Industries by Sex in Eastvale
The Eastvale industries that see more men than women are Mining, Quarrying, & Extraction (100.0%), Construction (87.7%), and Transportation & Warehousing (78.8%), whereas the industries that tend to have a higher number of women are Educational Services (71.0%), Health Care & Social Assistance (67.5%), and Real Estate, Rental & Leasing (65.2%).
| Industry | Male | Female |
| Agriculture, Fishing & Hunting | 109 (37.9%) | 179 (62.2%) |
| Mining, Quarrying, & Extraction | 15 (100.0%) | 0 (0.0%) |
| Construction | 1,814 (87.7%) | 254 (12.3%) |
| Manufacturing | 2,388 (62.8%) | 1,413 (37.2%) |
| Wholesale Trade | 849 (62.2%) | 517 (37.9%) |
| Retail Trade | 2,251 (58.4%) | 1,605 (41.6%) |
| Transportation & Warehousing | 2,004 (78.8%) | 540 (21.2%) |
| Utilities | 363 (67.8%) | 172 (32.2%) |
| Information | 436 (65.9%) | 226 (34.1%) |
| Finance & Insurance | 1,061 (47.1%) | 1,190 (52.9%) |
| Real Estate, Rental & Leasing | 205 (34.8%) | 384 (65.2%) |
| Professional & Scientific | 1,144 (54.8%) | 945 (45.2%) |
| Enterprise Management | 0 (0.0%) | 0 (0.0%) |
| Administrative & Support | 539 (65.2%) | 287 (34.7%) |
| Educational Services | 806 (29.0%) | 1,971 (71.0%) |
| Health Care & Social Assistance | 1,422 (32.5%) | 2,960 (67.5%) |
| Arts, Entertainment & Recreation | 150 (38.1%) | 244 (61.9%) |
| Accommodation & Food Services | 1,215 (54.3%) | 1,023 (45.7%) |
| Public Administration | 1,861 (66.6%) | 934 (33.4%) |
| Total | 19,607 (55.8%) | 15,505 (44.2%) |
Education in Eastvale
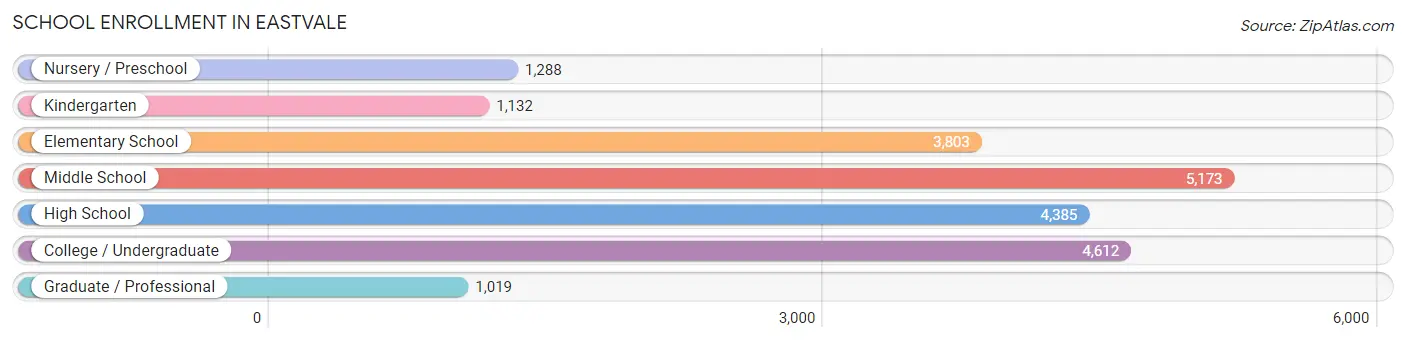
School Enrollment in Eastvale
The most common levels of schooling among the 21,412 students in Eastvale are middle school (5,173 | 24.2%), college / undergraduate (4,612 | 21.5%), and high school (4,385 | 20.5%).
| School Level | # Students | % Students |
| Nursery / Preschool | 1,288 | 6.0% |
| Kindergarten | 1,132 | 5.3% |
| Elementary School | 3,803 | 17.8% |
| Middle School | 5,173 | 24.2% |
| High School | 4,385 | 20.5% |
| College / Undergraduate | 4,612 | 21.5% |
| Graduate / Professional | 1,019 | 4.8% |
| Total | 21,412 | 100.0% |
School Enrollment by Age by Funding Source in Eastvale
Out of a total of 21,412 students who are enrolled in schools in Eastvale, 2,869 (13.4%) attend a private institution, while the remaining 18,543 (86.6%) are enrolled in public schools. The age group of 35 years and over has the highest likelihood of being enrolled in private schools, with 349 (40.7% in the age bracket) enrolled. Conversely, the age group of 15 to 17 year olds has the lowest likelihood of being enrolled in a private school, with 3,210 (94.8% in the age bracket) attending a public institution.
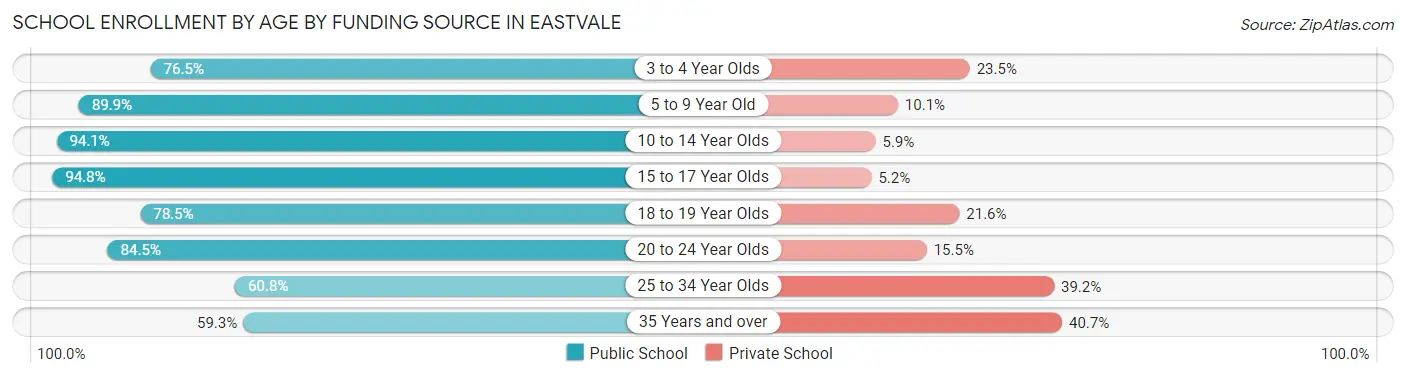
| Age Bracket | Public School | Private School |
| 3 to 4 Year Olds | 880 (76.5%) | 270 (23.5%) |
| 5 to 9 Year Old | 4,146 (89.9%) | 466 (10.1%) |
| 10 to 14 Year Olds | 5,888 (94.1%) | 372 (5.9%) |
| 15 to 17 Year Olds | 3,210 (94.8%) | 175 (5.2%) |
| 18 to 19 Year Olds | 1,445 (78.4%) | 397 (21.5%) |
| 20 to 24 Year Olds | 1,601 (84.5%) | 293 (15.5%) |
| 25 to 34 Year Olds | 858 (60.8%) | 553 (39.2%) |
| 35 Years and over | 509 (59.3%) | 349 (40.7%) |
| Total | 18,543 (86.6%) | 2,869 (13.4%) |
Educational Attainment by Field of Study in Eastvale
Business (3,891 | 21.6%), engineering (1,991 | 11.0%), science & technology (1,939 | 10.7%), social sciences (1,594 | 8.8%), and computers & mathematics (1,404 | 7.8%) are the most common fields of study among 18,043 individuals in Eastvale who have obtained a bachelor's degree or higher.
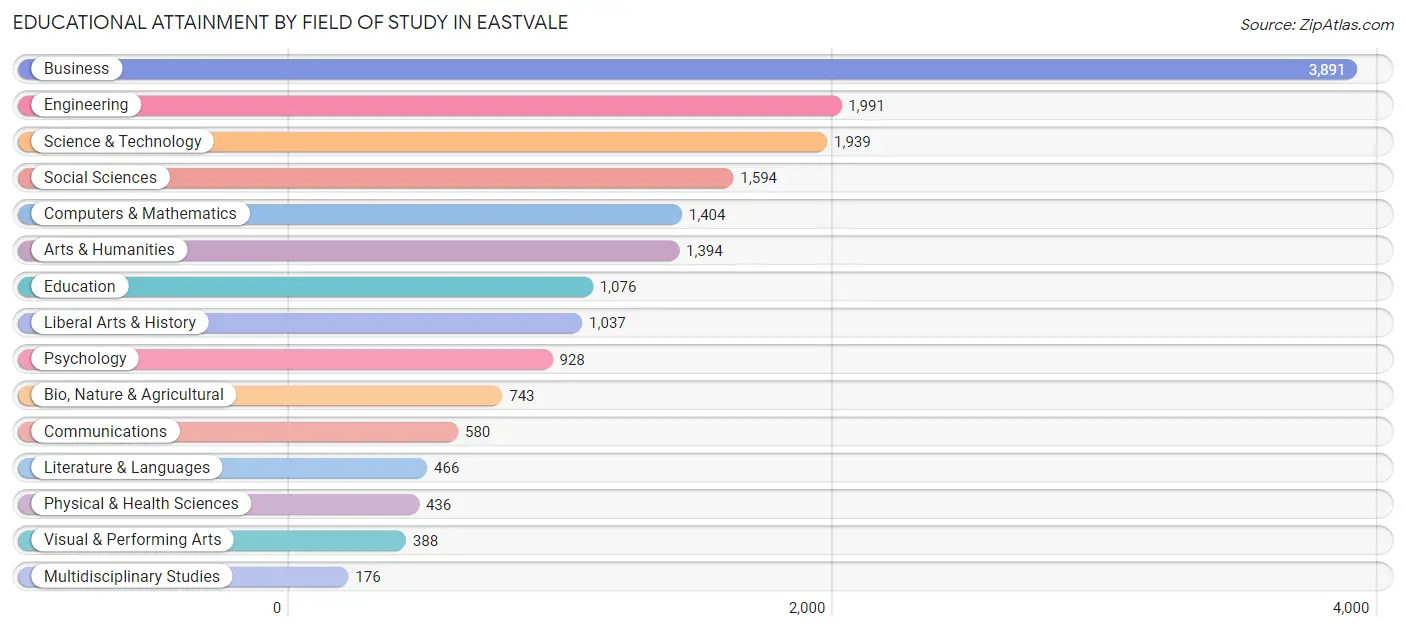
| Field of Study | # Graduates | % Graduates |
| Computers & Mathematics | 1,404 | 7.8% |
| Bio, Nature & Agricultural | 743 | 4.1% |
| Physical & Health Sciences | 436 | 2.4% |
| Psychology | 928 | 5.1% |
| Social Sciences | 1,594 | 8.8% |
| Engineering | 1,991 | 11.0% |
| Multidisciplinary Studies | 176 | 1.0% |
| Science & Technology | 1,939 | 10.7% |
| Business | 3,891 | 21.6% |
| Education | 1,076 | 6.0% |
| Literature & Languages | 466 | 2.6% |
| Liberal Arts & History | 1,037 | 5.8% |
| Visual & Performing Arts | 388 | 2.1% |
| Communications | 580 | 3.2% |
| Arts & Humanities | 1,394 | 7.7% |
| Total | 18,043 | 100.0% |
Transportation & Commute in Eastvale
Vehicle Availability by Sex in Eastvale
The most prevalent vehicle ownership categories in Eastvale are males with 2 vehicles (5,857, accounting for 30.5%) and females with 2 vehicles (4,624, making up 39.1%).
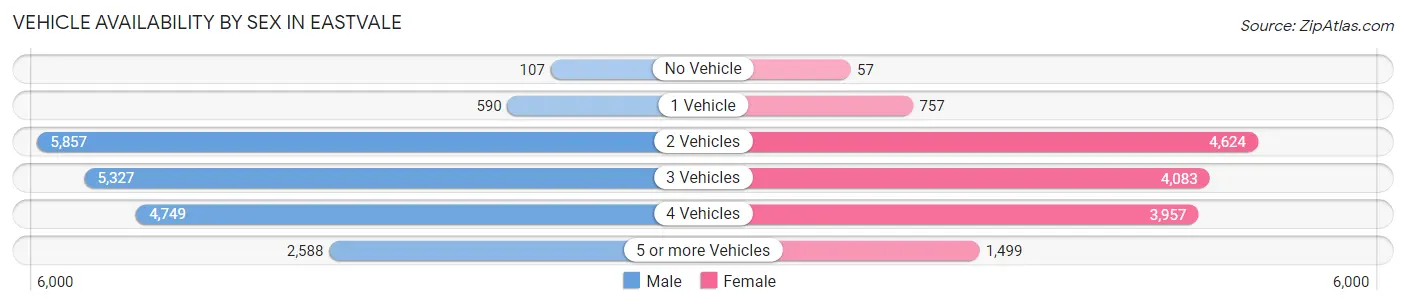
| Vehicles Available | Male | Female |
| No Vehicle | 107 (0.6%) | 57 (0.4%) |
| 1 Vehicle | 590 (3.1%) | 757 (5.1%) |
| 2 Vehicles | 5,857 (30.5%) | 4,624 (30.9%) |
| 3 Vehicles | 5,327 (27.7%) | 4,083 (27.3%) |
| 4 Vehicles | 4,749 (24.7%) | 3,957 (26.4%) |
| 5 or more Vehicles | 2,588 (13.5%) | 1,499 (10.0%) |
| Total | 19,218 (100.0%) | 14,977 (100.0%) |
Commute Time in Eastvale
The most frequently occuring commute durations in Eastvale are 45 to 59 minutes (5,062 commuters, 16.9%), 30 to 34 minutes (4,140 commuters, 13.8%), and 60 to 89 minutes (3,717 commuters, 12.4%).
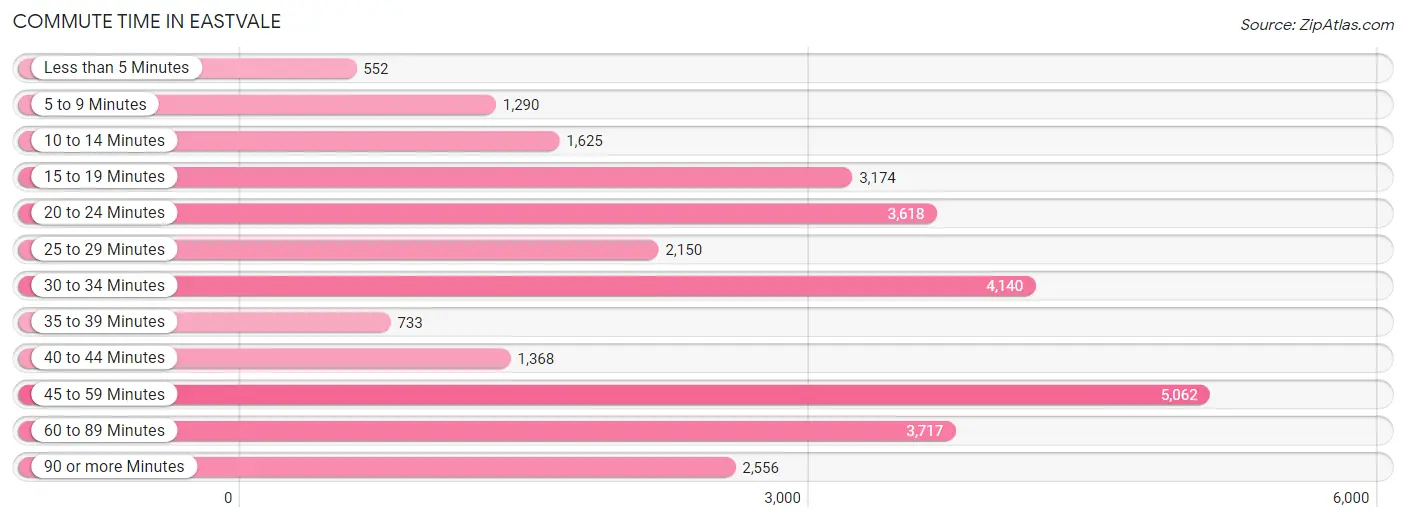
| Commute Time | # Commuters | % Commuters |
| Less than 5 Minutes | 552 | 1.8% |
| 5 to 9 Minutes | 1,290 | 4.3% |
| 10 to 14 Minutes | 1,625 | 5.4% |
| 15 to 19 Minutes | 3,174 | 10.6% |
| 20 to 24 Minutes | 3,618 | 12.1% |
| 25 to 29 Minutes | 2,150 | 7.2% |
| 30 to 34 Minutes | 4,140 | 13.8% |
| 35 to 39 Minutes | 733 | 2.4% |
| 40 to 44 Minutes | 1,368 | 4.6% |
| 45 to 59 Minutes | 5,062 | 16.9% |
| 60 to 89 Minutes | 3,717 | 12.4% |
| 90 or more Minutes | 2,556 | 8.5% |
Commute Time by Sex in Eastvale
The most common commute times in Eastvale are 45 to 59 minutes (2,924 commuters, 17.3%) for males and 30 to 34 minutes (2,290 commuters, 17.4%) for females.
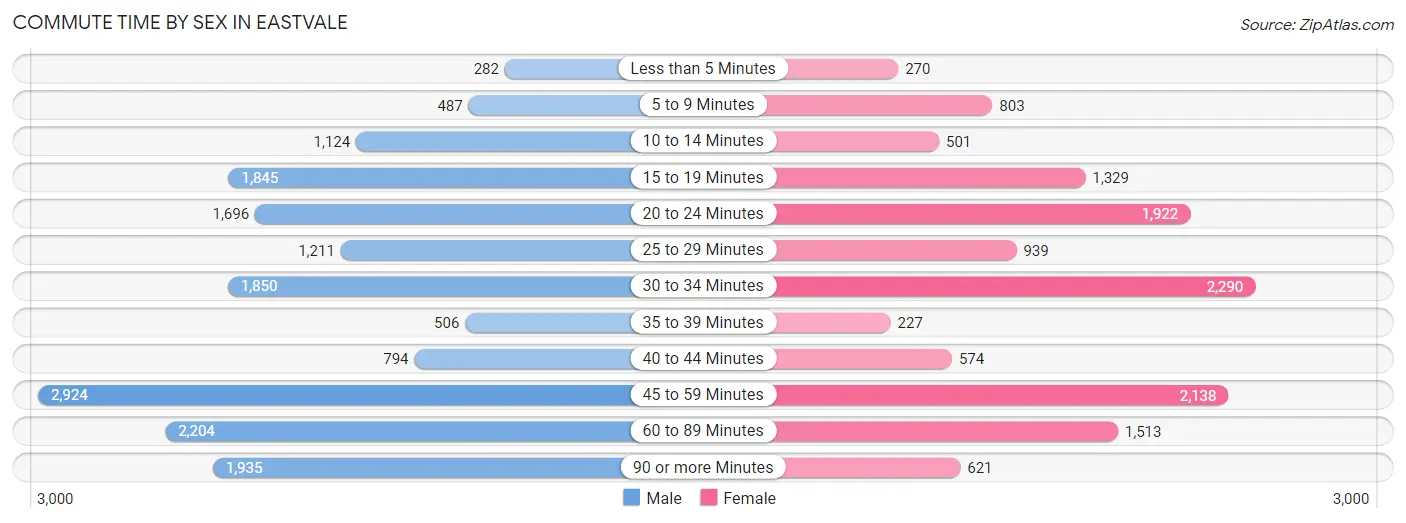
| Commute Time | Male | Female |
| Less than 5 Minutes | 282 (1.7%) | 270 (2.1%) |
| 5 to 9 Minutes | 487 (2.9%) | 803 (6.1%) |
| 10 to 14 Minutes | 1,124 (6.7%) | 501 (3.8%) |
| 15 to 19 Minutes | 1,845 (10.9%) | 1,329 (10.1%) |
| 20 to 24 Minutes | 1,696 (10.1%) | 1,922 (14.6%) |
| 25 to 29 Minutes | 1,211 (7.2%) | 939 (7.1%) |
| 30 to 34 Minutes | 1,850 (11.0%) | 2,290 (17.4%) |
| 35 to 39 Minutes | 506 (3.0%) | 227 (1.7%) |
| 40 to 44 Minutes | 794 (4.7%) | 574 (4.4%) |
| 45 to 59 Minutes | 2,924 (17.3%) | 2,138 (16.3%) |
| 60 to 89 Minutes | 2,204 (13.1%) | 1,513 (11.5%) |
| 90 or more Minutes | 1,935 (11.5%) | 621 (4.7%) |
Time of Departure to Work by Sex in Eastvale
The most frequent times of departure to work in Eastvale are 12:00 AM to 4:59 AM (1,875, 11.1%) for males and 7:00 AM to 7:29 AM (2,167, 16.5%) for females.
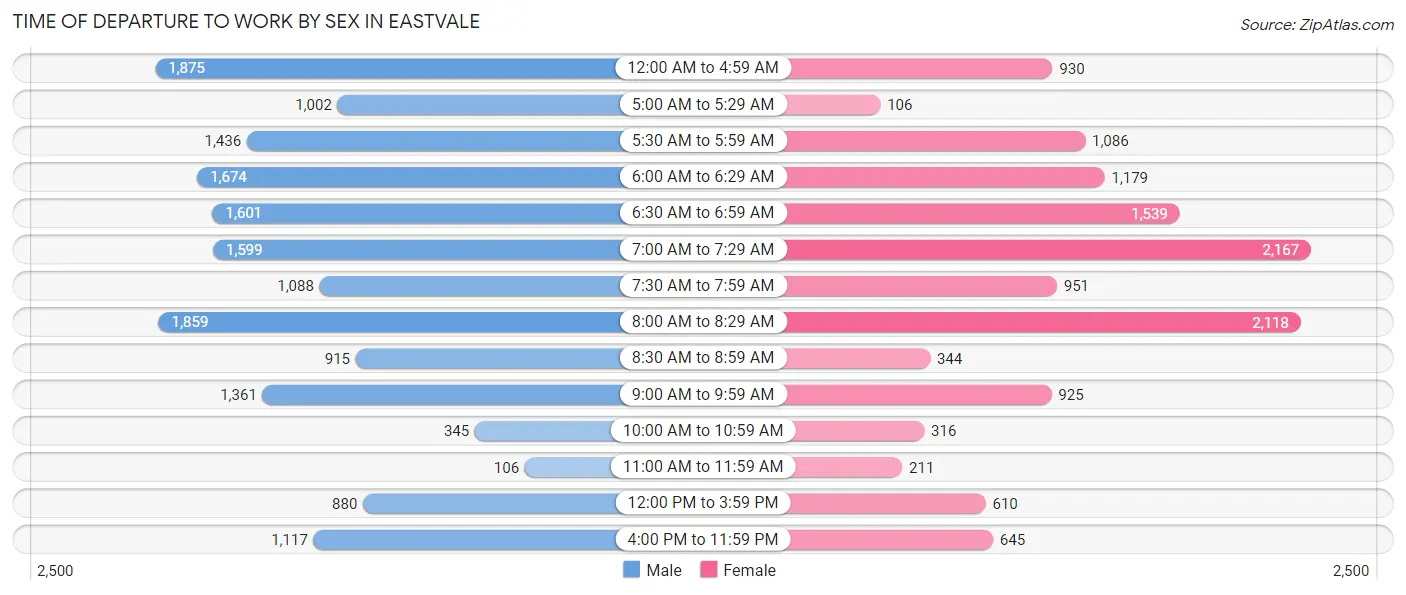
| Time of Departure | Male | Female |
| 12:00 AM to 4:59 AM | 1,875 (11.1%) | 930 (7.1%) |
| 5:00 AM to 5:29 AM | 1,002 (5.9%) | 106 (0.8%) |
| 5:30 AM to 5:59 AM | 1,436 (8.5%) | 1,086 (8.3%) |
| 6:00 AM to 6:29 AM | 1,674 (9.9%) | 1,179 (9.0%) |
| 6:30 AM to 6:59 AM | 1,601 (9.5%) | 1,539 (11.7%) |
| 7:00 AM to 7:29 AM | 1,599 (9.5%) | 2,167 (16.5%) |
| 7:30 AM to 7:59 AM | 1,088 (6.5%) | 951 (7.2%) |
| 8:00 AM to 8:29 AM | 1,859 (11.0%) | 2,118 (16.1%) |
| 8:30 AM to 8:59 AM | 915 (5.4%) | 344 (2.6%) |
| 9:00 AM to 9:59 AM | 1,361 (8.1%) | 925 (7.0%) |
| 10:00 AM to 10:59 AM | 345 (2.1%) | 316 (2.4%) |
| 11:00 AM to 11:59 AM | 106 (0.6%) | 211 (1.6%) |
| 12:00 PM to 3:59 PM | 880 (5.2%) | 610 (4.6%) |
| 4:00 PM to 11:59 PM | 1,117 (6.6%) | 645 (4.9%) |
| Total | 16,858 (100.0%) | 13,127 (100.0%) |
Housing Occupancy in Eastvale
Occupancy by Ownership in Eastvale
Of the total 17,250 dwellings in Eastvale, owner-occupied units account for 13,400 (77.7%), while renter-occupied units make up 3,850 (22.3%).
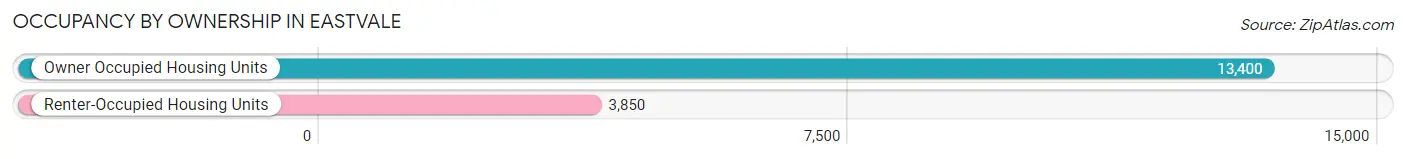
| Occupancy | # Housing Units | % Housing Units |
| Owner Occupied Housing Units | 13,400 | 77.7% |
| Renter-Occupied Housing Units | 3,850 | 22.3% |
| Total Occupied Housing Units | 17,250 | 100.0% |
Occupancy by Household Size in Eastvale
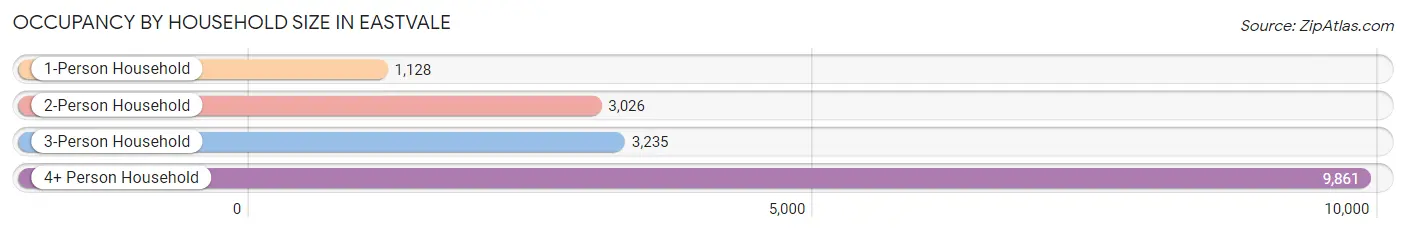
| Household Size | # Housing Units | % Housing Units |
| 1-Person Household | 1,128 | 6.5% |
| 2-Person Household | 3,026 | 17.5% |
| 3-Person Household | 3,235 | 18.8% |
| 4+ Person Household | 9,861 | 57.2% |
| Total Housing Units | 17,250 | 100.0% |
Occupancy by Ownership by Household Size in Eastvale
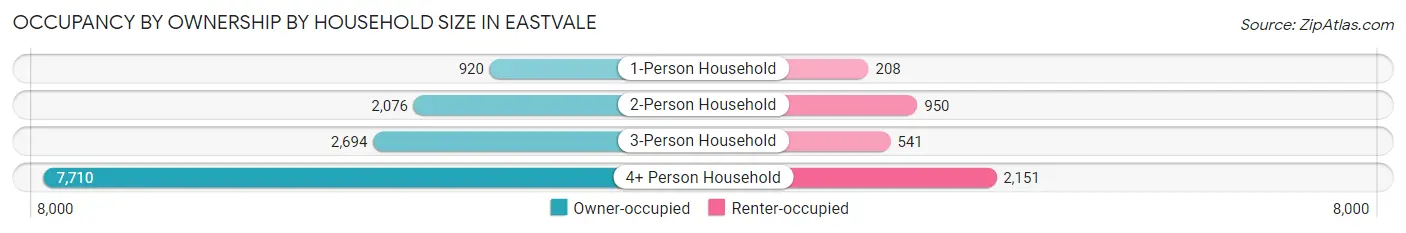
| Household Size | Owner-occupied | Renter-occupied |
| 1-Person Household | 920 (81.6%) | 208 (18.4%) |
| 2-Person Household | 2,076 (68.6%) | 950 (31.4%) |
| 3-Person Household | 2,694 (83.3%) | 541 (16.7%) |
| 4+ Person Household | 7,710 (78.2%) | 2,151 (21.8%) |
| Total Housing Units | 13,400 (77.7%) | 3,850 (22.3%) |
Occupancy by Educational Attainment in Eastvale
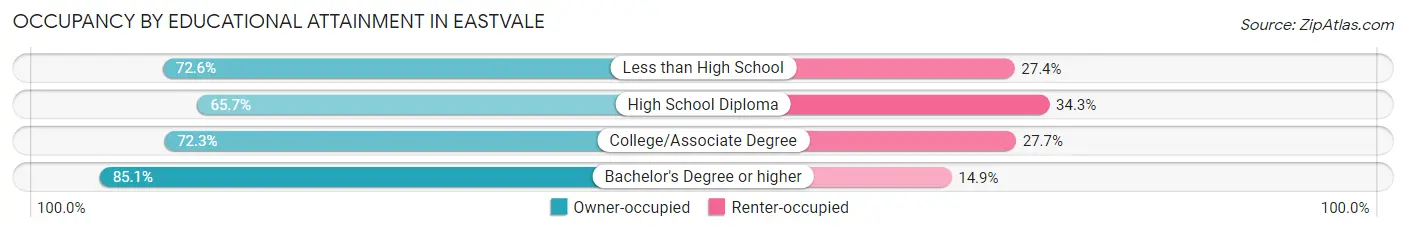
| Household Size | Owner-occupied | Renter-occupied |
| Less than High School | 1,182 (72.6%) | 446 (27.4%) |
| High School Diploma | 1,472 (65.7%) | 768 (34.3%) |
| College/Associate Degree | 3,634 (72.3%) | 1,391 (27.7%) |
| Bachelor's Degree or higher | 7,112 (85.1%) | 1,245 (14.9%) |
Occupancy by Age of Householder in Eastvale
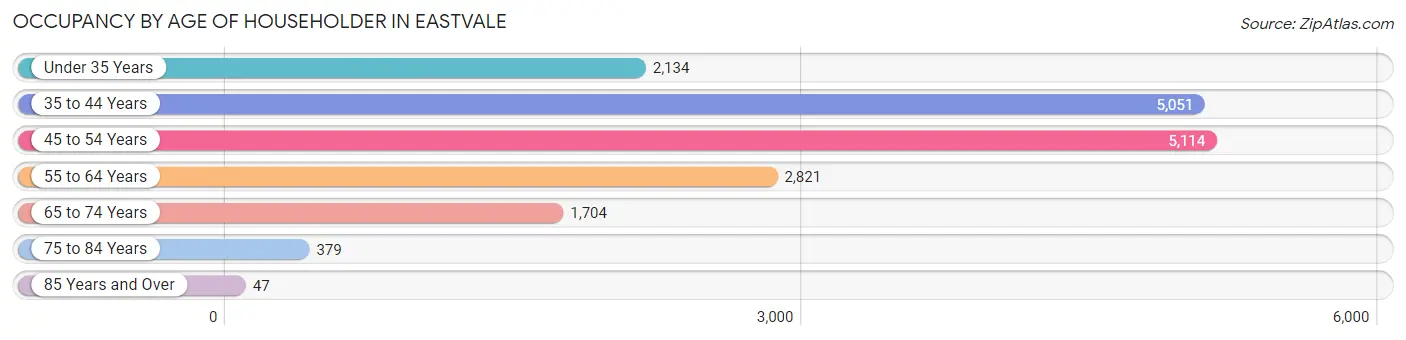
| Age Bracket | # Households | % Households |
| Under 35 Years | 2,134 | 12.4% |
| 35 to 44 Years | 5,051 | 29.3% |
| 45 to 54 Years | 5,114 | 29.6% |
| 55 to 64 Years | 2,821 | 16.4% |
| 65 to 74 Years | 1,704 | 9.9% |
| 75 to 84 Years | 379 | 2.2% |
| 85 Years and Over | 47 | 0.3% |
| Total | 17,250 | 100.0% |
Housing Finances in Eastvale
Median Income by Occupancy in Eastvale
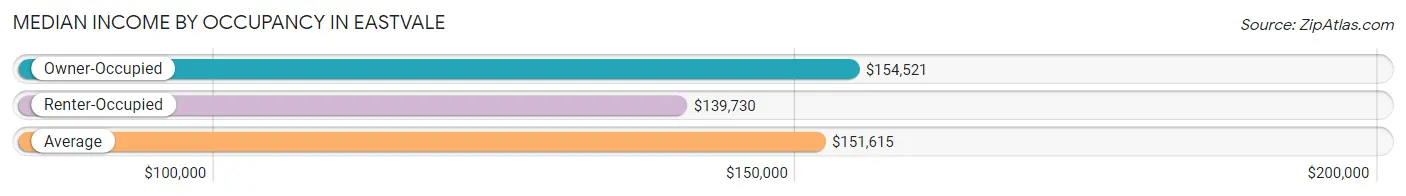
| Occupancy Type | # Households | Median Income |
| Owner-Occupied | 13,400 (77.7%) | $154,521 |
| Renter-Occupied | 3,850 (22.3%) | $139,730 |
| Average | 17,250 (100.0%) | $151,615 |
Occupancy by Householder Income Bracket in Eastvale
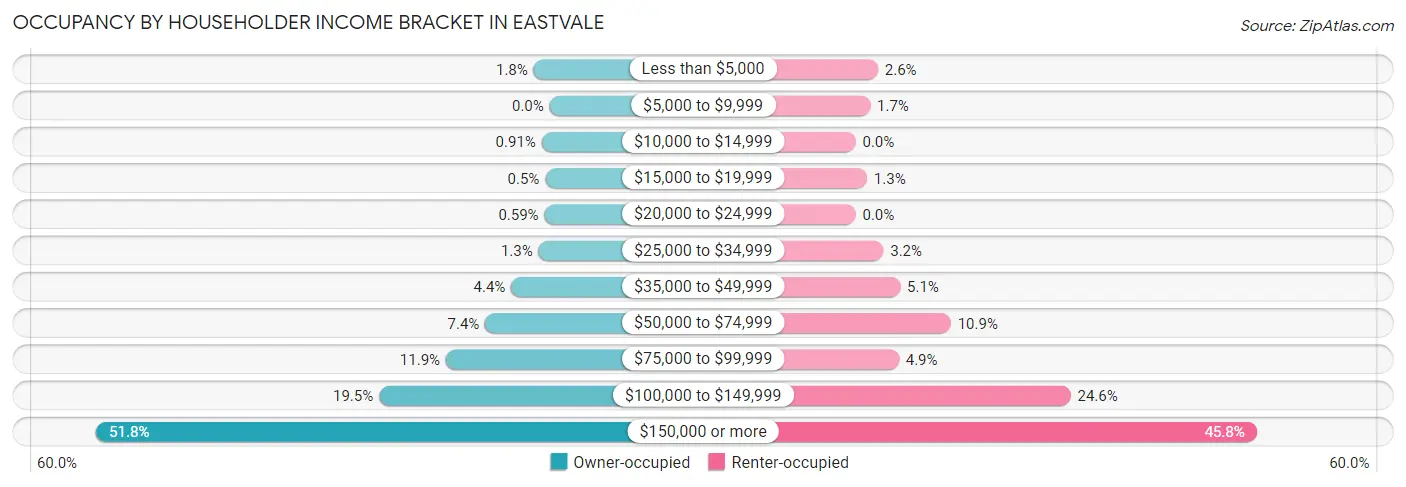
| Income Bracket | Owner-occupied | Renter-occupied |
| Less than $5,000 | 245 (1.8%) | 98 (2.5%) |
| $5,000 to $9,999 | 0 (0.0%) | 64 (1.7%) |
| $10,000 to $14,999 | 122 (0.9%) | 0 (0.0%) |
| $15,000 to $19,999 | 67 (0.5%) | 50 (1.3%) |
| $20,000 to $24,999 | 79 (0.6%) | 0 (0.0%) |
| $25,000 to $34,999 | 169 (1.3%) | 122 (3.2%) |
| $35,000 to $49,999 | 588 (4.4%) | 196 (5.1%) |
| $50,000 to $74,999 | 986 (7.4%) | 419 (10.9%) |
| $75,000 to $99,999 | 1,588 (11.8%) | 190 (4.9%) |
| $100,000 to $149,999 | 2,612 (19.5%) | 946 (24.6%) |
| $150,000 or more | 6,944 (51.8%) | 1,765 (45.8%) |
| Total | 13,400 (100.0%) | 3,850 (100.0%) |
Monthly Housing Cost Tiers in Eastvale
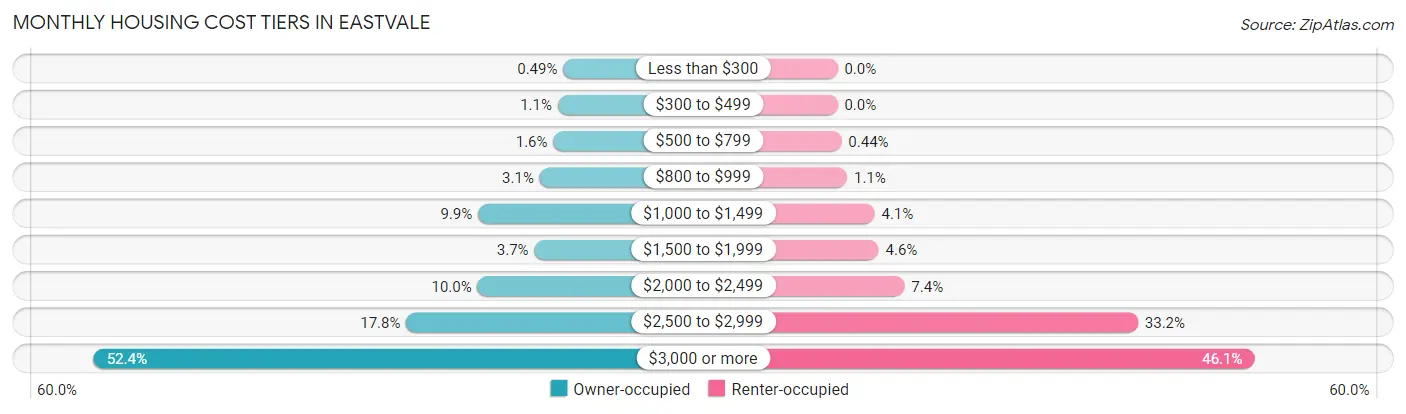
| Monthly Cost | Owner-occupied | Renter-occupied |
| Less than $300 | 66 (0.5%) | 0 (0.0%) |
| $300 to $499 | 147 (1.1%) | 0 (0.0%) |
| $500 to $799 | 213 (1.6%) | 17 (0.4%) |
| $800 to $999 | 414 (3.1%) | 41 (1.1%) |
| $1,000 to $1,499 | 1,328 (9.9%) | 158 (4.1%) |
| $1,500 to $1,999 | 493 (3.7%) | 175 (4.5%) |
| $2,000 to $2,499 | 1,334 (10.0%) | 285 (7.4%) |
| $2,500 to $2,999 | 2,389 (17.8%) | 1,278 (33.2%) |
| $3,000 or more | 7,016 (52.4%) | 1,773 (46.1%) |
| Total | 13,400 (100.0%) | 3,850 (100.0%) |
Physical Housing Characteristics in Eastvale
Housing Structures in Eastvale
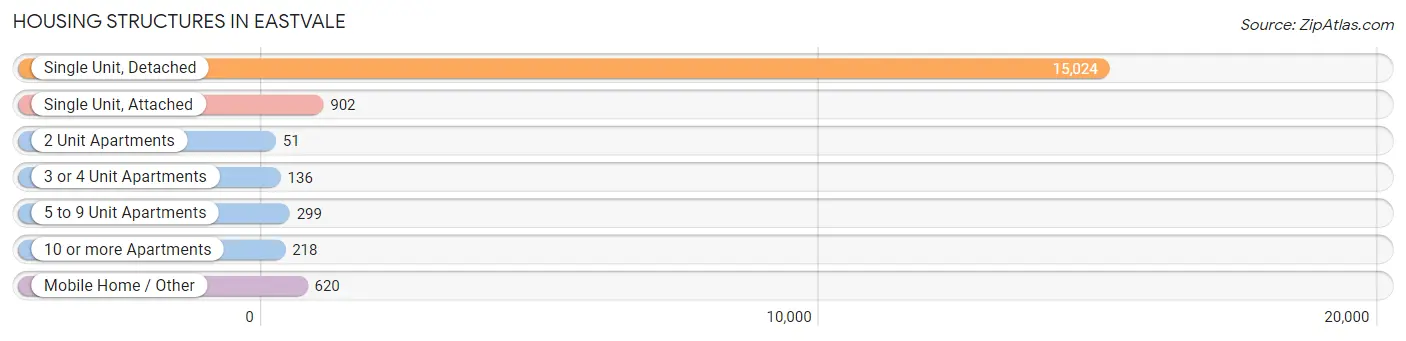
| Structure Type | # Housing Units | % Housing Units |
| Single Unit, Detached | 15,024 | 87.1% |
| Single Unit, Attached | 902 | 5.2% |
| 2 Unit Apartments | 51 | 0.3% |
| 3 or 4 Unit Apartments | 136 | 0.8% |
| 5 to 9 Unit Apartments | 299 | 1.7% |
| 10 or more Apartments | 218 | 1.3% |
| Mobile Home / Other | 620 | 3.6% |
| Total | 17,250 | 100.0% |
Housing Structures by Occupancy in Eastvale
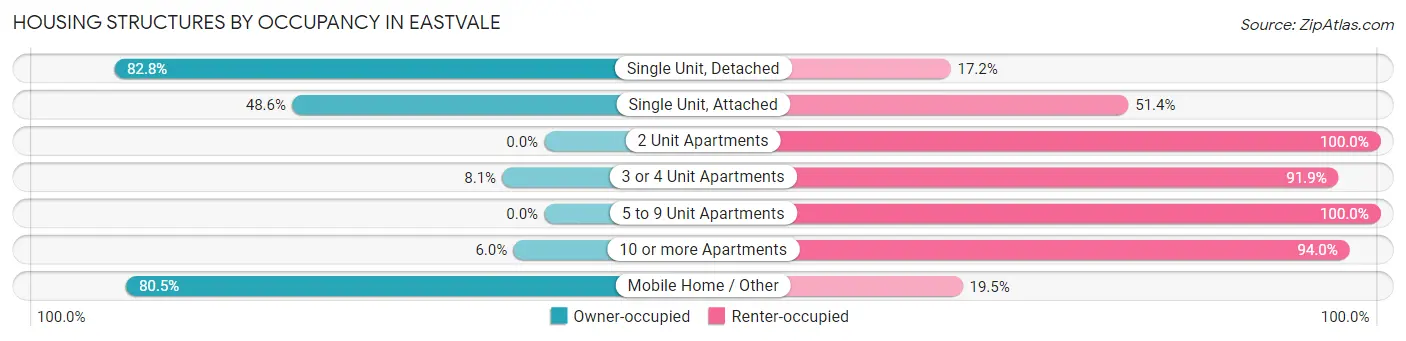
| Structure Type | Owner-occupied | Renter-occupied |
| Single Unit, Detached | 12,439 (82.8%) | 2,585 (17.2%) |
| Single Unit, Attached | 438 (48.6%) | 464 (51.4%) |
| 2 Unit Apartments | 0 (0.0%) | 51 (100.0%) |
| 3 or 4 Unit Apartments | 11 (8.1%) | 125 (91.9%) |
| 5 to 9 Unit Apartments | 0 (0.0%) | 299 (100.0%) |
| 10 or more Apartments | 13 (6.0%) | 205 (94.0%) |
| Mobile Home / Other | 499 (80.5%) | 121 (19.5%) |
| Total | 13,400 (77.7%) | 3,850 (22.3%) |
Housing Structures by Number of Rooms in Eastvale
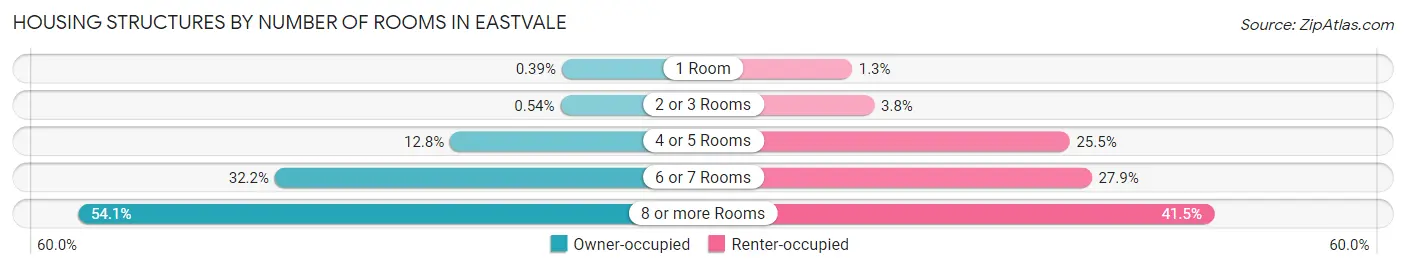
| Number of Rooms | Owner-occupied | Renter-occupied |
| 1 Room | 52 (0.4%) | 51 (1.3%) |
| 2 or 3 Rooms | 72 (0.5%) | 146 (3.8%) |
| 4 or 5 Rooms | 1,712 (12.8%) | 981 (25.5%) |
| 6 or 7 Rooms | 4,319 (32.2%) | 1,075 (27.9%) |
| 8 or more Rooms | 7,245 (54.1%) | 1,597 (41.5%) |
| Total | 13,400 (100.0%) | 3,850 (100.0%) |
Housing Structure by Heating Type in Eastvale
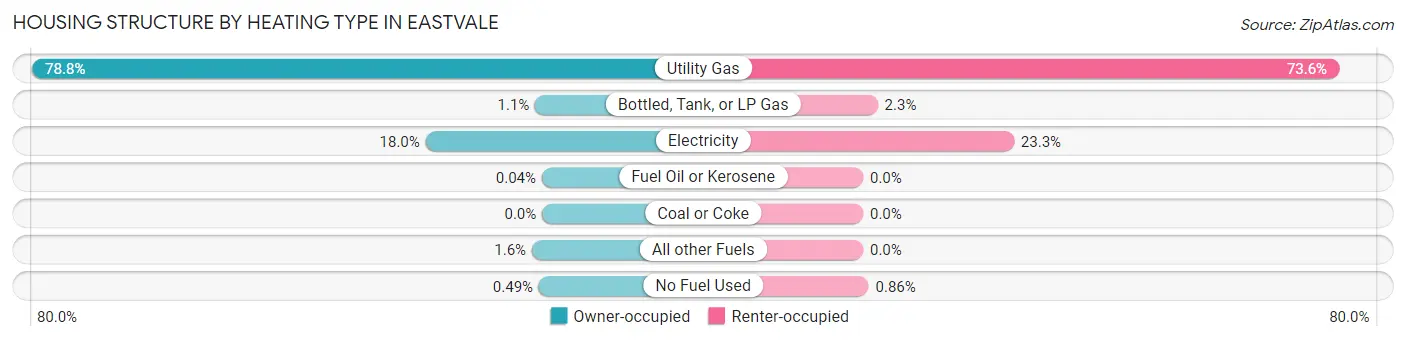
| Heating Type | Owner-occupied | Renter-occupied |
| Utility Gas | 10,563 (78.8%) | 2,832 (73.6%) |
| Bottled, Tank, or LP Gas | 143 (1.1%) | 87 (2.3%) |
| Electricity | 2,413 (18.0%) | 898 (23.3%) |
| Fuel Oil or Kerosene | 6 (0.0%) | 0 (0.0%) |
| Coal or Coke | 0 (0.0%) | 0 (0.0%) |
| All other Fuels | 210 (1.6%) | 0 (0.0%) |
| No Fuel Used | 65 (0.5%) | 33 (0.9%) |
| Total | 13,400 (100.0%) | 3,850 (100.0%) |
Household Vehicle Usage in Eastvale
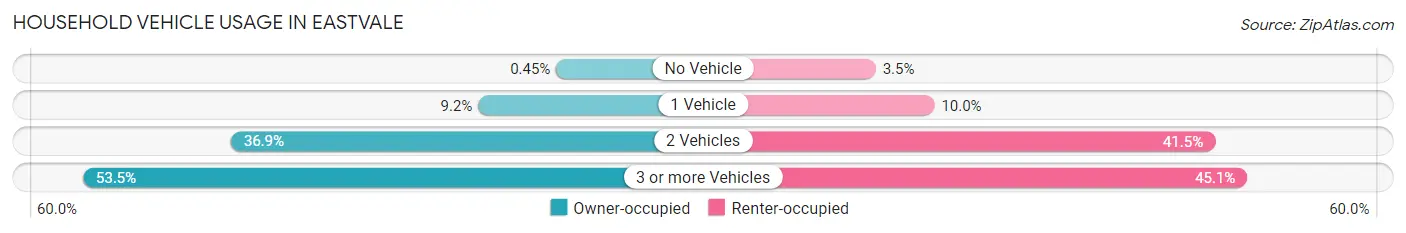
| Vehicles per Household | Owner-occupied | Renter-occupied |
| No Vehicle | 60 (0.4%) | 133 (3.5%) |
| 1 Vehicle | 1,231 (9.2%) | 386 (10.0%) |
| 2 Vehicles | 4,944 (36.9%) | 1,596 (41.4%) |
| 3 or more Vehicles | 7,165 (53.5%) | 1,735 (45.1%) |
| Total | 13,400 (100.0%) | 3,850 (100.0%) |
Real Estate & Mortgages in Eastvale
Real Estate and Mortgage Overview in Eastvale
| Characteristic | Without Mortgage | With Mortgage |
| Housing Units | 2,116 | 11,284 |
| Median Property Value | $649,800 | $680,500 |
| Median Household Income | $99,866 | $6,319 |
| Monthly Housing Costs | $1,065 | $7,016 |
| Real Estate Taxes | $7,829 | $161 |
Property Value by Mortgage Status in Eastvale
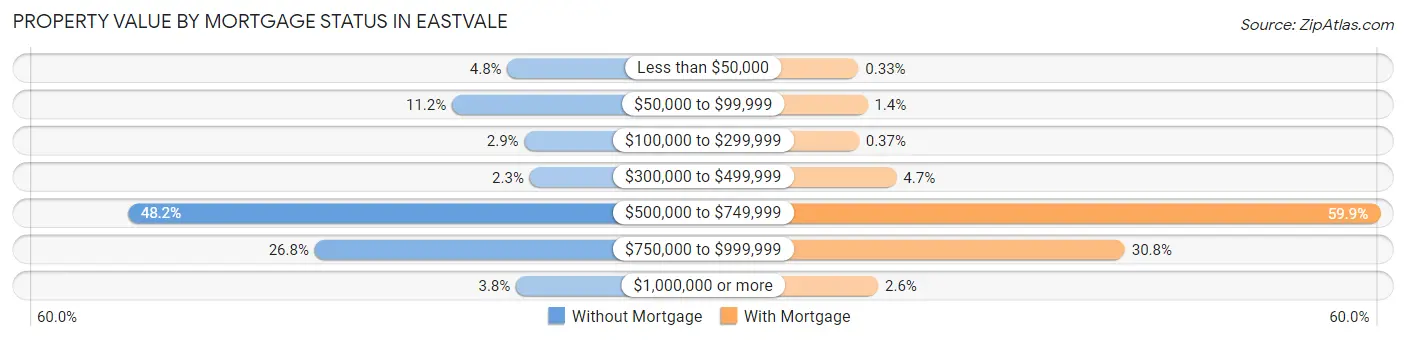
| Property Value | Without Mortgage | With Mortgage |
| Less than $50,000 | 102 (4.8%) | 37 (0.3%) |
| $50,000 to $99,999 | 236 (11.2%) | 153 (1.4%) |
| $100,000 to $299,999 | 61 (2.9%) | 42 (0.4%) |
| $300,000 to $499,999 | 48 (2.3%) | 527 (4.7%) |
| $500,000 to $749,999 | 1,020 (48.2%) | 6,762 (59.9%) |
| $750,000 to $999,999 | 568 (26.8%) | 3,472 (30.8%) |
| $1,000,000 or more | 81 (3.8%) | 291 (2.6%) |
| Total | 2,116 (100.0%) | 11,284 (100.0%) |
Household Income by Mortgage Status in Eastvale
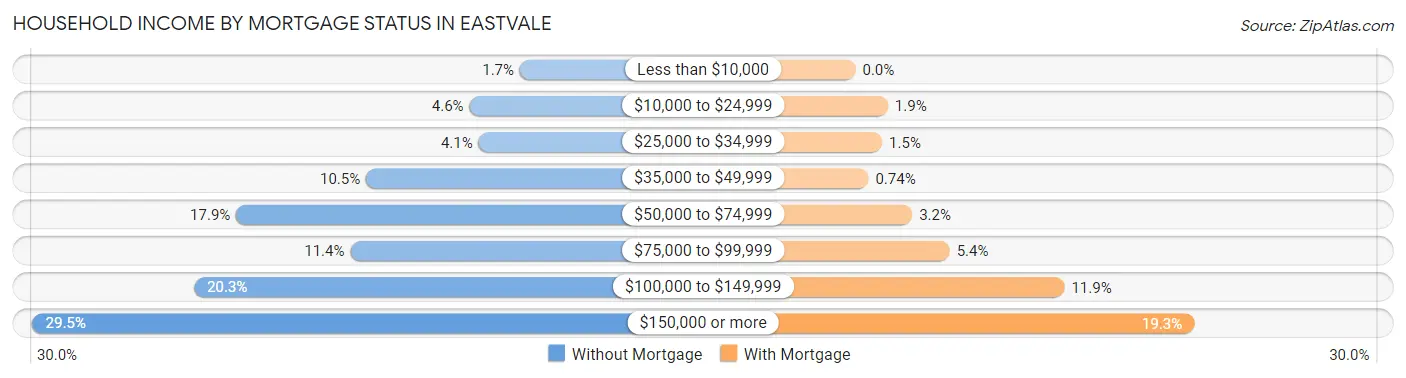
| Household Income | Without Mortgage | With Mortgage |
| Less than $10,000 | 36 (1.7%) | 0 (0.0%) |
| $10,000 to $24,999 | 97 (4.6%) | 209 (1.8%) |
| $25,000 to $34,999 | 86 (4.1%) | 171 (1.5%) |
| $35,000 to $49,999 | 222 (10.5%) | 83 (0.7%) |
| $50,000 to $74,999 | 379 (17.9%) | 366 (3.2%) |
| $75,000 to $99,999 | 241 (11.4%) | 607 (5.4%) |
| $100,000 to $149,999 | 430 (20.3%) | 1,347 (11.9%) |
| $150,000 or more | 625 (29.5%) | 2,182 (19.3%) |
| Total | 2,116 (100.0%) | 11,284 (100.0%) |
Property Value to Household Income Ratio in Eastvale
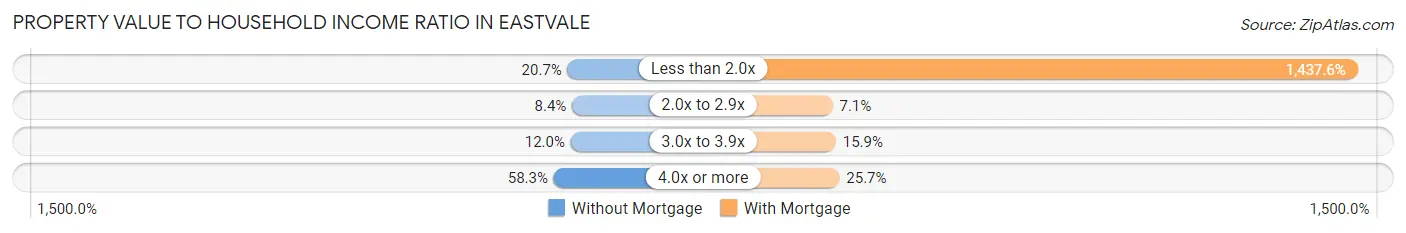
| Value-to-Income Ratio | Without Mortgage | With Mortgage |
| Less than 2.0x | 437 (20.6%) | 162,220 (1,437.6%) |
| 2.0x to 2.9x | 177 (8.4%) | 803 (7.1%) |
| 3.0x to 3.9x | 254 (12.0%) | 1,795 (15.9%) |
| 4.0x or more | 1,233 (58.3%) | 2,901 (25.7%) |
| Total | 2,116 (100.0%) | 11,284 (100.0%) |
Real Estate Taxes by Mortgage Status in Eastvale
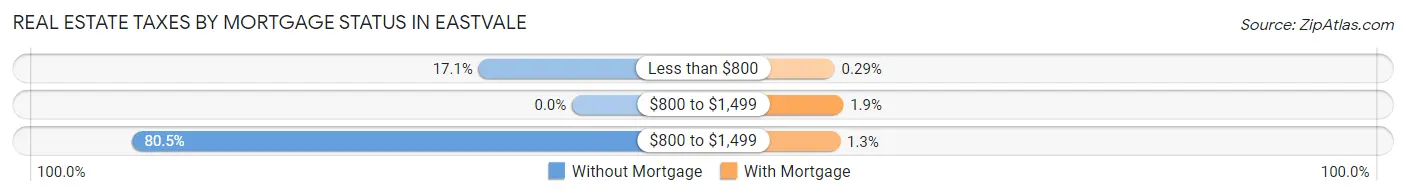
| Property Taxes | Without Mortgage | With Mortgage |
| Less than $800 | 361 (17.1%) | 33 (0.3%) |
| $800 to $1,499 | 0 (0.0%) | 210 (1.9%) |
| $800 to $1,499 | 1,703 (80.5%) | 143 (1.3%) |
| Total | 2,116 (100.0%) | 11,284 (100.0%) |
Health & Disability in Eastvale
Health Insurance Coverage by Age in Eastvale
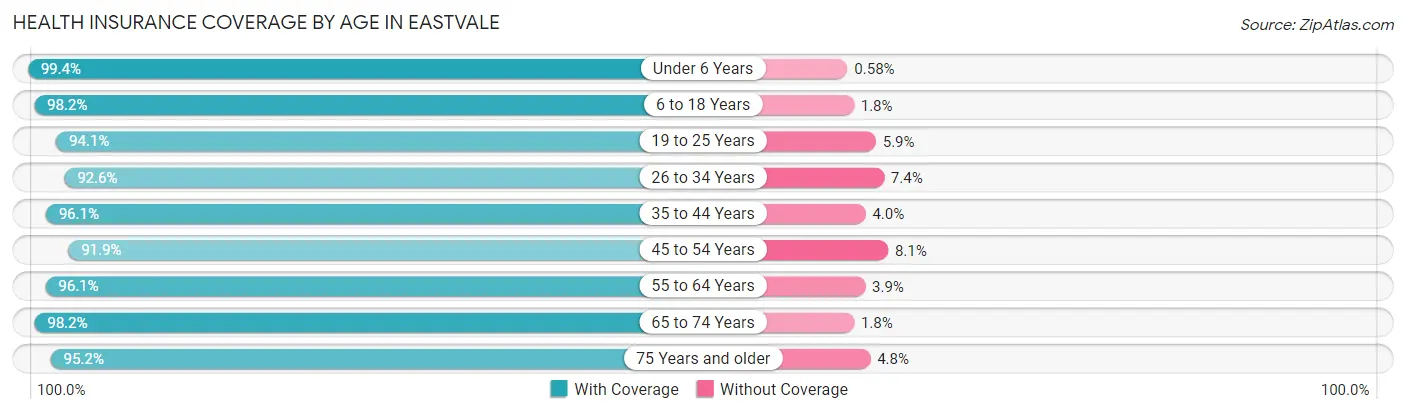
| Age Bracket | With Coverage | Without Coverage |
| Under 6 Years | 6,024 (99.4%) | 35 (0.6%) |
| 6 to 18 Years | 14,780 (98.2%) | 266 (1.8%) |
| 19 to 25 Years | 5,448 (94.1%) | 340 (5.9%) |
| 26 to 34 Years | 7,498 (92.6%) | 598 (7.4%) |
| 35 to 44 Years | 11,318 (96.1%) | 465 (4.0%) |
| 45 to 54 Years | 9,938 (91.9%) | 881 (8.1%) |
| 55 to 64 Years | 5,796 (96.1%) | 234 (3.9%) |
| 65 to 74 Years | 3,633 (98.2%) | 67 (1.8%) |
| 75 Years and older | 2,043 (95.2%) | 104 (4.8%) |
| Total | 66,478 (95.7%) | 2,990 (4.3%) |
Health Insurance Coverage by Citizenship Status in Eastvale
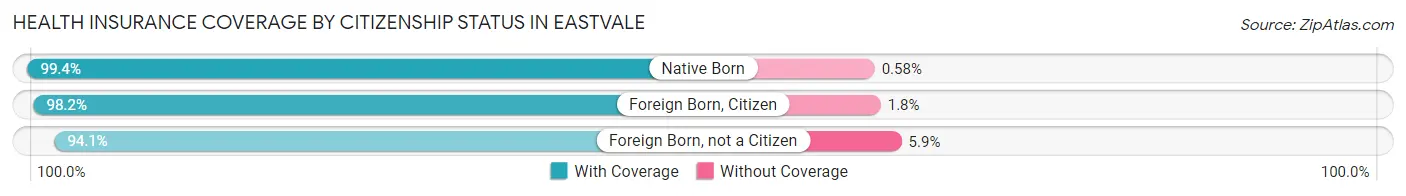
| Citizenship Status | With Coverage | Without Coverage |
| Native Born | 6,024 (99.4%) | 35 (0.6%) |
| Foreign Born, Citizen | 14,780 (98.2%) | 266 (1.8%) |
| Foreign Born, not a Citizen | 5,448 (94.1%) | 340 (5.9%) |
Health Insurance Coverage by Household Income in Eastvale
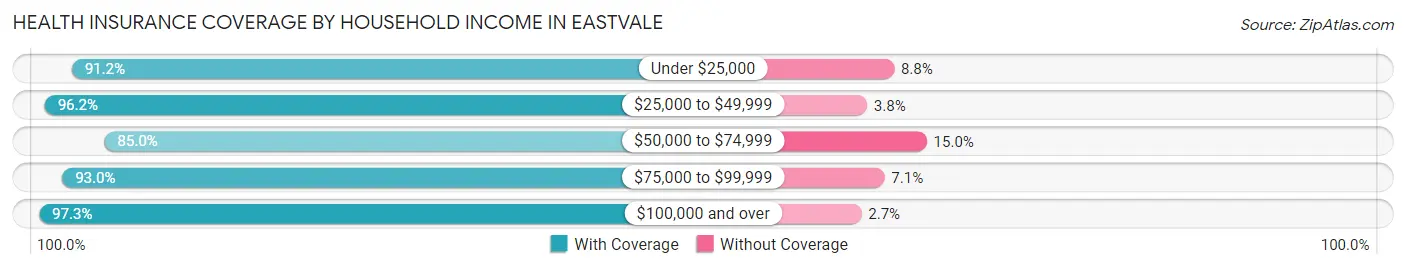
| Household Income | With Coverage | Without Coverage |
| Under $25,000 | 1,443 (91.2%) | 140 (8.8%) |
| $25,000 to $49,999 | 3,476 (96.2%) | 136 (3.8%) |
| $50,000 to $74,999 | 4,734 (85.0%) | 833 (15.0%) |
| $75,000 to $99,999 | 6,114 (92.9%) | 464 (7.0%) |
| $100,000 and over | 50,697 (97.3%) | 1,417 (2.7%) |
Public vs Private Health Insurance Coverage by Age in Eastvale
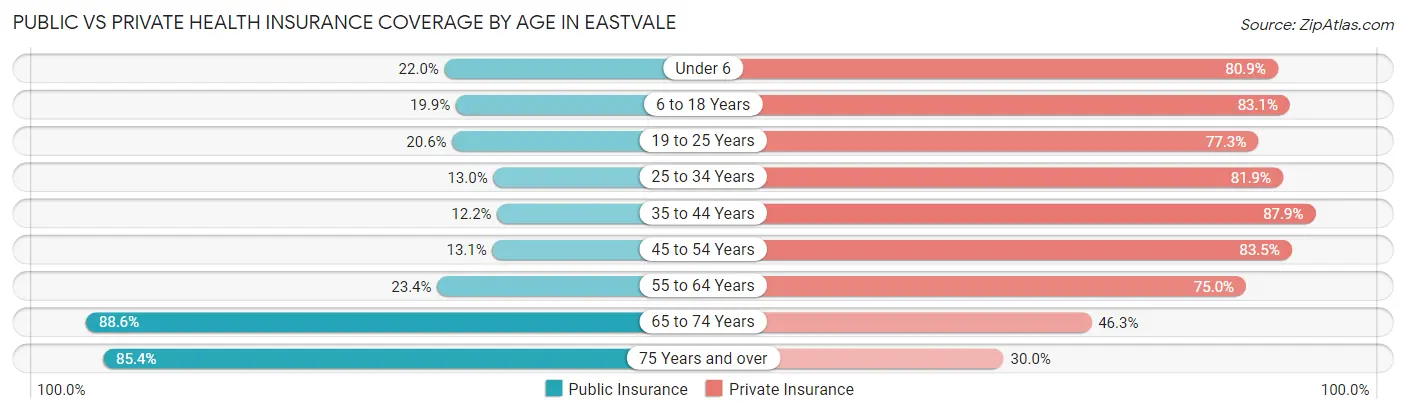
| Age Bracket | Public Insurance | Private Insurance |
| Under 6 | 1,335 (22.0%) | 4,900 (80.9%) |
| 6 to 18 Years | 2,995 (19.9%) | 12,509 (83.1%) |
| 19 to 25 Years | 1,192 (20.6%) | 4,472 (77.3%) |
| 25 to 34 Years | 1,050 (13.0%) | 6,627 (81.9%) |
| 35 to 44 Years | 1,442 (12.2%) | 10,354 (87.9%) |
| 45 to 54 Years | 1,422 (13.1%) | 9,032 (83.5%) |
| 55 to 64 Years | 1,410 (23.4%) | 4,523 (75.0%) |
| 65 to 74 Years | 3,279 (88.6%) | 1,713 (46.3%) |
| 75 Years and over | 1,834 (85.4%) | 645 (30.0%) |
| Total | 15,959 (23.0%) | 54,775 (78.8%) |
Disability Status by Sex by Age in Eastvale
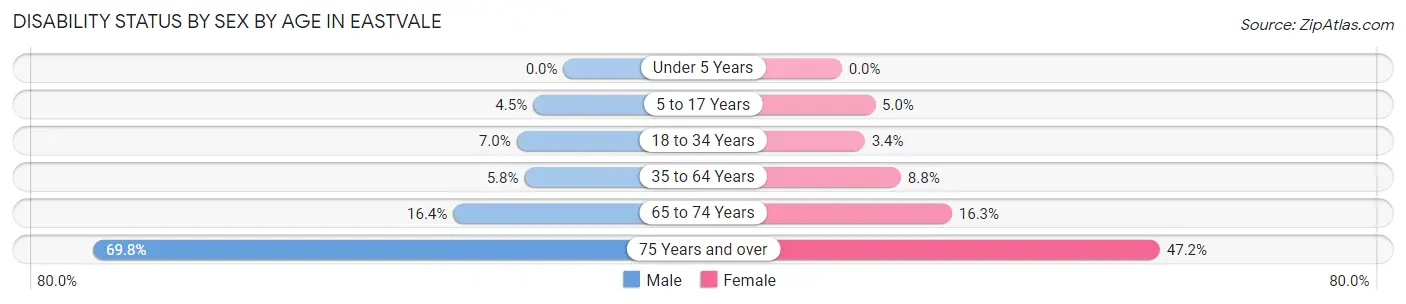
| Age Bracket | Male | Female |
| Under 5 Years | 0 (0.0%) | 0 (0.0%) |
| 5 to 17 Years | 324 (4.5%) | 367 (5.0%) |
| 18 to 34 Years | 528 (7.0%) | 261 (3.4%) |
| 35 to 64 Years | 836 (5.8%) | 1,249 (8.8%) |
| 65 to 74 Years | 299 (16.4%) | 306 (16.3%) |
| 75 Years and over | 680 (69.8%) | 554 (47.2%) |
Disability Class by Sex by Age in Eastvale
Disability Class: Hearing Difficulty
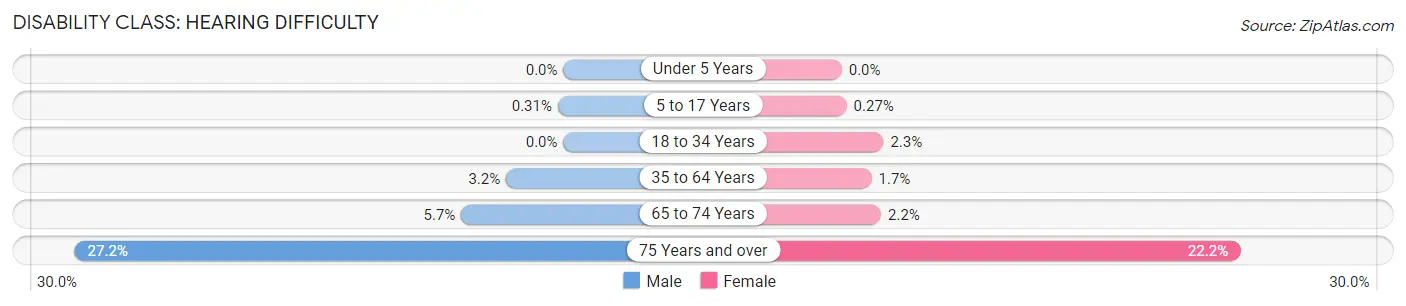
| Age Bracket | Male | Female |
| Under 5 Years | 0 (0.0%) | 0 (0.0%) |
| 5 to 17 Years | 22 (0.3%) | 20 (0.3%) |
| 18 to 34 Years | 0 (0.0%) | 178 (2.3%) |
| 35 to 64 Years | 460 (3.2%) | 236 (1.7%) |
| 65 to 74 Years | 104 (5.7%) | 41 (2.2%) |
| 75 Years and over | 265 (27.2%) | 260 (22.2%) |
Disability Class: Vision Difficulty
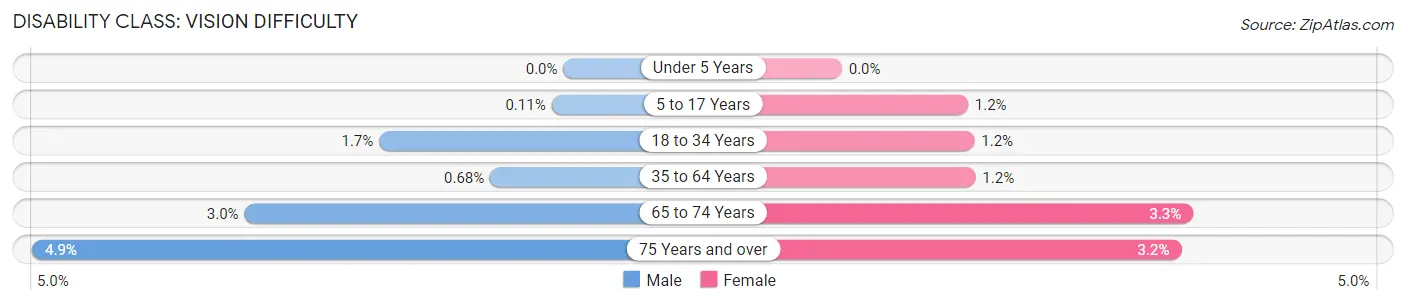
| Age Bracket | Male | Female |
| Under 5 Years | 0 (0.0%) | 0 (0.0%) |
| 5 to 17 Years | 8 (0.1%) | 87 (1.2%) |
| 18 to 34 Years | 130 (1.7%) | 94 (1.2%) |
| 35 to 64 Years | 98 (0.7%) | 177 (1.2%) |
| 65 to 74 Years | 54 (3.0%) | 61 (3.3%) |
| 75 Years and over | 48 (4.9%) | 37 (3.2%) |
Disability Class: Cognitive Difficulty
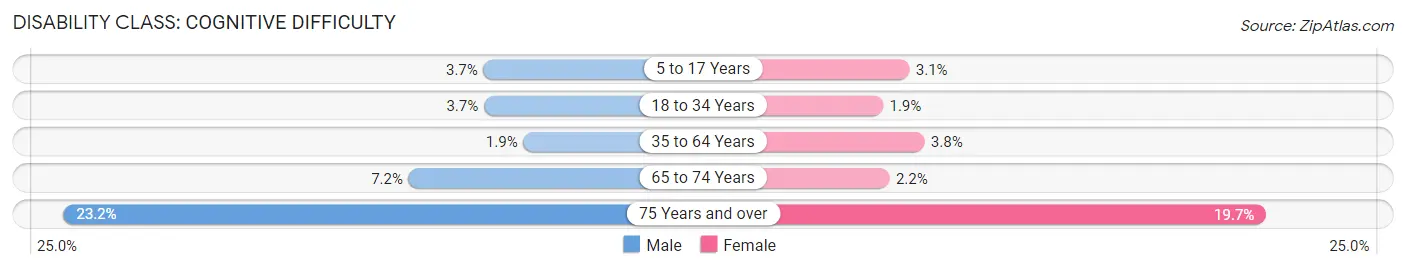
| Age Bracket | Male | Female |
| 5 to 17 Years | 266 (3.7%) | 230 (3.1%) |
| 18 to 34 Years | 279 (3.7%) | 145 (1.9%) |
| 35 to 64 Years | 266 (1.8%) | 542 (3.8%) |
| 65 to 74 Years | 131 (7.2%) | 41 (2.2%) |
| 75 Years and over | 226 (23.2%) | 231 (19.7%) |
Disability Class: Ambulatory Difficulty
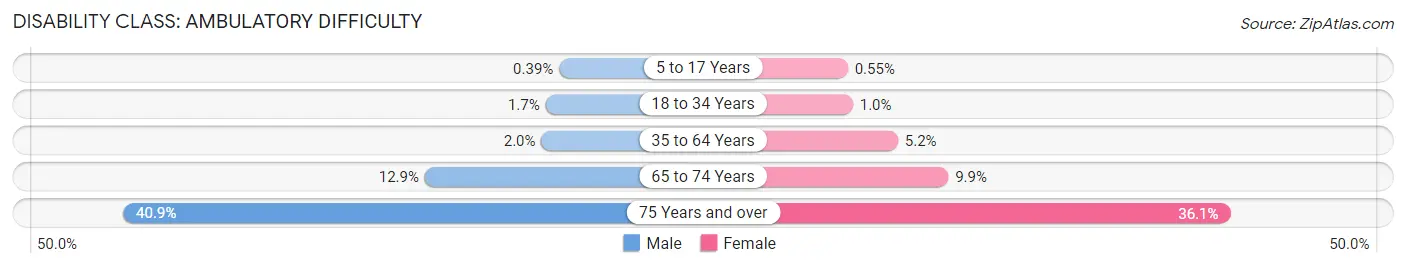
| Age Bracket | Male | Female |
| 5 to 17 Years | 28 (0.4%) | 41 (0.5%) |
| 18 to 34 Years | 125 (1.7%) | 78 (1.0%) |
| 35 to 64 Years | 294 (2.0%) | 740 (5.2%) |
| 65 to 74 Years | 235 (12.9%) | 185 (9.9%) |
| 75 Years and over | 398 (40.9%) | 423 (36.1%) |
Disability Class: Self-Care Difficulty
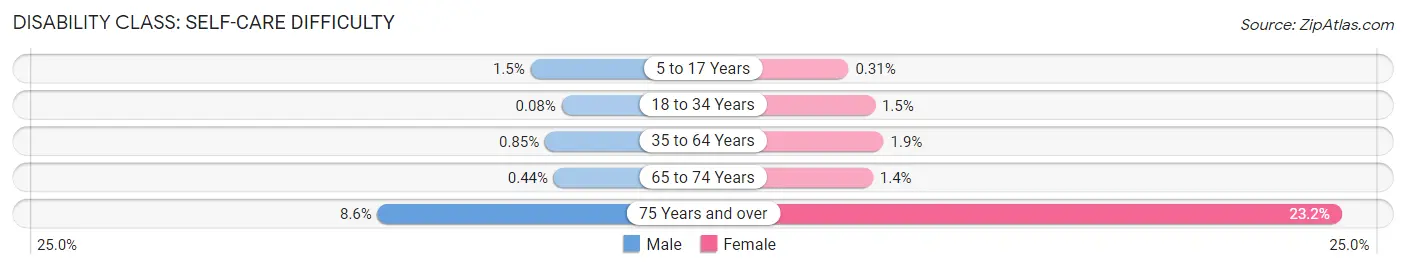
| Age Bracket | Male | Female |
| 5 to 17 Years | 109 (1.5%) | 23 (0.3%) |
| 18 to 34 Years | 6 (0.1%) | 118 (1.5%) |
| 35 to 64 Years | 122 (0.9%) | 276 (1.9%) |
| 65 to 74 Years | 8 (0.4%) | 27 (1.4%) |
| 75 Years and over | 84 (8.6%) | 272 (23.2%) |
Technology Access in Eastvale
Computing Device Access in Eastvale
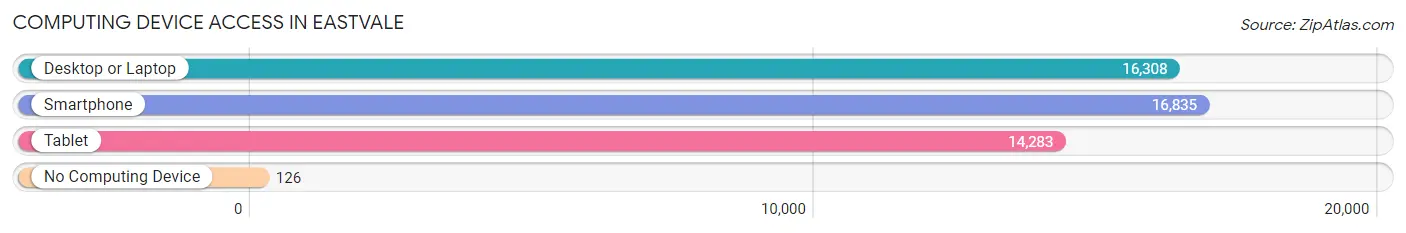
| Device Type | # Households | % Households |
| Desktop or Laptop | 16,308 | 94.5% |
| Smartphone | 16,835 | 97.6% |
| Tablet | 14,283 | 82.8% |
| No Computing Device | 126 | 0.7% |
| Total | 17,250 | 100.0% |
Internet Access in Eastvale
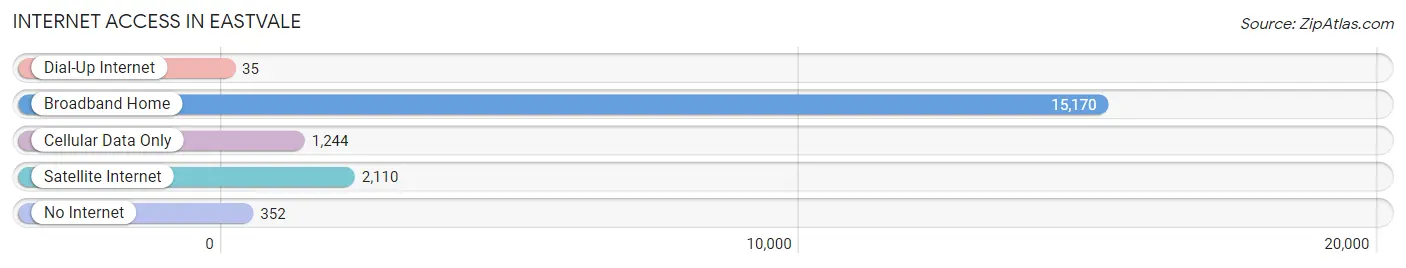
| Internet Type | # Households | % Households |
| Dial-Up Internet | 35 | 0.2% |
| Broadband Home | 15,170 | 87.9% |
| Cellular Data Only | 1,244 | 7.2% |
| Satellite Internet | 2,110 | 12.2% |
| No Internet | 352 | 2.0% |
| Total | 17,250 | 100.0% |
Eastvale Summary
History
Eastvale, California is a relatively new city located in Riverside County. It was incorporated in 2010, making it one of the youngest cities in the state. Prior to its incorporation, the area was an unincorporated community known as “Jurupa”. The area was first settled in the late 1800s by farmers and ranchers who were attracted to the fertile soil and mild climate. The area was primarily agricultural until the 1950s when the population began to grow due to the influx of people from Los Angeles and other parts of California.
The city of Eastvale was officially incorporated in 2010 after a long and contentious process. The city was formed from the merger of the communities of Jurupa, Limonite, and Pedley. The city was named after the nearby Eastvale Ranch, which was owned by the prominent Eastvale family. The city was officially incorporated on October 1, 2010, and the first mayor was Dennis Yates.
Geography
Eastvale is located in Riverside County, California, about 40 miles east of Los Angeles. The city is situated in the Santa Ana River Valley, and is bordered by the cities of Corona, Norco, and Jurupa Valley. The city covers an area of approximately 11.5 square miles, and has a population of approximately 64,000 people.
The city is located at an elevation of approximately 1,000 feet above sea level, and is surrounded by rolling hills and mountains. The climate in Eastvale is mild and temperate, with average temperatures ranging from the mid-50s in the winter to the mid-90s in the summer.
Economy
Eastvale’s economy is largely based on retail and services. The city is home to several large shopping centers, including the Eastvale Gateway Shopping Center, the Eastvale Town Center, and the Eastvale Marketplace. The city is also home to several industrial parks, which are home to a variety of businesses, including manufacturing, logistics, and distribution.
The city is also home to several corporate headquarters, including the headquarters of the clothing retailer Forever 21, the home improvement retailer Lowe’s, and the automotive parts retailer AutoZone. The city is also home to several educational institutions, including the University of California, Riverside, and California State University, San Bernardino.
Demographics
As of the 2010 census, the population of Eastvale was 64,000. The racial makeup of the city was 57.2% White, 8.2% African American, 0.7% Native American, 11.2% Asian, 0.3% Pacific Islander, and 22.3% from other races. The median household income was $76,000, and the median age was 33.
Eastvale is a diverse city, with a large Hispanic population. The city is also home to a large Asian population, with the largest ethnic groups being Chinese, Filipino, and Vietnamese. The city is also home to a large number of immigrants, with the largest immigrant groups being from Mexico, India, and the Philippines.
Common Questions
What is Per Capita Income in Eastvale?
Per Capita income in Eastvale is $43,311.
What is the Median Family Income in Eastvale?
Median Family Income in Eastvale is $153,947.
What is the Median Household income in Eastvale?
Median Household Income in Eastvale is $151,615.
What is Income or Wage Gap in Eastvale?
Income or Wage Gap in Eastvale is 29.3%.
Women in Eastvale earn 70.7 cents for every dollar earned by a man.
What is Inequality or Gini Index in Eastvale?
Inequality or Gini Index in Eastvale is 0.35.
What is the Total Population of Eastvale?
Total Population of Eastvale is 69,594.
What is the Total Male Population of Eastvale?
Total Male Population of Eastvale is 35,042.
What is the Total Female Population of Eastvale?
Total Female Population of Eastvale is 34,552.
What is the Ratio of Males per 100 Females in Eastvale?
There are 101.42 Males per 100 Females in Eastvale.
What is the Ratio of Females per 100 Males in Eastvale?
There are 98.60 Females per 100 Males in Eastvale.
What is the Median Population Age in Eastvale?
Median Population Age in Eastvale is 34.7 Years.
What is the Average Family Size in Eastvale
Average Family Size in Eastvale is 4.2 People.
What is the Average Household Size in Eastvale
Average Household Size in Eastvale is 4.0 People.
How Large is the Labor Force in Eastvale?
There are 36,889 People in the Labor Forcein in Eastvale.
What is the Percentage of People in the Labor Force in Eastvale?
70.5% of People are in the Labor Force in Eastvale.
What is the Unemployment Rate in Eastvale?
Unemployment Rate in Eastvale is 4.5%.