Fontana, CA Map & Demographics
Fontana Map
Fontana Overview
$30,351
PER CAPITA INCOME
$94,675
AVG FAMILY INCOME
$93,230
AVG HOUSEHOLD INCOME
23.4%
WAGE / INCOME GAP [ % ]
76.6¢/ $1
WAGE / INCOME GAP [ $ ]
$11,575
FAMILY INCOME DEFICIT
0.38
INEQUALITY / GINI INDEX
209,279
TOTAL POPULATION
106,346
MALE POPULATION
102,933
FEMALE POPULATION
103.32
MALES / 100 FEMALES
96.79
FEMALES / 100 MALES
32.6
MEDIAN AGE
4.0
AVG FAMILY SIZE
3.7
AVG HOUSEHOLD SIZE
106,051
LABOR FORCE [ PEOPLE ]
66.9%
PERCENT IN LABOR FORCE
6.2%
UNEMPLOYMENT RATE
Fontana Area Codes
Income in Fontana
Income Overview in Fontana
Per Capita Income in Fontana is $30,351, while median incomes of families and households are $94,675 and $93,230 respectively.
| Characteristic | Number | Measure |
| Per Capita Income | 209,279 | $30,351 |
| Median Family Income | 48,093 | $94,675 |
| Mean Family Income | 48,093 | $111,205 |
| Median Household Income | 55,856 | $93,230 |
| Mean Household Income | 55,856 | $109,881 |
| Income Deficit | 48,093 | $11,575 |
| Wage / Income Gap (%) | 209,279 | 23.36% |
| Wage / Income Gap ($) | 209,279 | 76.64¢ per $1 |
| Gini / Inequality Index | 209,279 | 0.38 |
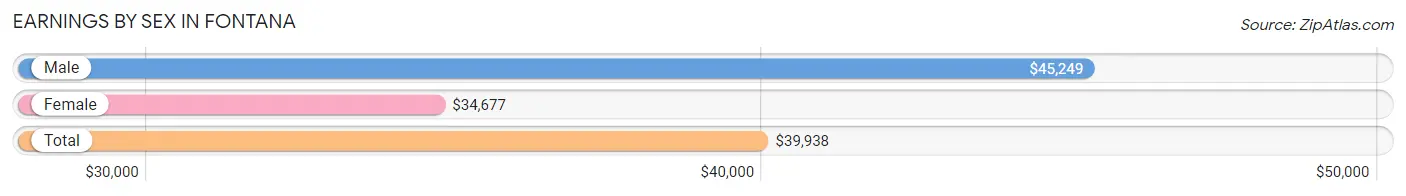
Earnings by Sex in Fontana
Average Earnings in Fontana are $39,938, $45,249 for men and $34,677 for women, a difference of 23.4%.
| Sex | Number | Average Earnings |
| Male | 60,060 (55.9%) | $45,249 |
| Female | 47,307 (44.1%) | $34,677 |
| Total | 107,367 (100.0%) | $39,938 |
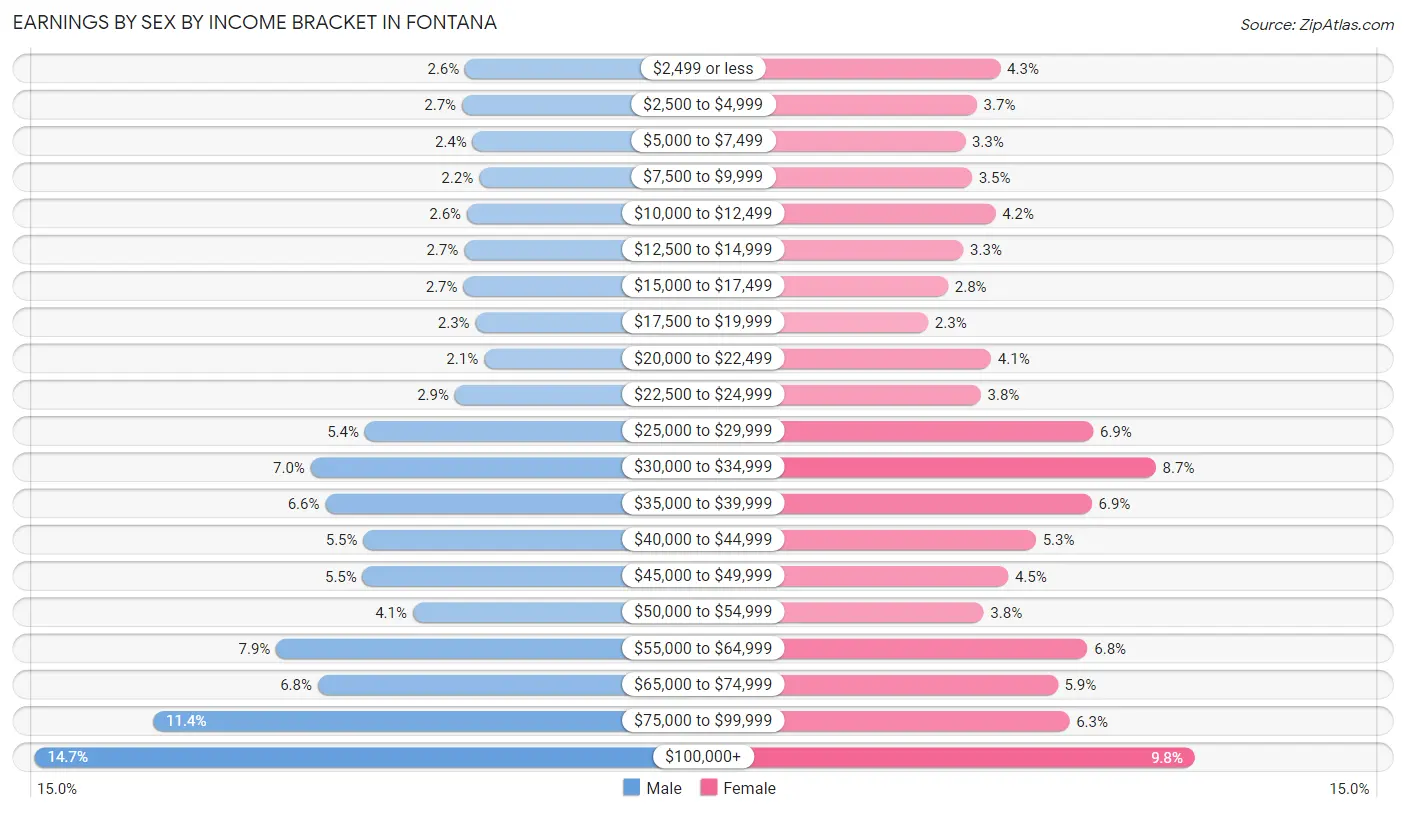
Earnings by Sex by Income Bracket in Fontana
The most common earnings brackets in Fontana are $100,000+ for men (8,841 | 14.7%) and $100,000+ for women (4,626 | 9.8%).
| Income | Male | Female |
| $2,499 or less | 1,573 (2.6%) | 2,037 (4.3%) |
| $2,500 to $4,999 | 1,626 (2.7%) | 1,725 (3.6%) |
| $5,000 to $7,499 | 1,448 (2.4%) | 1,569 (3.3%) |
| $7,500 to $9,999 | 1,337 (2.2%) | 1,660 (3.5%) |
| $10,000 to $12,499 | 1,546 (2.6%) | 1,972 (4.2%) |
| $12,500 to $14,999 | 1,591 (2.6%) | 1,546 (3.3%) |
| $15,000 to $17,499 | 1,602 (2.7%) | 1,342 (2.8%) |
| $17,500 to $19,999 | 1,402 (2.3%) | 1,077 (2.3%) |
| $20,000 to $22,499 | 1,258 (2.1%) | 1,916 (4.1%) |
| $22,500 to $24,999 | 1,746 (2.9%) | 1,777 (3.8%) |
| $25,000 to $29,999 | 3,265 (5.4%) | 3,274 (6.9%) |
| $30,000 to $34,999 | 4,179 (7.0%) | 4,105 (8.7%) |
| $35,000 to $39,999 | 3,934 (6.6%) | 3,256 (6.9%) |
| $40,000 to $44,999 | 3,292 (5.5%) | 2,512 (5.3%) |
| $45,000 to $49,999 | 3,305 (5.5%) | 2,142 (4.5%) |
| $50,000 to $54,999 | 2,454 (4.1%) | 1,815 (3.8%) |
| $55,000 to $64,999 | 4,763 (7.9%) | 3,198 (6.8%) |
| $65,000 to $74,999 | 4,060 (6.8%) | 2,799 (5.9%) |
| $75,000 to $99,999 | 6,838 (11.4%) | 2,959 (6.2%) |
| $100,000+ | 8,841 (14.7%) | 4,626 (9.8%) |
| Total | 60,060 (100.0%) | 47,307 (100.0%) |
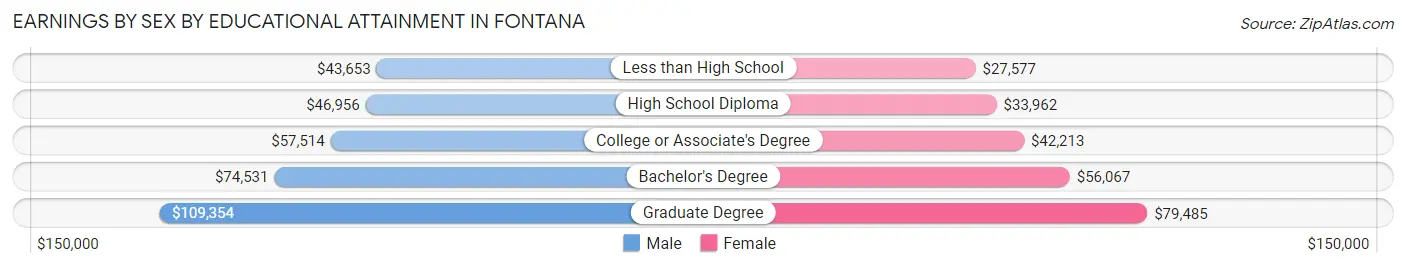
Earnings by Sex by Educational Attainment in Fontana
Average earnings in Fontana are $52,487 for men and $39,429 for women, a difference of 24.9%. Men with an educational attainment of graduate degree enjoy the highest average annual earnings of $109,354, while those with less than high school education earn the least with $43,653. Women with an educational attainment of graduate degree earn the most with the average annual earnings of $79,485, while those with less than high school education have the smallest earnings of $27,577.
| Educational Attainment | Male Income | Female Income |
| Less than High School | $43,653 | $27,577 |
| High School Diploma | $46,956 | $33,962 |
| College or Associate's Degree | $57,514 | $42,213 |
| Bachelor's Degree | $74,531 | $56,067 |
| Graduate Degree | $109,354 | $79,485 |
| Total | $52,487 | $39,429 |
Family Income in Fontana
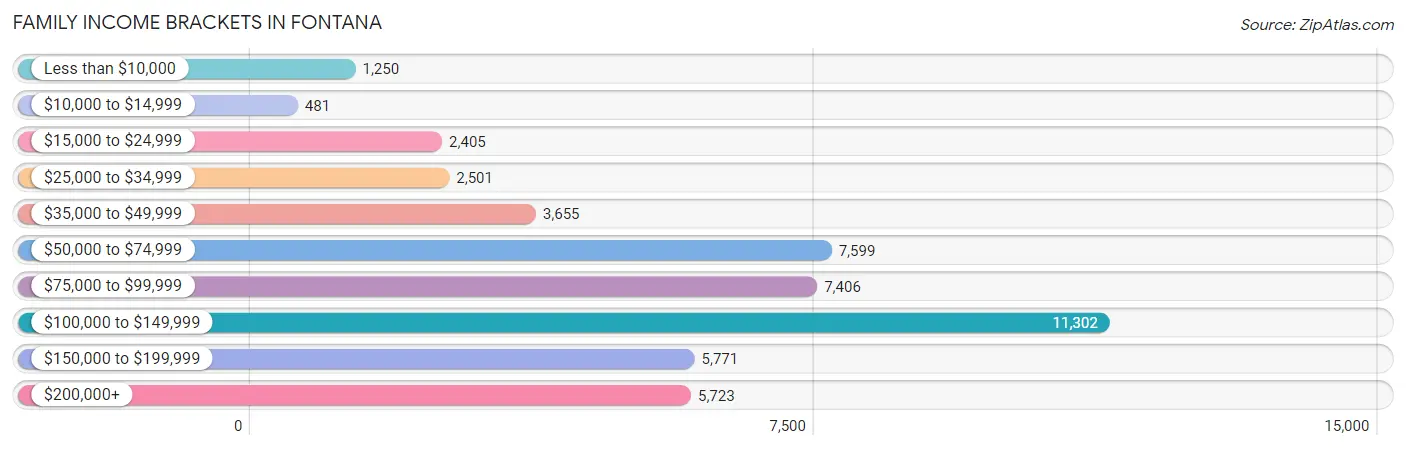
Family Income Brackets in Fontana
According to the Fontana family income data, there are 11,302 families falling into the $100,000 to $149,999 income range, which is the most common income bracket and makes up 23.5% of all families. Conversely, the $10,000 to $14,999 income bracket is the least frequent group with only 481 families (1.0%) belonging to this category.
| Income Bracket | # Families | % Families |
| Less than $10,000 | 1,250 | 2.6% |
| $10,000 to $14,999 | 481 | 1.0% |
| $15,000 to $24,999 | 2,405 | 5.0% |
| $25,000 to $34,999 | 2,501 | 5.2% |
| $35,000 to $49,999 | 3,655 | 7.6% |
| $50,000 to $74,999 | 7,599 | 15.8% |
| $75,000 to $99,999 | 7,406 | 15.4% |
| $100,000 to $149,999 | 11,302 | 23.5% |
| $150,000 to $199,999 | 5,771 | 12.0% |
| $200,000+ | 5,723 | 11.9% |
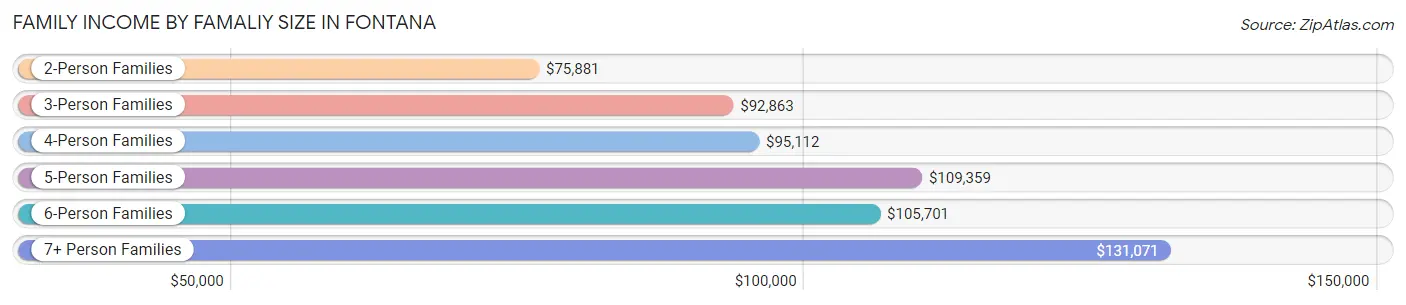
Family Income by Famaliy Size in Fontana
7+ person families (2,076 | 4.3%) account for the highest median family income in Fontana with $131,071 per family, while 2-person families (11,490 | 23.9%) have the highest median income of $37,940 per family member.
| Income Bracket | # Families | Median Income |
| 2-Person Families | 11,490 (23.9%) | $75,881 |
| 3-Person Families | 10,474 (21.8%) | $92,863 |
| 4-Person Families | 12,134 (25.2%) | $95,112 |
| 5-Person Families | 8,110 (16.9%) | $109,359 |
| 6-Person Families | 3,809 (7.9%) | $105,701 |
| 7+ Person Families | 2,076 (4.3%) | $131,071 |
| Total | 48,093 (100.0%) | $94,675 |
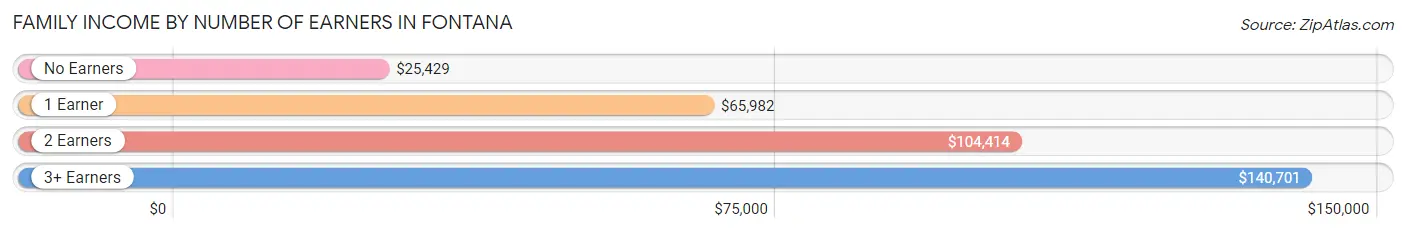
Family Income by Number of Earners in Fontana
The median family income in Fontana is $94,675, with families comprising 3+ earners (11,480) having the highest median family income of $140,701, while families with no earners (4,038) have the lowest median family income of $25,429, accounting for 23.9% and 8.4% of families, respectively.
| Number of Earners | # Families | Median Income |
| No Earners | 4,038 (8.4%) | $25,429 |
| 1 Earner | 13,761 (28.6%) | $65,982 |
| 2 Earners | 18,814 (39.1%) | $104,414 |
| 3+ Earners | 11,480 (23.9%) | $140,701 |
| Total | 48,093 (100.0%) | $94,675 |
Household Income in Fontana
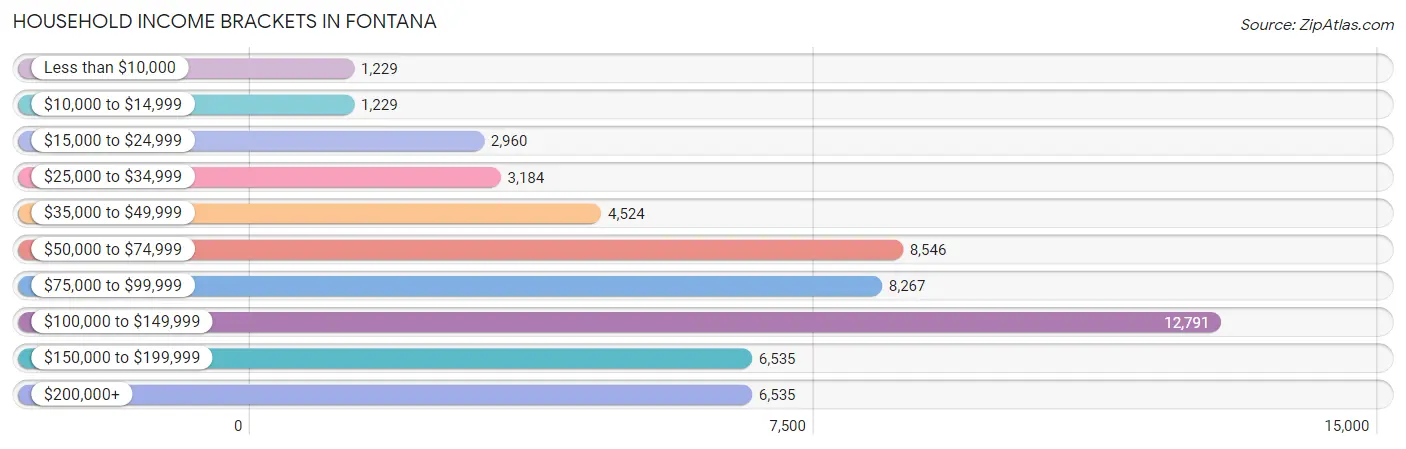
Household Income Brackets in Fontana
With 12,791 households falling in the category, the $100,000 to $149,999 income range is the most frequent in Fontana, accounting for 22.9% of all households. In contrast, only 1,229 households (2.2%) fall into the less than $10,000 income bracket, making it the least populous group.
| Income Bracket | # Households | % Households |
| Less than $10,000 | 1,229 | 2.2% |
| $10,000 to $14,999 | 1,229 | 2.2% |
| $15,000 to $24,999 | 2,960 | 5.3% |
| $25,000 to $34,999 | 3,184 | 5.7% |
| $35,000 to $49,999 | 4,524 | 8.1% |
| $50,000 to $74,999 | 8,546 | 15.3% |
| $75,000 to $99,999 | 8,267 | 14.8% |
| $100,000 to $149,999 | 12,791 | 22.9% |
| $150,000 to $199,999 | 6,535 | 11.7% |
| $200,000+ | 6,535 | 11.7% |
Household Income by Householder Age in Fontana
The median household income in Fontana is $93,230, with the highest median household income of $102,084 found in the 45 to 64 years age bracket for the primary householder. A total of 24,037 households (43.0%) fall into this category. Meanwhile, the 15 to 24 years age bracket for the primary householder has the lowest median household income of $60,948, with 908 households (1.6%) in this group.
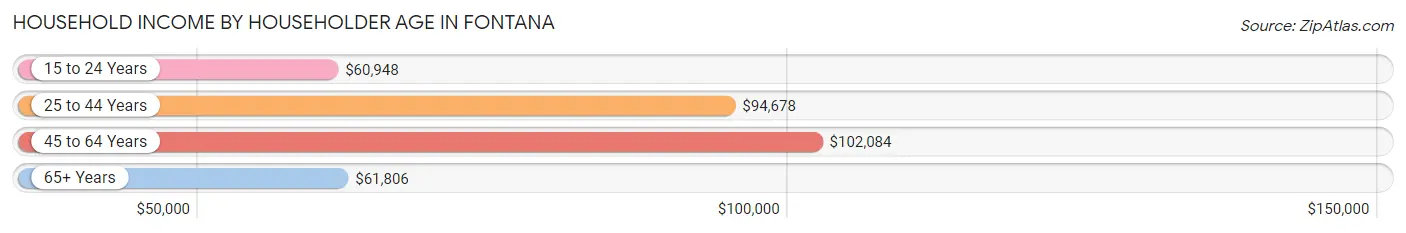
| Income Bracket | # Households | Median Income |
| 15 to 24 Years | 908 (1.6%) | $60,948 |
| 25 to 44 Years | 22,136 (39.6%) | $94,678 |
| 45 to 64 Years | 24,037 (43.0%) | $102,084 |
| 65+ Years | 8,775 (15.7%) | $61,806 |
| Total | 55,856 (100.0%) | $93,230 |
Poverty in Fontana
Income Below Poverty by Sex and Age in Fontana
With 9.8% poverty level for males and 11.3% for females among the residents of Fontana, under 5 year old males and 16 and 17 year old females are the most vulnerable to poverty, with 1,467 males (20.7%) and 637 females (18.0%) in their respective age groups living below the poverty level.
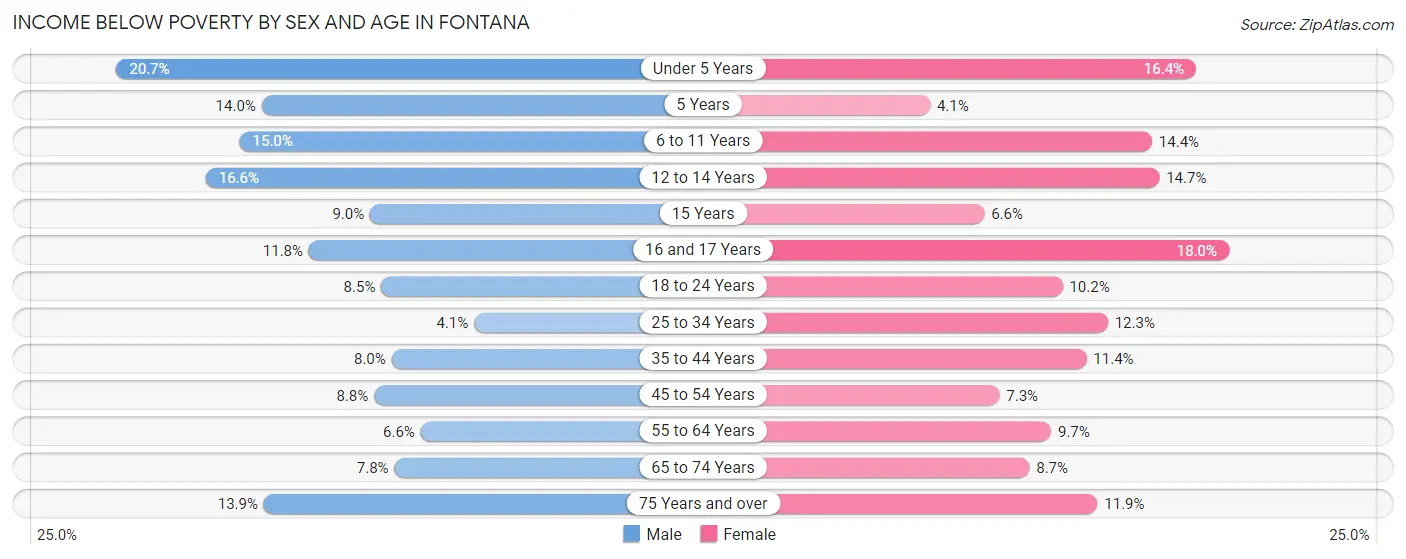
| Age Bracket | Male | Female |
| Under 5 Years | 1,467 (20.7%) | 943 (16.4%) |
| 5 Years | 159 (14.0%) | 50 (4.1%) |
| 6 to 11 Years | 1,584 (15.0%) | 1,337 (14.4%) |
| 12 to 14 Years | 874 (16.6%) | 803 (14.7%) |
| 15 Years | 189 (9.0%) | 136 (6.6%) |
| 16 and 17 Years | 492 (11.8%) | 637 (18.0%) |
| 18 to 24 Years | 1,036 (8.5%) | 1,085 (10.2%) |
| 25 to 34 Years | 672 (4.1%) | 1,735 (12.3%) |
| 35 to 44 Years | 1,203 (8.0%) | 1,799 (11.4%) |
| 45 to 54 Years | 1,231 (8.8%) | 1,037 (7.3%) |
| 55 to 64 Years | 636 (6.6%) | 1,005 (9.7%) |
| 65 to 74 Years | 468 (7.8%) | 548 (8.7%) |
| 75 Years and over | 311 (13.9%) | 455 (11.9%) |
| Total | 10,322 (9.8%) | 11,570 (11.3%) |
Income Above Poverty by Sex and Age in Fontana
According to the poverty statistics in Fontana, males aged 25 to 34 years and females aged 5 years are the age groups that are most secure financially, with 95.9% of males and 95.9% of females in these age groups living above the poverty line.
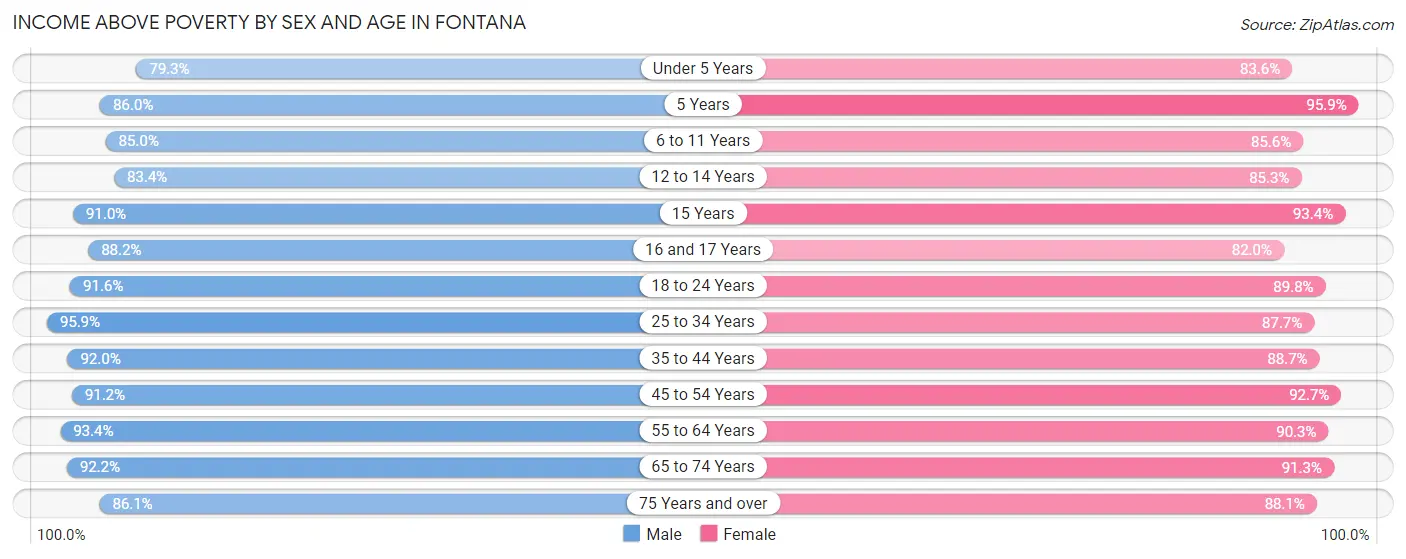
| Age Bracket | Male | Female |
| Under 5 Years | 5,607 (79.3%) | 4,796 (83.6%) |
| 5 Years | 977 (86.0%) | 1,172 (95.9%) |
| 6 to 11 Years | 8,962 (85.0%) | 7,957 (85.6%) |
| 12 to 14 Years | 4,395 (83.4%) | 4,647 (85.3%) |
| 15 Years | 1,917 (91.0%) | 1,922 (93.4%) |
| 16 and 17 Years | 3,673 (88.2%) | 2,910 (82.0%) |
| 18 to 24 Years | 11,220 (91.5%) | 9,509 (89.8%) |
| 25 to 34 Years | 15,559 (95.9%) | 12,328 (87.7%) |
| 35 to 44 Years | 13,884 (92.0%) | 14,051 (88.6%) |
| 45 to 54 Years | 12,791 (91.2%) | 13,152 (92.7%) |
| 55 to 64 Years | 8,968 (93.4%) | 9,345 (90.3%) |
| 65 to 74 Years | 5,504 (92.2%) | 5,752 (91.3%) |
| 75 Years and over | 1,926 (86.1%) | 3,381 (88.1%) |
| Total | 95,383 (90.2%) | 90,922 (88.7%) |
Income Below Poverty Among Married-Couple Families in Fontana
The poverty statistics for married-couple families in Fontana show that 6.2% or 2,062 of the total 33,309 families live below the poverty line. Families with 5 or more children have the highest poverty rate of 24.0%, comprising of 105 families. On the other hand, families with no children have the lowest poverty rate of 4.4%, which includes 573 families.
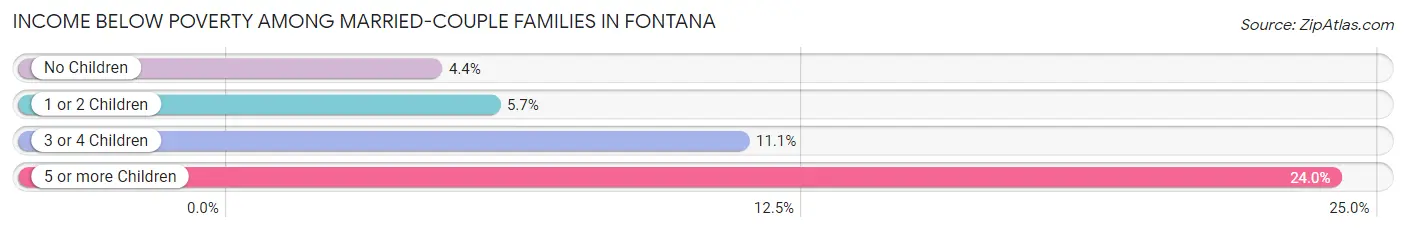
| Children | Above Poverty | Below Poverty |
| No Children | 12,329 (95.6%) | 573 (4.4%) |
| 1 or 2 Children | 14,565 (94.3%) | 881 (5.7%) |
| 3 or 4 Children | 4,021 (88.9%) | 503 (11.1%) |
| 5 or more Children | 332 (76.0%) | 105 (24.0%) |
| Total | 31,247 (93.8%) | 2,062 (6.2%) |
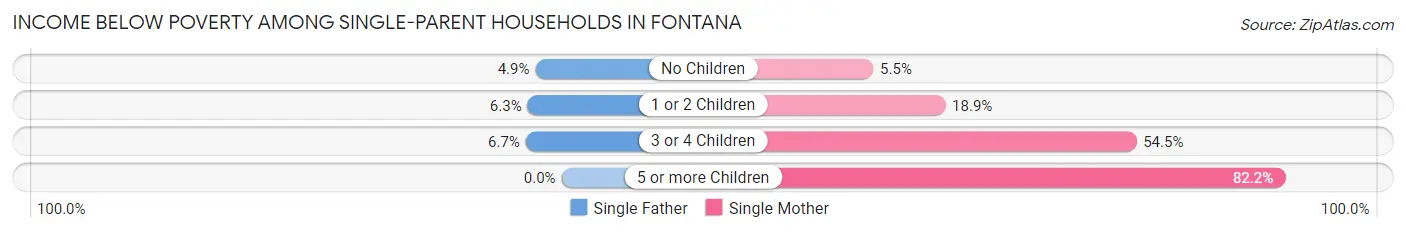
Income Below Poverty Among Single-Parent Households in Fontana
According to the poverty data in Fontana, 5.6% or 260 single-father households and 19.6% or 1,983 single-mother households are living below the poverty line. Among single-father households, those with 3 or 4 children have the highest poverty rate, with 31 households (6.7%) experiencing poverty. Likewise, among single-mother households, those with 5 or more children have the highest poverty rate, with 60 households (82.2%) falling below the poverty line.
| Children | Single Father | Single Mother |
| No Children | 117 (4.9%) | 222 (5.5%) |
| 1 or 2 Children | 112 (6.3%) | 833 (18.9%) |
| 3 or 4 Children | 31 (6.7%) | 868 (54.5%) |
| 5 or more Children | 0 (0.0%) | 60 (82.2%) |
| Total | 260 (5.6%) | 1,983 (19.6%) |
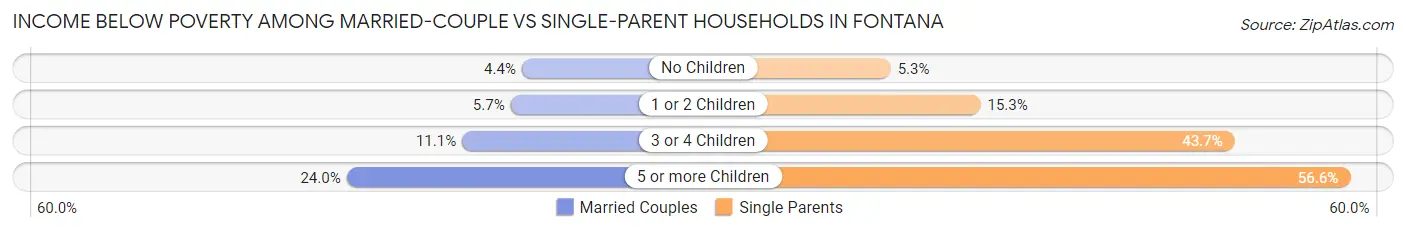
Income Below Poverty Among Married-Couple vs Single-Parent Households in Fontana
The poverty data for Fontana shows that 2,062 of the married-couple family households (6.2%) and 2,243 of the single-parent households (15.2%) are living below the poverty level. Within the married-couple family households, those with 5 or more children have the highest poverty rate, with 105 households (24.0%) falling below the poverty line. Among the single-parent households, those with 5 or more children have the highest poverty rate, with 60 household (56.6%) living below poverty.
| Children | Married-Couple Families | Single-Parent Households |
| No Children | 573 (4.4%) | 339 (5.3%) |
| 1 or 2 Children | 881 (5.7%) | 945 (15.3%) |
| 3 or 4 Children | 503 (11.1%) | 899 (43.7%) |
| 5 or more Children | 105 (24.0%) | 60 (56.6%) |
| Total | 2,062 (6.2%) | 2,243 (15.2%) |
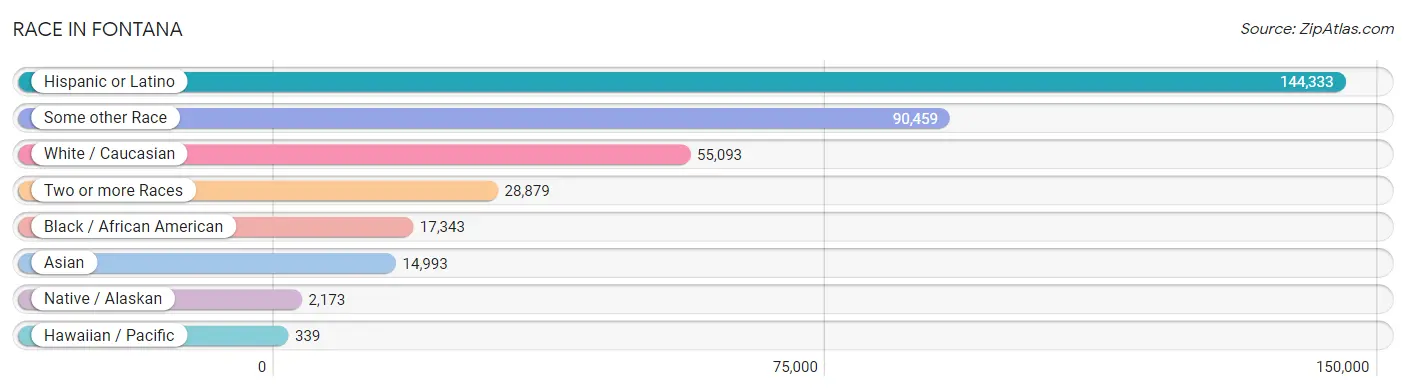
Race in Fontana
The most populous races in Fontana are Hispanic or Latino (144,333 | 69.0%), Some other Race (90,459 | 43.2%), and White / Caucasian (55,093 | 26.3%).
| Race | # Population | % Population |
| Asian | 14,993 | 7.2% |
| Black / African American | 17,343 | 8.3% |
| Hawaiian / Pacific | 339 | 0.2% |
| Hispanic or Latino | 144,333 | 69.0% |
| Native / Alaskan | 2,173 | 1.0% |
| White / Caucasian | 55,093 | 26.3% |
| Two or more Races | 28,879 | 13.8% |
| Some other Race | 90,459 | 43.2% |
| Total | 209,279 | 100.0% |
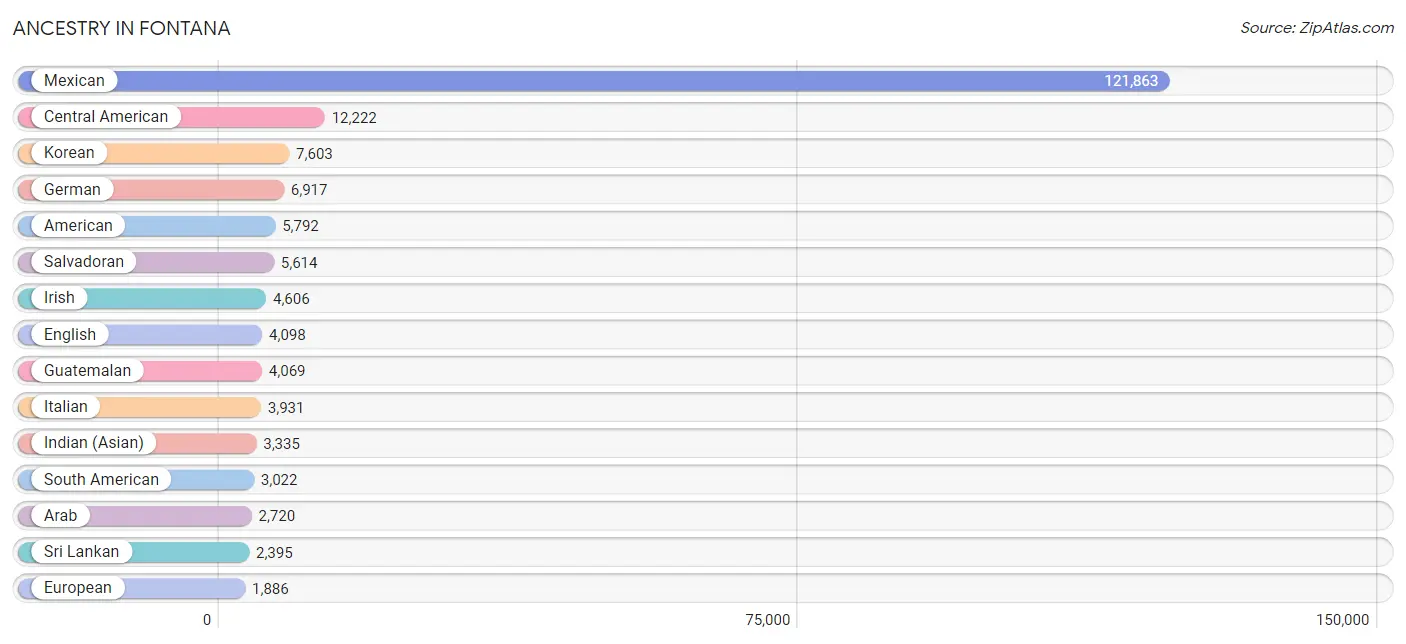
Ancestry in Fontana
The most populous ancestries reported in Fontana are Mexican (121,863 | 58.2%), Central American (12,222 | 5.8%), Korean (7,603 | 3.6%), German (6,917 | 3.3%), and American (5,792 | 2.8%), together accounting for 73.8% of all Fontana residents.
| Ancestry | # Population | % Population |
| Afghan | 100 | 0.1% |
| African | 560 | 0.3% |
| American | 5,792 | 2.8% |
| Apache | 74 | 0.0% |
| Arab | 2,720 | 1.3% |
| Argentinean | 731 | 0.4% |
| Armenian | 460 | 0.2% |
| Australian | 28 | 0.0% |
| Austrian | 150 | 0.1% |
| Bahamian | 97 | 0.1% |
| Basque | 26 | 0.0% |
| Belgian | 127 | 0.1% |
| Belizean | 299 | 0.1% |
| Bhutanese | 695 | 0.3% |
| Blackfeet | 326 | 0.2% |
| Bolivian | 275 | 0.1% |
| Brazilian | 204 | 0.1% |
| British | 224 | 0.1% |
| Burmese | 653 | 0.3% |
| Canadian | 84 | 0.0% |
| Cape Verdean | 201 | 0.1% |
| Central American | 12,222 | 5.8% |
| Central American Indian | 707 | 0.3% |
| Cherokee | 242 | 0.1% |
| Cheyenne | 30 | 0.0% |
| Chilean | 105 | 0.1% |
| Chippewa | 42 | 0.0% |
| Choctaw | 79 | 0.0% |
| Colombian | 433 | 0.2% |
| Comanche | 3 | 0.0% |
| Costa Rican | 293 | 0.1% |
| Creek | 14 | 0.0% |
| Croatian | 24 | 0.0% |
| Cuban | 468 | 0.2% |
| Czech | 36 | 0.0% |
| Danish | 153 | 0.1% |
| Dominican | 70 | 0.0% |
| Dutch | 1,729 | 0.8% |
| Eastern European | 11 | 0.0% |
| Ecuadorian | 695 | 0.3% |
| Egyptian | 690 | 0.3% |
| English | 4,098 | 2.0% |
| Ethiopian | 99 | 0.1% |
| European | 1,886 | 0.9% |
| Filipino | 252 | 0.1% |
| Finnish | 78 | 0.0% |
| French | 1,328 | 0.6% |
| French American Indian | 51 | 0.0% |
| French Canadian | 228 | 0.1% |
| German | 6,917 | 3.3% |
| Ghanaian | 38 | 0.0% |
| Greek | 202 | 0.1% |
| Guamanian / Chamorro | 149 | 0.1% |
| Guatemalan | 4,069 | 1.9% |
| Guyanese | 11 | 0.0% |
| Haitian | 65 | 0.0% |
| Honduran | 1,327 | 0.6% |
| Hungarian | 103 | 0.1% |
| Icelander | 55 | 0.0% |
| Indian (Asian) | 3,335 | 1.6% |
| Indonesian | 34 | 0.0% |
| Iranian | 125 | 0.1% |
| Iraqi | 83 | 0.0% |
| Irish | 4,606 | 2.2% |
| Italian | 3,931 | 1.9% |
| Jamaican | 312 | 0.2% |
| Japanese | 443 | 0.2% |
| Jordanian | 116 | 0.1% |
| Kenyan | 98 | 0.1% |
| Kiowa | 14 | 0.0% |
| Korean | 7,603 | 3.6% |
| Laotian | 1,059 | 0.5% |
| Latvian | 13 | 0.0% |
| Lebanese | 296 | 0.1% |
| Lithuanian | 46 | 0.0% |
| Luxembourger | 1 | 0.0% |
| Malaysian | 64 | 0.0% |
| Mexican | 121,863 | 58.2% |
| Mexican American Indian | 833 | 0.4% |
| Mongolian | 5 | 0.0% |
| Moroccan | 118 | 0.1% |
| Native Hawaiian | 125 | 0.1% |
| Navajo | 173 | 0.1% |
| Nepalese | 20 | 0.0% |
| Nicaraguan | 919 | 0.4% |
| Nigerian | 521 | 0.3% |
| Northern European | 7 | 0.0% |
| Norwegian | 970 | 0.5% |
| Paiute | 87 | 0.0% |
| Pakistani | 178 | 0.1% |
| Palestinian | 177 | 0.1% |
| Pennsylvania German | 4 | 0.0% |
| Peruvian | 705 | 0.3% |
| Polish | 501 | 0.2% |
| Portuguese | 795 | 0.4% |
| Potawatomi | 16 | 0.0% |
| Pueblo | 69 | 0.0% |
| Puerto Rican | 1,245 | 0.6% |
| Russian | 146 | 0.1% |
| Salvadoran | 5,614 | 2.7% |
| Samoan | 63 | 0.0% |
| Scandinavian | 120 | 0.1% |
| Scotch-Irish | 352 | 0.2% |
| Scottish | 536 | 0.3% |
| Seminole | 2 | 0.0% |
| Serbian | 39 | 0.0% |
| Sioux | 51 | 0.0% |
| Slovak | 95 | 0.1% |
| Slovene | 25 | 0.0% |
| South American | 3,022 | 1.4% |
| Spaniard | 907 | 0.4% |
| Spanish | 630 | 0.3% |
| Spanish American | 5 | 0.0% |
| Sri Lankan | 2,395 | 1.1% |
| Subsaharan African | 1,607 | 0.8% |
| Swedish | 449 | 0.2% |
| Swiss | 98 | 0.1% |
| Syrian | 762 | 0.4% |
| Thai | 841 | 0.4% |
| Tongan | 17 | 0.0% |
| Turkish | 13 | 0.0% |
| Ugandan | 18 | 0.0% |
| Ukrainian | 161 | 0.1% |
| Venezuelan | 56 | 0.0% |
| Vietnamese | 13 | 0.0% |
| Welsh | 252 | 0.1% |
| West Indian | 25 | 0.0% |
| Yaqui | 173 | 0.1% |
| Yugoslavian | 29 | 0.0% | View All 129 Rows |
Immigrants in Fontana
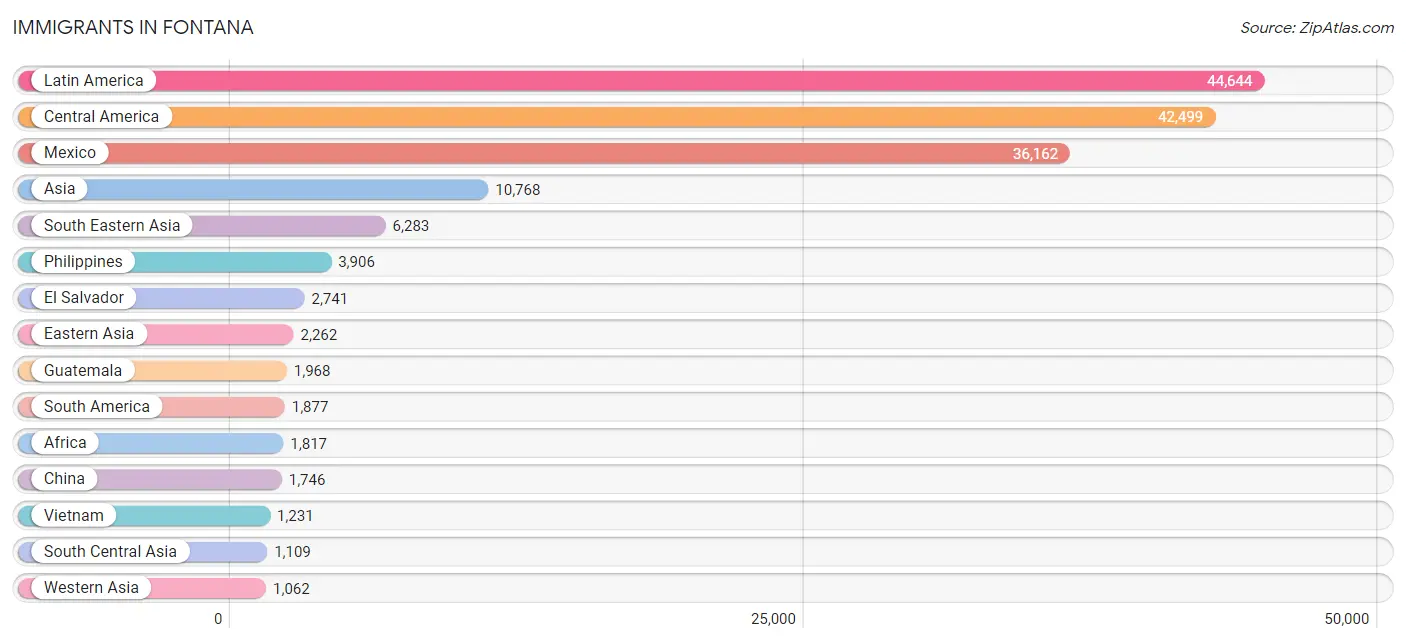
The most numerous immigrant groups reported in Fontana came from Latin America (44,644 | 21.3%), Central America (42,499 | 20.3%), Mexico (36,162 | 17.3%), Asia (10,768 | 5.1%), and South Eastern Asia (6,283 | 3.0%), together accounting for 67.1% of all Fontana residents.
| Immigration Origin | # Population | % Population |
| Afghanistan | 30 | 0.0% |
| Africa | 1,817 | 0.9% |
| Argentina | 391 | 0.2% |
| Asia | 10,768 | 5.1% |
| Australia | 9 | 0.0% |
| Austria | 8 | 0.0% |
| Bahamas | 45 | 0.0% |
| Bangladesh | 28 | 0.0% |
| Belize | 50 | 0.0% |
| Bolivia | 38 | 0.0% |
| Brazil | 160 | 0.1% |
| Cabo Verde | 47 | 0.0% |
| Cambodia | 169 | 0.1% |
| Cameroon | 68 | 0.0% |
| Canada | 57 | 0.0% |
| Caribbean | 268 | 0.1% |
| Central America | 42,499 | 20.3% |
| Chile | 8 | 0.0% |
| China | 1,746 | 0.8% |
| Colombia | 290 | 0.1% |
| Costa Rica | 96 | 0.1% |
| Cuba | 52 | 0.0% |
| Czechoslovakia | 13 | 0.0% |
| Dominican Republic | 20 | 0.0% |
| Eastern Africa | 191 | 0.1% |
| Eastern Asia | 2,262 | 1.1% |
| Eastern Europe | 138 | 0.1% |
| Ecuador | 490 | 0.2% |
| Egypt | 724 | 0.4% |
| El Salvador | 2,741 | 1.3% |
| England | 54 | 0.0% |
| Eritrea | 99 | 0.1% |
| Europe | 538 | 0.3% |
| Fiji | 20 | 0.0% |
| France | 53 | 0.0% |
| Germany | 79 | 0.0% |
| Ghana | 142 | 0.1% |
| Guatemala | 1,968 | 0.9% |
| Guyana | 6 | 0.0% |
| Haiti | 32 | 0.0% |
| Honduras | 787 | 0.4% |
| Hong Kong | 210 | 0.1% |
| India | 639 | 0.3% |
| Indonesia | 723 | 0.4% |
| Iran | 47 | 0.0% |
| Iraq | 16 | 0.0% |
| Ireland | 7 | 0.0% |
| Israel | 50 | 0.0% |
| Italy | 17 | 0.0% |
| Jamaica | 119 | 0.1% |
| Japan | 164 | 0.1% |
| Jordan | 242 | 0.1% |
| Kazakhstan | 5 | 0.0% |
| Kenya | 44 | 0.0% |
| Korea | 352 | 0.2% |
| Kuwait | 115 | 0.1% |
| Laos | 42 | 0.0% |
| Latin America | 44,644 | 21.3% |
| Lebanon | 88 | 0.0% |
| Malaysia | 5 | 0.0% |
| Mexico | 36,162 | 17.3% |
| Middle Africa | 68 | 0.0% |
| Morocco | 84 | 0.0% |
| Netherlands | 73 | 0.0% |
| Nicaragua | 639 | 0.3% |
| Nigeria | 382 | 0.2% |
| Northern Africa | 808 | 0.4% |
| Northern Europe | 82 | 0.0% |
| Oceania | 29 | 0.0% |
| Pakistan | 345 | 0.2% |
| Panama | 56 | 0.0% |
| Peru | 434 | 0.2% |
| Philippines | 3,906 | 1.9% |
| Poland | 17 | 0.0% |
| Portugal | 28 | 0.0% |
| Romania | 9 | 0.0% |
| Russia | 76 | 0.0% |
| Sierra Leone | 20 | 0.0% |
| Singapore | 20 | 0.0% |
| South America | 1,877 | 0.9% |
| South Central Asia | 1,109 | 0.5% |
| South Eastern Asia | 6,283 | 3.0% |
| Southern Europe | 50 | 0.0% |
| Spain | 5 | 0.0% |
| Sri Lanka | 15 | 0.0% |
| Switzerland | 17 | 0.0% |
| Syria | 536 | 0.3% |
| Taiwan | 285 | 0.1% |
| Thailand | 149 | 0.1% |
| Uganda | 35 | 0.0% |
| Ukraine | 4 | 0.0% |
| Venezuela | 24 | 0.0% |
| Vietnam | 1,231 | 0.6% |
| Western Africa | 591 | 0.3% |
| Western Asia | 1,062 | 0.5% |
| Western Europe | 230 | 0.1% | View All 96 Rows |
Sex and Age in Fontana
Sex and Age in Fontana
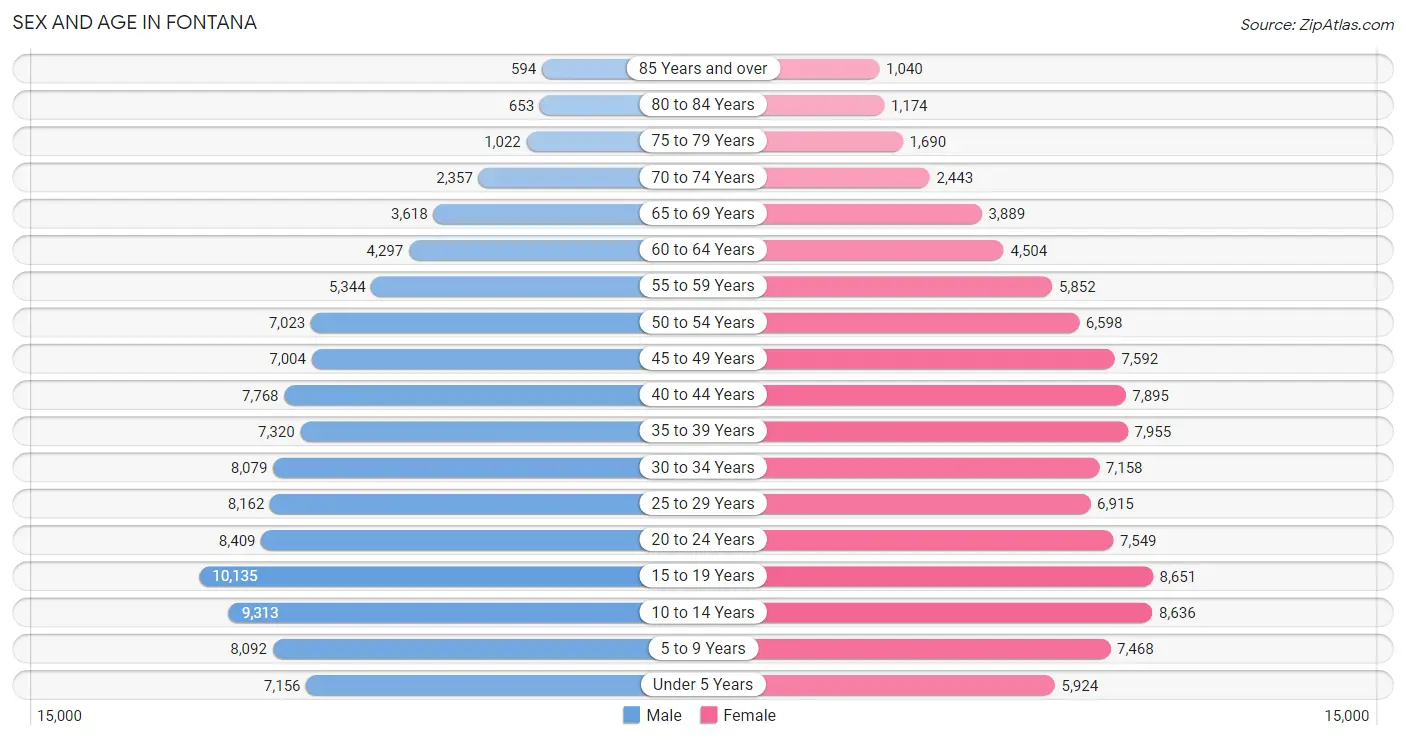
The most populous age groups in Fontana are 15 to 19 Years (10,135 | 9.5%) for men and 15 to 19 Years (8,651 | 8.4%) for women.
| Age Bracket | Male | Female |
| Under 5 Years | 7,156 (6.7%) | 5,924 (5.8%) |
| 5 to 9 Years | 8,092 (7.6%) | 7,468 (7.3%) |
| 10 to 14 Years | 9,313 (8.8%) | 8,636 (8.4%) |
| 15 to 19 Years | 10,135 (9.5%) | 8,651 (8.4%) |
| 20 to 24 Years | 8,409 (7.9%) | 7,549 (7.3%) |
| 25 to 29 Years | 8,162 (7.7%) | 6,915 (6.7%) |
| 30 to 34 Years | 8,079 (7.6%) | 7,158 (7.0%) |
| 35 to 39 Years | 7,320 (6.9%) | 7,955 (7.7%) |
| 40 to 44 Years | 7,768 (7.3%) | 7,895 (7.7%) |
| 45 to 49 Years | 7,004 (6.6%) | 7,592 (7.4%) |
| 50 to 54 Years | 7,023 (6.6%) | 6,598 (6.4%) |
| 55 to 59 Years | 5,344 (5.0%) | 5,852 (5.7%) |
| 60 to 64 Years | 4,297 (4.0%) | 4,504 (4.4%) |
| 65 to 69 Years | 3,618 (3.4%) | 3,889 (3.8%) |
| 70 to 74 Years | 2,357 (2.2%) | 2,443 (2.4%) |
| 75 to 79 Years | 1,022 (1.0%) | 1,690 (1.6%) |
| 80 to 84 Years | 653 (0.6%) | 1,174 (1.1%) |
| 85 Years and over | 594 (0.6%) | 1,040 (1.0%) |
| Total | 106,346 (100.0%) | 102,933 (100.0%) |
Families and Households in Fontana
Median Family Size in Fontana
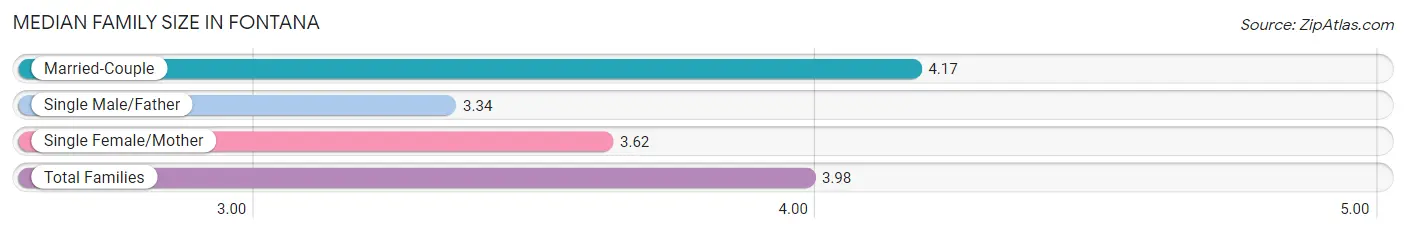
The median family size in Fontana is 3.98 persons per family, with married-couple families (33,309 | 69.3%) accounting for the largest median family size of 4.17 persons per family. On the other hand, single male/father families (4,663 | 9.7%) represent the smallest median family size with 3.34 persons per family.
| Family Type | # Families | Family Size |
| Married-Couple | 33,309 (69.3%) | 4.17 |
| Single Male/Father | 4,663 (9.7%) | 3.34 |
| Single Female/Mother | 10,121 (21.0%) | 3.62 |
| Total Families | 48,093 (100.0%) | 3.98 |
Median Household Size in Fontana
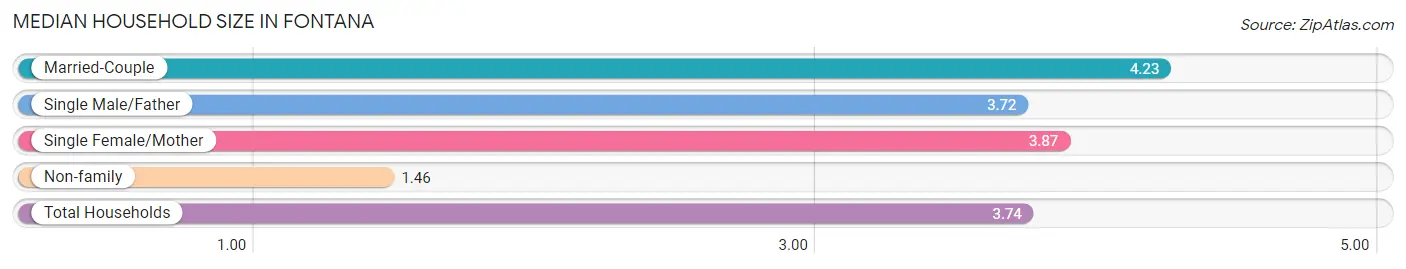
The median household size in Fontana is 3.74 persons per household, with married-couple households (33,309 | 59.6%) accounting for the largest median household size of 4.23 persons per household. non-family households (7,763 | 13.9%) represent the smallest median household size with 1.46 persons per household.
| Household Type | # Households | Household Size |
| Married-Couple | 33,309 (59.6%) | 4.23 |
| Single Male/Father | 4,663 (8.4%) | 3.72 |
| Single Female/Mother | 10,121 (18.1%) | 3.87 |
| Non-family | 7,763 (13.9%) | 1.46 |
| Total Households | 55,856 (100.0%) | 3.74 |
Household Size by Marriage Status in Fontana
Out of a total of 55,856 households in Fontana, 48,093 (86.1%) are family households, while 7,763 (13.9%) are nonfamily households. The most numerous type of family households are 4-person households, comprising 12,254, and the most common type of nonfamily households are 1-person households, comprising 5,814.
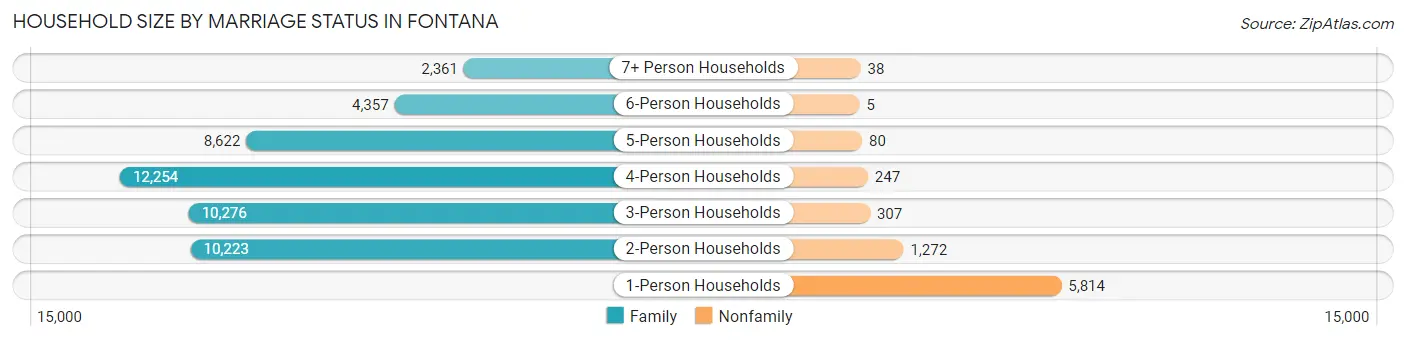
| Household Size | Family Households | Nonfamily Households |
| 1-Person Households | - | 5,814 (10.4%) |
| 2-Person Households | 10,223 (18.3%) | 1,272 (2.3%) |
| 3-Person Households | 10,276 (18.4%) | 307 (0.5%) |
| 4-Person Households | 12,254 (21.9%) | 247 (0.4%) |
| 5-Person Households | 8,622 (15.4%) | 80 (0.1%) |
| 6-Person Households | 4,357 (7.8%) | 5 (0.0%) |
| 7+ Person Households | 2,361 (4.2%) | 38 (0.1%) |
| Total | 48,093 (86.1%) | 7,763 (13.9%) |
Female Fertility in Fontana
Fertility by Age in Fontana
Average fertility rate in Fontana is 54.0 births per 1,000 women. Women in the age bracket of 20 to 34 years have the highest fertility rate with 95.0 births per 1,000 women. Women in the age bracket of 20 to 34 years acount for 68.5% of all women with births.
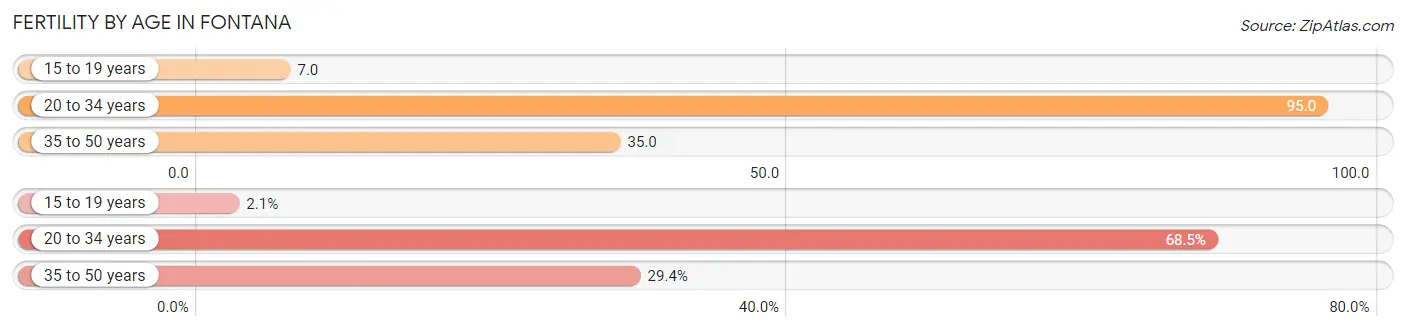
| Age Bracket | Women with Births | Births / 1,000 Women |
| 15 to 19 years | 64 (2.1%) | 7.0 |
| 20 to 34 years | 2,063 (68.5%) | 95.0 |
| 35 to 50 years | 884 (29.4%) | 35.0 |
| Total | 3,011 (100.0%) | 54.0 |
Fertility by Age by Marriage Status in Fontana
65.2% of women with births (3,011) in Fontana are married. The highest percentage of unmarried women with births falls into 15 to 19 years age bracket with 71.9% of them unmarried at the time of birth, while the lowest percentage of unmarried women with births belong to 35 to 50 years age bracket with 12.7% of them unmarried.
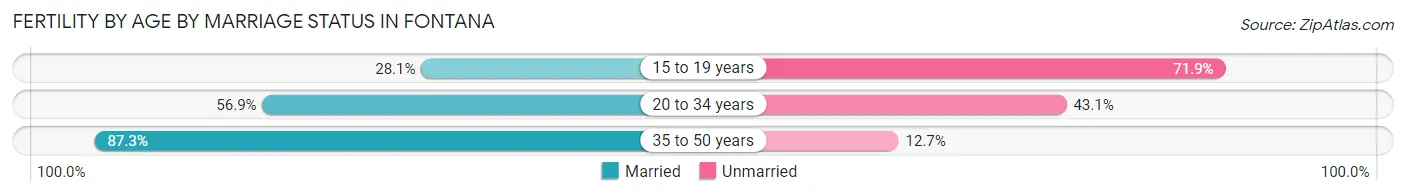
| Age Bracket | Married | Unmarried |
| 15 to 19 years | 18 (28.1%) | 46 (71.9%) |
| 20 to 34 years | 1,174 (56.9%) | 889 (43.1%) |
| 35 to 50 years | 772 (87.3%) | 112 (12.7%) |
| Total | 1,963 (65.2%) | 1,048 (34.8%) |
Fertility by Education in Fontana
Average fertility rate in Fontana is 54.0 births per 1,000 women. Women with the education attainment of college or associate's degree have the highest fertility rate of 74.0 births per 1,000 women, while women with the education attainment of less than high school have the lowest fertility at 20.0 births per 1,000 women. Women with the education attainment of college or associate's degree represent 44.4% of all women with births.
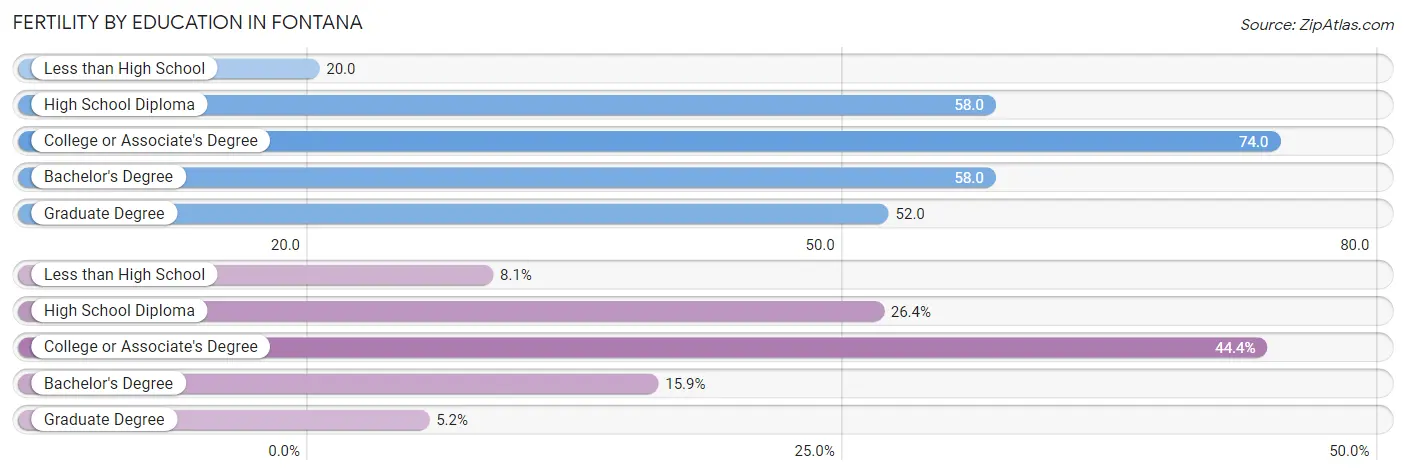
| Educational Attainment | Women with Births | Births / 1,000 Women |
| Less than High School | 245 (8.1%) | 20.0 |
| High School Diploma | 796 (26.4%) | 58.0 |
| College or Associate's Degree | 1,337 (44.4%) | 74.0 |
| Bachelor's Degree | 478 (15.9%) | 58.0 |
| Graduate Degree | 155 (5.1%) | 52.0 |
| Total | 3,011 (100.0%) | 54.0 |
Fertility by Education by Marriage Status in Fontana
34.8% of women with births in Fontana are unmarried. Women with the educational attainment of bachelor's degree are most likely to be married with 85.6% of them married at childbirth, while women with the educational attainment of less than high school are least likely to be married with 50.2% of them unmarried at childbirth.
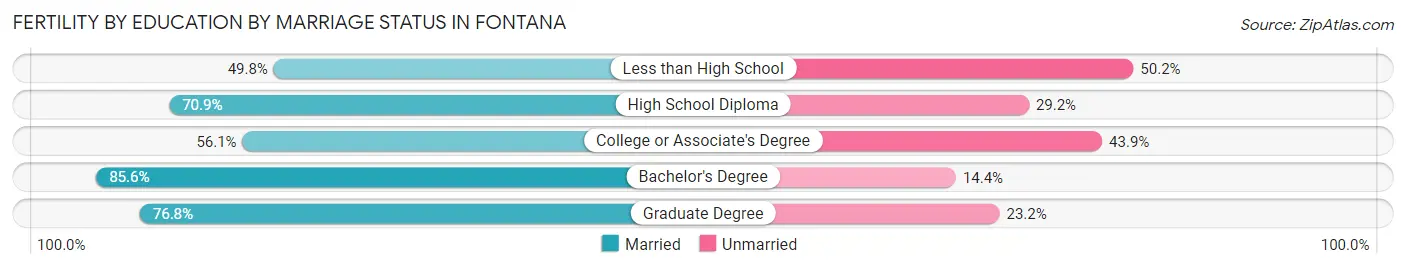
| Educational Attainment | Married | Unmarried |
| Less than High School | 122 (49.8%) | 123 (50.2%) |
| High School Diploma | 564 (70.9%) | 232 (29.1%) |
| College or Associate's Degree | 750 (56.1%) | 587 (43.9%) |
| Bachelor's Degree | 409 (85.6%) | 69 (14.4%) |
| Graduate Degree | 119 (76.8%) | 36 (23.2%) |
| Total | 1,963 (65.2%) | 1,048 (34.8%) |
Employment Characteristics in Fontana
Employment by Class of Employer in Fontana
Among the 97,882 employed individuals in Fontana, private company employees (71,551 | 73.1%), local government employees (7,900 | 8.1%), and not-for-profit organizations (5,699 | 5.8%) make up the most common classes of employment.
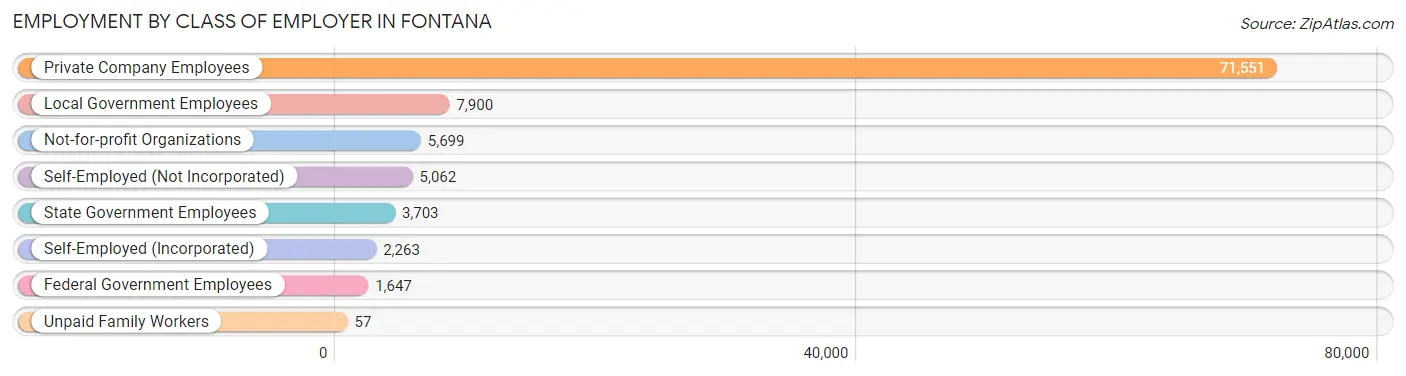
| Employer Class | # Employees | % Employees |
| Private Company Employees | 71,551 | 73.1% |
| Self-Employed (Incorporated) | 2,263 | 2.3% |
| Self-Employed (Not Incorporated) | 5,062 | 5.2% |
| Not-for-profit Organizations | 5,699 | 5.8% |
| Local Government Employees | 7,900 | 8.1% |
| State Government Employees | 3,703 | 3.8% |
| Federal Government Employees | 1,647 | 1.7% |
| Unpaid Family Workers | 57 | 0.1% |
| Total | 97,882 | 100.0% |
Employment Status by Age in Fontana
According to the labor force statistics for Fontana, out of the total population over 16 years of age (158,522), 66.9% or 106,051 individuals are in the labor force, with 6.2% or 6,575 of them unemployed. The age group with the highest labor force participation rate is 25 to 29 years, with 83.4% or 12,574 individuals in the labor force. Within the labor force, the 16 to 19 years age range has the highest percentage of unemployed individuals, with 17.0% or 843 of them being unemployed.
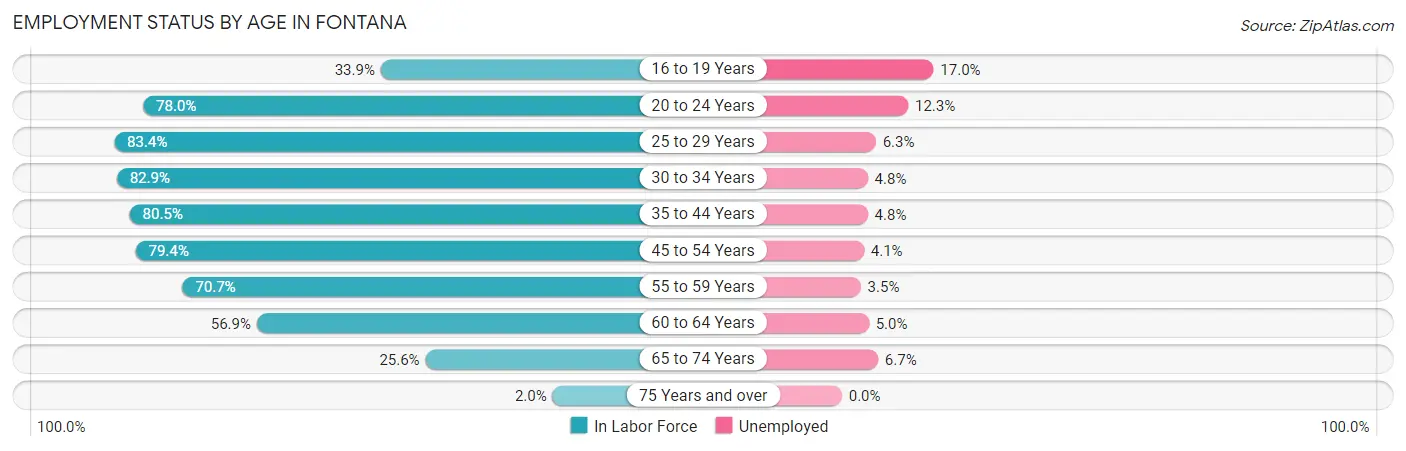
| Age Bracket | In Labor Force | Unemployed |
| 16 to 19 Years | 4,956 (33.9%) | 843 (17.0%) |
| 20 to 24 Years | 12,447 (78.0%) | 1,531 (12.3%) |
| 25 to 29 Years | 12,574 (83.4%) | 792 (6.3%) |
| 30 to 34 Years | 12,631 (82.9%) | 606 (4.8%) |
| 35 to 44 Years | 24,905 (80.5%) | 1,195 (4.8%) |
| 45 to 54 Years | 22,404 (79.4%) | 919 (4.1%) |
| 55 to 59 Years | 7,916 (70.7%) | 277 (3.5%) |
| 60 to 64 Years | 5,008 (56.9%) | 250 (5.0%) |
| 65 to 74 Years | 3,151 (25.6%) | 211 (6.7%) |
| 75 Years and over | 123 (2.0%) | 0 (0.0%) |
| Total | 106,051 (66.9%) | 6,575 (6.2%) |
Employment Status by Educational Attainment in Fontana
According to labor force statistics for Fontana, 78.0% of individuals (85,383) out of the total population between 25 and 64 years of age (109,466) are in the labor force, with 4.7% or 4,013 of them being unemployed. The group with the highest labor force participation rate are those with the educational attainment of bachelor's degree or higher, with 86.1% or 19,337 individuals in the labor force. Within the labor force, individuals with college / associate degree education have the highest percentage of unemployment, with 5.6% or 1,490 of them being unemployed.
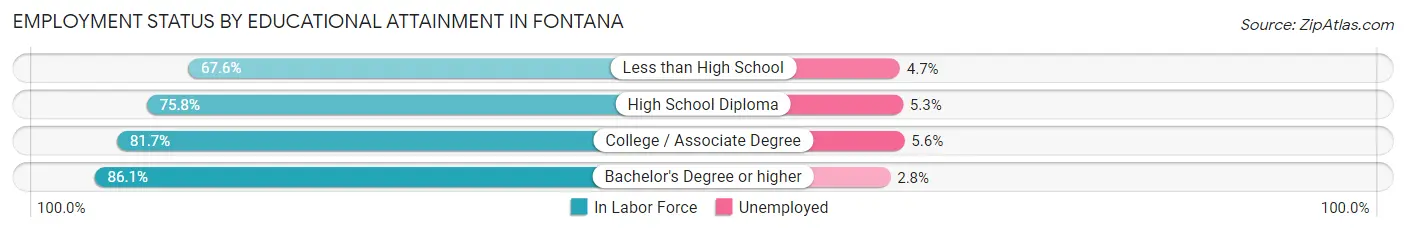
| Educational Attainment | In Labor Force | Unemployed |
| Less than High School | 14,595 (67.6%) | 1,015 (4.7%) |
| High School Diploma | 24,906 (75.8%) | 1,741 (5.3%) |
| College / Associate Degree | 26,601 (81.7%) | 1,823 (5.6%) |
| Bachelor's Degree or higher | 19,337 (86.1%) | 629 (2.8%) |
| Total | 85,383 (78.0%) | 5,145 (4.7%) |
Employment Occupations by Sex in Fontana
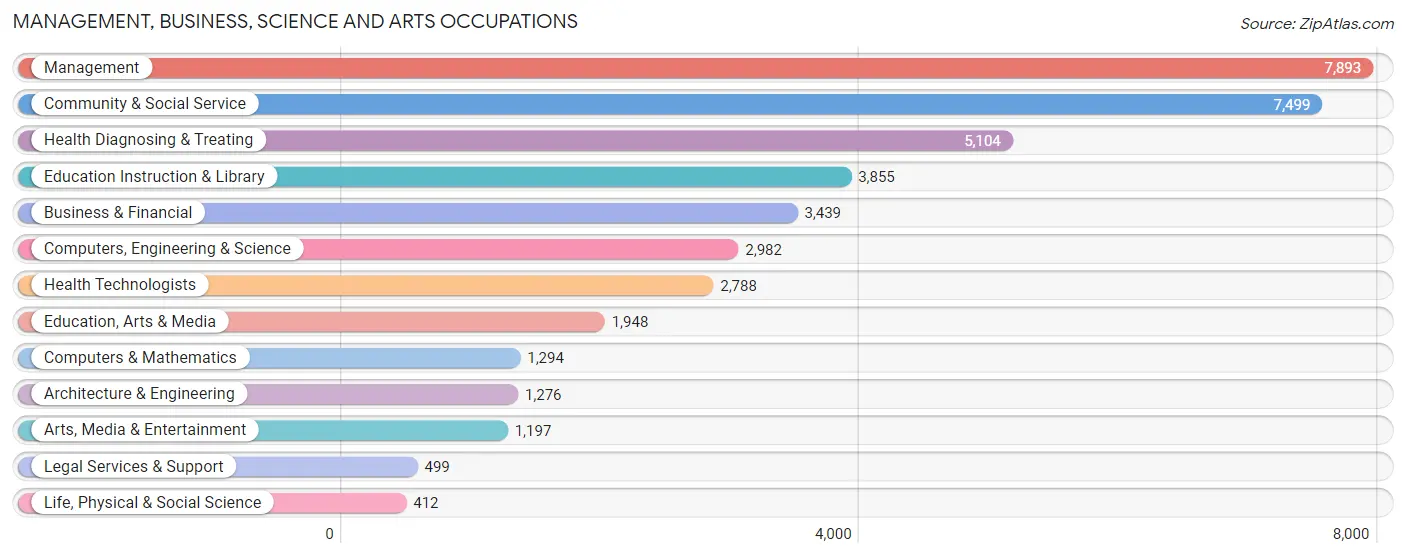
Management, Business, Science and Arts Occupations
The most common Management, Business, Science and Arts occupations in Fontana are Management (7,893 | 8.0%), Community & Social Service (7,499 | 7.6%), Health Diagnosing & Treating (5,104 | 5.1%), Education Instruction & Library (3,855 | 3.9%), and Business & Financial (3,439 | 3.5%).
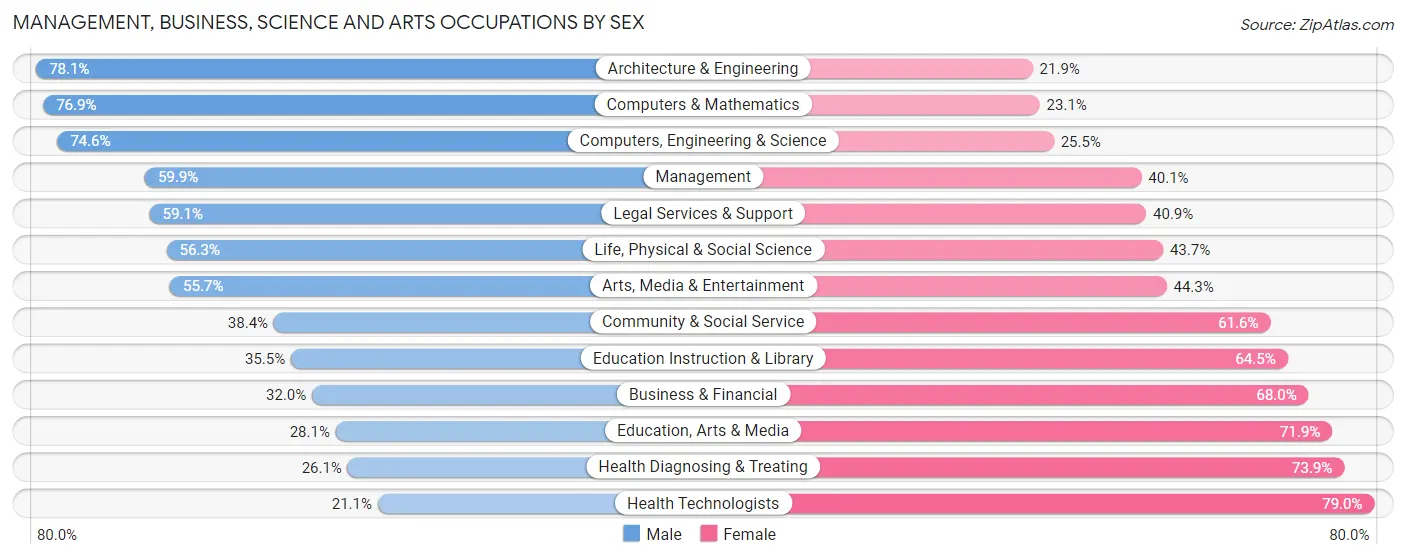
Management, Business, Science and Arts Occupations by Sex
Within the Management, Business, Science and Arts occupations in Fontana, the most male-oriented occupations are Architecture & Engineering (78.1%), Computers & Mathematics (76.9%), and Computers, Engineering & Science (74.6%), while the most female-oriented occupations are Health Technologists (78.9%), Health Diagnosing & Treating (73.9%), and Education, Arts & Media (71.9%).
| Occupation | Male | Female |
| Management | 4,729 (59.9%) | 3,164 (40.1%) |
| Business & Financial | 1,101 (32.0%) | 2,338 (68.0%) |
| Computers, Engineering & Science | 2,223 (74.6%) | 759 (25.5%) |
| Computers & Mathematics | 995 (76.9%) | 299 (23.1%) |
| Architecture & Engineering | 996 (78.1%) | 280 (21.9%) |
| Life, Physical & Social Science | 232 (56.3%) | 180 (43.7%) |
| Community & Social Service | 2,879 (38.4%) | 4,620 (61.6%) |
| Education, Arts & Media | 547 (28.1%) | 1,401 (71.9%) |
| Legal Services & Support | 295 (59.1%) | 204 (40.9%) |
| Education Instruction & Library | 1,370 (35.5%) | 2,485 (64.5%) |
| Arts, Media & Entertainment | 667 (55.7%) | 530 (44.3%) |
| Health Diagnosing & Treating | 1,331 (26.1%) | 3,773 (73.9%) |
| Health Technologists | 587 (21.0%) | 2,201 (78.9%) |
| Total (Category) | 12,263 (45.6%) | 14,654 (54.4%) |
| Total (Overall) | 56,476 (56.9%) | 42,770 (43.1%) |
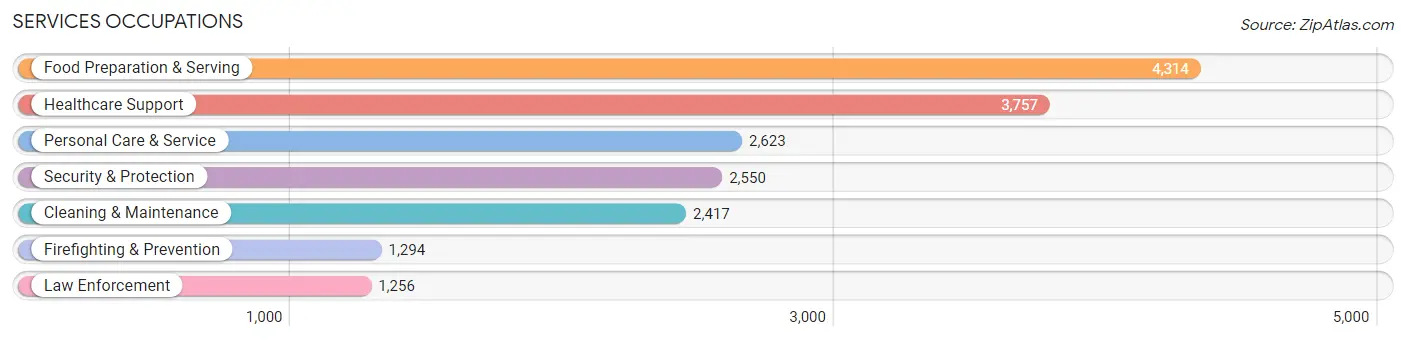
Services Occupations
The most common Services occupations in Fontana are Food Preparation & Serving (4,314 | 4.3%), Healthcare Support (3,757 | 3.8%), Personal Care & Service (2,623 | 2.6%), Security & Protection (2,550 | 2.6%), and Cleaning & Maintenance (2,417 | 2.4%).
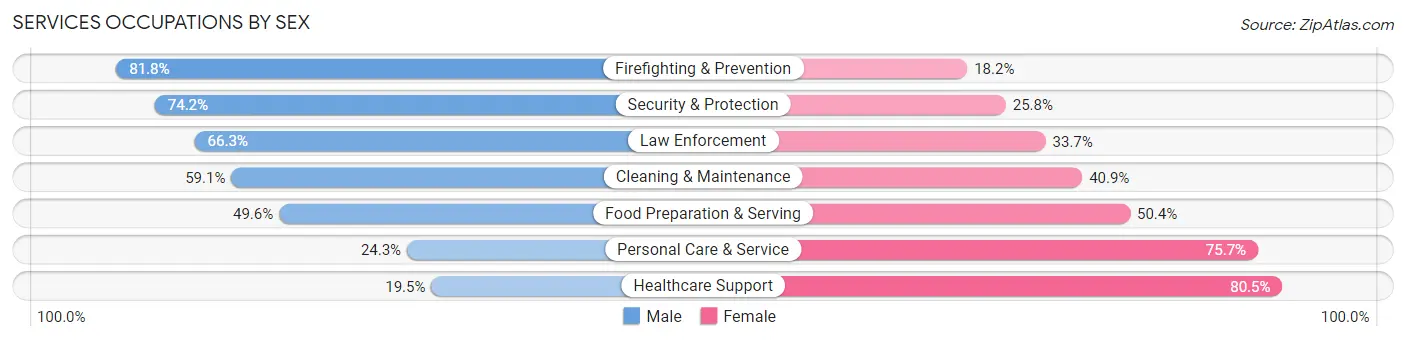
Services Occupations by Sex
Within the Services occupations in Fontana, the most male-oriented occupations are Firefighting & Prevention (81.8%), Security & Protection (74.2%), and Law Enforcement (66.3%), while the most female-oriented occupations are Healthcare Support (80.5%), Personal Care & Service (75.7%), and Food Preparation & Serving (50.4%).
| Occupation | Male | Female |
| Healthcare Support | 731 (19.5%) | 3,026 (80.5%) |
| Security & Protection | 1,892 (74.2%) | 658 (25.8%) |
| Firefighting & Prevention | 1,059 (81.8%) | 235 (18.2%) |
| Law Enforcement | 833 (66.3%) | 423 (33.7%) |
| Food Preparation & Serving | 2,140 (49.6%) | 2,174 (50.4%) |
| Cleaning & Maintenance | 1,428 (59.1%) | 989 (40.9%) |
| Personal Care & Service | 637 (24.3%) | 1,986 (75.7%) |
| Total (Category) | 6,828 (43.6%) | 8,833 (56.4%) |
| Total (Overall) | 56,476 (56.9%) | 42,770 (43.1%) |
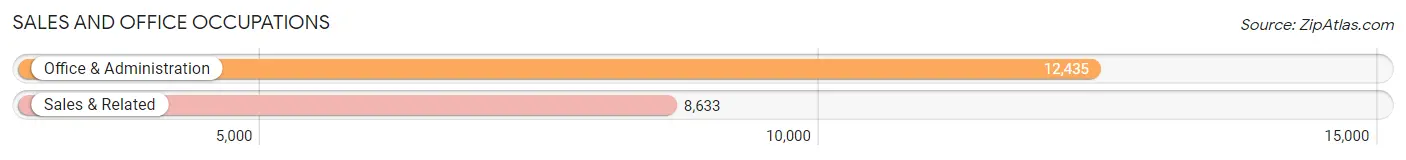
Sales and Office Occupations
The most common Sales and Office occupations in Fontana are Office & Administration (12,435 | 12.5%), and Sales & Related (8,633 | 8.7%).
Sales and Office Occupations by Sex
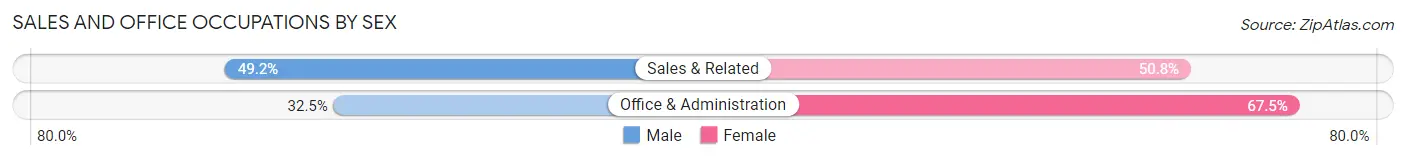
| Occupation | Male | Female |
| Sales & Related | 4,246 (49.2%) | 4,387 (50.8%) |
| Office & Administration | 4,036 (32.5%) | 8,399 (67.5%) |
| Total (Category) | 8,282 (39.3%) | 12,786 (60.7%) |
| Total (Overall) | 56,476 (56.9%) | 42,770 (43.1%) |
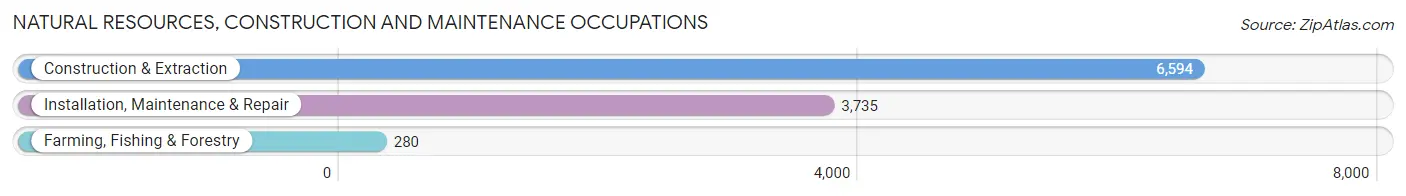
Natural Resources, Construction and Maintenance Occupations
The most common Natural Resources, Construction and Maintenance occupations in Fontana are Construction & Extraction (6,594 | 6.6%), Installation, Maintenance & Repair (3,735 | 3.8%), and Farming, Fishing & Forestry (280 | 0.3%).
Natural Resources, Construction and Maintenance Occupations by Sex
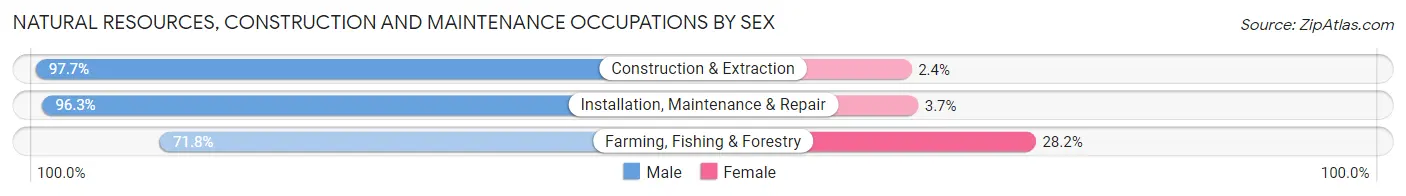
| Occupation | Male | Female |
| Farming, Fishing & Forestry | 201 (71.8%) | 79 (28.2%) |
| Construction & Extraction | 6,439 (97.7%) | 155 (2.4%) |
| Installation, Maintenance & Repair | 3,596 (96.3%) | 139 (3.7%) |
| Total (Category) | 10,236 (96.5%) | 373 (3.5%) |
| Total (Overall) | 56,476 (56.9%) | 42,770 (43.1%) |
Production, Transportation and Moving Occupations
The most common Production, Transportation and Moving occupations in Fontana are Material Moving (12,185 | 12.3%), Transportation (6,818 | 6.9%), and Production (5,988 | 6.0%).
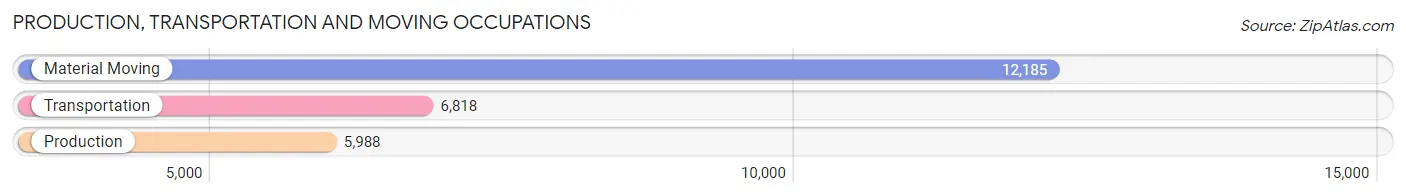
Production, Transportation and Moving Occupations by Sex
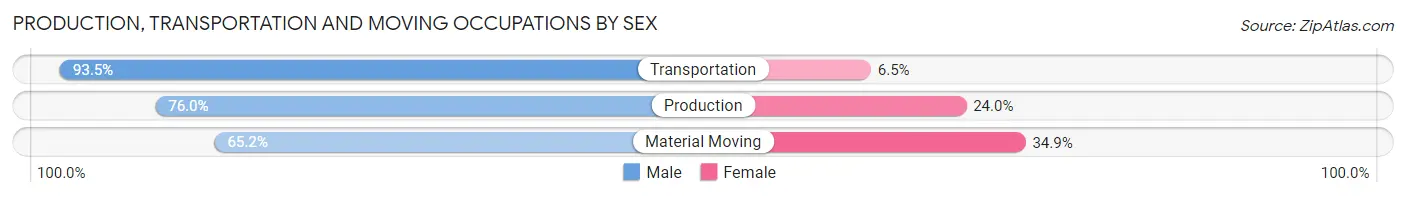
| Occupation | Male | Female |
| Production | 4,552 (76.0%) | 1,436 (24.0%) |
| Transportation | 6,376 (93.5%) | 442 (6.5%) |
| Material Moving | 7,939 (65.1%) | 4,246 (34.8%) |
| Total (Category) | 18,867 (75.5%) | 6,124 (24.5%) |
| Total (Overall) | 56,476 (56.9%) | 42,770 (43.1%) |
Employment Industries by Sex in Fontana
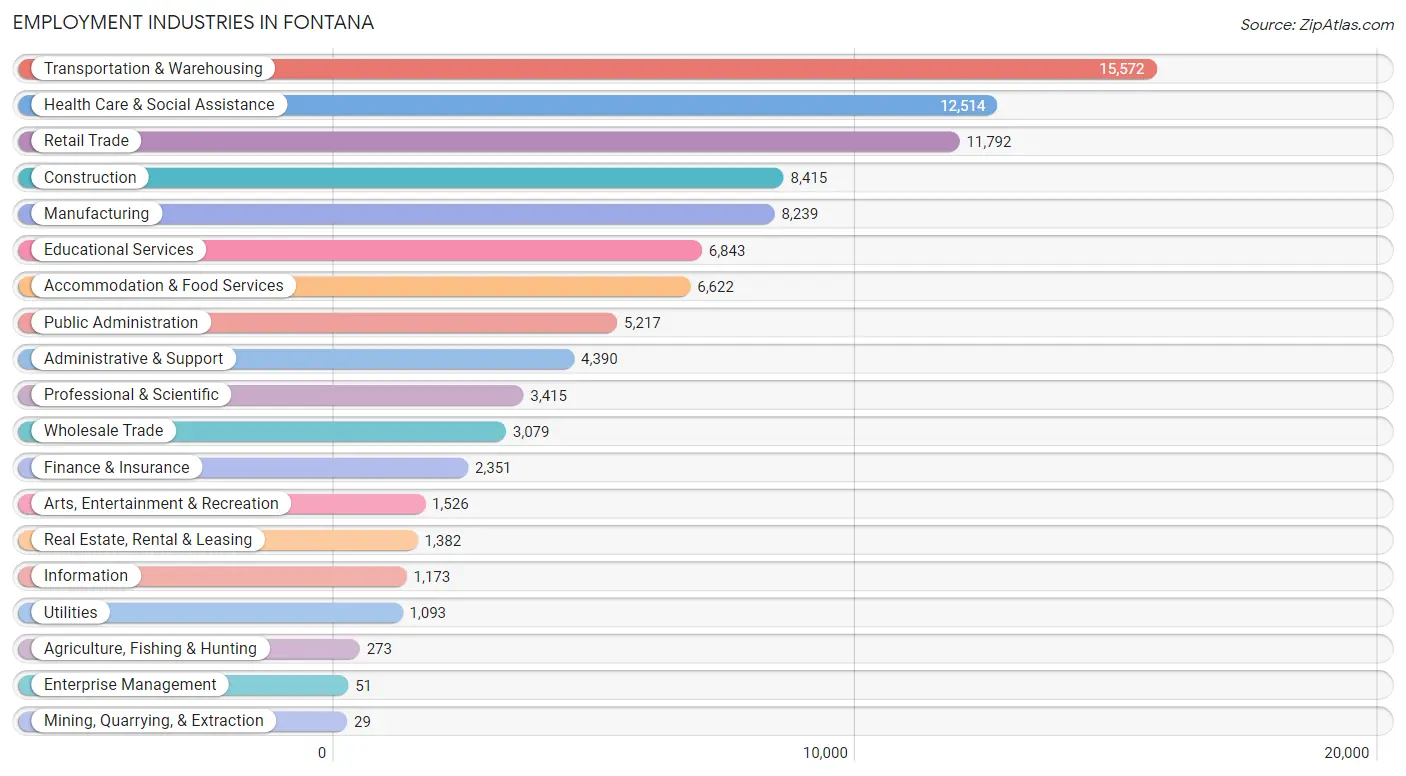
Employment Industries in Fontana
The major employment industries in Fontana include Transportation & Warehousing (15,572 | 15.7%), Health Care & Social Assistance (12,514 | 12.6%), Retail Trade (11,792 | 11.9%), Construction (8,415 | 8.5%), and Manufacturing (8,239 | 8.3%).
Employment Industries by Sex in Fontana
The Fontana industries that see more men than women are Mining, Quarrying, & Extraction (100.0%), Construction (92.4%), and Manufacturing (75.5%), whereas the industries that tend to have a higher number of women are Enterprise Management (100.0%), Health Care & Social Assistance (75.0%), and Real Estate, Rental & Leasing (65.4%).
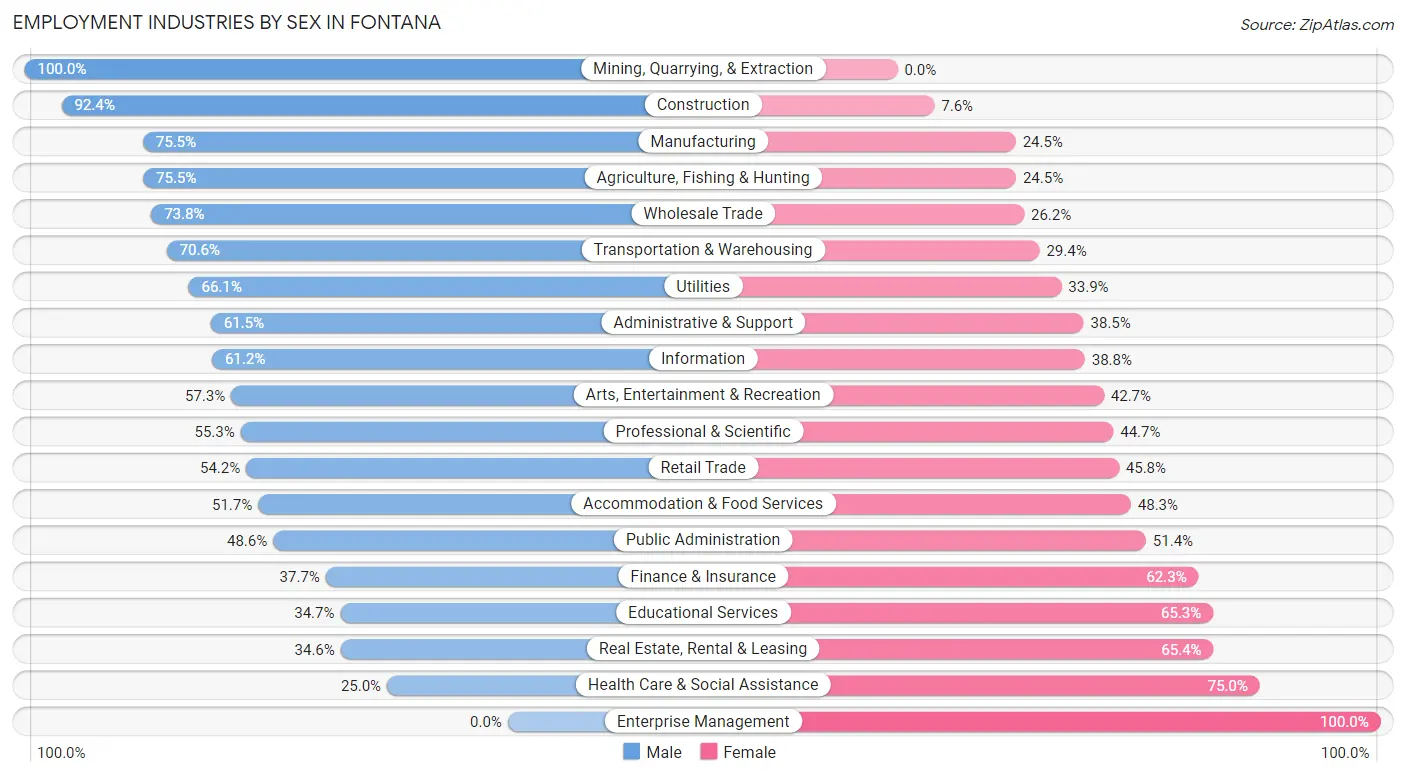
| Industry | Male | Female |
| Agriculture, Fishing & Hunting | 206 (75.5%) | 67 (24.5%) |
| Mining, Quarrying, & Extraction | 29 (100.0%) | 0 (0.0%) |
| Construction | 7,772 (92.4%) | 643 (7.6%) |
| Manufacturing | 6,222 (75.5%) | 2,017 (24.5%) |
| Wholesale Trade | 2,272 (73.8%) | 807 (26.2%) |
| Retail Trade | 6,386 (54.2%) | 5,406 (45.8%) |
| Transportation & Warehousing | 10,993 (70.6%) | 4,579 (29.4%) |
| Utilities | 722 (66.1%) | 371 (33.9%) |
| Information | 718 (61.2%) | 455 (38.8%) |
| Finance & Insurance | 886 (37.7%) | 1,465 (62.3%) |
| Real Estate, Rental & Leasing | 478 (34.6%) | 904 (65.4%) |
| Professional & Scientific | 1,889 (55.3%) | 1,526 (44.7%) |
| Enterprise Management | 0 (0.0%) | 51 (100.0%) |
| Administrative & Support | 2,698 (61.5%) | 1,692 (38.5%) |
| Educational Services | 2,372 (34.7%) | 4,471 (65.3%) |
| Health Care & Social Assistance | 3,128 (25.0%) | 9,386 (75.0%) |
| Arts, Entertainment & Recreation | 874 (57.3%) | 652 (42.7%) |
| Accommodation & Food Services | 3,422 (51.7%) | 3,200 (48.3%) |
| Public Administration | 2,534 (48.6%) | 2,683 (51.4%) |
| Total | 56,476 (56.9%) | 42,770 (43.1%) |
Education in Fontana
School Enrollment in Fontana
The most common levels of schooling among the 64,210 students in Fontana are high school (16,441 | 25.6%), college / undergraduate (14,969 | 23.3%), and middle school (13,579 | 21.1%).
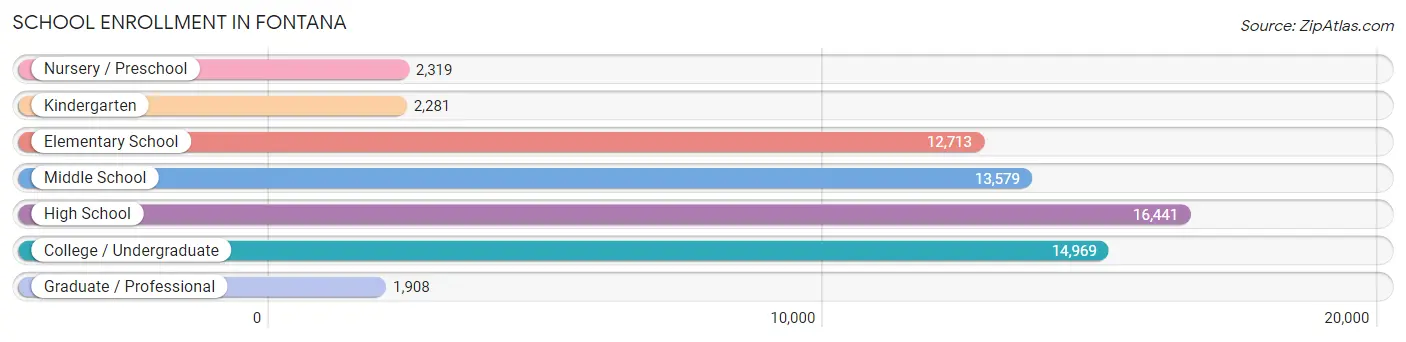
| School Level | # Students | % Students |
| Nursery / Preschool | 2,319 | 3.6% |
| Kindergarten | 2,281 | 3.5% |
| Elementary School | 12,713 | 19.8% |
| Middle School | 13,579 | 21.1% |
| High School | 16,441 | 25.6% |
| College / Undergraduate | 14,969 | 23.3% |
| Graduate / Professional | 1,908 | 3.0% |
| Total | 64,210 | 100.0% |
School Enrollment by Age by Funding Source in Fontana
Out of a total of 64,210 students who are enrolled in schools in Fontana, 5,650 (8.8%) attend a private institution, while the remaining 58,560 (91.2%) are enrolled in public schools. The age group of 25 to 34 year olds has the highest likelihood of being enrolled in private schools, with 1,411 (35.3% in the age bracket) enrolled. Conversely, the age group of 10 to 14 year olds has the lowest likelihood of being enrolled in a private school, with 17,251 (97.2% in the age bracket) attending a public institution.
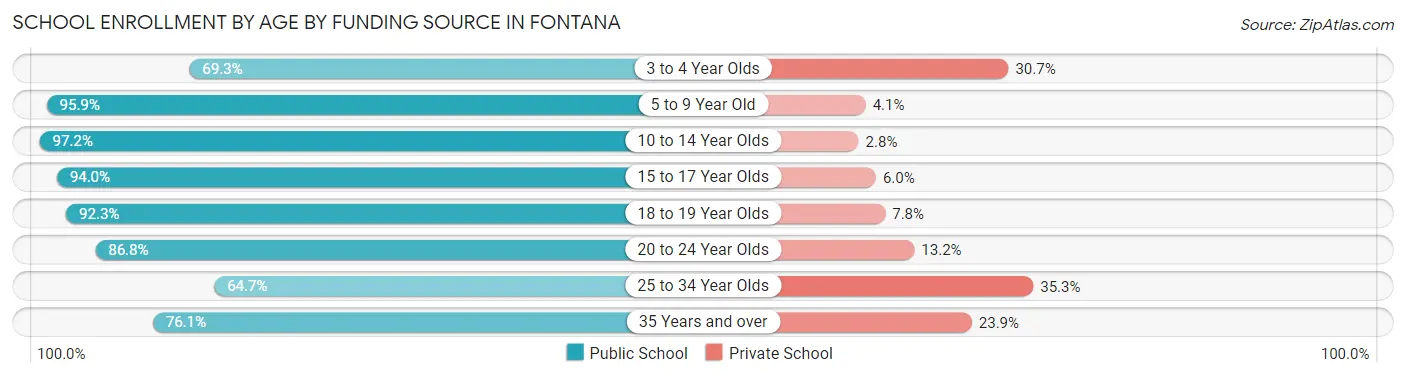
| Age Bracket | Public School | Private School |
| 3 to 4 Year Olds | 1,079 (69.3%) | 478 (30.7%) |
| 5 to 9 Year Old | 14,168 (95.9%) | 606 (4.1%) |
| 10 to 14 Year Olds | 17,251 (97.2%) | 495 (2.8%) |
| 15 to 17 Year Olds | 10,960 (94.0%) | 702 (6.0%) |
| 18 to 19 Year Olds | 4,442 (92.2%) | 373 (7.7%) |
| 20 to 24 Year Olds | 5,690 (86.8%) | 864 (13.2%) |
| 25 to 34 Year Olds | 2,584 (64.7%) | 1,411 (35.3%) |
| 35 Years and over | 2,365 (76.1%) | 742 (23.9%) |
| Total | 58,560 (91.2%) | 5,650 (8.8%) |
Educational Attainment by Field of Study in Fontana
Business (6,442 | 24.0%), science & technology (3,208 | 11.9%), arts & humanities (2,836 | 10.6%), social sciences (2,447 | 9.1%), and engineering (2,092 | 7.8%) are the most common fields of study among 26,834 individuals in Fontana who have obtained a bachelor's degree or higher.
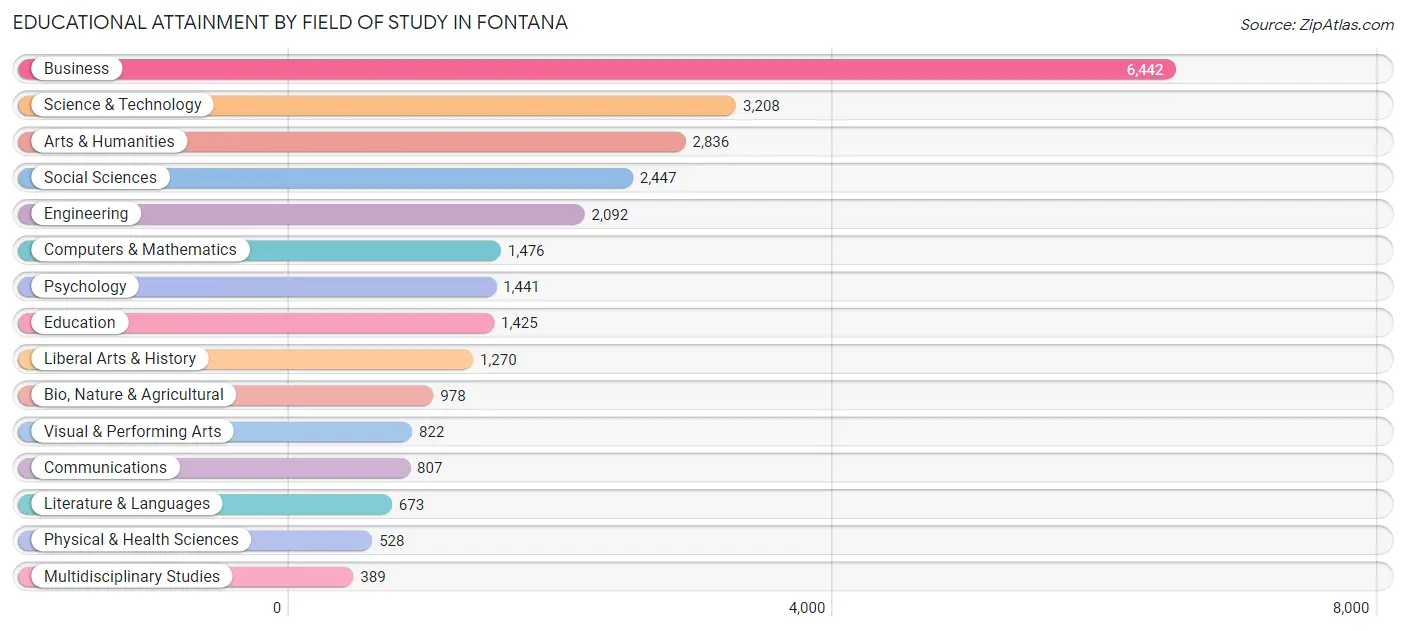
| Field of Study | # Graduates | % Graduates |
| Computers & Mathematics | 1,476 | 5.5% |
| Bio, Nature & Agricultural | 978 | 3.6% |
| Physical & Health Sciences | 528 | 2.0% |
| Psychology | 1,441 | 5.4% |
| Social Sciences | 2,447 | 9.1% |
| Engineering | 2,092 | 7.8% |
| Multidisciplinary Studies | 389 | 1.5% |
| Science & Technology | 3,208 | 11.9% |
| Business | 6,442 | 24.0% |
| Education | 1,425 | 5.3% |
| Literature & Languages | 673 | 2.5% |
| Liberal Arts & History | 1,270 | 4.7% |
| Visual & Performing Arts | 822 | 3.1% |
| Communications | 807 | 3.0% |
| Arts & Humanities | 2,836 | 10.6% |
| Total | 26,834 | 100.0% |
Transportation & Commute in Fontana
Vehicle Availability by Sex in Fontana
The most prevalent vehicle ownership categories in Fontana are males with 2 vehicles (18,150, accounting for 32.5%) and females with 2 vehicles (13,611, making up 43.3%).
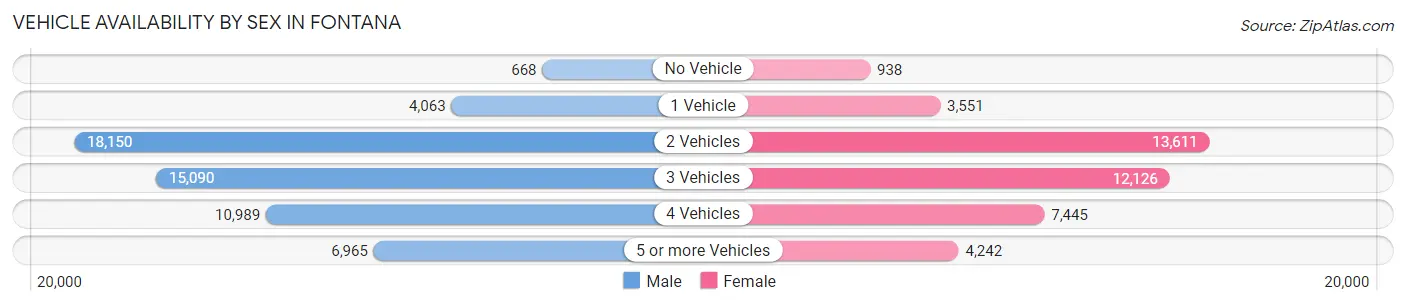
| Vehicles Available | Male | Female |
| No Vehicle | 668 (1.2%) | 938 (2.2%) |
| 1 Vehicle | 4,063 (7.3%) | 3,551 (8.5%) |
| 2 Vehicles | 18,150 (32.5%) | 13,611 (32.5%) |
| 3 Vehicles | 15,090 (27.0%) | 12,126 (28.9%) |
| 4 Vehicles | 10,989 (19.7%) | 7,445 (17.8%) |
| 5 or more Vehicles | 6,965 (12.4%) | 4,242 (10.1%) |
| Total | 55,925 (100.0%) | 41,913 (100.0%) |
Commute Time in Fontana
The most frequently occuring commute durations in Fontana are 20 to 24 minutes (13,539 commuters, 15.4%), 15 to 19 minutes (12,813 commuters, 14.6%), and 30 to 34 minutes (12,444 commuters, 14.2%).
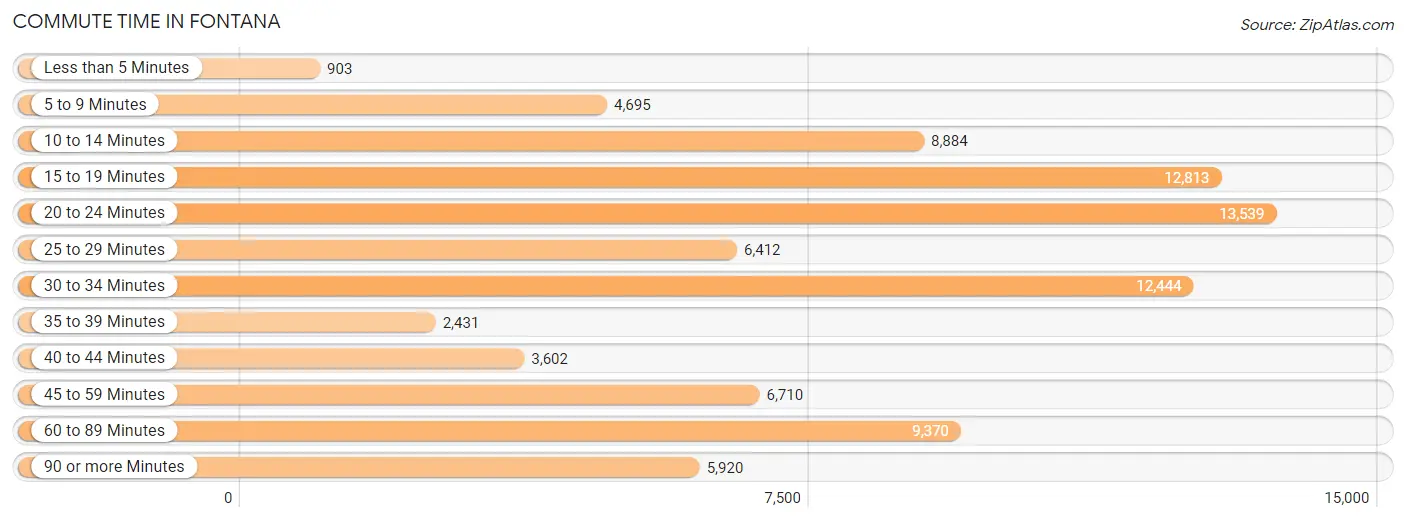
| Commute Time | # Commuters | % Commuters |
| Less than 5 Minutes | 903 | 1.0% |
| 5 to 9 Minutes | 4,695 | 5.3% |
| 10 to 14 Minutes | 8,884 | 10.1% |
| 15 to 19 Minutes | 12,813 | 14.6% |
| 20 to 24 Minutes | 13,539 | 15.4% |
| 25 to 29 Minutes | 6,412 | 7.3% |
| 30 to 34 Minutes | 12,444 | 14.2% |
| 35 to 39 Minutes | 2,431 | 2.8% |
| 40 to 44 Minutes | 3,602 | 4.1% |
| 45 to 59 Minutes | 6,710 | 7.6% |
| 60 to 89 Minutes | 9,370 | 10.7% |
| 90 or more Minutes | 5,920 | 6.8% |
Commute Time by Sex in Fontana
The most common commute times in Fontana are 20 to 24 minutes (7,117 commuters, 14.2%) for males and 20 to 24 minutes (6,422 commuters, 17.1%) for females.
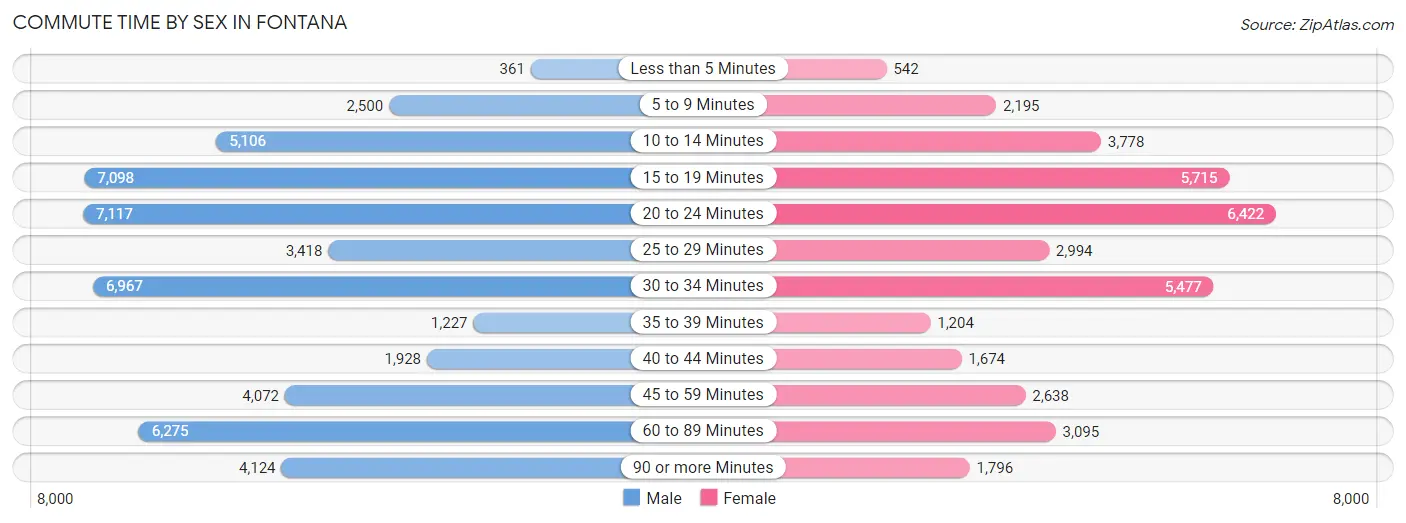
| Commute Time | Male | Female |
| Less than 5 Minutes | 361 (0.7%) | 542 (1.4%) |
| 5 to 9 Minutes | 2,500 (5.0%) | 2,195 (5.9%) |
| 10 to 14 Minutes | 5,106 (10.2%) | 3,778 (10.1%) |
| 15 to 19 Minutes | 7,098 (14.1%) | 5,715 (15.2%) |
| 20 to 24 Minutes | 7,117 (14.2%) | 6,422 (17.1%) |
| 25 to 29 Minutes | 3,418 (6.8%) | 2,994 (8.0%) |
| 30 to 34 Minutes | 6,967 (13.9%) | 5,477 (14.6%) |
| 35 to 39 Minutes | 1,227 (2.4%) | 1,204 (3.2%) |
| 40 to 44 Minutes | 1,928 (3.8%) | 1,674 (4.5%) |
| 45 to 59 Minutes | 4,072 (8.1%) | 2,638 (7.0%) |
| 60 to 89 Minutes | 6,275 (12.5%) | 3,095 (8.3%) |
| 90 or more Minutes | 4,124 (8.2%) | 1,796 (4.8%) |
Time of Departure to Work by Sex in Fontana
The most frequent times of departure to work in Fontana are 12:00 AM to 4:59 AM (9,553, 19.0%) for males and 7:00 AM to 7:29 AM (4,385, 11.7%) for females.
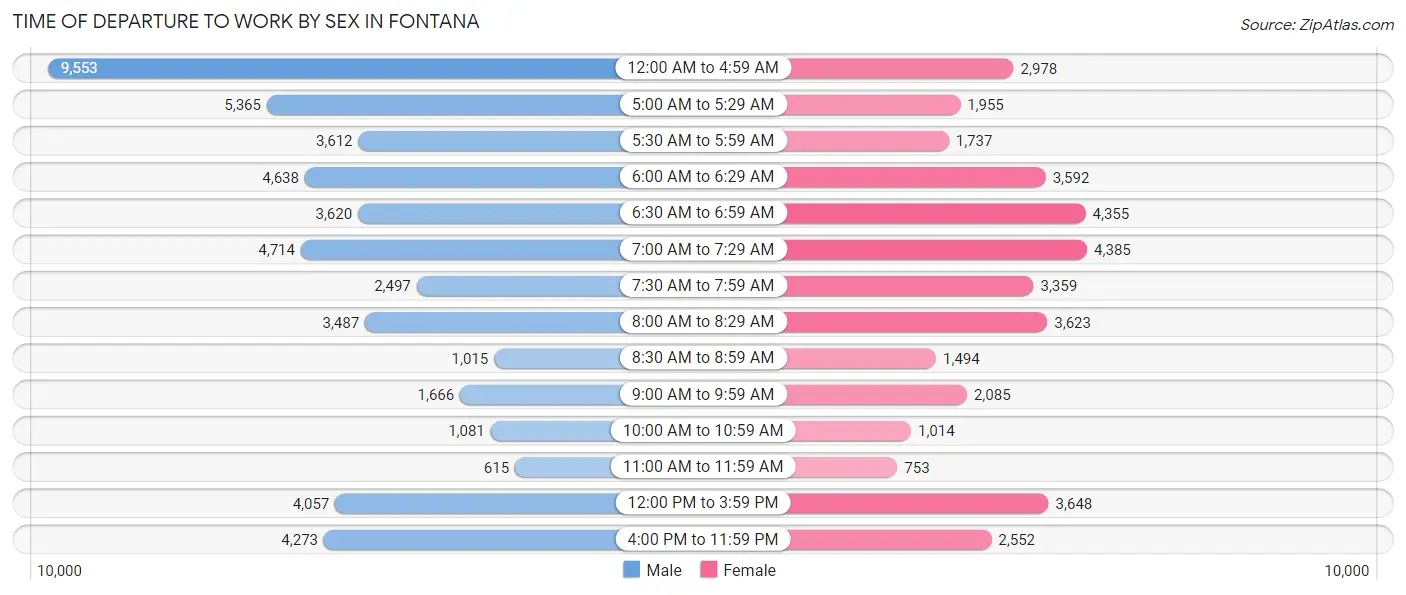
| Time of Departure | Male | Female |
| 12:00 AM to 4:59 AM | 9,553 (19.0%) | 2,978 (7.9%) |
| 5:00 AM to 5:29 AM | 5,365 (10.7%) | 1,955 (5.2%) |
| 5:30 AM to 5:59 AM | 3,612 (7.2%) | 1,737 (4.6%) |
| 6:00 AM to 6:29 AM | 4,638 (9.2%) | 3,592 (9.6%) |
| 6:30 AM to 6:59 AM | 3,620 (7.2%) | 4,355 (11.6%) |
| 7:00 AM to 7:29 AM | 4,714 (9.4%) | 4,385 (11.7%) |
| 7:30 AM to 7:59 AM | 2,497 (5.0%) | 3,359 (8.9%) |
| 8:00 AM to 8:29 AM | 3,487 (7.0%) | 3,623 (9.7%) |
| 8:30 AM to 8:59 AM | 1,015 (2.0%) | 1,494 (4.0%) |
| 9:00 AM to 9:59 AM | 1,666 (3.3%) | 2,085 (5.6%) |
| 10:00 AM to 10:59 AM | 1,081 (2.1%) | 1,014 (2.7%) |
| 11:00 AM to 11:59 AM | 615 (1.2%) | 753 (2.0%) |
| 12:00 PM to 3:59 PM | 4,057 (8.1%) | 3,648 (9.7%) |
| 4:00 PM to 11:59 PM | 4,273 (8.5%) | 2,552 (6.8%) |
| Total | 50,193 (100.0%) | 37,530 (100.0%) |
Housing Occupancy in Fontana
Occupancy by Ownership in Fontana
Of the total 55,856 dwellings in Fontana, owner-occupied units account for 37,214 (66.6%), while renter-occupied units make up 18,642 (33.4%).
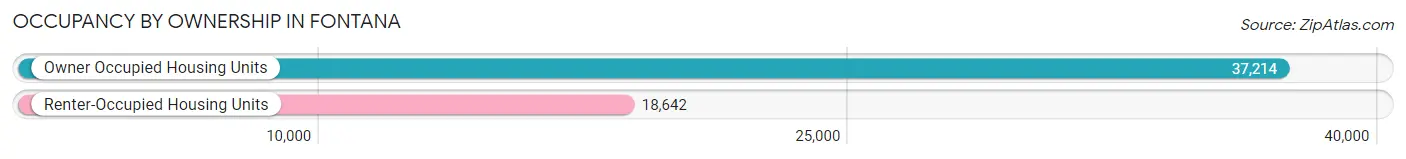
| Occupancy | # Housing Units | % Housing Units |
| Owner Occupied Housing Units | 37,214 | 66.6% |
| Renter-Occupied Housing Units | 18,642 | 33.4% |
| Total Occupied Housing Units | 55,856 | 100.0% |
Occupancy by Household Size in Fontana
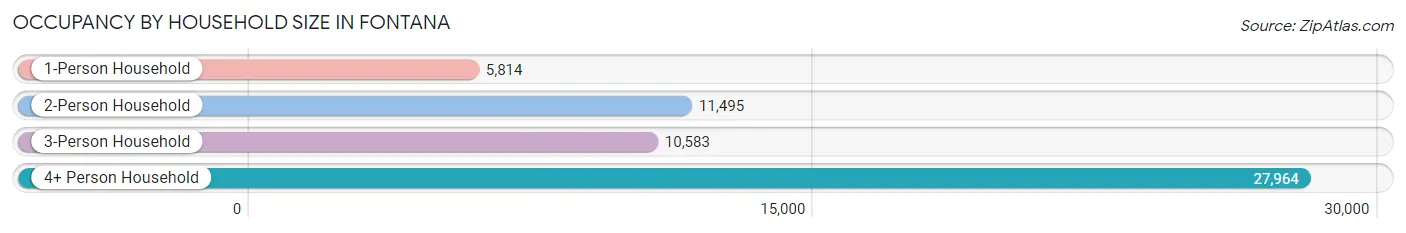
| Household Size | # Housing Units | % Housing Units |
| 1-Person Household | 5,814 | 10.4% |
| 2-Person Household | 11,495 | 20.6% |
| 3-Person Household | 10,583 | 19.0% |
| 4+ Person Household | 27,964 | 50.1% |
| Total Housing Units | 55,856 | 100.0% |
Occupancy by Ownership by Household Size in Fontana
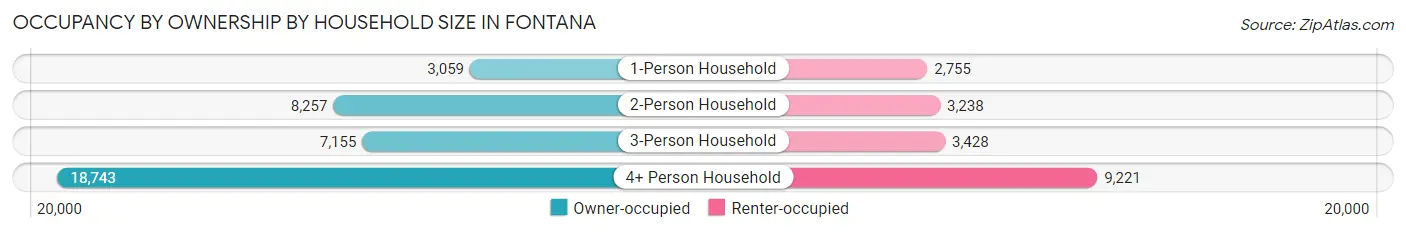
| Household Size | Owner-occupied | Renter-occupied |
| 1-Person Household | 3,059 (52.6%) | 2,755 (47.4%) |
| 2-Person Household | 8,257 (71.8%) | 3,238 (28.2%) |
| 3-Person Household | 7,155 (67.6%) | 3,428 (32.4%) |
| 4+ Person Household | 18,743 (67.0%) | 9,221 (33.0%) |
| Total Housing Units | 37,214 (66.6%) | 18,642 (33.4%) |
Occupancy by Educational Attainment in Fontana
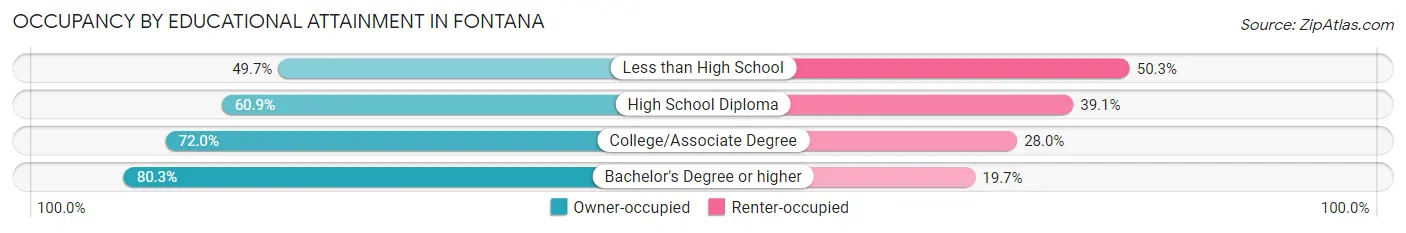
| Household Size | Owner-occupied | Renter-occupied |
| Less than High School | 5,586 (49.7%) | 5,648 (50.3%) |
| High School Diploma | 8,798 (60.9%) | 5,646 (39.1%) |
| College/Associate Degree | 12,279 (72.0%) | 4,765 (28.0%) |
| Bachelor's Degree or higher | 10,551 (80.3%) | 2,583 (19.7%) |
Occupancy by Age of Householder in Fontana
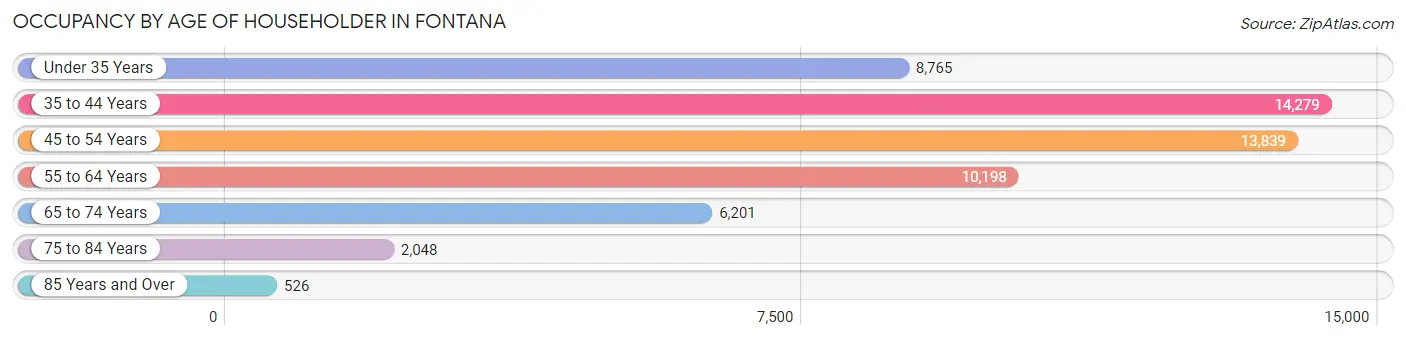
| Age Bracket | # Households | % Households |
| Under 35 Years | 8,765 | 15.7% |
| 35 to 44 Years | 14,279 | 25.6% |
| 45 to 54 Years | 13,839 | 24.8% |
| 55 to 64 Years | 10,198 | 18.3% |
| 65 to 74 Years | 6,201 | 11.1% |
| 75 to 84 Years | 2,048 | 3.7% |
| 85 Years and Over | 526 | 0.9% |
| Total | 55,856 | 100.0% |
Housing Finances in Fontana
Median Income by Occupancy in Fontana
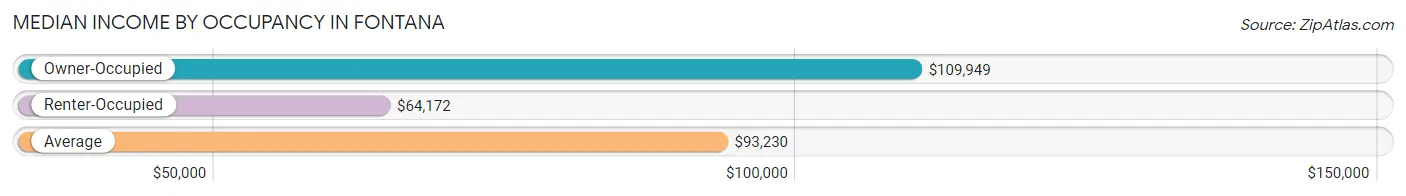
| Occupancy Type | # Households | Median Income |
| Owner-Occupied | 37,214 (66.6%) | $109,949 |
| Renter-Occupied | 18,642 (33.4%) | $64,172 |
| Average | 55,856 (100.0%) | $93,230 |
Occupancy by Householder Income Bracket in Fontana
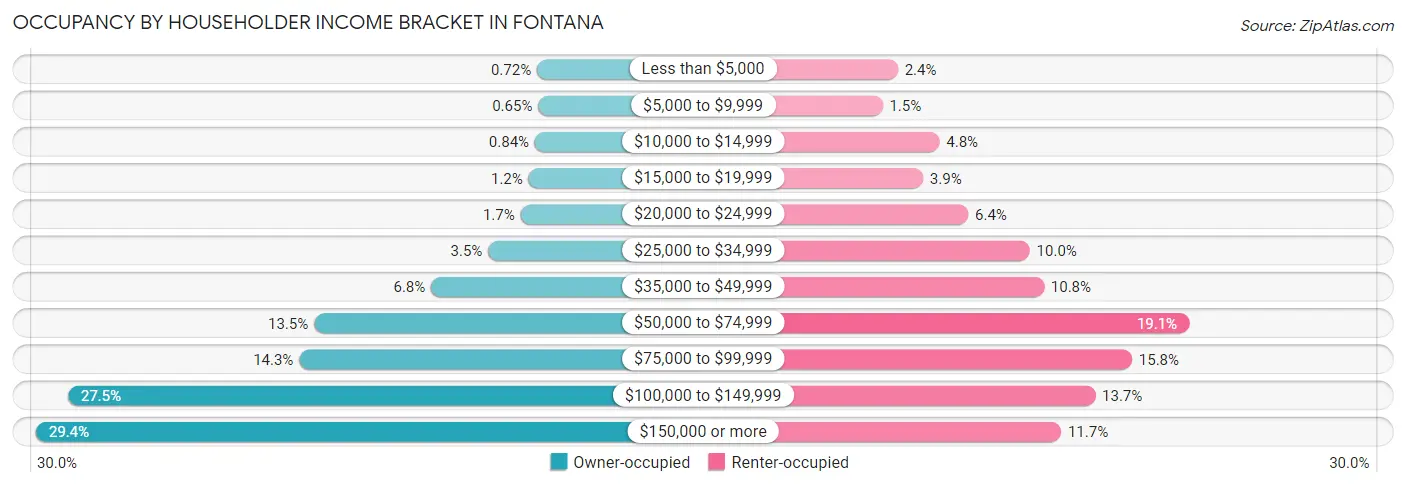
| Income Bracket | Owner-occupied | Renter-occupied |
| Less than $5,000 | 269 (0.7%) | 449 (2.4%) |
| $5,000 to $9,999 | 241 (0.6%) | 287 (1.5%) |
| $10,000 to $14,999 | 312 (0.8%) | 893 (4.8%) |
| $15,000 to $19,999 | 448 (1.2%) | 718 (3.8%) |
| $20,000 to $24,999 | 616 (1.7%) | 1,199 (6.4%) |
| $25,000 to $34,999 | 1,305 (3.5%) | 1,854 (10.0%) |
| $35,000 to $49,999 | 2,518 (6.8%) | 2,006 (10.8%) |
| $50,000 to $74,999 | 5,008 (13.5%) | 3,552 (19.1%) |
| $75,000 to $99,999 | 5,327 (14.3%) | 2,943 (15.8%) |
| $100,000 to $149,999 | 10,245 (27.5%) | 2,553 (13.7%) |
| $150,000 or more | 10,925 (29.4%) | 2,188 (11.7%) |
| Total | 37,214 (100.0%) | 18,642 (100.0%) |
Monthly Housing Cost Tiers in Fontana
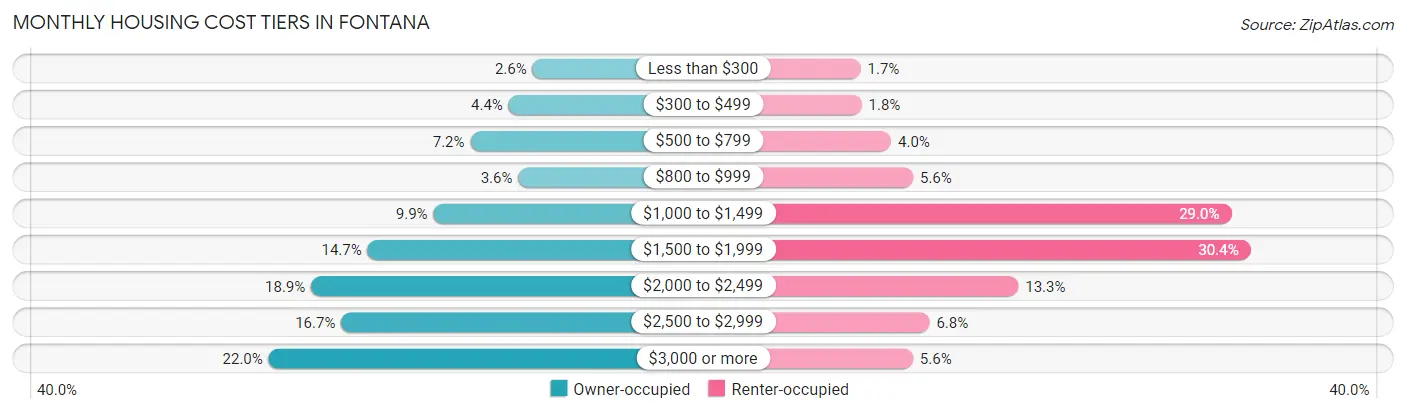
| Monthly Cost | Owner-occupied | Renter-occupied |
| Less than $300 | 962 (2.6%) | 318 (1.7%) |
| $300 to $499 | 1,620 (4.3%) | 332 (1.8%) |
| $500 to $799 | 2,670 (7.2%) | 737 (4.0%) |
| $800 to $999 | 1,355 (3.6%) | 1,039 (5.6%) |
| $1,000 to $1,499 | 3,679 (9.9%) | 5,407 (29.0%) |
| $1,500 to $1,999 | 5,487 (14.7%) | 5,670 (30.4%) |
| $2,000 to $2,499 | 7,034 (18.9%) | 2,483 (13.3%) |
| $2,500 to $2,999 | 6,208 (16.7%) | 1,264 (6.8%) |
| $3,000 or more | 8,199 (22.0%) | 1,036 (5.6%) |
| Total | 37,214 (100.0%) | 18,642 (100.0%) |
Physical Housing Characteristics in Fontana
Housing Structures in Fontana
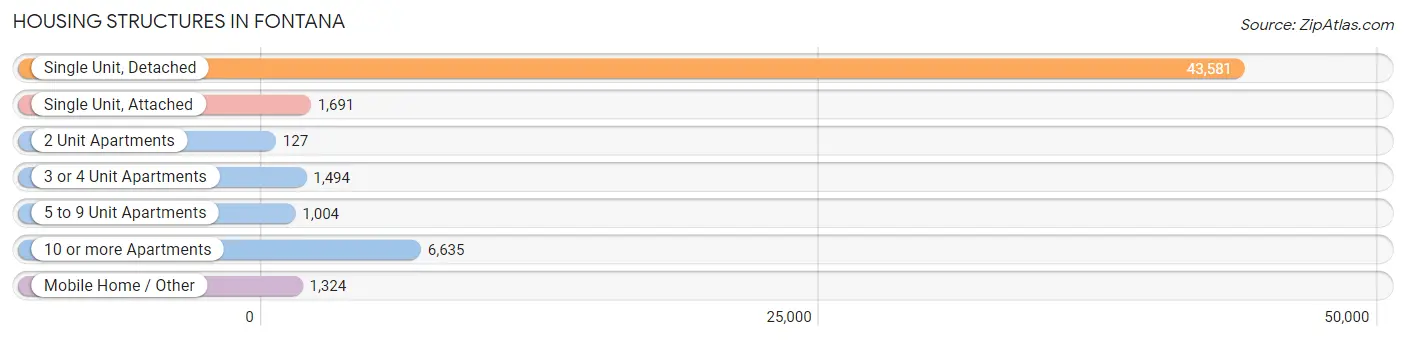
| Structure Type | # Housing Units | % Housing Units |
| Single Unit, Detached | 43,581 | 78.0% |
| Single Unit, Attached | 1,691 | 3.0% |
| 2 Unit Apartments | 127 | 0.2% |
| 3 or 4 Unit Apartments | 1,494 | 2.7% |
| 5 to 9 Unit Apartments | 1,004 | 1.8% |
| 10 or more Apartments | 6,635 | 11.9% |
| Mobile Home / Other | 1,324 | 2.4% |
| Total | 55,856 | 100.0% |
Housing Structures by Occupancy in Fontana
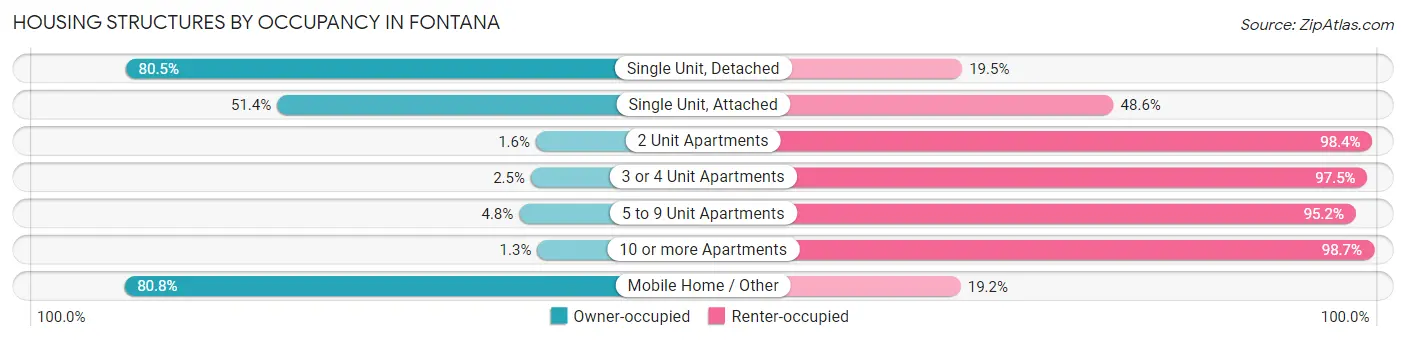
| Structure Type | Owner-occupied | Renter-occupied |
| Single Unit, Detached | 35,101 (80.5%) | 8,480 (19.5%) |
| Single Unit, Attached | 869 (51.4%) | 822 (48.6%) |
| 2 Unit Apartments | 2 (1.6%) | 125 (98.4%) |
| 3 or 4 Unit Apartments | 38 (2.5%) | 1,456 (97.5%) |
| 5 to 9 Unit Apartments | 48 (4.8%) | 956 (95.2%) |
| 10 or more Apartments | 86 (1.3%) | 6,549 (98.7%) |
| Mobile Home / Other | 1,070 (80.8%) | 254 (19.2%) |
| Total | 37,214 (66.6%) | 18,642 (33.4%) |
Housing Structures by Number of Rooms in Fontana
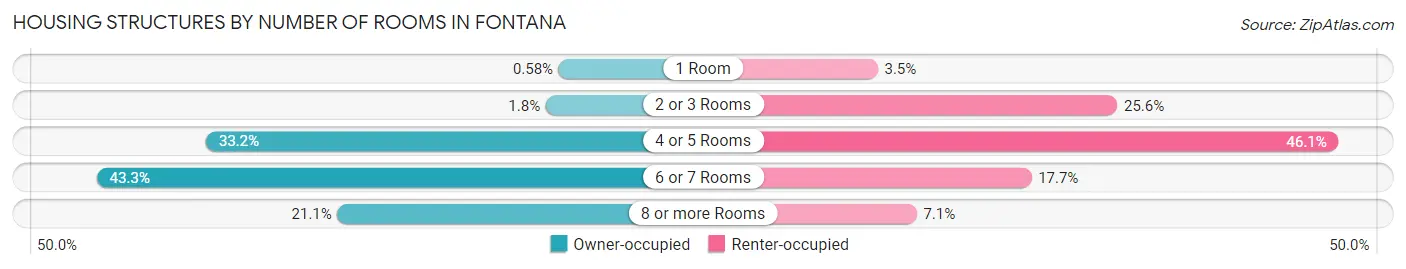
| Number of Rooms | Owner-occupied | Renter-occupied |
| 1 Room | 217 (0.6%) | 648 (3.5%) |
| 2 or 3 Rooms | 664 (1.8%) | 4,778 (25.6%) |
| 4 or 5 Rooms | 12,370 (33.2%) | 8,598 (46.1%) |
| 6 or 7 Rooms | 16,128 (43.3%) | 3,298 (17.7%) |
| 8 or more Rooms | 7,835 (21.0%) | 1,320 (7.1%) |
| Total | 37,214 (100.0%) | 18,642 (100.0%) |
Housing Structure by Heating Type in Fontana
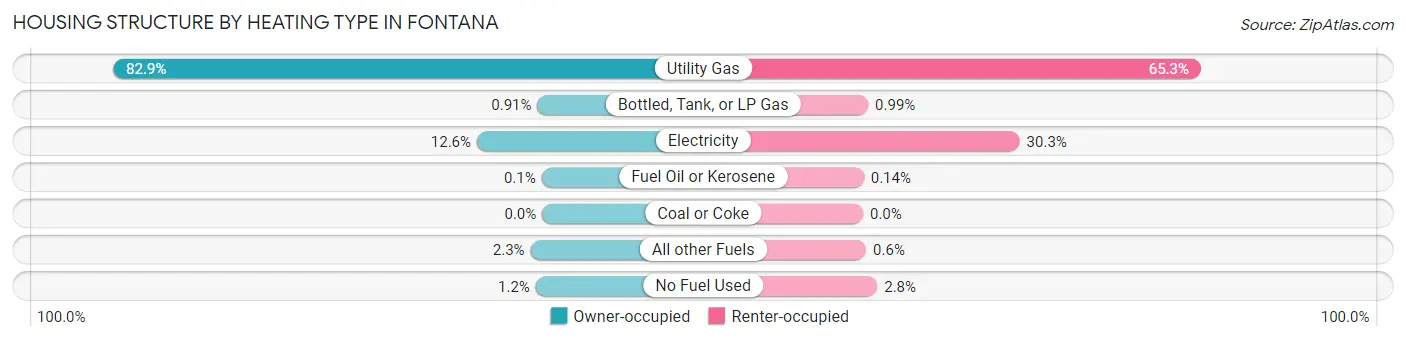
| Heating Type | Owner-occupied | Renter-occupied |
| Utility Gas | 30,851 (82.9%) | 12,165 (65.3%) |
| Bottled, Tank, or LP Gas | 338 (0.9%) | 185 (1.0%) |
| Electricity | 4,691 (12.6%) | 5,642 (30.3%) |
| Fuel Oil or Kerosene | 36 (0.1%) | 26 (0.1%) |
| Coal or Coke | 0 (0.0%) | 0 (0.0%) |
| All other Fuels | 837 (2.2%) | 112 (0.6%) |
| No Fuel Used | 461 (1.2%) | 512 (2.8%) |
| Total | 37,214 (100.0%) | 18,642 (100.0%) |
Household Vehicle Usage in Fontana
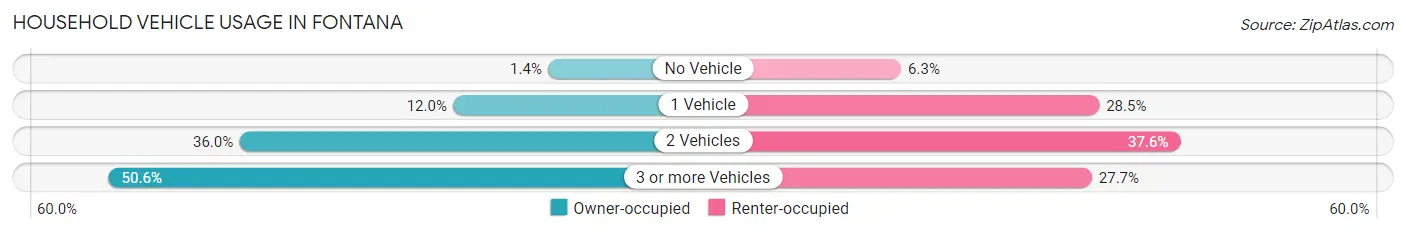
| Vehicles per Household | Owner-occupied | Renter-occupied |
| No Vehicle | 520 (1.4%) | 1,174 (6.3%) |
| 1 Vehicle | 4,481 (12.0%) | 5,311 (28.5%) |
| 2 Vehicles | 13,391 (36.0%) | 7,001 (37.6%) |
| 3 or more Vehicles | 18,822 (50.6%) | 5,156 (27.7%) |
| Total | 37,214 (100.0%) | 18,642 (100.0%) |
Real Estate & Mortgages in Fontana
Real Estate and Mortgage Overview in Fontana
| Characteristic | Without Mortgage | With Mortgage |
| Housing Units | 7,128 | 30,086 |
| Median Property Value | $447,500 | $525,200 |
| Median Household Income | $80,944 | $9,473 |
| Monthly Housing Costs | $621 | $8,183 |
| Real Estate Taxes | $2,827 | $445 |
Property Value by Mortgage Status in Fontana
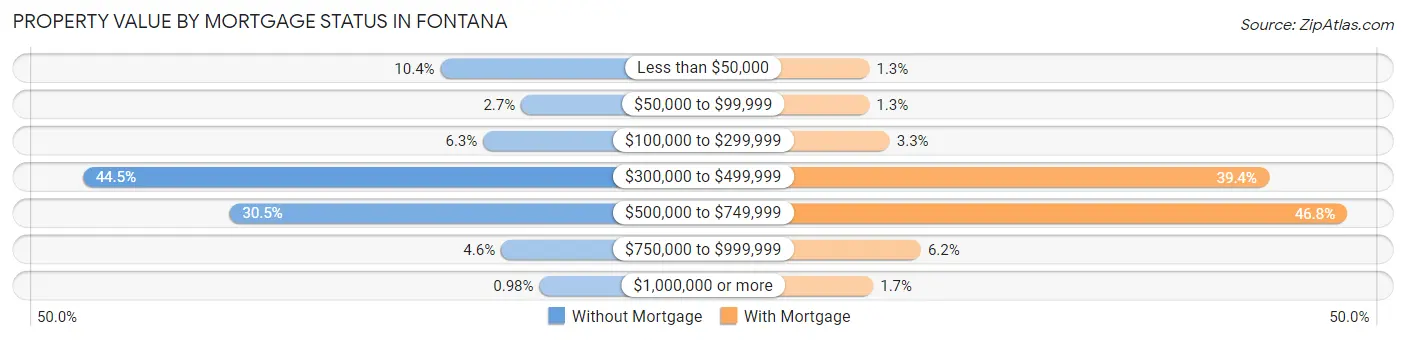
| Property Value | Without Mortgage | With Mortgage |
| Less than $50,000 | 741 (10.4%) | 399 (1.3%) |
| $50,000 to $99,999 | 194 (2.7%) | 397 (1.3%) |
| $100,000 to $299,999 | 451 (6.3%) | 985 (3.3%) |
| $300,000 to $499,999 | 3,169 (44.5%) | 11,842 (39.4%) |
| $500,000 to $749,999 | 2,173 (30.5%) | 14,079 (46.8%) |
| $750,000 to $999,999 | 330 (4.6%) | 1,875 (6.2%) |
| $1,000,000 or more | 70 (1.0%) | 509 (1.7%) |
| Total | 7,128 (100.0%) | 30,086 (100.0%) |
Household Income by Mortgage Status in Fontana
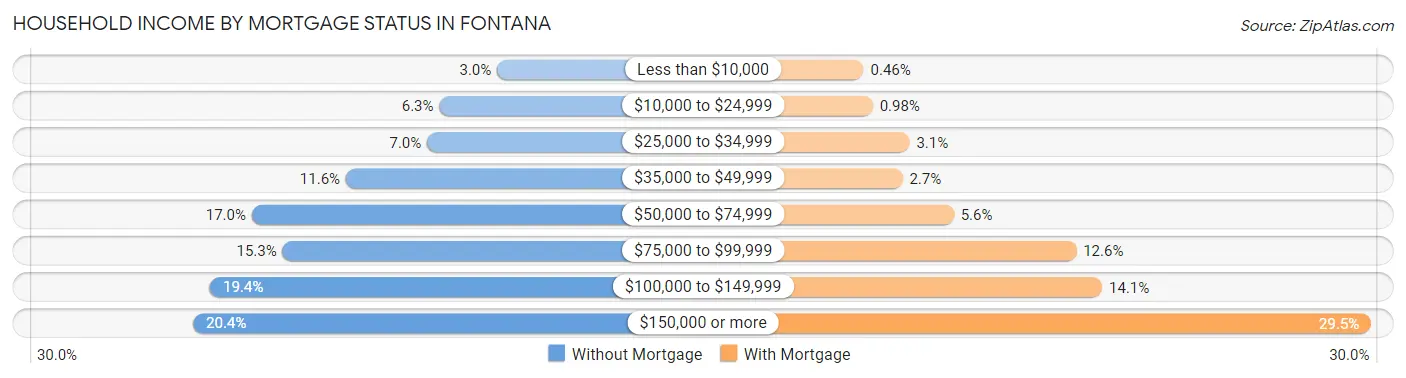
| Household Income | Without Mortgage | With Mortgage |
| Less than $10,000 | 214 (3.0%) | 138 (0.5%) |
| $10,000 to $24,999 | 449 (6.3%) | 296 (1.0%) |
| $25,000 to $34,999 | 499 (7.0%) | 927 (3.1%) |
| $35,000 to $49,999 | 830 (11.6%) | 806 (2.7%) |
| $50,000 to $74,999 | 1,213 (17.0%) | 1,688 (5.6%) |
| $75,000 to $99,999 | 1,088 (15.3%) | 3,795 (12.6%) |
| $100,000 to $149,999 | 1,383 (19.4%) | 4,239 (14.1%) |
| $150,000 or more | 1,452 (20.4%) | 8,862 (29.5%) |
| Total | 7,128 (100.0%) | 30,086 (100.0%) |
Property Value to Household Income Ratio in Fontana
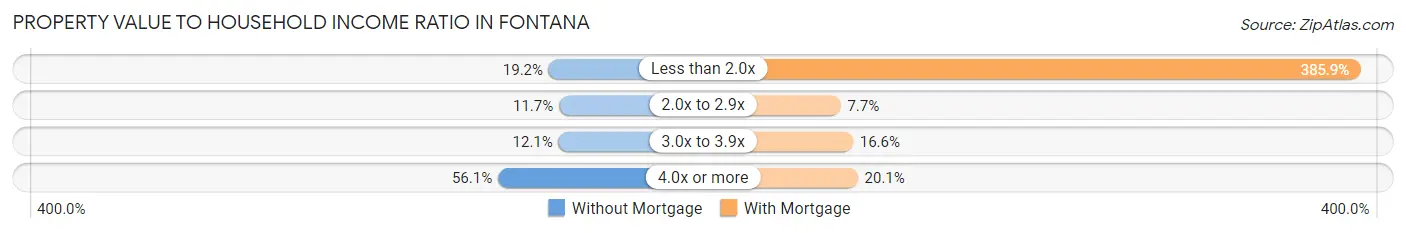
| Value-to-Income Ratio | Without Mortgage | With Mortgage |
| Less than 2.0x | 1,365 (19.2%) | 116,109 (385.9%) |
| 2.0x to 2.9x | 837 (11.7%) | 2,301 (7.6%) |
| 3.0x to 3.9x | 859 (12.0%) | 4,992 (16.6%) |
| 4.0x or more | 4,000 (56.1%) | 6,051 (20.1%) |
| Total | 7,128 (100.0%) | 30,086 (100.0%) |
Real Estate Taxes by Mortgage Status in Fontana
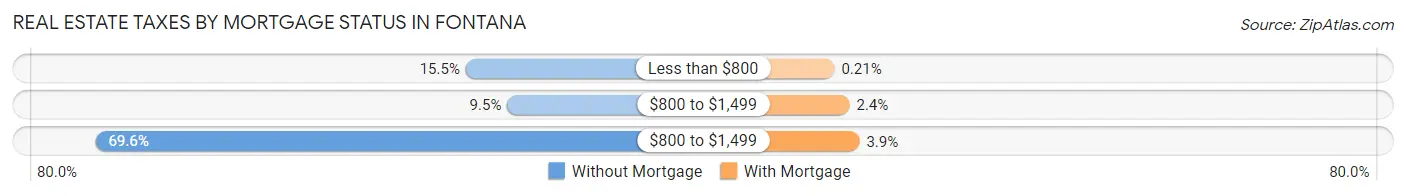
| Property Taxes | Without Mortgage | With Mortgage |
| Less than $800 | 1,108 (15.5%) | 62 (0.2%) |
| $800 to $1,499 | 676 (9.5%) | 724 (2.4%) |
| $800 to $1,499 | 4,964 (69.6%) | 1,161 (3.9%) |
| Total | 7,128 (100.0%) | 30,086 (100.0%) |
Health & Disability in Fontana
Health Insurance Coverage by Age in Fontana
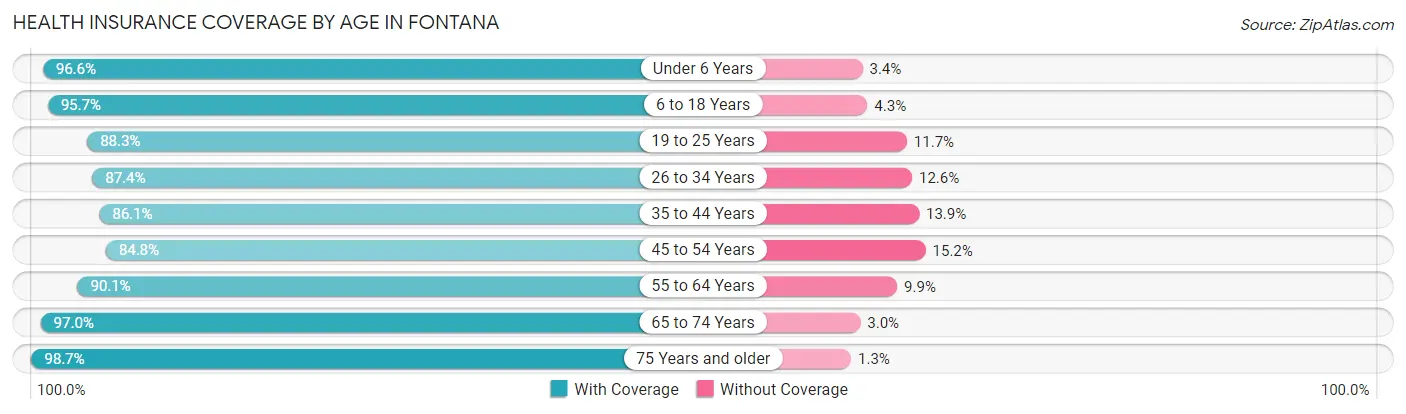
| Age Bracket | With Coverage | Without Coverage |
| Under 6 Years | 15,039 (96.6%) | 529 (3.4%) |
| 6 to 18 Years | 44,698 (95.7%) | 2,014 (4.3%) |
| 19 to 25 Years | 19,448 (88.3%) | 2,573 (11.7%) |
| 26 to 34 Years | 23,665 (87.4%) | 3,421 (12.6%) |
| 35 to 44 Years | 26,583 (86.1%) | 4,306 (13.9%) |
| 45 to 54 Years | 23,934 (84.8%) | 4,277 (15.2%) |
| 55 to 64 Years | 17,986 (90.1%) | 1,968 (9.9%) |
| 65 to 74 Years | 11,904 (97.0%) | 368 (3.0%) |
| 75 Years and older | 5,996 (98.7%) | 77 (1.3%) |
| Total | 189,253 (90.6%) | 19,533 (9.4%) |
Health Insurance Coverage by Citizenship Status in Fontana
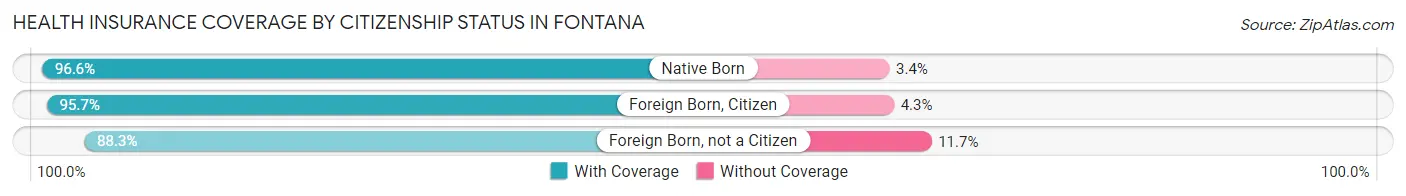
| Citizenship Status | With Coverage | Without Coverage |
| Native Born | 15,039 (96.6%) | 529 (3.4%) |
| Foreign Born, Citizen | 44,698 (95.7%) | 2,014 (4.3%) |
| Foreign Born, not a Citizen | 19,448 (88.3%) | 2,573 (11.7%) |
Health Insurance Coverage by Household Income in Fontana
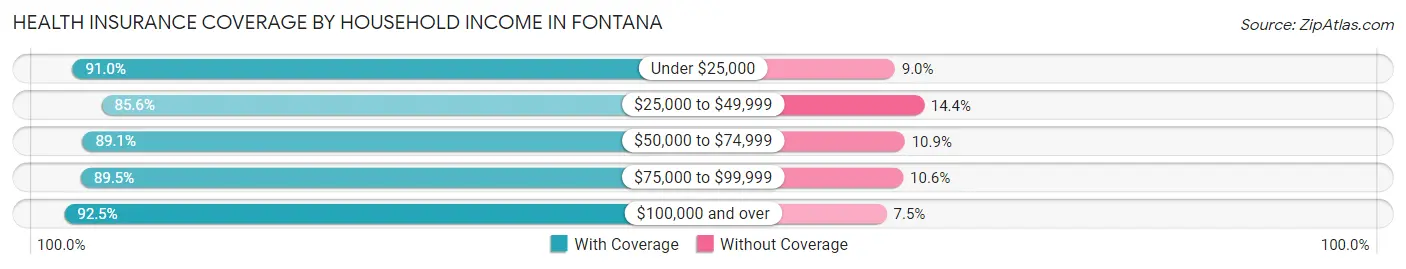
| Household Income | With Coverage | Without Coverage |
| Under $25,000 | 12,876 (91.0%) | 1,272 (9.0%) |
| $25,000 to $49,999 | 21,160 (85.6%) | 3,564 (14.4%) |
| $50,000 to $74,999 | 26,936 (89.1%) | 3,283 (10.9%) |
| $75,000 to $99,999 | 28,082 (89.4%) | 3,312 (10.5%) |
| $100,000 and over | 99,868 (92.5%) | 8,045 (7.5%) |
Public vs Private Health Insurance Coverage by Age in Fontana
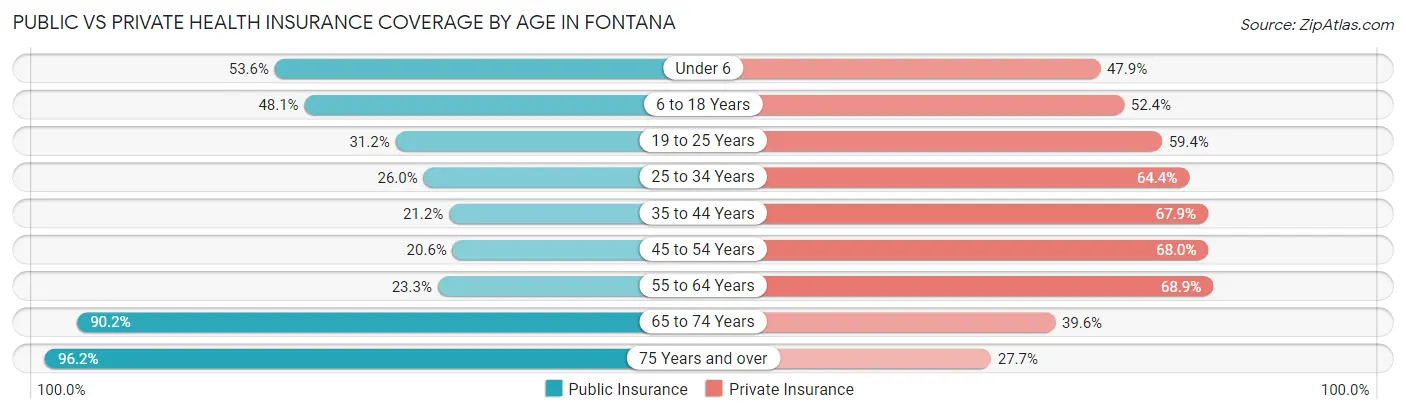
| Age Bracket | Public Insurance | Private Insurance |
| Under 6 | 8,338 (53.6%) | 7,460 (47.9%) |
| 6 to 18 Years | 22,448 (48.1%) | 24,459 (52.4%) |
| 19 to 25 Years | 6,861 (31.2%) | 13,076 (59.4%) |
| 25 to 34 Years | 7,029 (26.0%) | 17,454 (64.4%) |
| 35 to 44 Years | 6,557 (21.2%) | 20,985 (67.9%) |
| 45 to 54 Years | 5,798 (20.5%) | 19,193 (68.0%) |
| 55 to 64 Years | 4,654 (23.3%) | 13,748 (68.9%) |
| 65 to 74 Years | 11,072 (90.2%) | 4,855 (39.6%) |
| 75 Years and over | 5,842 (96.2%) | 1,680 (27.7%) |
| Total | 78,599 (37.7%) | 122,910 (58.9%) |
Disability Status by Sex by Age in Fontana
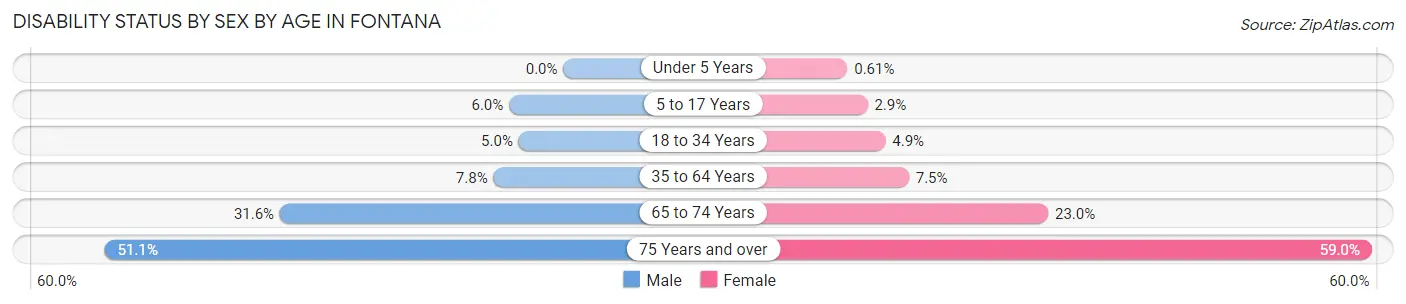
| Age Bracket | Male | Female |
| Under 5 Years | 0 (0.0%) | 36 (0.6%) |
| 5 to 17 Years | 1,429 (6.0%) | 621 (2.9%) |
| 18 to 34 Years | 1,406 (5.0%) | 1,196 (4.9%) |
| 35 to 64 Years | 3,013 (7.8%) | 3,011 (7.5%) |
| 65 to 74 Years | 1,885 (31.6%) | 1,447 (23.0%) |
| 75 Years and over | 1,143 (51.1%) | 2,264 (59.0%) |
Disability Class by Sex by Age in Fontana
Disability Class: Hearing Difficulty
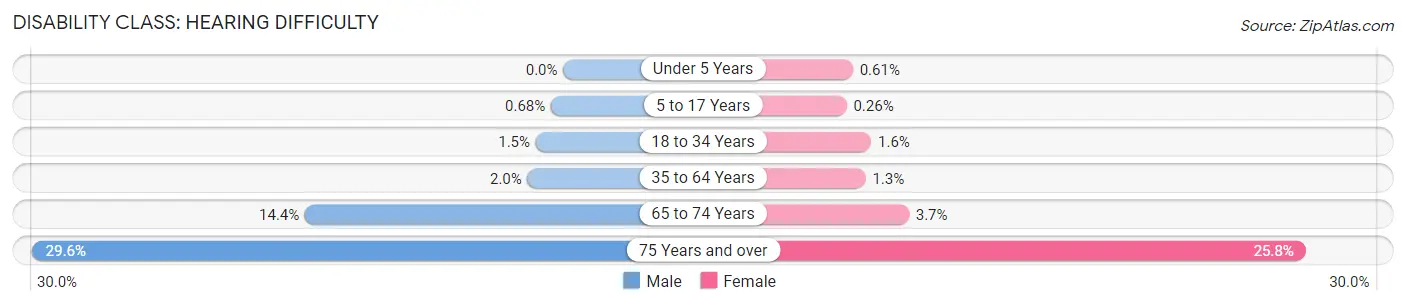
| Age Bracket | Male | Female |
| Under 5 Years | 0 (0.0%) | 36 (0.6%) |
| 5 to 17 Years | 161 (0.7%) | 56 (0.3%) |
| 18 to 34 Years | 434 (1.5%) | 402 (1.6%) |
| 35 to 64 Years | 769 (2.0%) | 534 (1.3%) |
| 65 to 74 Years | 859 (14.4%) | 235 (3.7%) |
| 75 Years and over | 661 (29.5%) | 991 (25.8%) |
Disability Class: Vision Difficulty
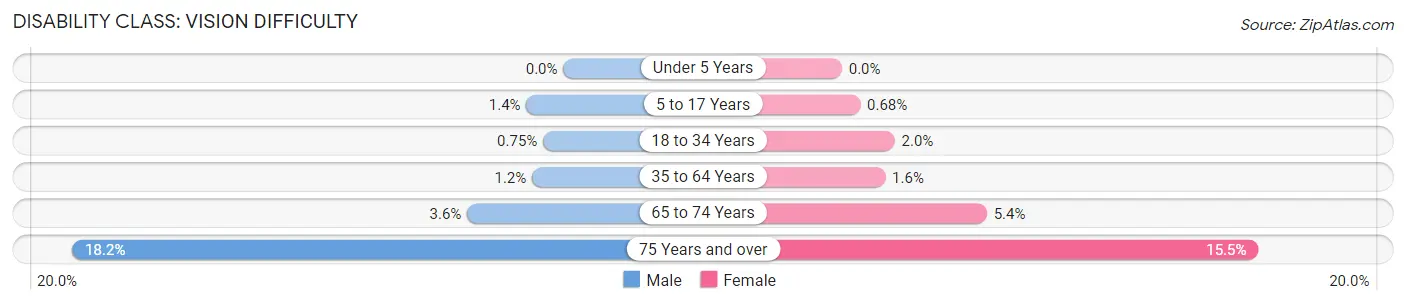
| Age Bracket | Male | Female |
| Under 5 Years | 0 (0.0%) | 0 (0.0%) |
| 5 to 17 Years | 324 (1.4%) | 148 (0.7%) |
| 18 to 34 Years | 213 (0.7%) | 482 (2.0%) |
| 35 to 64 Years | 448 (1.2%) | 651 (1.6%) |
| 65 to 74 Years | 213 (3.6%) | 339 (5.4%) |
| 75 Years and over | 408 (18.2%) | 593 (15.5%) |
Disability Class: Cognitive Difficulty
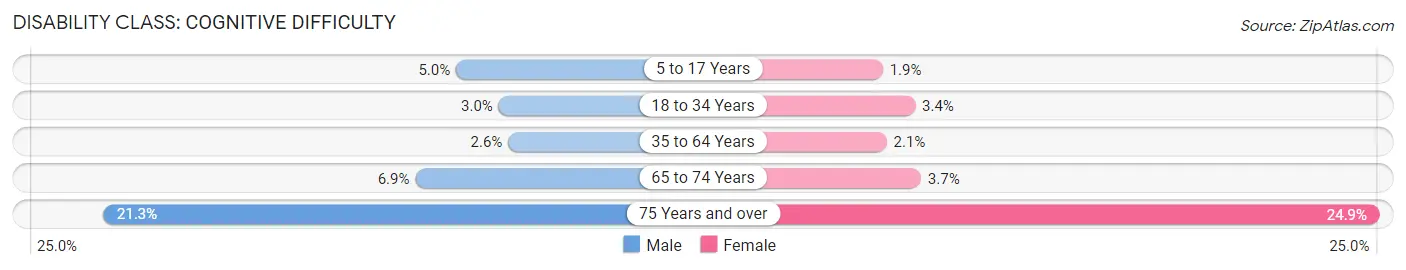
| Age Bracket | Male | Female |
| 5 to 17 Years | 1,179 (5.0%) | 413 (1.9%) |
| 18 to 34 Years | 848 (3.0%) | 838 (3.4%) |
| 35 to 64 Years | 992 (2.6%) | 840 (2.1%) |
| 65 to 74 Years | 410 (6.9%) | 231 (3.7%) |
| 75 Years and over | 477 (21.3%) | 956 (24.9%) |
Disability Class: Ambulatory Difficulty
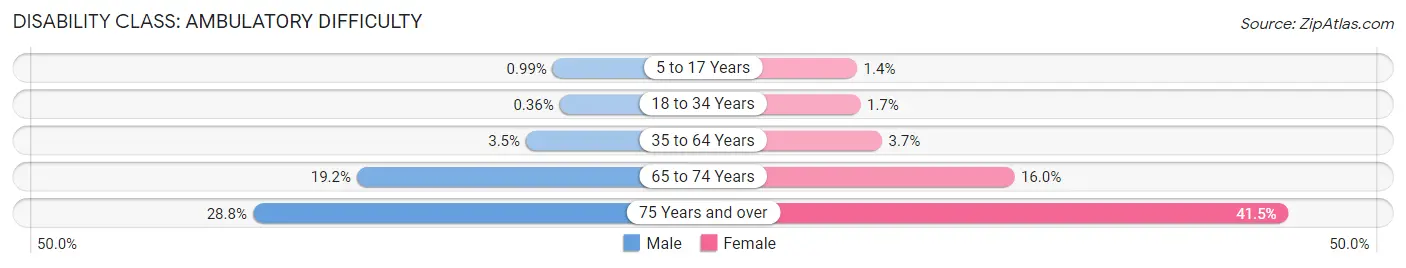
| Age Bracket | Male | Female |
| 5 to 17 Years | 235 (1.0%) | 299 (1.4%) |
| 18 to 34 Years | 102 (0.4%) | 416 (1.7%) |
| 35 to 64 Years | 1,346 (3.5%) | 1,488 (3.7%) |
| 65 to 74 Years | 1,145 (19.2%) | 1,007 (16.0%) |
| 75 Years and over | 645 (28.8%) | 1,590 (41.4%) |
Disability Class: Self-Care Difficulty
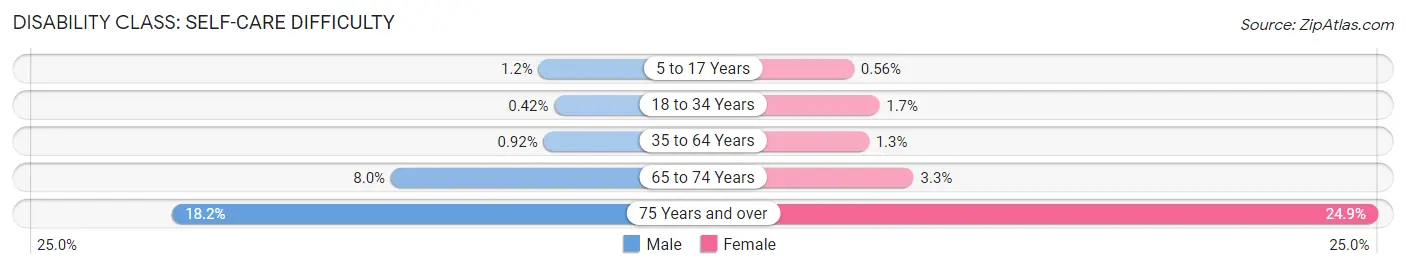
| Age Bracket | Male | Female |
| 5 to 17 Years | 271 (1.1%) | 121 (0.6%) |
| 18 to 34 Years | 118 (0.4%) | 430 (1.7%) |
| 35 to 64 Years | 358 (0.9%) | 505 (1.3%) |
| 65 to 74 Years | 478 (8.0%) | 210 (3.3%) |
| 75 Years and over | 406 (18.1%) | 954 (24.9%) |
Technology Access in Fontana
Computing Device Access in Fontana
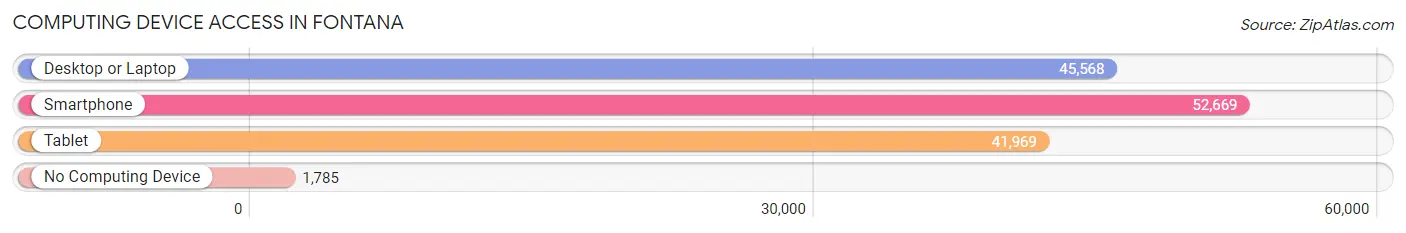
| Device Type | # Households | % Households |
| Desktop or Laptop | 45,568 | 81.6% |
| Smartphone | 52,669 | 94.3% |
| Tablet | 41,969 | 75.1% |
| No Computing Device | 1,785 | 3.2% |
| Total | 55,856 | 100.0% |
Internet Access in Fontana
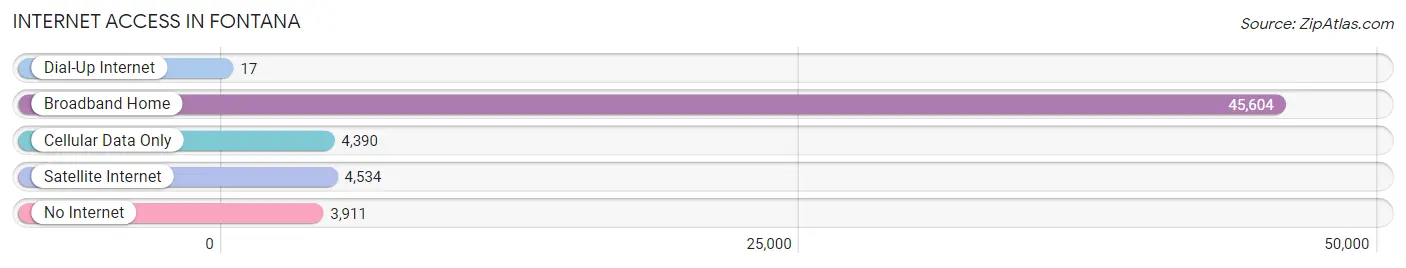
| Internet Type | # Households | % Households |
| Dial-Up Internet | 17 | 0.0% |
| Broadband Home | 45,604 | 81.7% |
| Cellular Data Only | 4,390 | 7.9% |
| Satellite Internet | 4,534 | 8.1% |
| No Internet | 3,911 | 7.0% |
| Total | 55,856 | 100.0% |
Fontana Summary
Fontana is a city located in San Bernardino County, California, United States. The city is situated at the base of the San Gabriel Mountains, and is located approximately 40 miles east of downtown Los Angeles. As of the 2010 census, the city had a population of 196,069, making it the second most populous city in San Bernardino County and the 19th most populous city in California.
History
Fontana was founded in 1913 by Azariel Blanchard Miller, who named the city after his own middle name. Miller was a railroad worker who had been living in the area since 1882. The city was incorporated in 1952, and has since grown to become one of the largest cities in the Inland Empire.
Geography
Fontana is located at 34°7′40″N 117°26′54″W (34.127778, -117.448889). According to the United States Census Bureau, the city has a total area of 94.3 square miles (244.2 km2), of which 94.2 square miles (244.1 km2) is land and 0.1 square miles (0.2 km2) (0.11%) is water.
Economy
Fontana is home to a variety of businesses and industries, including automotive, manufacturing, logistics, and retail. The city is also home to the Fontana Auto Club Speedway, which hosts NASCAR and other racing events.
Demographics
As of the 2010 census, Fontana had a population of 196,069. The racial makeup of the city was 57.2% White, 8.2% African American, 1.1% Native American, 5.3% Asian, 0.5% Pacific Islander, 25.2% from other races, and 3.5% from two or more races. Hispanic or Latino of any race were 50.2% of the population.
The median income for a household in the city was $50,845, and the median income for a family was $56,845. Males had a median income of $41,845 versus $31,845 for females. The per capita income for the city was $22,845. About 11.2% of families and 14.2% of the population were below the poverty line, including 19.2% of those under age 18 and 9.2% of those age 65 or over.
Common Questions
What is Per Capita Income in Fontana?
Per Capita income in Fontana is $30,351.
What is the Median Family Income in Fontana?
Median Family Income in Fontana is $94,675.
What is the Median Household income in Fontana?
Median Household Income in Fontana is $93,230.
What is Income or Wage Gap in Fontana?
Income or Wage Gap in Fontana is 23.4%.
Women in Fontana earn 76.6 cents for every dollar earned by a man.
What is Family Income Deficit in Fontana?
Family Income Deficit in Fontana is $11,575.
Families that are below poverty line in Fontana earn $11,575 less on average than the poverty threshold level.
What is Inequality or Gini Index in Fontana?
Inequality or Gini Index in Fontana is 0.38.
What is the Total Population of Fontana?
Total Population of Fontana is 209,279.
What is the Total Male Population of Fontana?
Total Male Population of Fontana is 106,346.
What is the Total Female Population of Fontana?
Total Female Population of Fontana is 102,933.
What is the Ratio of Males per 100 Females in Fontana?
There are 103.32 Males per 100 Females in Fontana.
What is the Ratio of Females per 100 Males in Fontana?
There are 96.79 Females per 100 Males in Fontana.
What is the Median Population Age in Fontana?
Median Population Age in Fontana is 32.6 Years.
What is the Average Family Size in Fontana
Average Family Size in Fontana is 4.0 People.
What is the Average Household Size in Fontana
Average Household Size in Fontana is 3.7 People.
How Large is the Labor Force in Fontana?
There are 106,051 People in the Labor Forcein in Fontana.
What is the Percentage of People in the Labor Force in Fontana?
66.9% of People are in the Labor Force in Fontana.
What is the Unemployment Rate in Fontana?
Unemployment Rate in Fontana is 6.2%.