San Marcos, CA Map & Demographics
San Marcos Map
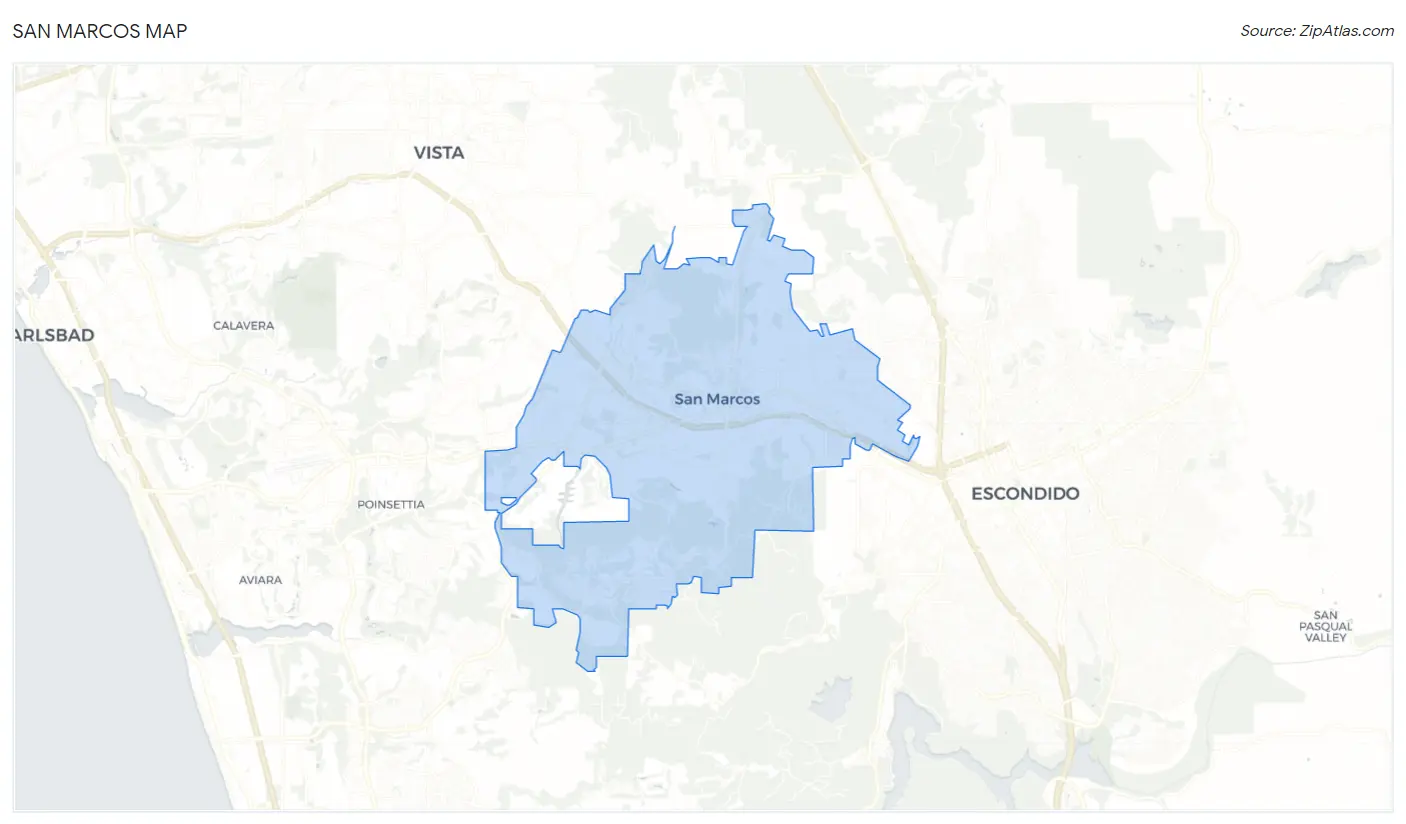
San Marcos Overview
$42,194
PER CAPITA INCOME
$119,616
AVG FAMILY INCOME
$99,413
AVG HOUSEHOLD INCOME
28.7%
WAGE / INCOME GAP [ % ]
71.3¢/ $1
WAGE / INCOME GAP [ $ ]
$9,592
FAMILY INCOME DEFICIT
0.45
INEQUALITY / GINI INDEX
94,360
TOTAL POPULATION
47,444
MALE POPULATION
46,916
FEMALE POPULATION
101.13
MALES / 100 FEMALES
98.89
FEMALES / 100 MALES
35.9
MEDIAN AGE
3.5
AVG FAMILY SIZE
3.0
AVG HOUSEHOLD SIZE
47,439
LABOR FORCE [ PEOPLE ]
65.6%
PERCENT IN LABOR FORCE
4.2%
UNEMPLOYMENT RATE
San Marcos Area Codes
Income in San Marcos
Income Overview in San Marcos
Per Capita Income in San Marcos is $42,194, while median incomes of families and households are $119,616 and $99,413 respectively.
| Characteristic | Number | Measure |
| Per Capita Income | 94,360 | $42,194 |
| Median Family Income | 22,401 | $119,616 |
| Mean Family Income | 22,401 | $143,817 |
| Median Household Income | 30,503 | $99,413 |
| Mean Household Income | 30,503 | $126,652 |
| Income Deficit | 22,401 | $9,592 |
| Wage / Income Gap (%) | 94,360 | 28.75% |
| Wage / Income Gap ($) | 94,360 | 71.25¢ per $1 |
| Gini / Inequality Index | 94,360 | 0.45 |
Earnings by Sex in San Marcos
Average Earnings in San Marcos are $45,053, $51,859 for men and $36,951 for women, a difference of 28.7%.
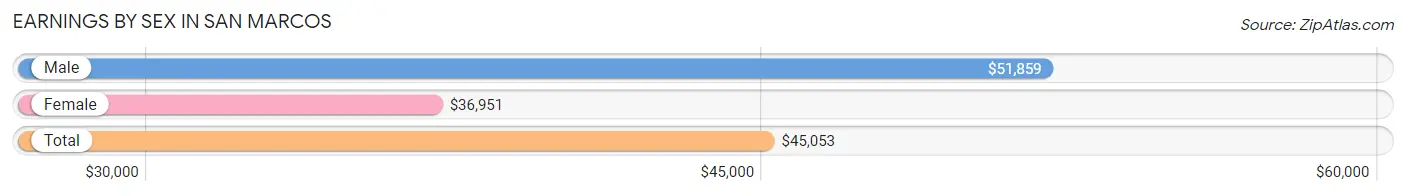
| Sex | Number | Average Earnings |
| Male | 26,830 (54.2%) | $51,859 |
| Female | 22,691 (45.8%) | $36,951 |
| Total | 49,521 (100.0%) | $45,053 |
Earnings by Sex by Income Bracket in San Marcos
The most common earnings brackets in San Marcos are $100,000+ for men (7,445 | 27.8%) and $100,000+ for women (3,427 | 15.1%).
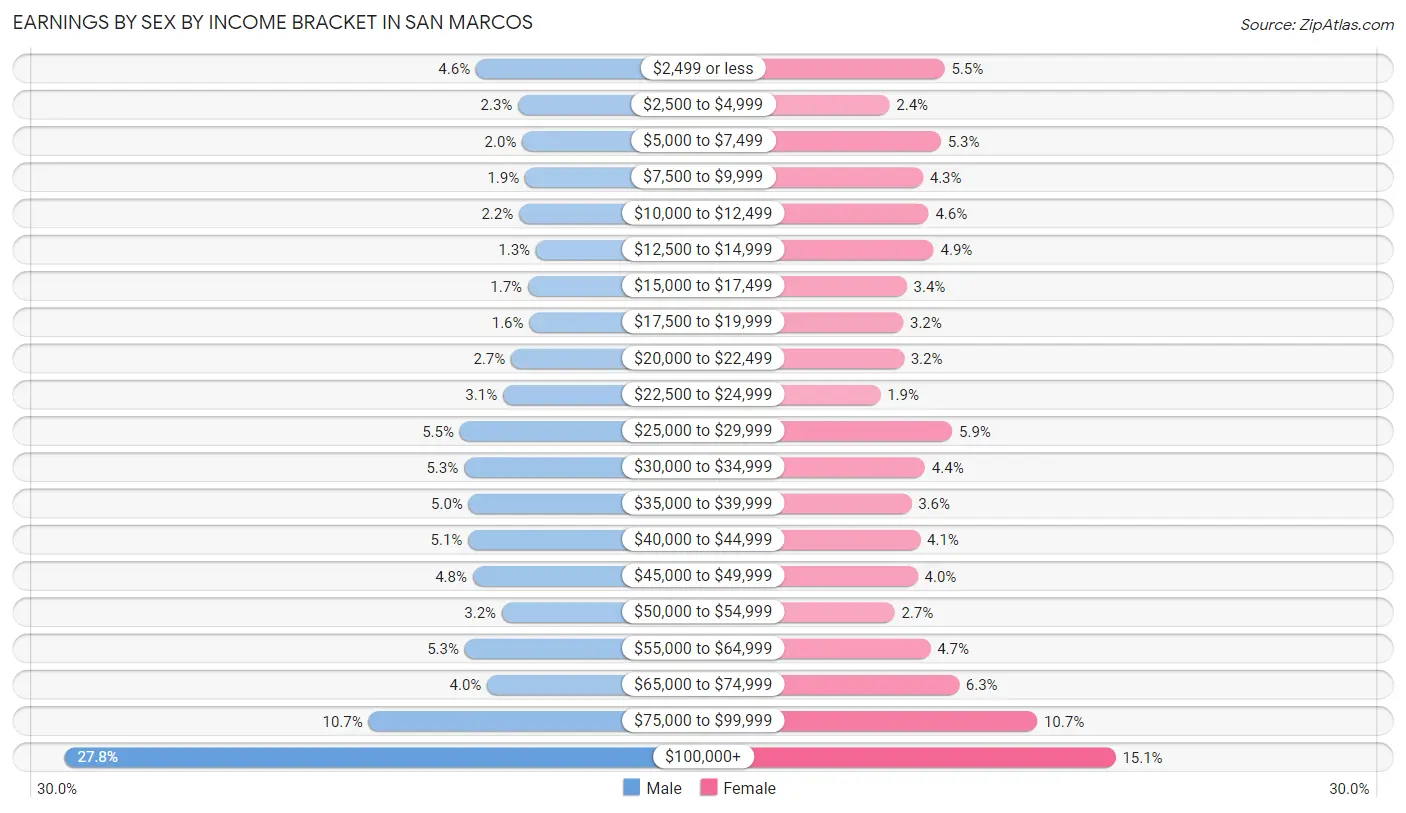
| Income | Male | Female |
| $2,499 or less | 1,243 (4.6%) | 1,245 (5.5%) |
| $2,500 to $4,999 | 607 (2.3%) | 543 (2.4%) |
| $5,000 to $7,499 | 545 (2.0%) | 1,198 (5.3%) |
| $7,500 to $9,999 | 502 (1.9%) | 970 (4.3%) |
| $10,000 to $12,499 | 593 (2.2%) | 1,042 (4.6%) |
| $12,500 to $14,999 | 337 (1.3%) | 1,108 (4.9%) |
| $15,000 to $17,499 | 460 (1.7%) | 763 (3.4%) |
| $17,500 to $19,999 | 438 (1.6%) | 717 (3.2%) |
| $20,000 to $22,499 | 715 (2.7%) | 726 (3.2%) |
| $22,500 to $24,999 | 835 (3.1%) | 426 (1.9%) |
| $25,000 to $29,999 | 1,487 (5.5%) | 1,343 (5.9%) |
| $30,000 to $34,999 | 1,421 (5.3%) | 996 (4.4%) |
| $35,000 to $39,999 | 1,352 (5.0%) | 821 (3.6%) |
| $40,000 to $44,999 | 1,361 (5.1%) | 936 (4.1%) |
| $45,000 to $49,999 | 1,290 (4.8%) | 902 (4.0%) |
| $50,000 to $54,999 | 850 (3.2%) | 608 (2.7%) |
| $55,000 to $64,999 | 1,411 (5.3%) | 1,065 (4.7%) |
| $65,000 to $74,999 | 1,074 (4.0%) | 1,429 (6.3%) |
| $75,000 to $99,999 | 2,864 (10.7%) | 2,426 (10.7%) |
| $100,000+ | 7,445 (27.8%) | 3,427 (15.1%) |
| Total | 26,830 (100.0%) | 22,691 (100.0%) |
Earnings by Sex by Educational Attainment in San Marcos
Average earnings in San Marcos are $63,111 for men and $47,044 for women, a difference of 25.5%. Men with an educational attainment of graduate degree enjoy the highest average annual earnings of $151,200, while those with less than high school education earn the least with $34,814. Women with an educational attainment of graduate degree earn the most with the average annual earnings of $89,913, while those with less than high school education have the smallest earnings of $19,324.
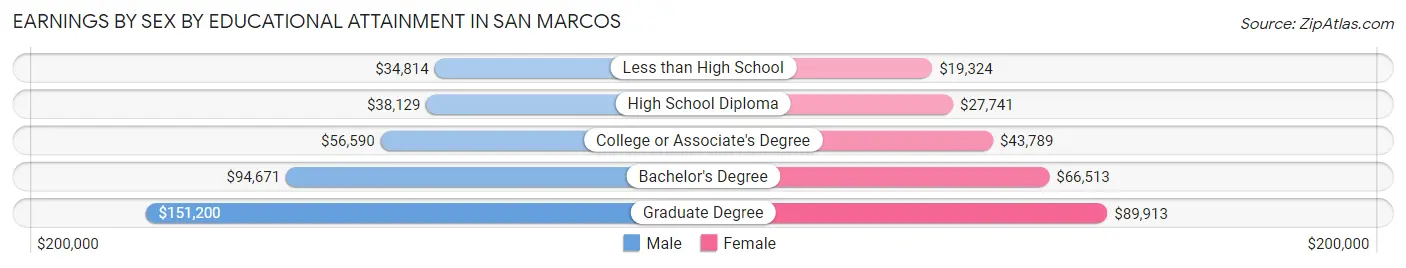
| Educational Attainment | Male Income | Female Income |
| Less than High School | $34,814 | $19,324 |
| High School Diploma | $38,129 | $27,741 |
| College or Associate's Degree | $56,590 | $43,789 |
| Bachelor's Degree | $94,671 | $66,513 |
| Graduate Degree | $151,200 | $89,913 |
| Total | $63,111 | $47,044 |
Family Income in San Marcos
Family Income Brackets in San Marcos
According to the San Marcos family income data, there are 5,555 families falling into the $200,000+ income range, which is the most common income bracket and makes up 24.8% of all families. Conversely, the $10,000 to $14,999 income bracket is the least frequent group with only 269 families (1.2%) belonging to this category.
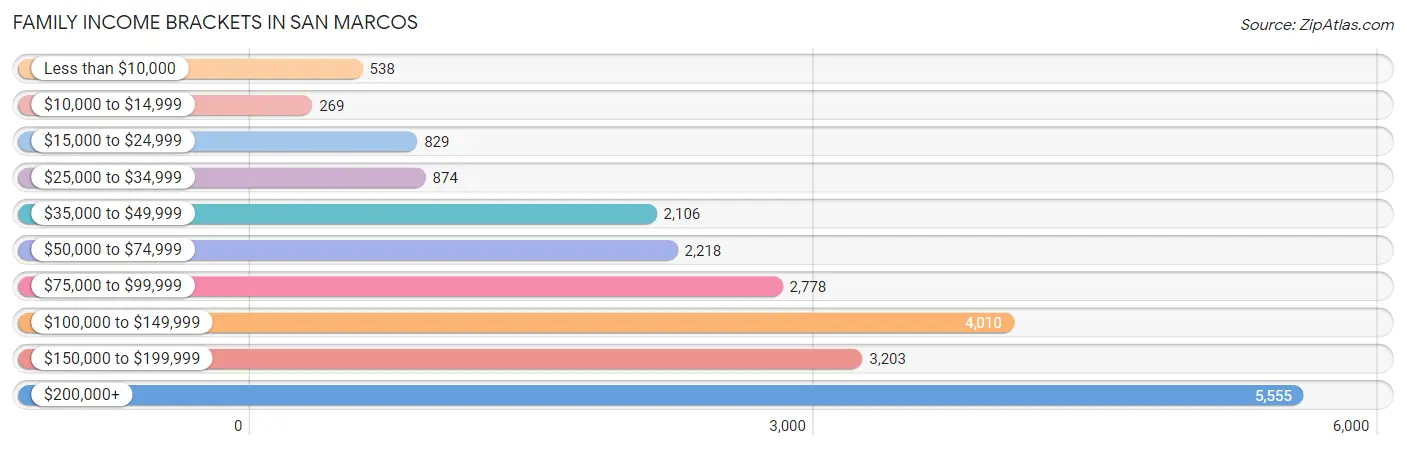
| Income Bracket | # Families | % Families |
| Less than $10,000 | 538 | 2.4% |
| $10,000 to $14,999 | 269 | 1.2% |
| $15,000 to $24,999 | 829 | 3.7% |
| $25,000 to $34,999 | 874 | 3.9% |
| $35,000 to $49,999 | 2,106 | 9.4% |
| $50,000 to $74,999 | 2,218 | 9.9% |
| $75,000 to $99,999 | 2,778 | 12.4% |
| $100,000 to $149,999 | 4,010 | 17.9% |
| $150,000 to $199,999 | 3,203 | 14.3% |
| $200,000+ | 5,555 | 24.8% |
Family Income by Famaliy Size in San Marcos
4-person families (5,500 | 24.5%) account for the highest median family income in San Marcos with $158,816 per family, while 2-person families (8,158 | 36.4%) have the highest median income of $44,296 per family member.
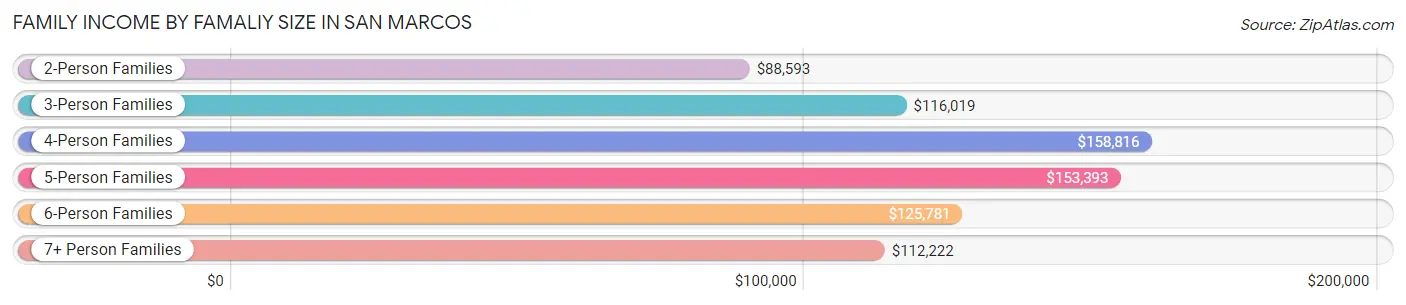
| Income Bracket | # Families | Median Income |
| 2-Person Families | 8,158 (36.4%) | $88,593 |
| 3-Person Families | 4,842 (21.6%) | $116,019 |
| 4-Person Families | 5,500 (24.5%) | $158,816 |
| 5-Person Families | 2,331 (10.4%) | $153,393 |
| 6-Person Families | 982 (4.4%) | $125,781 |
| 7+ Person Families | 588 (2.6%) | $112,222 |
| Total | 22,401 (100.0%) | $119,616 |
Family Income by Number of Earners in San Marcos
The median family income in San Marcos is $119,616, with families comprising 2 earners (9,815) having the highest median family income of $160,558, while families with no earners (2,225) have the lowest median family income of $44,663, accounting for 43.8% and 9.9% of families, respectively.
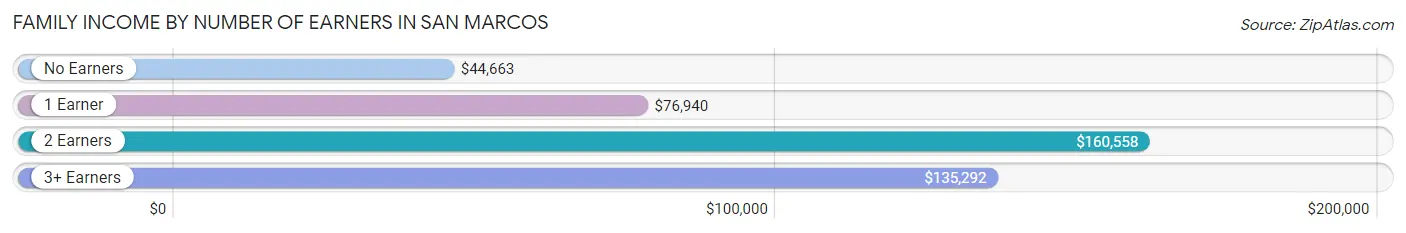
| Number of Earners | # Families | Median Income |
| No Earners | 2,225 (9.9%) | $44,663 |
| 1 Earner | 6,785 (30.3%) | $76,940 |
| 2 Earners | 9,815 (43.8%) | $160,558 |
| 3+ Earners | 3,576 (16.0%) | $135,292 |
| Total | 22,401 (100.0%) | $119,616 |
Household Income in San Marcos
Household Income Brackets in San Marcos
With 6,131 households falling in the category, the $200,000+ income range is the most frequent in San Marcos, accounting for 20.1% of all households. In contrast, only 641 households (2.1%) fall into the $10,000 to $14,999 income bracket, making it the least populous group.
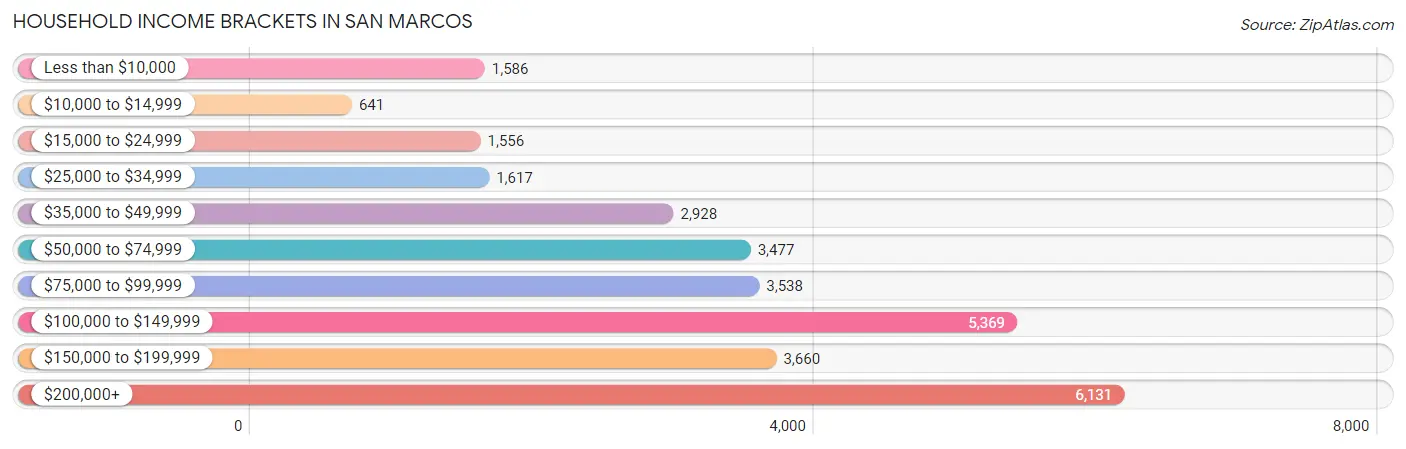
| Income Bracket | # Households | % Households |
| Less than $10,000 | 1,586 | 5.2% |
| $10,000 to $14,999 | 641 | 2.1% |
| $15,000 to $24,999 | 1,556 | 5.1% |
| $25,000 to $34,999 | 1,617 | 5.3% |
| $35,000 to $49,999 | 2,928 | 9.6% |
| $50,000 to $74,999 | 3,477 | 11.4% |
| $75,000 to $99,999 | 3,538 | 11.6% |
| $100,000 to $149,999 | 5,369 | 17.6% |
| $150,000 to $199,999 | 3,660 | 12.0% |
| $200,000+ | 6,131 | 20.1% |
Household Income by Householder Age in San Marcos
The median household income in San Marcos is $99,413, with the highest median household income of $123,569 found in the 25 to 44 years age bracket for the primary householder. A total of 11,228 households (36.8%) fall into this category. Meanwhile, the 15 to 24 years age bracket for the primary householder has the lowest median household income of $52,735, with 921 households (3.0%) in this group.
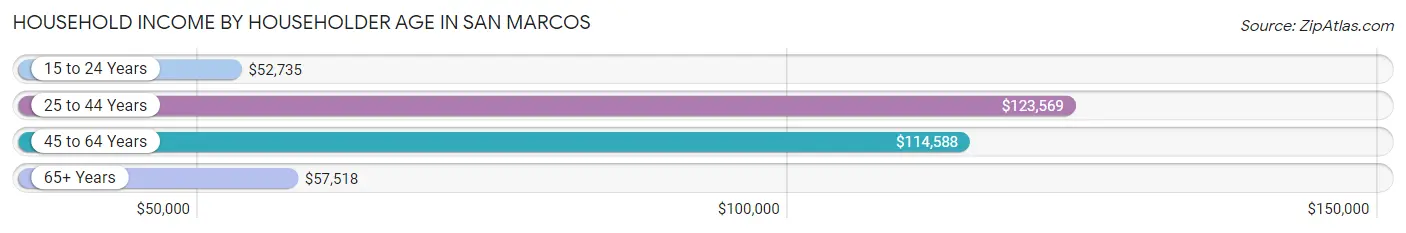
| Income Bracket | # Households | Median Income |
| 15 to 24 Years | 921 (3.0%) | $52,735 |
| 25 to 44 Years | 11,228 (36.8%) | $123,569 |
| 45 to 64 Years | 11,014 (36.1%) | $114,588 |
| 65+ Years | 7,340 (24.1%) | $57,518 |
| Total | 30,503 (100.0%) | $99,413 |
Poverty in San Marcos
Income Below Poverty by Sex and Age in San Marcos
With 8.0% poverty level for males and 11.5% for females among the residents of San Marcos, 18 to 24 year old males and 75 year old and over females are the most vulnerable to poverty, with 715 males (17.5%) and 695 females (21.5%) in their respective age groups living below the poverty level.
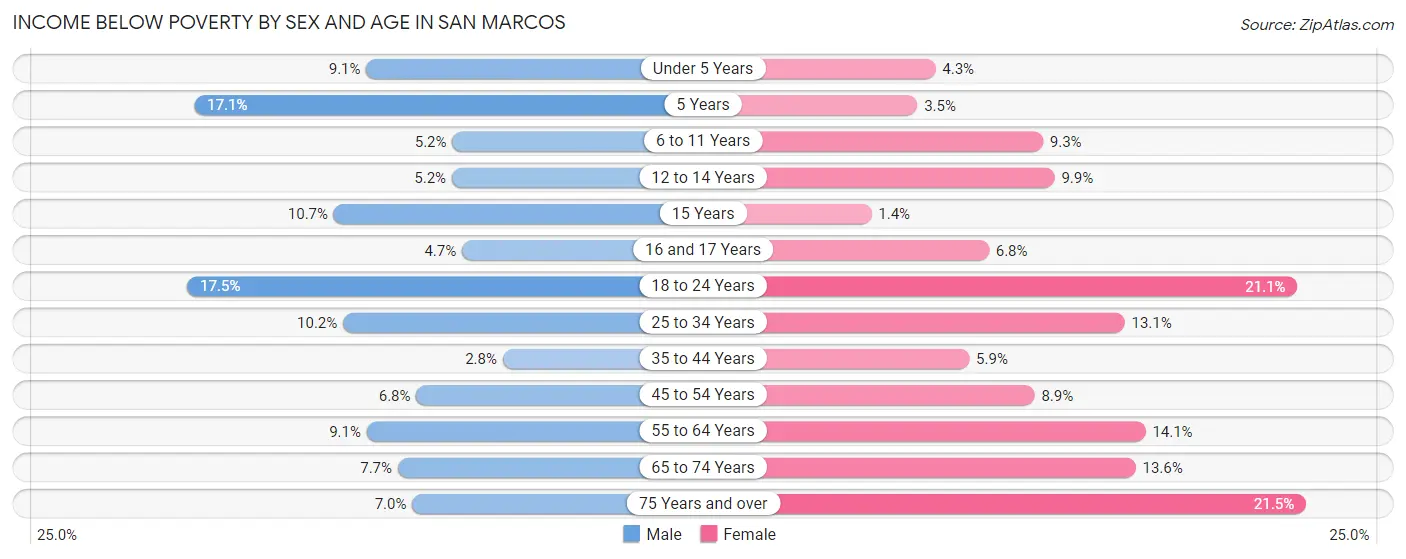
| Age Bracket | Male | Female |
| Under 5 Years | 350 (9.1%) | 116 (4.3%) |
| 5 Years | 99 (17.1%) | 28 (3.5%) |
| 6 to 11 Years | 214 (5.1%) | 360 (9.3%) |
| 12 to 14 Years | 126 (5.2%) | 200 (9.9%) |
| 15 Years | 77 (10.6%) | 9 (1.4%) |
| 16 and 17 Years | 52 (4.7%) | 84 (6.8%) |
| 18 to 24 Years | 715 (17.5%) | 950 (21.1%) |
| 25 to 34 Years | 631 (10.2%) | 740 (13.1%) |
| 35 to 44 Years | 215 (2.8%) | 430 (5.9%) |
| 45 to 54 Years | 391 (6.8%) | 512 (8.9%) |
| 55 to 64 Years | 465 (9.1%) | 675 (14.1%) |
| 65 to 74 Years | 219 (7.7%) | 549 (13.6%) |
| 75 Years and over | 143 (7.0%) | 695 (21.5%) |
| Total | 3,697 (8.0%) | 5,348 (11.5%) |
Income Above Poverty by Sex and Age in San Marcos
According to the poverty statistics in San Marcos, males aged 35 to 44 years and females aged 15 years are the age groups that are most secure financially, with 97.2% of males and 98.6% of females in these age groups living above the poverty line.
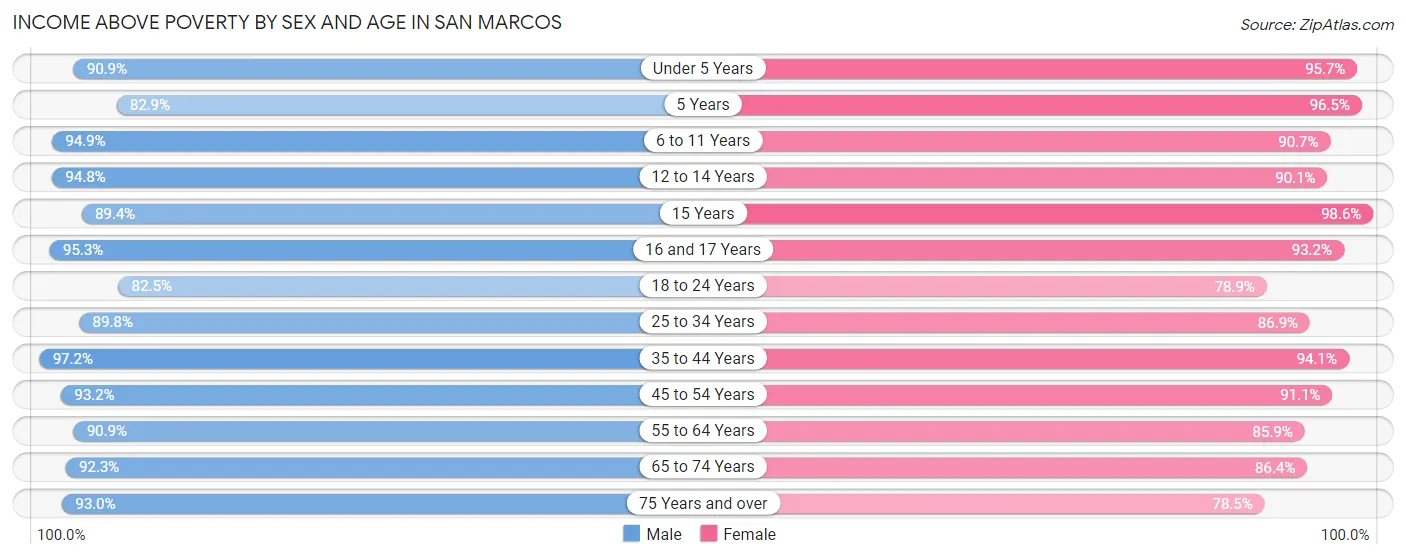
| Age Bracket | Male | Female |
| Under 5 Years | 3,479 (90.9%) | 2,558 (95.7%) |
| 5 Years | 479 (82.9%) | 771 (96.5%) |
| 6 to 11 Years | 3,944 (94.9%) | 3,499 (90.7%) |
| 12 to 14 Years | 2,311 (94.8%) | 1,827 (90.1%) |
| 15 Years | 646 (89.3%) | 649 (98.6%) |
| 16 and 17 Years | 1,055 (95.3%) | 1,147 (93.2%) |
| 18 to 24 Years | 3,381 (82.5%) | 3,544 (78.9%) |
| 25 to 34 Years | 5,544 (89.8%) | 4,902 (86.9%) |
| 35 to 44 Years | 7,433 (97.2%) | 6,847 (94.1%) |
| 45 to 54 Years | 5,344 (93.2%) | 5,218 (91.1%) |
| 55 to 64 Years | 4,636 (90.9%) | 4,115 (85.9%) |
| 65 to 74 Years | 2,631 (92.3%) | 3,478 (86.4%) |
| 75 Years and over | 1,896 (93.0%) | 2,532 (78.5%) |
| Total | 42,779 (92.0%) | 41,087 (88.5%) |
Income Below Poverty Among Married-Couple Families in San Marcos
The poverty statistics for married-couple families in San Marcos show that 4.1% or 708 of the total 17,280 families live below the poverty line. Families with 5 or more children have the highest poverty rate of 20.3%, comprising of 24 families. On the other hand, families with 3 or 4 children have the lowest poverty rate of 3.1%, which includes 47 families.
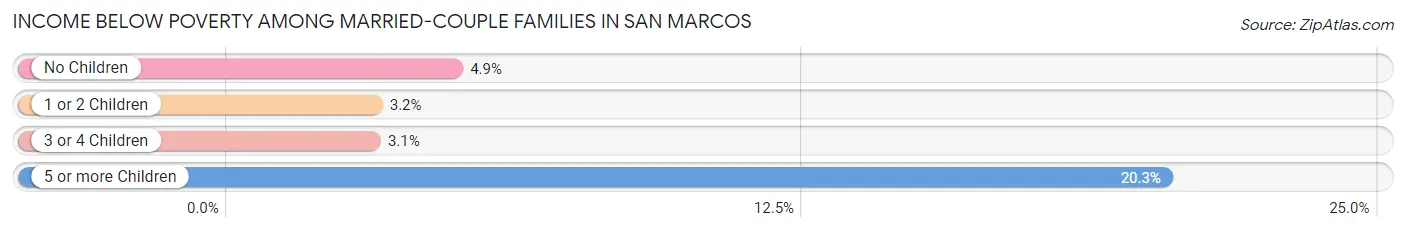
| Children | Above Poverty | Below Poverty |
| No Children | 7,815 (95.1%) | 403 (4.9%) |
| 1 or 2 Children | 7,201 (96.9%) | 234 (3.2%) |
| 3 or 4 Children | 1,462 (96.9%) | 47 (3.1%) |
| 5 or more Children | 94 (79.7%) | 24 (20.3%) |
| Total | 16,572 (95.9%) | 708 (4.1%) |
Income Below Poverty Among Single-Parent Households in San Marcos
According to the poverty data in San Marcos, 12.8% or 170 single-father households and 16.7% or 633 single-mother households are living below the poverty line. Among single-father households, those with 3 or 4 children have the highest poverty rate, with 23 households (52.3%) experiencing poverty. Likewise, among single-mother households, those with 3 or 4 children have the highest poverty rate, with 115 households (28.5%) falling below the poverty line.
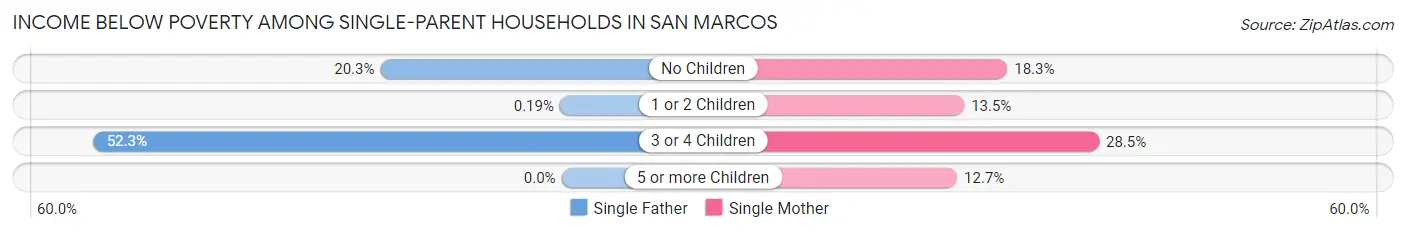
| Children | Single Father | Single Mother |
| No Children | 146 (20.3%) | 236 (18.3%) |
| 1 or 2 Children | 1 (0.2%) | 273 (13.5%) |
| 3 or 4 Children | 23 (52.3%) | 115 (28.5%) |
| 5 or more Children | 0 (0.0%) | 9 (12.7%) |
| Total | 170 (12.8%) | 633 (16.7%) |
Income Below Poverty Among Married-Couple vs Single-Parent Households in San Marcos
The poverty data for San Marcos shows that 708 of the married-couple family households (4.1%) and 803 of the single-parent households (15.7%) are living below the poverty level. Within the married-couple family households, those with 5 or more children have the highest poverty rate, with 24 households (20.3%) falling below the poverty line. Among the single-parent households, those with 3 or 4 children have the highest poverty rate, with 138 household (30.9%) living below poverty.
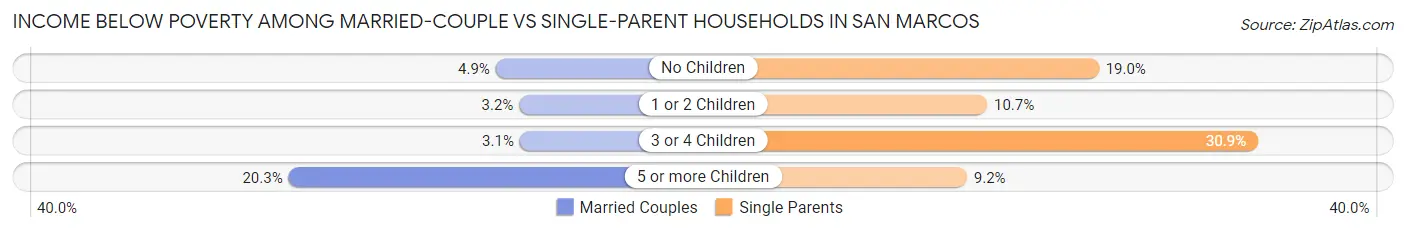
| Children | Married-Couple Families | Single-Parent Households |
| No Children | 403 (4.9%) | 382 (19.0%) |
| 1 or 2 Children | 234 (3.2%) | 274 (10.7%) |
| 3 or 4 Children | 47 (3.1%) | 138 (30.9%) |
| 5 or more Children | 24 (20.3%) | 9 (9.2%) |
| Total | 708 (4.1%) | 803 (15.7%) |
Race in San Marcos
The most populous races in San Marcos are White / Caucasian (57,078 | 60.5%), Hispanic or Latino (37,533 | 39.8%), and Two or more Races (14,755 | 15.6%).
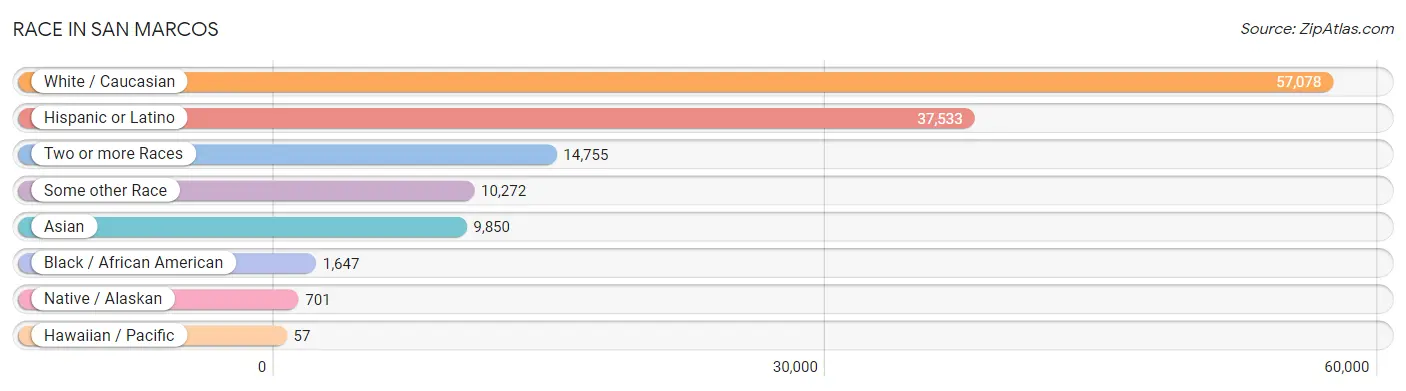
| Race | # Population | % Population |
| Asian | 9,850 | 10.4% |
| Black / African American | 1,647 | 1.8% |
| Hawaiian / Pacific | 57 | 0.1% |
| Hispanic or Latino | 37,533 | 39.8% |
| Native / Alaskan | 701 | 0.7% |
| White / Caucasian | 57,078 | 60.5% |
| Two or more Races | 14,755 | 15.6% |
| Some other Race | 10,272 | 10.9% |
| Total | 94,360 | 100.0% |
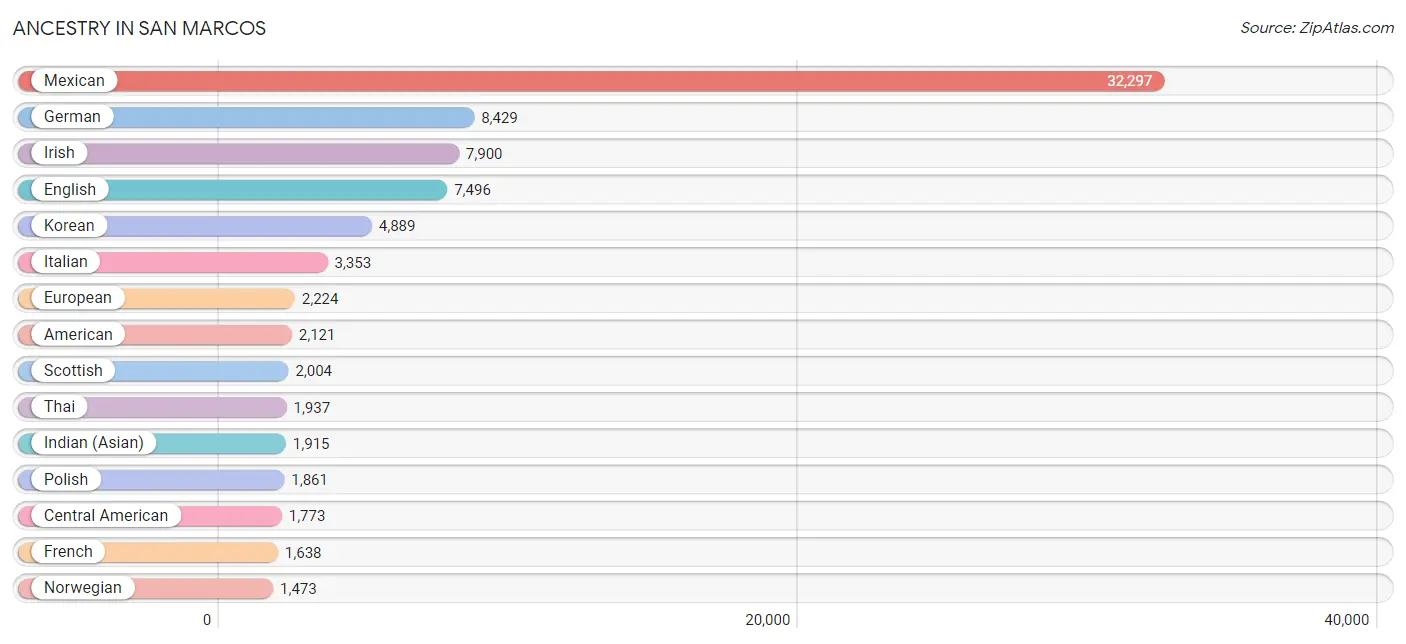
Ancestry in San Marcos
The most populous ancestries reported in San Marcos are Mexican (32,297 | 34.2%), German (8,429 | 8.9%), Irish (7,900 | 8.4%), English (7,496 | 7.9%), and Korean (4,889 | 5.2%), together accounting for 64.6% of all San Marcos residents.
| Ancestry | # Population | % Population |
| Afghan | 90 | 0.1% |
| African | 92 | 0.1% |
| American | 2,121 | 2.2% |
| Arab | 803 | 0.9% |
| Argentinean | 132 | 0.1% |
| Armenian | 190 | 0.2% |
| Assyrian / Chaldean / Syriac | 33 | 0.0% |
| Australian | 120 | 0.1% |
| Austrian | 232 | 0.3% |
| Bangladeshi | 8 | 0.0% |
| Barbadian | 34 | 0.0% |
| Belgian | 34 | 0.0% |
| Belizean | 81 | 0.1% |
| Bhutanese | 962 | 1.0% |
| Blackfeet | 55 | 0.1% |
| Brazilian | 146 | 0.2% |
| British | 366 | 0.4% |
| Bulgarian | 61 | 0.1% |
| Burmese | 772 | 0.8% |
| Canadian | 310 | 0.3% |
| Celtic | 40 | 0.0% |
| Central American | 1,773 | 1.9% |
| Central American Indian | 503 | 0.5% |
| Cherokee | 127 | 0.1% |
| Chilean | 434 | 0.5% |
| Chinese | 39 | 0.0% |
| Choctaw | 13 | 0.0% |
| Colombian | 137 | 0.2% |
| Costa Rican | 12 | 0.0% |
| Creek | 6 | 0.0% |
| Croatian | 169 | 0.2% |
| Cuban | 221 | 0.2% |
| Czech | 275 | 0.3% |
| Czechoslovakian | 92 | 0.1% |
| Danish | 538 | 0.6% |
| Dominican | 9 | 0.0% |
| Dutch | 804 | 0.9% |
| Eastern European | 138 | 0.2% |
| Ecuadorian | 155 | 0.2% |
| Egyptian | 396 | 0.4% |
| English | 7,496 | 7.9% |
| European | 2,224 | 2.4% |
| Fijian | 128 | 0.1% |
| Filipino | 177 | 0.2% |
| Finnish | 79 | 0.1% |
| French | 1,638 | 1.7% |
| French Canadian | 454 | 0.5% |
| German | 8,429 | 8.9% |
| Ghanaian | 9 | 0.0% |
| Greek | 421 | 0.4% |
| Guamanian / Chamorro | 14 | 0.0% |
| Guatemalan | 286 | 0.3% |
| Honduran | 317 | 0.3% |
| Hungarian | 392 | 0.4% |
| Icelander | 17 | 0.0% |
| Indian (Asian) | 1,915 | 2.0% |
| Iranian | 771 | 0.8% |
| Iraqi | 33 | 0.0% |
| Irish | 7,900 | 8.4% |
| Italian | 3,353 | 3.5% |
| Jamaican | 30 | 0.0% |
| Japanese | 71 | 0.1% |
| Jordanian | 6 | 0.0% |
| Korean | 4,889 | 5.2% |
| Laotian | 583 | 0.6% |
| Latvian | 31 | 0.0% |
| Lebanese | 146 | 0.2% |
| Lithuanian | 126 | 0.1% |
| Malaysian | 150 | 0.2% |
| Maltese | 22 | 0.0% |
| Mexican | 32,297 | 34.2% |
| Mexican American Indian | 527 | 0.6% |
| Mongolian | 15 | 0.0% |
| Moroccan | 20 | 0.0% |
| Native Hawaiian | 176 | 0.2% |
| Navajo | 25 | 0.0% |
| New Zealander | 67 | 0.1% |
| Nicaraguan | 435 | 0.5% |
| Nigerian | 11 | 0.0% |
| Northern European | 179 | 0.2% |
| Norwegian | 1,473 | 1.6% |
| Okinawan | 56 | 0.1% |
| Pakistani | 78 | 0.1% |
| Palestinian | 19 | 0.0% |
| Panamanian | 132 | 0.1% |
| Pennsylvania German | 43 | 0.1% |
| Peruvian | 206 | 0.2% |
| Pima | 79 | 0.1% |
| Polish | 1,861 | 2.0% |
| Portuguese | 341 | 0.4% |
| Puerto Rican | 443 | 0.5% |
| Romanian | 162 | 0.2% |
| Russian | 1,373 | 1.5% |
| Salvadoran | 447 | 0.5% |
| Samoan | 138 | 0.2% |
| Scandinavian | 218 | 0.2% |
| Scotch-Irish | 589 | 0.6% |
| Scottish | 2,004 | 2.1% |
| Serbian | 254 | 0.3% |
| Sioux | 7 | 0.0% |
| Slavic | 90 | 0.1% |
| Slovak | 132 | 0.1% |
| South African | 6 | 0.0% |
| South American | 1,230 | 1.3% |
| Spaniard | 465 | 0.5% |
| Spanish | 170 | 0.2% |
| Sri Lankan | 1,314 | 1.4% |
| Subsaharan African | 198 | 0.2% |
| Swedish | 813 | 0.9% |
| Swiss | 65 | 0.1% |
| Syrian | 43 | 0.1% |
| Thai | 1,937 | 2.1% |
| Tlingit-Haida | 9 | 0.0% |
| Trinidadian and Tobagonian | 12 | 0.0% |
| Turkish | 9 | 0.0% |
| Ukrainian | 159 | 0.2% |
| Venezuelan | 156 | 0.2% |
| Vietnamese | 136 | 0.1% |
| Welsh | 757 | 0.8% |
| Yaqui | 10 | 0.0% |
| Yugoslavian | 5 | 0.0% | View All 121 Rows |
Immigrants in San Marcos
The most numerous immigrant groups reported in San Marcos came from Latin America (12,575 | 13.3%), Central America (11,962 | 12.7%), Mexico (11,225 | 11.9%), Asia (7,025 | 7.4%), and South Eastern Asia (3,407 | 3.6%), together accounting for 49.0% of all San Marcos residents.
| Immigration Origin | # Population | % Population |
| Afghanistan | 42 | 0.0% |
| Africa | 194 | 0.2% |
| Argentina | 14 | 0.0% |
| Armenia | 22 | 0.0% |
| Asia | 7,025 | 7.4% |
| Australia | 22 | 0.0% |
| Bangladesh | 46 | 0.1% |
| Barbados | 14 | 0.0% |
| Belarus | 34 | 0.0% |
| Belgium | 10 | 0.0% |
| Belize | 21 | 0.0% |
| Bosnia and Herzegovina | 23 | 0.0% |
| Brazil | 115 | 0.1% |
| Bulgaria | 47 | 0.1% |
| Cambodia | 9 | 0.0% |
| Canada | 433 | 0.5% |
| Caribbean | 168 | 0.2% |
| Central America | 11,962 | 12.7% |
| Chile | 7 | 0.0% |
| China | 850 | 0.9% |
| Colombia | 100 | 0.1% |
| Croatia | 22 | 0.0% |
| Cuba | 106 | 0.1% |
| Denmark | 23 | 0.0% |
| Eastern Asia | 1,501 | 1.6% |
| Eastern Europe | 713 | 0.8% |
| Ecuador | 73 | 0.1% |
| Egypt | 136 | 0.1% |
| El Salvador | 90 | 0.1% |
| England | 123 | 0.1% |
| Europe | 1,461 | 1.5% |
| France | 90 | 0.1% |
| Germany | 150 | 0.2% |
| Ghana | 9 | 0.0% |
| Guatemala | 73 | 0.1% |
| Honduras | 210 | 0.2% |
| Hong Kong | 75 | 0.1% |
| Hungary | 47 | 0.1% |
| India | 913 | 1.0% |
| Indonesia | 551 | 0.6% |
| Iran | 638 | 0.7% |
| Iraq | 52 | 0.1% |
| Ireland | 14 | 0.0% |
| Israel | 62 | 0.1% |
| Italy | 31 | 0.0% |
| Jamaica | 48 | 0.1% |
| Japan | 394 | 0.4% |
| Jordan | 6 | 0.0% |
| Kazakhstan | 9 | 0.0% |
| Korea | 257 | 0.3% |
| Laos | 73 | 0.1% |
| Latin America | 12,575 | 13.3% |
| Latvia | 31 | 0.0% |
| Lebanon | 85 | 0.1% |
| Lithuania | 41 | 0.0% |
| Malaysia | 15 | 0.0% |
| Mexico | 11,225 | 11.9% |
| Moldova | 14 | 0.0% |
| Morocco | 9 | 0.0% |
| Nepal | 46 | 0.1% |
| Netherlands | 169 | 0.2% |
| Nicaragua | 217 | 0.2% |
| Nigeria | 11 | 0.0% |
| Northern Africa | 155 | 0.2% |
| Northern Europe | 280 | 0.3% |
| Oceania | 37 | 0.0% |
| Pakistan | 84 | 0.1% |
| Panama | 126 | 0.1% |
| Peru | 80 | 0.1% |
| Philippines | 1,924 | 2.0% |
| Poland | 21 | 0.0% |
| Romania | 79 | 0.1% |
| Russia | 197 | 0.2% |
| Saudi Arabia | 41 | 0.0% |
| Serbia | 113 | 0.1% |
| Singapore | 27 | 0.0% |
| South Africa | 19 | 0.0% |
| South America | 445 | 0.5% |
| South Central Asia | 1,778 | 1.9% |
| South Eastern Asia | 3,407 | 3.6% |
| Southern Europe | 49 | 0.1% |
| Spain | 18 | 0.0% |
| Sudan | 10 | 0.0% |
| Sweden | 75 | 0.1% |
| Syria | 17 | 0.0% |
| Taiwan | 209 | 0.2% |
| Thailand | 18 | 0.0% |
| Turkey | 9 | 0.0% |
| Ukraine | 44 | 0.1% |
| Venezuela | 56 | 0.1% |
| Vietnam | 779 | 0.8% |
| Western Africa | 20 | 0.0% |
| Western Asia | 339 | 0.4% |
| Western Europe | 419 | 0.4% | View All 94 Rows |
Sex and Age in San Marcos
Sex and Age in San Marcos
The most populous age groups in San Marcos are 40 to 44 Years (3,924 | 8.3%) for men and 15 to 19 Years (3,803 | 8.1%) for women.
| Age Bracket | Male | Female |
| Under 5 Years | 3,847 (8.1%) | 2,674 (5.7%) |
| 5 to 9 Years | 3,658 (7.7%) | 3,522 (7.5%) |
| 10 to 14 Years | 3,677 (7.7%) | 3,286 (7.0%) |
| 15 to 19 Years | 3,699 (7.8%) | 3,803 (8.1%) |
| 20 to 24 Years | 2,967 (6.2%) | 2,863 (6.1%) |
| 25 to 29 Years | 3,010 (6.3%) | 2,466 (5.3%) |
| 30 to 34 Years | 3,169 (6.7%) | 3,180 (6.8%) |
| 35 to 39 Years | 3,736 (7.9%) | 3,802 (8.1%) |
| 40 to 44 Years | 3,924 (8.3%) | 3,482 (7.4%) |
| 45 to 49 Years | 3,134 (6.6%) | 2,997 (6.4%) |
| 50 to 54 Years | 2,601 (5.5%) | 2,733 (5.8%) |
| 55 to 59 Years | 2,543 (5.4%) | 2,898 (6.2%) |
| 60 to 64 Years | 2,558 (5.4%) | 1,909 (4.1%) |
| 65 to 69 Years | 1,565 (3.3%) | 2,188 (4.7%) |
| 70 to 74 Years | 1,297 (2.7%) | 1,840 (3.9%) |
| 75 to 79 Years | 979 (2.1%) | 1,163 (2.5%) |
| 80 to 84 Years | 460 (1.0%) | 774 (1.7%) |
| 85 Years and over | 620 (1.3%) | 1,336 (2.9%) |
| Total | 47,444 (100.0%) | 46,916 (100.0%) |
Families and Households in San Marcos
Median Family Size in San Marcos
The median family size in San Marcos is 3.53 persons per family, with single female/mother families (3,791 | 16.9%) accounting for the largest median family size of 3.59 persons per family. On the other hand, single male/father families (1,330 | 5.9%) represent the smallest median family size with 3.22 persons per family.
| Family Type | # Families | Family Size |
| Married-Couple | 17,280 (77.1%) | 3.54 |
| Single Male/Father | 1,330 (5.9%) | 3.22 |
| Single Female/Mother | 3,791 (16.9%) | 3.59 |
| Total Families | 22,401 (100.0%) | 3.53 |
Median Household Size in San Marcos
The median household size in San Marcos is 3.05 persons per household, with single female/mother households (3,791 | 12.4%) accounting for the largest median household size of 3.9 persons per household. non-family households (8,102 | 26.6%) represent the smallest median household size with 1.39 persons per household.
| Household Type | # Households | Household Size |
| Married-Couple | 17,280 (56.7%) | 3.59 |
| Single Male/Father | 1,330 (4.4%) | 3.62 |
| Single Female/Mother | 3,791 (12.4%) | 3.90 |
| Non-family | 8,102 (26.6%) | 1.39 |
| Total Households | 30,503 (100.0%) | 3.05 |
Household Size by Marriage Status in San Marcos
Out of a total of 30,503 households in San Marcos, 22,401 (73.4%) are family households, while 8,102 (26.6%) are nonfamily households. The most numerous type of family households are 2-person households, comprising 7,351, and the most common type of nonfamily households are 1-person households, comprising 6,323.
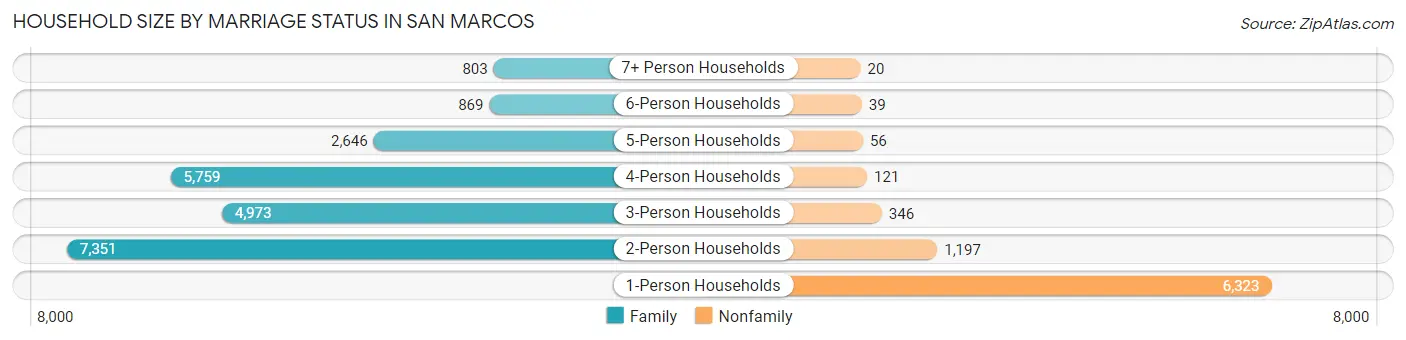
| Household Size | Family Households | Nonfamily Households |
| 1-Person Households | - | 6,323 (20.7%) |
| 2-Person Households | 7,351 (24.1%) | 1,197 (3.9%) |
| 3-Person Households | 4,973 (16.3%) | 346 (1.1%) |
| 4-Person Households | 5,759 (18.9%) | 121 (0.4%) |
| 5-Person Households | 2,646 (8.7%) | 56 (0.2%) |
| 6-Person Households | 869 (2.9%) | 39 (0.1%) |
| 7+ Person Households | 803 (2.6%) | 20 (0.1%) |
| Total | 22,401 (73.4%) | 8,102 (26.6%) |
Female Fertility in San Marcos
Fertility by Age in San Marcos
Average fertility rate in San Marcos is 45.0 births per 1,000 women. Women in the age bracket of 20 to 34 years have the highest fertility rate with 76.0 births per 1,000 women. Women in the age bracket of 20 to 34 years acount for 61.9% of all women with births.
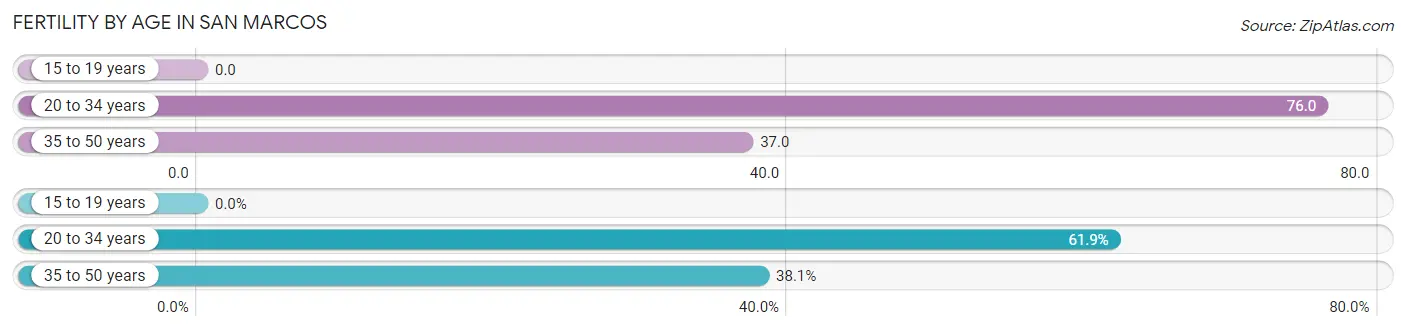
| Age Bracket | Women with Births | Births / 1,000 Women |
| 15 to 19 years | 0 (0.0%) | 0.0 |
| 20 to 34 years | 644 (61.9%) | 76.0 |
| 35 to 50 years | 396 (38.1%) | 37.0 |
| Total | 1,040 (100.0%) | 45.0 |
Fertility by Age by Marriage Status in San Marcos
72.7% of women with births (1,040) in San Marcos are married. The highest percentage of unmarried women with births falls into 20 to 34 years age bracket with 39.8% of them unmarried at the time of birth, while the lowest percentage of unmarried women with births belong to 35 to 50 years age bracket with 7.1% of them unmarried.
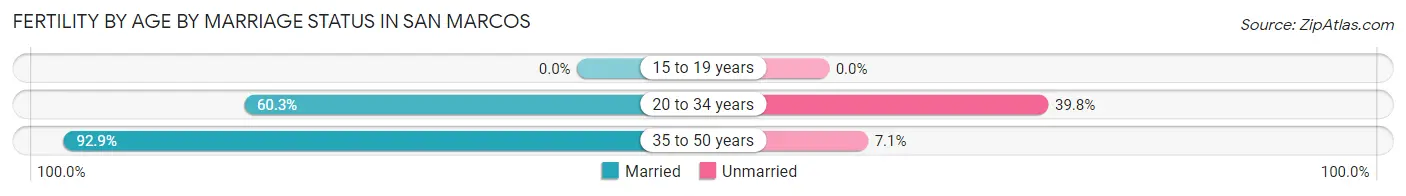
| Age Bracket | Married | Unmarried |
| 15 to 19 years | 0 (0.0%) | 0 (0.0%) |
| 20 to 34 years | 388 (60.3%) | 256 (39.8%) |
| 35 to 50 years | 368 (92.9%) | 28 (7.1%) |
| Total | 756 (72.7%) | 284 (27.3%) |
Fertility by Education in San Marcos
Average fertility rate in San Marcos is 45.0 births per 1,000 women. Women with the education attainment of graduate degree have the highest fertility rate of 58.0 births per 1,000 women, while women with the education attainment of high school diploma have the lowest fertility at 35.0 births per 1,000 women. Women with the education attainment of college or associate's degree represent 27.7% of all women with births.
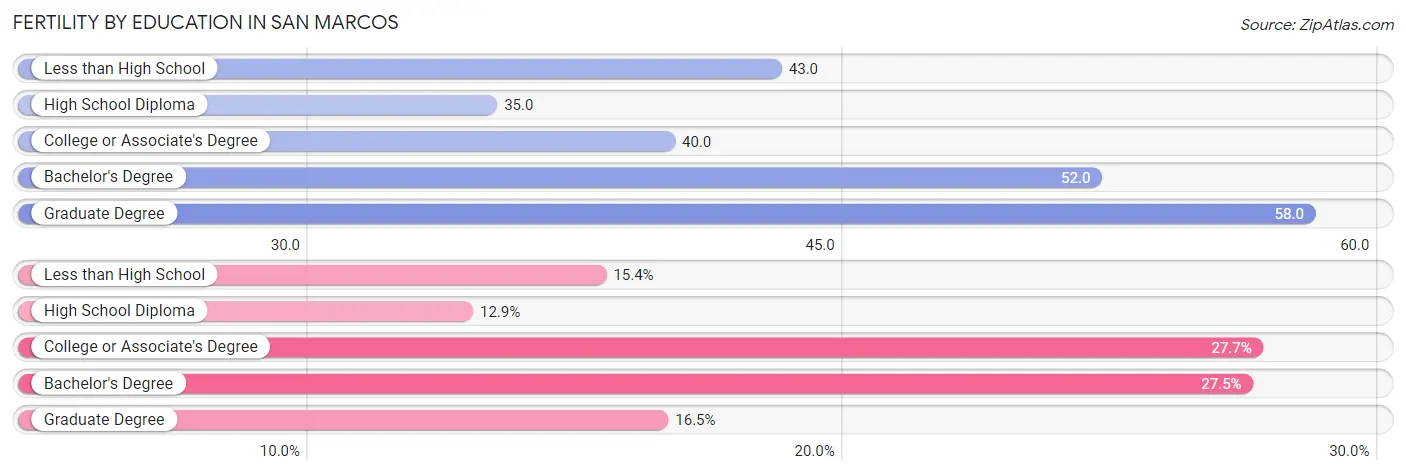
| Educational Attainment | Women with Births | Births / 1,000 Women |
| Less than High School | 160 (15.4%) | 43.0 |
| High School Diploma | 134 (12.9%) | 35.0 |
| College or Associate's Degree | 288 (27.7%) | 40.0 |
| Bachelor's Degree | 286 (27.5%) | 52.0 |
| Graduate Degree | 172 (16.5%) | 58.0 |
| Total | 1,040 (100.0%) | 45.0 |
Fertility by Education by Marriage Status in San Marcos
27.3% of women with births in San Marcos are unmarried. Women with the educational attainment of less than high school are most likely to be married with 100.0% of them married at childbirth, while women with the educational attainment of college or associate's degree are least likely to be married with 60.4% of them unmarried at childbirth.
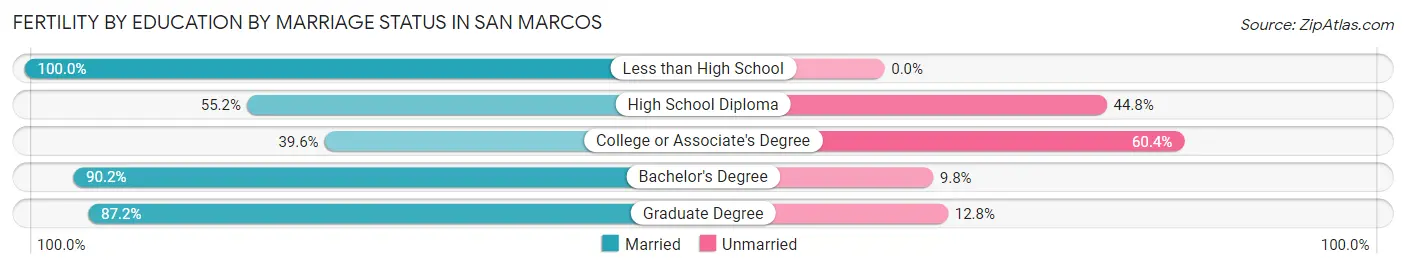
| Educational Attainment | Married | Unmarried |
| Less than High School | 160 (100.0%) | 0 (0.0%) |
| High School Diploma | 74 (55.2%) | 60 (44.8%) |
| College or Associate's Degree | 114 (39.6%) | 174 (60.4%) |
| Bachelor's Degree | 258 (90.2%) | 28 (9.8%) |
| Graduate Degree | 150 (87.2%) | 22 (12.8%) |
| Total | 756 (72.7%) | 284 (27.3%) |
Employment Characteristics in San Marcos
Employment by Class of Employer in San Marcos
Among the 44,584 employed individuals in San Marcos, private company employees (31,228 | 70.0%), self-employed (not incorporated) (3,319 | 7.4%), and not-for-profit organizations (2,970 | 6.7%) make up the most common classes of employment.
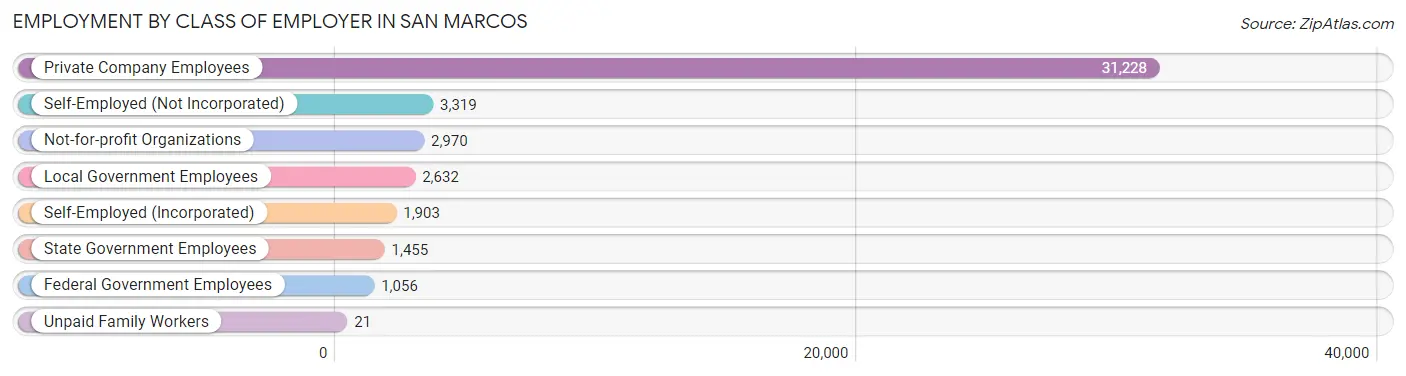
| Employer Class | # Employees | % Employees |
| Private Company Employees | 31,228 | 70.0% |
| Self-Employed (Incorporated) | 1,903 | 4.3% |
| Self-Employed (Not Incorporated) | 3,319 | 7.4% |
| Not-for-profit Organizations | 2,970 | 6.7% |
| Local Government Employees | 2,632 | 5.9% |
| State Government Employees | 1,455 | 3.3% |
| Federal Government Employees | 1,056 | 2.4% |
| Unpaid Family Workers | 21 | 0.1% |
| Total | 44,584 | 100.0% |
Employment Status by Age in San Marcos
According to the labor force statistics for San Marcos, out of the total population over 16 years of age (72,315), 65.6% or 47,439 individuals are in the labor force, with 4.2% or 1,992 of them unemployed. The age group with the highest labor force participation rate is 30 to 34 years, with 84.5% or 5,365 individuals in the labor force. Within the labor force, the 16 to 19 years age range has the highest percentage of unemployed individuals, with 12.3% or 306 of them being unemployed.
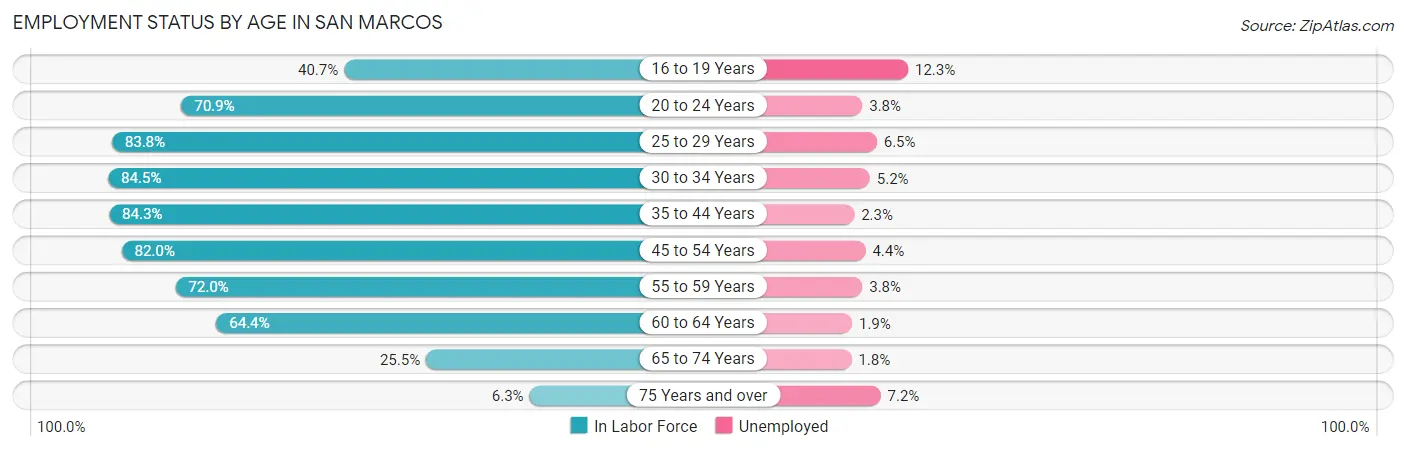
| Age Bracket | In Labor Force | Unemployed |
| 16 to 19 Years | 2,491 (40.7%) | 306 (12.3%) |
| 20 to 24 Years | 4,133 (70.9%) | 157 (3.8%) |
| 25 to 29 Years | 4,589 (83.8%) | 298 (6.5%) |
| 30 to 34 Years | 5,365 (84.5%) | 279 (5.2%) |
| 35 to 44 Years | 12,598 (84.3%) | 290 (2.3%) |
| 45 to 54 Years | 9,401 (82.0%) | 414 (4.4%) |
| 55 to 59 Years | 3,918 (72.0%) | 149 (3.8%) |
| 60 to 64 Years | 2,877 (64.4%) | 55 (1.9%) |
| 65 to 74 Years | 1,757 (25.5%) | 32 (1.8%) |
| 75 Years and over | 336 (6.3%) | 24 (7.2%) |
| Total | 47,439 (65.6%) | 1,992 (4.2%) |
Employment Status by Educational Attainment in San Marcos
According to labor force statistics for San Marcos, 80.5% of individuals (38,754) out of the total population between 25 and 64 years of age (48,142) are in the labor force, with 3.8% or 1,473 of them being unemployed. The group with the highest labor force participation rate are those with the educational attainment of bachelor's degree or higher, with 87.4% or 18,311 individuals in the labor force. Within the labor force, individuals with college / associate degree education have the highest percentage of unemployment, with 4.8% or 505 of them being unemployed.
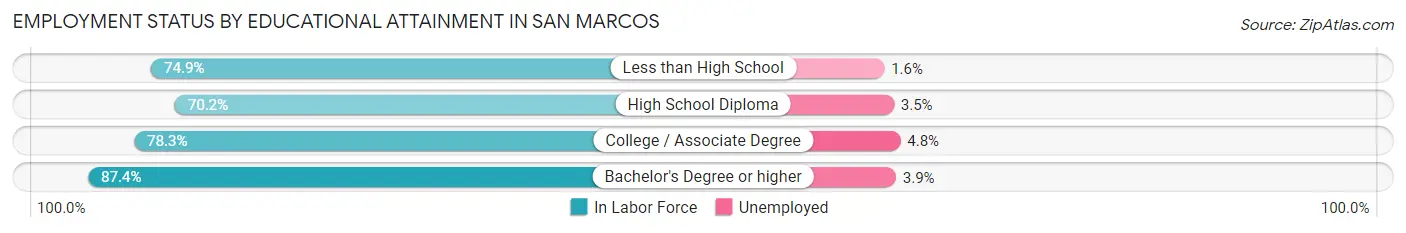
| Educational Attainment | In Labor Force | Unemployed |
| Less than High School | 4,219 (74.9%) | 90 (1.6%) |
| High School Diploma | 5,710 (70.2%) | 285 (3.5%) |
| College / Associate Degree | 10,511 (78.3%) | 644 (4.8%) |
| Bachelor's Degree or higher | 18,311 (87.4%) | 817 (3.9%) |
| Total | 38,754 (80.5%) | 1,829 (3.8%) |
Employment Occupations by Sex in San Marcos
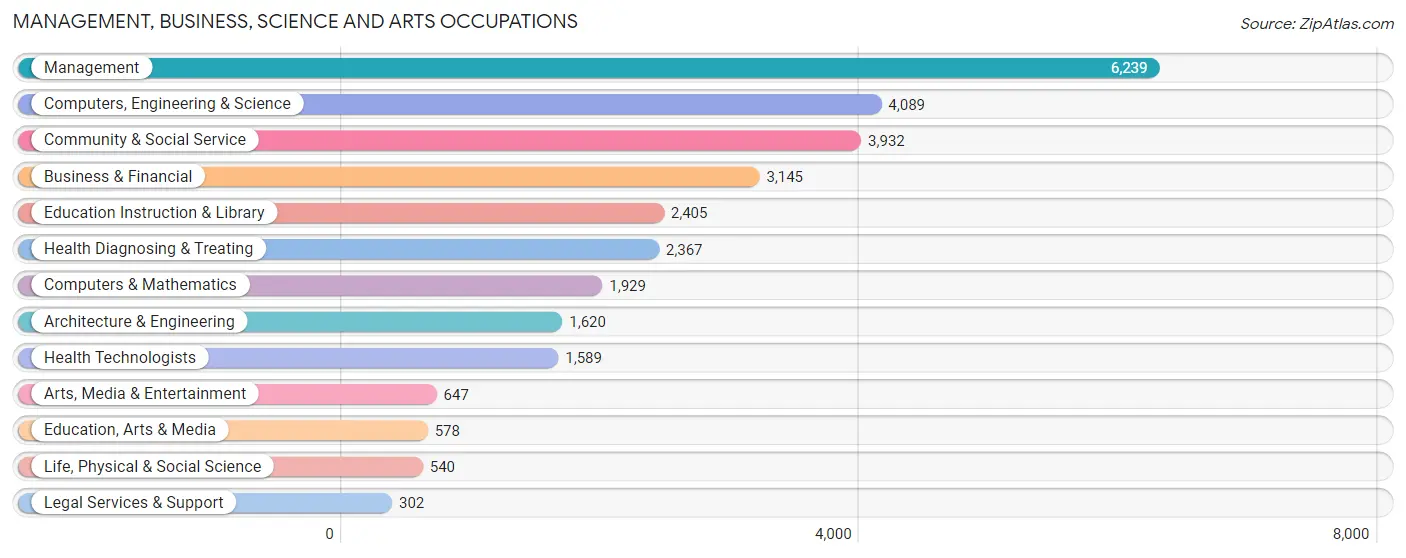
Management, Business, Science and Arts Occupations
The most common Management, Business, Science and Arts occupations in San Marcos are Management (6,239 | 13.8%), Computers, Engineering & Science (4,089 | 9.0%), Community & Social Service (3,932 | 8.7%), Business & Financial (3,145 | 7.0%), and Education Instruction & Library (2,405 | 5.3%).
Management, Business, Science and Arts Occupations by Sex
Within the Management, Business, Science and Arts occupations in San Marcos, the most male-oriented occupations are Architecture & Engineering (87.8%), Computers, Engineering & Science (75.9%), and Computers & Mathematics (71.2%), while the most female-oriented occupations are Education Instruction & Library (74.5%), Community & Social Service (66.0%), and Health Technologists (65.6%).
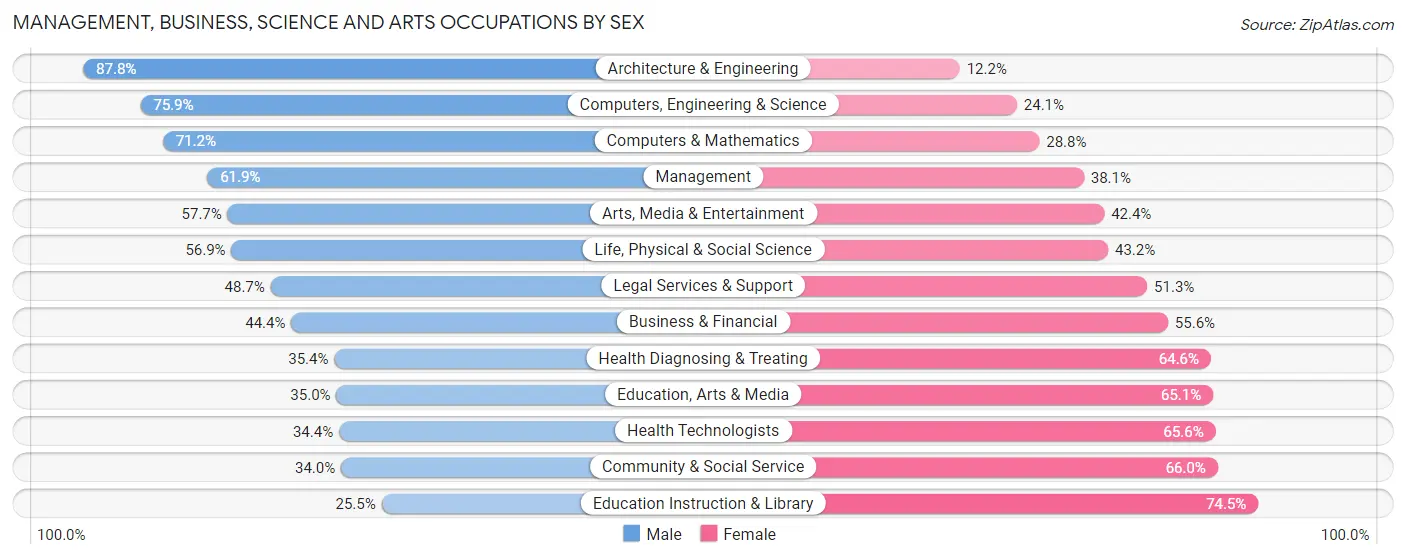
| Occupation | Male | Female |
| Management | 3,862 (61.9%) | 2,377 (38.1%) |
| Business & Financial | 1,395 (44.4%) | 1,750 (55.6%) |
| Computers, Engineering & Science | 3,102 (75.9%) | 987 (24.1%) |
| Computers & Mathematics | 1,373 (71.2%) | 556 (28.8%) |
| Architecture & Engineering | 1,422 (87.8%) | 198 (12.2%) |
| Life, Physical & Social Science | 307 (56.9%) | 233 (43.1%) |
| Community & Social Service | 1,336 (34.0%) | 2,596 (66.0%) |
| Education, Arts & Media | 202 (34.9%) | 376 (65.0%) |
| Legal Services & Support | 147 (48.7%) | 155 (51.3%) |
| Education Instruction & Library | 614 (25.5%) | 1,791 (74.5%) |
| Arts, Media & Entertainment | 373 (57.7%) | 274 (42.3%) |
| Health Diagnosing & Treating | 838 (35.4%) | 1,529 (64.6%) |
| Health Technologists | 547 (34.4%) | 1,042 (65.6%) |
| Total (Category) | 10,533 (53.3%) | 9,239 (46.7%) |
| Total (Overall) | 24,697 (54.6%) | 20,509 (45.4%) |
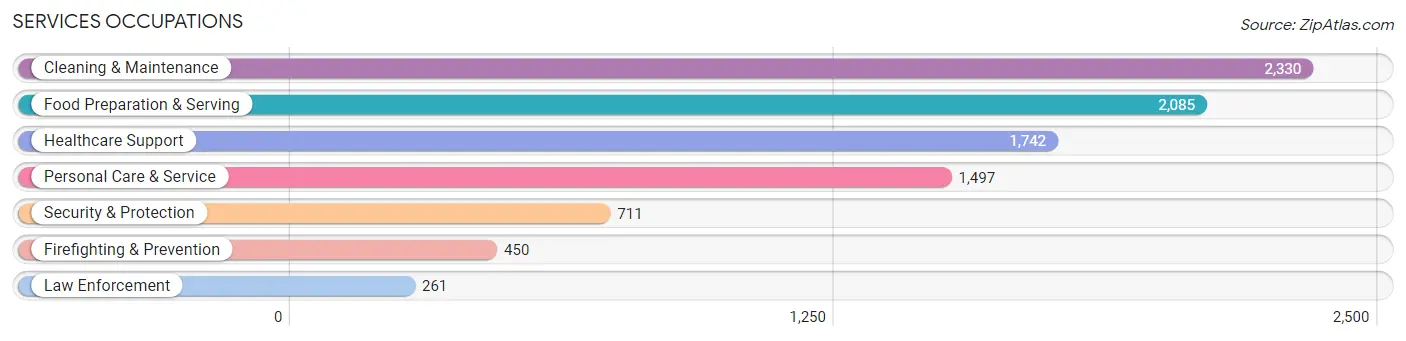
Services Occupations
The most common Services occupations in San Marcos are Cleaning & Maintenance (2,330 | 5.1%), Food Preparation & Serving (2,085 | 4.6%), Healthcare Support (1,742 | 3.8%), Personal Care & Service (1,497 | 3.3%), and Security & Protection (711 | 1.6%).
Services Occupations by Sex
Within the Services occupations in San Marcos, the most male-oriented occupations are Firefighting & Prevention (95.1%), Security & Protection (82.8%), and Law Enforcement (61.7%), while the most female-oriented occupations are Healthcare Support (82.8%), Personal Care & Service (71.3%), and Food Preparation & Serving (54.9%).
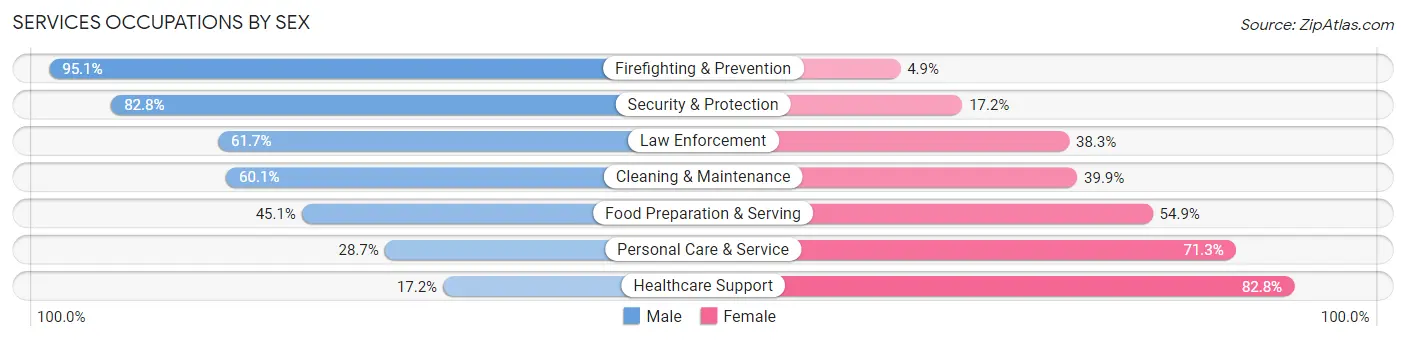
| Occupation | Male | Female |
| Healthcare Support | 299 (17.2%) | 1,443 (82.8%) |
| Security & Protection | 589 (82.8%) | 122 (17.2%) |
| Firefighting & Prevention | 428 (95.1%) | 22 (4.9%) |
| Law Enforcement | 161 (61.7%) | 100 (38.3%) |
| Food Preparation & Serving | 941 (45.1%) | 1,144 (54.9%) |
| Cleaning & Maintenance | 1,400 (60.1%) | 930 (39.9%) |
| Personal Care & Service | 430 (28.7%) | 1,067 (71.3%) |
| Total (Category) | 3,659 (43.7%) | 4,706 (56.3%) |
| Total (Overall) | 24,697 (54.6%) | 20,509 (45.4%) |
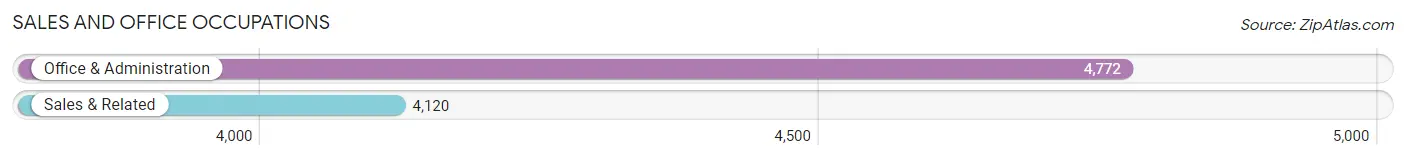
Sales and Office Occupations
The most common Sales and Office occupations in San Marcos are Office & Administration (4,772 | 10.6%), and Sales & Related (4,120 | 9.1%).
Sales and Office Occupations by Sex
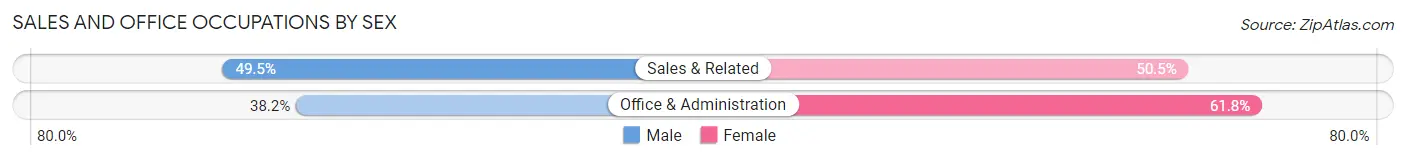
| Occupation | Male | Female |
| Sales & Related | 2,041 (49.5%) | 2,079 (50.5%) |
| Office & Administration | 1,825 (38.2%) | 2,947 (61.8%) |
| Total (Category) | 3,866 (43.5%) | 5,026 (56.5%) |
| Total (Overall) | 24,697 (54.6%) | 20,509 (45.4%) |
Natural Resources, Construction and Maintenance Occupations
The most common Natural Resources, Construction and Maintenance occupations in San Marcos are Construction & Extraction (2,189 | 4.8%), Installation, Maintenance & Repair (1,074 | 2.4%), and Farming, Fishing & Forestry (302 | 0.7%).
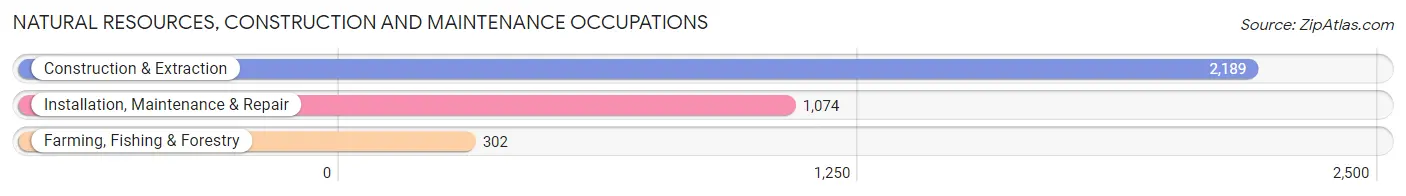
Natural Resources, Construction and Maintenance Occupations by Sex
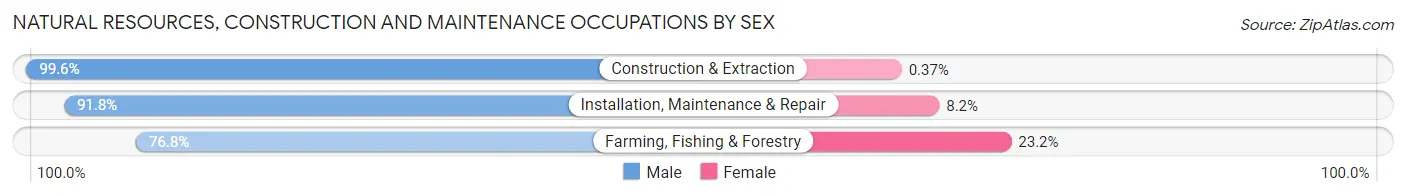
| Occupation | Male | Female |
| Farming, Fishing & Forestry | 232 (76.8%) | 70 (23.2%) |
| Construction & Extraction | 2,181 (99.6%) | 8 (0.4%) |
| Installation, Maintenance & Repair | 986 (91.8%) | 88 (8.2%) |
| Total (Category) | 3,399 (95.3%) | 166 (4.7%) |
| Total (Overall) | 24,697 (54.6%) | 20,509 (45.4%) |
Production, Transportation and Moving Occupations
The most common Production, Transportation and Moving occupations in San Marcos are Production (2,492 | 5.5%), Material Moving (1,235 | 2.7%), and Transportation (885 | 2.0%).
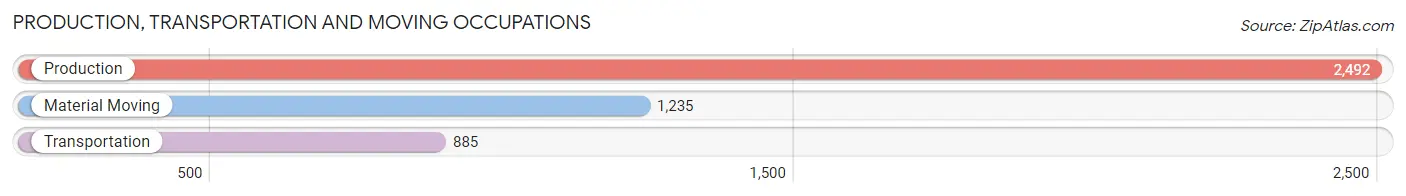
Production, Transportation and Moving Occupations by Sex
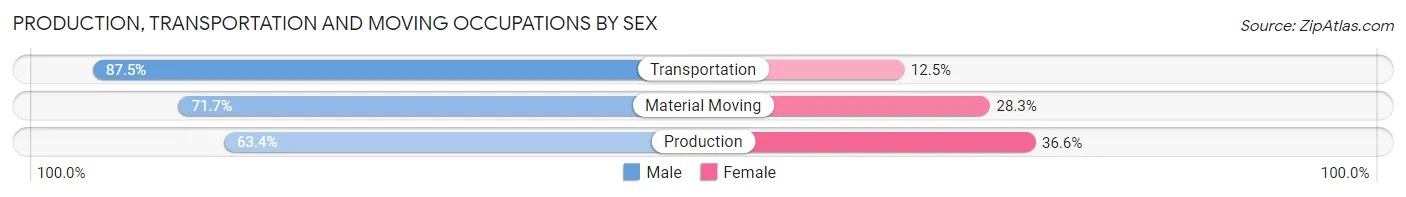
| Occupation | Male | Female |
| Production | 1,580 (63.4%) | 912 (36.6%) |
| Transportation | 774 (87.5%) | 111 (12.5%) |
| Material Moving | 886 (71.7%) | 349 (28.3%) |
| Total (Category) | 3,240 (70.3%) | 1,372 (29.7%) |
| Total (Overall) | 24,697 (54.6%) | 20,509 (45.4%) |
Employment Industries by Sex in San Marcos
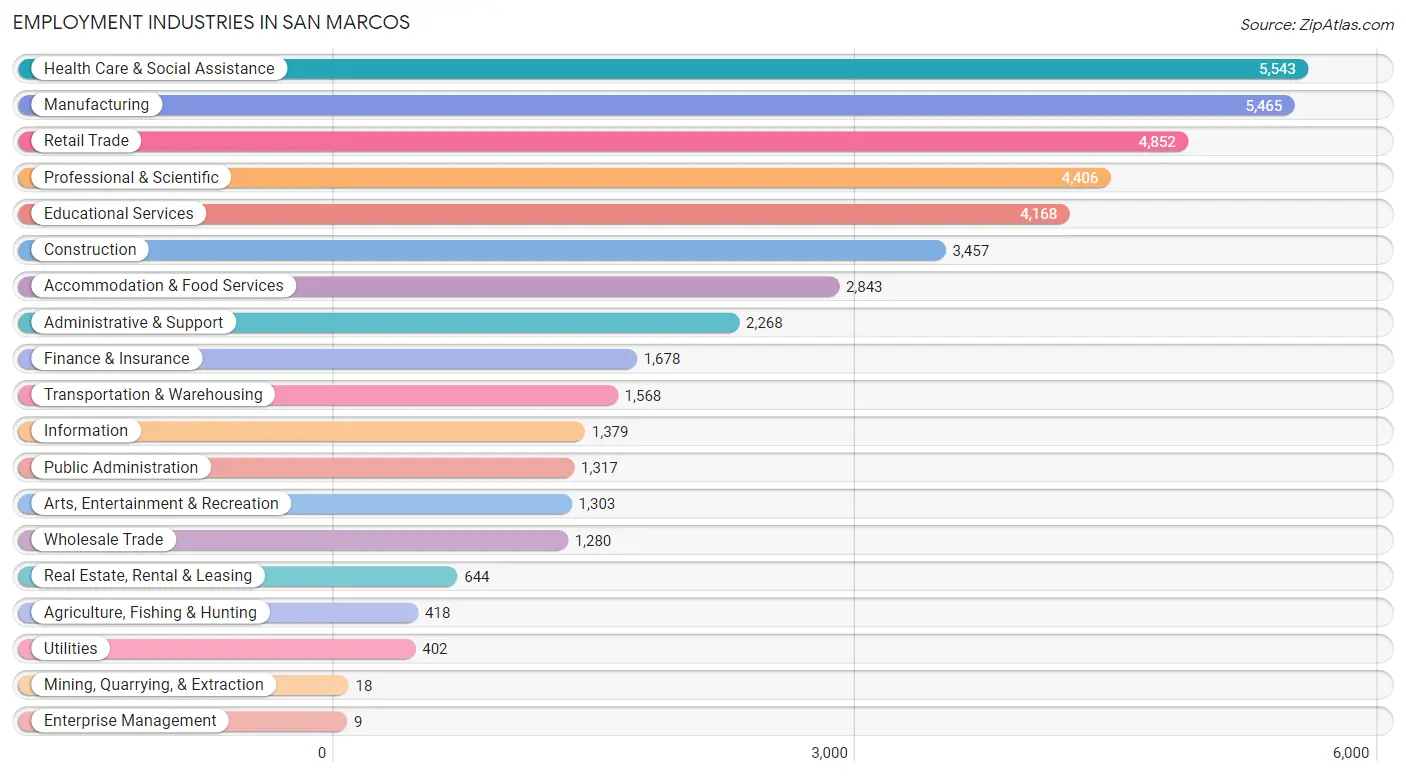
Employment Industries in San Marcos
The major employment industries in San Marcos include Health Care & Social Assistance (5,543 | 12.3%), Manufacturing (5,465 | 12.1%), Retail Trade (4,852 | 10.7%), Professional & Scientific (4,406 | 9.8%), and Educational Services (4,168 | 9.2%).
Employment Industries by Sex in San Marcos
The San Marcos industries that see more men than women are Mining, Quarrying, & Extraction (100.0%), Enterprise Management (100.0%), and Construction (91.3%), whereas the industries that tend to have a higher number of women are Educational Services (75.0%), Health Care & Social Assistance (74.1%), and Accommodation & Food Services (55.0%).
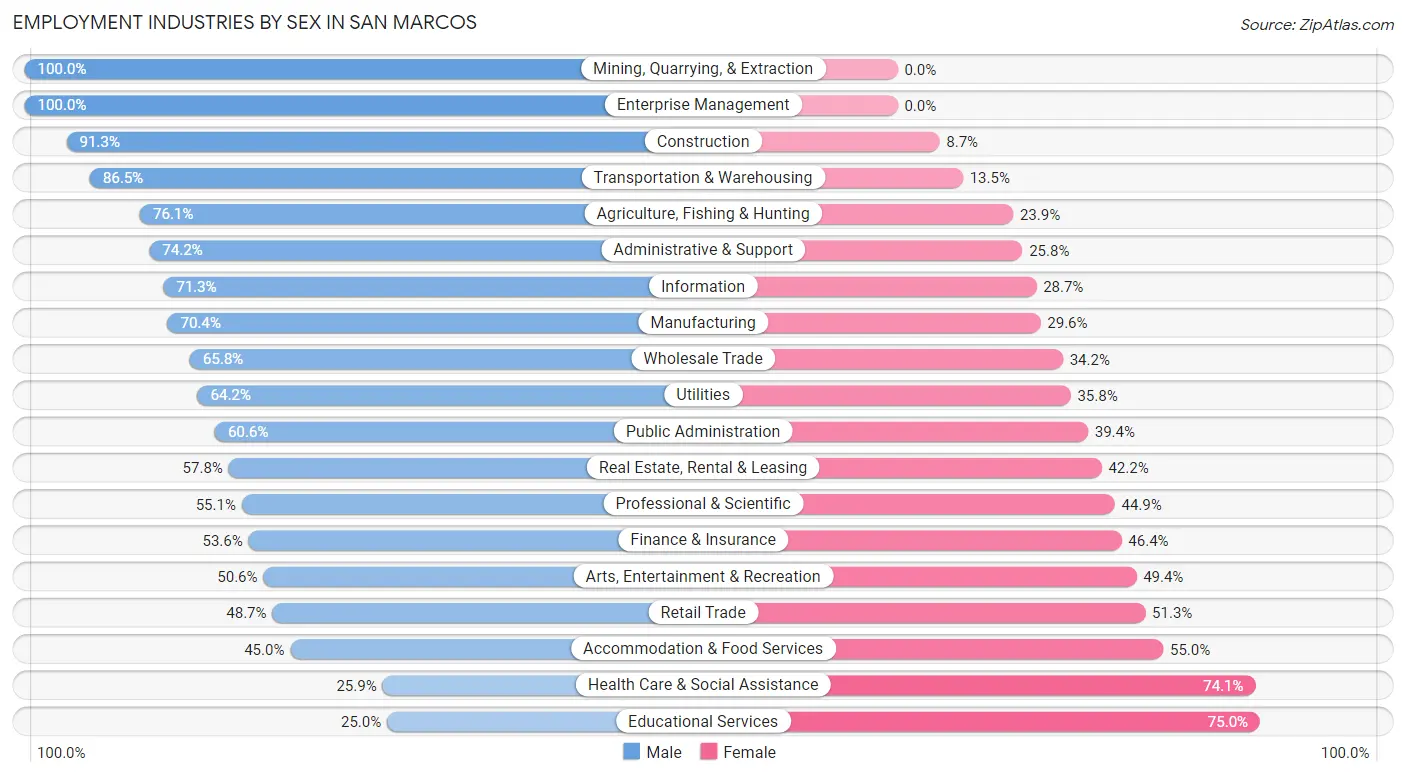
| Industry | Male | Female |
| Agriculture, Fishing & Hunting | 318 (76.1%) | 100 (23.9%) |
| Mining, Quarrying, & Extraction | 18 (100.0%) | 0 (0.0%) |
| Construction | 3,157 (91.3%) | 300 (8.7%) |
| Manufacturing | 3,848 (70.4%) | 1,617 (29.6%) |
| Wholesale Trade | 842 (65.8%) | 438 (34.2%) |
| Retail Trade | 2,364 (48.7%) | 2,488 (51.3%) |
| Transportation & Warehousing | 1,356 (86.5%) | 212 (13.5%) |
| Utilities | 258 (64.2%) | 144 (35.8%) |
| Information | 983 (71.3%) | 396 (28.7%) |
| Finance & Insurance | 900 (53.6%) | 778 (46.4%) |
| Real Estate, Rental & Leasing | 372 (57.8%) | 272 (42.2%) |
| Professional & Scientific | 2,426 (55.1%) | 1,980 (44.9%) |
| Enterprise Management | 9 (100.0%) | 0 (0.0%) |
| Administrative & Support | 1,682 (74.2%) | 586 (25.8%) |
| Educational Services | 1,041 (25.0%) | 3,127 (75.0%) |
| Health Care & Social Assistance | 1,437 (25.9%) | 4,106 (74.1%) |
| Arts, Entertainment & Recreation | 659 (50.6%) | 644 (49.4%) |
| Accommodation & Food Services | 1,280 (45.0%) | 1,563 (55.0%) |
| Public Administration | 798 (60.6%) | 519 (39.4%) |
| Total | 24,697 (54.6%) | 20,509 (45.4%) |
Education in San Marcos
School Enrollment in San Marcos
The most common levels of schooling among the 28,780 students in San Marcos are college / undergraduate (8,337 | 29.0%), middle school (5,549 | 19.3%), and elementary school (5,363 | 18.6%).
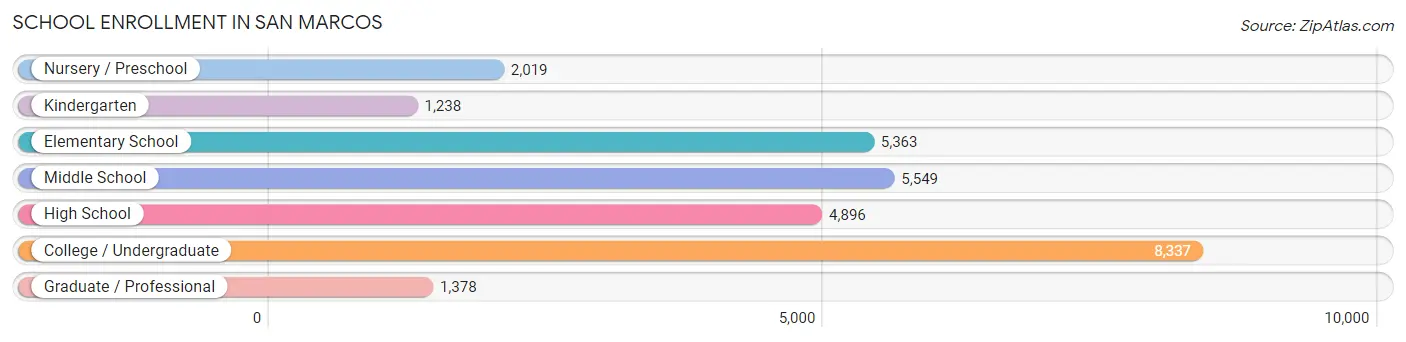
| School Level | # Students | % Students |
| Nursery / Preschool | 2,019 | 7.0% |
| Kindergarten | 1,238 | 4.3% |
| Elementary School | 5,363 | 18.6% |
| Middle School | 5,549 | 19.3% |
| High School | 4,896 | 17.0% |
| College / Undergraduate | 8,337 | 29.0% |
| Graduate / Professional | 1,378 | 4.8% |
| Total | 28,780 | 100.0% |
School Enrollment by Age by Funding Source in San Marcos
Out of a total of 28,780 students who are enrolled in schools in San Marcos, 3,223 (11.2%) attend a private institution, while the remaining 25,557 (88.8%) are enrolled in public schools. The age group of 3 to 4 year olds has the highest likelihood of being enrolled in private schools, with 829 (53.1% in the age bracket) enrolled. Conversely, the age group of 15 to 17 year olds has the lowest likelihood of being enrolled in a private school, with 3,507 (97.2% in the age bracket) attending a public institution.
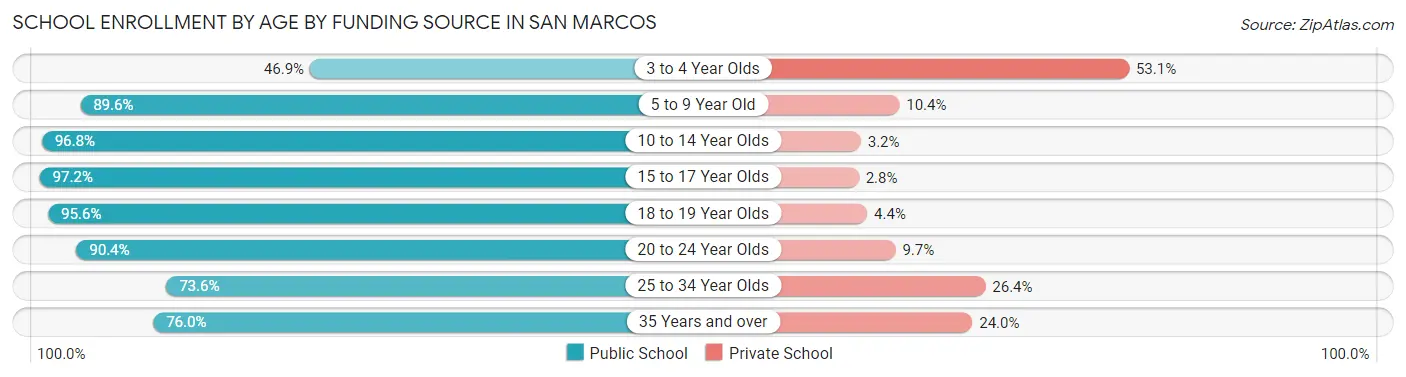
| Age Bracket | Public School | Private School |
| 3 to 4 Year Olds | 731 (46.9%) | 829 (53.1%) |
| 5 to 9 Year Old | 6,065 (89.6%) | 701 (10.4%) |
| 10 to 14 Year Olds | 6,564 (96.8%) | 216 (3.2%) |
| 15 to 17 Year Olds | 3,507 (97.2%) | 101 (2.8%) |
| 18 to 19 Year Olds | 3,014 (95.6%) | 138 (4.4%) |
| 20 to 24 Year Olds | 2,986 (90.3%) | 319 (9.7%) |
| 25 to 34 Year Olds | 1,523 (73.6%) | 546 (26.4%) |
| 35 Years and over | 1,171 (76.0%) | 369 (24.0%) |
| Total | 25,557 (88.8%) | 3,223 (11.2%) |
Educational Attainment by Field of Study in San Marcos
Business (6,003 | 22.7%), engineering (3,139 | 11.8%), social sciences (2,238 | 8.5%), science & technology (2,217 | 8.4%), and education (1,885 | 7.1%) are the most common fields of study among 26,479 individuals in San Marcos who have obtained a bachelor's degree or higher.
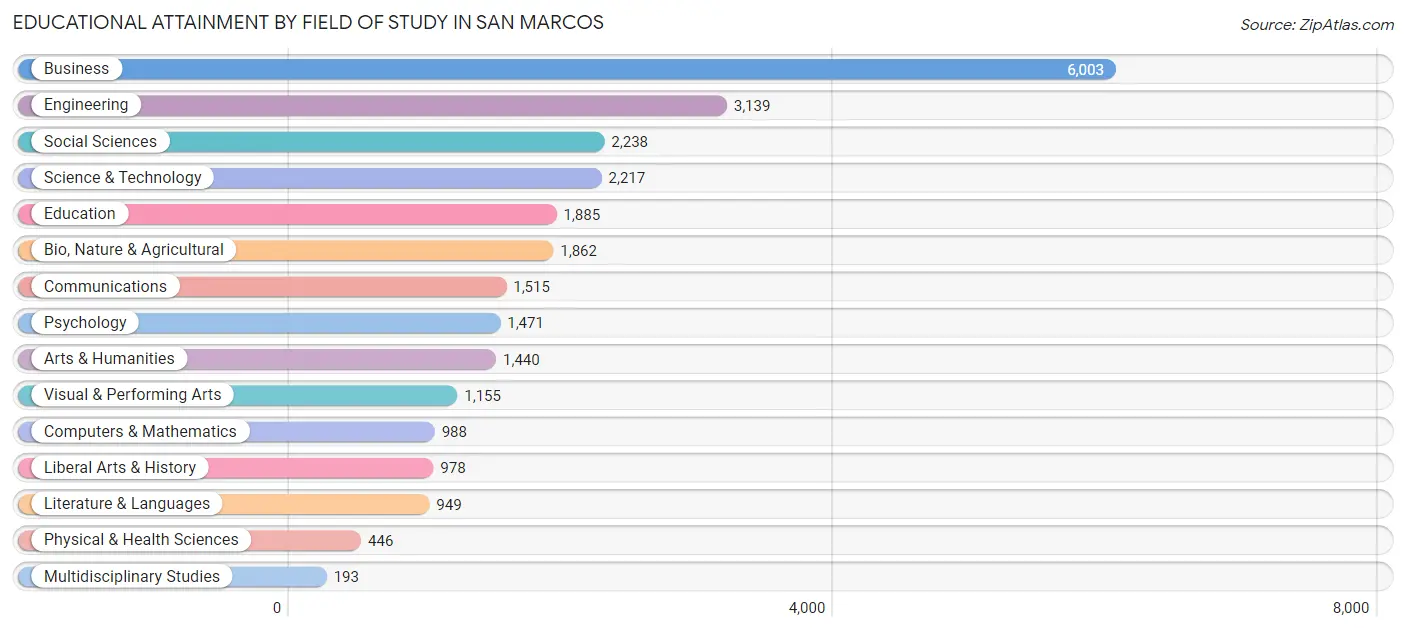
| Field of Study | # Graduates | % Graduates |
| Computers & Mathematics | 988 | 3.7% |
| Bio, Nature & Agricultural | 1,862 | 7.0% |
| Physical & Health Sciences | 446 | 1.7% |
| Psychology | 1,471 | 5.6% |
| Social Sciences | 2,238 | 8.5% |
| Engineering | 3,139 | 11.8% |
| Multidisciplinary Studies | 193 | 0.7% |
| Science & Technology | 2,217 | 8.4% |
| Business | 6,003 | 22.7% |
| Education | 1,885 | 7.1% |
| Literature & Languages | 949 | 3.6% |
| Liberal Arts & History | 978 | 3.7% |
| Visual & Performing Arts | 1,155 | 4.4% |
| Communications | 1,515 | 5.7% |
| Arts & Humanities | 1,440 | 5.4% |
| Total | 26,479 | 100.0% |
Transportation & Commute in San Marcos
Vehicle Availability by Sex in San Marcos
The most prevalent vehicle ownership categories in San Marcos are males with 2 vehicles (11,114, accounting for 46.0%) and females with 2 vehicles (8,847, making up 55.7%).
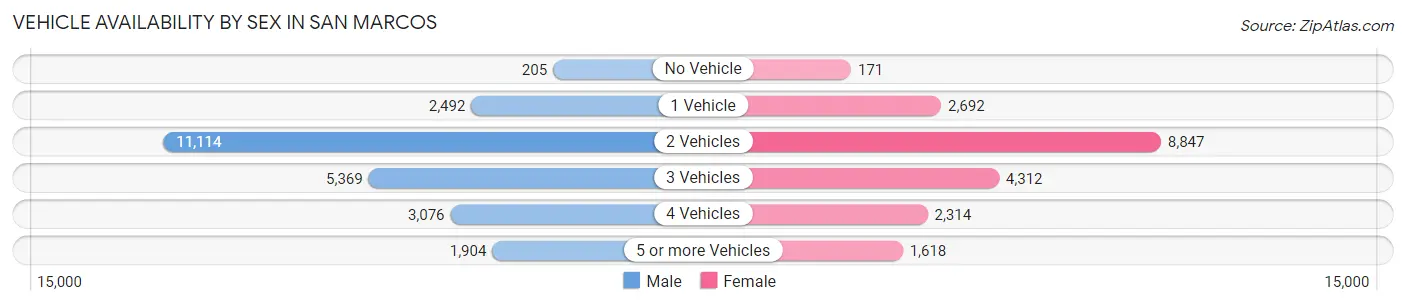
| Vehicles Available | Male | Female |
| No Vehicle | 205 (0.9%) | 171 (0.9%) |
| 1 Vehicle | 2,492 (10.3%) | 2,692 (13.5%) |
| 2 Vehicles | 11,114 (46.0%) | 8,847 (44.3%) |
| 3 Vehicles | 5,369 (22.2%) | 4,312 (21.6%) |
| 4 Vehicles | 3,076 (12.7%) | 2,314 (11.6%) |
| 5 or more Vehicles | 1,904 (7.9%) | 1,618 (8.1%) |
| Total | 24,160 (100.0%) | 19,954 (100.0%) |
Commute Time in San Marcos
The most frequently occuring commute durations in San Marcos are 20 to 24 minutes (6,379 commuters, 17.1%), 15 to 19 minutes (6,122 commuters, 16.4%), and 30 to 34 minutes (5,857 commuters, 15.7%).
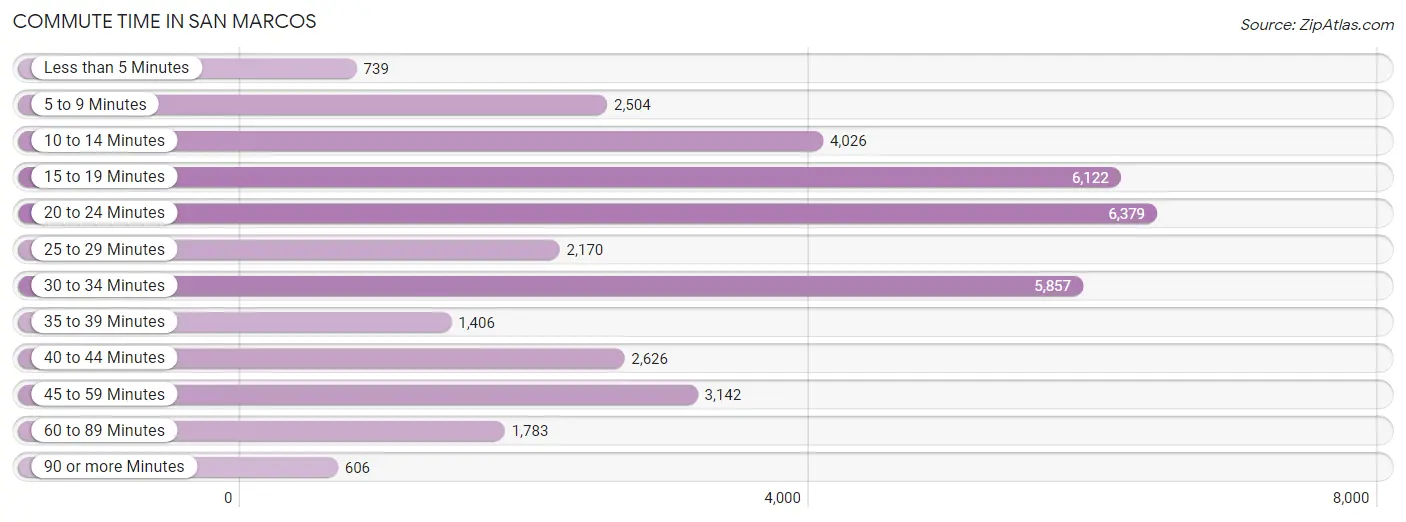
| Commute Time | # Commuters | % Commuters |
| Less than 5 Minutes | 739 | 2.0% |
| 5 to 9 Minutes | 2,504 | 6.7% |
| 10 to 14 Minutes | 4,026 | 10.8% |
| 15 to 19 Minutes | 6,122 | 16.4% |
| 20 to 24 Minutes | 6,379 | 17.1% |
| 25 to 29 Minutes | 2,170 | 5.8% |
| 30 to 34 Minutes | 5,857 | 15.7% |
| 35 to 39 Minutes | 1,406 | 3.8% |
| 40 to 44 Minutes | 2,626 | 7.0% |
| 45 to 59 Minutes | 3,142 | 8.4% |
| 60 to 89 Minutes | 1,783 | 4.8% |
| 90 or more Minutes | 606 | 1.6% |
Commute Time by Sex in San Marcos
The most common commute times in San Marcos are 20 to 24 minutes (3,538 commuters, 16.8%) for males and 15 to 19 minutes (3,056 commuters, 18.8%) for females.
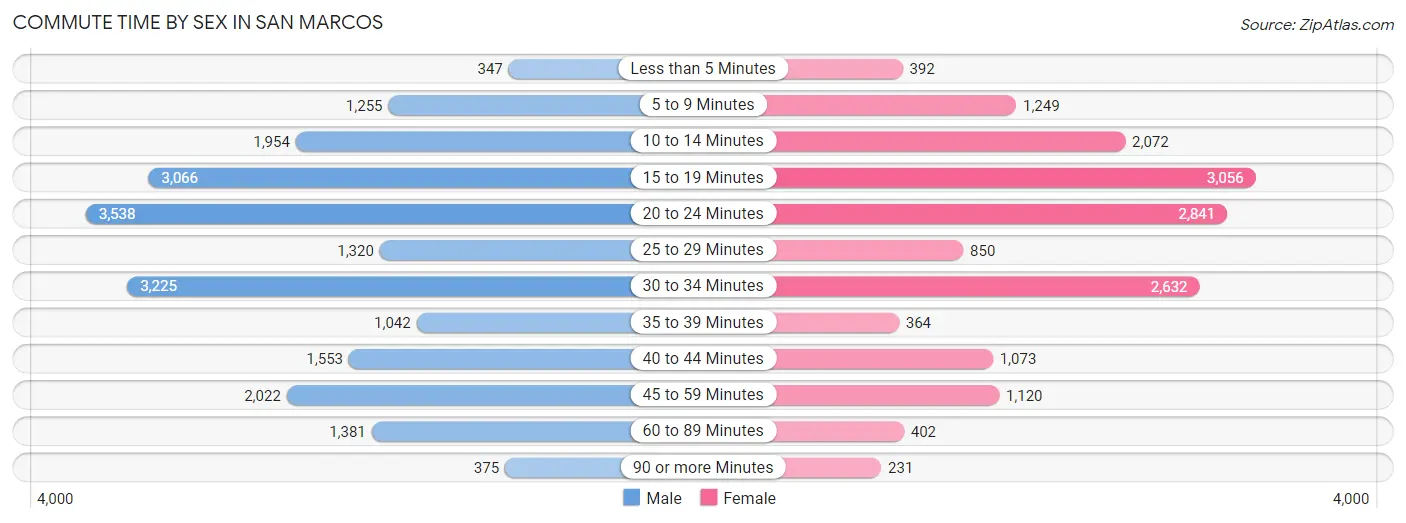
| Commute Time | Male | Female |
| Less than 5 Minutes | 347 (1.7%) | 392 (2.4%) |
| 5 to 9 Minutes | 1,255 (5.9%) | 1,249 (7.7%) |
| 10 to 14 Minutes | 1,954 (9.3%) | 2,072 (12.7%) |
| 15 to 19 Minutes | 3,066 (14.5%) | 3,056 (18.8%) |
| 20 to 24 Minutes | 3,538 (16.8%) | 2,841 (17.4%) |
| 25 to 29 Minutes | 1,320 (6.3%) | 850 (5.2%) |
| 30 to 34 Minutes | 3,225 (15.3%) | 2,632 (16.2%) |
| 35 to 39 Minutes | 1,042 (4.9%) | 364 (2.2%) |
| 40 to 44 Minutes | 1,553 (7.4%) | 1,073 (6.6%) |
| 45 to 59 Minutes | 2,022 (9.6%) | 1,120 (6.9%) |
| 60 to 89 Minutes | 1,381 (6.6%) | 402 (2.5%) |
| 90 or more Minutes | 375 (1.8%) | 231 (1.4%) |
Time of Departure to Work by Sex in San Marcos
The most frequent times of departure to work in San Marcos are 7:00 AM to 7:29 AM (3,936, 18.7%) for males and 7:00 AM to 7:29 AM (3,063, 18.8%) for females.
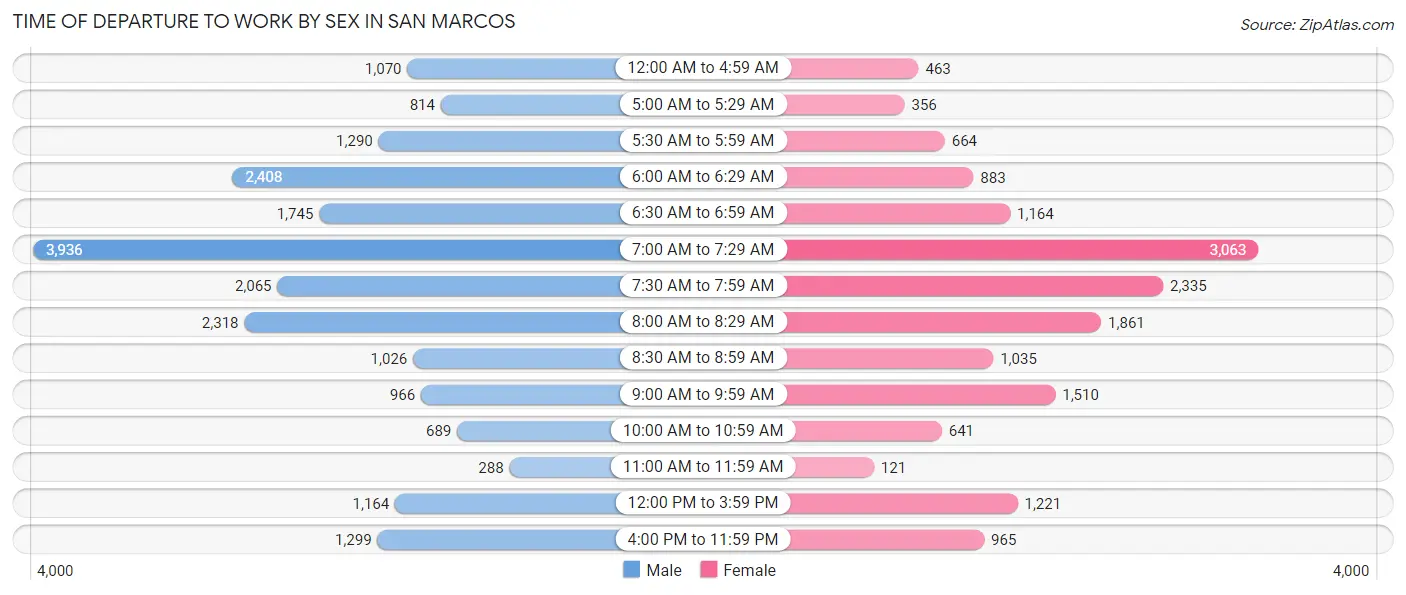
| Time of Departure | Male | Female |
| 12:00 AM to 4:59 AM | 1,070 (5.1%) | 463 (2.8%) |
| 5:00 AM to 5:29 AM | 814 (3.9%) | 356 (2.2%) |
| 5:30 AM to 5:59 AM | 1,290 (6.1%) | 664 (4.1%) |
| 6:00 AM to 6:29 AM | 2,408 (11.4%) | 883 (5.4%) |
| 6:30 AM to 6:59 AM | 1,745 (8.3%) | 1,164 (7.1%) |
| 7:00 AM to 7:29 AM | 3,936 (18.7%) | 3,063 (18.8%) |
| 7:30 AM to 7:59 AM | 2,065 (9.8%) | 2,335 (14.3%) |
| 8:00 AM to 8:29 AM | 2,318 (11.0%) | 1,861 (11.4%) |
| 8:30 AM to 8:59 AM | 1,026 (4.9%) | 1,035 (6.4%) |
| 9:00 AM to 9:59 AM | 966 (4.6%) | 1,510 (9.3%) |
| 10:00 AM to 10:59 AM | 689 (3.3%) | 641 (3.9%) |
| 11:00 AM to 11:59 AM | 288 (1.4%) | 121 (0.7%) |
| 12:00 PM to 3:59 PM | 1,164 (5.5%) | 1,221 (7.5%) |
| 4:00 PM to 11:59 PM | 1,299 (6.2%) | 965 (5.9%) |
| Total | 21,078 (100.0%) | 16,282 (100.0%) |
Housing Occupancy in San Marcos
Occupancy by Ownership in San Marcos
Of the total 30,503 dwellings in San Marcos, owner-occupied units account for 18,896 (62.0%), while renter-occupied units make up 11,607 (38.1%).
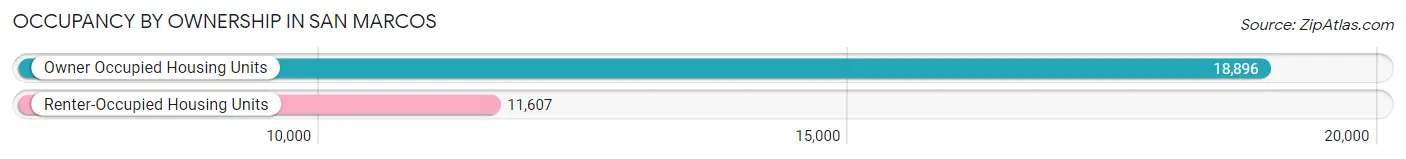
| Occupancy | # Housing Units | % Housing Units |
| Owner Occupied Housing Units | 18,896 | 62.0% |
| Renter-Occupied Housing Units | 11,607 | 38.1% |
| Total Occupied Housing Units | 30,503 | 100.0% |
Occupancy by Household Size in San Marcos
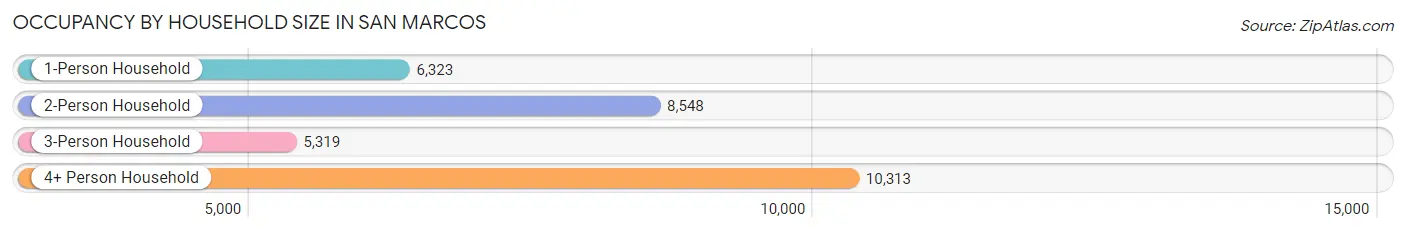
| Household Size | # Housing Units | % Housing Units |
| 1-Person Household | 6,323 | 20.7% |
| 2-Person Household | 8,548 | 28.0% |
| 3-Person Household | 5,319 | 17.4% |
| 4+ Person Household | 10,313 | 33.8% |
| Total Housing Units | 30,503 | 100.0% |
Occupancy by Ownership by Household Size in San Marcos
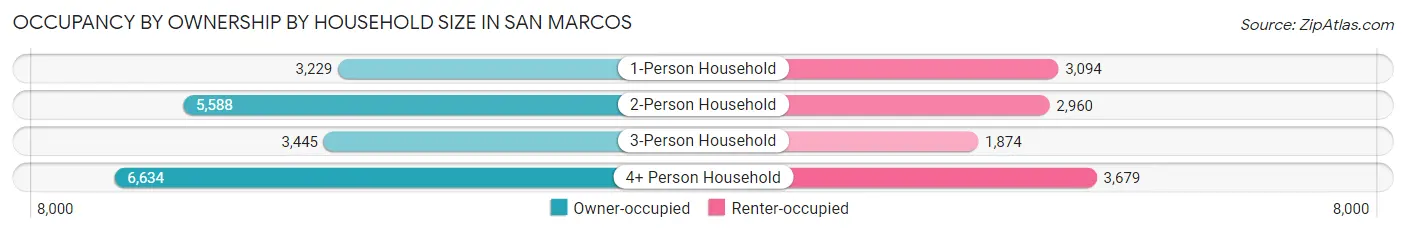
| Household Size | Owner-occupied | Renter-occupied |
| 1-Person Household | 3,229 (51.1%) | 3,094 (48.9%) |
| 2-Person Household | 5,588 (65.4%) | 2,960 (34.6%) |
| 3-Person Household | 3,445 (64.8%) | 1,874 (35.2%) |
| 4+ Person Household | 6,634 (64.3%) | 3,679 (35.7%) |
| Total Housing Units | 18,896 (62.0%) | 11,607 (38.1%) |
Occupancy by Educational Attainment in San Marcos
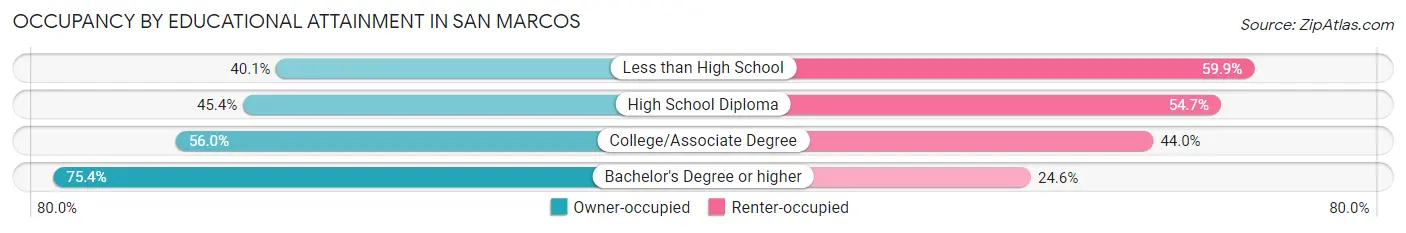
| Household Size | Owner-occupied | Renter-occupied |
| Less than High School | 1,138 (40.1%) | 1,703 (59.9%) |
| High School Diploma | 1,996 (45.4%) | 2,405 (54.6%) |
| College/Associate Degree | 5,147 (56.0%) | 4,041 (44.0%) |
| Bachelor's Degree or higher | 10,615 (75.4%) | 3,458 (24.6%) |
Occupancy by Age of Householder in San Marcos
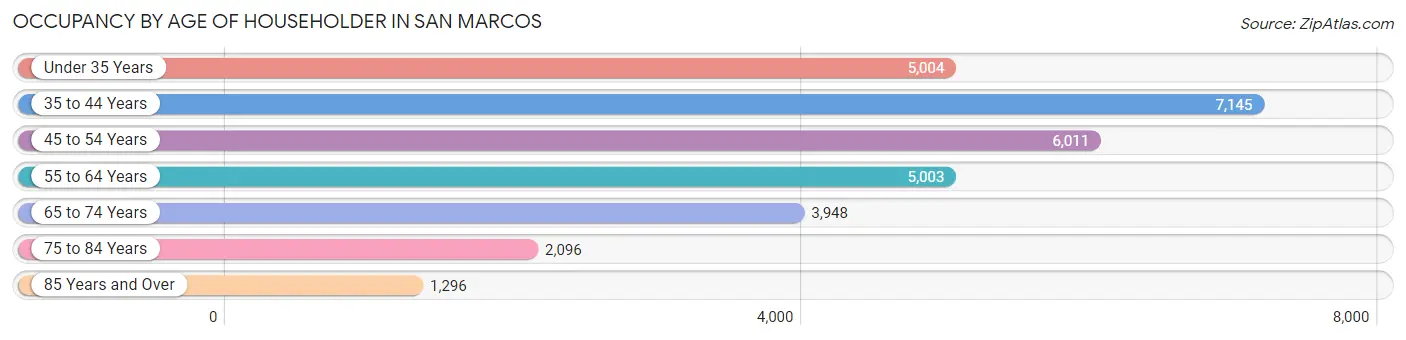
| Age Bracket | # Households | % Households |
| Under 35 Years | 5,004 | 16.4% |
| 35 to 44 Years | 7,145 | 23.4% |
| 45 to 54 Years | 6,011 | 19.7% |
| 55 to 64 Years | 5,003 | 16.4% |
| 65 to 74 Years | 3,948 | 12.9% |
| 75 to 84 Years | 2,096 | 6.9% |
| 85 Years and Over | 1,296 | 4.3% |
| Total | 30,503 | 100.0% |
Housing Finances in San Marcos
Median Income by Occupancy in San Marcos
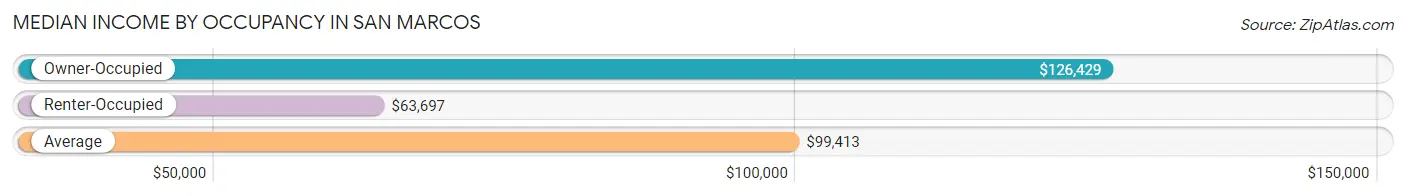
| Occupancy Type | # Households | Median Income |
| Owner-Occupied | 18,896 (62.0%) | $126,429 |
| Renter-Occupied | 11,607 (38.1%) | $63,697 |
| Average | 30,503 (100.0%) | $99,413 |
Occupancy by Householder Income Bracket in San Marcos

| Income Bracket | Owner-occupied | Renter-occupied |
| Less than $5,000 | 587 (3.1%) | 388 (3.3%) |
| $5,000 to $9,999 | 360 (1.9%) | 258 (2.2%) |
| $10,000 to $14,999 | 263 (1.4%) | 373 (3.2%) |
| $15,000 to $19,999 | 400 (2.1%) | 366 (3.2%) |
| $20,000 to $24,999 | 262 (1.4%) | 540 (4.6%) |
| $25,000 to $34,999 | 640 (3.4%) | 963 (8.3%) |
| $35,000 to $49,999 | 1,016 (5.4%) | 1,922 (16.6%) |
| $50,000 to $74,999 | 1,783 (9.4%) | 1,683 (14.5%) |
| $75,000 to $99,999 | 2,008 (10.6%) | 1,533 (13.2%) |
| $100,000 to $149,999 | 3,473 (18.4%) | 1,904 (16.4%) |
| $150,000 or more | 8,104 (42.9%) | 1,677 (14.4%) |
| Total | 18,896 (100.0%) | 11,607 (100.0%) |
Monthly Housing Cost Tiers in San Marcos
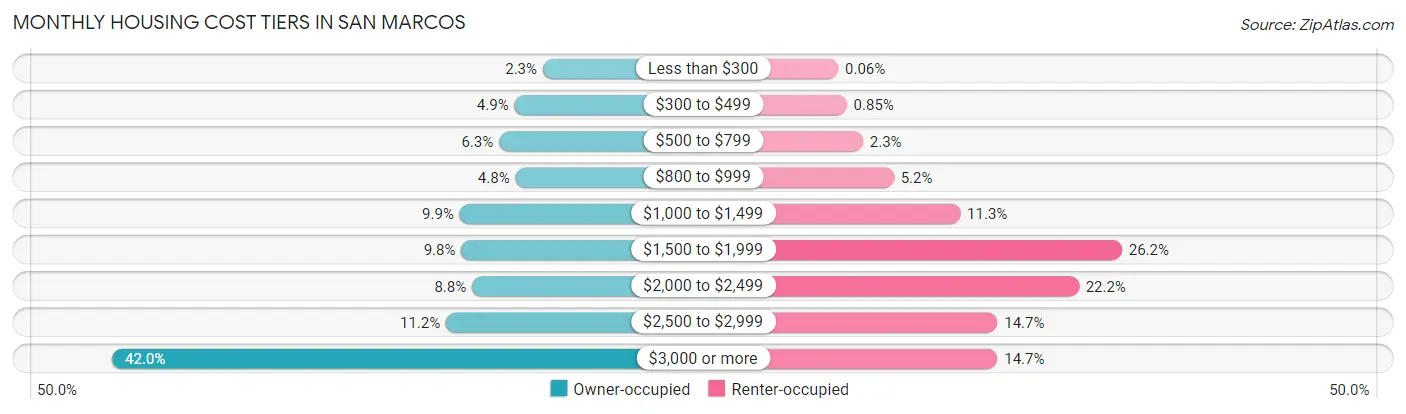
| Monthly Cost | Owner-occupied | Renter-occupied |
| Less than $300 | 432 (2.3%) | 7 (0.1%) |
| $300 to $499 | 926 (4.9%) | 99 (0.9%) |
| $500 to $799 | 1,195 (6.3%) | 272 (2.3%) |
| $800 to $999 | 908 (4.8%) | 601 (5.2%) |
| $1,000 to $1,499 | 1,878 (9.9%) | 1,312 (11.3%) |
| $1,500 to $1,999 | 1,851 (9.8%) | 3,039 (26.2%) |
| $2,000 to $2,499 | 1,664 (8.8%) | 2,578 (22.2%) |
| $2,500 to $2,999 | 2,116 (11.2%) | 1,708 (14.7%) |
| $3,000 or more | 7,926 (41.9%) | 1,709 (14.7%) |
| Total | 18,896 (100.0%) | 11,607 (100.0%) |
Physical Housing Characteristics in San Marcos
Housing Structures in San Marcos
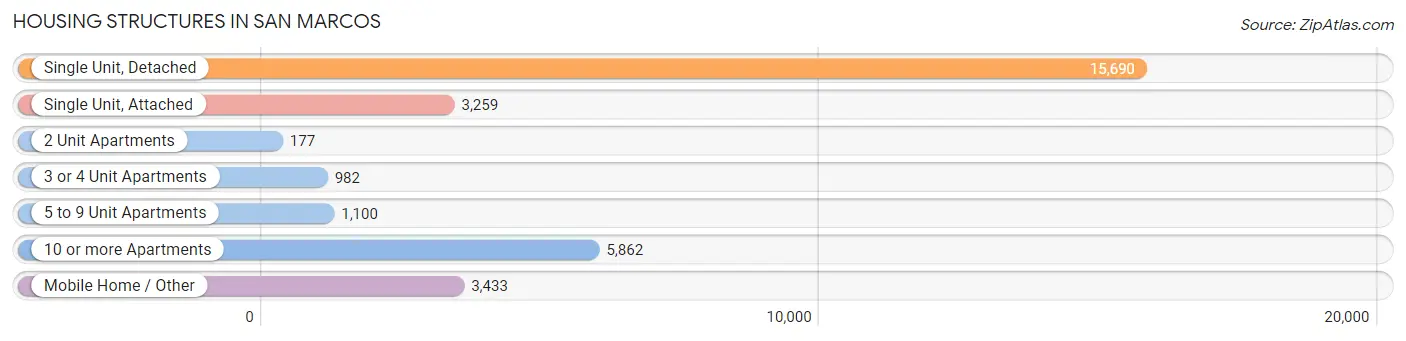
| Structure Type | # Housing Units | % Housing Units |
| Single Unit, Detached | 15,690 | 51.4% |
| Single Unit, Attached | 3,259 | 10.7% |
| 2 Unit Apartments | 177 | 0.6% |
| 3 or 4 Unit Apartments | 982 | 3.2% |
| 5 to 9 Unit Apartments | 1,100 | 3.6% |
| 10 or more Apartments | 5,862 | 19.2% |
| Mobile Home / Other | 3,433 | 11.3% |
| Total | 30,503 | 100.0% |
Housing Structures by Occupancy in San Marcos
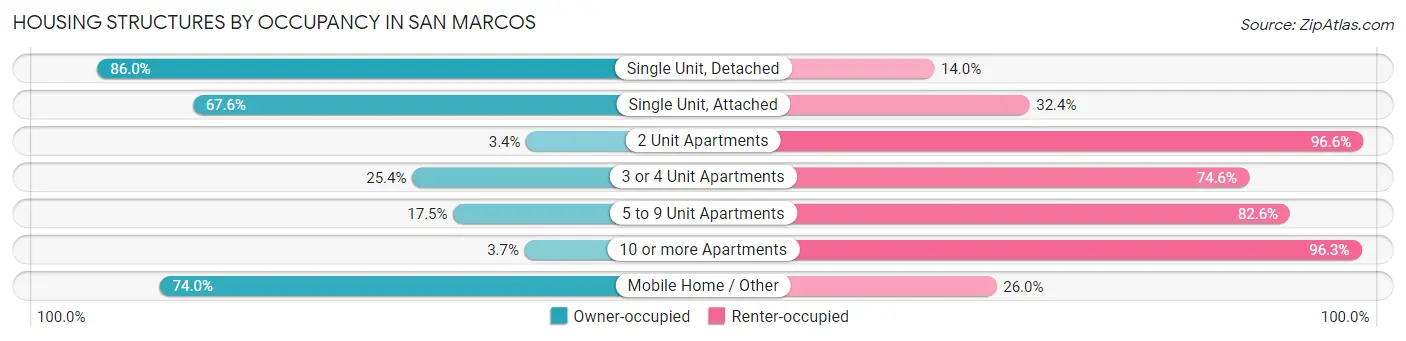
| Structure Type | Owner-occupied | Renter-occupied |
| Single Unit, Detached | 13,488 (86.0%) | 2,202 (14.0%) |
| Single Unit, Attached | 2,204 (67.6%) | 1,055 (32.4%) |
| 2 Unit Apartments | 6 (3.4%) | 171 (96.6%) |
| 3 or 4 Unit Apartments | 249 (25.4%) | 733 (74.6%) |
| 5 to 9 Unit Apartments | 192 (17.4%) | 908 (82.6%) |
| 10 or more Apartments | 217 (3.7%) | 5,645 (96.3%) |
| Mobile Home / Other | 2,540 (74.0%) | 893 (26.0%) |
| Total | 18,896 (62.0%) | 11,607 (38.1%) |
Housing Structures by Number of Rooms in San Marcos
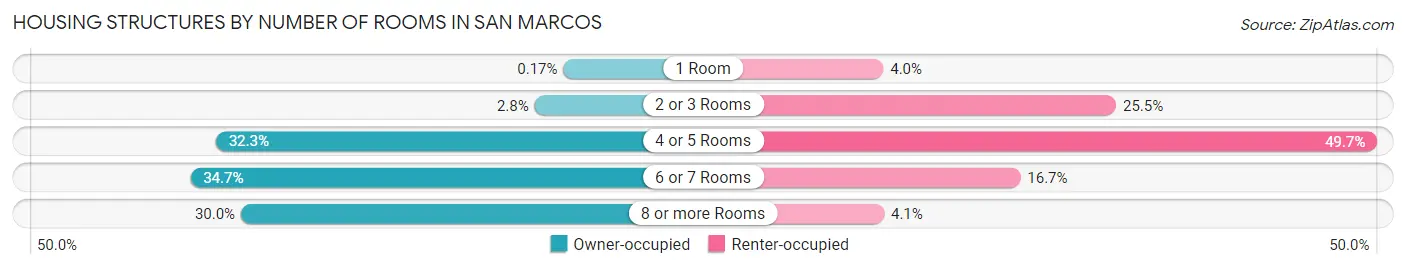
| Number of Rooms | Owner-occupied | Renter-occupied |
| 1 Room | 32 (0.2%) | 465 (4.0%) |
| 2 or 3 Rooms | 536 (2.8%) | 2,965 (25.5%) |
| 4 or 5 Rooms | 6,108 (32.3%) | 5,767 (49.7%) |
| 6 or 7 Rooms | 6,553 (34.7%) | 1,937 (16.7%) |
| 8 or more Rooms | 5,667 (30.0%) | 473 (4.1%) |
| Total | 18,896 (100.0%) | 11,607 (100.0%) |
Housing Structure by Heating Type in San Marcos
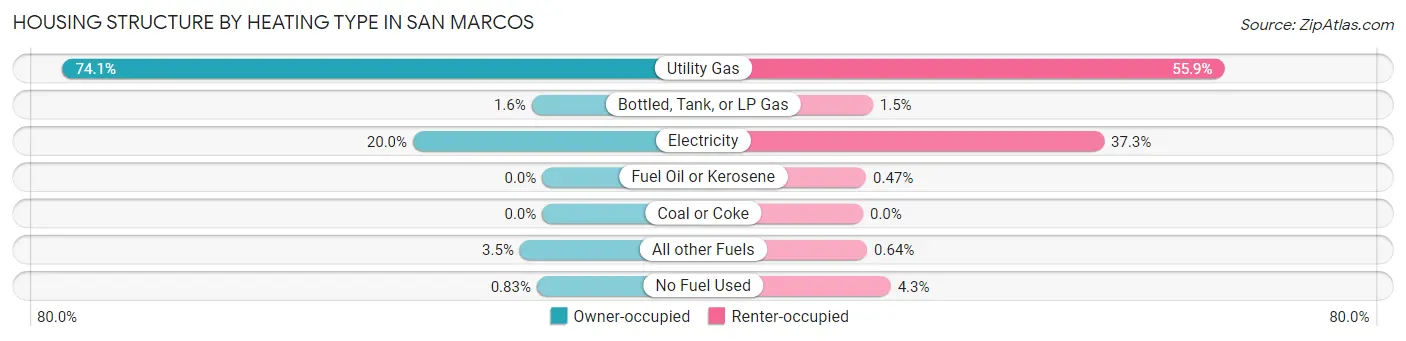
| Heating Type | Owner-occupied | Renter-occupied |
| Utility Gas | 14,003 (74.1%) | 6,482 (55.8%) |
| Bottled, Tank, or LP Gas | 308 (1.6%) | 175 (1.5%) |
| Electricity | 3,775 (20.0%) | 4,324 (37.2%) |
| Fuel Oil or Kerosene | 0 (0.0%) | 55 (0.5%) |
| Coal or Coke | 0 (0.0%) | 0 (0.0%) |
| All other Fuels | 653 (3.5%) | 74 (0.6%) |
| No Fuel Used | 157 (0.8%) | 497 (4.3%) |
| Total | 18,896 (100.0%) | 11,607 (100.0%) |
Household Vehicle Usage in San Marcos
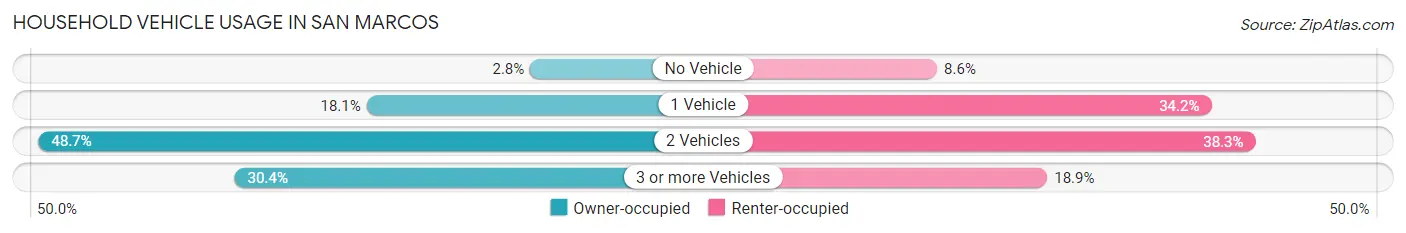
| Vehicles per Household | Owner-occupied | Renter-occupied |
| No Vehicle | 531 (2.8%) | 999 (8.6%) |
| 1 Vehicle | 3,417 (18.1%) | 3,969 (34.2%) |
| 2 Vehicles | 9,204 (48.7%) | 4,447 (38.3%) |
| 3 or more Vehicles | 5,744 (30.4%) | 2,192 (18.9%) |
| Total | 18,896 (100.0%) | 11,607 (100.0%) |
Real Estate & Mortgages in San Marcos
Real Estate and Mortgage Overview in San Marcos
| Characteristic | Without Mortgage | With Mortgage |
| Housing Units | 4,909 | 13,987 |
| Median Property Value | $540,800 | $787,500 |
| Median Household Income | $71,616 | $7,118 |
| Monthly Housing Costs | $791 | $7,918 |
| Real Estate Taxes | $3,291 | $352 |
Property Value by Mortgage Status in San Marcos
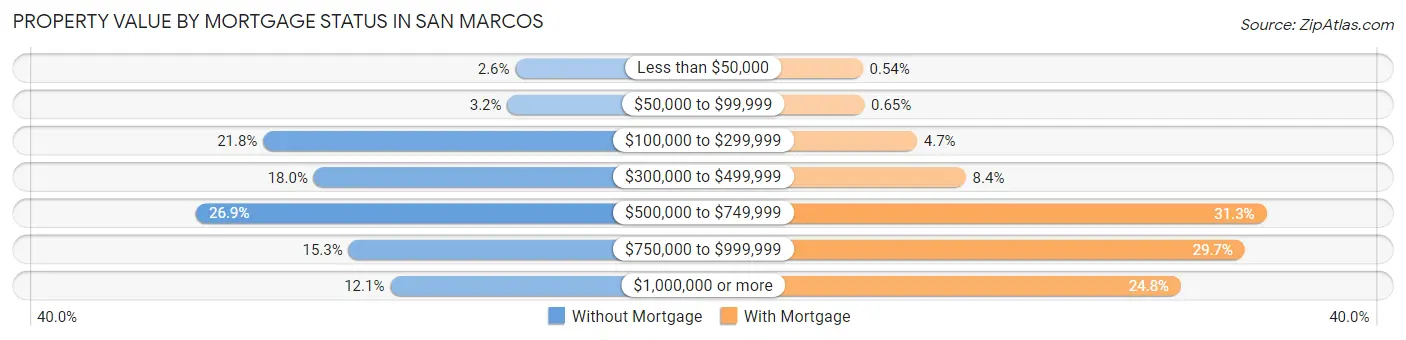
| Property Value | Without Mortgage | With Mortgage |
| Less than $50,000 | 128 (2.6%) | 76 (0.5%) |
| $50,000 to $99,999 | 158 (3.2%) | 91 (0.6%) |
| $100,000 to $299,999 | 1,071 (21.8%) | 653 (4.7%) |
| $300,000 to $499,999 | 882 (18.0%) | 1,173 (8.4%) |
| $500,000 to $749,999 | 1,322 (26.9%) | 4,378 (31.3%) |
| $750,000 to $999,999 | 752 (15.3%) | 4,149 (29.7%) |
| $1,000,000 or more | 596 (12.1%) | 3,467 (24.8%) |
| Total | 4,909 (100.0%) | 13,987 (100.0%) |
Household Income by Mortgage Status in San Marcos
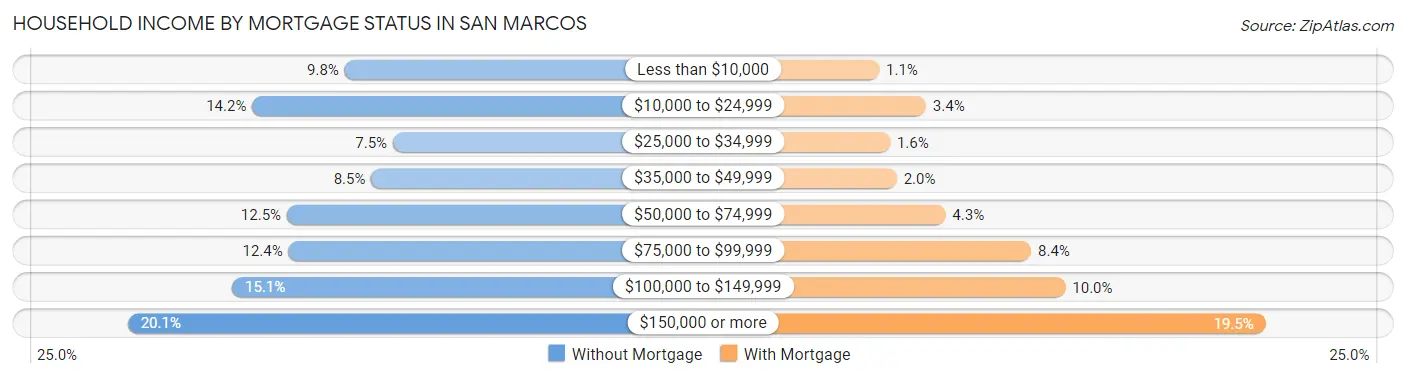
| Household Income | Without Mortgage | With Mortgage |
| Less than $10,000 | 479 (9.8%) | 156 (1.1%) |
| $10,000 to $24,999 | 695 (14.2%) | 468 (3.4%) |
| $25,000 to $34,999 | 366 (7.5%) | 230 (1.6%) |
| $35,000 to $49,999 | 417 (8.5%) | 274 (2.0%) |
| $50,000 to $74,999 | 614 (12.5%) | 599 (4.3%) |
| $75,000 to $99,999 | 610 (12.4%) | 1,169 (8.4%) |
| $100,000 to $149,999 | 742 (15.1%) | 1,398 (10.0%) |
| $150,000 or more | 986 (20.1%) | 2,731 (19.5%) |
| Total | 4,909 (100.0%) | 13,987 (100.0%) |
Property Value to Household Income Ratio in San Marcos
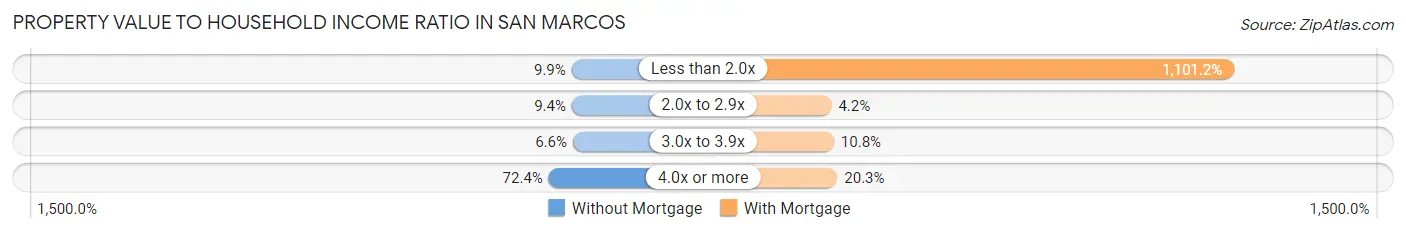
| Value-to-Income Ratio | Without Mortgage | With Mortgage |
| Less than 2.0x | 488 (9.9%) | 154,023 (1,101.2%) |
| 2.0x to 2.9x | 459 (9.3%) | 586 (4.2%) |
| 3.0x to 3.9x | 324 (6.6%) | 1,516 (10.8%) |
| 4.0x or more | 3,553 (72.4%) | 2,841 (20.3%) |
| Total | 4,909 (100.0%) | 13,987 (100.0%) |
Real Estate Taxes by Mortgage Status in San Marcos
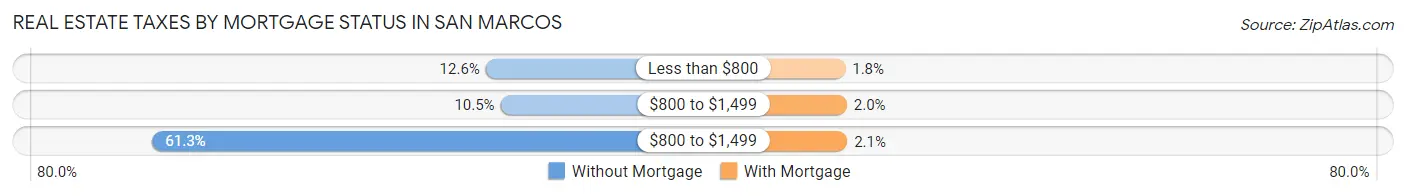
| Property Taxes | Without Mortgage | With Mortgage |
| Less than $800 | 620 (12.6%) | 251 (1.8%) |
| $800 to $1,499 | 514 (10.5%) | 282 (2.0%) |
| $800 to $1,499 | 3,010 (61.3%) | 290 (2.1%) |
| Total | 4,909 (100.0%) | 13,987 (100.0%) |
Health & Disability in San Marcos
Health Insurance Coverage by Age in San Marcos
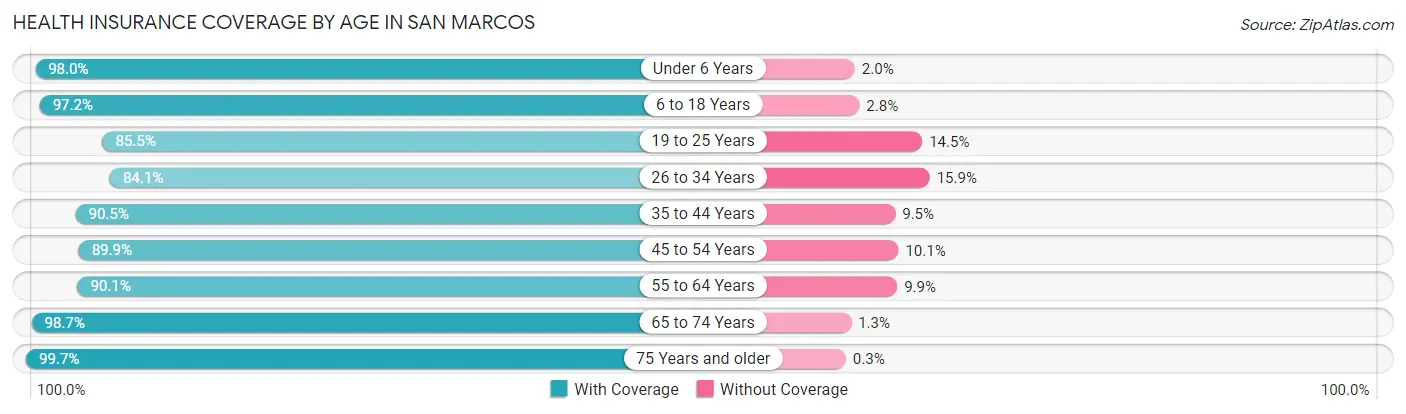
| Age Bracket | With Coverage | Without Coverage |
| Under 6 Years | 7,742 (98.0%) | 156 (2.0%) |
| 6 to 18 Years | 17,667 (97.2%) | 513 (2.8%) |
| 19 to 25 Years | 7,536 (85.5%) | 1,281 (14.5%) |
| 26 to 34 Years | 9,062 (84.1%) | 1,717 (15.9%) |
| 35 to 44 Years | 13,429 (90.5%) | 1,411 (9.5%) |
| 45 to 54 Years | 10,286 (89.9%) | 1,155 (10.1%) |
| 55 to 64 Years | 8,915 (90.1%) | 976 (9.9%) |
| 65 to 74 Years | 6,788 (98.7%) | 89 (1.3%) |
| 75 Years and older | 5,250 (99.7%) | 16 (0.3%) |
| Total | 86,675 (92.2%) | 7,314 (7.8%) |
Health Insurance Coverage by Citizenship Status in San Marcos
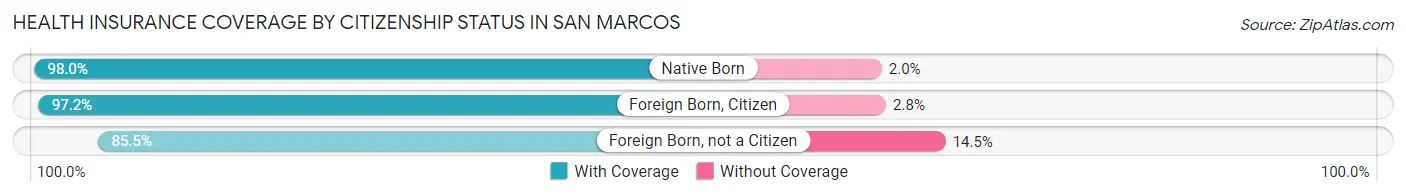
| Citizenship Status | With Coverage | Without Coverage |
| Native Born | 7,742 (98.0%) | 156 (2.0%) |
| Foreign Born, Citizen | 17,667 (97.2%) | 513 (2.8%) |
| Foreign Born, not a Citizen | 7,536 (85.5%) | 1,281 (14.5%) |
Health Insurance Coverage by Household Income in San Marcos
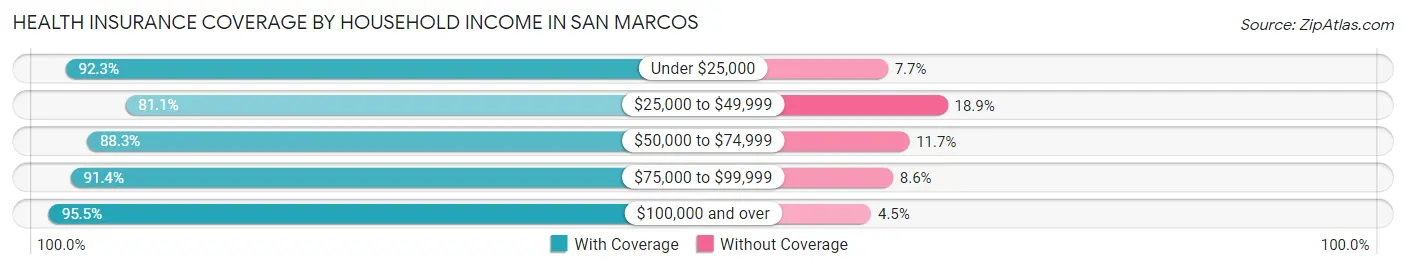
| Household Income | With Coverage | Without Coverage |
| Under $25,000 | 6,131 (92.3%) | 509 (7.7%) |
| $25,000 to $49,999 | 9,763 (81.1%) | 2,271 (18.9%) |
| $50,000 to $74,999 | 8,632 (88.3%) | 1,143 (11.7%) |
| $75,000 to $99,999 | 10,222 (91.4%) | 966 (8.6%) |
| $100,000 and over | 50,635 (95.5%) | 2,410 (4.5%) |
Public vs Private Health Insurance Coverage by Age in San Marcos
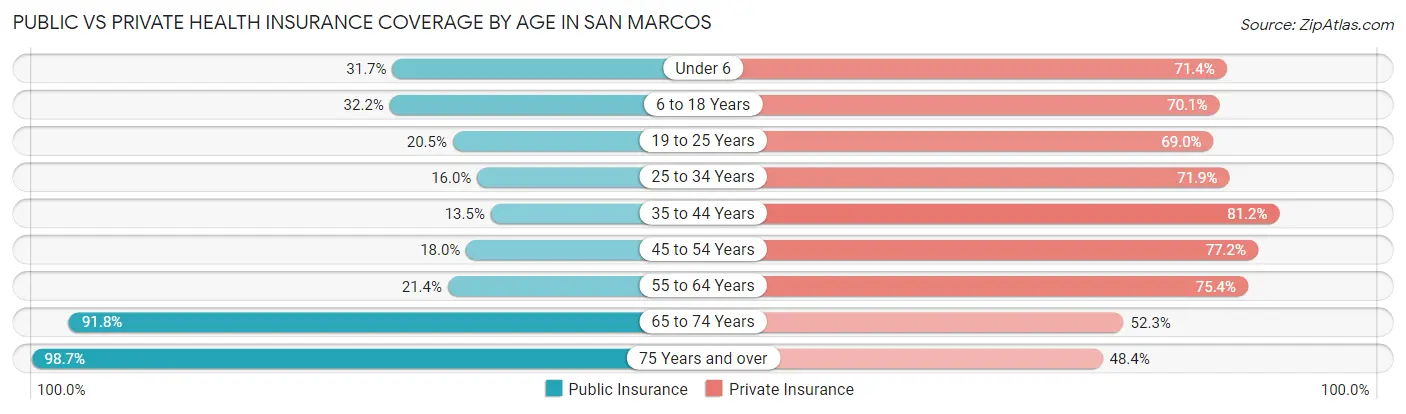
| Age Bracket | Public Insurance | Private Insurance |
| Under 6 | 2,507 (31.7%) | 5,640 (71.4%) |
| 6 to 18 Years | 5,862 (32.2%) | 12,737 (70.1%) |
| 19 to 25 Years | 1,809 (20.5%) | 6,082 (69.0%) |
| 25 to 34 Years | 1,724 (16.0%) | 7,753 (71.9%) |
| 35 to 44 Years | 2,001 (13.5%) | 12,051 (81.2%) |
| 45 to 54 Years | 2,063 (18.0%) | 8,834 (77.2%) |
| 55 to 64 Years | 2,121 (21.4%) | 7,454 (75.4%) |
| 65 to 74 Years | 6,311 (91.8%) | 3,598 (52.3%) |
| 75 Years and over | 5,197 (98.7%) | 2,549 (48.4%) |
| Total | 29,595 (31.5%) | 66,698 (71.0%) |
Disability Status by Sex by Age in San Marcos
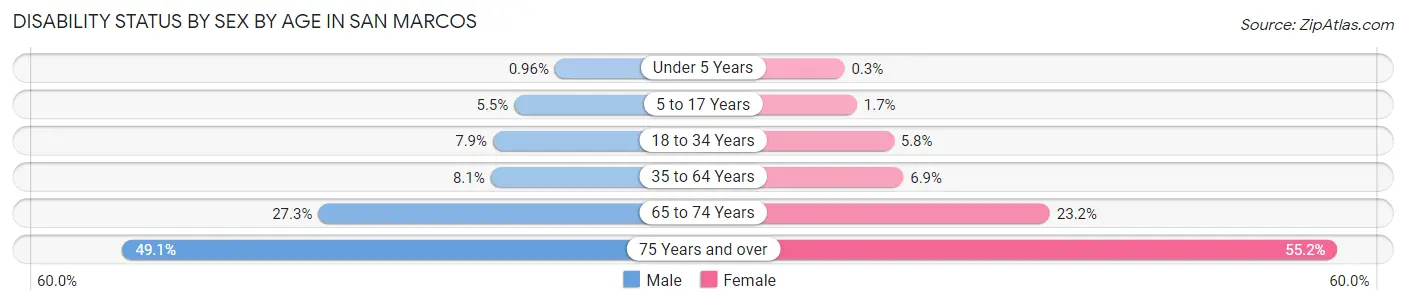
| Age Bracket | Male | Female |
| Under 5 Years | 37 (1.0%) | 8 (0.3%) |
| 5 to 17 Years | 502 (5.5%) | 146 (1.7%) |
| 18 to 34 Years | 859 (7.9%) | 600 (5.8%) |
| 35 to 64 Years | 1,490 (8.1%) | 1,219 (6.9%) |
| 65 to 74 Years | 778 (27.3%) | 933 (23.2%) |
| 75 Years and over | 1,001 (49.1%) | 1,781 (55.2%) |
Disability Class by Sex by Age in San Marcos
Disability Class: Hearing Difficulty
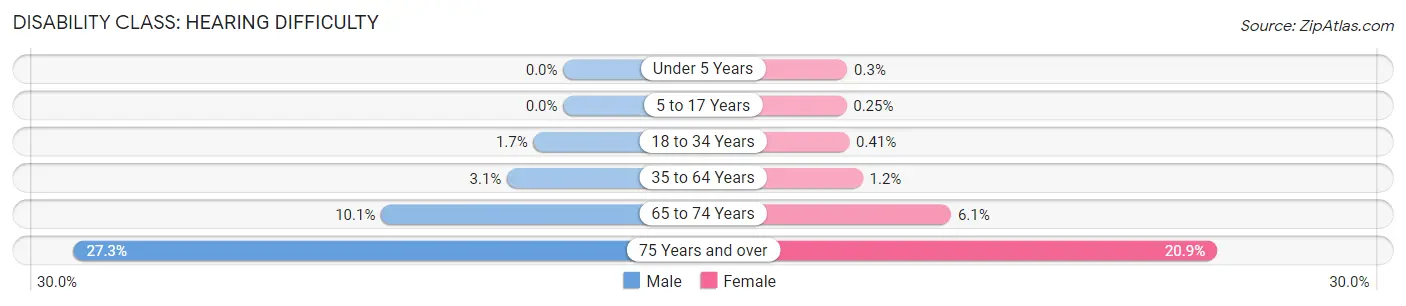
| Age Bracket | Male | Female |
| Under 5 Years | 0 (0.0%) | 8 (0.3%) |
| 5 to 17 Years | 0 (0.0%) | 22 (0.3%) |
| 18 to 34 Years | 182 (1.7%) | 42 (0.4%) |
| 35 to 64 Years | 576 (3.1%) | 206 (1.2%) |
| 65 to 74 Years | 289 (10.1%) | 245 (6.1%) |
| 75 Years and over | 556 (27.3%) | 674 (20.9%) |
Disability Class: Vision Difficulty
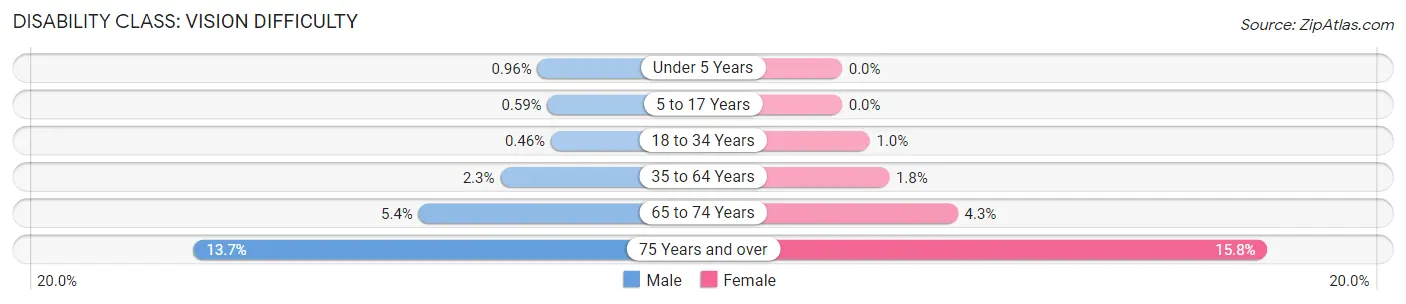
| Age Bracket | Male | Female |
| Under 5 Years | 37 (1.0%) | 0 (0.0%) |
| 5 to 17 Years | 54 (0.6%) | 0 (0.0%) |
| 18 to 34 Years | 50 (0.5%) | 107 (1.0%) |
| 35 to 64 Years | 430 (2.3%) | 311 (1.8%) |
| 65 to 74 Years | 153 (5.4%) | 173 (4.3%) |
| 75 Years and over | 280 (13.7%) | 510 (15.8%) |
Disability Class: Cognitive Difficulty
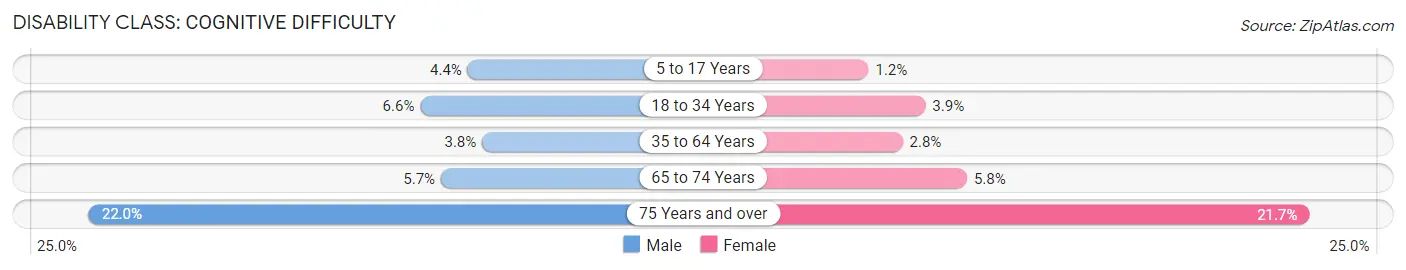
| Age Bracket | Male | Female |
| 5 to 17 Years | 407 (4.4%) | 108 (1.2%) |
| 18 to 34 Years | 726 (6.6%) | 402 (3.9%) |
| 35 to 64 Years | 692 (3.8%) | 502 (2.8%) |
| 65 to 74 Years | 162 (5.7%) | 234 (5.8%) |
| 75 Years and over | 449 (22.0%) | 700 (21.7%) |
Disability Class: Ambulatory Difficulty
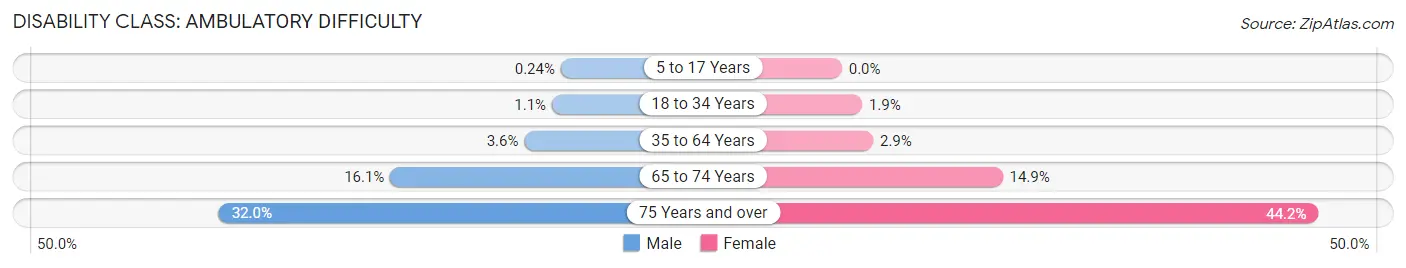
| Age Bracket | Male | Female |
| 5 to 17 Years | 22 (0.2%) | 0 (0.0%) |
| 18 to 34 Years | 116 (1.1%) | 194 (1.9%) |
| 35 to 64 Years | 666 (3.6%) | 517 (2.9%) |
| 65 to 74 Years | 458 (16.1%) | 601 (14.9%) |
| 75 Years and over | 652 (32.0%) | 1,427 (44.2%) |
Disability Class: Self-Care Difficulty
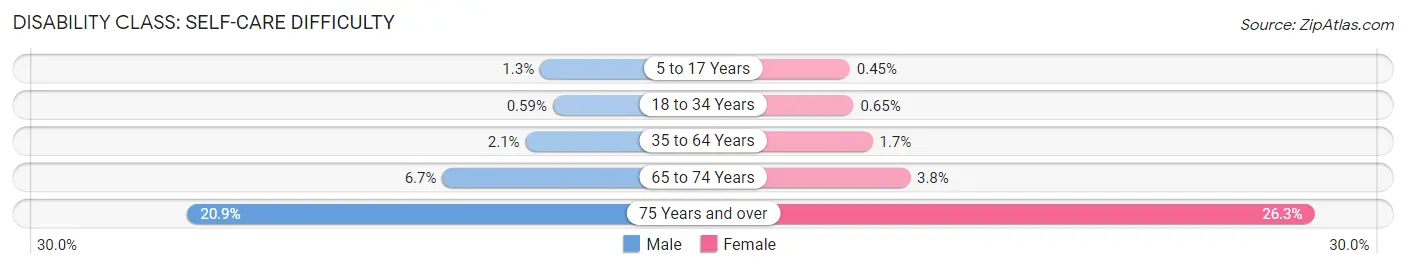
| Age Bracket | Male | Female |
| 5 to 17 Years | 119 (1.3%) | 39 (0.4%) |
| 18 to 34 Years | 64 (0.6%) | 67 (0.6%) |
| 35 to 64 Years | 387 (2.1%) | 304 (1.7%) |
| 65 to 74 Years | 192 (6.7%) | 153 (3.8%) |
| 75 Years and over | 427 (20.9%) | 849 (26.3%) |
Technology Access in San Marcos
Computing Device Access in San Marcos
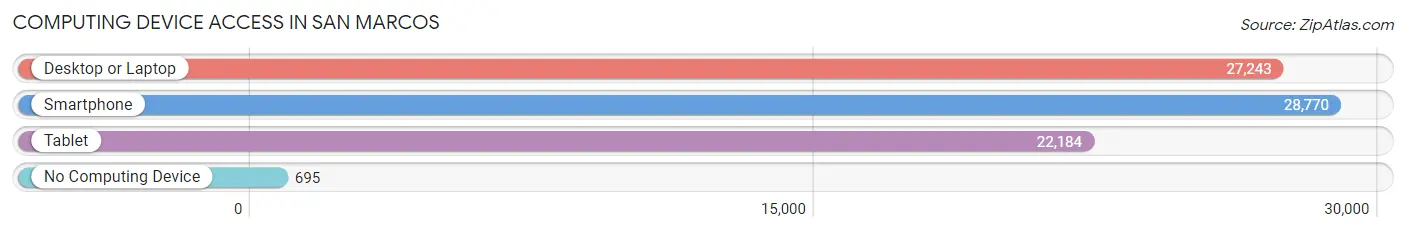
| Device Type | # Households | % Households |
| Desktop or Laptop | 27,243 | 89.3% |
| Smartphone | 28,770 | 94.3% |
| Tablet | 22,184 | 72.7% |
| No Computing Device | 695 | 2.3% |
| Total | 30,503 | 100.0% |
Internet Access in San Marcos
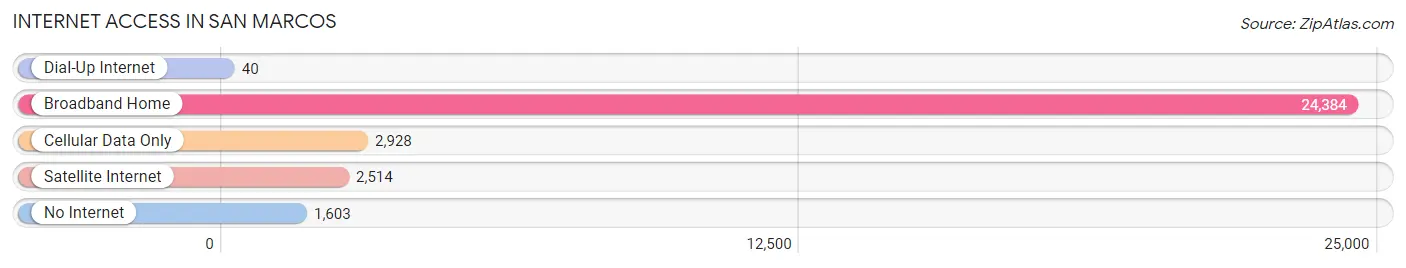
| Internet Type | # Households | % Households |
| Dial-Up Internet | 40 | 0.1% |
| Broadband Home | 24,384 | 79.9% |
| Cellular Data Only | 2,928 | 9.6% |
| Satellite Internet | 2,514 | 8.2% |
| No Internet | 1,603 | 5.3% |
| Total | 30,503 | 100.0% |
San Marcos Summary
History
The city of San Marcos, California is located in the North County region of San Diego County. It is situated in the foothills of the Santa Margarita Mountains and is bordered by the cities of Vista, Escondido, and Carlsbad. The city was founded in 1963 and incorporated in 1963.
The area that is now San Marcos was originally inhabited by the Luiseño Indians, who were part of the Shoshonean language group. The Luiseño Indians lived in the area for thousands of years before the arrival of the Spanish in the late 1700s. The Spanish established a mission in the area in 1798, and the area was later part of the Rancho Vallecitos de San Marcos land grant.
In the late 1800s, the area began to be settled by farmers and ranchers, and the first post office was established in 1887. The city was officially incorporated in 1963, and the population has grown steadily since then.
Geography
San Marcos is located in the North County region of San Diego County, in the foothills of the Santa Margarita Mountains. It is bordered by the cities of Vista, Escondido, and Carlsbad. The city covers an area of approximately 18.5 square miles and has a population of approximately 83,781 people.
The city is situated at an elevation of approximately 500 feet above sea level and is located in a semi-arid climate zone. The average annual temperature is approximately 70 degrees Fahrenheit, and the average annual precipitation is approximately 10 inches.
Economy
San Marcos is home to a diverse economy, with a variety of industries represented. The city is home to several large employers, including California State University San Marcos, Palomar College, and the San Marcos Unified School District.
The city is also home to a number of technology companies, including Sony, Qualcomm, and Hewlett-Packard. The city is also home to a number of retail and service businesses, including restaurants, banks, and other retail stores.
Demographics
As of the 2010 census, the population of San Marcos was 83,781. The racial makeup of the city was 68.2% White, 8.3% African American, 0.7% Native American, 11.2% Asian, 0.3% Pacific Islander, 6.2% from other races, and 5.3% from two or more races. Hispanic or Latino of any race were 22.9% of the population.
The median income for a household in the city was $60,837, and the median income for a family was $71,837. The per capita income for the city was $25,837. About 8.2% of families and 11.2% of the population were below the poverty line, including 15.2% of those under age 18 and 6.2% of those age 65 or over.
Common Questions
What is Per Capita Income in San Marcos?
Per Capita income in San Marcos is $42,194.
What is the Median Family Income in San Marcos?
Median Family Income in San Marcos is $119,616.
What is the Median Household income in San Marcos?
Median Household Income in San Marcos is $99,413.
What is Income or Wage Gap in San Marcos?
Income or Wage Gap in San Marcos is 28.7%.
Women in San Marcos earn 71.3 cents for every dollar earned by a man.
What is Family Income Deficit in San Marcos?
Family Income Deficit in San Marcos is $9,592.
Families that are below poverty line in San Marcos earn $9,592 less on average than the poverty threshold level.
What is Inequality or Gini Index in San Marcos?
Inequality or Gini Index in San Marcos is 0.45.
What is the Total Population of San Marcos?
Total Population of San Marcos is 94,360.
What is the Total Male Population of San Marcos?
Total Male Population of San Marcos is 47,444.
What is the Total Female Population of San Marcos?
Total Female Population of San Marcos is 46,916.
What is the Ratio of Males per 100 Females in San Marcos?
There are 101.13 Males per 100 Females in San Marcos.
What is the Ratio of Females per 100 Males in San Marcos?
There are 98.89 Females per 100 Males in San Marcos.
What is the Median Population Age in San Marcos?
Median Population Age in San Marcos is 35.9 Years.
What is the Average Family Size in San Marcos
Average Family Size in San Marcos is 3.5 People.
What is the Average Household Size in San Marcos
Average Household Size in San Marcos is 3.0 People.
How Large is the Labor Force in San Marcos?
There are 47,439 People in the Labor Forcein in San Marcos.
What is the Percentage of People in the Labor Force in San Marcos?
65.6% of People are in the Labor Force in San Marcos.
What is the Unemployment Rate in San Marcos?
Unemployment Rate in San Marcos is 4.2%.