Cities with the Lowest Percentage of Births to Unmarried Women over the Age of 35 in Pennsylvania
RELATED REPORTS & OPTIONS
Lowest Illegitimacy | Women 35+
Pennsylvania
Compare Cities
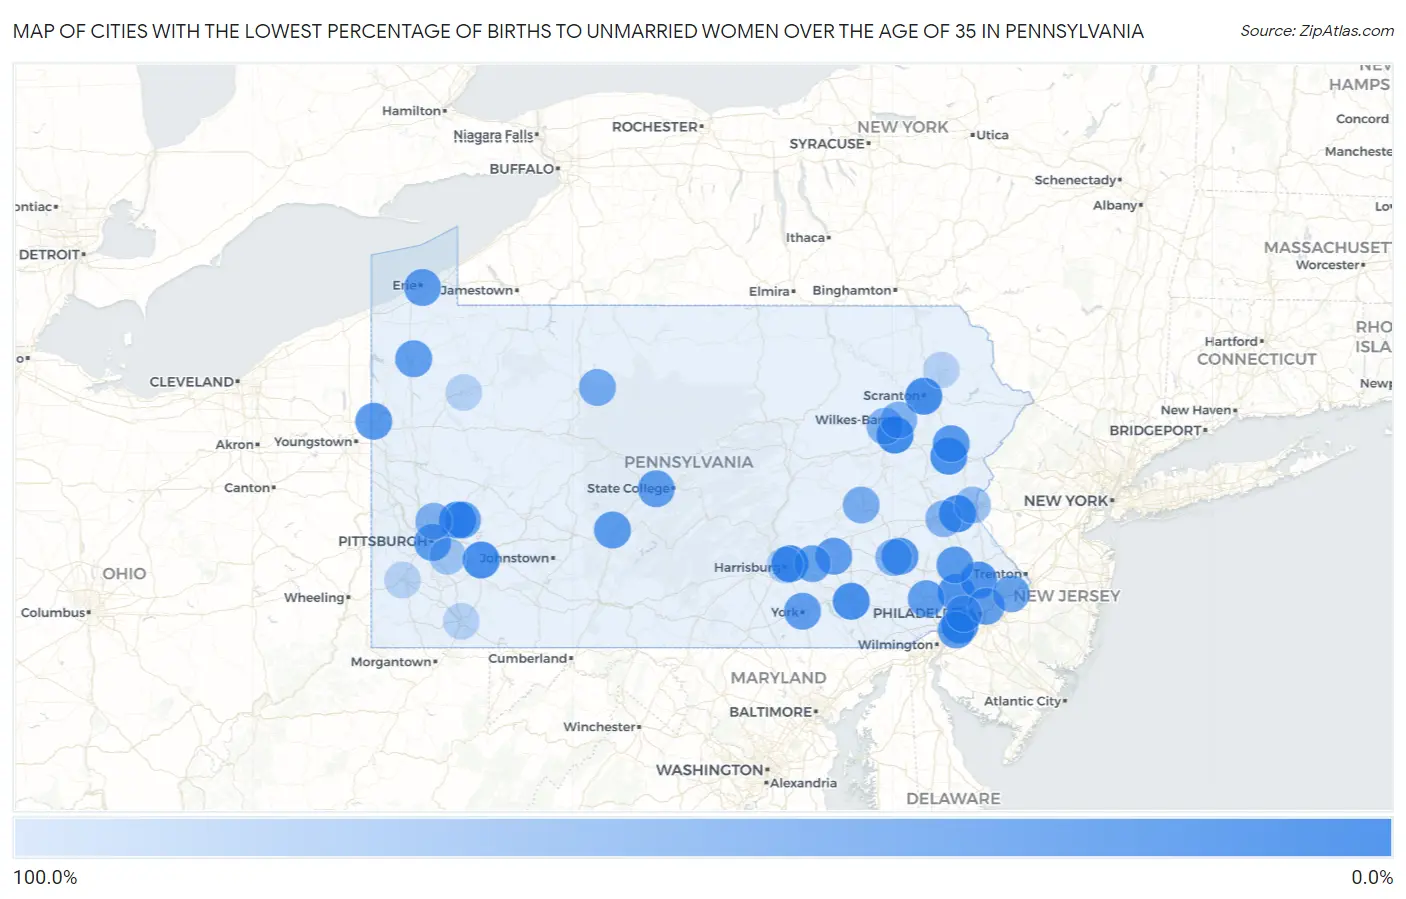
Map of Cities with the Lowest Percentage of Births to Unmarried Women over the Age of 35 in Pennsylvania
100.0%
0.0%
Cities with the Lowest Percentage of Births to Unmarried Women over the Age of 35 in Pennsylvania
| City | % Unmarried | vs State | vs National | |
| 1. | Kingston Borough | 1.7% | 19.9%(-18.2)#1 | 20.1%(-18.4)#17 |
| 2. | Woodlyn | 7.7% | 19.9%(-12.2)#2 | 20.1%(-12.4)#239 |
| 3. | Clearfield Borough | 7.7% | 19.9%(-12.2)#3 | 20.1%(-12.4)#241 |
| 4. | Progress | 8.1% | 19.9%(-11.8)#4 | 20.1%(-12.0)#264 |
| 5. | Mountain Top | 9.8% | 19.9%(-10.1)#5 | 20.1%(-10.3)#340 |
| 6. | Bellevue Borough | 11.1% | 19.9%(-8.80)#6 | 20.1%(-9.00)#396 |
| 7. | Arnold | 12.2% | 19.9%(-7.70)#7 | 20.1%(-7.90)#446 |
| 8. | Scranton | 12.4% | 19.9%(-7.50)#8 | 20.1%(-7.70)#455 |
| 9. | Bethlehem | 13.5% | 19.9%(-6.40)#9 | 20.1%(-6.60)#516 |
| 10. | Chambersburg Borough | 14.0% | 19.9%(-5.90)#10 | 20.1%(-6.10)#554 |
| 11. | Lancaster | 14.2% | 19.9%(-5.70)#11 | 20.1%(-5.90)#561 |
| 12. | Pillow Borough | 14.3% | 19.9%(-5.60)#12 | 20.1%(-5.80)#573 |
| 13. | Norristown Borough | 14.5% | 19.9%(-5.40)#13 | 20.1%(-5.60)#579 |
| 14. | Greensburg | 17.0% | 19.9%(-2.90)#14 | 20.1%(-3.10)#733 |
| 15. | Sierra View | 17.2% | 19.9%(-2.70)#15 | 20.1%(-2.90)#741 |
| 16. | King Of Prussia | 19.4% | 19.9%(-0.500)#16 | 20.1%(-0.700)#847 |
| 17. | Maple Glen | 23.3% | 19.9%(+3.40)#17 | 20.1%(+3.20)#1,035 |
| 18. | Sellersville Borough | 23.3% | 19.9%(+3.40)#18 | 20.1%(+3.20)#1,037 |
| 19. | Valley View Cdp York County | 23.5% | 19.9%(+3.60)#19 | 20.1%(+3.40)#1,048 |
| 20. | Hellertown Borough | 25.0% | 19.9%(+5.10)#20 | 20.1%(+4.90)#1,108 |
| 21. | Pennside | 25.0% | 19.9%(+5.10)#21 | 20.1%(+4.90)#1,109 |
| 22. | Quakertown Borough | 25.9% | 19.9%(+6.00)#22 | 20.1%(+5.80)#1,155 |
| 23. | Camp Hill Borough | 26.2% | 19.9%(+6.30)#23 | 20.1%(+6.10)#1,168 |
| 24. | Harleysville | 27.8% | 19.9%(+7.90)#24 | 20.1%(+7.70)#1,238 |
| 25. | Emerald Lakes | 28.2% | 19.9%(+8.30)#25 | 20.1%(+8.10)#1,261 |
| 26. | Sharon | 28.6% | 19.9%(+8.70)#26 | 20.1%(+8.50)#1,278 |
| 27. | Penn Borough | 28.6% | 19.9%(+8.70)#27 | 20.1%(+8.50)#1,285 |
| 28. | Wyalusing Borough | 28.6% | 19.9%(+8.70)#28 | 20.1%(+8.50)#1,286 |
| 29. | Altoona | 29.3% | 19.9%(+9.40)#29 | 20.1%(+9.20)#1,314 |
| 30. | Chester | 29.7% | 19.9%(+9.80)#30 | 20.1%(+9.60)#1,330 |
| 31. | Roaring Spring Borough | 30.0% | 19.9%(+10.1)#31 | 20.1%(+9.90)#1,346 |
| 32. | Erie | 30.4% | 19.9%(+10.5)#32 | 20.1%(+10.3)#1,360 |
| 33. | Pittsburgh | 31.0% | 19.9%(+11.1)#33 | 20.1%(+10.9)#1,379 |
| 34. | Doylestown Borough | 31.3% | 19.9%(+11.4)#34 | 20.1%(+11.2)#1,394 |
| 35. | Philadelphia | 32.3% | 19.9%(+12.4)#35 | 20.1%(+12.2)#1,432 |
| 36. | York | 33.3% | 19.9%(+13.4)#36 | 20.1%(+13.2)#1,458 |
| 37. | Columbia Borough | 33.3% | 19.9%(+13.4)#37 | 20.1%(+13.2)#1,471 |
| 38. | Pleasant Hill | 33.3% | 19.9%(+13.4)#38 | 20.1%(+13.2)#1,482 |
| 39. | Stormstown | 33.3% | 19.9%(+13.4)#39 | 20.1%(+13.2)#1,487 |
| 40. | Courtdale Borough | 33.3% | 19.9%(+13.4)#40 | 20.1%(+13.2)#1,503 |
| 41. | Lionville | 34.2% | 19.9%(+14.3)#41 | 20.1%(+14.1)#1,531 |
| 42. | Meadville | 34.6% | 19.9%(+14.7)#42 | 20.1%(+14.5)#1,544 |
| 43. | Edgeworth Borough | 36.4% | 19.9%(+16.5)#43 | 20.1%(+16.3)#1,618 |
| 44. | Conway Borough | 36.8% | 19.9%(+16.9)#44 | 20.1%(+16.7)#1,630 |
| 45. | Phoenixville Borough | 39.0% | 19.9%(+19.1)#45 | 20.1%(+18.9)#1,710 |
| 46. | Lower Burrell | 40.4% | 19.9%(+20.5)#46 | 20.1%(+20.3)#1,770 |
| 47. | Croydon | 40.5% | 19.9%(+20.6)#47 | 20.1%(+20.4)#1,772 |
| 48. | Hershey | 41.2% | 19.9%(+21.3)#48 | 20.1%(+21.1)#1,790 |
| 49. | Old Forge Borough | 41.9% | 19.9%(+22.0)#49 | 20.1%(+21.8)#1,808 |
| 50. | St Marys | 48.8% | 19.9%(+28.9)#50 | 20.1%(+28.7)#2,006 |
| 51. | Hughesville Borough | 50.0% | 19.9%(+30.1)#51 | 20.1%(+29.9)#2,052 |
| 52. | Patterson Heights Borough | 50.0% | 19.9%(+30.1)#52 | 20.1%(+29.9)#2,067 |
| 53. | Laurel Run Borough | 50.0% | 19.9%(+30.1)#53 | 20.1%(+29.9)#2,072 |
| 54. | Mapleton Borough | 50.0% | 19.9%(+30.1)#54 | 20.1%(+29.9)#2,074 |
| 55. | Hatboro Borough | 50.6% | 19.9%(+30.7)#55 | 20.1%(+30.5)#2,084 |
| 56. | Pottsville | 51.7% | 19.9%(+31.8)#56 | 20.1%(+31.6)#2,113 |
| 57. | Tyrone Borough | 52.0% | 19.9%(+32.1)#57 | 20.1%(+31.9)#2,121 |
| 58. | West Chester Borough | 52.6% | 19.9%(+32.7)#58 | 20.1%(+32.5)#2,135 |
| 59. | West Homestead Borough | 54.5% | 19.9%(+34.6)#59 | 20.1%(+34.4)#2,181 |
| 60. | Reading | 55.4% | 19.9%(+35.5)#60 | 20.1%(+35.3)#2,195 |
| 61. | Port Carbon Borough | 55.6% | 19.9%(+35.7)#61 | 20.1%(+35.5)#2,202 |
| 62. | Folcroft Borough | 57.8% | 19.9%(+37.9)#62 | 20.1%(+37.7)#2,250 |
| 63. | Allison Park | 58.1% | 19.9%(+38.2)#63 | 20.1%(+38.0)#2,261 |
| 64. | Fleetwood Borough | 58.3% | 19.9%(+38.4)#64 | 20.1%(+38.2)#2,263 |
| 65. | Pottstown Borough | 58.8% | 19.9%(+38.9)#65 | 20.1%(+38.7)#2,274 |
| 66. | Nanticoke | 58.8% | 19.9%(+38.9)#66 | 20.1%(+38.7)#2,275 |
| 67. | Wilkes Barre | 60.0% | 19.9%(+40.1)#67 | 20.1%(+39.9)#2,292 |
| 68. | New Holland Borough | 60.0% | 19.9%(+40.1)#68 | 20.1%(+39.9)#2,298 |
| 69. | Lewis Run Borough | 60.0% | 19.9%(+40.1)#69 | 20.1%(+39.9)#2,303 |
| 70. | North Apollo Borough | 61.5% | 19.9%(+41.6)#70 | 20.1%(+41.4)#2,333 |
| 71. | Drexel Hill | 62.2% | 19.9%(+42.3)#71 | 20.1%(+42.1)#2,347 |
| 72. | Allentown | 62.6% | 19.9%(+42.7)#72 | 20.1%(+42.5)#2,365 |
| 73. | Lansdale Borough | 63.9% | 19.9%(+44.0)#73 | 20.1%(+43.8)#2,391 |
| 74. | Ephrata Borough | 66.7% | 19.9%(+46.8)#74 | 20.1%(+46.6)#2,444 |
| 75. | Ellwood City Borough | 66.7% | 19.9%(+46.8)#75 | 20.1%(+46.6)#2,448 |
| 76. | Emsworth Borough | 66.7% | 19.9%(+46.8)#76 | 20.1%(+46.6)#2,454 |
| 77. | New Albany Borough | 69.2% | 19.9%(+49.3)#77 | 20.1%(+49.1)#2,499 |
| 78. | Brentwood Borough | 71.6% | 19.9%(+51.7)#78 | 20.1%(+51.5)#2,528 |
| 79. | Easton | 72.5% | 19.9%(+52.6)#79 | 20.1%(+52.4)#2,539 |
| 80. | Highspire Borough | 74.1% | 19.9%(+54.2)#80 | 20.1%(+54.0)#2,557 |
| 81. | Stroudsburg Borough | 75.9% | 19.9%(+56.0)#81 | 20.1%(+55.8)#2,583 |
| 82. | Blakely Borough | 76.7% | 19.9%(+56.8)#82 | 20.1%(+56.6)#2,593 |
| 83. | Greencastle Borough | 78.0% | 19.9%(+58.1)#83 | 20.1%(+57.9)#2,609 |
| 84. | Mckeesport | 80.4% | 19.9%(+60.5)#84 | 20.1%(+60.3)#2,632 |
| 85. | West Mifflin Borough | 84.2% | 19.9%(+64.3)#85 | 20.1%(+64.1)#2,665 |
| 86. | Harrisburg | 91.7% | 19.9%(+71.8)#86 | 20.1%(+71.6)#2,714 |
| 87. | Darby Borough | 93.9% | 19.9%(+74.0)#87 | 20.1%(+73.8)#2,726 |
| 88. | Washington | 100.0% | 19.9%(+80.1)#88 | 20.1%(+79.9)#2,847 |
| 89. | Uniontown | 100.0% | 19.9%(+80.1)#89 | 20.1%(+79.9)#2,924 |
| 90. | Oil City | 100.0% | 19.9%(+80.1)#90 | 20.1%(+79.9)#2,935 |
| 91. | East Stroudsburg Borough | 100.0% | 19.9%(+80.1)#91 | 20.1%(+79.9)#2,941 |
| 92. | Carbondale | 100.0% | 19.9%(+80.1)#92 | 20.1%(+79.9)#2,956 |
| 93. | Ambridge Borough | 100.0% | 19.9%(+80.1)#93 | 20.1%(+79.9)#3,013 |
| 94. | Tamaqua Borough | 100.0% | 19.9%(+80.1)#94 | 20.1%(+79.9)#3,016 |
| 95. | Plymouth Borough | 100.0% | 19.9%(+80.1)#95 | 20.1%(+79.9)#3,073 |
| 96. | Oxford Borough | 100.0% | 19.9%(+80.1)#96 | 20.1%(+79.9)#3,076 |
| 97. | Exeter Borough | 100.0% | 19.9%(+80.1)#97 | 20.1%(+79.9)#3,088 |
| 98. | Olyphant Borough | 100.0% | 19.9%(+80.1)#98 | 20.1%(+79.9)#3,100 |
| 99. | Collegeville Borough | 100.0% | 19.9%(+80.1)#99 | 20.1%(+79.9)#3,110 |
| 100. | Edinboro Borough | 100.0% | 19.9%(+80.1)#100 | 20.1%(+79.9)#3,123 |
Common Questions
What are the Top 10 Cities with the Lowest Percentage of Births to Unmarried Women over the Age of 35 in Pennsylvania?
Top 10 Cities with the Lowest Percentage of Births to Unmarried Women over the Age of 35 in Pennsylvania are:
#1
7.7%
#2
8.1%
#3
9.8%
#4
12.2%
#5
12.4%
#6
13.5%
#7
14.2%
#8
17.0%
#9
17.2%
#10
19.4%
What city has the Lowest Percentage of Births to Unmarried Women over the Age of 35 in Pennsylvania?
Woodlyn has the Lowest Percentage of Births to Unmarried Women over the Age of 35 in Pennsylvania with 7.7%.
What is the Percentage of Births to Unmarried Women over the Age of 35 in the State of Pennsylvania?
Percentage of Births to Unmarried Women over the Age of 35 in Pennsylvania is 19.9%.
What is the Percentage of Births to Unmarried Women over the Age of 35 in the United States?
Percentage of Births to Unmarried Women over the Age of 35 in the United States is 20.1%.