Artesia, CA Map & Demographics
Artesia Map
Artesia Overview
$29,781
PER CAPITA INCOME
$95,417
AVG FAMILY INCOME
$92,702
AVG HOUSEHOLD INCOME
25.8%
WAGE / INCOME GAP [ % ]
74.2¢/ $1
WAGE / INCOME GAP [ $ ]
$15,781
FAMILY INCOME DEFICIT
0.39
INEQUALITY / GINI INDEX
16,237
TOTAL POPULATION
7,787
MALE POPULATION
8,450
FEMALE POPULATION
92.15
MALES / 100 FEMALES
108.51
FEMALES / 100 MALES
39.1
MEDIAN AGE
3.8
AVG FAMILY SIZE
3.5
AVG HOUSEHOLD SIZE
8,216
LABOR FORCE [ PEOPLE ]
60.9%
PERCENT IN LABOR FORCE
9.1%
UNEMPLOYMENT RATE
Artesia Zip Codes
Artesia Area Codes
Income in Artesia
Income Overview in Artesia
Per Capita Income in Artesia is $29,781, while median incomes of families and households are $95,417 and $92,702 respectively.
| Characteristic | Number | Measure |
| Per Capita Income | 16,237 | $29,781 |
| Median Family Income | 3,719 | $95,417 |
| Mean Family Income | 3,719 | $106,903 |
| Median Household Income | 4,484 | $92,702 |
| Mean Household Income | 4,484 | $102,932 |
| Income Deficit | 3,719 | $15,781 |
| Wage / Income Gap (%) | 16,237 | 25.83% |
| Wage / Income Gap ($) | 16,237 | 74.17¢ per $1 |
| Gini / Inequality Index | 16,237 | 0.39 |
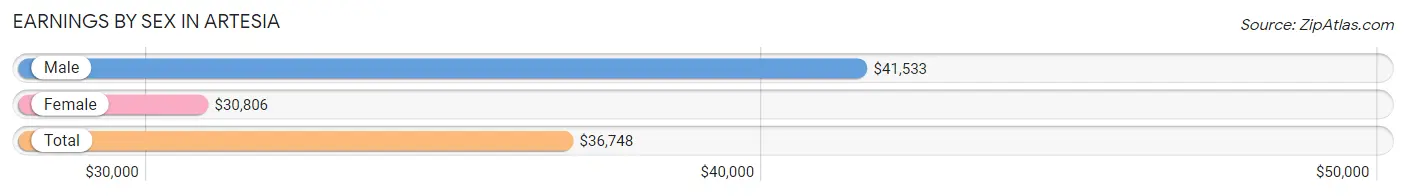
Earnings by Sex in Artesia
Average Earnings in Artesia are $36,748, $41,533 for men and $30,806 for women, a difference of 25.8%.
| Sex | Number | Average Earnings |
| Male | 4,263 (52.9%) | $41,533 |
| Female | 3,797 (47.1%) | $30,806 |
| Total | 8,060 (100.0%) | $36,748 |
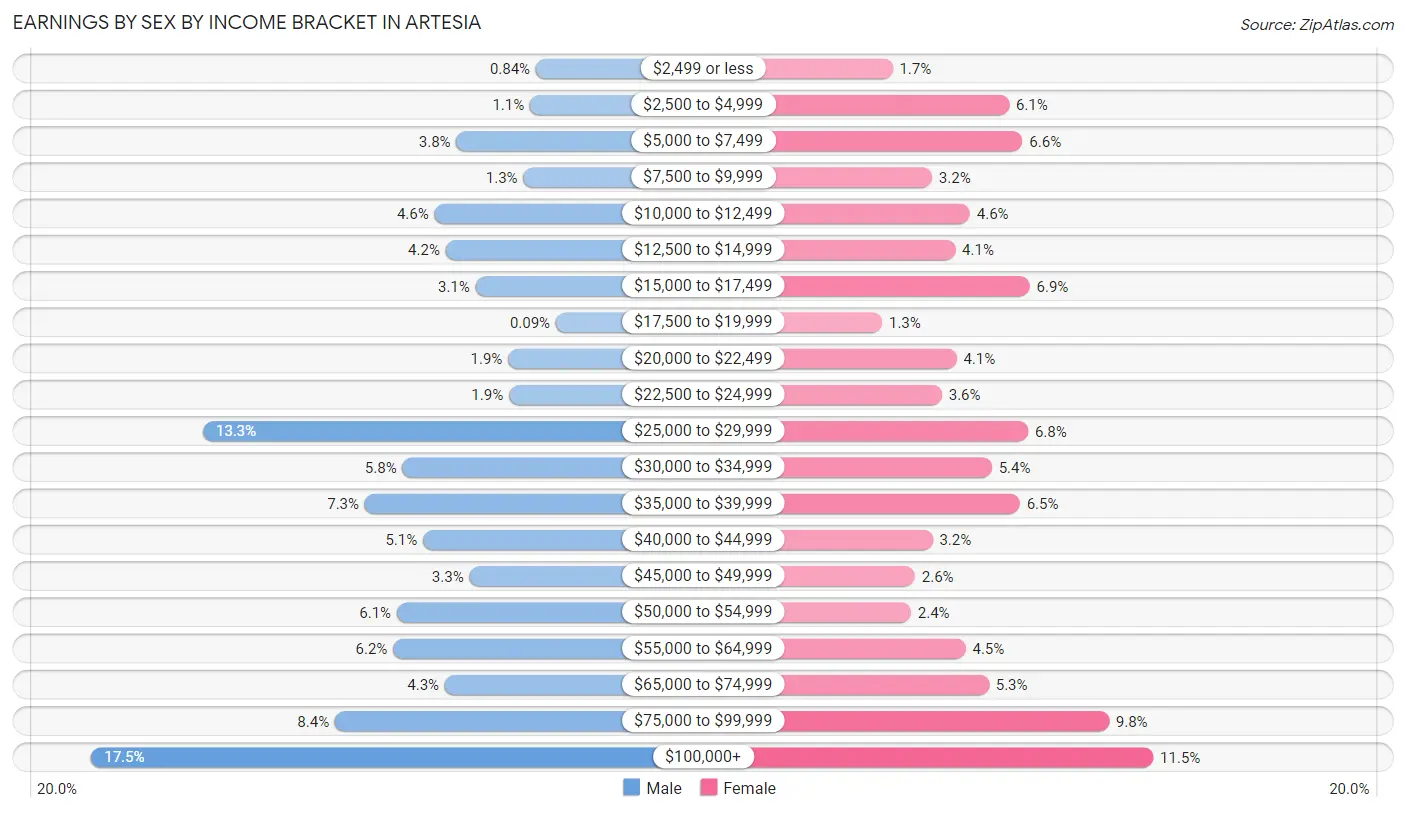
Earnings by Sex by Income Bracket in Artesia
The most common earnings brackets in Artesia are $100,000+ for men (746 | 17.5%) and $100,000+ for women (436 | 11.5%).
| Income | Male | Female |
| $2,499 or less | 36 (0.8%) | 65 (1.7%) |
| $2,500 to $4,999 | 45 (1.1%) | 231 (6.1%) |
| $5,000 to $7,499 | 163 (3.8%) | 250 (6.6%) |
| $7,500 to $9,999 | 56 (1.3%) | 121 (3.2%) |
| $10,000 to $12,499 | 198 (4.6%) | 175 (4.6%) |
| $12,500 to $14,999 | 180 (4.2%) | 154 (4.1%) |
| $15,000 to $17,499 | 132 (3.1%) | 260 (6.9%) |
| $17,500 to $19,999 | 4 (0.1%) | 50 (1.3%) |
| $20,000 to $22,499 | 80 (1.9%) | 156 (4.1%) |
| $22,500 to $24,999 | 79 (1.8%) | 135 (3.6%) |
| $25,000 to $29,999 | 568 (13.3%) | 258 (6.8%) |
| $30,000 to $34,999 | 249 (5.8%) | 206 (5.4%) |
| $35,000 to $39,999 | 309 (7.2%) | 246 (6.5%) |
| $40,000 to $44,999 | 216 (5.1%) | 122 (3.2%) |
| $45,000 to $49,999 | 142 (3.3%) | 97 (2.5%) |
| $50,000 to $54,999 | 258 (6.0%) | 91 (2.4%) |
| $55,000 to $64,999 | 264 (6.2%) | 169 (4.4%) |
| $65,000 to $74,999 | 181 (4.3%) | 202 (5.3%) |
| $75,000 to $99,999 | 357 (8.4%) | 373 (9.8%) |
| $100,000+ | 746 (17.5%) | 436 (11.5%) |
| Total | 4,263 (100.0%) | 3,797 (100.0%) |
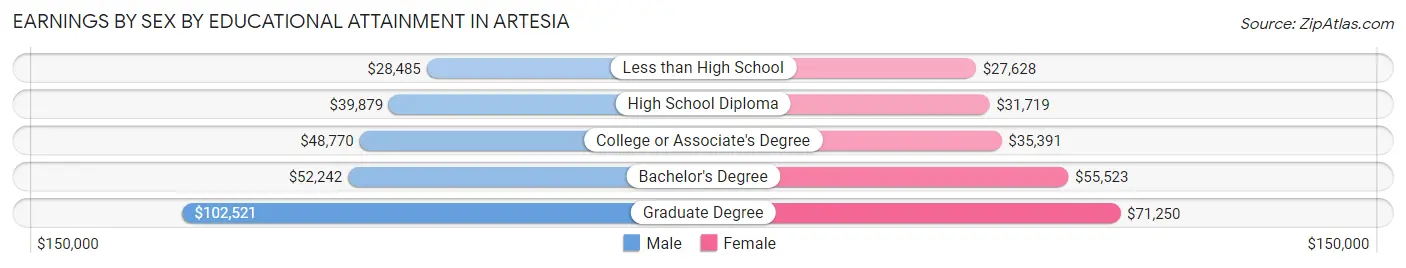
Earnings by Sex by Educational Attainment in Artesia
Average earnings in Artesia are $47,976 for men and $35,918 for women, a difference of 25.1%. Men with an educational attainment of graduate degree enjoy the highest average annual earnings of $102,521, while those with less than high school education earn the least with $28,485. Women with an educational attainment of graduate degree earn the most with the average annual earnings of $71,250, while those with less than high school education have the smallest earnings of $27,628.
| Educational Attainment | Male Income | Female Income |
| Less than High School | $28,485 | $27,628 |
| High School Diploma | $39,879 | $31,719 |
| College or Associate's Degree | $48,770 | $35,391 |
| Bachelor's Degree | $52,242 | $55,523 |
| Graduate Degree | $102,521 | $71,250 |
| Total | $47,976 | $35,918 |
Family Income in Artesia
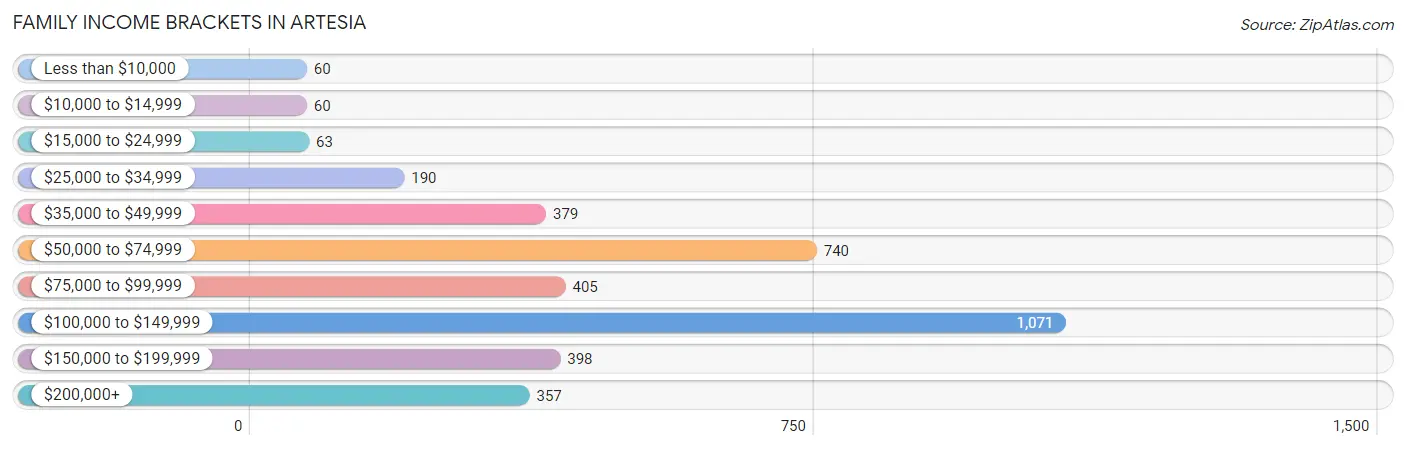
Family Income Brackets in Artesia
According to the Artesia family income data, there are 1,071 families falling into the $100,000 to $149,999 income range, which is the most common income bracket and makes up 28.8% of all families. Conversely, the less than $10,000 income bracket is the least frequent group with only 60 families (1.6%) belonging to this category.
| Income Bracket | # Families | % Families |
| Less than $10,000 | 60 | 1.6% |
| $10,000 to $14,999 | 60 | 1.6% |
| $15,000 to $24,999 | 63 | 1.7% |
| $25,000 to $34,999 | 190 | 5.1% |
| $35,000 to $49,999 | 379 | 10.2% |
| $50,000 to $74,999 | 740 | 19.9% |
| $75,000 to $99,999 | 405 | 10.9% |
| $100,000 to $149,999 | 1,071 | 28.8% |
| $150,000 to $199,999 | 398 | 10.7% |
| $200,000+ | 357 | 9.6% |
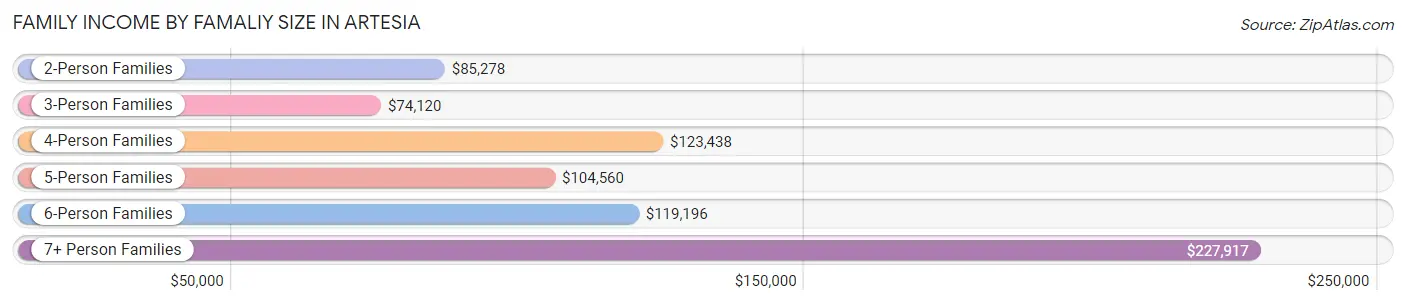
Family Income by Famaliy Size in Artesia
7+ person families (176 | 4.7%) account for the highest median family income in Artesia with $227,917 per family, while 2-person families (958 | 25.8%) have the highest median income of $42,639 per family member.
| Income Bracket | # Families | Median Income |
| 2-Person Families | 958 (25.8%) | $85,278 |
| 3-Person Families | 1,000 (26.9%) | $74,120 |
| 4-Person Families | 1,040 (28.0%) | $123,438 |
| 5-Person Families | 453 (12.2%) | $104,560 |
| 6-Person Families | 92 (2.5%) | $119,196 |
| 7+ Person Families | 176 (4.7%) | $227,917 |
| Total | 3,719 (100.0%) | $95,417 |
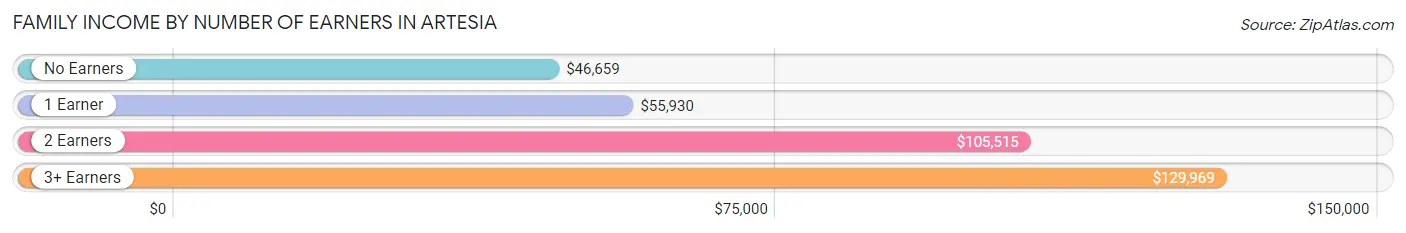
Family Income by Number of Earners in Artesia
The median family income in Artesia is $95,417, with families comprising 3+ earners (830) having the highest median family income of $129,969, while families with no earners (395) have the lowest median family income of $46,659, accounting for 22.3% and 10.6% of families, respectively.
| Number of Earners | # Families | Median Income |
| No Earners | 395 (10.6%) | $46,659 |
| 1 Earner | 1,068 (28.7%) | $55,930 |
| 2 Earners | 1,426 (38.3%) | $105,515 |
| 3+ Earners | 830 (22.3%) | $129,969 |
| Total | 3,719 (100.0%) | $95,417 |
Household Income in Artesia
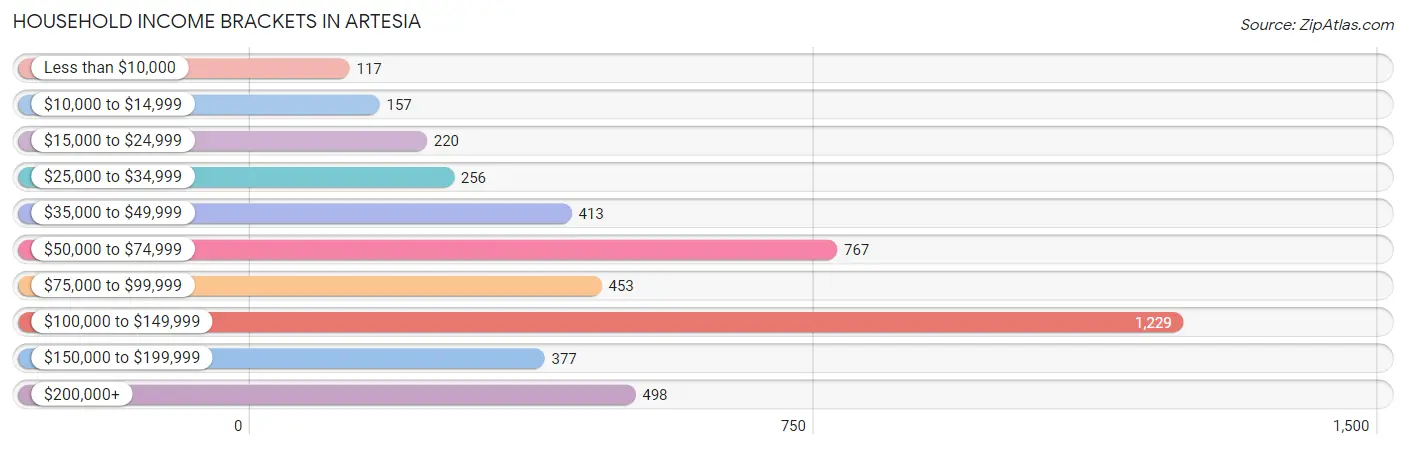
Household Income Brackets in Artesia
With 1,229 households falling in the category, the $100,000 to $149,999 income range is the most frequent in Artesia, accounting for 27.4% of all households. In contrast, only 117 households (2.6%) fall into the less than $10,000 income bracket, making it the least populous group.
| Income Bracket | # Households | % Households |
| Less than $10,000 | 117 | 2.6% |
| $10,000 to $14,999 | 157 | 3.5% |
| $15,000 to $24,999 | 220 | 4.9% |
| $25,000 to $34,999 | 256 | 5.7% |
| $35,000 to $49,999 | 413 | 9.2% |
| $50,000 to $74,999 | 767 | 17.1% |
| $75,000 to $99,999 | 453 | 10.1% |
| $100,000 to $149,999 | 1,229 | 27.4% |
| $150,000 to $199,999 | 377 | 8.4% |
| $200,000+ | 498 | 11.1% |
Household Income by Householder Age in Artesia
The median household income in Artesia is $92,702, with the highest median household income of $113,198 found in the 45 to 64 years age bracket for the primary householder. A total of 1,892 households (42.2%) fall into this category. Meanwhile, the 15 to 24 years age bracket for the primary householder has the lowest median household income of $0, with 144 households (3.2%) in this group.
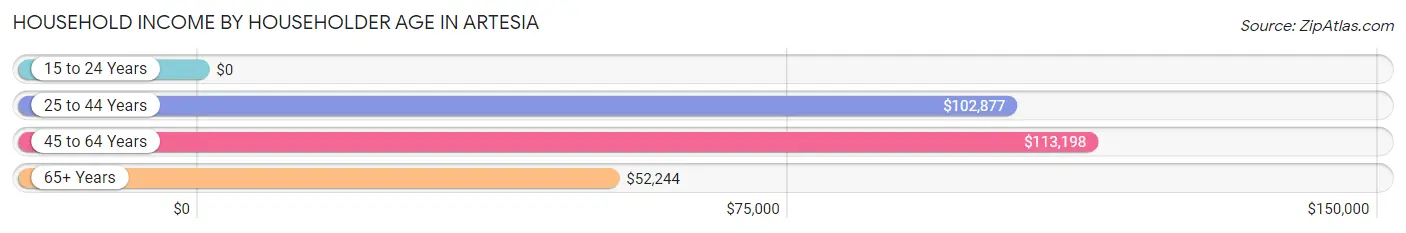
| Income Bracket | # Households | Median Income |
| 15 to 24 Years | 144 (3.2%) | $0 |
| 25 to 44 Years | 1,353 (30.2%) | $102,877 |
| 45 to 64 Years | 1,892 (42.2%) | $113,198 |
| 65+ Years | 1,095 (24.4%) | $52,244 |
| Total | 4,484 (100.0%) | $92,702 |
Poverty in Artesia
Income Below Poverty by Sex and Age in Artesia
With 7.0% poverty level for males and 7.7% for females among the residents of Artesia, 15 year old males and 15 year old females are the most vulnerable to poverty, with 52 males (48.6%) and 16 females (21.9%) in their respective age groups living below the poverty level.
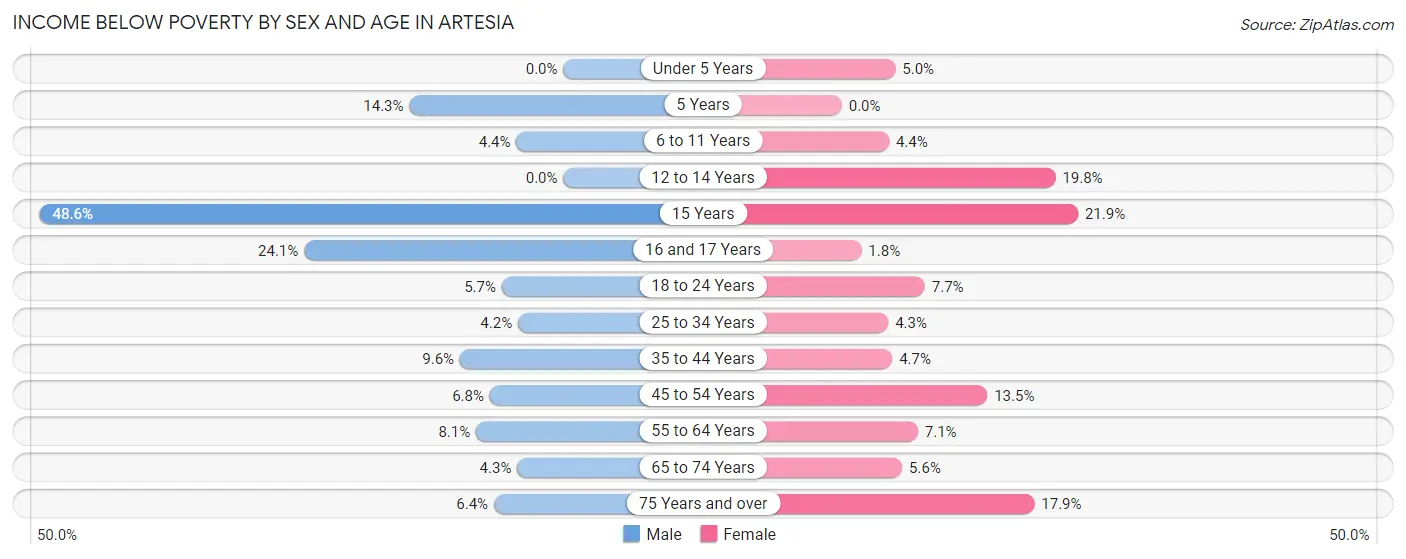
| Age Bracket | Male | Female |
| Under 5 Years | 0 (0.0%) | 25 (5.0%) |
| 5 Years | 3 (14.3%) | 0 (0.0%) |
| 6 to 11 Years | 26 (4.4%) | 25 (4.4%) |
| 12 to 14 Years | 0 (0.0%) | 23 (19.8%) |
| 15 Years | 52 (48.6%) | 16 (21.9%) |
| 16 and 17 Years | 45 (24.1%) | 5 (1.8%) |
| 18 to 24 Years | 47 (5.7%) | 46 (7.7%) |
| 25 to 34 Years | 46 (4.2%) | 54 (4.3%) |
| 35 to 44 Years | 97 (9.6%) | 55 (4.7%) |
| 45 to 54 Years | 81 (6.8%) | 153 (13.5%) |
| 55 to 64 Years | 75 (8.1%) | 76 (7.1%) |
| 65 to 74 Years | 26 (4.3%) | 39 (5.6%) |
| 75 Years and over | 25 (6.4%) | 116 (17.9%) |
| Total | 523 (7.0%) | 633 (7.7%) |
Income Above Poverty by Sex and Age in Artesia
According to the poverty statistics in Artesia, males aged under 5 years and females aged 5 years are the age groups that are most secure financially, with 100.0% of males and 100.0% of females in these age groups living above the poverty line.
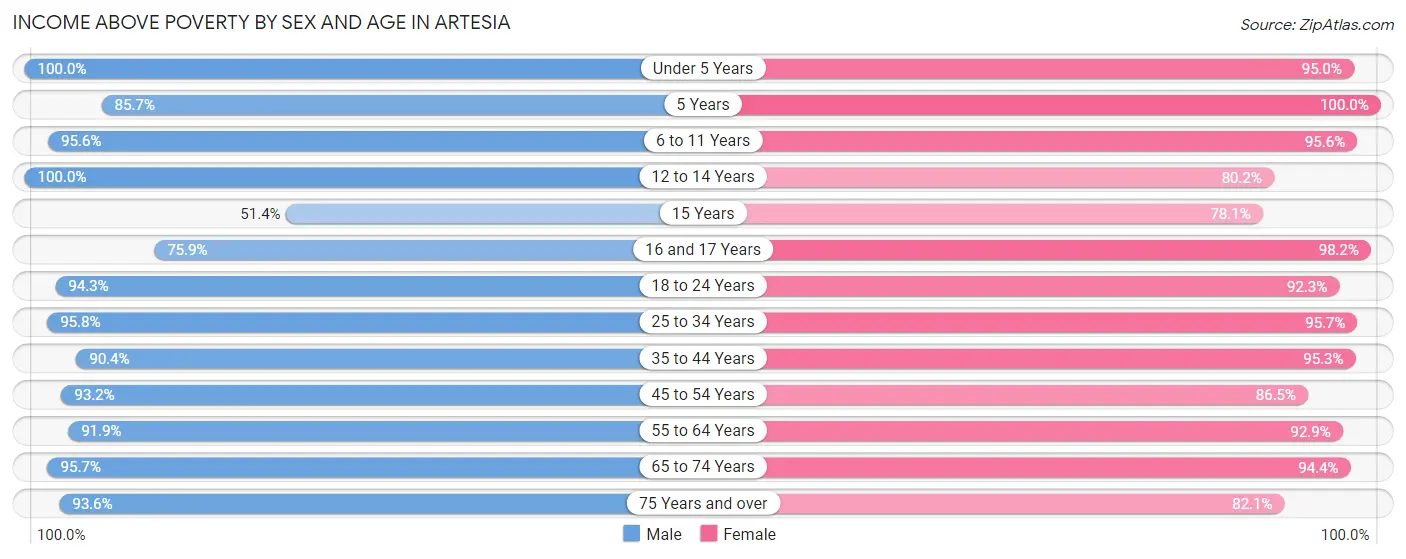
| Age Bracket | Male | Female |
| Under 5 Years | 313 (100.0%) | 478 (95.0%) |
| 5 Years | 18 (85.7%) | 131 (100.0%) |
| 6 to 11 Years | 571 (95.6%) | 546 (95.6%) |
| 12 to 14 Years | 256 (100.0%) | 93 (80.2%) |
| 15 Years | 55 (51.4%) | 57 (78.1%) |
| 16 and 17 Years | 142 (75.9%) | 270 (98.2%) |
| 18 to 24 Years | 776 (94.3%) | 551 (92.3%) |
| 25 to 34 Years | 1,047 (95.8%) | 1,199 (95.7%) |
| 35 to 44 Years | 913 (90.4%) | 1,119 (95.3%) |
| 45 to 54 Years | 1,105 (93.2%) | 980 (86.5%) |
| 55 to 64 Years | 851 (91.9%) | 1,001 (92.9%) |
| 65 to 74 Years | 582 (95.7%) | 658 (94.4%) |
| 75 Years and over | 363 (93.6%) | 533 (82.1%) |
| Total | 6,992 (93.0%) | 7,616 (92.3%) |
Income Below Poverty Among Married-Couple Families in Artesia
The poverty statistics for married-couple families in Artesia show that 3.9% or 103 of the total 2,661 families live below the poverty line. Families with 1 or 2 children have the highest poverty rate of 6.9%, comprising of 70 families. On the other hand, families with 5 or more children have the lowest poverty rate of 0.0%, which includes 0 families.
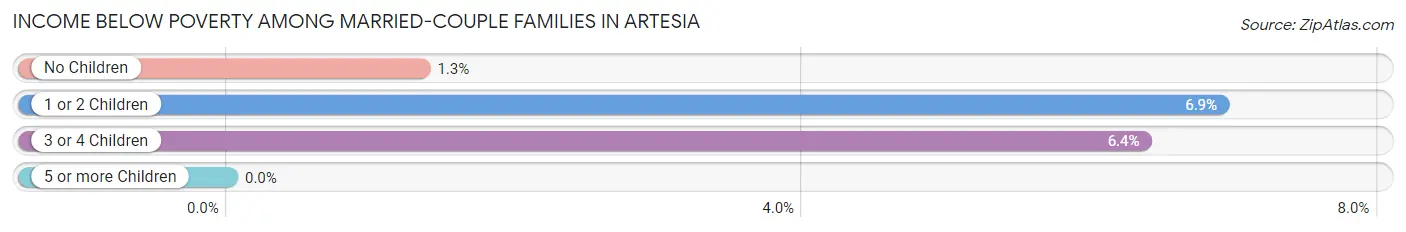
| Children | Above Poverty | Below Poverty |
| No Children | 1,395 (98.7%) | 19 (1.3%) |
| 1 or 2 Children | 944 (93.1%) | 70 (6.9%) |
| 3 or 4 Children | 206 (93.6%) | 14 (6.4%) |
| 5 or more Children | 13 (100.0%) | 0 (0.0%) |
| Total | 2,558 (96.1%) | 103 (3.9%) |
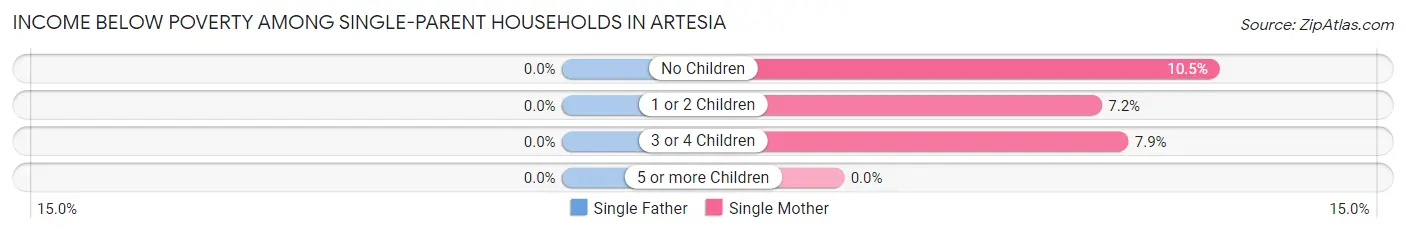
Income Below Poverty Among Single-Parent Households in Artesia
| Children | Single Father | Single Mother |
| No Children | 0 (0.0%) | 44 (10.5%) |
| 1 or 2 Children | 0 (0.0%) | 18 (7.2%) |
| 3 or 4 Children | 0 (0.0%) | 5 (7.9%) |
| 5 or more Children | 0 (0.0%) | 0 (0.0%) |
| Total | 0 (0.0%) | 67 (9.1%) |
Income Below Poverty Among Married-Couple vs Single-Parent Households in Artesia
The poverty data for Artesia shows that 103 of the married-couple family households (3.9%) and 67 of the single-parent households (6.3%) are living below the poverty level. Within the married-couple family households, those with 1 or 2 children have the highest poverty rate, with 70 households (6.9%) falling below the poverty line. Among the single-parent households, those with no children have the highest poverty rate, with 44 household (6.5%) living below poverty.
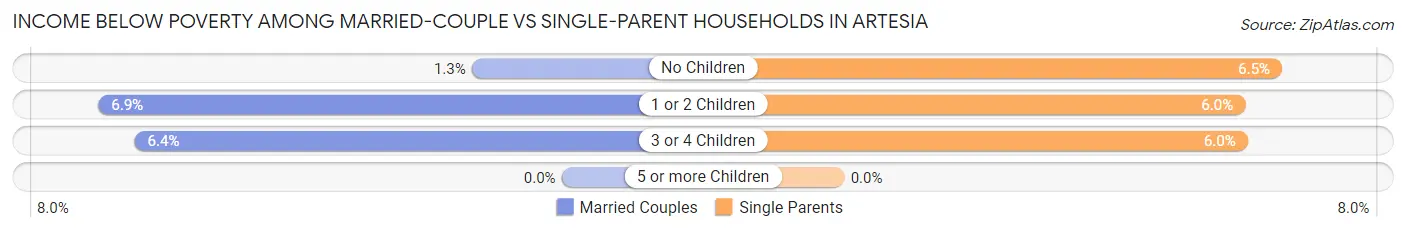
| Children | Married-Couple Families | Single-Parent Households |
| No Children | 19 (1.3%) | 44 (6.5%) |
| 1 or 2 Children | 70 (6.9%) | 18 (6.0%) |
| 3 or 4 Children | 14 (6.4%) | 5 (6.0%) |
| 5 or more Children | 0 (0.0%) | 0 (0.0%) |
| Total | 103 (3.9%) | 67 (6.3%) |
Race in Artesia
The most populous races in Artesia are Asian (6,831 | 42.1%), Hispanic or Latino (5,732 | 35.3%), and Some other Race (3,534 | 21.8%).
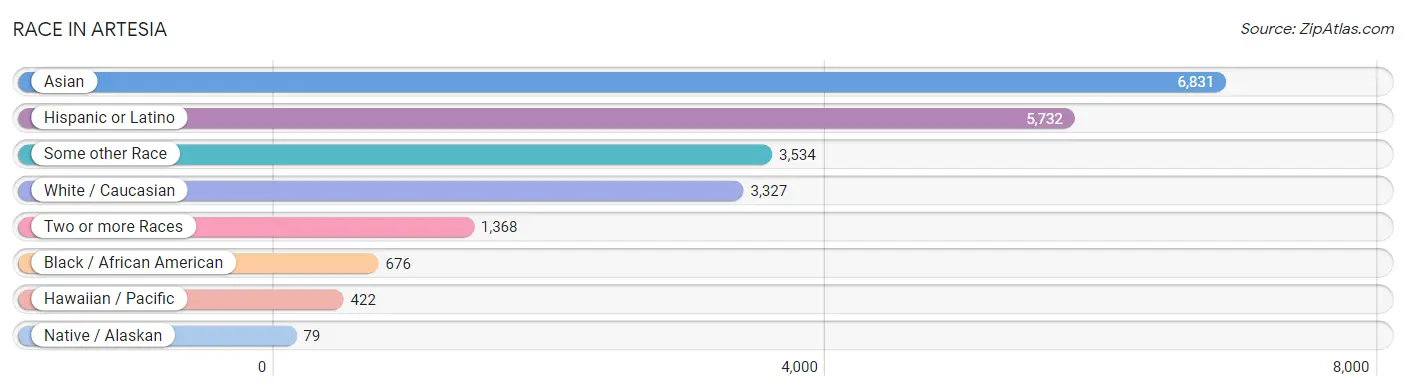
| Race | # Population | % Population |
| Asian | 6,831 | 42.1% |
| Black / African American | 676 | 4.2% |
| Hawaiian / Pacific | 422 | 2.6% |
| Hispanic or Latino | 5,732 | 35.3% |
| Native / Alaskan | 79 | 0.5% |
| White / Caucasian | 3,327 | 20.5% |
| Two or more Races | 1,368 | 8.4% |
| Some other Race | 3,534 | 21.8% |
| Total | 16,237 | 100.0% |
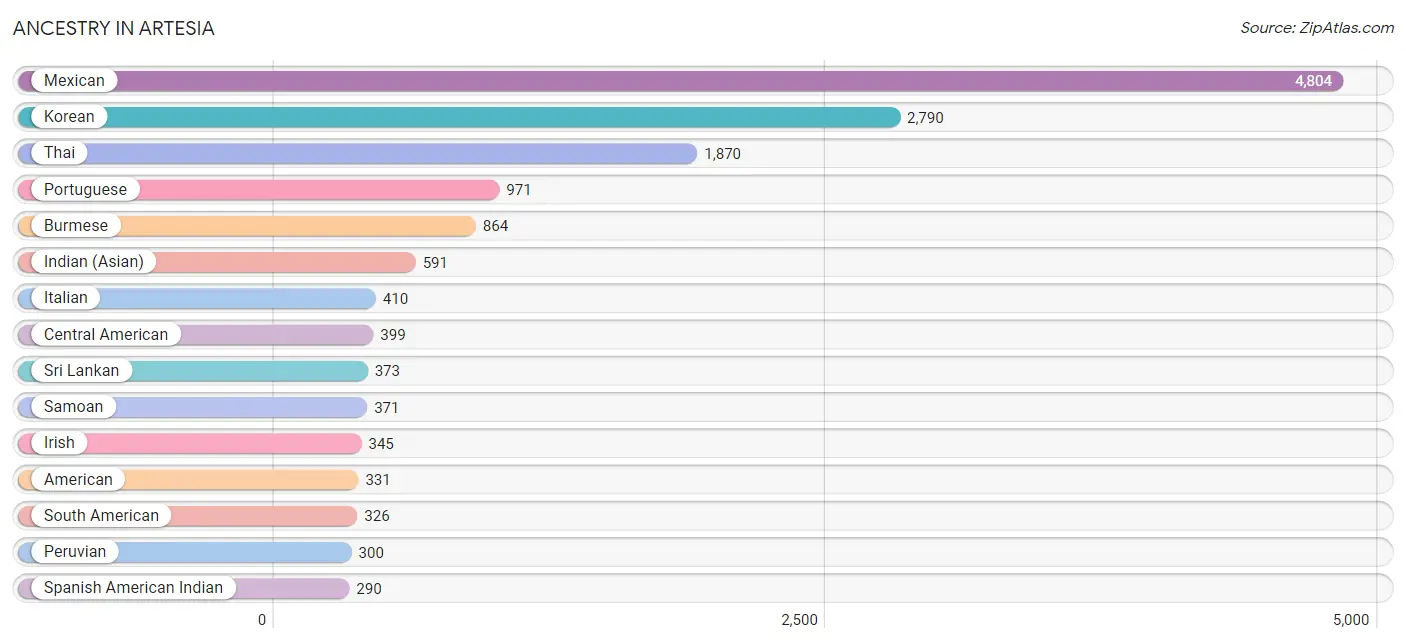
Ancestry in Artesia
The most populous ancestries reported in Artesia are Mexican (4,804 | 29.6%), Korean (2,790 | 17.2%), Thai (1,870 | 11.5%), Portuguese (971 | 6.0%), and Burmese (864 | 5.3%), together accounting for 69.6% of all Artesia residents.
| Ancestry | # Population | % Population |
| American | 331 | 2.0% |
| Arab | 20 | 0.1% |
| Austrian | 14 | 0.1% |
| Bhutanese | 288 | 1.8% |
| Bolivian | 11 | 0.1% |
| Burmese | 864 | 5.3% |
| Central American | 399 | 2.5% |
| Croatian | 7 | 0.0% |
| Danish | 7 | 0.0% |
| Dutch | 233 | 1.4% |
| Eastern European | 14 | 0.1% |
| Ecuadorian | 15 | 0.1% |
| Egyptian | 11 | 0.1% |
| English | 264 | 1.6% |
| European | 97 | 0.6% |
| Filipino | 149 | 0.9% |
| French | 60 | 0.4% |
| German | 262 | 1.6% |
| Guamanian / Chamorro | 46 | 0.3% |
| Guatemalan | 138 | 0.9% |
| Honduran | 2 | 0.0% |
| Indian (Asian) | 591 | 3.6% |
| Indonesian | 20 | 0.1% |
| Iranian | 7 | 0.0% |
| Irish | 345 | 2.1% |
| Italian | 410 | 2.5% |
| Japanese | 68 | 0.4% |
| Korean | 2,790 | 17.2% |
| Laotian | 41 | 0.3% |
| Lebanese | 9 | 0.1% |
| Mexican | 4,804 | 29.6% |
| Mexican American Indian | 20 | 0.1% |
| Native Hawaiian | 11 | 0.1% |
| Nicaraguan | 7 | 0.0% |
| Northern European | 12 | 0.1% |
| Pakistani | 23 | 0.1% |
| Peruvian | 300 | 1.8% |
| Polish | 27 | 0.2% |
| Portuguese | 971 | 6.0% |
| Puerto Rican | 10 | 0.1% |
| Salvadoran | 252 | 1.5% |
| Samoan | 371 | 2.3% |
| Scotch-Irish | 25 | 0.2% |
| South American | 326 | 2.0% |
| South American Indian | 7 | 0.0% |
| Spanish | 29 | 0.2% |
| Spanish American Indian | 290 | 1.8% |
| Sri Lankan | 373 | 2.3% |
| Swedish | 28 | 0.2% |
| Thai | 1,870 | 11.5% |
| Vietnamese | 39 | 0.2% |
| Welsh | 49 | 0.3% |
| Yaqui | 26 | 0.2% | View All 53 Rows |
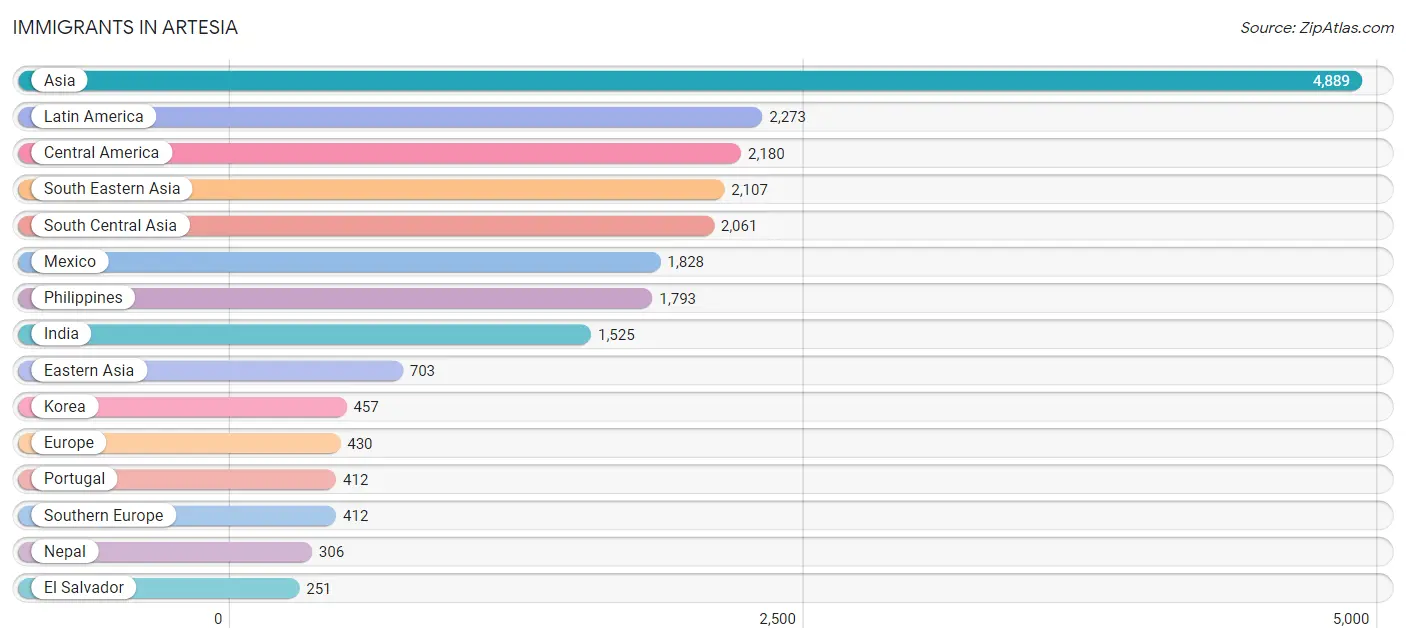
Immigrants in Artesia
The most numerous immigrant groups reported in Artesia came from Asia (4,889 | 30.1%), Latin America (2,273 | 14.0%), Central America (2,180 | 13.4%), South Eastern Asia (2,107 | 13.0%), and South Central Asia (2,061 | 12.7%), together accounting for 83.2% of all Artesia residents.
| Immigration Origin | # Population | % Population |
| Africa | 152 | 0.9% |
| Asia | 4,889 | 30.1% |
| Azores | 23 | 0.1% |
| Bangladesh | 13 | 0.1% |
| Bolivia | 11 | 0.1% |
| Cambodia | 26 | 0.2% |
| Central America | 2,180 | 13.4% |
| China | 222 | 1.4% |
| Eastern Asia | 703 | 4.3% |
| Ecuador | 3 | 0.0% |
| Egypt | 11 | 0.1% |
| El Salvador | 251 | 1.5% |
| Europe | 430 | 2.6% |
| Fiji | 38 | 0.2% |
| Germany | 7 | 0.0% |
| Guatemala | 62 | 0.4% |
| Honduras | 24 | 0.2% |
| Hong Kong | 26 | 0.2% |
| India | 1,525 | 9.4% |
| Indonesia | 32 | 0.2% |
| Iran | 7 | 0.0% |
| Japan | 24 | 0.2% |
| Korea | 457 | 2.8% |
| Latin America | 2,273 | 14.0% |
| Lebanon | 9 | 0.1% |
| Mexico | 1,828 | 11.3% |
| Nepal | 306 | 1.9% |
| Netherlands | 3 | 0.0% |
| Nicaragua | 7 | 0.0% |
| Northern Africa | 11 | 0.1% |
| Northern Europe | 8 | 0.1% |
| Oceania | 131 | 0.8% |
| Pakistan | 210 | 1.3% |
| Peru | 73 | 0.4% |
| Philippines | 1,793 | 11.0% |
| Portugal | 412 | 2.5% |
| South Africa | 131 | 0.8% |
| South America | 93 | 0.6% |
| South Central Asia | 2,061 | 12.7% |
| South Eastern Asia | 2,107 | 13.0% |
| Southern Europe | 412 | 2.5% |
| Taiwan | 177 | 1.1% |
| Thailand | 24 | 0.2% |
| Venezuela | 6 | 0.0% |
| Vietnam | 232 | 1.4% |
| Western Asia | 18 | 0.1% |
| Western Europe | 10 | 0.1% | View All 47 Rows |
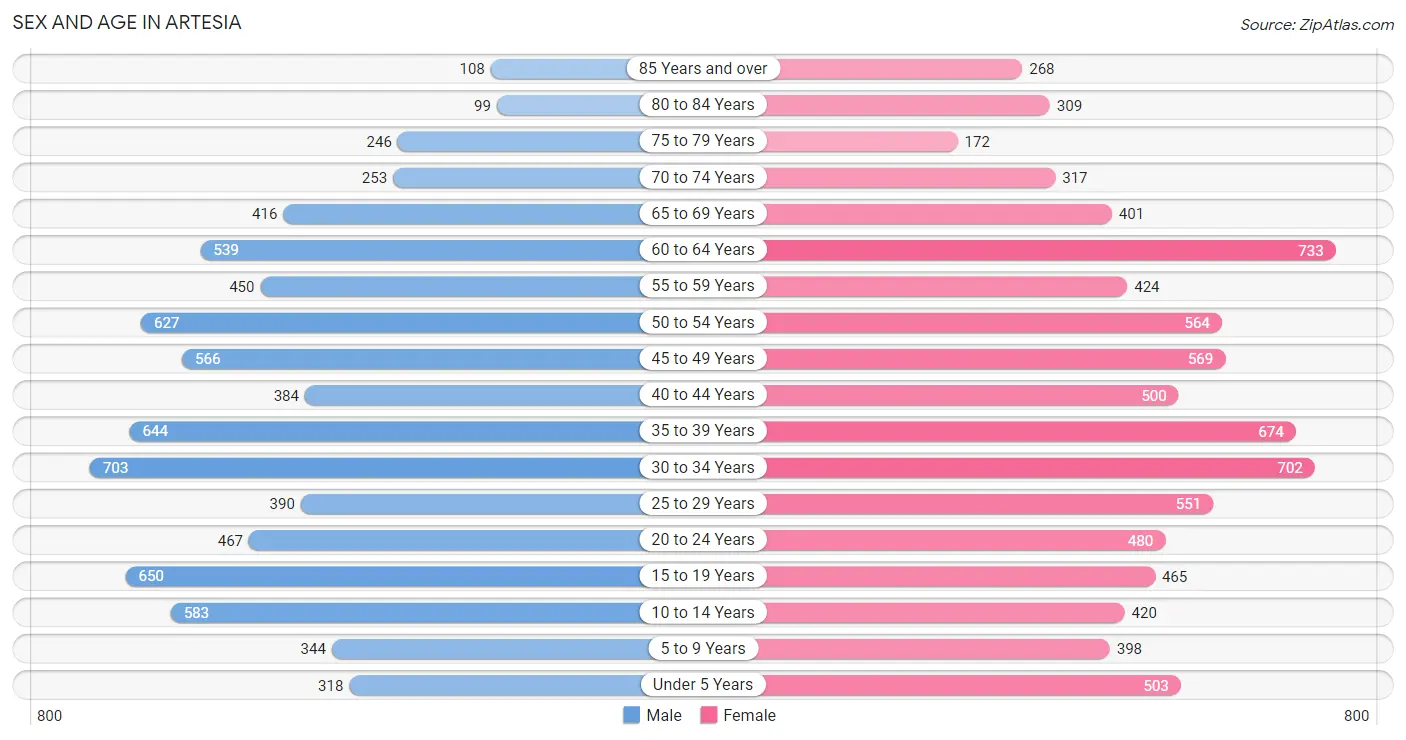
Sex and Age in Artesia
Sex and Age in Artesia
The most populous age groups in Artesia are 30 to 34 Years (703 | 9.0%) for men and 60 to 64 Years (733 | 8.7%) for women.
| Age Bracket | Male | Female |
| Under 5 Years | 318 (4.1%) | 503 (5.9%) |
| 5 to 9 Years | 344 (4.4%) | 398 (4.7%) |
| 10 to 14 Years | 583 (7.5%) | 420 (5.0%) |
| 15 to 19 Years | 650 (8.4%) | 465 (5.5%) |
| 20 to 24 Years | 467 (6.0%) | 480 (5.7%) |
| 25 to 29 Years | 390 (5.0%) | 551 (6.5%) |
| 30 to 34 Years | 703 (9.0%) | 702 (8.3%) |
| 35 to 39 Years | 644 (8.3%) | 674 (8.0%) |
| 40 to 44 Years | 384 (4.9%) | 500 (5.9%) |
| 45 to 49 Years | 566 (7.3%) | 569 (6.7%) |
| 50 to 54 Years | 627 (8.1%) | 564 (6.7%) |
| 55 to 59 Years | 450 (5.8%) | 424 (5.0%) |
| 60 to 64 Years | 539 (6.9%) | 733 (8.7%) |
| 65 to 69 Years | 416 (5.3%) | 401 (4.8%) |
| 70 to 74 Years | 253 (3.3%) | 317 (3.7%) |
| 75 to 79 Years | 246 (3.2%) | 172 (2.0%) |
| 80 to 84 Years | 99 (1.3%) | 309 (3.7%) |
| 85 Years and over | 108 (1.4%) | 268 (3.2%) |
| Total | 7,787 (100.0%) | 8,450 (100.0%) |
Families and Households in Artesia
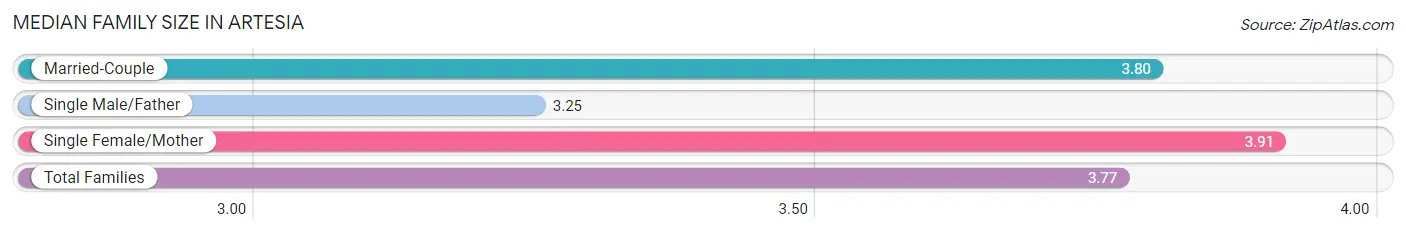
Median Family Size in Artesia
The median family size in Artesia is 3.77 persons per family, with single female/mother families (732 | 19.7%) accounting for the largest median family size of 3.91 persons per family. On the other hand, single male/father families (326 | 8.8%) represent the smallest median family size with 3.25 persons per family.
| Family Type | # Families | Family Size |
| Married-Couple | 2,661 (71.6%) | 3.80 |
| Single Male/Father | 326 (8.8%) | 3.25 |
| Single Female/Mother | 732 (19.7%) | 3.91 |
| Total Families | 3,719 (100.0%) | 3.77 |
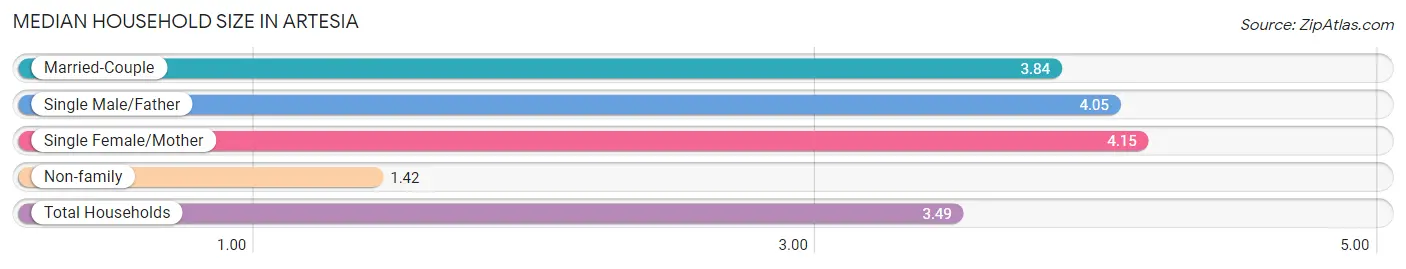
Median Household Size in Artesia
The median household size in Artesia is 3.49 persons per household, with single female/mother households (732 | 16.3%) accounting for the largest median household size of 4.15 persons per household. non-family households (765 | 17.1%) represent the smallest median household size with 1.42 persons per household.
| Household Type | # Households | Household Size |
| Married-Couple | 2,661 (59.3%) | 3.84 |
| Single Male/Father | 326 (7.3%) | 4.05 |
| Single Female/Mother | 732 (16.3%) | 4.15 |
| Non-family | 765 (17.1%) | 1.42 |
| Total Households | 4,484 (100.0%) | 3.49 |
Household Size by Marriage Status in Artesia
Out of a total of 4,484 households in Artesia, 3,719 (82.9%) are family households, while 765 (17.1%) are nonfamily households. The most numerous type of family households are 4-person households, comprising 1,100, and the most common type of nonfamily households are 1-person households, comprising 588.

| Household Size | Family Households | Nonfamily Households |
| 1-Person Households | - | 588 (13.1%) |
| 2-Person Households | 892 (19.9%) | 134 (3.0%) |
| 3-Person Households | 887 (19.8%) | 23 (0.5%) |
| 4-Person Households | 1,100 (24.5%) | 0 (0.0%) |
| 5-Person Households | 512 (11.4%) | 0 (0.0%) |
| 6-Person Households | 138 (3.1%) | 8 (0.2%) |
| 7+ Person Households | 190 (4.2%) | 12 (0.3%) |
| Total | 3,719 (82.9%) | 765 (17.1%) |
Female Fertility in Artesia
Fertility by Age in Artesia
Average fertility rate in Artesia is 33.0 births per 1,000 women. Women in the age bracket of 15 to 19 years have the highest fertility rate with 65.0 births per 1,000 women. Women in the age bracket of 35 to 50 years acount for 47.8% of all women with births.
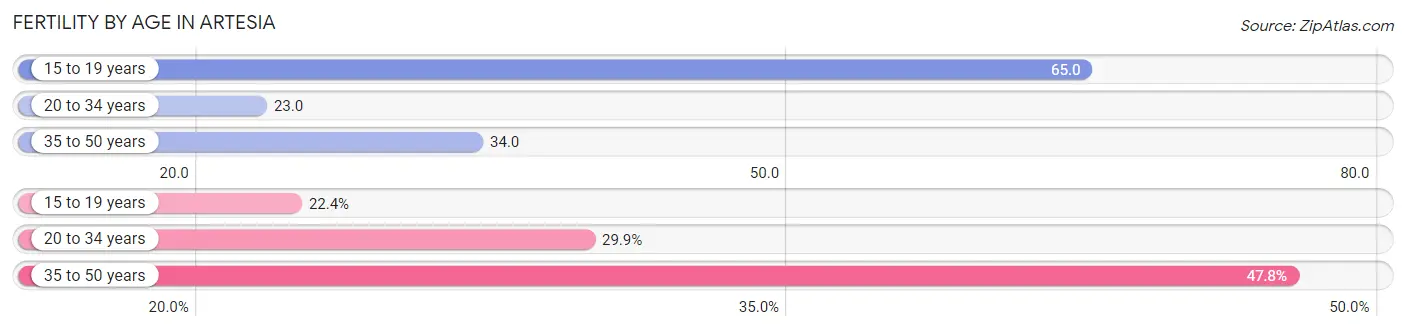
| Age Bracket | Women with Births | Births / 1,000 Women |
| 15 to 19 years | 30 (22.4%) | 65.0 |
| 20 to 34 years | 40 (29.8%) | 23.0 |
| 35 to 50 years | 64 (47.8%) | 34.0 |
| Total | 134 (100.0%) | 33.0 |
Fertility by Age by Marriage Status in Artesia
59.7% of women with births (134) in Artesia are married. The highest percentage of unmarried women with births falls into 15 to 19 years age bracket with 100.0% of them unmarried at the time of birth, while the lowest percentage of unmarried women with births belong to 35 to 50 years age bracket with 10.9% of them unmarried.
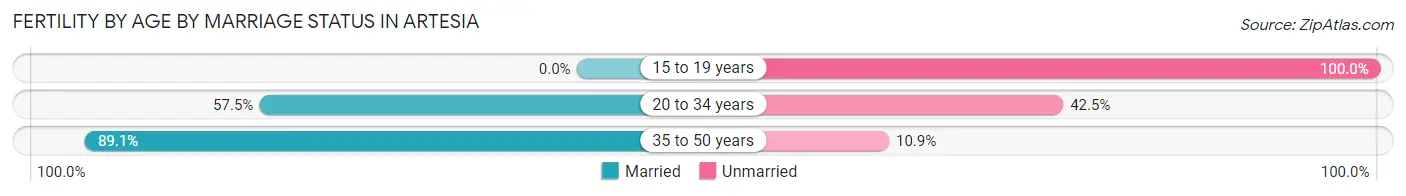
| Age Bracket | Married | Unmarried |
| 15 to 19 years | 0 (0.0%) | 30 (100.0%) |
| 20 to 34 years | 23 (57.5%) | 17 (42.5%) |
| 35 to 50 years | 57 (89.1%) | 7 (10.9%) |
| Total | 80 (59.7%) | 54 (40.3%) |
Fertility by Education in Artesia
Average fertility rate in Artesia is 33.0 births per 1,000 women. Women with the education attainment of high school diploma have the highest fertility rate of 83.0 births per 1,000 women, while women with the education attainment of bachelor's degree have the lowest fertility at 9.0 births per 1,000 women. Women with the education attainment of high school diploma represent 50.0% of all women with births.
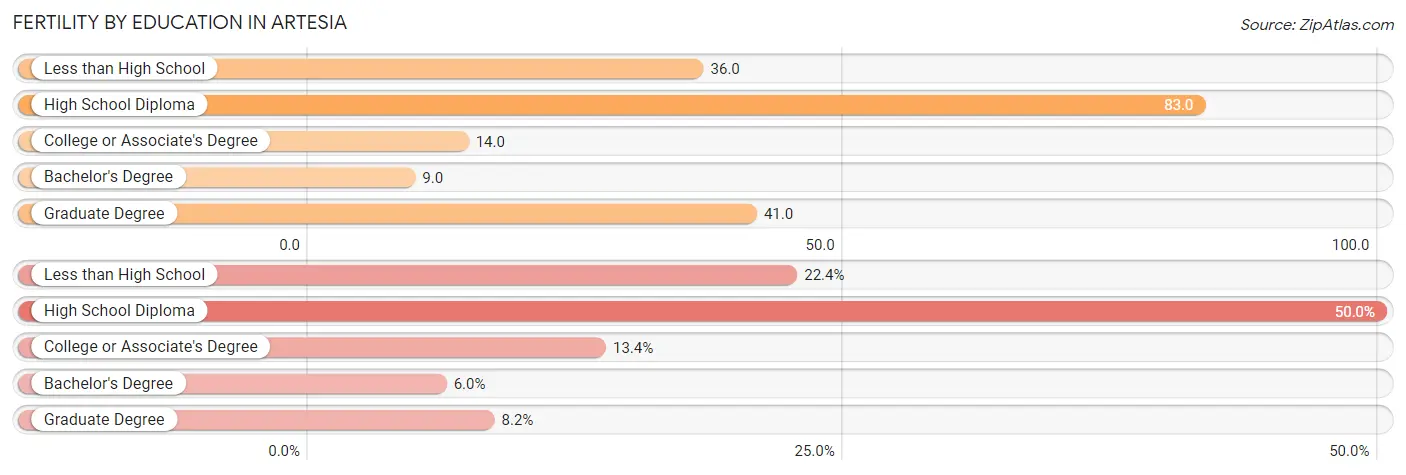
| Educational Attainment | Women with Births | Births / 1,000 Women |
| Less than High School | 30 (22.4%) | 36.0 |
| High School Diploma | 67 (50.0%) | 83.0 |
| College or Associate's Degree | 18 (13.4%) | 14.0 |
| Bachelor's Degree | 8 (6.0%) | 9.0 |
| Graduate Degree | 11 (8.2%) | 41.0 |
| Total | 134 (100.0%) | 33.0 |
Fertility by Education by Marriage Status in Artesia
40.3% of women with births in Artesia are unmarried. Women with the educational attainment of college or associate's degree are most likely to be married with 100.0% of them married at childbirth, while women with the educational attainment of less than high school are least likely to be married with 100.0% of them unmarried at childbirth.
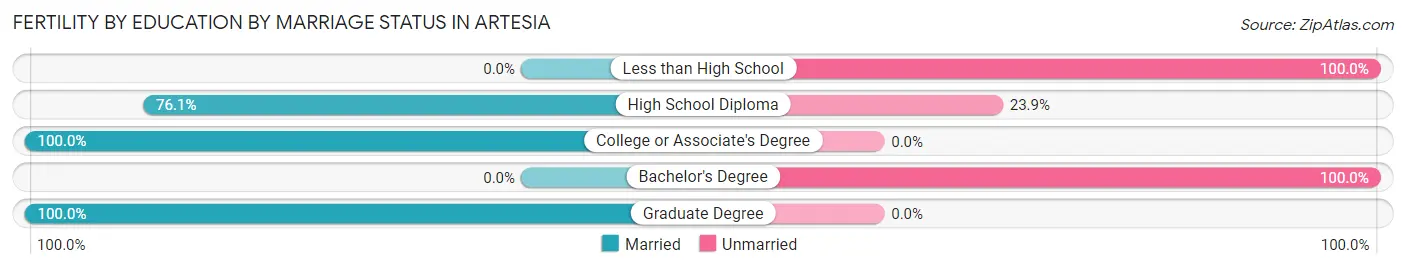
| Educational Attainment | Married | Unmarried |
| Less than High School | 0 (0.0%) | 30 (100.0%) |
| High School Diploma | 51 (76.1%) | 16 (23.9%) |
| College or Associate's Degree | 18 (100.0%) | 0 (0.0%) |
| Bachelor's Degree | 0 (0.0%) | 8 (100.0%) |
| Graduate Degree | 11 (100.0%) | 0 (0.0%) |
| Total | 80 (59.7%) | 54 (40.3%) |
Employment Characteristics in Artesia
Employment by Class of Employer in Artesia
Among the 6,959 employed individuals in Artesia, private company employees (5,091 | 73.2%), local government employees (627 | 9.0%), and self-employed (not incorporated) (395 | 5.7%) make up the most common classes of employment.
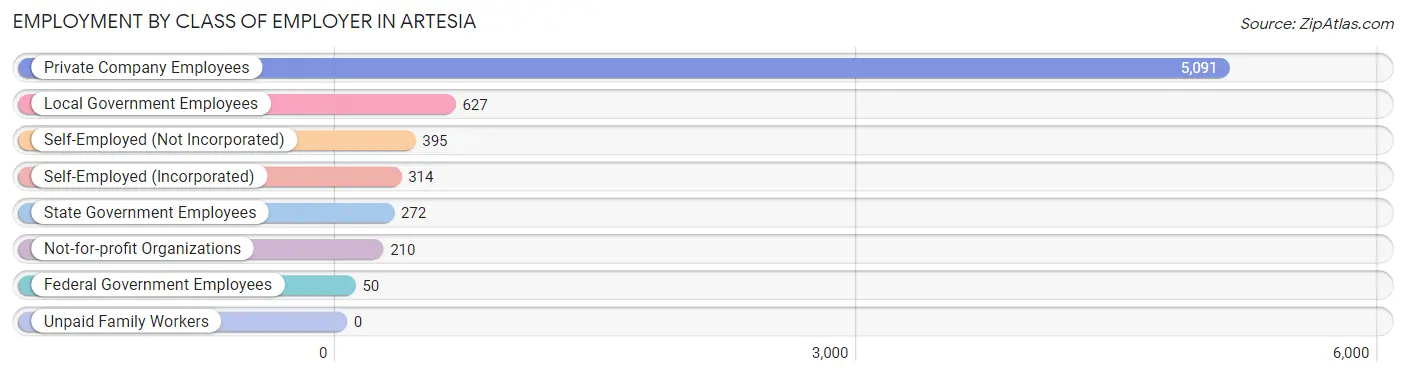
| Employer Class | # Employees | % Employees |
| Private Company Employees | 5,091 | 73.2% |
| Self-Employed (Incorporated) | 314 | 4.5% |
| Self-Employed (Not Incorporated) | 395 | 5.7% |
| Not-for-profit Organizations | 210 | 3.0% |
| Local Government Employees | 627 | 9.0% |
| State Government Employees | 272 | 3.9% |
| Federal Government Employees | 50 | 0.7% |
| Unpaid Family Workers | 0 | 0.0% |
| Total | 6,959 | 100.0% |
Employment Status by Age in Artesia
According to the labor force statistics for Artesia, out of the total population over 16 years of age (13,491), 60.9% or 8,216 individuals are in the labor force, with 9.1% or 748 of them unemployed. The age group with the highest labor force participation rate is 25 to 29 years, with 89.4% or 841 individuals in the labor force. Within the labor force, the 20 to 24 years age range has the highest percentage of unemployed individuals, with 24.2% or 173 of them being unemployed.
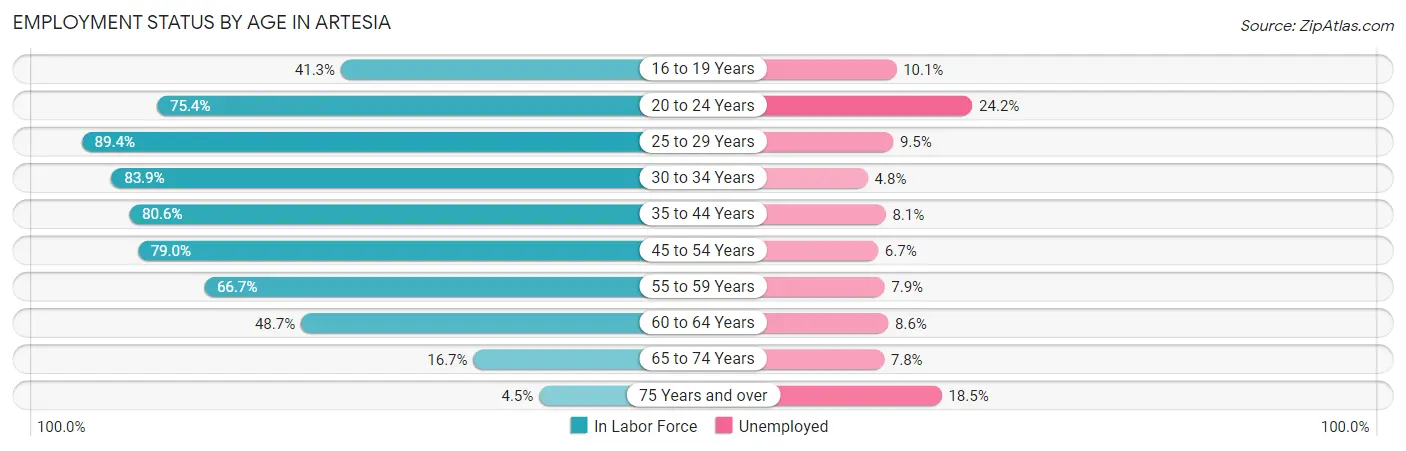
| Age Bracket | In Labor Force | Unemployed |
| 16 to 19 Years | 386 (41.3%) | 39 (10.1%) |
| 20 to 24 Years | 714 (75.4%) | 173 (24.2%) |
| 25 to 29 Years | 841 (89.4%) | 80 (9.5%) |
| 30 to 34 Years | 1,179 (83.9%) | 57 (4.8%) |
| 35 to 44 Years | 1,775 (80.6%) | 144 (8.1%) |
| 45 to 54 Years | 1,838 (79.0%) | 123 (6.7%) |
| 55 to 59 Years | 583 (66.7%) | 46 (7.9%) |
| 60 to 64 Years | 619 (48.7%) | 53 (8.6%) |
| 65 to 74 Years | 232 (16.7%) | 18 (7.8%) |
| 75 Years and over | 54 (4.5%) | 10 (18.5%) |
| Total | 8,216 (60.9%) | 748 (9.1%) |
Employment Status by Educational Attainment in Artesia
According to labor force statistics for Artesia, 75.8% of individuals (6,837) out of the total population between 25 and 64 years of age (9,020) are in the labor force, with 7.4% or 506 of them being unemployed. The group with the highest labor force participation rate are those with the educational attainment of bachelor's degree or higher, with 82.1% or 2,362 individuals in the labor force. Within the labor force, individuals with high school diploma education have the highest percentage of unemployment, with 12.1% or 181 of them being unemployed.
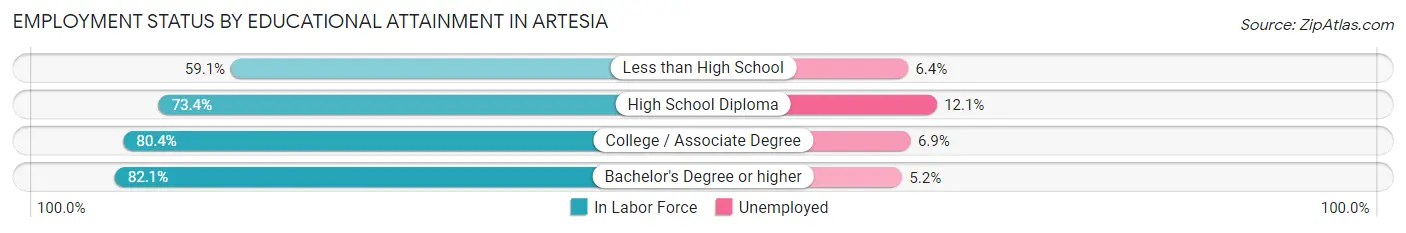
| Educational Attainment | In Labor Force | Unemployed |
| Less than High School | 897 (59.1%) | 97 (6.4%) |
| High School Diploma | 1,494 (73.4%) | 246 (12.1%) |
| College / Associate Degree | 2,082 (80.4%) | 179 (6.9%) |
| Bachelor's Degree or higher | 2,362 (82.1%) | 150 (5.2%) |
| Total | 6,837 (75.8%) | 667 (7.4%) |
Employment Occupations by Sex in Artesia
Management, Business, Science and Arts Occupations
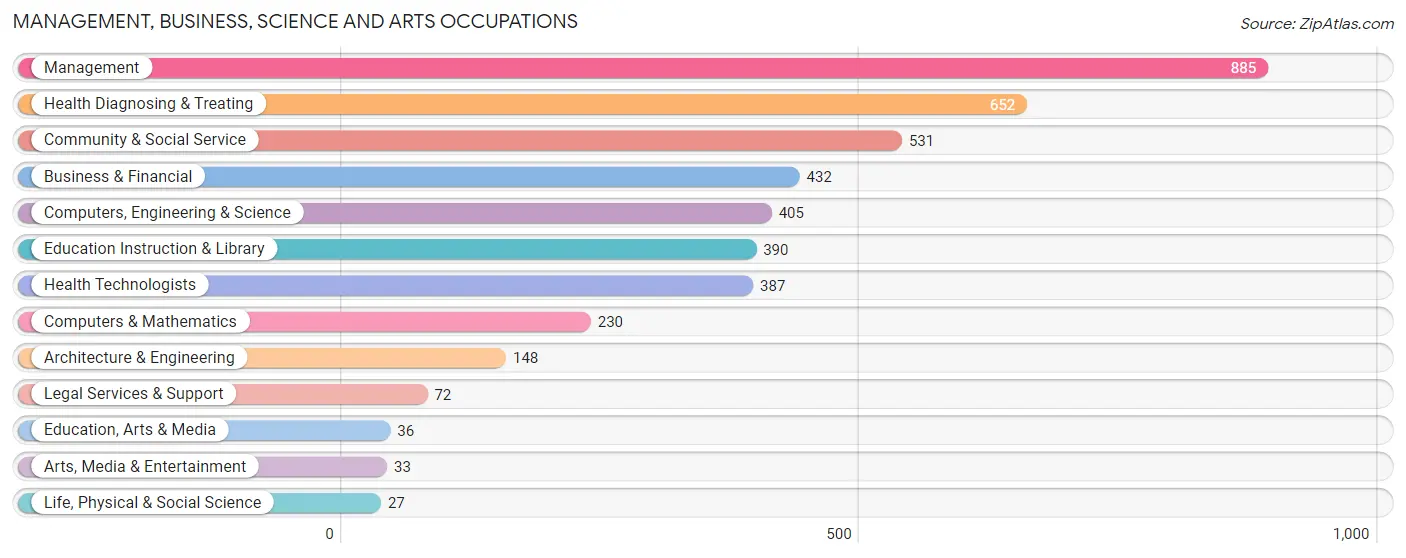
The most common Management, Business, Science and Arts occupations in Artesia are Management (885 | 11.9%), Health Diagnosing & Treating (652 | 8.7%), Community & Social Service (531 | 7.1%), Business & Financial (432 | 5.8%), and Computers, Engineering & Science (405 | 5.4%).
Management, Business, Science and Arts Occupations by Sex
Within the Management, Business, Science and Arts occupations in Artesia, the most male-oriented occupations are Computers & Mathematics (91.3%), Computers, Engineering & Science (77.8%), and Architecture & Engineering (60.8%), while the most female-oriented occupations are Legal Services & Support (73.6%), Business & Financial (65.5%), and Education Instruction & Library (63.1%).
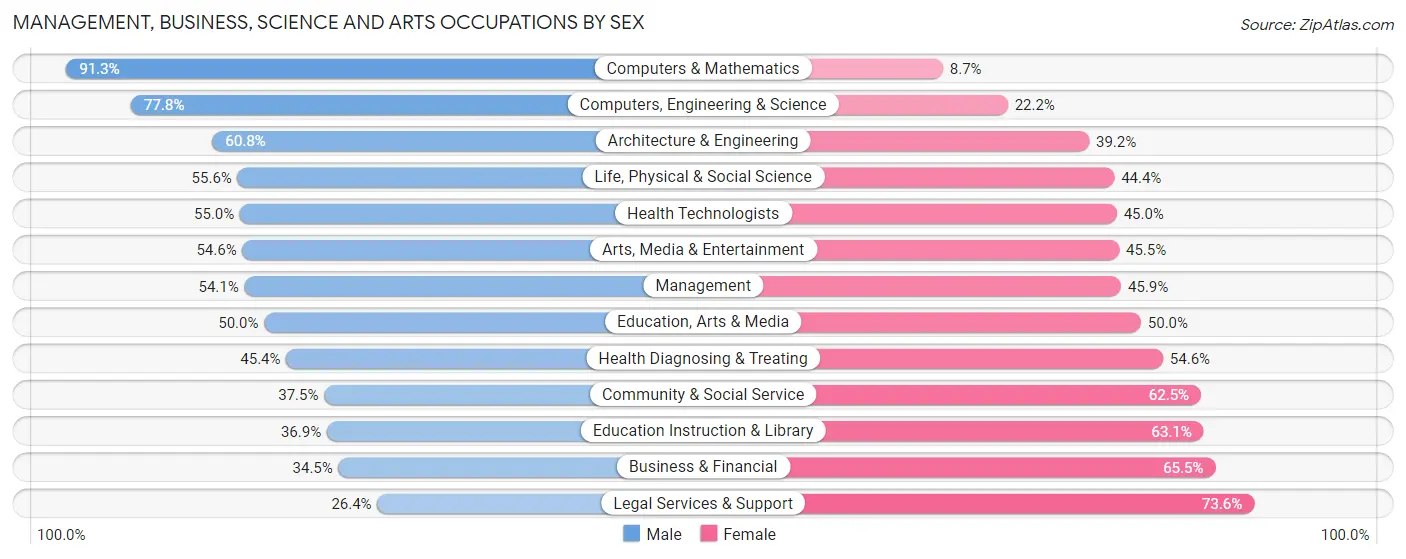
| Occupation | Male | Female |
| Management | 479 (54.1%) | 406 (45.9%) |
| Business & Financial | 149 (34.5%) | 283 (65.5%) |
| Computers, Engineering & Science | 315 (77.8%) | 90 (22.2%) |
| Computers & Mathematics | 210 (91.3%) | 20 (8.7%) |
| Architecture & Engineering | 90 (60.8%) | 58 (39.2%) |
| Life, Physical & Social Science | 15 (55.6%) | 12 (44.4%) |
| Community & Social Service | 199 (37.5%) | 332 (62.5%) |
| Education, Arts & Media | 18 (50.0%) | 18 (50.0%) |
| Legal Services & Support | 19 (26.4%) | 53 (73.6%) |
| Education Instruction & Library | 144 (36.9%) | 246 (63.1%) |
| Arts, Media & Entertainment | 18 (54.5%) | 15 (45.5%) |
| Health Diagnosing & Treating | 296 (45.4%) | 356 (54.6%) |
| Health Technologists | 213 (55.0%) | 174 (45.0%) |
| Total (Category) | 1,438 (49.5%) | 1,467 (50.5%) |
| Total (Overall) | 3,996 (53.6%) | 3,460 (46.4%) |
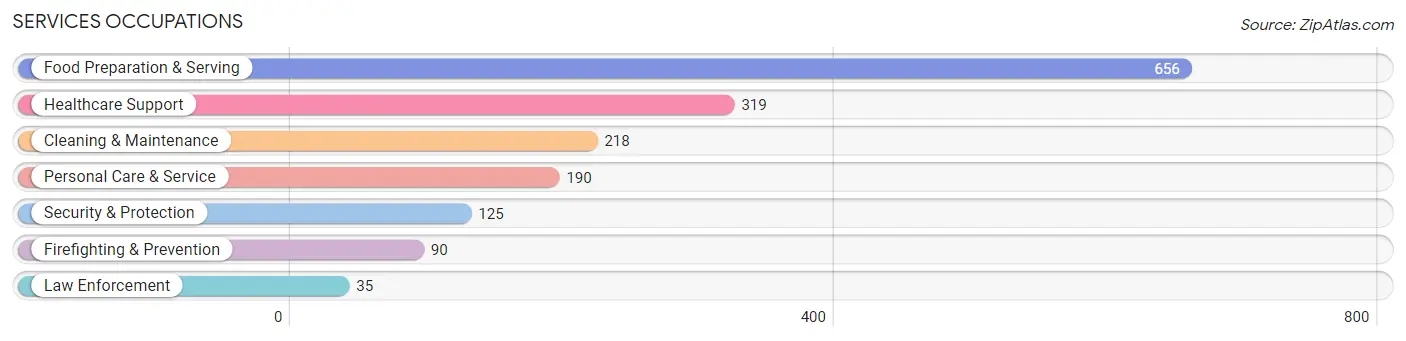
Services Occupations
The most common Services occupations in Artesia are Food Preparation & Serving (656 | 8.8%), Healthcare Support (319 | 4.3%), Cleaning & Maintenance (218 | 2.9%), Personal Care & Service (190 | 2.5%), and Security & Protection (125 | 1.7%).
Services Occupations by Sex
Within the Services occupations in Artesia, the most male-oriented occupations are Security & Protection (100.0%), Firefighting & Prevention (100.0%), and Law Enforcement (100.0%), while the most female-oriented occupations are Healthcare Support (75.2%), Personal Care & Service (73.2%), and Food Preparation & Serving (49.1%).
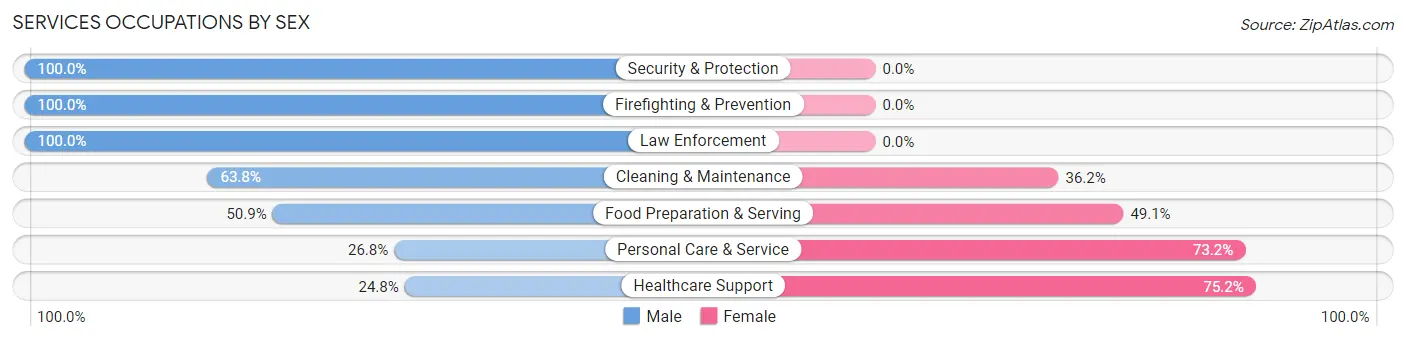
| Occupation | Male | Female |
| Healthcare Support | 79 (24.8%) | 240 (75.2%) |
| Security & Protection | 125 (100.0%) | 0 (0.0%) |
| Firefighting & Prevention | 90 (100.0%) | 0 (0.0%) |
| Law Enforcement | 35 (100.0%) | 0 (0.0%) |
| Food Preparation & Serving | 334 (50.9%) | 322 (49.1%) |
| Cleaning & Maintenance | 139 (63.8%) | 79 (36.2%) |
| Personal Care & Service | 51 (26.8%) | 139 (73.2%) |
| Total (Category) | 728 (48.3%) | 780 (51.7%) |
| Total (Overall) | 3,996 (53.6%) | 3,460 (46.4%) |
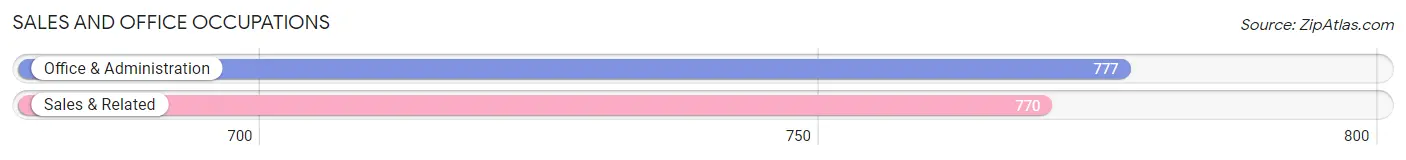
Sales and Office Occupations
The most common Sales and Office occupations in Artesia are Office & Administration (777 | 10.4%), and Sales & Related (770 | 10.3%).
Sales and Office Occupations by Sex
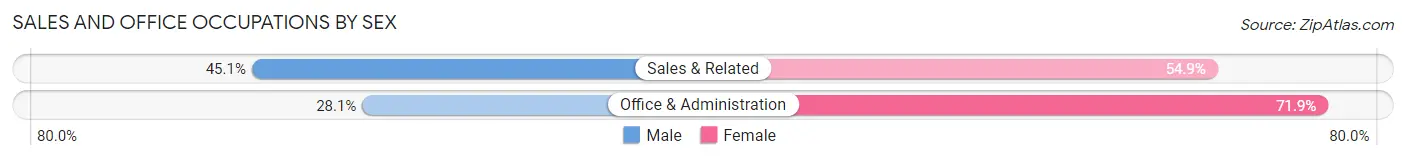
| Occupation | Male | Female |
| Sales & Related | 347 (45.1%) | 423 (54.9%) |
| Office & Administration | 218 (28.1%) | 559 (71.9%) |
| Total (Category) | 565 (36.5%) | 982 (63.5%) |
| Total (Overall) | 3,996 (53.6%) | 3,460 (46.4%) |
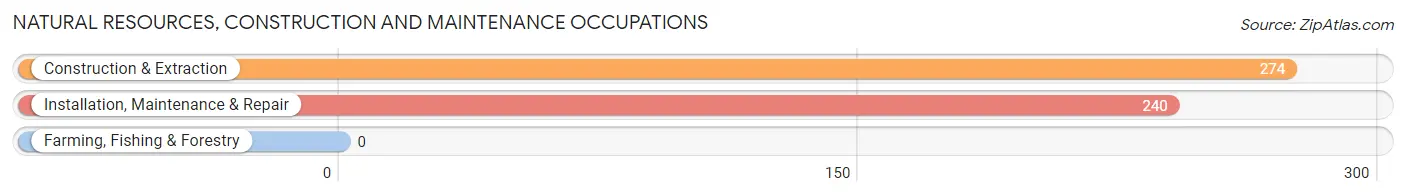
Natural Resources, Construction and Maintenance Occupations
The most common Natural Resources, Construction and Maintenance occupations in Artesia are Construction & Extraction (274 | 3.7%), and Installation, Maintenance & Repair (240 | 3.2%).
Natural Resources, Construction and Maintenance Occupations by Sex
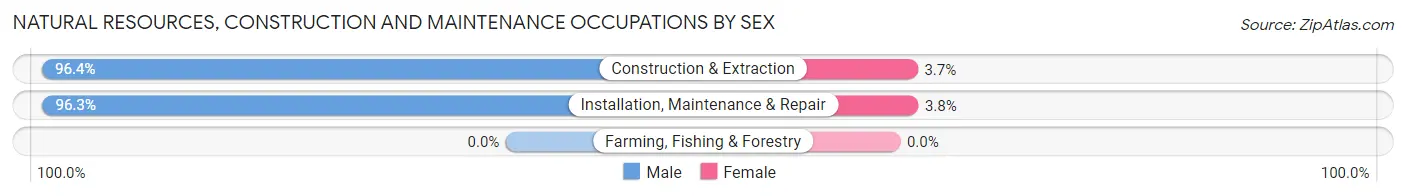
| Occupation | Male | Female |
| Farming, Fishing & Forestry | 0 (0.0%) | 0 (0.0%) |
| Construction & Extraction | 264 (96.4%) | 10 (3.6%) |
| Installation, Maintenance & Repair | 231 (96.3%) | 9 (3.7%) |
| Total (Category) | 495 (96.3%) | 19 (3.7%) |
| Total (Overall) | 3,996 (53.6%) | 3,460 (46.4%) |
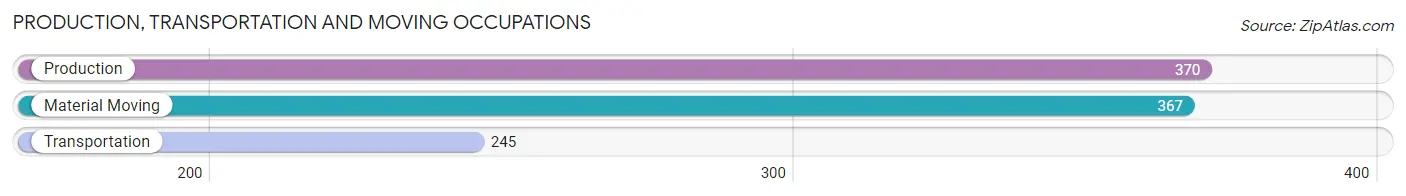
Production, Transportation and Moving Occupations
The most common Production, Transportation and Moving occupations in Artesia are Production (370 | 5.0%), Material Moving (367 | 4.9%), and Transportation (245 | 3.3%).
Production, Transportation and Moving Occupations by Sex
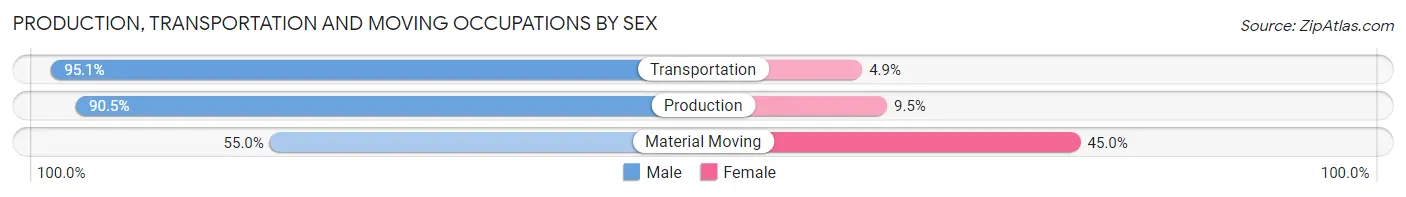
| Occupation | Male | Female |
| Production | 335 (90.5%) | 35 (9.5%) |
| Transportation | 233 (95.1%) | 12 (4.9%) |
| Material Moving | 202 (55.0%) | 165 (45.0%) |
| Total (Category) | 770 (78.4%) | 212 (21.6%) |
| Total (Overall) | 3,996 (53.6%) | 3,460 (46.4%) |
Employment Industries by Sex in Artesia
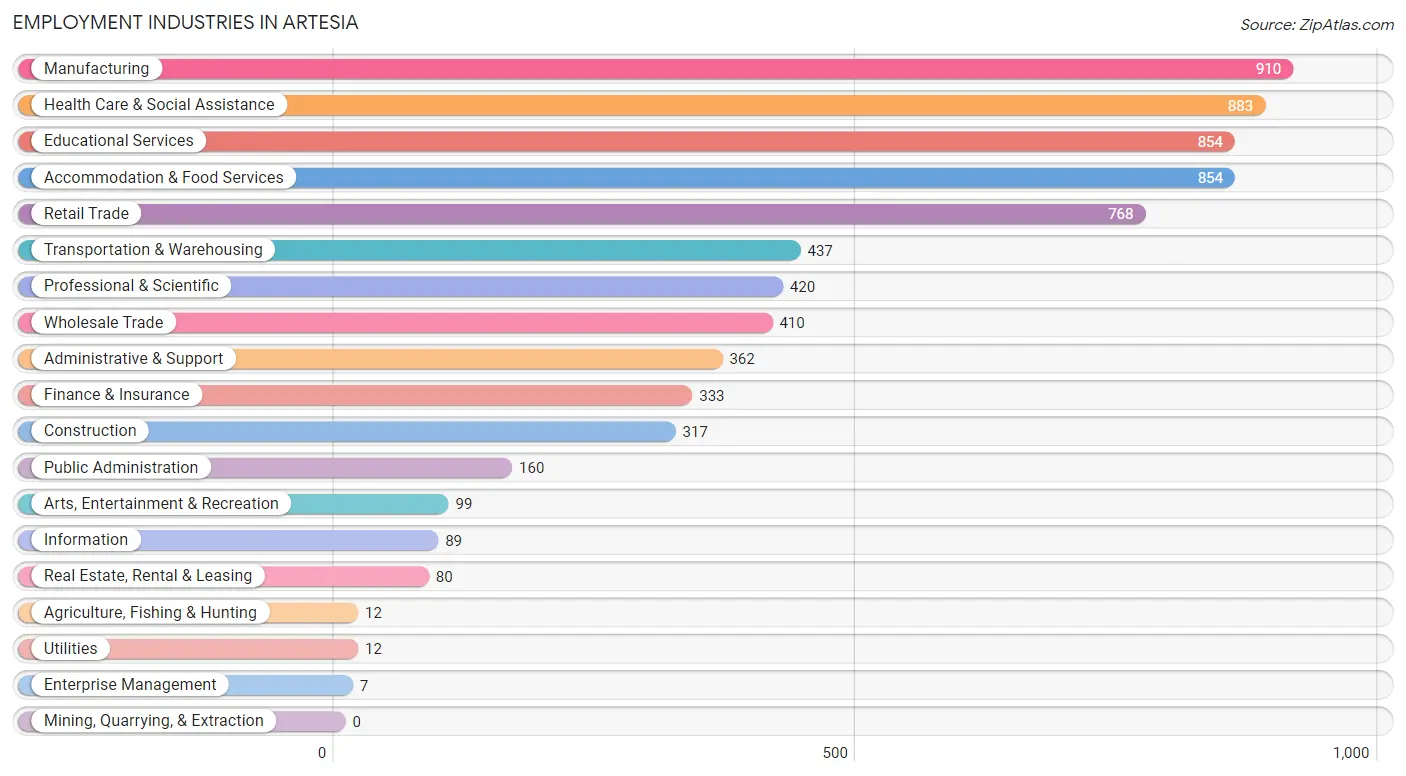
Employment Industries in Artesia
The major employment industries in Artesia include Manufacturing (910 | 12.2%), Health Care & Social Assistance (883 | 11.8%), Educational Services (854 | 11.5%), Accommodation & Food Services (854 | 11.5%), and Retail Trade (768 | 10.3%).
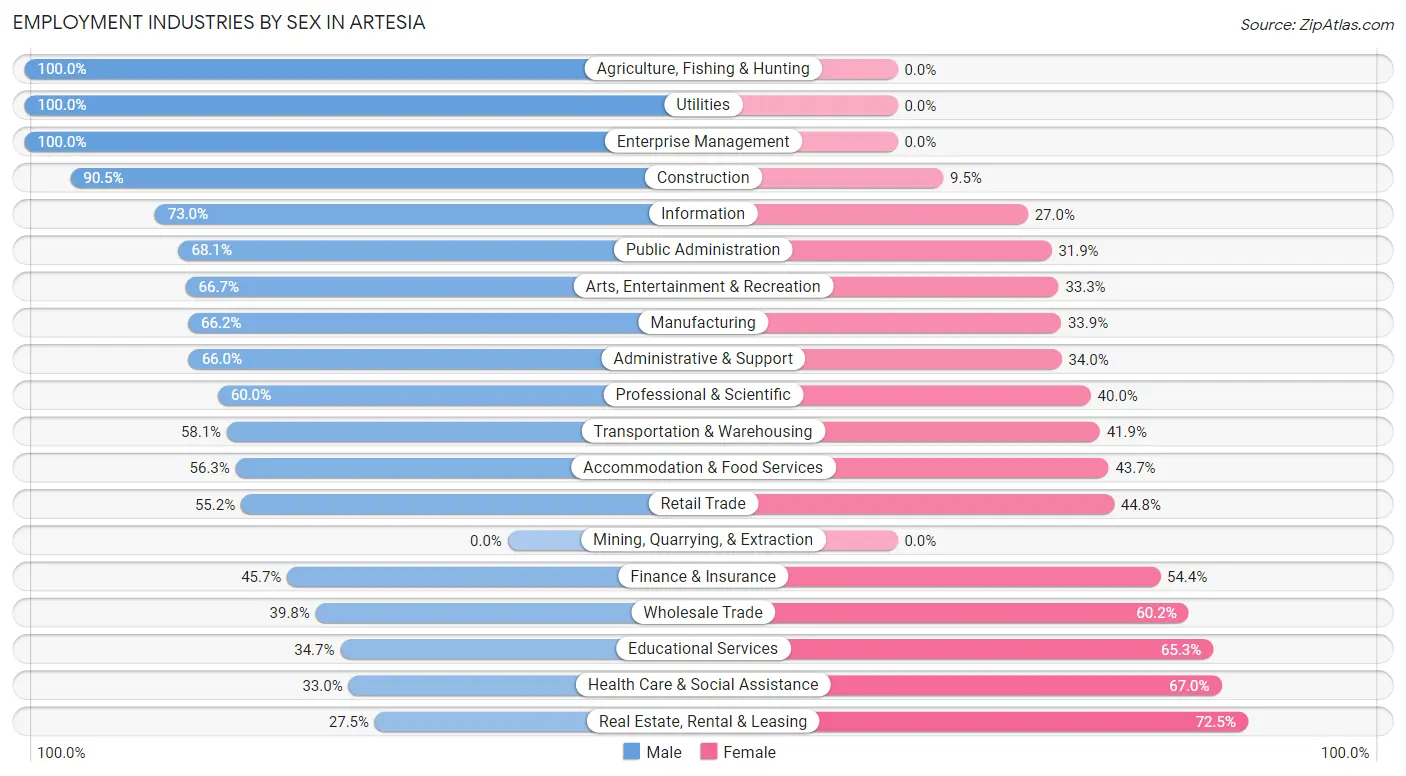
Employment Industries by Sex in Artesia
The Artesia industries that see more men than women are Agriculture, Fishing & Hunting (100.0%), Utilities (100.0%), and Enterprise Management (100.0%), whereas the industries that tend to have a higher number of women are Real Estate, Rental & Leasing (72.5%), Health Care & Social Assistance (67.0%), and Educational Services (65.3%).
| Industry | Male | Female |
| Agriculture, Fishing & Hunting | 12 (100.0%) | 0 (0.0%) |
| Mining, Quarrying, & Extraction | 0 (0.0%) | 0 (0.0%) |
| Construction | 287 (90.5%) | 30 (9.5%) |
| Manufacturing | 602 (66.1%) | 308 (33.9%) |
| Wholesale Trade | 163 (39.8%) | 247 (60.2%) |
| Retail Trade | 424 (55.2%) | 344 (44.8%) |
| Transportation & Warehousing | 254 (58.1%) | 183 (41.9%) |
| Utilities | 12 (100.0%) | 0 (0.0%) |
| Information | 65 (73.0%) | 24 (27.0%) |
| Finance & Insurance | 152 (45.7%) | 181 (54.3%) |
| Real Estate, Rental & Leasing | 22 (27.5%) | 58 (72.5%) |
| Professional & Scientific | 252 (60.0%) | 168 (40.0%) |
| Enterprise Management | 7 (100.0%) | 0 (0.0%) |
| Administrative & Support | 239 (66.0%) | 123 (34.0%) |
| Educational Services | 296 (34.7%) | 558 (65.3%) |
| Health Care & Social Assistance | 291 (33.0%) | 592 (67.0%) |
| Arts, Entertainment & Recreation | 66 (66.7%) | 33 (33.3%) |
| Accommodation & Food Services | 481 (56.3%) | 373 (43.7%) |
| Public Administration | 109 (68.1%) | 51 (31.9%) |
| Total | 3,996 (53.6%) | 3,460 (46.4%) |
Education in Artesia
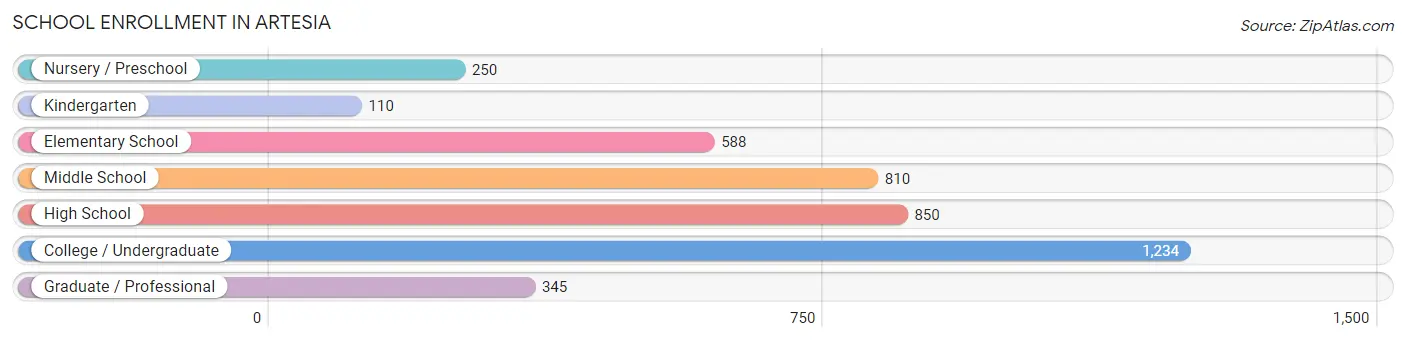
School Enrollment in Artesia
The most common levels of schooling among the 4,187 students in Artesia are college / undergraduate (1,234 | 29.5%), high school (850 | 20.3%), and middle school (810 | 19.4%).
| School Level | # Students | % Students |
| Nursery / Preschool | 250 | 6.0% |
| Kindergarten | 110 | 2.6% |
| Elementary School | 588 | 14.0% |
| Middle School | 810 | 19.4% |
| High School | 850 | 20.3% |
| College / Undergraduate | 1,234 | 29.5% |
| Graduate / Professional | 345 | 8.2% |
| Total | 4,187 | 100.0% |
School Enrollment by Age by Funding Source in Artesia
Out of a total of 4,187 students who are enrolled in schools in Artesia, 368 (8.8%) attend a private institution, while the remaining 3,819 (91.2%) are enrolled in public schools. The age group of 35 years and over has the highest likelihood of being enrolled in private schools, with 103 (37.2% in the age bracket) enrolled. Conversely, the age group of 10 to 14 year olds has the lowest likelihood of being enrolled in a private school, with 1,003 (100.0% in the age bracket) attending a public institution.
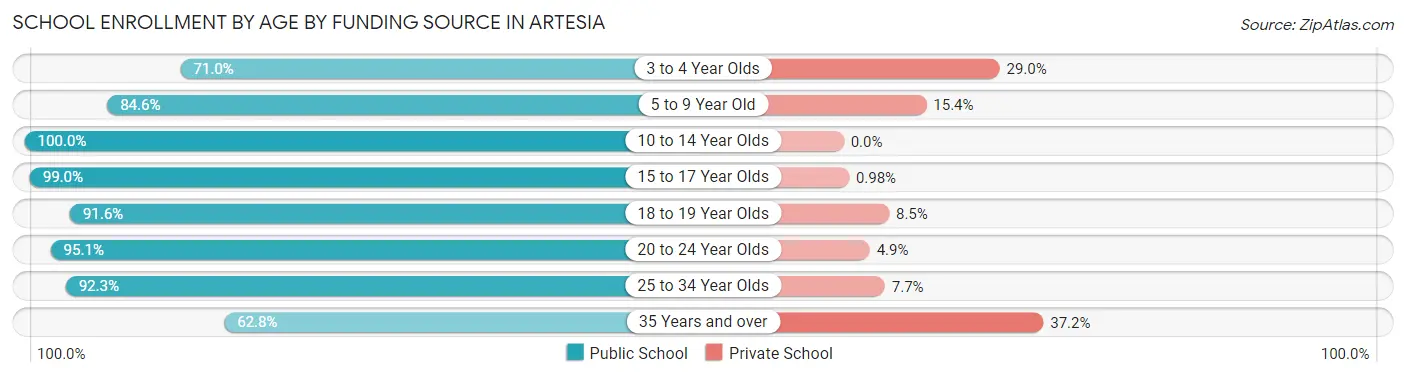
| Age Bracket | Public School | Private School |
| 3 to 4 Year Olds | 154 (71.0%) | 63 (29.0%) |
| 5 to 9 Year Old | 544 (84.6%) | 99 (15.4%) |
| 10 to 14 Year Olds | 1,003 (100.0%) | 0 (0.0%) |
| 15 to 17 Year Olds | 604 (99.0%) | 6 (1.0%) |
| 18 to 19 Year Olds | 401 (91.5%) | 37 (8.5%) |
| 20 to 24 Year Olds | 529 (95.1%) | 27 (4.9%) |
| 25 to 34 Year Olds | 409 (92.3%) | 34 (7.7%) |
| 35 Years and over | 174 (62.8%) | 103 (37.2%) |
| Total | 3,819 (91.2%) | 368 (8.8%) |
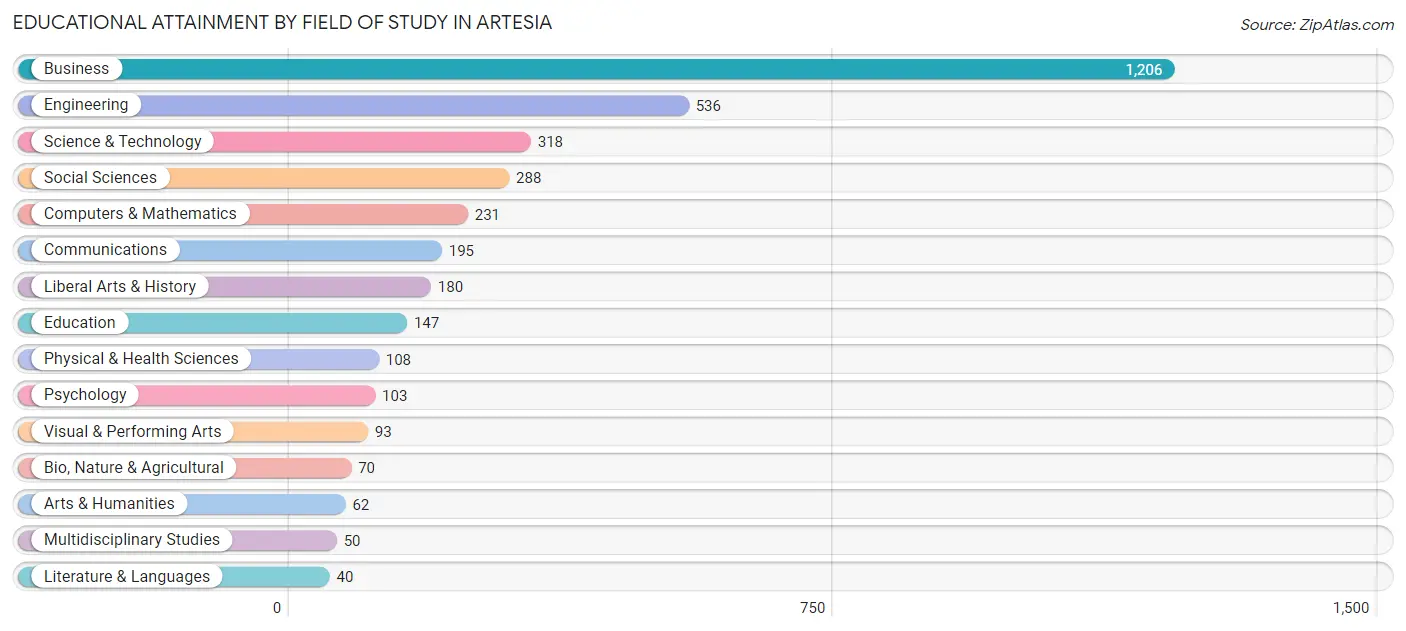
Educational Attainment by Field of Study in Artesia
Business (1,206 | 33.3%), engineering (536 | 14.8%), science & technology (318 | 8.8%), social sciences (288 | 7.9%), and computers & mathematics (231 | 6.4%) are the most common fields of study among 3,627 individuals in Artesia who have obtained a bachelor's degree or higher.
| Field of Study | # Graduates | % Graduates |
| Computers & Mathematics | 231 | 6.4% |
| Bio, Nature & Agricultural | 70 | 1.9% |
| Physical & Health Sciences | 108 | 3.0% |
| Psychology | 103 | 2.8% |
| Social Sciences | 288 | 7.9% |
| Engineering | 536 | 14.8% |
| Multidisciplinary Studies | 50 | 1.4% |
| Science & Technology | 318 | 8.8% |
| Business | 1,206 | 33.3% |
| Education | 147 | 4.1% |
| Literature & Languages | 40 | 1.1% |
| Liberal Arts & History | 180 | 5.0% |
| Visual & Performing Arts | 93 | 2.6% |
| Communications | 195 | 5.4% |
| Arts & Humanities | 62 | 1.7% |
| Total | 3,627 | 100.0% |
Transportation & Commute in Artesia
Vehicle Availability by Sex in Artesia
The most prevalent vehicle ownership categories in Artesia are males with 2 vehicles (1,225, accounting for 33.1%) and females with 2 vehicles (796, making up 37.6%).
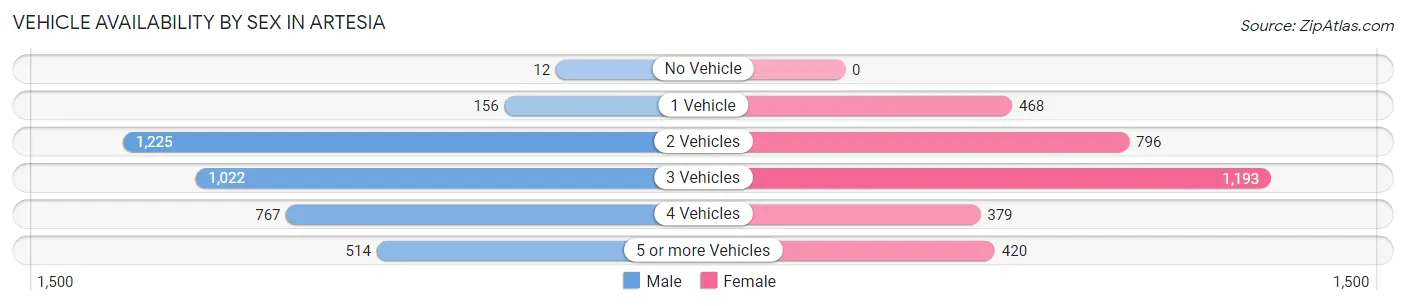
| Vehicles Available | Male | Female |
| No Vehicle | 12 (0.3%) | 0 (0.0%) |
| 1 Vehicle | 156 (4.2%) | 468 (14.4%) |
| 2 Vehicles | 1,225 (33.1%) | 796 (24.4%) |
| 3 Vehicles | 1,022 (27.7%) | 1,193 (36.6%) |
| 4 Vehicles | 767 (20.7%) | 379 (11.6%) |
| 5 or more Vehicles | 514 (13.9%) | 420 (12.9%) |
| Total | 3,696 (100.0%) | 3,256 (100.0%) |
Commute Time in Artesia
The most frequently occuring commute durations in Artesia are 10 to 14 minutes (1,075 commuters, 17.3%), 15 to 19 minutes (923 commuters, 14.8%), and 20 to 24 minutes (864 commuters, 13.9%).
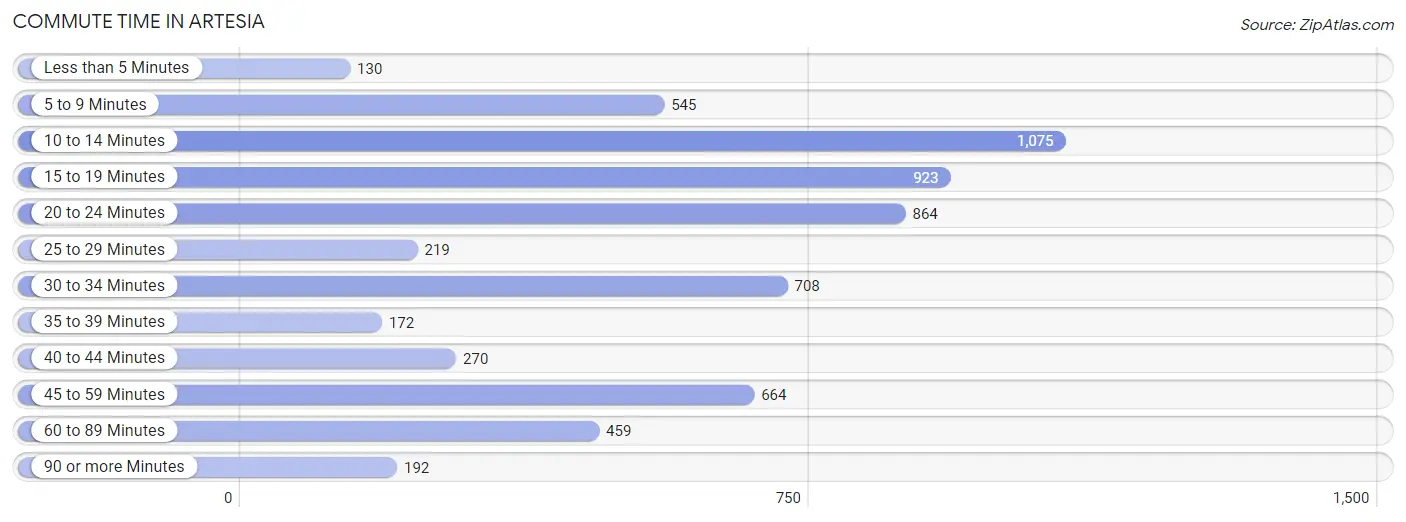
| Commute Time | # Commuters | % Commuters |
| Less than 5 Minutes | 130 | 2.1% |
| 5 to 9 Minutes | 545 | 8.8% |
| 10 to 14 Minutes | 1,075 | 17.3% |
| 15 to 19 Minutes | 923 | 14.8% |
| 20 to 24 Minutes | 864 | 13.9% |
| 25 to 29 Minutes | 219 | 3.5% |
| 30 to 34 Minutes | 708 | 11.4% |
| 35 to 39 Minutes | 172 | 2.8% |
| 40 to 44 Minutes | 270 | 4.3% |
| 45 to 59 Minutes | 664 | 10.7% |
| 60 to 89 Minutes | 459 | 7.4% |
| 90 or more Minutes | 192 | 3.1% |
Commute Time by Sex in Artesia
The most common commute times in Artesia are 10 to 14 minutes (626 commuters, 18.2%) for males and 15 to 19 minutes (465 commuters, 16.7%) for females.
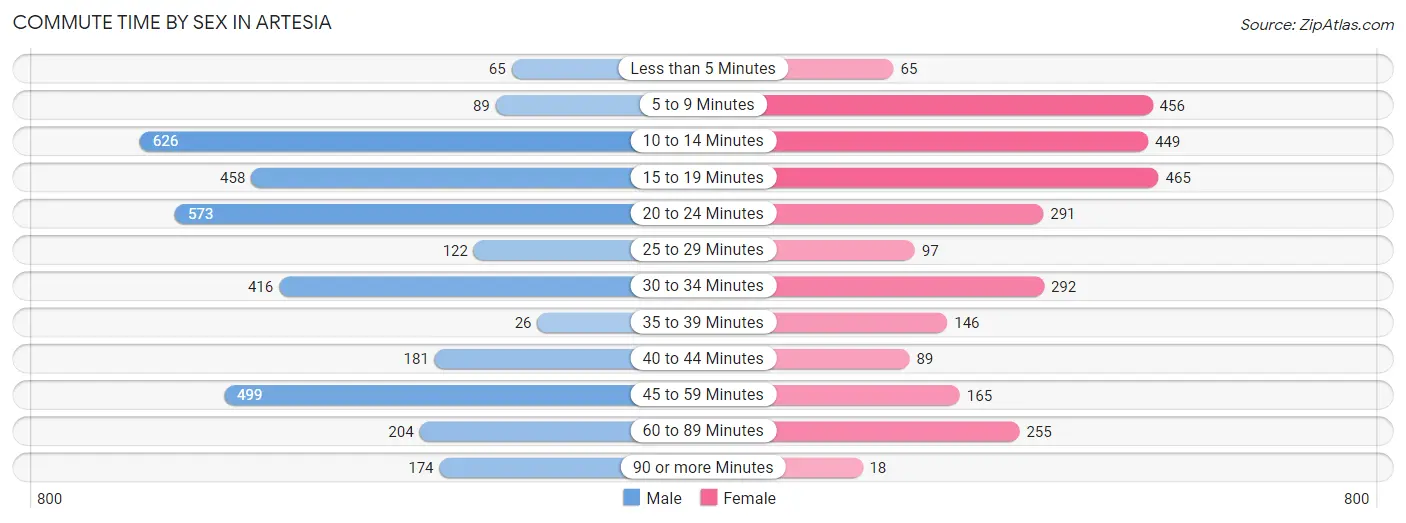
| Commute Time | Male | Female |
| Less than 5 Minutes | 65 (1.9%) | 65 (2.3%) |
| 5 to 9 Minutes | 89 (2.6%) | 456 (16.4%) |
| 10 to 14 Minutes | 626 (18.2%) | 449 (16.1%) |
| 15 to 19 Minutes | 458 (13.3%) | 465 (16.7%) |
| 20 to 24 Minutes | 573 (16.7%) | 291 (10.4%) |
| 25 to 29 Minutes | 122 (3.5%) | 97 (3.5%) |
| 30 to 34 Minutes | 416 (12.1%) | 292 (10.5%) |
| 35 to 39 Minutes | 26 (0.8%) | 146 (5.2%) |
| 40 to 44 Minutes | 181 (5.3%) | 89 (3.2%) |
| 45 to 59 Minutes | 499 (14.5%) | 165 (5.9%) |
| 60 to 89 Minutes | 204 (5.9%) | 255 (9.1%) |
| 90 or more Minutes | 174 (5.1%) | 18 (0.6%) |
Time of Departure to Work by Sex in Artesia
The most frequent times of departure to work in Artesia are 7:30 AM to 7:59 AM (442, 12.9%) for males and 7:00 AM to 7:29 AM (494, 17.7%) for females.
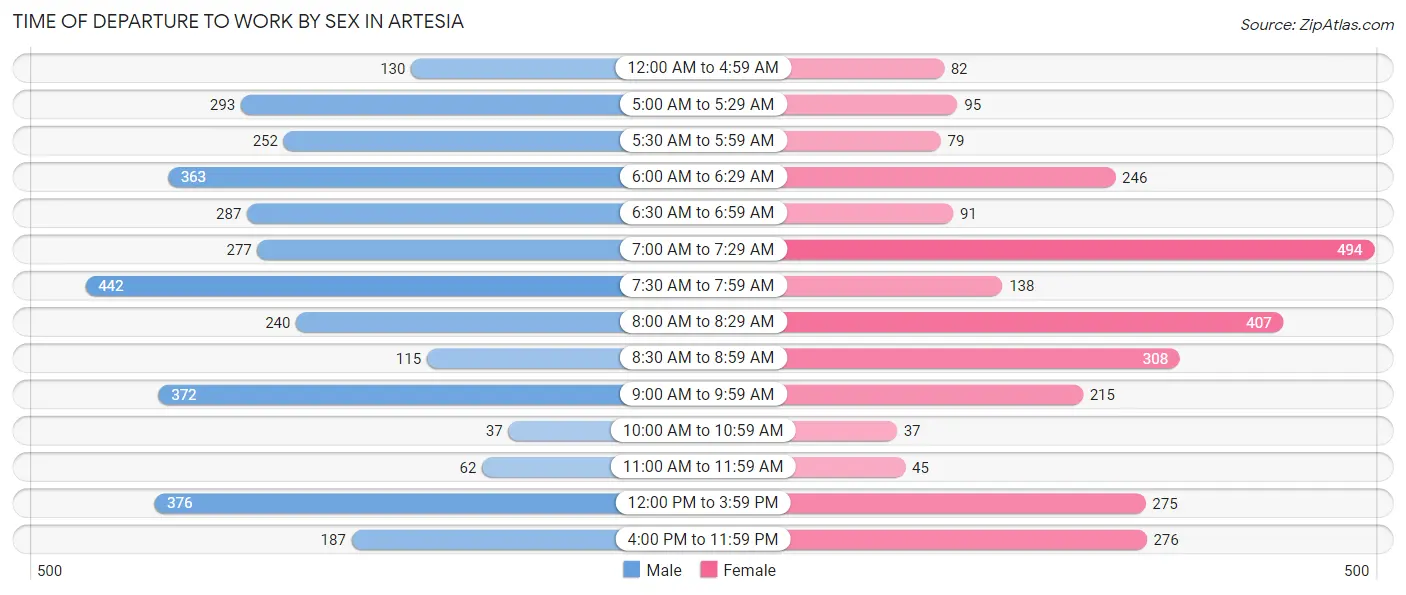
| Time of Departure | Male | Female |
| 12:00 AM to 4:59 AM | 130 (3.8%) | 82 (2.9%) |
| 5:00 AM to 5:29 AM | 293 (8.5%) | 95 (3.4%) |
| 5:30 AM to 5:59 AM | 252 (7.3%) | 79 (2.8%) |
| 6:00 AM to 6:29 AM | 363 (10.6%) | 246 (8.8%) |
| 6:30 AM to 6:59 AM | 287 (8.4%) | 91 (3.3%) |
| 7:00 AM to 7:29 AM | 277 (8.1%) | 494 (17.7%) |
| 7:30 AM to 7:59 AM | 442 (12.9%) | 138 (5.0%) |
| 8:00 AM to 8:29 AM | 240 (7.0%) | 407 (14.6%) |
| 8:30 AM to 8:59 AM | 115 (3.4%) | 308 (11.1%) |
| 9:00 AM to 9:59 AM | 372 (10.8%) | 215 (7.7%) |
| 10:00 AM to 10:59 AM | 37 (1.1%) | 37 (1.3%) |
| 11:00 AM to 11:59 AM | 62 (1.8%) | 45 (1.6%) |
| 12:00 PM to 3:59 PM | 376 (11.0%) | 275 (9.9%) |
| 4:00 PM to 11:59 PM | 187 (5.4%) | 276 (9.9%) |
| Total | 3,433 (100.0%) | 2,788 (100.0%) |
Housing Occupancy in Artesia
Occupancy by Ownership in Artesia
Of the total 4,484 dwellings in Artesia, owner-occupied units account for 2,323 (51.8%), while renter-occupied units make up 2,161 (48.2%).
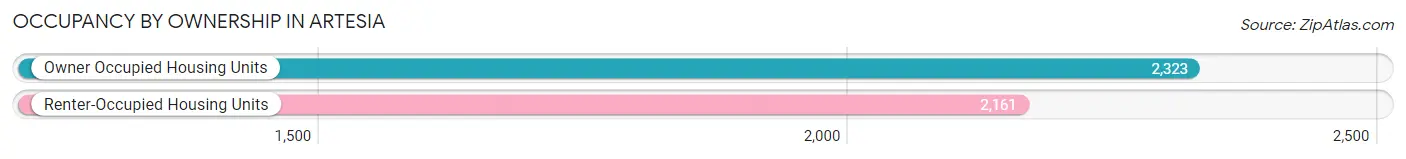
| Occupancy | # Housing Units | % Housing Units |
| Owner Occupied Housing Units | 2,323 | 51.8% |
| Renter-Occupied Housing Units | 2,161 | 48.2% |
| Total Occupied Housing Units | 4,484 | 100.0% |
Occupancy by Household Size in Artesia
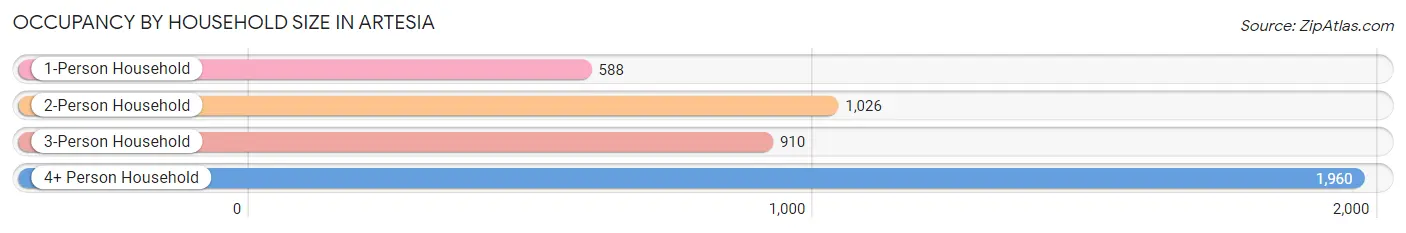
| Household Size | # Housing Units | % Housing Units |
| 1-Person Household | 588 | 13.1% |
| 2-Person Household | 1,026 | 22.9% |
| 3-Person Household | 910 | 20.3% |
| 4+ Person Household | 1,960 | 43.7% |
| Total Housing Units | 4,484 | 100.0% |
Occupancy by Ownership by Household Size in Artesia
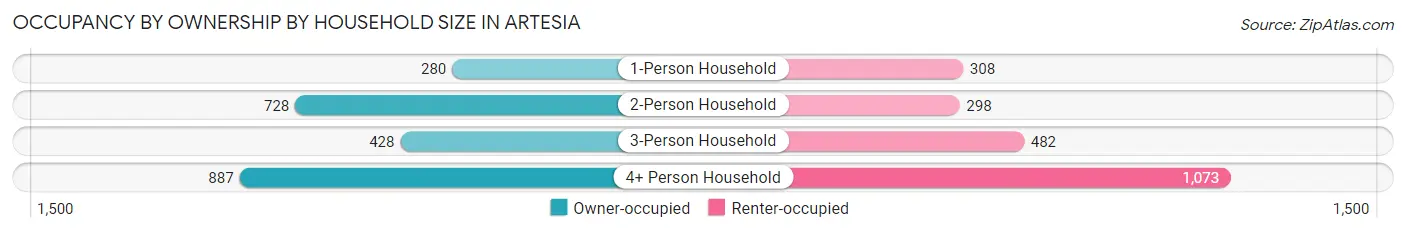
| Household Size | Owner-occupied | Renter-occupied |
| 1-Person Household | 280 (47.6%) | 308 (52.4%) |
| 2-Person Household | 728 (71.0%) | 298 (29.0%) |
| 3-Person Household | 428 (47.0%) | 482 (53.0%) |
| 4+ Person Household | 887 (45.3%) | 1,073 (54.7%) |
| Total Housing Units | 2,323 (51.8%) | 2,161 (48.2%) |
Occupancy by Educational Attainment in Artesia
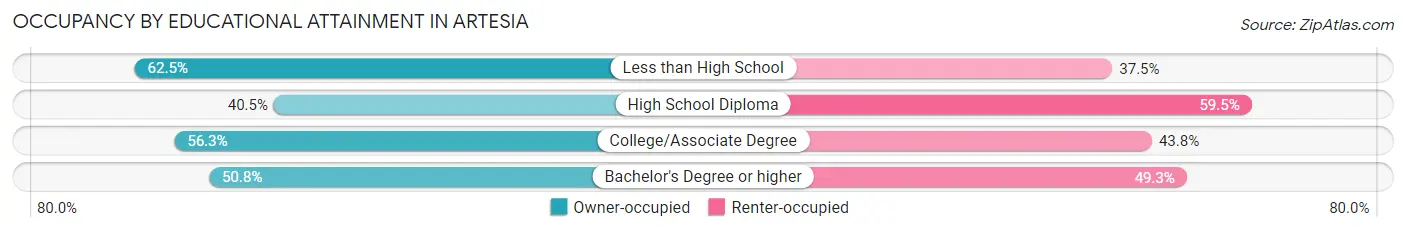
| Household Size | Owner-occupied | Renter-occupied |
| Less than High School | 444 (62.5%) | 266 (37.5%) |
| High School Diploma | 389 (40.5%) | 572 (59.5%) |
| College/Associate Degree | 639 (56.2%) | 497 (43.8%) |
| Bachelor's Degree or higher | 851 (50.7%) | 826 (49.2%) |
Occupancy by Age of Householder in Artesia
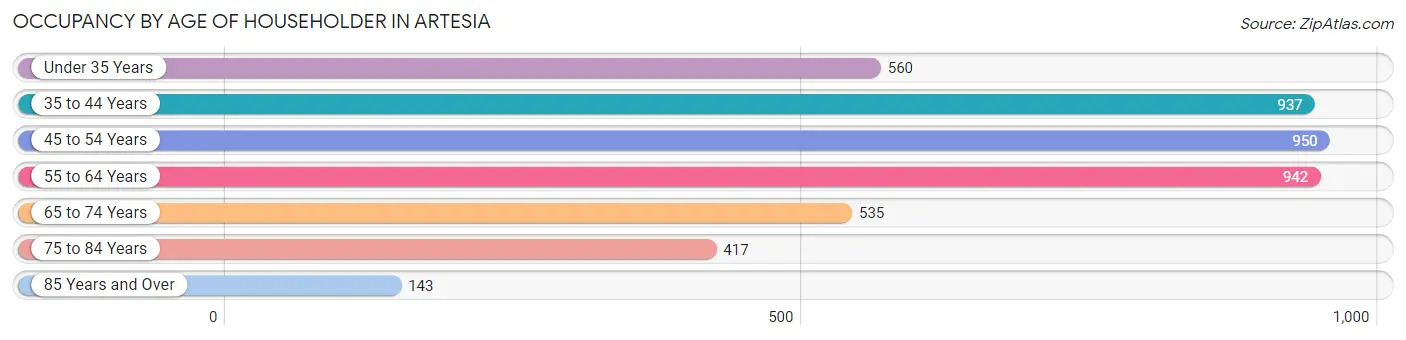
| Age Bracket | # Households | % Households |
| Under 35 Years | 560 | 12.5% |
| 35 to 44 Years | 937 | 20.9% |
| 45 to 54 Years | 950 | 21.2% |
| 55 to 64 Years | 942 | 21.0% |
| 65 to 74 Years | 535 | 11.9% |
| 75 to 84 Years | 417 | 9.3% |
| 85 Years and Over | 143 | 3.2% |
| Total | 4,484 | 100.0% |
Housing Finances in Artesia
Median Income by Occupancy in Artesia
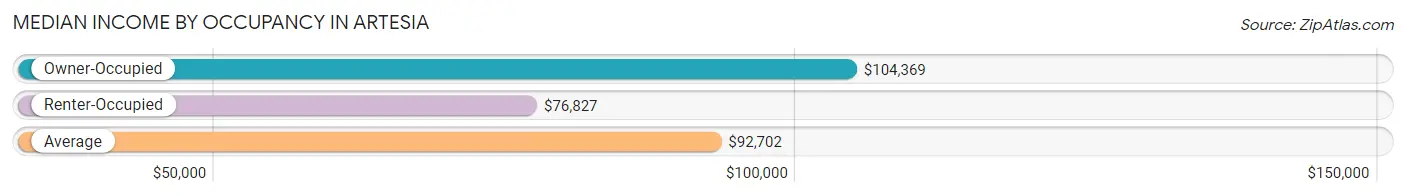
| Occupancy Type | # Households | Median Income |
| Owner-Occupied | 2,323 (51.8%) | $104,369 |
| Renter-Occupied | 2,161 (48.2%) | $76,827 |
| Average | 4,484 (100.0%) | $92,702 |
Occupancy by Householder Income Bracket in Artesia
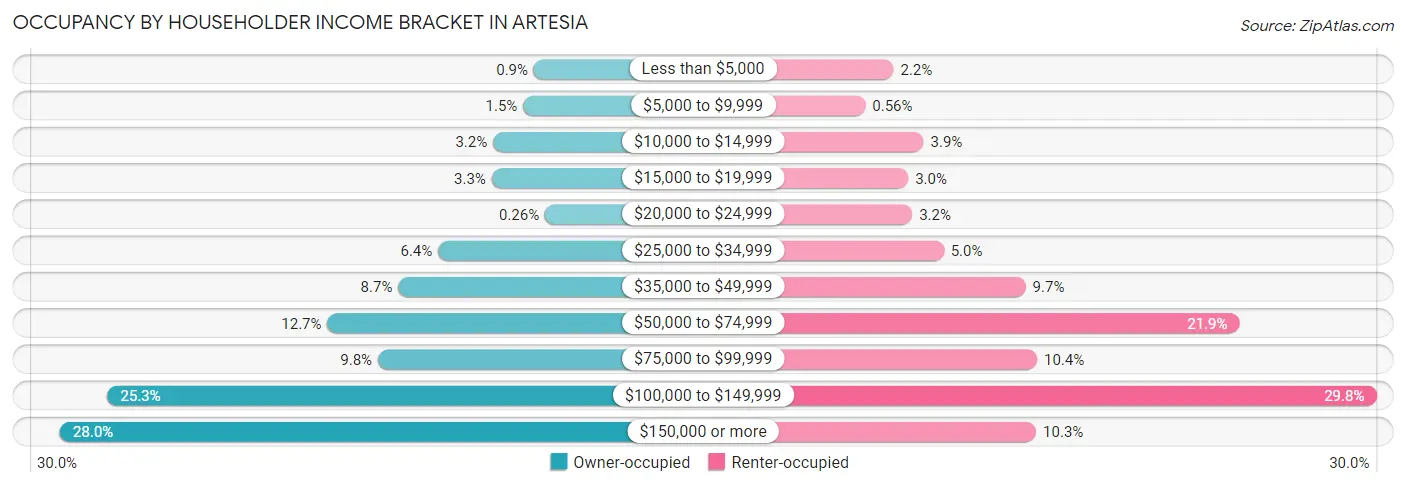
| Income Bracket | Owner-occupied | Renter-occupied |
| Less than $5,000 | 21 (0.9%) | 47 (2.2%) |
| $5,000 to $9,999 | 35 (1.5%) | 12 (0.6%) |
| $10,000 to $14,999 | 75 (3.2%) | 84 (3.9%) |
| $15,000 to $19,999 | 77 (3.3%) | 65 (3.0%) |
| $20,000 to $24,999 | 6 (0.3%) | 70 (3.2%) |
| $25,000 to $34,999 | 148 (6.4%) | 109 (5.0%) |
| $35,000 to $49,999 | 201 (8.6%) | 210 (9.7%) |
| $50,000 to $74,999 | 295 (12.7%) | 474 (21.9%) |
| $75,000 to $99,999 | 228 (9.8%) | 224 (10.4%) |
| $100,000 to $149,999 | 587 (25.3%) | 643 (29.7%) |
| $150,000 or more | 650 (28.0%) | 223 (10.3%) |
| Total | 2,323 (100.0%) | 2,161 (100.0%) |
Monthly Housing Cost Tiers in Artesia
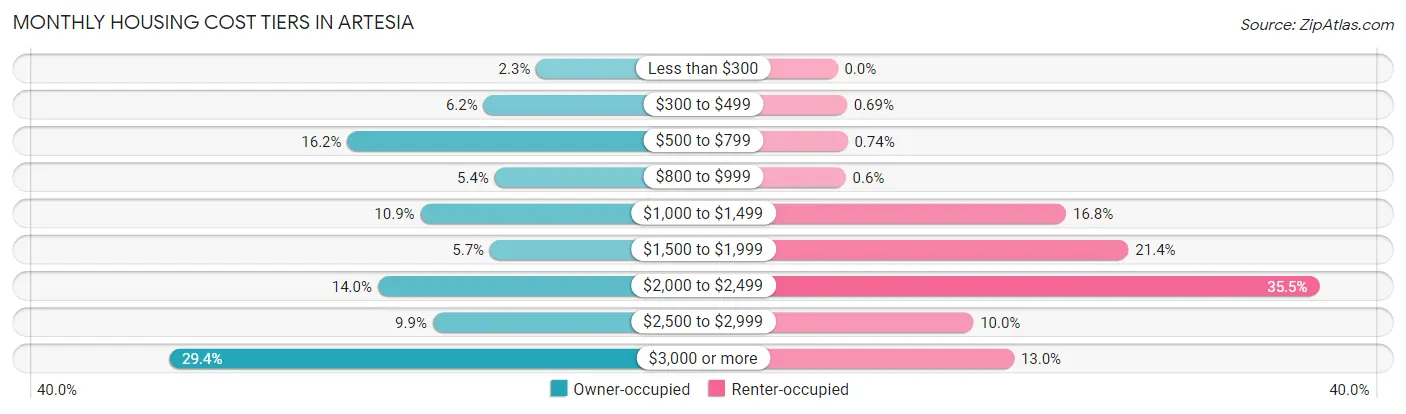
| Monthly Cost | Owner-occupied | Renter-occupied |
| Less than $300 | 54 (2.3%) | 0 (0.0%) |
| $300 to $499 | 144 (6.2%) | 15 (0.7%) |
| $500 to $799 | 377 (16.2%) | 16 (0.7%) |
| $800 to $999 | 125 (5.4%) | 13 (0.6%) |
| $1,000 to $1,499 | 252 (10.8%) | 364 (16.8%) |
| $1,500 to $1,999 | 133 (5.7%) | 463 (21.4%) |
| $2,000 to $2,499 | 325 (14.0%) | 767 (35.5%) |
| $2,500 to $2,999 | 231 (9.9%) | 216 (10.0%) |
| $3,000 or more | 682 (29.4%) | 281 (13.0%) |
| Total | 2,323 (100.0%) | 2,161 (100.0%) |
Physical Housing Characteristics in Artesia
Housing Structures in Artesia
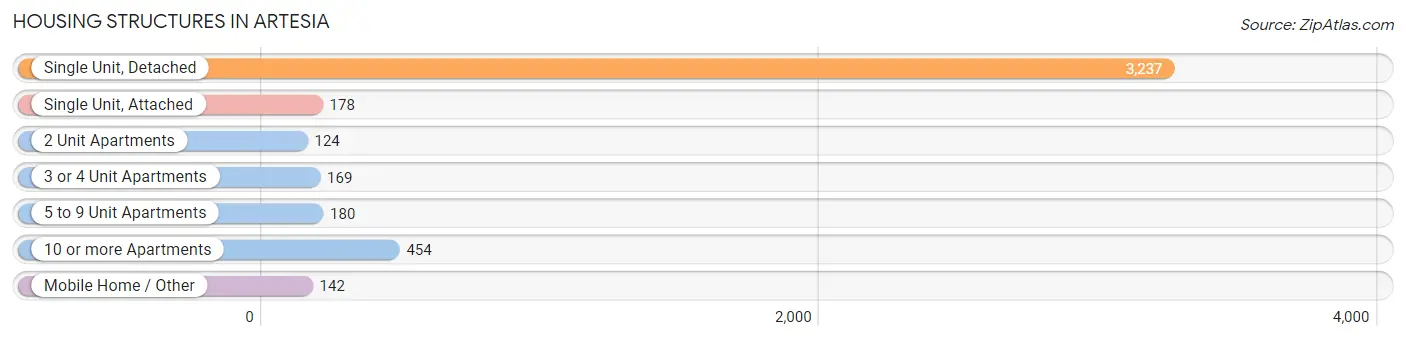
| Structure Type | # Housing Units | % Housing Units |
| Single Unit, Detached | 3,237 | 72.2% |
| Single Unit, Attached | 178 | 4.0% |
| 2 Unit Apartments | 124 | 2.8% |
| 3 or 4 Unit Apartments | 169 | 3.8% |
| 5 to 9 Unit Apartments | 180 | 4.0% |
| 10 or more Apartments | 454 | 10.1% |
| Mobile Home / Other | 142 | 3.2% |
| Total | 4,484 | 100.0% |
Housing Structures by Occupancy in Artesia
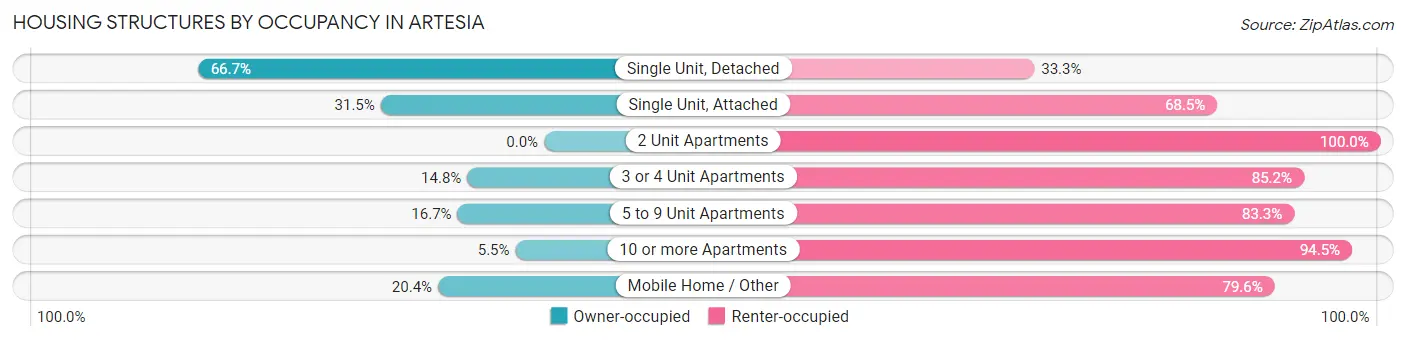
| Structure Type | Owner-occupied | Renter-occupied |
| Single Unit, Detached | 2,158 (66.7%) | 1,079 (33.3%) |
| Single Unit, Attached | 56 (31.5%) | 122 (68.5%) |
| 2 Unit Apartments | 0 (0.0%) | 124 (100.0%) |
| 3 or 4 Unit Apartments | 25 (14.8%) | 144 (85.2%) |
| 5 to 9 Unit Apartments | 30 (16.7%) | 150 (83.3%) |
| 10 or more Apartments | 25 (5.5%) | 429 (94.5%) |
| Mobile Home / Other | 29 (20.4%) | 113 (79.6%) |
| Total | 2,323 (51.8%) | 2,161 (48.2%) |
Housing Structures by Number of Rooms in Artesia
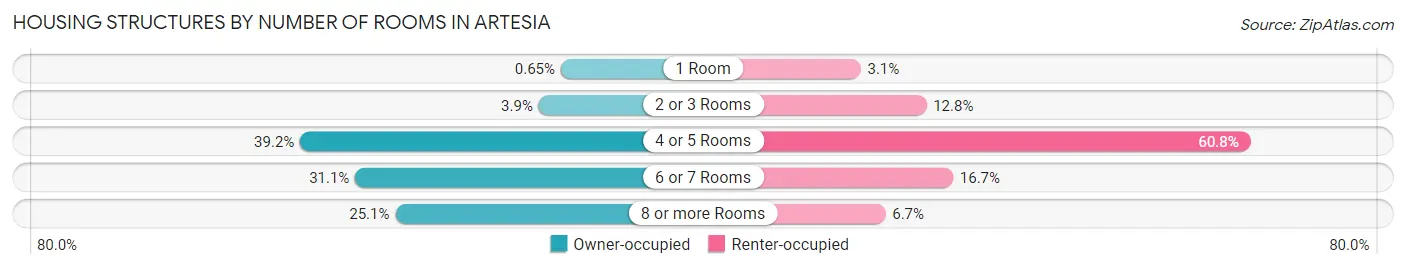
| Number of Rooms | Owner-occupied | Renter-occupied |
| 1 Room | 15 (0.6%) | 66 (3.0%) |
| 2 or 3 Rooms | 91 (3.9%) | 276 (12.8%) |
| 4 or 5 Rooms | 911 (39.2%) | 1,313 (60.8%) |
| 6 or 7 Rooms | 722 (31.1%) | 361 (16.7%) |
| 8 or more Rooms | 584 (25.1%) | 145 (6.7%) |
| Total | 2,323 (100.0%) | 2,161 (100.0%) |
Housing Structure by Heating Type in Artesia
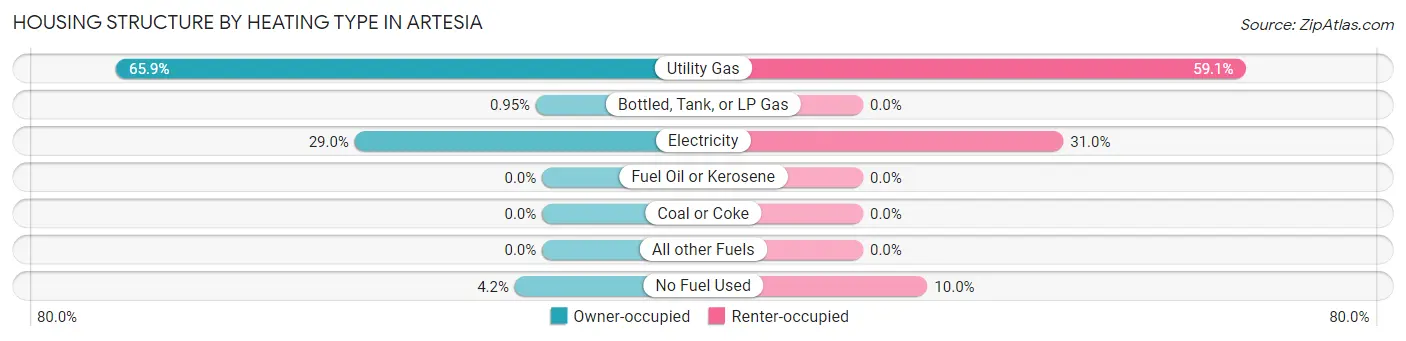
| Heating Type | Owner-occupied | Renter-occupied |
| Utility Gas | 1,530 (65.9%) | 1,277 (59.1%) |
| Bottled, Tank, or LP Gas | 22 (0.9%) | 0 (0.0%) |
| Electricity | 673 (29.0%) | 669 (31.0%) |
| Fuel Oil or Kerosene | 0 (0.0%) | 0 (0.0%) |
| Coal or Coke | 0 (0.0%) | 0 (0.0%) |
| All other Fuels | 0 (0.0%) | 0 (0.0%) |
| No Fuel Used | 98 (4.2%) | 215 (10.0%) |
| Total | 2,323 (100.0%) | 2,161 (100.0%) |
Household Vehicle Usage in Artesia
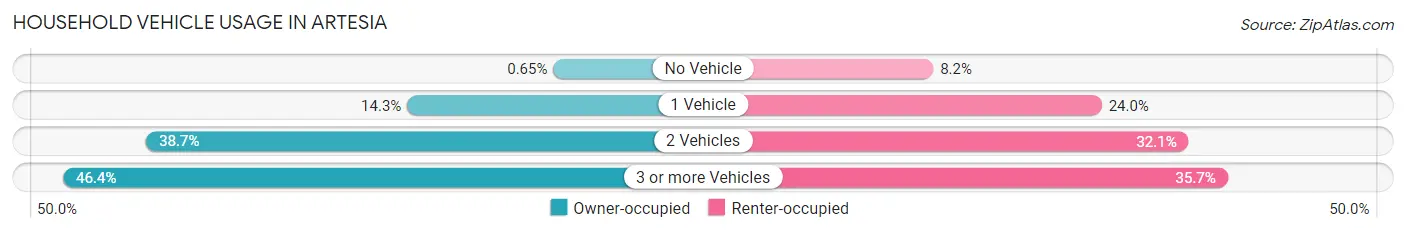
| Vehicles per Household | Owner-occupied | Renter-occupied |
| No Vehicle | 15 (0.6%) | 178 (8.2%) |
| 1 Vehicle | 332 (14.3%) | 518 (24.0%) |
| 2 Vehicles | 898 (38.7%) | 693 (32.1%) |
| 3 or more Vehicles | 1,078 (46.4%) | 772 (35.7%) |
| Total | 2,323 (100.0%) | 2,161 (100.0%) |
Real Estate & Mortgages in Artesia
Real Estate and Mortgage Overview in Artesia
| Characteristic | Without Mortgage | With Mortgage |
| Housing Units | 753 | 1,570 |
| Median Property Value | $655,700 | $715,900 |
| Median Household Income | $80,521 | $440 |
| Monthly Housing Costs | $634 | $682 |
| Real Estate Taxes | $3,438 | $69 |
Property Value by Mortgage Status in Artesia
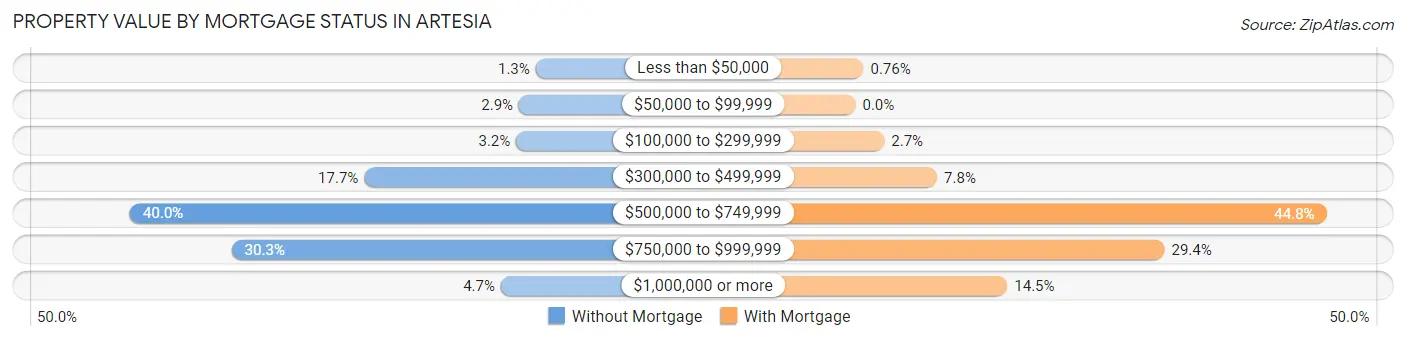
| Property Value | Without Mortgage | With Mortgage |
| Less than $50,000 | 10 (1.3%) | 12 (0.8%) |
| $50,000 to $99,999 | 22 (2.9%) | 0 (0.0%) |
| $100,000 to $299,999 | 24 (3.2%) | 43 (2.7%) |
| $300,000 to $499,999 | 133 (17.7%) | 122 (7.8%) |
| $500,000 to $749,999 | 301 (40.0%) | 704 (44.8%) |
| $750,000 to $999,999 | 228 (30.3%) | 462 (29.4%) |
| $1,000,000 or more | 35 (4.6%) | 227 (14.5%) |
| Total | 753 (100.0%) | 1,570 (100.0%) |
Household Income by Mortgage Status in Artesia
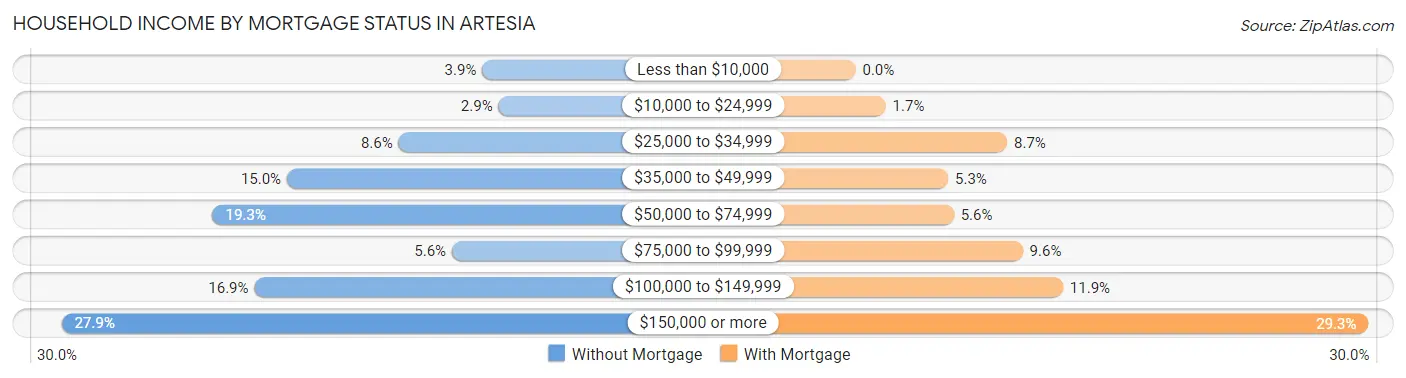
| Household Income | Without Mortgage | With Mortgage |
| Less than $10,000 | 29 (3.8%) | 0 (0.0%) |
| $10,000 to $24,999 | 22 (2.9%) | 27 (1.7%) |
| $25,000 to $34,999 | 65 (8.6%) | 136 (8.7%) |
| $35,000 to $49,999 | 113 (15.0%) | 83 (5.3%) |
| $50,000 to $74,999 | 145 (19.3%) | 88 (5.6%) |
| $75,000 to $99,999 | 42 (5.6%) | 150 (9.6%) |
| $100,000 to $149,999 | 127 (16.9%) | 186 (11.8%) |
| $150,000 or more | 210 (27.9%) | 460 (29.3%) |
| Total | 753 (100.0%) | 1,570 (100.0%) |
Property Value to Household Income Ratio in Artesia
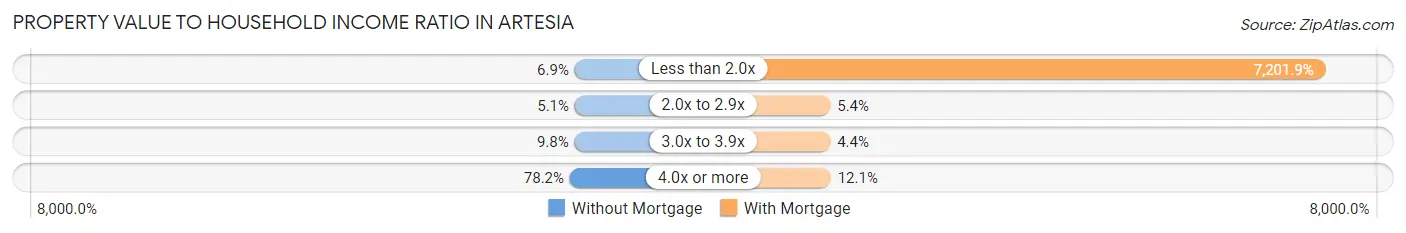
| Value-to-Income Ratio | Without Mortgage | With Mortgage |
| Less than 2.0x | 52 (6.9%) | 113,070 (7,201.9%) |
| 2.0x to 2.9x | 38 (5.1%) | 85 (5.4%) |
| 3.0x to 3.9x | 74 (9.8%) | 69 (4.4%) |
| 4.0x or more | 589 (78.2%) | 190 (12.1%) |
| Total | 753 (100.0%) | 1,570 (100.0%) |
Real Estate Taxes by Mortgage Status in Artesia
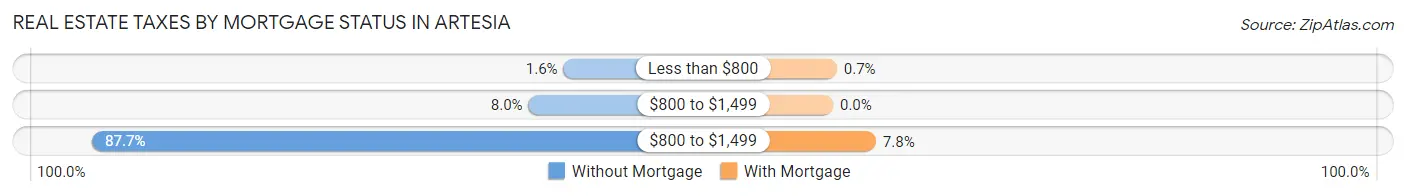
| Property Taxes | Without Mortgage | With Mortgage |
| Less than $800 | 12 (1.6%) | 11 (0.7%) |
| $800 to $1,499 | 60 (8.0%) | 0 (0.0%) |
| $800 to $1,499 | 660 (87.6%) | 123 (7.8%) |
| Total | 753 (100.0%) | 1,570 (100.0%) |
Health & Disability in Artesia
Health Insurance Coverage by Age in Artesia
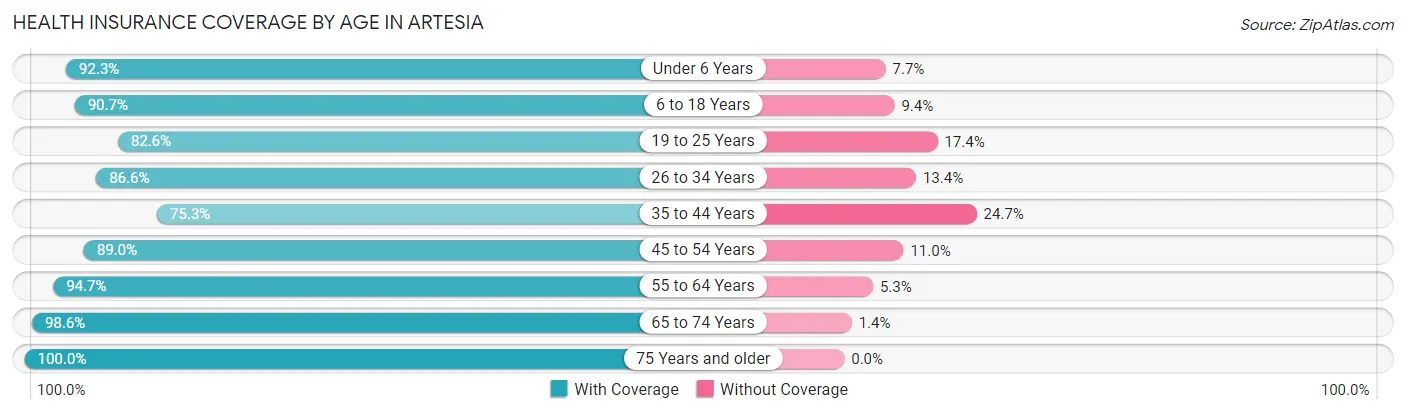
| Age Bracket | With Coverage | Without Coverage |
| Under 6 Years | 898 (92.3%) | 75 (7.7%) |
| 6 to 18 Years | 2,318 (90.6%) | 239 (9.3%) |
| 19 to 25 Years | 1,055 (82.6%) | 222 (17.4%) |
| 26 to 34 Years | 1,860 (86.6%) | 287 (13.4%) |
| 35 to 44 Years | 1,645 (75.3%) | 539 (24.7%) |
| 45 to 54 Years | 2,063 (89.0%) | 256 (11.0%) |
| 55 to 64 Years | 1,896 (94.7%) | 107 (5.3%) |
| 65 to 74 Years | 1,287 (98.6%) | 18 (1.4%) |
| 75 Years and older | 1,037 (100.0%) | 0 (0.0%) |
| Total | 14,059 (89.0%) | 1,743 (11.0%) |
Health Insurance Coverage by Citizenship Status in Artesia
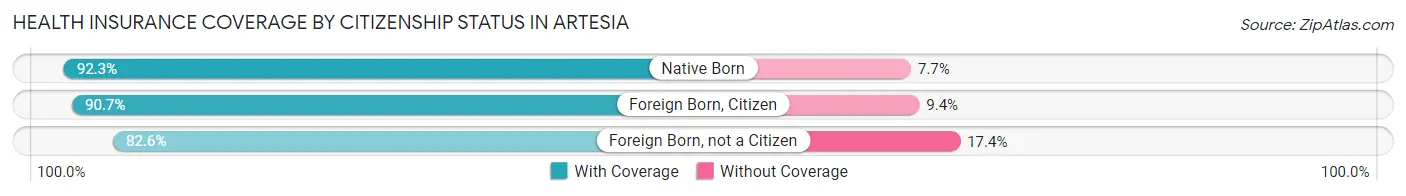
| Citizenship Status | With Coverage | Without Coverage |
| Native Born | 898 (92.3%) | 75 (7.7%) |
| Foreign Born, Citizen | 2,318 (90.6%) | 239 (9.3%) |
| Foreign Born, not a Citizen | 1,055 (82.6%) | 222 (17.4%) |
Health Insurance Coverage by Household Income in Artesia
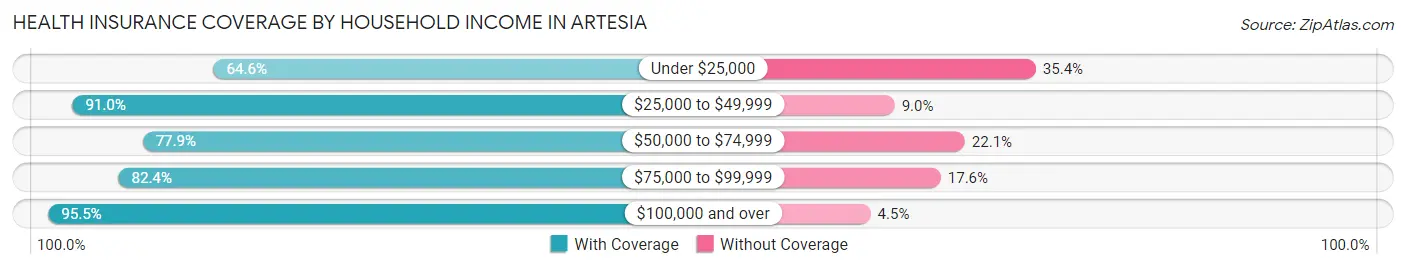
| Household Income | With Coverage | Without Coverage |
| Under $25,000 | 636 (64.6%) | 349 (35.4%) |
| $25,000 to $49,999 | 1,591 (91.0%) | 157 (9.0%) |
| $50,000 to $74,999 | 2,034 (77.9%) | 578 (22.1%) |
| $75,000 to $99,999 | 1,248 (82.4%) | 267 (17.6%) |
| $100,000 and over | 8,387 (95.5%) | 392 (4.5%) |
Public vs Private Health Insurance Coverage by Age in Artesia
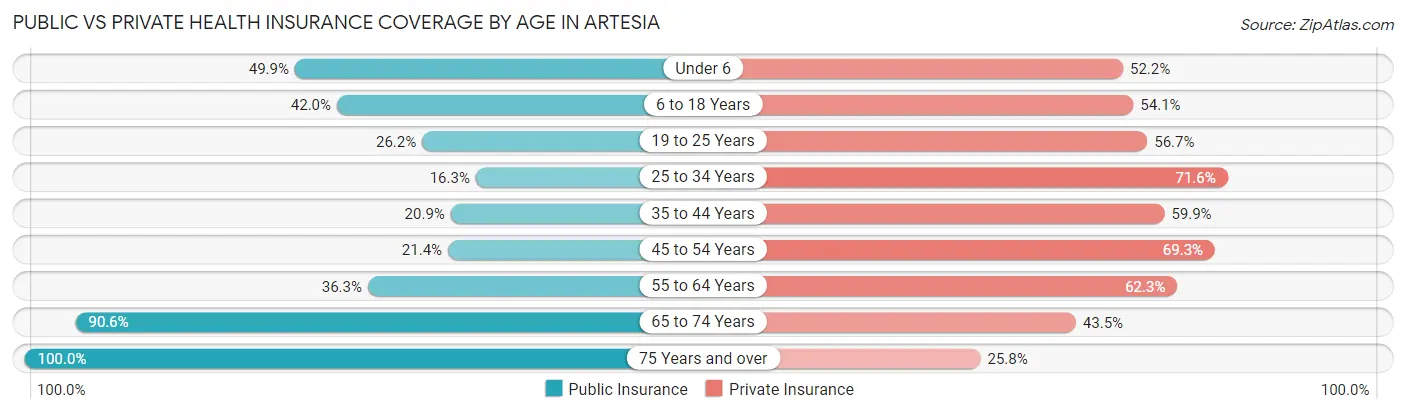
| Age Bracket | Public Insurance | Private Insurance |
| Under 6 | 485 (49.8%) | 508 (52.2%) |
| 6 to 18 Years | 1,075 (42.0%) | 1,384 (54.1%) |
| 19 to 25 Years | 335 (26.2%) | 724 (56.7%) |
| 25 to 34 Years | 349 (16.3%) | 1,537 (71.6%) |
| 35 to 44 Years | 457 (20.9%) | 1,308 (59.9%) |
| 45 to 54 Years | 497 (21.4%) | 1,606 (69.3%) |
| 55 to 64 Years | 727 (36.3%) | 1,247 (62.3%) |
| 65 to 74 Years | 1,182 (90.6%) | 567 (43.4%) |
| 75 Years and over | 1,037 (100.0%) | 267 (25.8%) |
| Total | 6,144 (38.9%) | 9,148 (57.9%) |
Disability Status by Sex by Age in Artesia
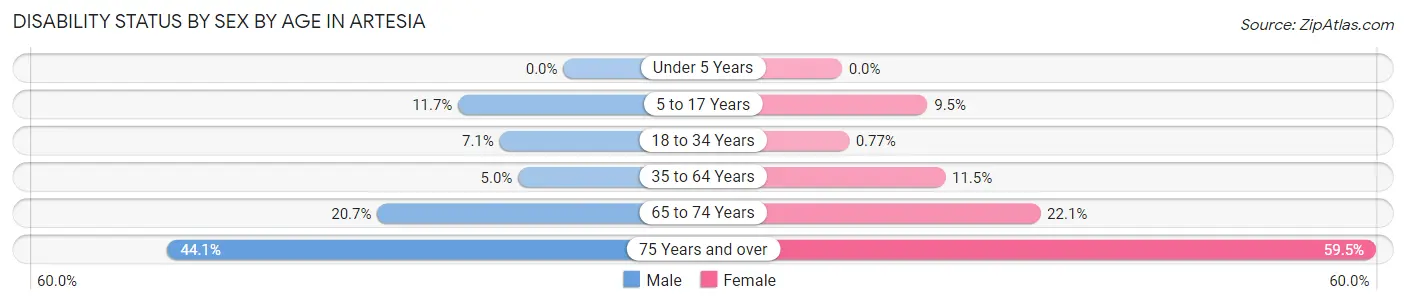
| Age Bracket | Male | Female |
| Under 5 Years | 0 (0.0%) | 0 (0.0%) |
| 5 to 17 Years | 143 (11.7%) | 111 (9.5%) |
| 18 to 34 Years | 136 (7.1%) | 14 (0.8%) |
| 35 to 64 Years | 157 (5.0%) | 389 (11.5%) |
| 65 to 74 Years | 126 (20.7%) | 154 (22.1%) |
| 75 Years and over | 171 (44.1%) | 386 (59.5%) |
Disability Class by Sex by Age in Artesia
Disability Class: Hearing Difficulty
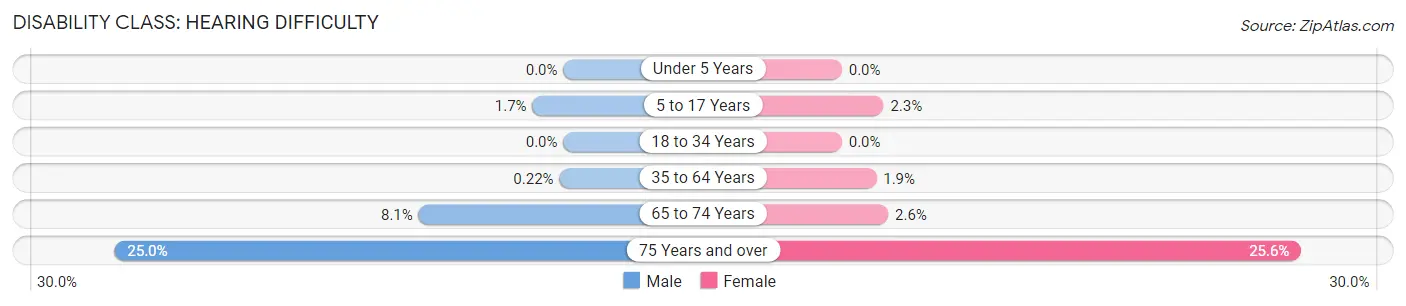
| Age Bracket | Male | Female |
| Under 5 Years | 0 (0.0%) | 0 (0.0%) |
| 5 to 17 Years | 21 (1.7%) | 27 (2.3%) |
| 18 to 34 Years | 0 (0.0%) | 0 (0.0%) |
| 35 to 64 Years | 7 (0.2%) | 65 (1.9%) |
| 65 to 74 Years | 49 (8.1%) | 18 (2.6%) |
| 75 Years and over | 97 (25.0%) | 166 (25.6%) |
Disability Class: Vision Difficulty
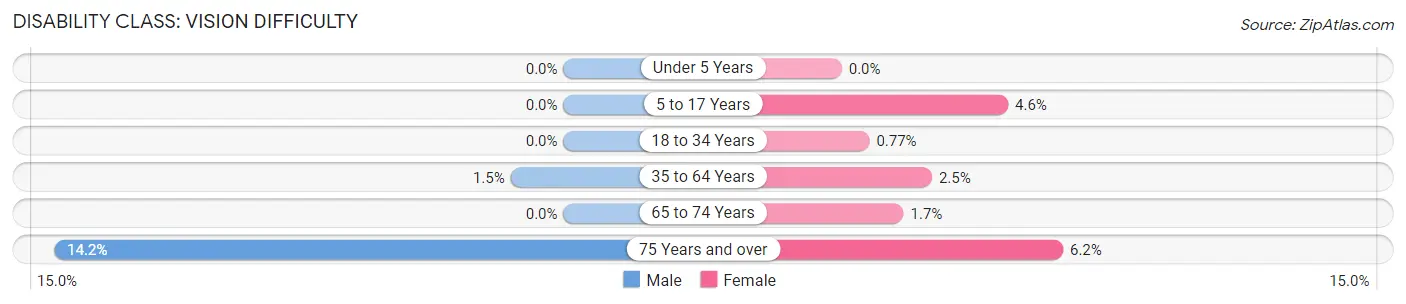
| Age Bracket | Male | Female |
| Under 5 Years | 0 (0.0%) | 0 (0.0%) |
| 5 to 17 Years | 0 (0.0%) | 54 (4.6%) |
| 18 to 34 Years | 0 (0.0%) | 14 (0.8%) |
| 35 to 64 Years | 46 (1.5%) | 85 (2.5%) |
| 65 to 74 Years | 0 (0.0%) | 12 (1.7%) |
| 75 Years and over | 55 (14.2%) | 40 (6.2%) |
Disability Class: Cognitive Difficulty
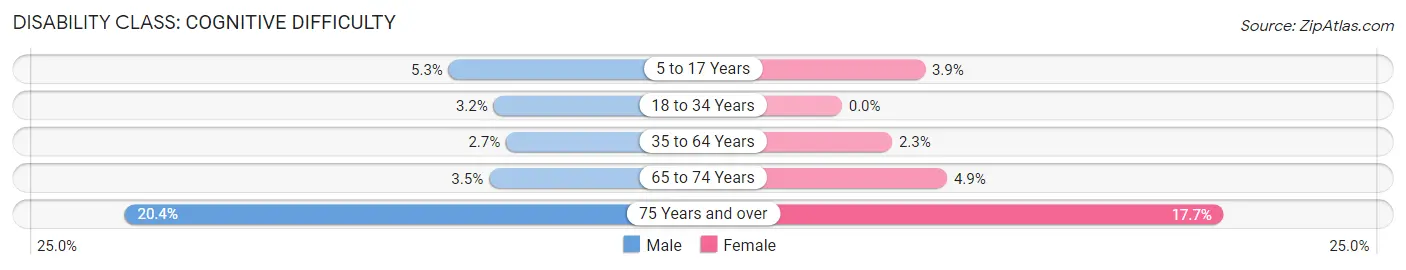
| Age Bracket | Male | Female |
| 5 to 17 Years | 65 (5.3%) | 45 (3.9%) |
| 18 to 34 Years | 62 (3.2%) | 0 (0.0%) |
| 35 to 64 Years | 83 (2.7%) | 79 (2.3%) |
| 65 to 74 Years | 21 (3.5%) | 34 (4.9%) |
| 75 Years and over | 79 (20.4%) | 115 (17.7%) |
Disability Class: Ambulatory Difficulty
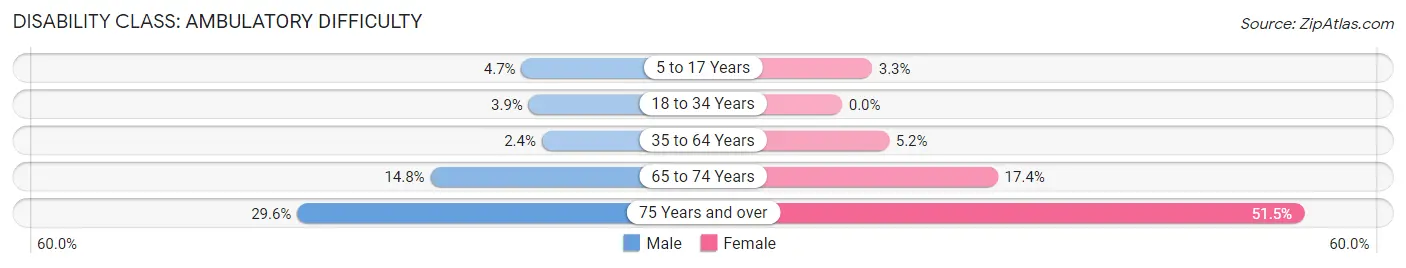
| Age Bracket | Male | Female |
| 5 to 17 Years | 57 (4.7%) | 39 (3.3%) |
| 18 to 34 Years | 74 (3.9%) | 0 (0.0%) |
| 35 to 64 Years | 75 (2.4%) | 177 (5.2%) |
| 65 to 74 Years | 90 (14.8%) | 121 (17.4%) |
| 75 Years and over | 115 (29.6%) | 334 (51.5%) |
Disability Class: Self-Care Difficulty
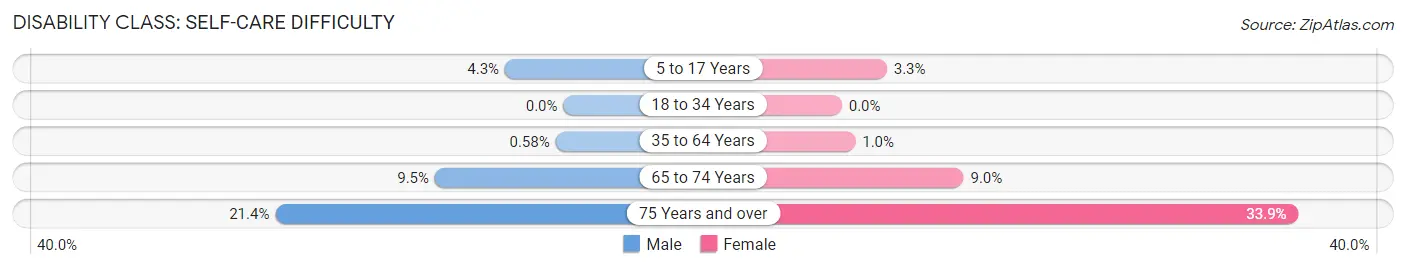
| Age Bracket | Male | Female |
| 5 to 17 Years | 53 (4.3%) | 39 (3.3%) |
| 18 to 34 Years | 0 (0.0%) | 0 (0.0%) |
| 35 to 64 Years | 18 (0.6%) | 34 (1.0%) |
| 65 to 74 Years | 58 (9.5%) | 63 (9.0%) |
| 75 Years and over | 83 (21.4%) | 220 (33.9%) |
Technology Access in Artesia
Computing Device Access in Artesia
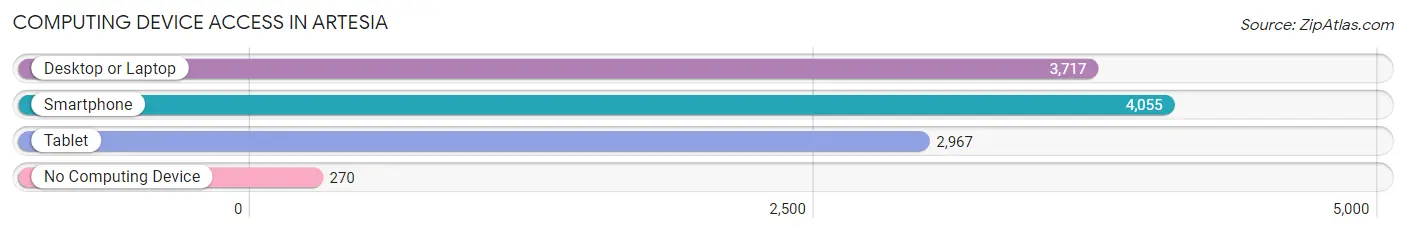
| Device Type | # Households | % Households |
| Desktop or Laptop | 3,717 | 82.9% |
| Smartphone | 4,055 | 90.4% |
| Tablet | 2,967 | 66.2% |
| No Computing Device | 270 | 6.0% |
| Total | 4,484 | 100.0% |
Internet Access in Artesia
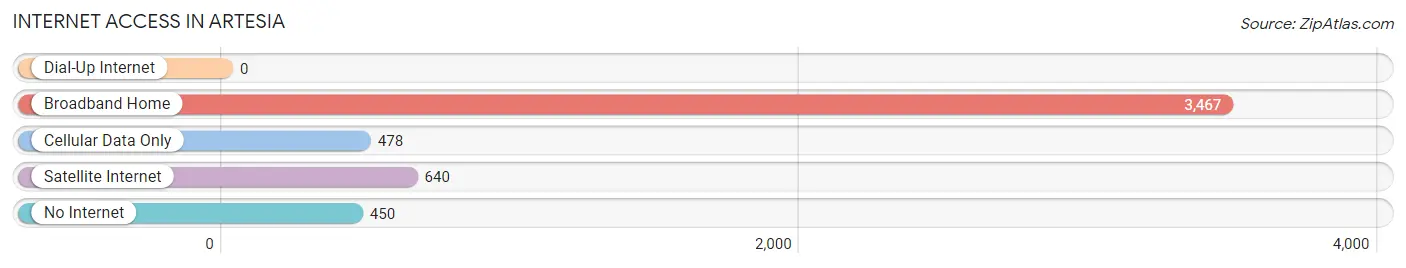
| Internet Type | # Households | % Households |
| Dial-Up Internet | 0 | 0.0% |
| Broadband Home | 3,467 | 77.3% |
| Cellular Data Only | 478 | 10.7% |
| Satellite Internet | 640 | 14.3% |
| No Internet | 450 | 10.0% |
| Total | 4,484 | 100.0% |
Artesia Summary
Artesia, California is a city located in Los Angeles County, California, United States. It is located in the Gateway Cities region of southeastern Los Angeles County, and is bordered by Cerritos on the north, Hawaiian Gardens on the east, Lakewood on the south, and Long Beach on the west. The population was 16,380 at the 2010 census, down from 16,630 at the 2000 census.
History
Artesia was originally part of the Rancho Los Nietos, an 8,000-acre (32 km2) Spanish land grant given in 1834 by Governor José Figueroa to Juan José Domínguez. The area was named for the many flowing artesian wells in the area, which made it a productive agricultural area. In the 1920s, the Artesia area became known for its successful agricultural business. The town was incorporated on May 29, 1959, and became known as the "City of Artesia".
Geography
Artesia is located at 33°53′17″N 118°4′39″W (33.888133, -118.077500). According to the United States Census Bureau, the city has a total area of 1.9 square miles (4.9 km2), all land.
Economy
Artesia is a predominantly residential community, with a small commercial district along Pioneer Boulevard. The city is home to the Little India shopping district, which is located along Pioneer Boulevard between 183rd Street and 186th Street. The city is also home to the Artesia Historical Museum, which is located in the former Artesia City Hall building.
Demographics
As of the census of 2000, there were 16,630 people, 5,835 households, and 4,541 families residing in the city. The population density was 8,619.2 inhabitants per square mile (3,334.2/km2). There were 6,001 housing units at an average density of 3,122.9 per square mile (1,204.2/km2). The racial makeup of the city was 57.2% White, 2.2% African American, 1.0% Native American, 20.3% Asian, 0.2% Pacific Islander, 14.0% from other races, and 5.1% from two or more races. Hispanic or Latino of any race were 33.6% of the population.
There were 5,835 households, out of which 37.2% had children under the age of 18 living with them, 57.2% were married couples living together, 14.2% had a female householder with no husband present, and 21.2% were non-families. 16.2% of all households were made up of individuals, and 6.2% had someone living alone who was 65 years of age or older. The average household size was 2.83 and the average family size was 3.17.
In the city, the population was spread out, with 25.2% under the age of 18, 9.2% from 18 to 24, 32.2% from 25 to 44, 22.2% from 45 to 64, and 11.2% who were 65 years of age or older. The median age was 35 years. For every 100 females, there were 97.2 males. For every 100 females age 18 and over, there were 94.2 males.
The median income for a household in the city was $50,845, and the median income for a family was $54,945. Males had a median income of $41,845 versus $31,935 for females. The per capita income for the city was $20,845. About 8.2% of families and 10.2% of the population were below the poverty line, including 13.2% of those under age 18 and 7.2% of those age 65 or over.
Common Questions
What is Per Capita Income in Artesia?
Per Capita income in Artesia is $29,781.
What is the Median Family Income in Artesia?
Median Family Income in Artesia is $95,417.
What is the Median Household income in Artesia?
Median Household Income in Artesia is $92,702.
What is Income or Wage Gap in Artesia?
Income or Wage Gap in Artesia is 25.8%.
Women in Artesia earn 74.2 cents for every dollar earned by a man.
What is Family Income Deficit in Artesia?
Family Income Deficit in Artesia is $15,781.
Families that are below poverty line in Artesia earn $15,781 less on average than the poverty threshold level.
What is Inequality or Gini Index in Artesia?
Inequality or Gini Index in Artesia is 0.39.
What is the Total Population of Artesia?
Total Population of Artesia is 16,237.
What is the Total Male Population of Artesia?
Total Male Population of Artesia is 7,787.
What is the Total Female Population of Artesia?
Total Female Population of Artesia is 8,450.
What is the Ratio of Males per 100 Females in Artesia?
There are 92.15 Males per 100 Females in Artesia.
What is the Ratio of Females per 100 Males in Artesia?
There are 108.51 Females per 100 Males in Artesia.
What is the Median Population Age in Artesia?
Median Population Age in Artesia is 39.1 Years.
What is the Average Family Size in Artesia
Average Family Size in Artesia is 3.8 People.
What is the Average Household Size in Artesia
Average Household Size in Artesia is 3.5 People.
How Large is the Labor Force in Artesia?
There are 8,216 People in the Labor Forcein in Artesia.
What is the Percentage of People in the Labor Force in Artesia?
60.9% of People are in the Labor Force in Artesia.
What is the Unemployment Rate in Artesia?
Unemployment Rate in Artesia is 9.1%.