Cities with the Lowest Percentage of Births to Unmarried Women over the Age of 35 in Louisiana
RELATED REPORTS & OPTIONS
Lowest Illegitimacy | Women 35+
Louisiana
Compare Cities
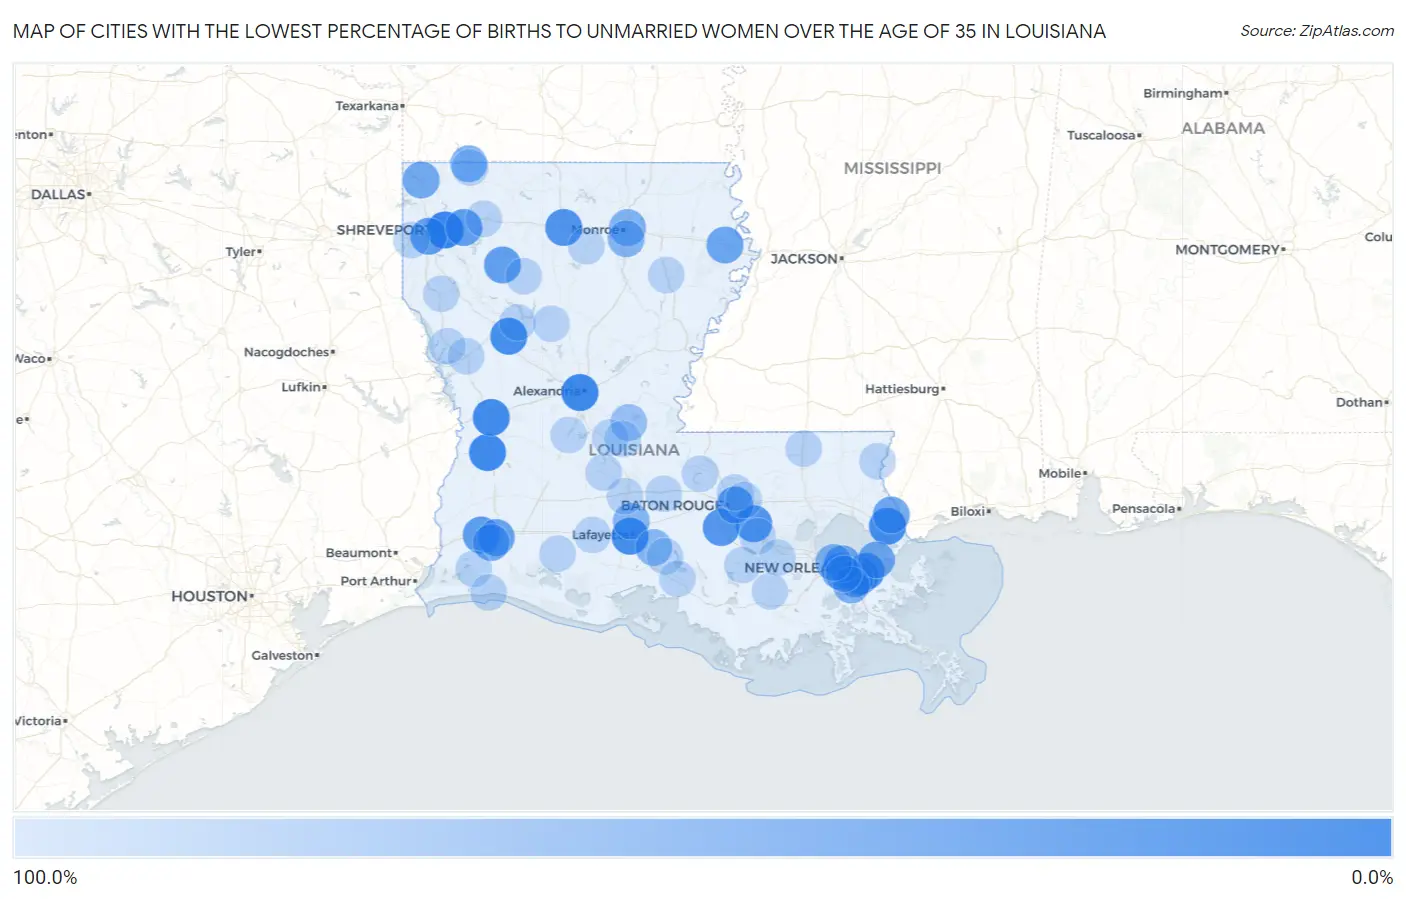
Map of Cities with the Lowest Percentage of Births to Unmarried Women over the Age of 35 in Louisiana
100.0%
0.0%
Cities with the Lowest Percentage of Births to Unmarried Women over the Age of 35 in Louisiana
| City | % Unmarried | vs State | vs National | |
| 1. | Bossier City | 6.3% | 28.6%(-22.3)#1 | 20.1%(-13.8)#174 |
| 2. | Alexandria | 11.7% | 28.6%(-16.9)#2 | 20.1%(-8.40)#422 |
| 3. | Deridder | 12.5% | 28.6%(-16.1)#3 | 20.1%(-7.60)#463 |
| 4. | Leesville | 14.3% | 28.6%(-14.3)#4 | 20.1%(-5.80)#570 |
| 5. | Lafayette | 14.9% | 28.6%(-13.7)#5 | 20.1%(-5.20)#609 |
| 6. | Natchitoches | 15.4% | 28.6%(-13.2)#6 | 20.1%(-4.70)#641 |
| 7. | Slidell | 15.6% | 28.6%(-13.0)#7 | 20.1%(-4.50)#653 |
| 8. | Ruston | 23.1% | 28.6%(-5.50)#8 | 20.1%(+3.00)#1,026 |
| 9. | Prairieville | 26.7% | 28.6%(-1.90)#9 | 20.1%(+6.60)#1,186 |
| 10. | Terrytown | 28.2% | 28.6%(-0.400)#10 | 20.1%(+8.10)#1,260 |
| 11. | Chalmette | 28.6% | 28.6%(=0.000)#11 | 20.1%(+8.50)#1,277 |
| 12. | Plaquemine | 28.6% | 28.6%(=0.000)#12 | 20.1%(+8.50)#1,282 |
| 13. | Shreveport | 34.2% | 28.6%(+5.60)#13 | 20.1%(+14.1)#1,528 |
| 14. | Sulphur | 34.8% | 28.6%(+6.20)#14 | 20.1%(+14.7)#1,551 |
| 15. | Haughton | 35.3% | 28.6%(+6.70)#15 | 20.1%(+15.2)#1,577 |
| 16. | Baton Rouge | 35.5% | 28.6%(+6.90)#16 | 20.1%(+15.4)#1,580 |
| 17. | Harahan | 36.4% | 28.6%(+7.80)#17 | 20.1%(+16.3)#1,614 |
| 18. | Castor | 37.5% | 28.6%(+8.90)#18 | 20.1%(+17.4)#1,664 |
| 19. | Lake Charles | 42.0% | 28.6%(+13.4)#19 | 20.1%(+21.9)#1,809 |
| 20. | Harvey | 44.4% | 28.6%(+15.8)#20 | 20.1%(+24.3)#1,881 |
| 21. | Metairie | 45.1% | 28.6%(+16.5)#21 | 20.1%(+25.0)#1,907 |
| 22. | Tallulah | 45.5% | 28.6%(+16.9)#22 | 20.1%(+25.4)#1,917 |
| 23. | New Orleans | 46.8% | 28.6%(+18.2)#23 | 20.1%(+26.7)#1,953 |
| 24. | Pearl River | 47.1% | 28.6%(+18.5)#24 | 20.1%(+27.0)#1,965 |
| 25. | Prien | 49.4% | 28.6%(+20.8)#25 | 20.1%(+29.3)#2,018 |
| 26. | Hosston | 50.0% | 28.6%(+21.4)#26 | 20.1%(+29.9)#2,076 |
| 27. | Springhill | 56.7% | 28.6%(+28.1)#27 | 20.1%(+36.6)#2,219 |
| 28. | Estelle | 60.9% | 28.6%(+32.3)#28 | 20.1%(+40.8)#2,317 |
| 29. | Kenner | 61.3% | 28.6%(+32.7)#29 | 20.1%(+41.2)#2,321 |
| 30. | Monroe | 62.7% | 28.6%(+34.1)#30 | 20.1%(+42.6)#2,368 |
| 31. | Richwood | 64.7% | 28.6%(+36.1)#31 | 20.1%(+44.6)#2,416 |
| 32. | Carencro | 65.4% | 28.6%(+36.8)#32 | 20.1%(+45.3)#2,430 |
| 33. | St Martinville | 66.7% | 28.6%(+38.1)#33 | 20.1%(+46.6)#2,451 |
| 34. | Mansura | 77.8% | 28.6%(+49.2)#34 | 20.1%(+57.7)#2,604 |
| 35. | Opelousas | 100.0% | 28.6%(+71.4)#35 | 20.1%(+79.9)#2,813 |
| 36. | Thibodaux | 100.0% | 28.6%(+71.4)#36 | 20.1%(+79.9)#2,814 |
| 37. | Gonzales | 100.0% | 28.6%(+71.4)#37 | 20.1%(+79.9)#2,859 |
| 38. | Crowley | 100.0% | 28.6%(+71.4)#38 | 20.1%(+79.9)#2,871 |
| 39. | Bogalusa | 100.0% | 28.6%(+71.4)#39 | 20.1%(+79.9)#2,896 |
| 40. | Bridge City | 100.0% | 28.6%(+71.4)#40 | 20.1%(+79.9)#3,015 |
| 41. | Ville Platte | 100.0% | 28.6%(+71.4)#41 | 20.1%(+79.9)#3,030 |
| 42. | Brownfields | 100.0% | 28.6%(+71.4)#42 | 20.1%(+79.9)#3,101 |
| 43. | Winnsboro | 100.0% | 28.6%(+71.4)#43 | 20.1%(+79.9)#3,131 |
| 44. | Monticello | 100.0% | 28.6%(+71.4)#44 | 20.1%(+79.9)#3,135 |
| 45. | Mansfield | 100.0% | 28.6%(+71.4)#45 | 20.1%(+79.9)#3,139 |
| 46. | Bunkie | 100.0% | 28.6%(+71.4)#46 | 20.1%(+79.9)#3,241 |
| 47. | Greenwood | 100.0% | 28.6%(+71.4)#47 | 20.1%(+79.9)#3,266 |
| 48. | Lake Arthur | 100.0% | 28.6%(+71.4)#48 | 20.1%(+79.9)#3,347 |
| 49. | Many | 100.0% | 28.6%(+71.4)#49 | 20.1%(+79.9)#3,359 |
| 50. | Grand Point | 100.0% | 28.6%(+71.4)#50 | 20.1%(+79.9)#3,366 |
| 51. | Zwolle | 100.0% | 28.6%(+71.4)#51 | 20.1%(+79.9)#3,479 |
| 52. | Glenmora | 100.0% | 28.6%(+71.4)#52 | 20.1%(+79.9)#3,548 |
| 53. | Paincourtville | 100.0% | 28.6%(+71.4)#53 | 20.1%(+79.9)#3,609 |
| 54. | Ventress | 100.0% | 28.6%(+71.4)#54 | 20.1%(+79.9)#3,638 |
| 55. | Hackberry | 100.0% | 28.6%(+71.4)#55 | 20.1%(+79.9)#3,711 |
| 56. | Krotz Springs | 100.0% | 28.6%(+71.4)#57 | 20.1%(+79.9)#3,742 |
| 57. | Loreauville | 100.0% | 28.6%(+71.4)#58 | 20.1%(+79.9)#3,743 |
| 58. | Cullen | 100.0% | 28.6%(+71.4)#59 | 20.1%(+79.9)#3,823 |
| 59. | Tangipahoa | 100.0% | 28.6%(+71.4)#60 | 20.1%(+79.9)#3,869 |
| 60. | Sorrel | 100.0% | 28.6%(+71.4)#61 | 20.1%(+79.9)#3,928 |
| 61. | Clarence | 100.0% | 28.6%(+71.4)#62 | 20.1%(+79.9)#3,984 |
| 62. | Evergreen | 100.0% | 28.6%(+71.4)#63 | 20.1%(+79.9)#4,062 |
| 63. | Eros | 100.0% | 28.6%(+71.4)#64 | 20.1%(+79.9)#4,067 |
| 64. | Dixie Inn | 100.0% | 28.6%(+71.4)#65 | 20.1%(+79.9)#4,075 |
| 65. | Saline | 100.0% | 28.6%(+71.4)#66 | 20.1%(+79.9)#4,085 |
| 66. | Cameron | 100.0% | 28.6%(+71.4)#67 | 20.1%(+79.9)#4,126 |
| 67. | Atlanta | 100.0% | 28.6%(+71.4)#68 | 20.1%(+79.9)#4,145 |
Common Questions
What are the Top 10 Cities with the Lowest Percentage of Births to Unmarried Women over the Age of 35 in Louisiana?
Top 10 Cities with the Lowest Percentage of Births to Unmarried Women over the Age of 35 in Louisiana are:
#1
0.0%
#2
0.0%
#3
0.0%
#4
0.0%
#5
0.0%
#6
0.0%
#7
0.0%
#8
0.0%
#9
0.0%
#10
0.0%
What city has the Lowest Percentage of Births to Unmarried Women over the Age of 35 in Louisiana?
Bossier City has the Lowest Percentage of Births to Unmarried Women over the Age of 35 in Louisiana with 6.3%.
What is the Percentage of Births to Unmarried Women over the Age of 35 in the State of Louisiana?
Percentage of Births to Unmarried Women over the Age of 35 in Louisiana is 28.6%.
What is the Percentage of Births to Unmarried Women over the Age of 35 in the United States?
Percentage of Births to Unmarried Women over the Age of 35 in the United States is 20.1%.