Dinuba, CA Map & Demographics
Dinuba Map
Dinuba Overview
$20,547
PER CAPITA INCOME
$55,477
AVG FAMILY INCOME
$54,590
AVG HOUSEHOLD INCOME
10.1%
WAGE / INCOME GAP [ % ]
89.9¢/ $1
WAGE / INCOME GAP [ $ ]
$12,470
FAMILY INCOME DEFICIT
0.45
INEQUALITY / GINI INDEX
24,713
TOTAL POPULATION
12,312
MALE POPULATION
12,401
FEMALE POPULATION
99.28
MALES / 100 FEMALES
100.72
FEMALES / 100 MALES
28.2
MEDIAN AGE
4.1
AVG FAMILY SIZE
3.8
AVG HOUSEHOLD SIZE
10,989
LABOR FORCE [ PEOPLE ]
64.3%
PERCENT IN LABOR FORCE
11.0%
UNEMPLOYMENT RATE
Dinuba Zip Codes
Dinuba Area Codes
Income in Dinuba
Income Overview in Dinuba
Per Capita Income in Dinuba is $20,547, while median incomes of families and households are $55,477 and $54,590 respectively.
| Characteristic | Number | Measure |
| Per Capita Income | 24,713 | $20,547 |
| Median Family Income | 5,593 | $55,477 |
| Mean Family Income | 5,593 | $75,424 |
| Median Household Income | 6,386 | $54,590 |
| Mean Household Income | 6,386 | $76,826 |
| Income Deficit | 5,593 | $12,470 |
| Wage / Income Gap (%) | 24,713 | 10.08% |
| Wage / Income Gap ($) | 24,713 | 89.92¢ per $1 |
| Gini / Inequality Index | 24,713 | 0.45 |
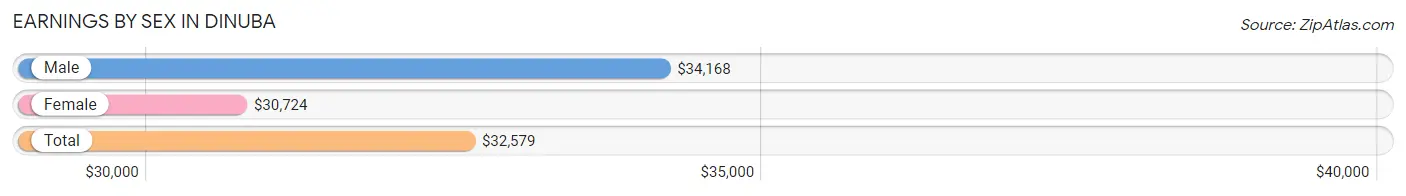
Earnings by Sex in Dinuba
Average Earnings in Dinuba are $32,579, $34,168 for men and $30,724 for women, a difference of 10.1%.
| Sex | Number | Average Earnings |
| Male | 5,575 (52.5%) | $34,168 |
| Female | 5,045 (47.5%) | $30,724 |
| Total | 10,620 (100.0%) | $32,579 |
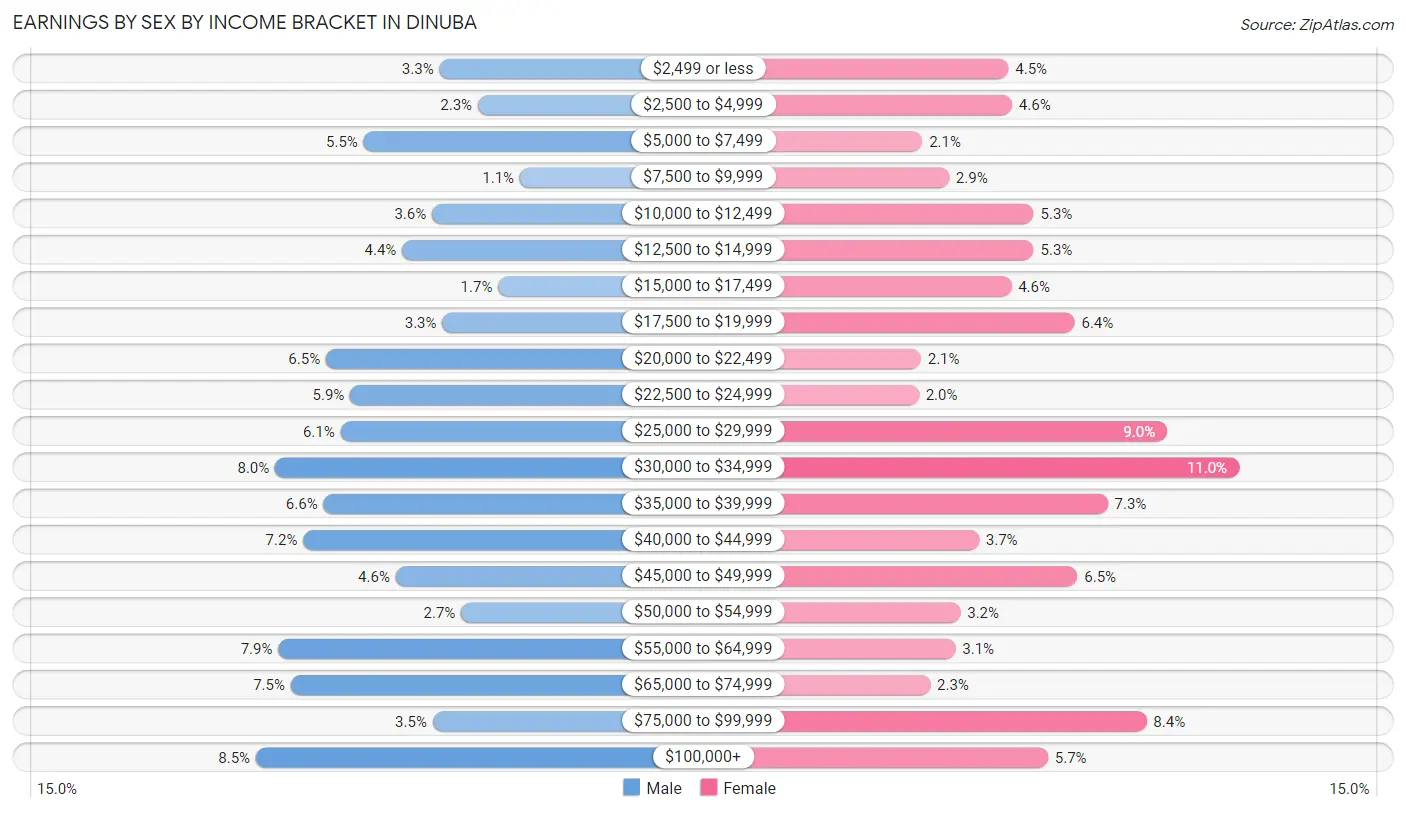
Earnings by Sex by Income Bracket in Dinuba
The most common earnings brackets in Dinuba are $100,000+ for men (474 | 8.5%) and $30,000 to $34,999 for women (556 | 11.0%).
| Income | Male | Female |
| $2,499 or less | 186 (3.3%) | 229 (4.5%) |
| $2,500 to $4,999 | 126 (2.3%) | 234 (4.6%) |
| $5,000 to $7,499 | 305 (5.5%) | 107 (2.1%) |
| $7,500 to $9,999 | 60 (1.1%) | 145 (2.9%) |
| $10,000 to $12,499 | 198 (3.5%) | 265 (5.2%) |
| $12,500 to $14,999 | 245 (4.4%) | 265 (5.2%) |
| $15,000 to $17,499 | 94 (1.7%) | 233 (4.6%) |
| $17,500 to $19,999 | 182 (3.3%) | 323 (6.4%) |
| $20,000 to $22,499 | 364 (6.5%) | 105 (2.1%) |
| $22,500 to $24,999 | 326 (5.9%) | 102 (2.0%) |
| $25,000 to $29,999 | 341 (6.1%) | 454 (9.0%) |
| $30,000 to $34,999 | 444 (8.0%) | 556 (11.0%) |
| $35,000 to $39,999 | 368 (6.6%) | 370 (7.3%) |
| $40,000 to $44,999 | 400 (7.2%) | 187 (3.7%) |
| $45,000 to $49,999 | 255 (4.6%) | 327 (6.5%) |
| $50,000 to $54,999 | 152 (2.7%) | 161 (3.2%) |
| $55,000 to $64,999 | 439 (7.9%) | 154 (3.0%) |
| $65,000 to $74,999 | 419 (7.5%) | 118 (2.3%) |
| $75,000 to $99,999 | 197 (3.5%) | 425 (8.4%) |
| $100,000+ | 474 (8.5%) | 285 (5.7%) |
| Total | 5,575 (100.0%) | 5,045 (100.0%) |
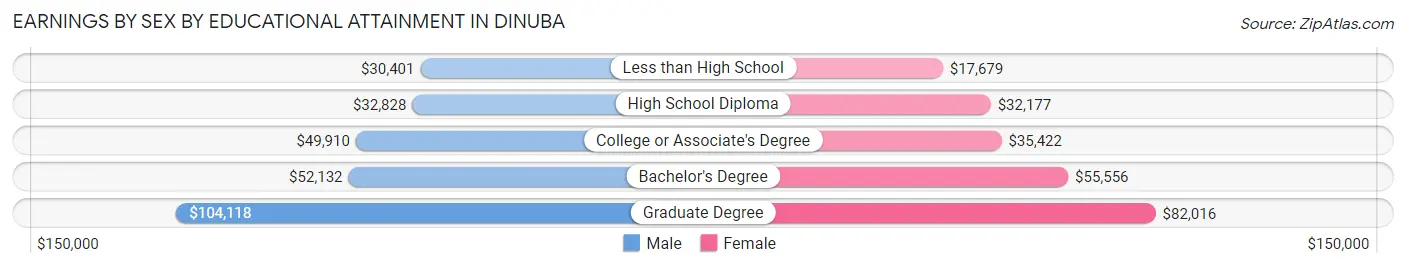
Earnings by Sex by Educational Attainment in Dinuba
Average earnings in Dinuba are $39,565 for men and $34,168 for women, a difference of 13.6%. Men with an educational attainment of graduate degree enjoy the highest average annual earnings of $104,118, while those with less than high school education earn the least with $30,401. Women with an educational attainment of graduate degree earn the most with the average annual earnings of $82,016, while those with less than high school education have the smallest earnings of $17,679.
| Educational Attainment | Male Income | Female Income |
| Less than High School | $30,401 | $17,679 |
| High School Diploma | $32,828 | $32,177 |
| College or Associate's Degree | $49,910 | $35,422 |
| Bachelor's Degree | $52,132 | $55,556 |
| Graduate Degree | $104,118 | $82,016 |
| Total | $39,565 | $34,168 |
Family Income in Dinuba
Family Income Brackets in Dinuba
According to the Dinuba family income data, there are 1,074 families falling into the $100,000 to $149,999 income range, which is the most common income bracket and makes up 19.2% of all families. Conversely, the $10,000 to $14,999 income bracket is the least frequent group with only 213 families (3.8%) belonging to this category.
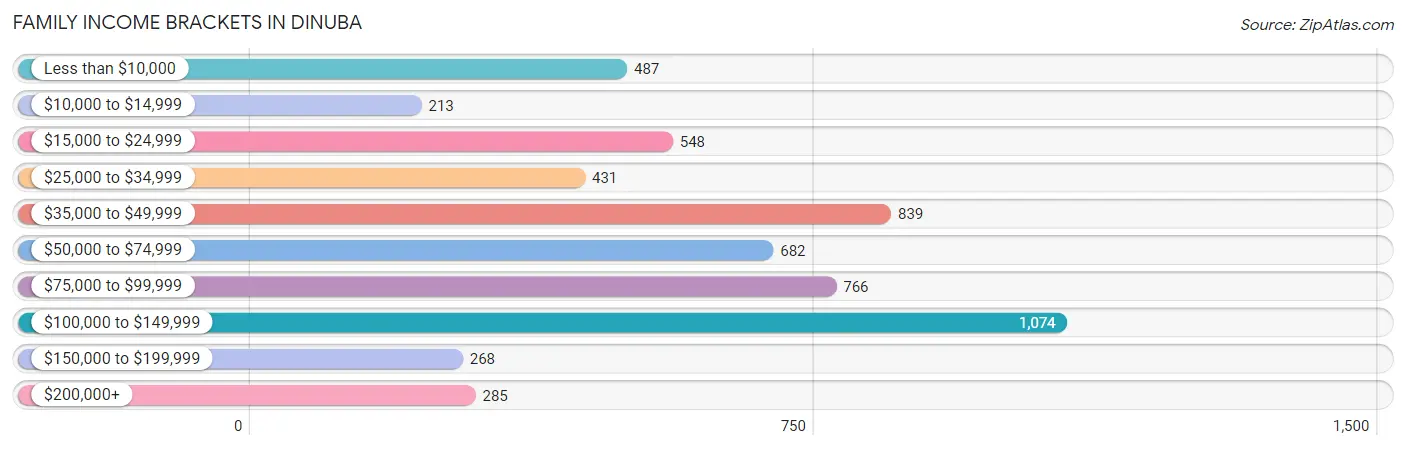
| Income Bracket | # Families | % Families |
| Less than $10,000 | 487 | 8.7% |
| $10,000 to $14,999 | 213 | 3.8% |
| $15,000 to $24,999 | 548 | 9.8% |
| $25,000 to $34,999 | 431 | 7.7% |
| $35,000 to $49,999 | 839 | 15.0% |
| $50,000 to $74,999 | 682 | 12.2% |
| $75,000 to $99,999 | 766 | 13.7% |
| $100,000 to $149,999 | 1,074 | 19.2% |
| $150,000 to $199,999 | 268 | 4.8% |
| $200,000+ | 285 | 5.1% |
Family Income by Famaliy Size in Dinuba
7+ person families (253 | 4.5%) account for the highest median family income in Dinuba with $101,091 per family, while 3-person families (982 | 17.6%) have the highest median income of $27,123 per family member.
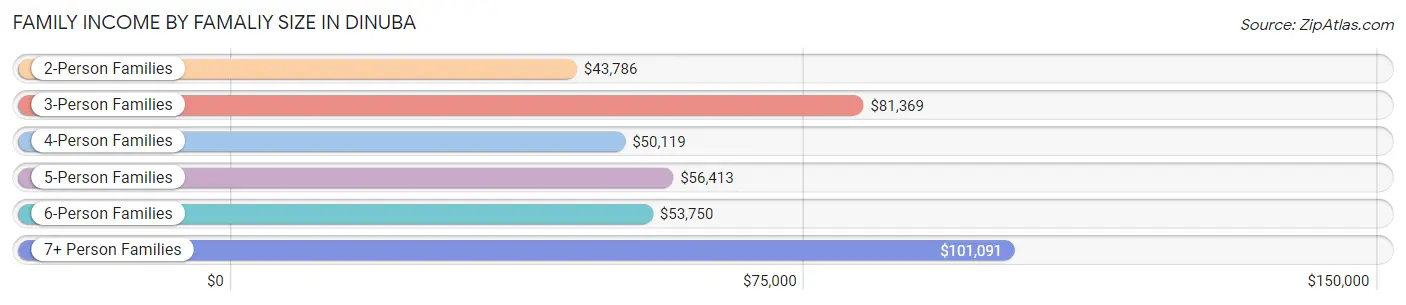
| Income Bracket | # Families | Median Income |
| 2-Person Families | 1,600 (28.6%) | $43,786 |
| 3-Person Families | 982 (17.6%) | $81,369 |
| 4-Person Families | 1,014 (18.1%) | $50,119 |
| 5-Person Families | 1,008 (18.0%) | $56,413 |
| 6-Person Families | 736 (13.2%) | $53,750 |
| 7+ Person Families | 253 (4.5%) | $101,091 |
| Total | 5,593 (100.0%) | $55,477 |
Family Income by Number of Earners in Dinuba
The median family income in Dinuba is $55,477, with families comprising 3+ earners (1,004) having the highest median family income of $122,000, while families with no earners (725) have the lowest median family income of $13,963, accounting for 17.9% and 13.0% of families, respectively.
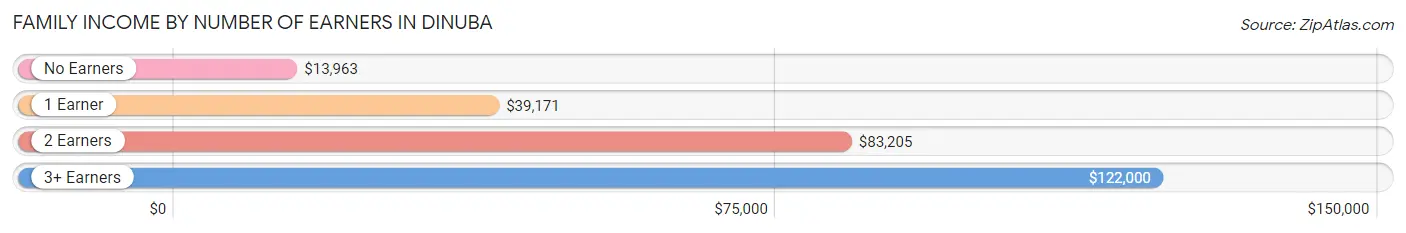
| Number of Earners | # Families | Median Income |
| No Earners | 725 (13.0%) | $13,963 |
| 1 Earner | 2,271 (40.6%) | $39,171 |
| 2 Earners | 1,593 (28.5%) | $83,205 |
| 3+ Earners | 1,004 (17.9%) | $122,000 |
| Total | 5,593 (100.0%) | $55,477 |
Household Income in Dinuba
Household Income Brackets in Dinuba
With 1,079 households falling in the category, the $100,000 to $149,999 income range is the most frequent in Dinuba, accounting for 16.9% of all households. In contrast, only 268 households (4.2%) fall into the $10,000 to $14,999 income bracket, making it the least populous group.
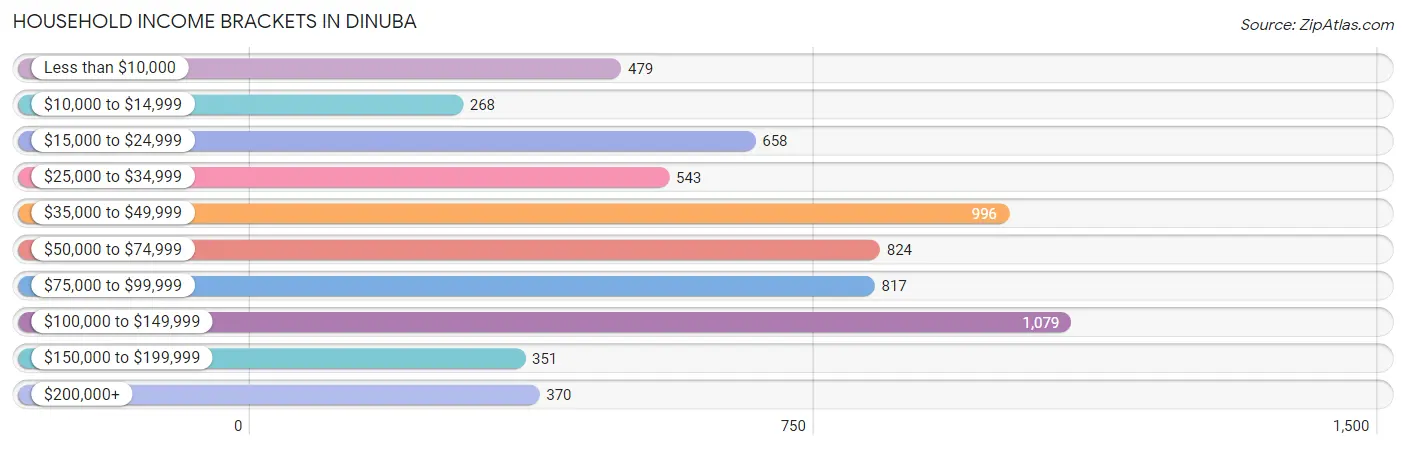
| Income Bracket | # Households | % Households |
| Less than $10,000 | 479 | 7.5% |
| $10,000 to $14,999 | 268 | 4.2% |
| $15,000 to $24,999 | 658 | 10.3% |
| $25,000 to $34,999 | 543 | 8.5% |
| $35,000 to $49,999 | 996 | 15.6% |
| $50,000 to $74,999 | 824 | 12.9% |
| $75,000 to $99,999 | 817 | 12.8% |
| $100,000 to $149,999 | 1,079 | 16.9% |
| $150,000 to $199,999 | 351 | 5.5% |
| $200,000+ | 370 | 5.8% |
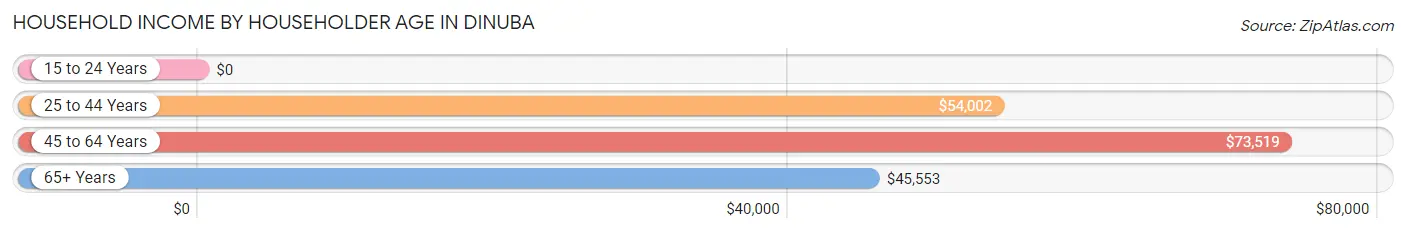
Household Income by Householder Age in Dinuba
The median household income in Dinuba is $54,590, with the highest median household income of $73,519 found in the 45 to 64 years age bracket for the primary householder. A total of 2,064 households (32.3%) fall into this category. Meanwhile, the 15 to 24 years age bracket for the primary householder has the lowest median household income of $0, with 264 households (4.1%) in this group.
| Income Bracket | # Households | Median Income |
| 15 to 24 Years | 264 (4.1%) | $0 |
| 25 to 44 Years | 3,027 (47.4%) | $54,002 |
| 45 to 64 Years | 2,064 (32.3%) | $73,519 |
| 65+ Years | 1,031 (16.1%) | $45,553 |
| Total | 6,386 (100.0%) | $54,590 |
Poverty in Dinuba
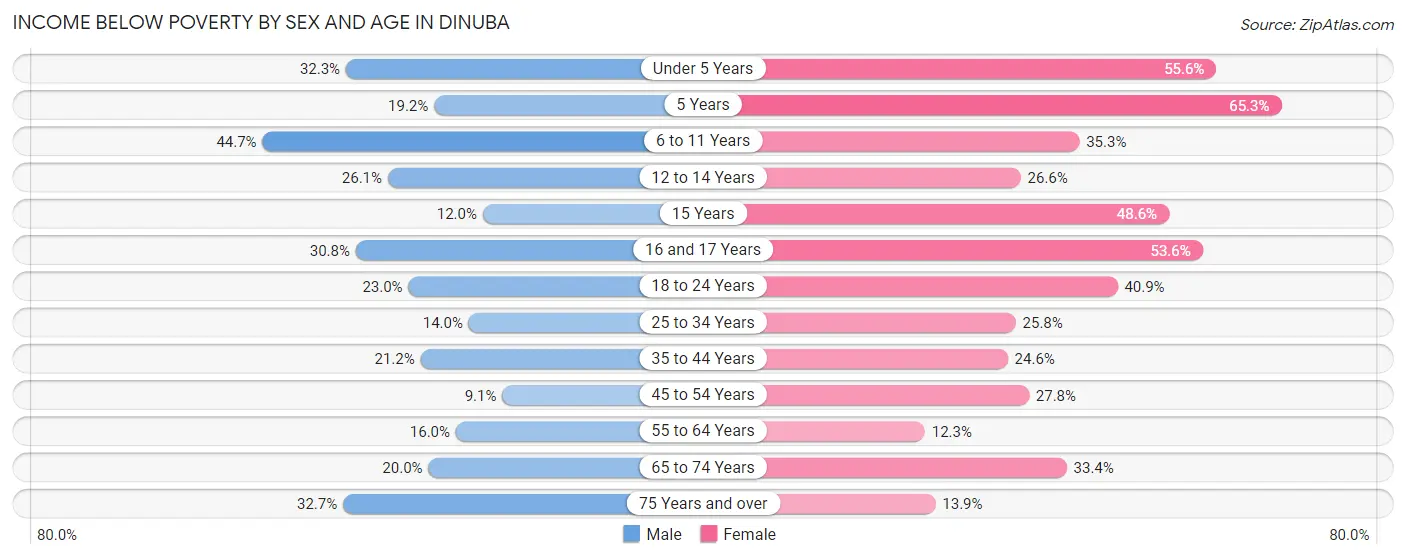
Income Below Poverty by Sex and Age in Dinuba
With 23.7% poverty level for males and 31.9% for females among the residents of Dinuba, 6 to 11 year old males and 5 year old females are the most vulnerable to poverty, with 702 males (44.7%) and 62 females (65.3%) in their respective age groups living below the poverty level.
| Age Bracket | Male | Female |
| Under 5 Years | 346 (32.3%) | 472 (55.6%) |
| 5 Years | 52 (19.2%) | 62 (65.3%) |
| 6 to 11 Years | 702 (44.7%) | 518 (35.3%) |
| 12 to 14 Years | 294 (26.1%) | 163 (26.6%) |
| 15 Years | 22 (12.0%) | 153 (48.6%) |
| 16 and 17 Years | 102 (30.8%) | 270 (53.6%) |
| 18 to 24 Years | 327 (23.0%) | 609 (40.9%) |
| 25 to 34 Years | 233 (14.0%) | 438 (25.8%) |
| 35 to 44 Years | 336 (21.2%) | 477 (24.6%) |
| 45 to 54 Years | 97 (9.1%) | 330 (27.8%) |
| 55 to 64 Years | 165 (16.0%) | 120 (12.3%) |
| 65 to 74 Years | 111 (20.0%) | 248 (33.4%) |
| 75 Years and over | 122 (32.7%) | 60 (13.9%) |
| Total | 2,909 (23.7%) | 3,920 (31.9%) |
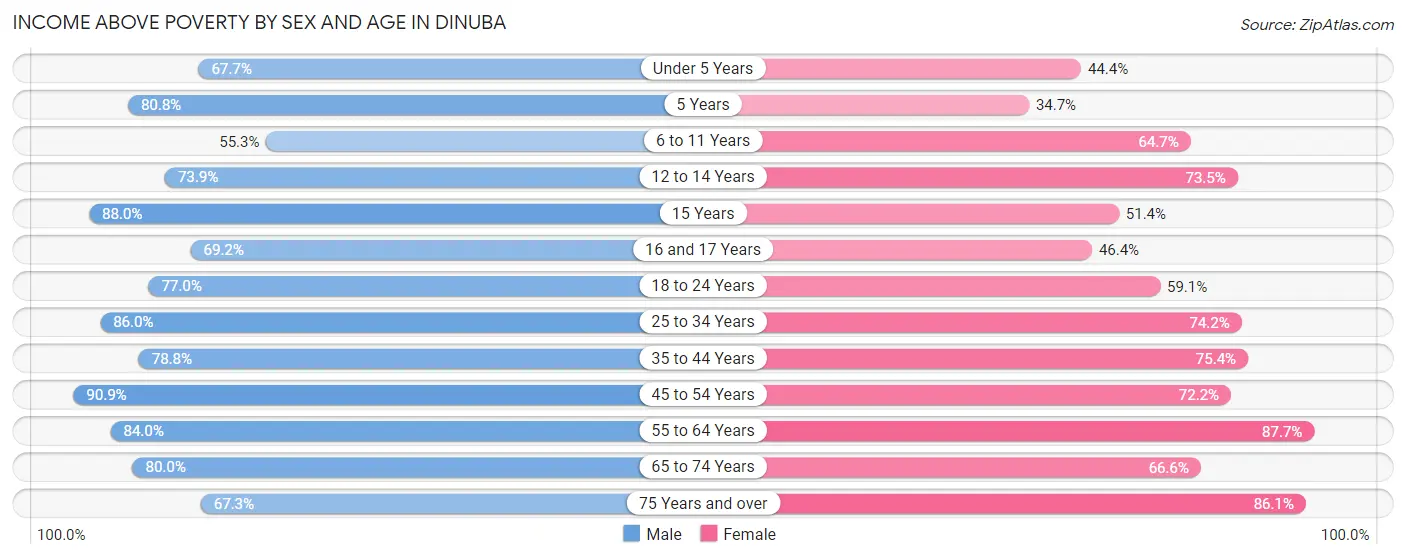
Income Above Poverty by Sex and Age in Dinuba
According to the poverty statistics in Dinuba, males aged 45 to 54 years and females aged 55 to 64 years are the age groups that are most secure financially, with 90.9% of males and 87.7% of females in these age groups living above the poverty line.
| Age Bracket | Male | Female |
| Under 5 Years | 726 (67.7%) | 377 (44.4%) |
| 5 Years | 219 (80.8%) | 33 (34.7%) |
| 6 to 11 Years | 869 (55.3%) | 951 (64.7%) |
| 12 to 14 Years | 834 (73.9%) | 451 (73.5%) |
| 15 Years | 162 (88.0%) | 162 (51.4%) |
| 16 and 17 Years | 229 (69.2%) | 234 (46.4%) |
| 18 to 24 Years | 1,095 (77.0%) | 879 (59.1%) |
| 25 to 34 Years | 1,427 (86.0%) | 1,259 (74.2%) |
| 35 to 44 Years | 1,248 (78.8%) | 1,460 (75.4%) |
| 45 to 54 Years | 972 (90.9%) | 858 (72.2%) |
| 55 to 64 Years | 869 (84.0%) | 853 (87.7%) |
| 65 to 74 Years | 443 (80.0%) | 495 (66.6%) |
| 75 Years and over | 251 (67.3%) | 372 (86.1%) |
| Total | 9,344 (76.3%) | 8,384 (68.1%) |
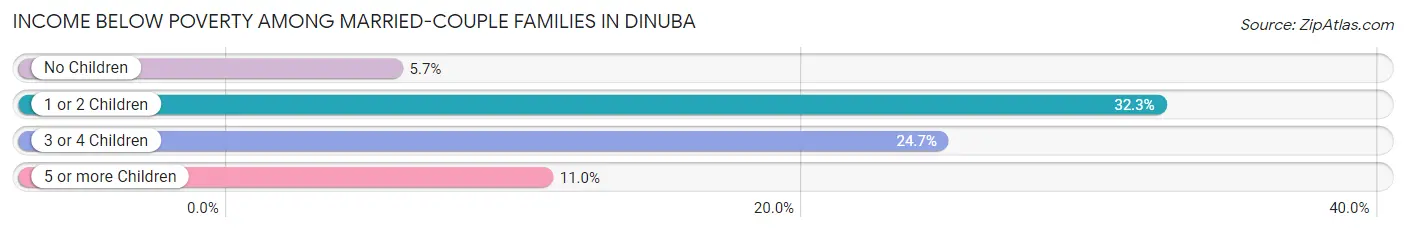
Income Below Poverty Among Married-Couple Families in Dinuba
The poverty statistics for married-couple families in Dinuba show that 19.3% or 624 of the total 3,230 families live below the poverty line. Families with 1 or 2 children have the highest poverty rate of 32.3%, comprising of 371 families. On the other hand, families with no children have the lowest poverty rate of 5.7%, which includes 76 families.
| Children | Above Poverty | Below Poverty |
| No Children | 1,250 (94.3%) | 76 (5.7%) |
| 1 or 2 Children | 777 (67.7%) | 371 (32.3%) |
| 3 or 4 Children | 514 (75.3%) | 169 (24.7%) |
| 5 or more Children | 65 (89.0%) | 8 (11.0%) |
| Total | 2,606 (80.7%) | 624 (19.3%) |
Income Below Poverty Among Single-Parent Households in Dinuba
According to the poverty data in Dinuba, 24.8% or 167 single-father households and 42.2% or 714 single-mother households are living below the poverty line. Among single-father households, those with no children have the highest poverty rate, with 87 households (41.2%) experiencing poverty. Likewise, among single-mother households, those with 3 or 4 children have the highest poverty rate, with 347 households (74.2%) falling below the poverty line.
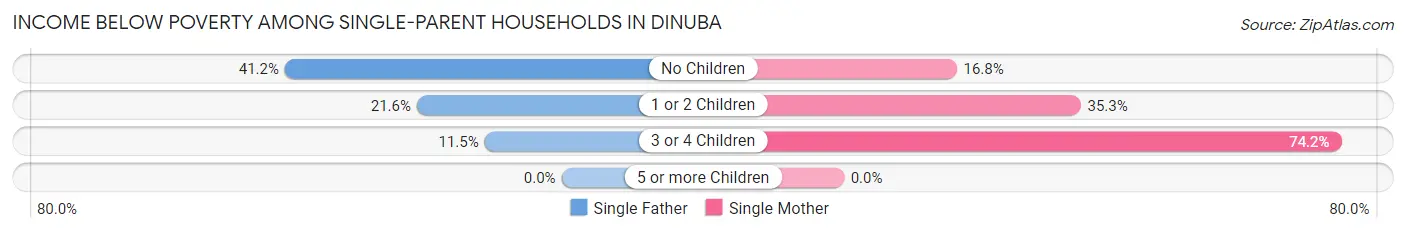
| Children | Single Father | Single Mother |
| No Children | 87 (41.2%) | 56 (16.8%) |
| 1 or 2 Children | 58 (21.6%) | 311 (35.3%) |
| 3 or 4 Children | 22 (11.5%) | 347 (74.2%) |
| 5 or more Children | 0 (0.0%) | 0 (0.0%) |
| Total | 167 (24.8%) | 714 (42.2%) |
Income Below Poverty Among Married-Couple vs Single-Parent Households in Dinuba
The poverty data for Dinuba shows that 624 of the married-couple family households (19.3%) and 881 of the single-parent households (37.3%) are living below the poverty level. Within the married-couple family households, those with 1 or 2 children have the highest poverty rate, with 371 households (32.3%) falling below the poverty line. Among the single-parent households, those with 3 or 4 children have the highest poverty rate, with 369 household (55.9%) living below poverty.
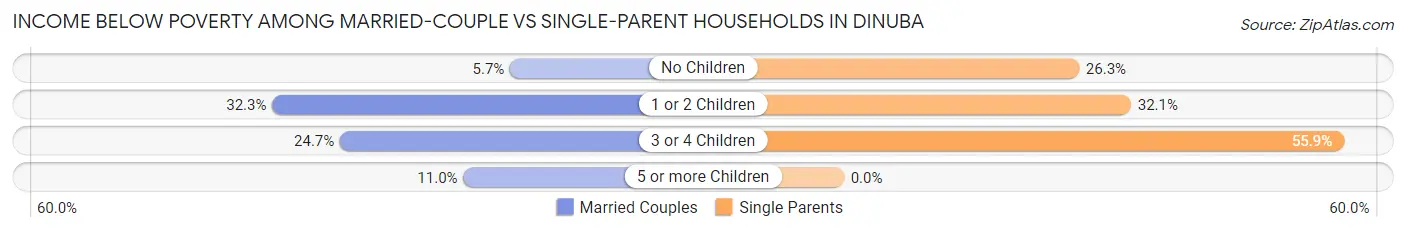
| Children | Married-Couple Families | Single-Parent Households |
| No Children | 76 (5.7%) | 143 (26.3%) |
| 1 or 2 Children | 371 (32.3%) | 369 (32.1%) |
| 3 or 4 Children | 169 (24.7%) | 369 (55.9%) |
| 5 or more Children | 8 (11.0%) | 0 (0.0%) |
| Total | 624 (19.3%) | 881 (37.3%) |
Race in Dinuba
The most populous races in Dinuba are Hispanic or Latino (22,141 | 89.6%), White / Caucasian (11,596 | 46.9%), and Some other Race (8,167 | 33.1%).
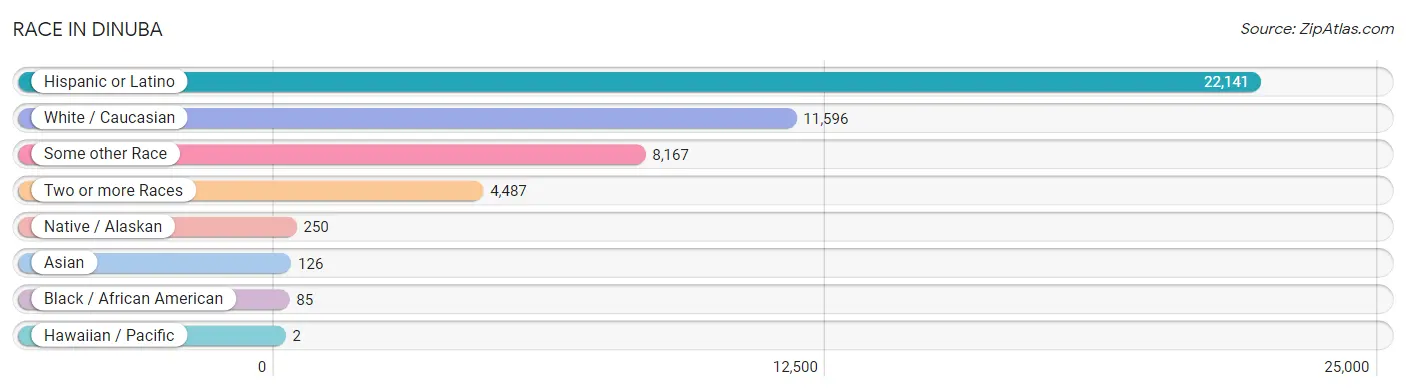
| Race | # Population | % Population |
| Asian | 126 | 0.5% |
| Black / African American | 85 | 0.3% |
| Hawaiian / Pacific | 2 | 0.0% |
| Hispanic or Latino | 22,141 | 89.6% |
| Native / Alaskan | 250 | 1.0% |
| White / Caucasian | 11,596 | 46.9% |
| Two or more Races | 4,487 | 18.2% |
| Some other Race | 8,167 | 33.1% |
| Total | 24,713 | 100.0% |
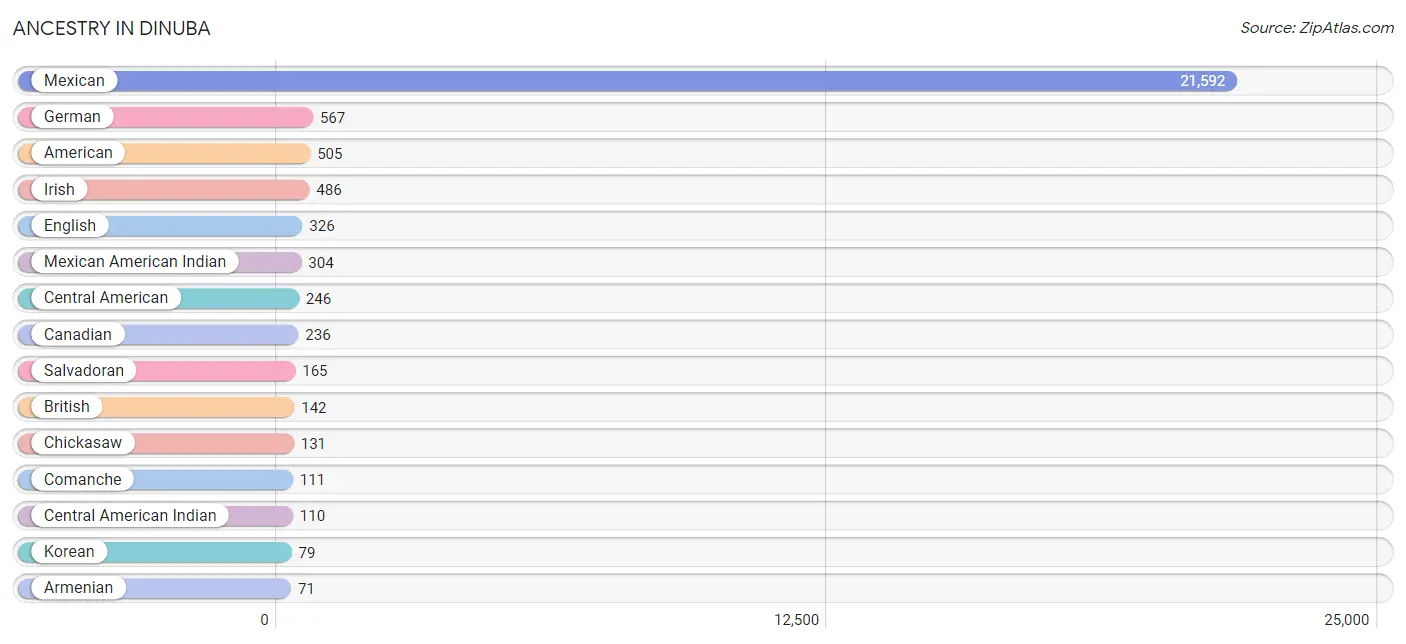
Ancestry in Dinuba
The most populous ancestries reported in Dinuba are Mexican (21,592 | 87.4%), German (567 | 2.3%), American (505 | 2.0%), Irish (486 | 2.0%), and English (326 | 1.3%), together accounting for 95.0% of all Dinuba residents.
| Ancestry | # Population | % Population |
| African | 13 | 0.1% |
| American | 505 | 2.0% |
| Apache | 9 | 0.0% |
| Argentinean | 15 | 0.1% |
| Armenian | 71 | 0.3% |
| Belizean | 28 | 0.1% |
| Bhutanese | 24 | 0.1% |
| British | 142 | 0.6% |
| Burmese | 15 | 0.1% |
| Cambodian | 52 | 0.2% |
| Canadian | 236 | 0.9% |
| Central American | 246 | 1.0% |
| Central American Indian | 110 | 0.4% |
| Cherokee | 51 | 0.2% |
| Chickasaw | 131 | 0.5% |
| Comanche | 111 | 0.4% |
| English | 326 | 1.3% |
| European | 65 | 0.3% |
| French | 7 | 0.0% |
| German | 567 | 2.3% |
| Greek | 7 | 0.0% |
| Guatemalan | 27 | 0.1% |
| Honduran | 54 | 0.2% |
| Indian (Asian) | 3 | 0.0% |
| Irish | 486 | 2.0% |
| Italian | 60 | 0.2% |
| Korean | 79 | 0.3% |
| Mexican | 21,592 | 87.4% |
| Mexican American Indian | 304 | 1.2% |
| Native Hawaiian | 2 | 0.0% |
| Navajo | 27 | 0.1% |
| Norwegian | 5 | 0.0% |
| Paiute | 4 | 0.0% |
| Pima | 11 | 0.0% |
| Portuguese | 16 | 0.1% |
| Puerto Rican | 43 | 0.2% |
| Russian | 20 | 0.1% |
| Salvadoran | 165 | 0.7% |
| Scotch-Irish | 21 | 0.1% |
| Scottish | 7 | 0.0% |
| South American | 15 | 0.1% |
| Spaniard | 27 | 0.1% |
| Spanish | 11 | 0.0% |
| Spanish American | 13 | 0.1% |
| Subsaharan African | 13 | 0.1% |
| Swiss | 20 | 0.1% |
| Thai | 14 | 0.1% |
| Tohono O'Odham | 51 | 0.2% |
| Welsh | 51 | 0.2% | View All 49 Rows |
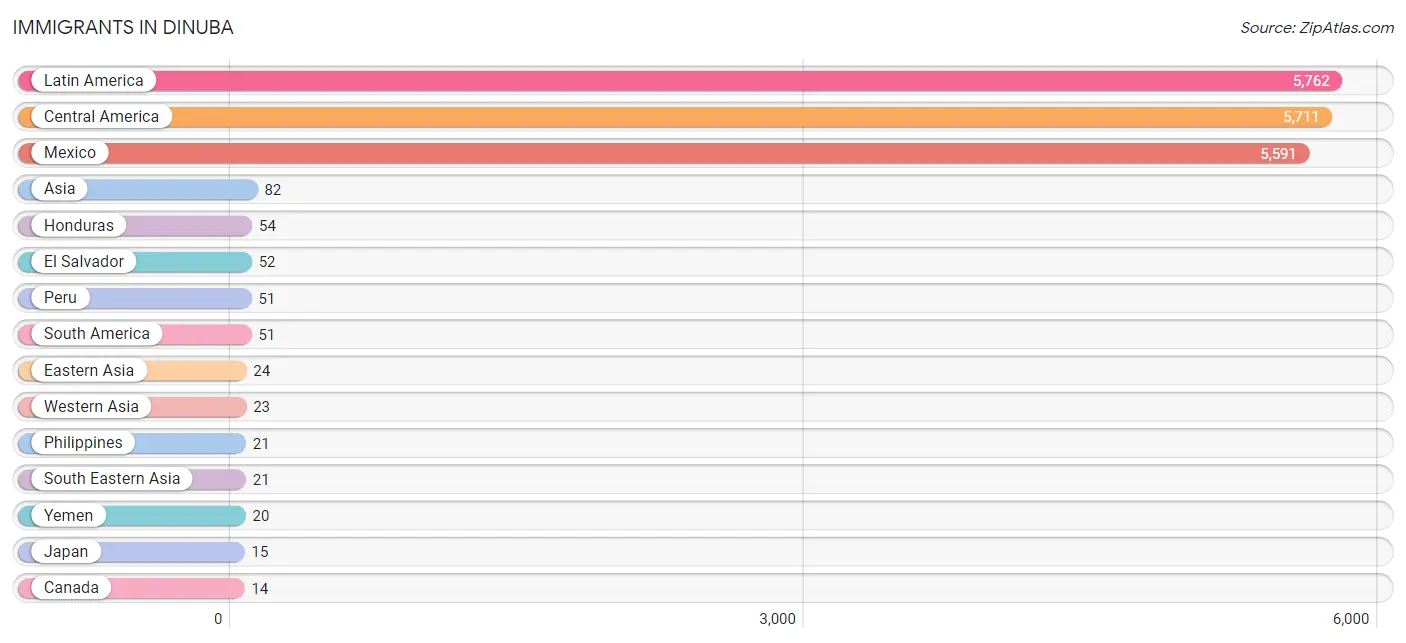
Immigrants in Dinuba
The most numerous immigrant groups reported in Dinuba came from Latin America (5,762 | 23.3%), Central America (5,711 | 23.1%), Mexico (5,591 | 22.6%), Asia (82 | 0.3%), and Honduras (54 | 0.2%), together accounting for 69.6% of all Dinuba residents.
| Immigration Origin | # Population | % Population |
| Asia | 82 | 0.3% |
| Canada | 14 | 0.1% |
| Central America | 5,711 | 23.1% |
| Eastern Asia | 24 | 0.1% |
| El Salvador | 52 | 0.2% |
| Guatemala | 14 | 0.1% |
| Honduras | 54 | 0.2% |
| India | 14 | 0.1% |
| Japan | 15 | 0.1% |
| Korea | 9 | 0.0% |
| Latin America | 5,762 | 23.3% |
| Mexico | 5,591 | 22.6% |
| Peru | 51 | 0.2% |
| Philippines | 21 | 0.1% |
| Saudi Arabia | 3 | 0.0% |
| South America | 51 | 0.2% |
| South Central Asia | 14 | 0.1% |
| South Eastern Asia | 21 | 0.1% |
| Western Asia | 23 | 0.1% |
| Yemen | 20 | 0.1% | View All 20 Rows |
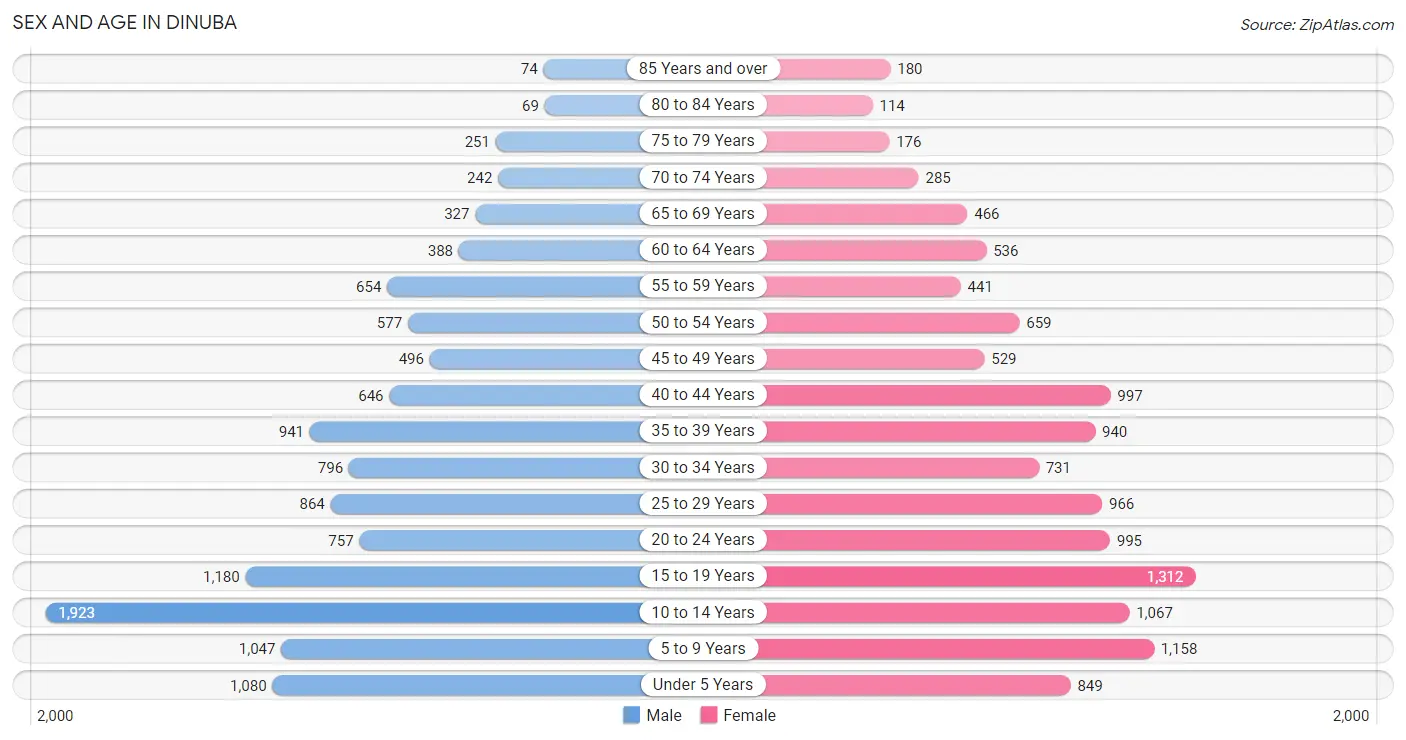
Sex and Age in Dinuba
Sex and Age in Dinuba
The most populous age groups in Dinuba are 10 to 14 Years (1,923 | 15.6%) for men and 15 to 19 Years (1,312 | 10.6%) for women.
| Age Bracket | Male | Female |
| Under 5 Years | 1,080 (8.8%) | 849 (6.9%) |
| 5 to 9 Years | 1,047 (8.5%) | 1,158 (9.3%) |
| 10 to 14 Years | 1,923 (15.6%) | 1,067 (8.6%) |
| 15 to 19 Years | 1,180 (9.6%) | 1,312 (10.6%) |
| 20 to 24 Years | 757 (6.1%) | 995 (8.0%) |
| 25 to 29 Years | 864 (7.0%) | 966 (7.8%) |
| 30 to 34 Years | 796 (6.5%) | 731 (5.9%) |
| 35 to 39 Years | 941 (7.6%) | 940 (7.6%) |
| 40 to 44 Years | 646 (5.2%) | 997 (8.0%) |
| 45 to 49 Years | 496 (4.0%) | 529 (4.3%) |
| 50 to 54 Years | 577 (4.7%) | 659 (5.3%) |
| 55 to 59 Years | 654 (5.3%) | 441 (3.6%) |
| 60 to 64 Years | 388 (3.2%) | 536 (4.3%) |
| 65 to 69 Years | 327 (2.7%) | 466 (3.8%) |
| 70 to 74 Years | 242 (2.0%) | 285 (2.3%) |
| 75 to 79 Years | 251 (2.0%) | 176 (1.4%) |
| 80 to 84 Years | 69 (0.6%) | 114 (0.9%) |
| 85 Years and over | 74 (0.6%) | 180 (1.5%) |
| Total | 12,312 (100.0%) | 12,401 (100.0%) |
Families and Households in Dinuba
Median Family Size in Dinuba
The median family size in Dinuba is 4.09 persons per family, with married-couple families (3,230 | 57.8%) accounting for the largest median family size of 4.34 persons per family. On the other hand, single male/father families (672 | 12.0%) represent the smallest median family size with 3.41 persons per family.
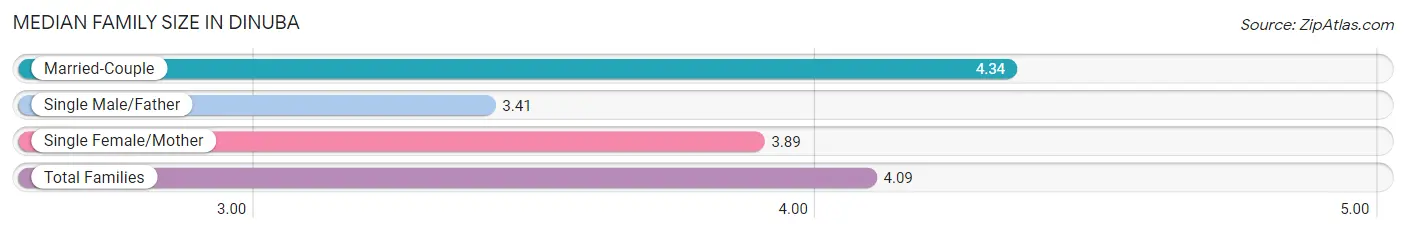
| Family Type | # Families | Family Size |
| Married-Couple | 3,230 (57.8%) | 4.34 |
| Single Male/Father | 672 (12.0%) | 3.41 |
| Single Female/Mother | 1,691 (30.2%) | 3.89 |
| Total Families | 5,593 (100.0%) | 4.09 |
Median Household Size in Dinuba
The median household size in Dinuba is 3.83 persons per household, with married-couple households (3,230 | 50.6%) accounting for the largest median household size of 4.36 persons per household. non-family households (793 | 12.4%) represent the smallest median household size with 1.44 persons per household.
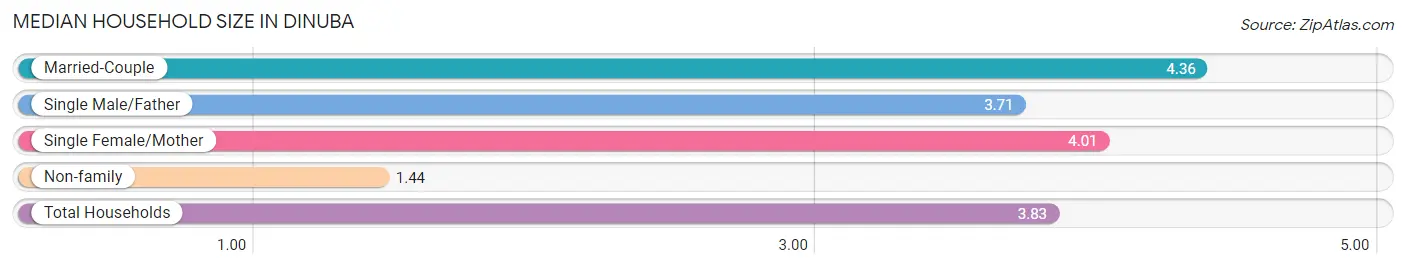
| Household Type | # Households | Household Size |
| Married-Couple | 3,230 (50.6%) | 4.36 |
| Single Male/Father | 672 (10.5%) | 3.71 |
| Single Female/Mother | 1,691 (26.5%) | 4.01 |
| Non-family | 793 (12.4%) | 1.44 |
| Total Households | 6,386 (100.0%) | 3.83 |
Household Size by Marriage Status in Dinuba
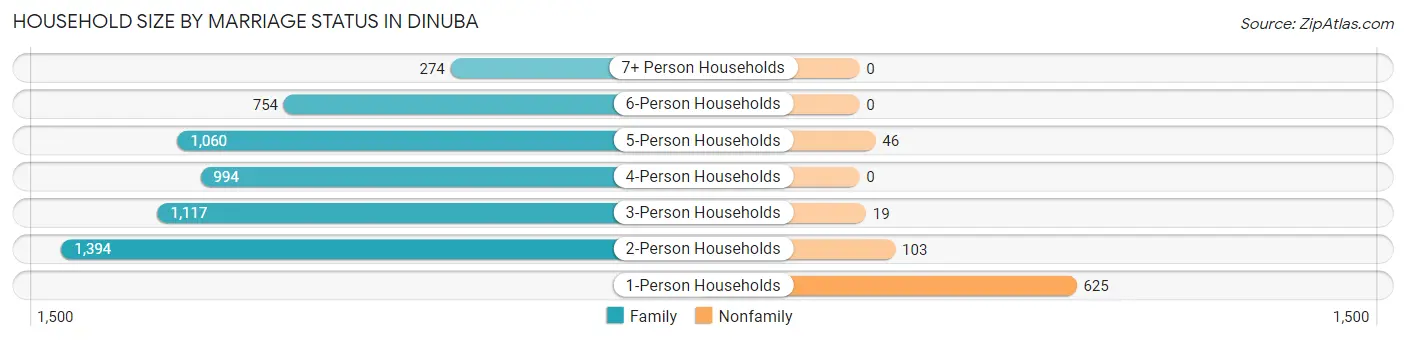
Out of a total of 6,386 households in Dinuba, 5,593 (87.6%) are family households, while 793 (12.4%) are nonfamily households. The most numerous type of family households are 2-person households, comprising 1,394, and the most common type of nonfamily households are 1-person households, comprising 625.
| Household Size | Family Households | Nonfamily Households |
| 1-Person Households | - | 625 (9.8%) |
| 2-Person Households | 1,394 (21.8%) | 103 (1.6%) |
| 3-Person Households | 1,117 (17.5%) | 19 (0.3%) |
| 4-Person Households | 994 (15.6%) | 0 (0.0%) |
| 5-Person Households | 1,060 (16.6%) | 46 (0.7%) |
| 6-Person Households | 754 (11.8%) | 0 (0.0%) |
| 7+ Person Households | 274 (4.3%) | 0 (0.0%) |
| Total | 5,593 (87.6%) | 793 (12.4%) |
Female Fertility in Dinuba
Fertility by Age in Dinuba
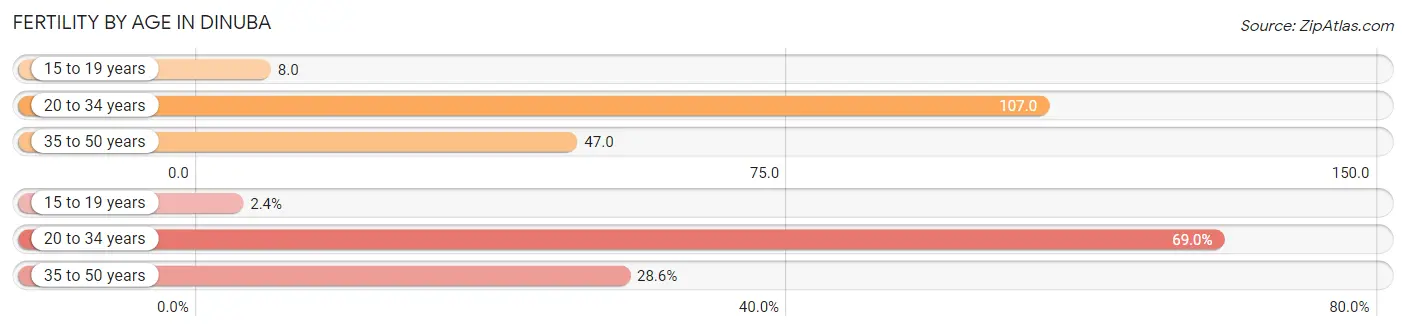
Average fertility rate in Dinuba is 64.0 births per 1,000 women. Women in the age bracket of 20 to 34 years have the highest fertility rate with 107.0 births per 1,000 women. Women in the age bracket of 20 to 34 years acount for 69.0% of all women with births.
| Age Bracket | Women with Births | Births / 1,000 Women |
| 15 to 19 years | 10 (2.4%) | 8.0 |
| 20 to 34 years | 289 (69.0%) | 107.0 |
| 35 to 50 years | 120 (28.6%) | 47.0 |
| Total | 419 (100.0%) | 64.0 |
Fertility by Age by Marriage Status in Dinuba
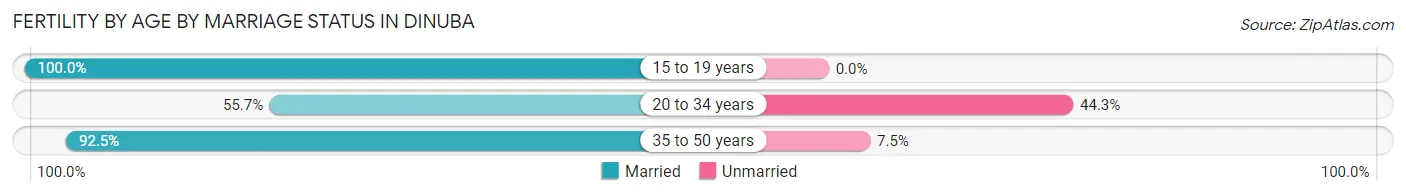
67.3% of women with births (419) in Dinuba are married. The highest percentage of unmarried women with births falls into 20 to 34 years age bracket with 44.3% of them unmarried at the time of birth, while the lowest percentage of unmarried women with births belong to 15 to 19 years age bracket with 0.0% of them unmarried.
| Age Bracket | Married | Unmarried |
| 15 to 19 years | 10 (100.0%) | 0 (0.0%) |
| 20 to 34 years | 161 (55.7%) | 128 (44.3%) |
| 35 to 50 years | 111 (92.5%) | 9 (7.5%) |
| Total | 282 (67.3%) | 137 (32.7%) |
Fertility by Education in Dinuba
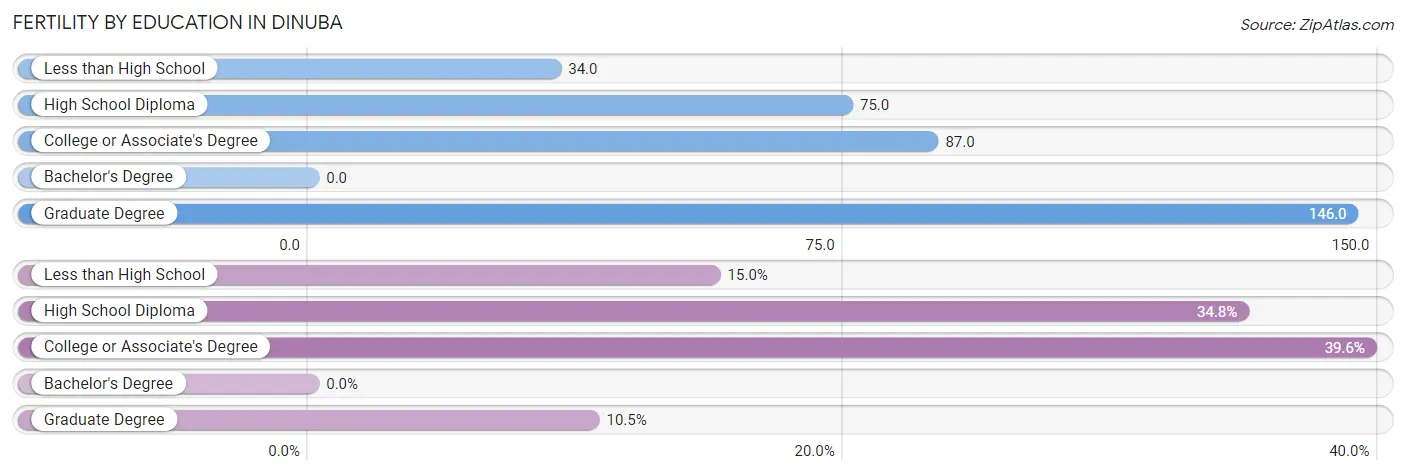
| Educational Attainment | Women with Births | Births / 1,000 Women |
| Less than High School | 63 (15.0%) | 34.0 |
| High School Diploma | 146 (34.8%) | 75.0 |
| College or Associate's Degree | 166 (39.6%) | 87.0 |
| Bachelor's Degree | 0 (0.0%) | 0.0 |
| Graduate Degree | 44 (10.5%) | 146.0 |
| Total | 419 (100.0%) | 64.0 |
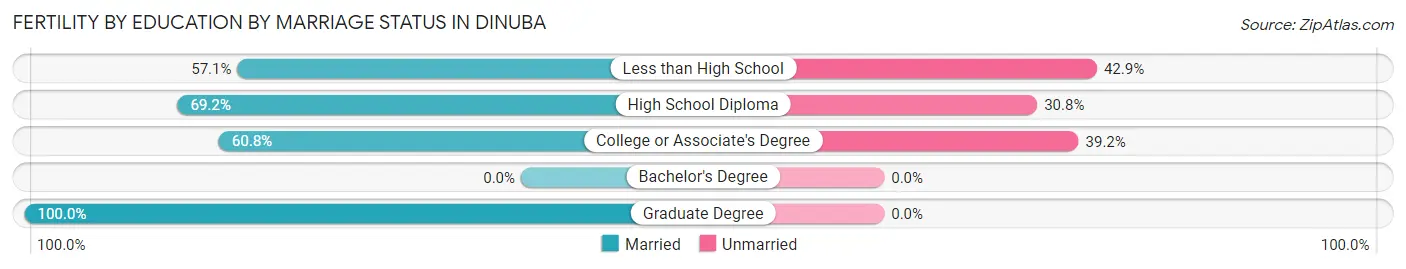
Fertility by Education by Marriage Status in Dinuba
32.7% of women with births in Dinuba are unmarried. Women with the educational attainment of graduate degree are most likely to be married with 100.0% of them married at childbirth, while women with the educational attainment of less than high school are least likely to be married with 42.9% of them unmarried at childbirth.
| Educational Attainment | Married | Unmarried |
| Less than High School | 36 (57.1%) | 27 (42.9%) |
| High School Diploma | 101 (69.2%) | 45 (30.8%) |
| College or Associate's Degree | 101 (60.8%) | 65 (39.2%) |
| Bachelor's Degree | 0 (0.0%) | 0 (0.0%) |
| Graduate Degree | 44 (100.0%) | 0 (0.0%) |
| Total | 282 (67.3%) | 137 (32.7%) |
Employment Characteristics in Dinuba
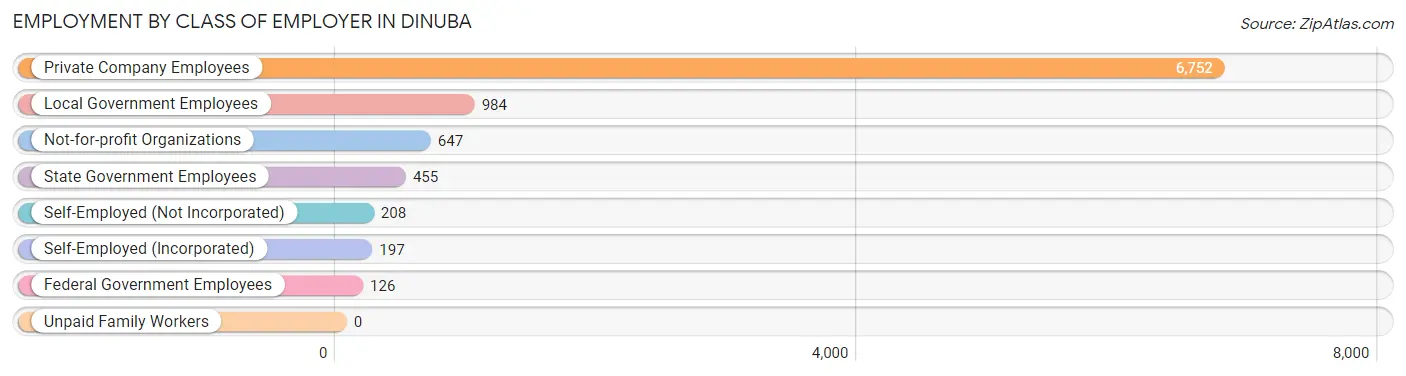
Employment by Class of Employer in Dinuba
Among the 9,369 employed individuals in Dinuba, private company employees (6,752 | 72.1%), local government employees (984 | 10.5%), and not-for-profit organizations (647 | 6.9%) make up the most common classes of employment.
| Employer Class | # Employees | % Employees |
| Private Company Employees | 6,752 | 72.1% |
| Self-Employed (Incorporated) | 197 | 2.1% |
| Self-Employed (Not Incorporated) | 208 | 2.2% |
| Not-for-profit Organizations | 647 | 6.9% |
| Local Government Employees | 984 | 10.5% |
| State Government Employees | 455 | 4.9% |
| Federal Government Employees | 126 | 1.3% |
| Unpaid Family Workers | 0 | 0.0% |
| Total | 9,369 | 100.0% |
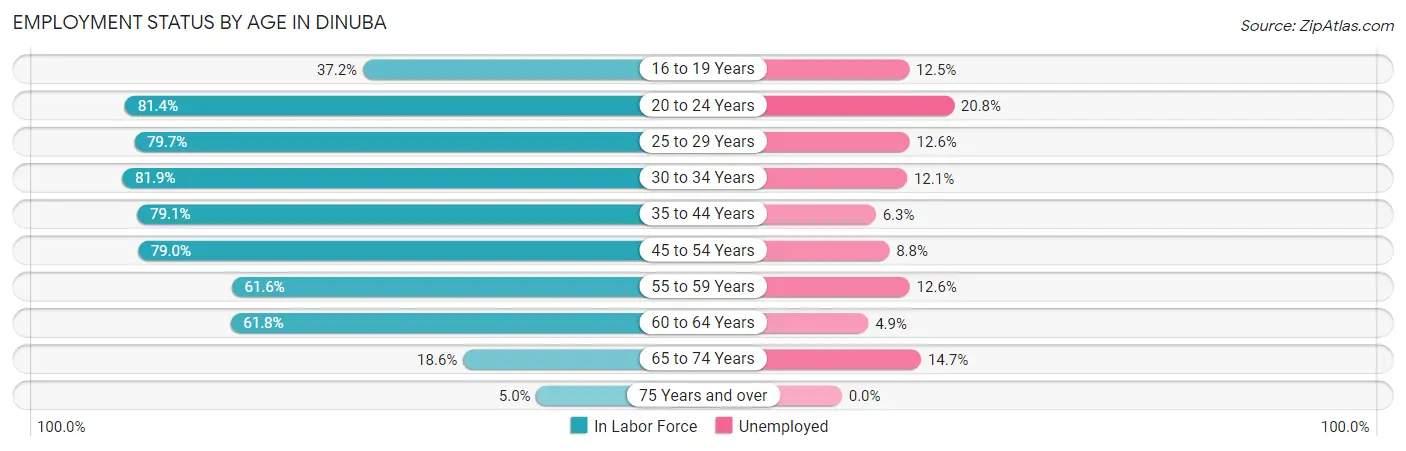
Employment Status by Age in Dinuba
According to the labor force statistics for Dinuba, out of the total population over 16 years of age (17,090), 64.3% or 10,989 individuals are in the labor force, with 11.0% or 1,209 of them unemployed. The age group with the highest labor force participation rate is 30 to 34 years, with 81.9% or 1,251 individuals in the labor force. Within the labor force, the 20 to 24 years age range has the highest percentage of unemployed individuals, with 20.8% or 297 of them being unemployed.
| Age Bracket | In Labor Force | Unemployed |
| 16 to 19 Years | 741 (37.2%) | 93 (12.5%) |
| 20 to 24 Years | 1,426 (81.4%) | 297 (20.8%) |
| 25 to 29 Years | 1,459 (79.7%) | 184 (12.6%) |
| 30 to 34 Years | 1,251 (81.9%) | 151 (12.1%) |
| 35 to 44 Years | 2,787 (79.1%) | 176 (6.3%) |
| 45 to 54 Years | 1,786 (79.0%) | 157 (8.8%) |
| 55 to 59 Years | 675 (61.6%) | 85 (12.6%) |
| 60 to 64 Years | 571 (61.8%) | 28 (4.9%) |
| 65 to 74 Years | 246 (18.6%) | 36 (14.7%) |
| 75 Years and over | 43 (5.0%) | 0 (0.0%) |
| Total | 10,989 (64.3%) | 1,209 (11.0%) |
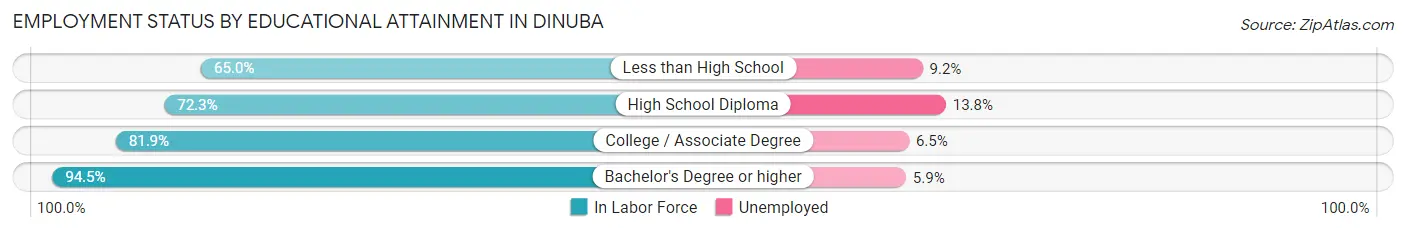
Employment Status by Educational Attainment in Dinuba
According to labor force statistics for Dinuba, 76.4% of individuals (8,527) out of the total population between 25 and 64 years of age (11,161) are in the labor force, with 9.1% or 776 of them being unemployed. The group with the highest labor force participation rate are those with the educational attainment of bachelor's degree or higher, with 94.5% or 1,329 individuals in the labor force. Within the labor force, individuals with high school diploma education have the highest percentage of unemployment, with 13.8% or 357 of them being unemployed.
| Educational Attainment | In Labor Force | Unemployed |
| Less than High School | 1,730 (65.0%) | 245 (9.2%) |
| High School Diploma | 2,585 (72.3%) | 493 (13.8%) |
| College / Associate Degree | 2,882 (81.9%) | 229 (6.5%) |
| Bachelor's Degree or higher | 1,329 (94.5%) | 83 (5.9%) |
| Total | 8,527 (76.4%) | 1,016 (9.1%) |
Employment Occupations by Sex in Dinuba
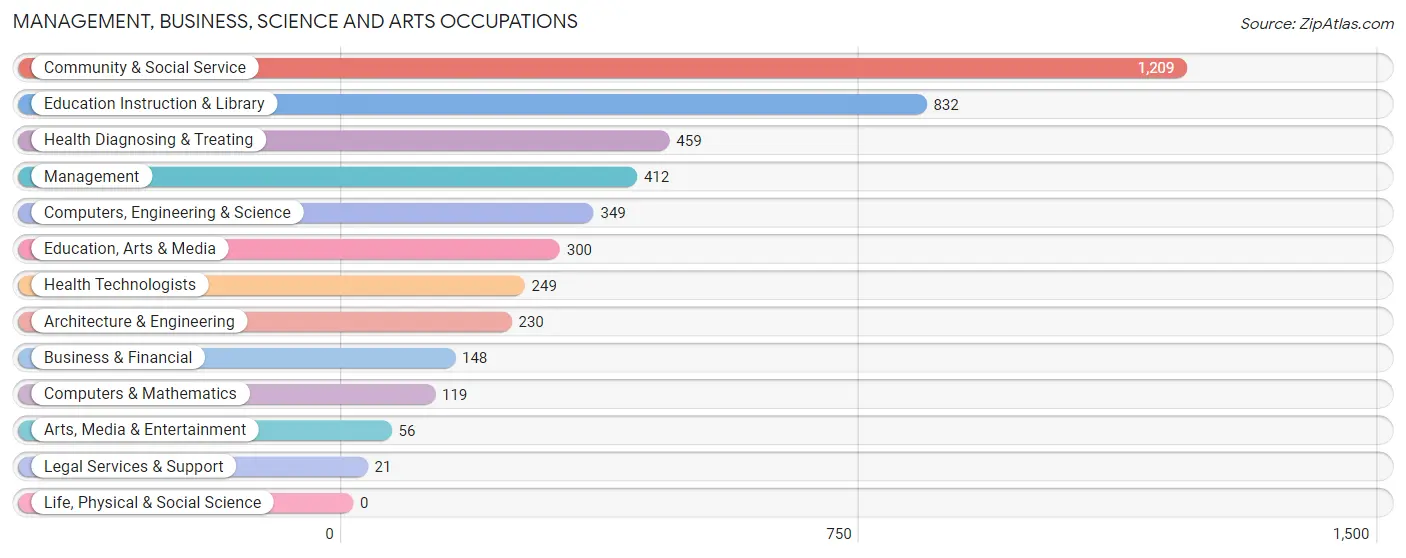
Management, Business, Science and Arts Occupations
The most common Management, Business, Science and Arts occupations in Dinuba are Community & Social Service (1,209 | 12.4%), Education Instruction & Library (832 | 8.5%), Health Diagnosing & Treating (459 | 4.7%), Management (412 | 4.2%), and Computers, Engineering & Science (349 | 3.6%).
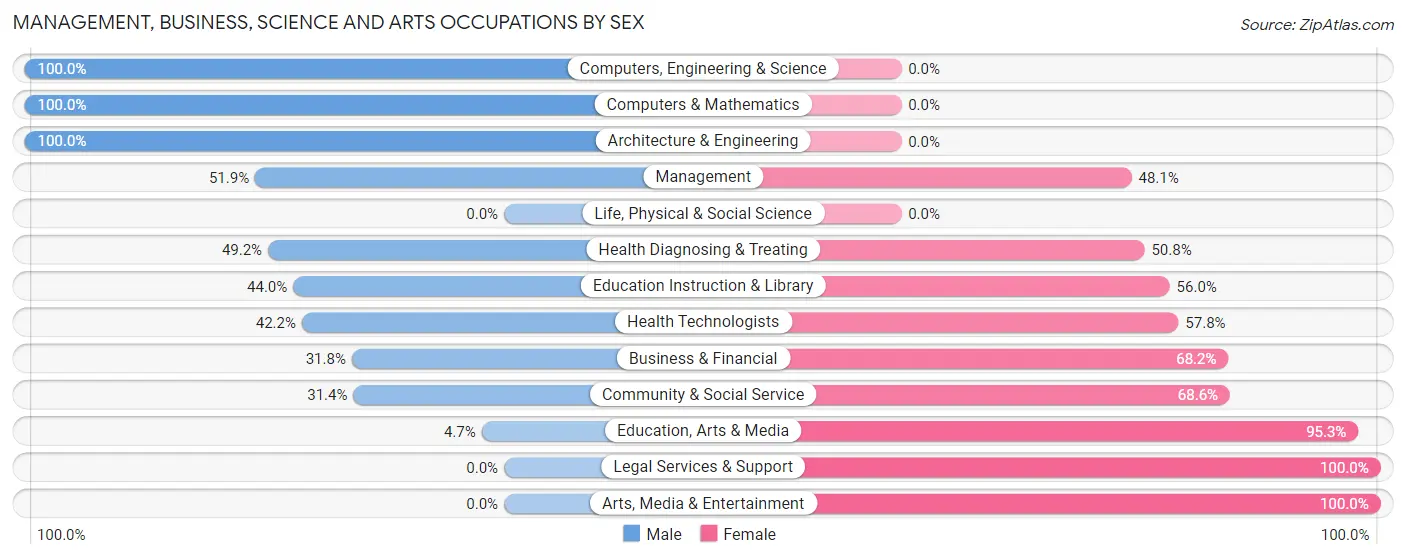
Management, Business, Science and Arts Occupations by Sex
Within the Management, Business, Science and Arts occupations in Dinuba, the most male-oriented occupations are Computers, Engineering & Science (100.0%), Computers & Mathematics (100.0%), and Architecture & Engineering (100.0%), while the most female-oriented occupations are Legal Services & Support (100.0%), Arts, Media & Entertainment (100.0%), and Education, Arts & Media (95.3%).
| Occupation | Male | Female |
| Management | 214 (51.9%) | 198 (48.1%) |
| Business & Financial | 47 (31.8%) | 101 (68.2%) |
| Computers, Engineering & Science | 349 (100.0%) | 0 (0.0%) |
| Computers & Mathematics | 119 (100.0%) | 0 (0.0%) |
| Architecture & Engineering | 230 (100.0%) | 0 (0.0%) |
| Life, Physical & Social Science | 0 (0.0%) | 0 (0.0%) |
| Community & Social Service | 380 (31.4%) | 829 (68.6%) |
| Education, Arts & Media | 14 (4.7%) | 286 (95.3%) |
| Legal Services & Support | 0 (0.0%) | 21 (100.0%) |
| Education Instruction & Library | 366 (44.0%) | 466 (56.0%) |
| Arts, Media & Entertainment | 0 (0.0%) | 56 (100.0%) |
| Health Diagnosing & Treating | 226 (49.2%) | 233 (50.8%) |
| Health Technologists | 105 (42.2%) | 144 (57.8%) |
| Total (Category) | 1,216 (47.2%) | 1,361 (52.8%) |
| Total (Overall) | 5,003 (51.3%) | 4,757 (48.7%) |
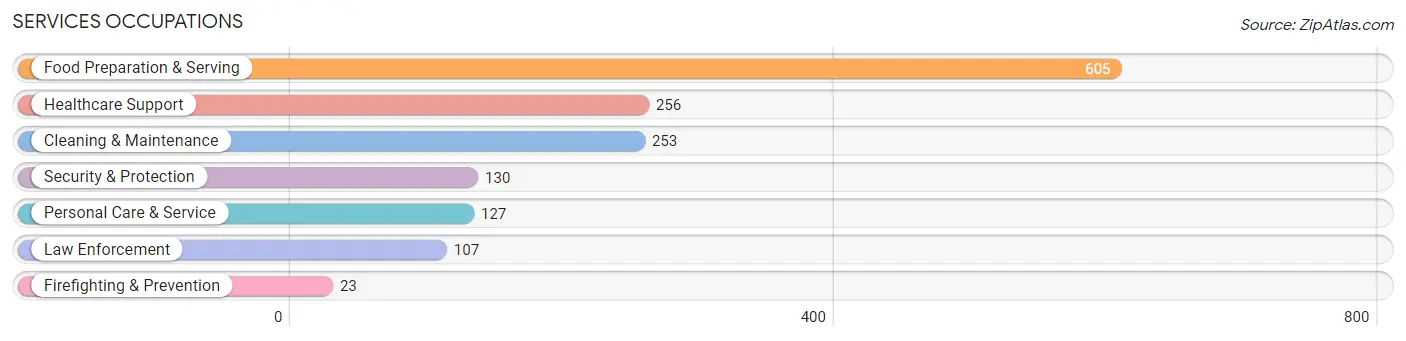
Services Occupations
The most common Services occupations in Dinuba are Food Preparation & Serving (605 | 6.2%), Healthcare Support (256 | 2.6%), Cleaning & Maintenance (253 | 2.6%), Security & Protection (130 | 1.3%), and Personal Care & Service (127 | 1.3%).
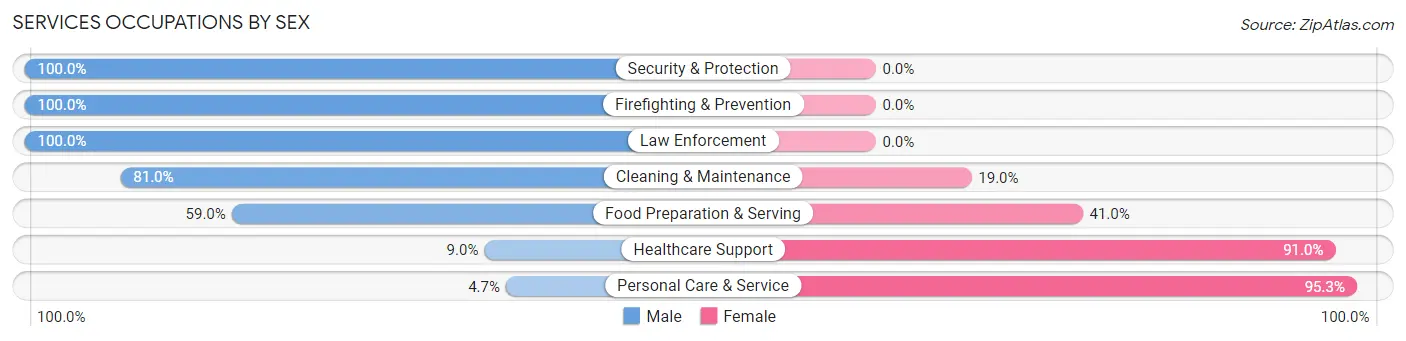
Services Occupations by Sex
Within the Services occupations in Dinuba, the most male-oriented occupations are Security & Protection (100.0%), Firefighting & Prevention (100.0%), and Law Enforcement (100.0%), while the most female-oriented occupations are Personal Care & Service (95.3%), Healthcare Support (91.0%), and Food Preparation & Serving (41.0%).
| Occupation | Male | Female |
| Healthcare Support | 23 (9.0%) | 233 (91.0%) |
| Security & Protection | 130 (100.0%) | 0 (0.0%) |
| Firefighting & Prevention | 23 (100.0%) | 0 (0.0%) |
| Law Enforcement | 107 (100.0%) | 0 (0.0%) |
| Food Preparation & Serving | 357 (59.0%) | 248 (41.0%) |
| Cleaning & Maintenance | 205 (81.0%) | 48 (19.0%) |
| Personal Care & Service | 6 (4.7%) | 121 (95.3%) |
| Total (Category) | 721 (52.6%) | 650 (47.4%) |
| Total (Overall) | 5,003 (51.3%) | 4,757 (48.7%) |
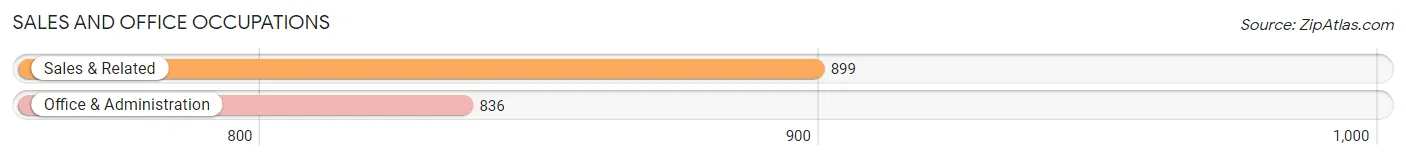
Sales and Office Occupations
The most common Sales and Office occupations in Dinuba are Sales & Related (899 | 9.2%), and Office & Administration (836 | 8.6%).
Sales and Office Occupations by Sex
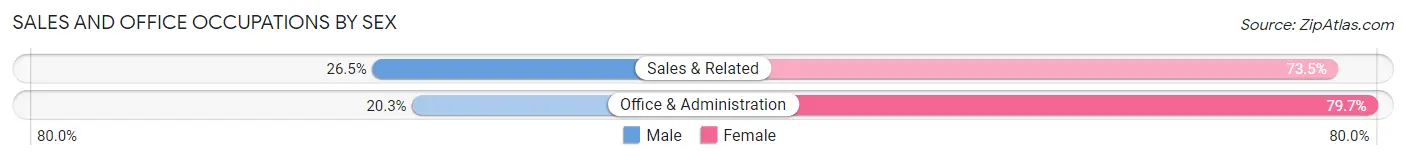
| Occupation | Male | Female |
| Sales & Related | 238 (26.5%) | 661 (73.5%) |
| Office & Administration | 170 (20.3%) | 666 (79.7%) |
| Total (Category) | 408 (23.5%) | 1,327 (76.5%) |
| Total (Overall) | 5,003 (51.3%) | 4,757 (48.7%) |
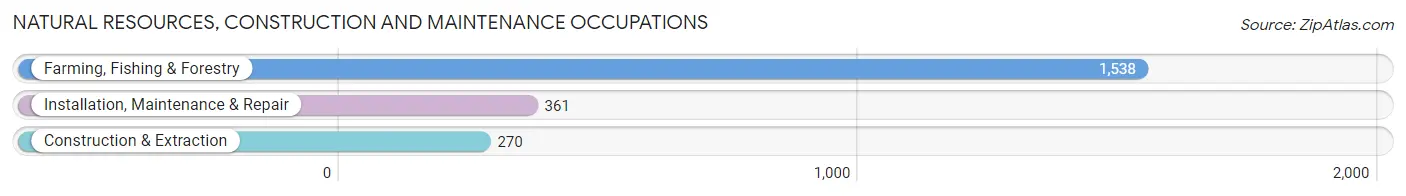
Natural Resources, Construction and Maintenance Occupations
The most common Natural Resources, Construction and Maintenance occupations in Dinuba are Farming, Fishing & Forestry (1,538 | 15.8%), Installation, Maintenance & Repair (361 | 3.7%), and Construction & Extraction (270 | 2.8%).
Natural Resources, Construction and Maintenance Occupations by Sex
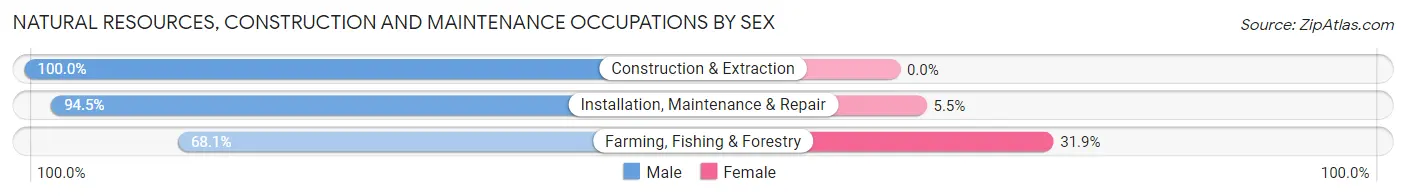
| Occupation | Male | Female |
| Farming, Fishing & Forestry | 1,047 (68.1%) | 491 (31.9%) |
| Construction & Extraction | 270 (100.0%) | 0 (0.0%) |
| Installation, Maintenance & Repair | 341 (94.5%) | 20 (5.5%) |
| Total (Category) | 1,658 (76.4%) | 511 (23.6%) |
| Total (Overall) | 5,003 (51.3%) | 4,757 (48.7%) |
Production, Transportation and Moving Occupations
The most common Production, Transportation and Moving occupations in Dinuba are Material Moving (1,139 | 11.7%), Production (502 | 5.1%), and Transportation (267 | 2.7%).
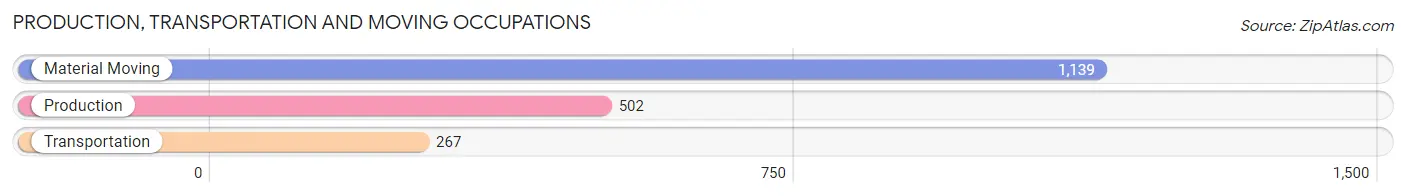
Production, Transportation and Moving Occupations by Sex
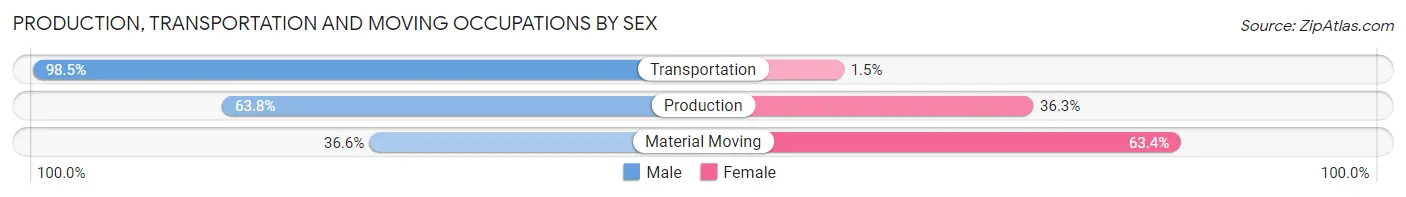
| Occupation | Male | Female |
| Production | 320 (63.7%) | 182 (36.2%) |
| Transportation | 263 (98.5%) | 4 (1.5%) |
| Material Moving | 417 (36.6%) | 722 (63.4%) |
| Total (Category) | 1,000 (52.4%) | 908 (47.6%) |
| Total (Overall) | 5,003 (51.3%) | 4,757 (48.7%) |
Employment Industries by Sex in Dinuba
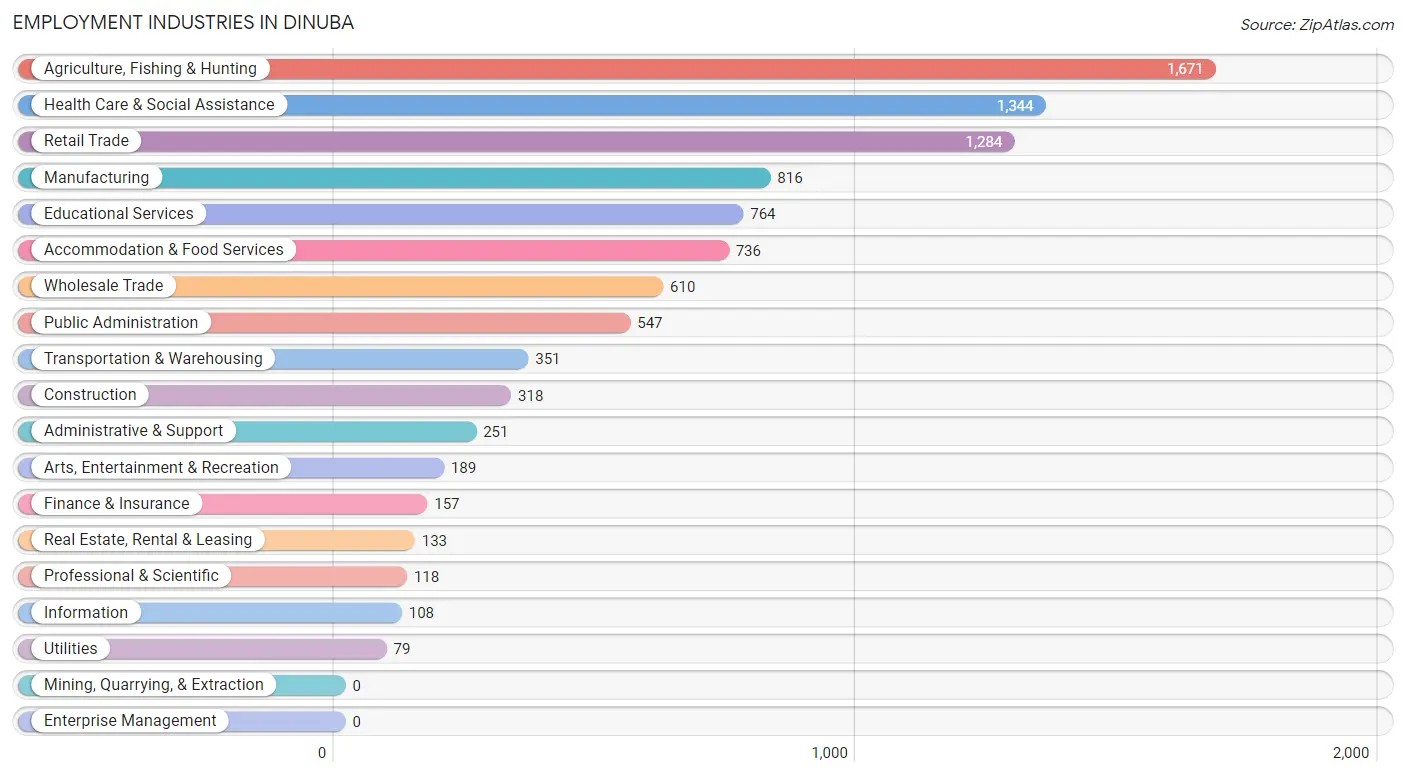
Employment Industries in Dinuba
The major employment industries in Dinuba include Agriculture, Fishing & Hunting (1,671 | 17.1%), Health Care & Social Assistance (1,344 | 13.8%), Retail Trade (1,284 | 13.2%), Manufacturing (816 | 8.4%), and Educational Services (764 | 7.8%).
Employment Industries by Sex in Dinuba
The Dinuba industries that see more men than women are Information (100.0%), Construction (98.1%), and Utilities (72.2%), whereas the industries that tend to have a higher number of women are Finance & Insurance (86.6%), Educational Services (71.9%), and Health Care & Social Assistance (66.2%).
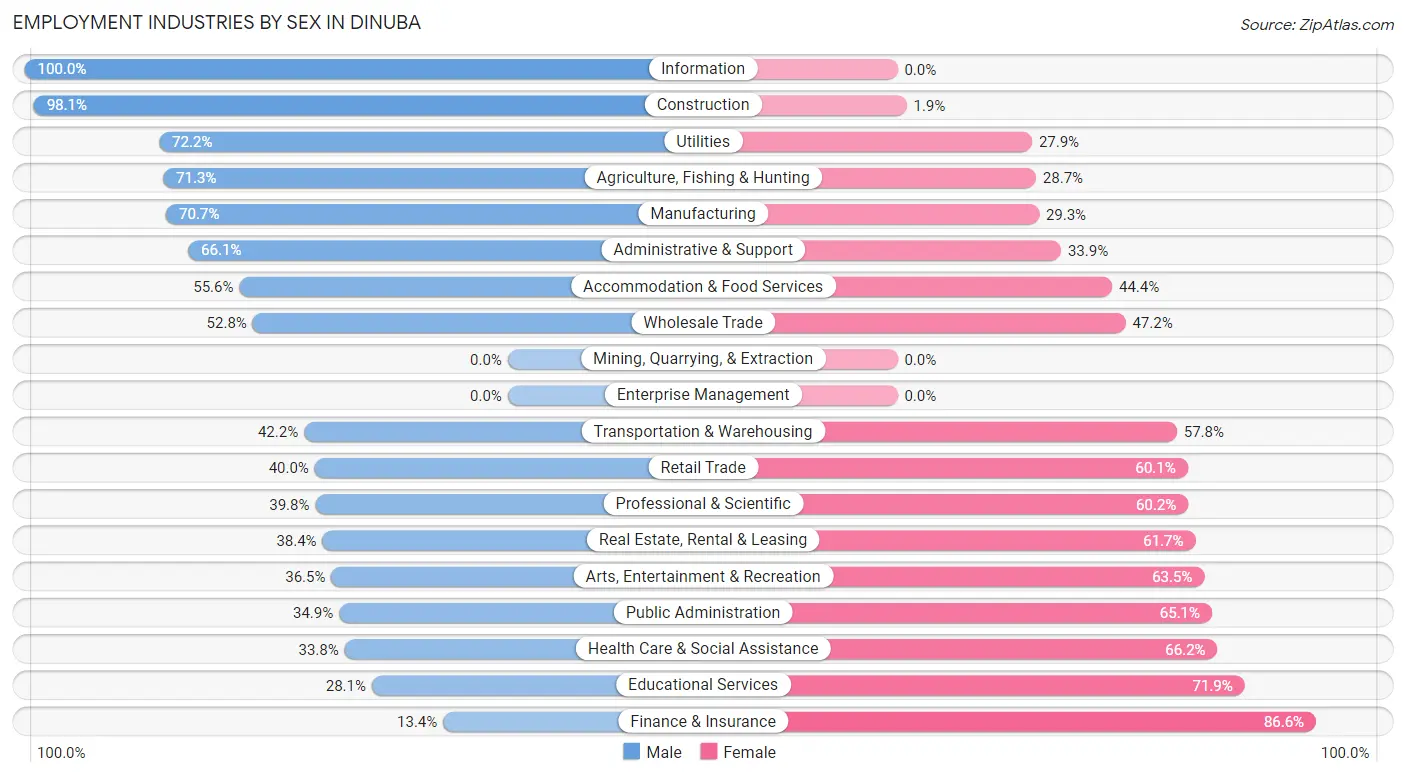
| Industry | Male | Female |
| Agriculture, Fishing & Hunting | 1,192 (71.3%) | 479 (28.7%) |
| Mining, Quarrying, & Extraction | 0 (0.0%) | 0 (0.0%) |
| Construction | 312 (98.1%) | 6 (1.9%) |
| Manufacturing | 577 (70.7%) | 239 (29.3%) |
| Wholesale Trade | 322 (52.8%) | 288 (47.2%) |
| Retail Trade | 513 (40.0%) | 771 (60.1%) |
| Transportation & Warehousing | 148 (42.2%) | 203 (57.8%) |
| Utilities | 57 (72.2%) | 22 (27.9%) |
| Information | 108 (100.0%) | 0 (0.0%) |
| Finance & Insurance | 21 (13.4%) | 136 (86.6%) |
| Real Estate, Rental & Leasing | 51 (38.4%) | 82 (61.7%) |
| Professional & Scientific | 47 (39.8%) | 71 (60.2%) |
| Enterprise Management | 0 (0.0%) | 0 (0.0%) |
| Administrative & Support | 166 (66.1%) | 85 (33.9%) |
| Educational Services | 215 (28.1%) | 549 (71.9%) |
| Health Care & Social Assistance | 454 (33.8%) | 890 (66.2%) |
| Arts, Entertainment & Recreation | 69 (36.5%) | 120 (63.5%) |
| Accommodation & Food Services | 409 (55.6%) | 327 (44.4%) |
| Public Administration | 191 (34.9%) | 356 (65.1%) |
| Total | 5,003 (51.3%) | 4,757 (48.7%) |
Education in Dinuba
School Enrollment in Dinuba
The most common levels of schooling among the 8,460 students in Dinuba are middle school (2,279 | 26.9%), elementary school (2,066 | 24.4%), and high school (1,743 | 20.6%).
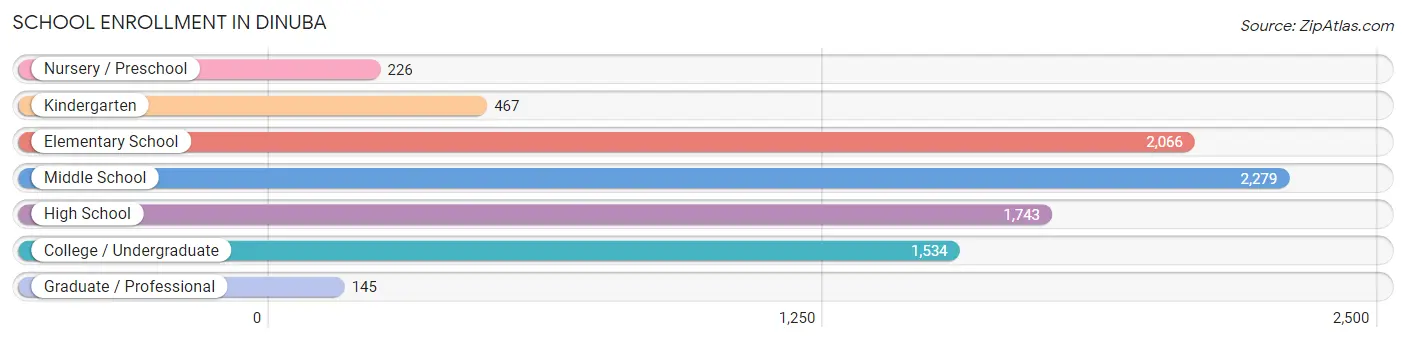
| School Level | # Students | % Students |
| Nursery / Preschool | 226 | 2.7% |
| Kindergarten | 467 | 5.5% |
| Elementary School | 2,066 | 24.4% |
| Middle School | 2,279 | 26.9% |
| High School | 1,743 | 20.6% |
| College / Undergraduate | 1,534 | 18.1% |
| Graduate / Professional | 145 | 1.7% |
| Total | 8,460 | 100.0% |
School Enrollment by Age by Funding Source in Dinuba
Out of a total of 8,460 students who are enrolled in schools in Dinuba, 897 (10.6%) attend a private institution, while the remaining 7,563 (89.4%) are enrolled in public schools. The age group of 3 to 4 year olds has the highest likelihood of being enrolled in private schools, with 100 (43.1% in the age bracket) enrolled. Conversely, the age group of 15 to 17 year olds has the lowest likelihood of being enrolled in a private school, with 1,225 (100.0% in the age bracket) attending a public institution.
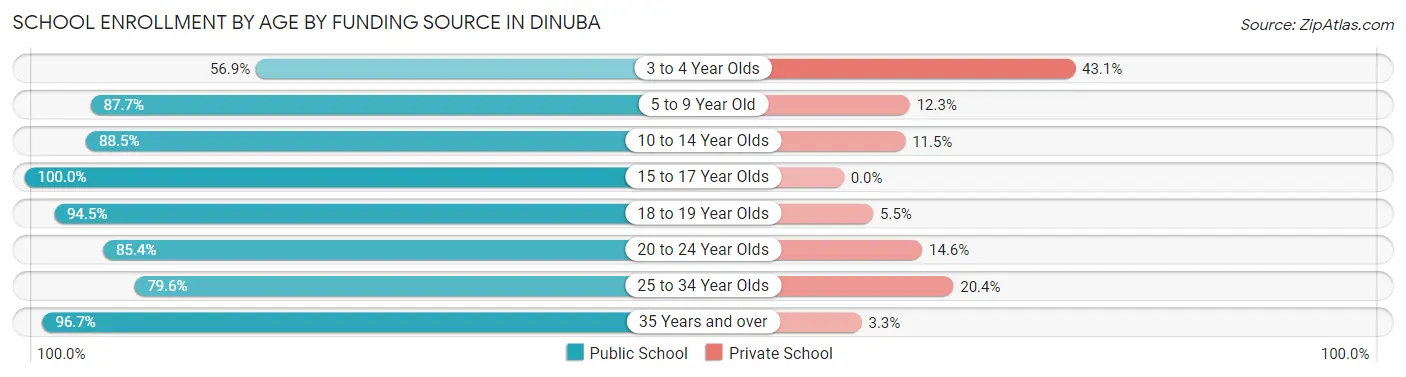
| Age Bracket | Public School | Private School |
| 3 to 4 Year Olds | 132 (56.9%) | 100 (43.1%) |
| 5 to 9 Year Old | 1,923 (87.7%) | 270 (12.3%) |
| 10 to 14 Year Olds | 2,627 (88.5%) | 340 (11.5%) |
| 15 to 17 Year Olds | 1,225 (100.0%) | 0 (0.0%) |
| 18 to 19 Year Olds | 742 (94.5%) | 43 (5.5%) |
| 20 to 24 Year Olds | 456 (85.4%) | 78 (14.6%) |
| 25 to 34 Year Olds | 226 (79.6%) | 58 (20.4%) |
| 35 Years and over | 232 (96.7%) | 8 (3.3%) |
| Total | 7,563 (89.4%) | 897 (10.6%) |
Educational Attainment by Field of Study in Dinuba
Education (432 | 23.8%), business (207 | 11.4%), bio, nature & agricultural (177 | 9.8%), science & technology (168 | 9.2%), and arts & humanities (149 | 8.2%) are the most common fields of study among 1,816 individuals in Dinuba who have obtained a bachelor's degree or higher.
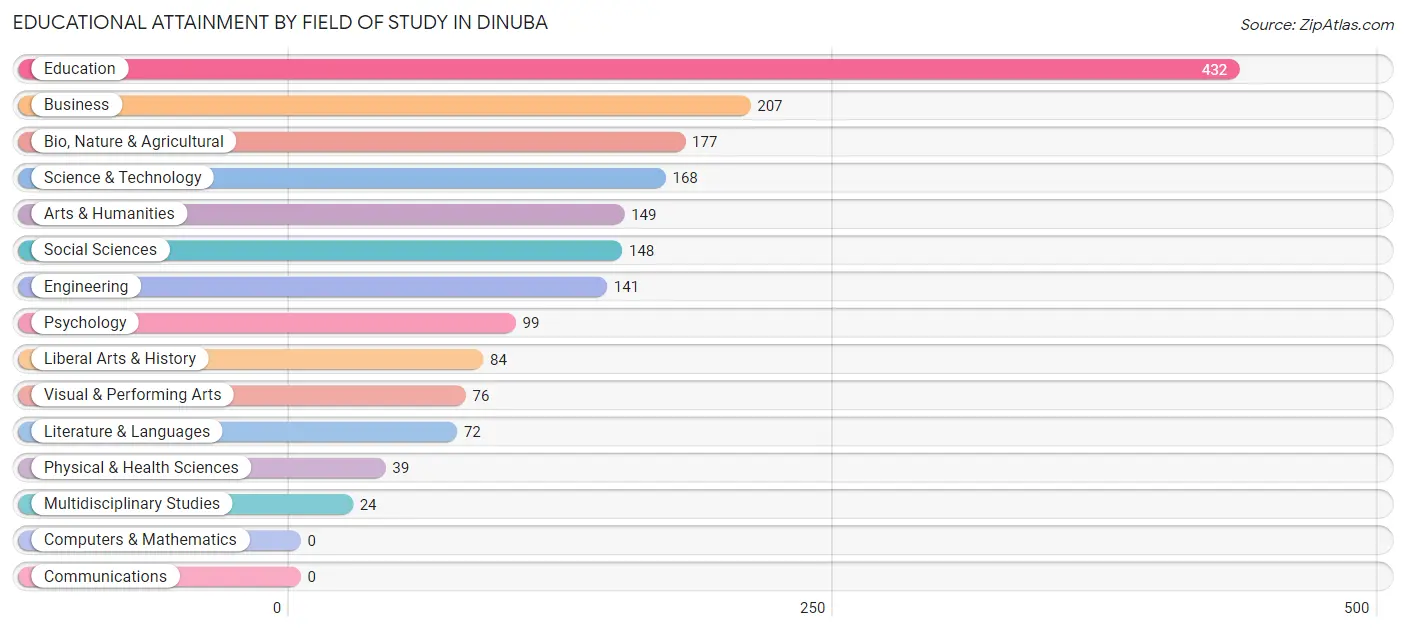
| Field of Study | # Graduates | % Graduates |
| Computers & Mathematics | 0 | 0.0% |
| Bio, Nature & Agricultural | 177 | 9.8% |
| Physical & Health Sciences | 39 | 2.1% |
| Psychology | 99 | 5.4% |
| Social Sciences | 148 | 8.2% |
| Engineering | 141 | 7.8% |
| Multidisciplinary Studies | 24 | 1.3% |
| Science & Technology | 168 | 9.2% |
| Business | 207 | 11.4% |
| Education | 432 | 23.8% |
| Literature & Languages | 72 | 4.0% |
| Liberal Arts & History | 84 | 4.6% |
| Visual & Performing Arts | 76 | 4.2% |
| Communications | 0 | 0.0% |
| Arts & Humanities | 149 | 8.2% |
| Total | 1,816 | 100.0% |
Transportation & Commute in Dinuba
Vehicle Availability by Sex in Dinuba
The most prevalent vehicle ownership categories in Dinuba are males with 2 vehicles (1,844, accounting for 37.6%) and females with 2 vehicles (1,353, making up 41.6%).
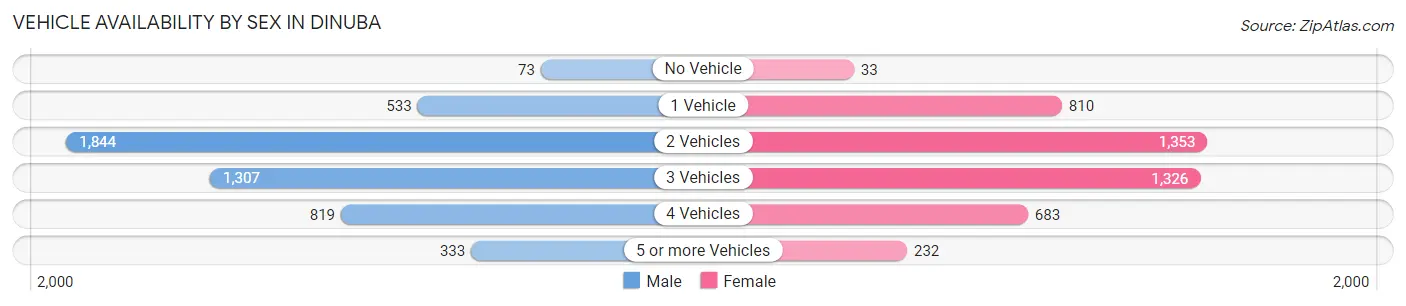
| Vehicles Available | Male | Female |
| No Vehicle | 73 (1.5%) | 33 (0.7%) |
| 1 Vehicle | 533 (10.9%) | 810 (18.3%) |
| 2 Vehicles | 1,844 (37.6%) | 1,353 (30.5%) |
| 3 Vehicles | 1,307 (26.6%) | 1,326 (29.9%) |
| 4 Vehicles | 819 (16.7%) | 683 (15.4%) |
| 5 or more Vehicles | 333 (6.8%) | 232 (5.2%) |
| Total | 4,909 (100.0%) | 4,437 (100.0%) |
Commute Time in Dinuba
The most frequently occuring commute durations in Dinuba are 30 to 34 minutes (1,536 commuters, 16.8%), 5 to 9 minutes (1,427 commuters, 15.7%), and 15 to 19 minutes (1,384 commuters, 15.2%).
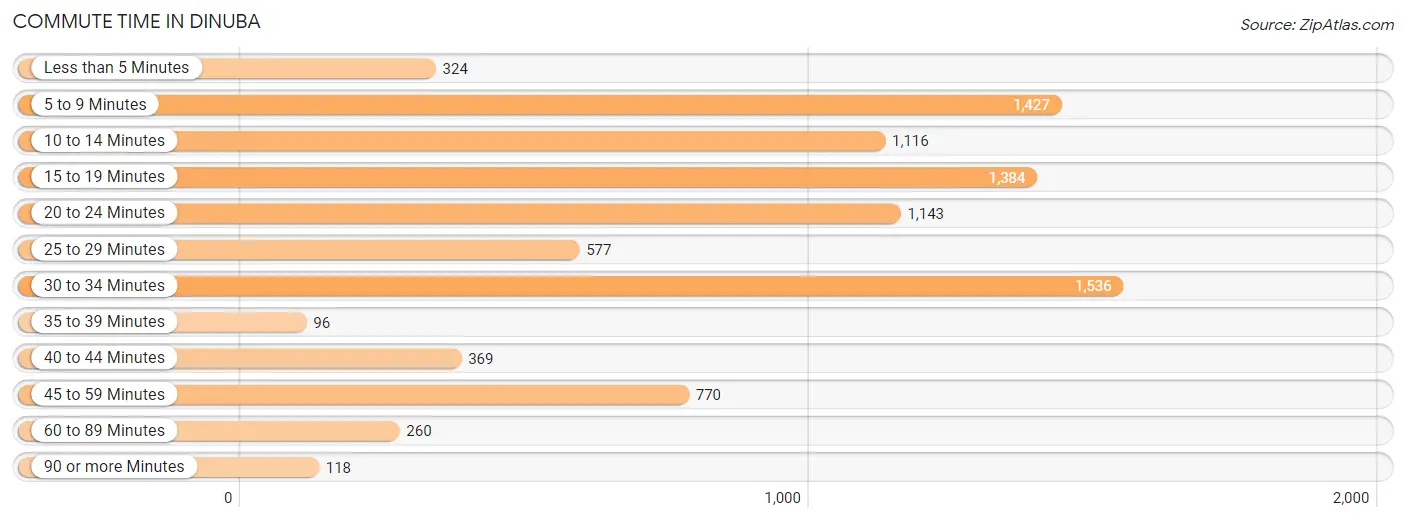
| Commute Time | # Commuters | % Commuters |
| Less than 5 Minutes | 324 | 3.5% |
| 5 to 9 Minutes | 1,427 | 15.7% |
| 10 to 14 Minutes | 1,116 | 12.2% |
| 15 to 19 Minutes | 1,384 | 15.2% |
| 20 to 24 Minutes | 1,143 | 12.5% |
| 25 to 29 Minutes | 577 | 6.3% |
| 30 to 34 Minutes | 1,536 | 16.8% |
| 35 to 39 Minutes | 96 | 1.1% |
| 40 to 44 Minutes | 369 | 4.1% |
| 45 to 59 Minutes | 770 | 8.4% |
| 60 to 89 Minutes | 260 | 2.9% |
| 90 or more Minutes | 118 | 1.3% |
Commute Time by Sex in Dinuba
The most common commute times in Dinuba are 30 to 34 minutes (778 commuters, 16.1%) for males and 5 to 9 minutes (851 commuters, 19.8%) for females.
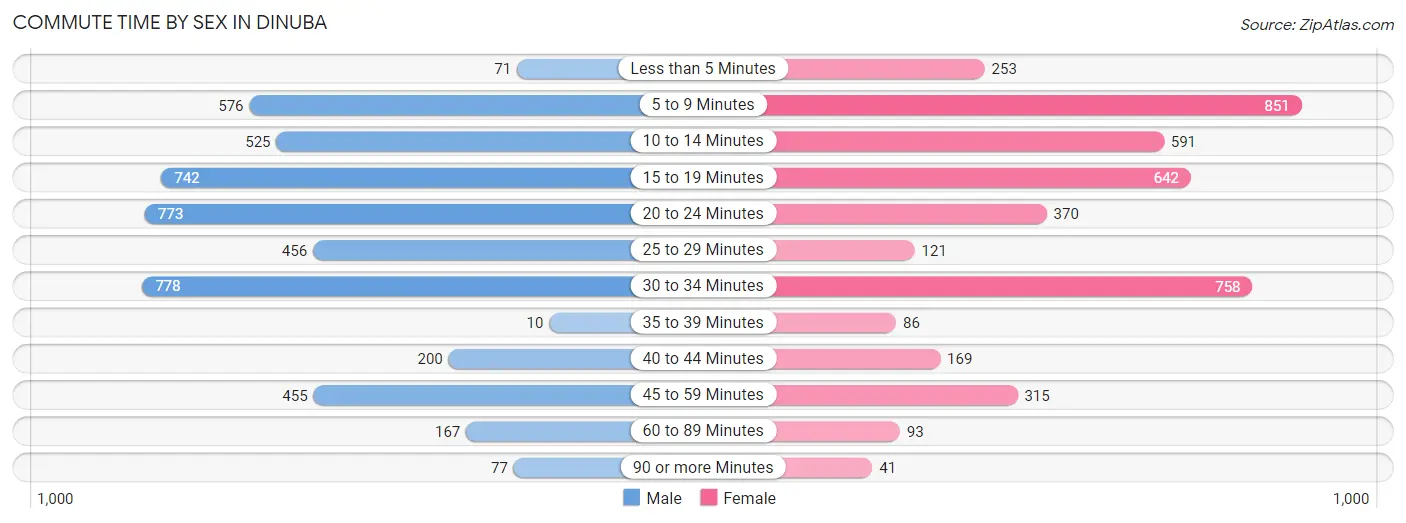
| Commute Time | Male | Female |
| Less than 5 Minutes | 71 (1.5%) | 253 (5.9%) |
| 5 to 9 Minutes | 576 (11.9%) | 851 (19.8%) |
| 10 to 14 Minutes | 525 (10.9%) | 591 (13.8%) |
| 15 to 19 Minutes | 742 (15.4%) | 642 (15.0%) |
| 20 to 24 Minutes | 773 (16.0%) | 370 (8.6%) |
| 25 to 29 Minutes | 456 (9.4%) | 121 (2.8%) |
| 30 to 34 Minutes | 778 (16.1%) | 758 (17.7%) |
| 35 to 39 Minutes | 10 (0.2%) | 86 (2.0%) |
| 40 to 44 Minutes | 200 (4.1%) | 169 (3.9%) |
| 45 to 59 Minutes | 455 (9.4%) | 315 (7.3%) |
| 60 to 89 Minutes | 167 (3.5%) | 93 (2.2%) |
| 90 or more Minutes | 77 (1.6%) | 41 (1.0%) |
Time of Departure to Work by Sex in Dinuba
The most frequent times of departure to work in Dinuba are 12:00 PM to 3:59 PM (624, 12.9%) for males and 7:30 AM to 7:59 AM (756, 17.6%) for females.
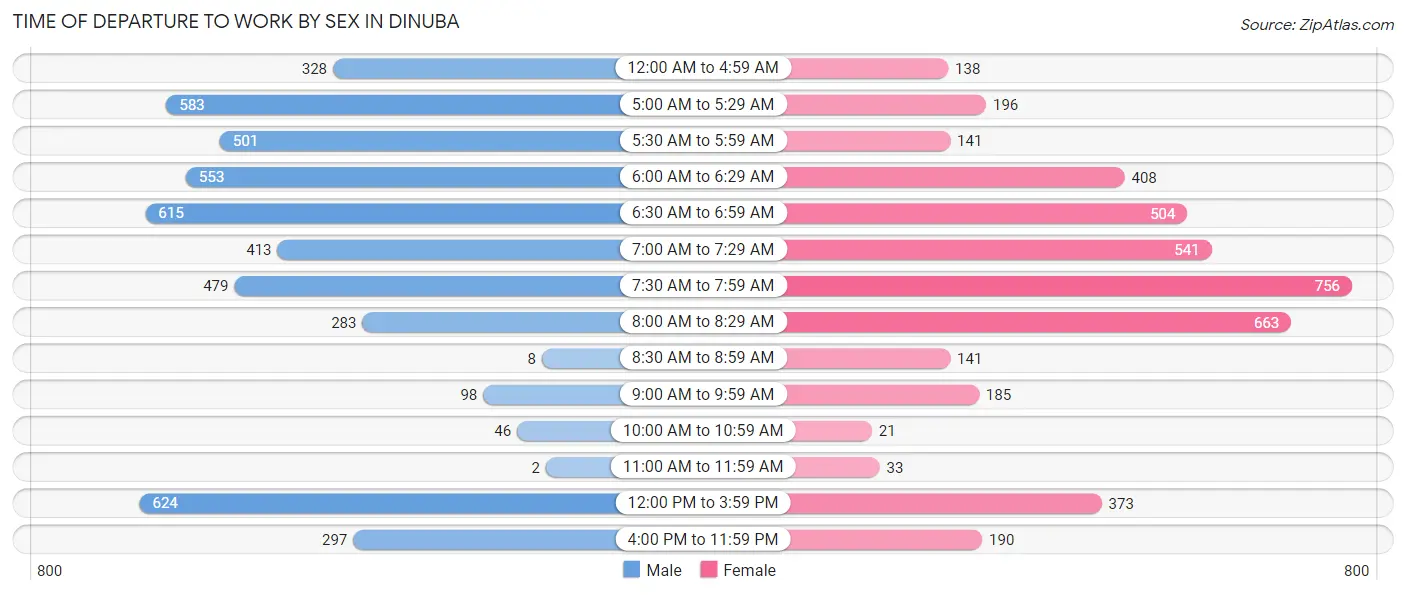
| Time of Departure | Male | Female |
| 12:00 AM to 4:59 AM | 328 (6.8%) | 138 (3.2%) |
| 5:00 AM to 5:29 AM | 583 (12.1%) | 196 (4.6%) |
| 5:30 AM to 5:59 AM | 501 (10.4%) | 141 (3.3%) |
| 6:00 AM to 6:29 AM | 553 (11.5%) | 408 (9.5%) |
| 6:30 AM to 6:59 AM | 615 (12.7%) | 504 (11.7%) |
| 7:00 AM to 7:29 AM | 413 (8.6%) | 541 (12.6%) |
| 7:30 AM to 7:59 AM | 479 (9.9%) | 756 (17.6%) |
| 8:00 AM to 8:29 AM | 283 (5.9%) | 663 (15.4%) |
| 8:30 AM to 8:59 AM | 8 (0.2%) | 141 (3.3%) |
| 9:00 AM to 9:59 AM | 98 (2.0%) | 185 (4.3%) |
| 10:00 AM to 10:59 AM | 46 (0.9%) | 21 (0.5%) |
| 11:00 AM to 11:59 AM | 2 (0.0%) | 33 (0.8%) |
| 12:00 PM to 3:59 PM | 624 (12.9%) | 373 (8.7%) |
| 4:00 PM to 11:59 PM | 297 (6.1%) | 190 (4.4%) |
| Total | 4,830 (100.0%) | 4,290 (100.0%) |
Housing Occupancy in Dinuba
Occupancy by Ownership in Dinuba
Of the total 6,386 dwellings in Dinuba, owner-occupied units account for 3,772 (59.1%), while renter-occupied units make up 2,614 (40.9%).
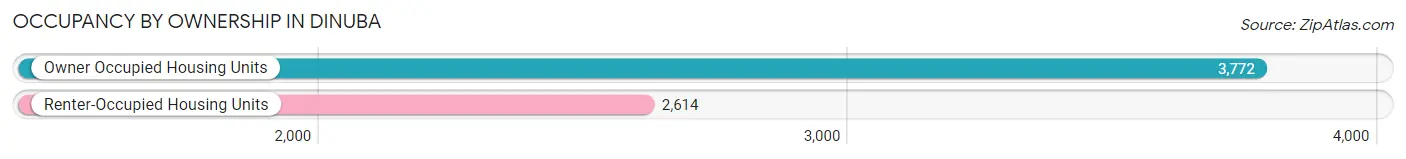
| Occupancy | # Housing Units | % Housing Units |
| Owner Occupied Housing Units | 3,772 | 59.1% |
| Renter-Occupied Housing Units | 2,614 | 40.9% |
| Total Occupied Housing Units | 6,386 | 100.0% |
Occupancy by Household Size in Dinuba
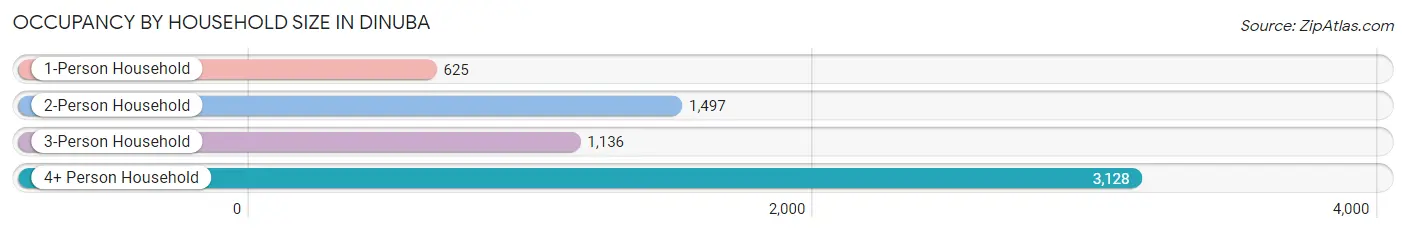
| Household Size | # Housing Units | % Housing Units |
| 1-Person Household | 625 | 9.8% |
| 2-Person Household | 1,497 | 23.4% |
| 3-Person Household | 1,136 | 17.8% |
| 4+ Person Household | 3,128 | 49.0% |
| Total Housing Units | 6,386 | 100.0% |
Occupancy by Ownership by Household Size in Dinuba
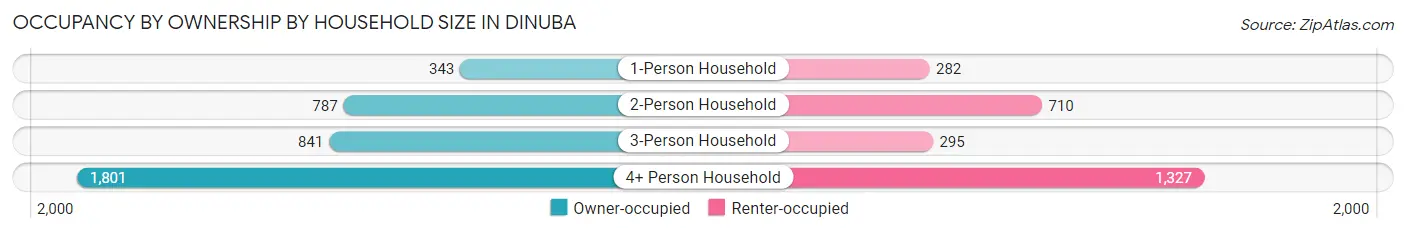
| Household Size | Owner-occupied | Renter-occupied |
| 1-Person Household | 343 (54.9%) | 282 (45.1%) |
| 2-Person Household | 787 (52.6%) | 710 (47.4%) |
| 3-Person Household | 841 (74.0%) | 295 (26.0%) |
| 4+ Person Household | 1,801 (57.6%) | 1,327 (42.4%) |
| Total Housing Units | 3,772 (59.1%) | 2,614 (40.9%) |
Occupancy by Educational Attainment in Dinuba
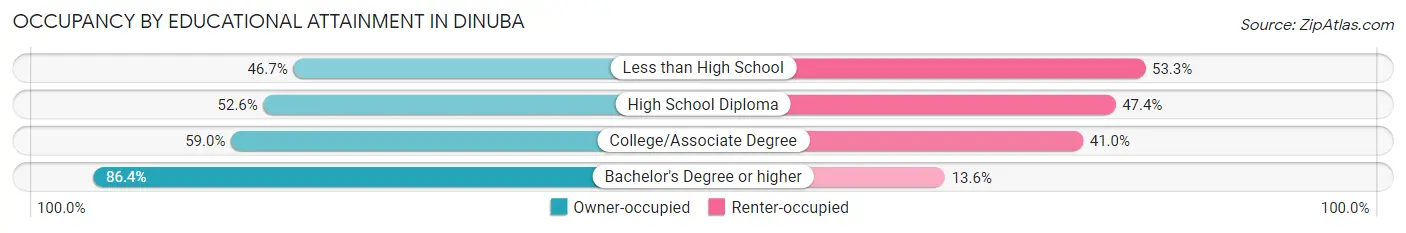
| Household Size | Owner-occupied | Renter-occupied |
| Less than High School | 692 (46.7%) | 790 (53.3%) |
| High School Diploma | 959 (52.6%) | 864 (47.4%) |
| College/Associate Degree | 1,167 (59.0%) | 810 (41.0%) |
| Bachelor's Degree or higher | 954 (86.4%) | 150 (13.6%) |
Occupancy by Age of Householder in Dinuba
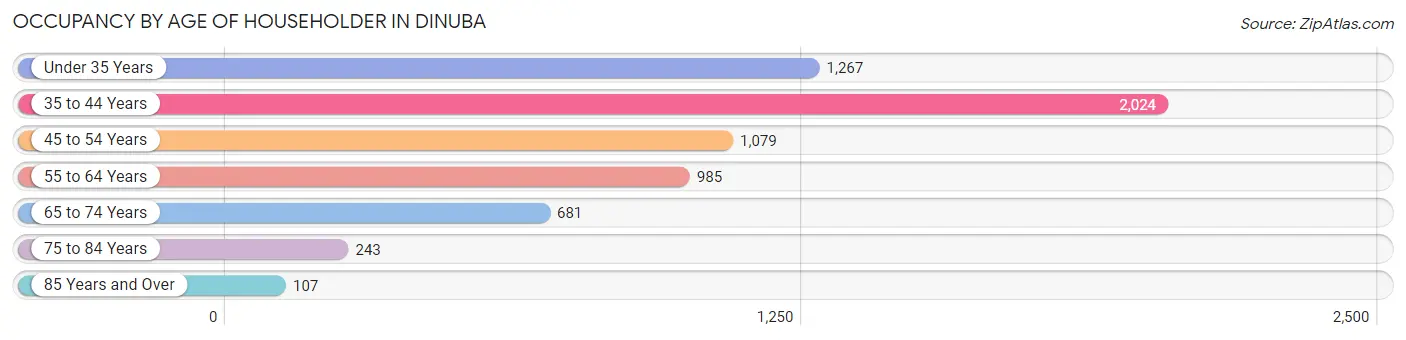
| Age Bracket | # Households | % Households |
| Under 35 Years | 1,267 | 19.8% |
| 35 to 44 Years | 2,024 | 31.7% |
| 45 to 54 Years | 1,079 | 16.9% |
| 55 to 64 Years | 985 | 15.4% |
| 65 to 74 Years | 681 | 10.7% |
| 75 to 84 Years | 243 | 3.8% |
| 85 Years and Over | 107 | 1.7% |
| Total | 6,386 | 100.0% |
Housing Finances in Dinuba
Median Income by Occupancy in Dinuba
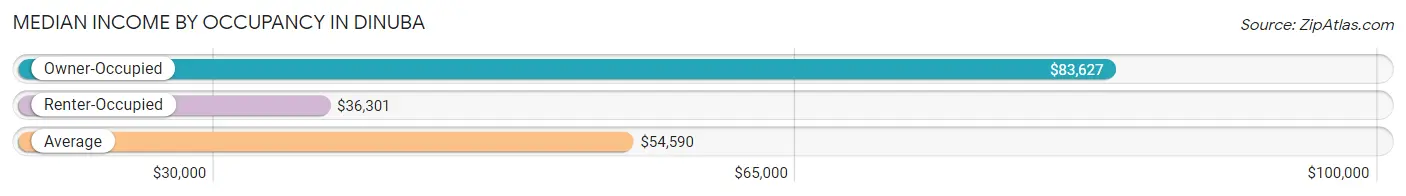
| Occupancy Type | # Households | Median Income |
| Owner-Occupied | 3,772 (59.1%) | $83,627 |
| Renter-Occupied | 2,614 (40.9%) | $36,301 |
| Average | 6,386 (100.0%) | $54,590 |
Occupancy by Householder Income Bracket in Dinuba
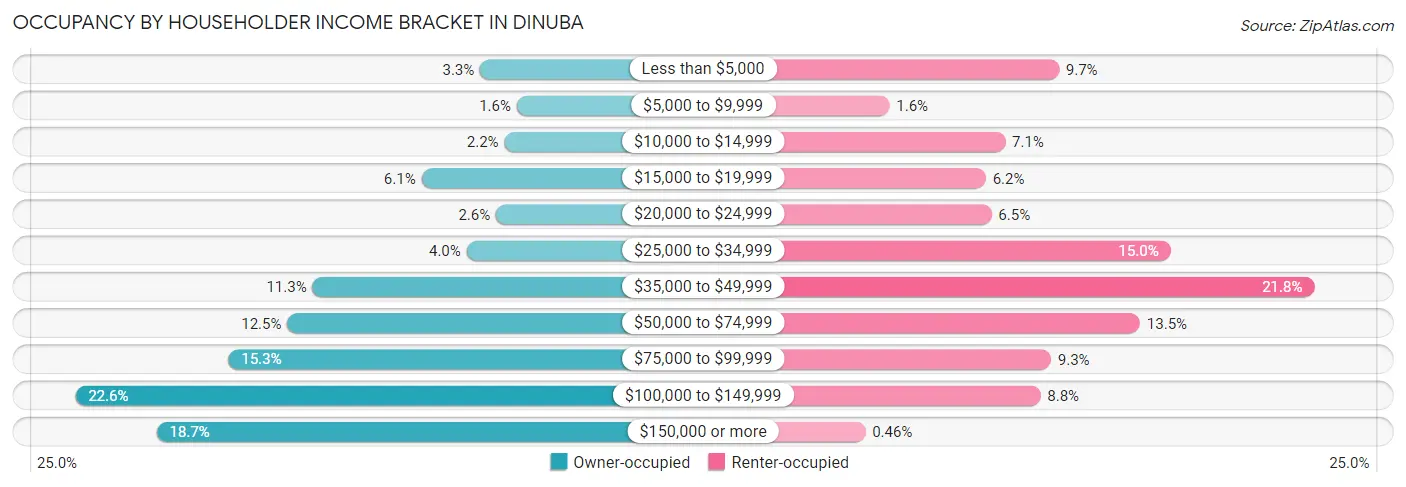
| Income Bracket | Owner-occupied | Renter-occupied |
| Less than $5,000 | 125 (3.3%) | 253 (9.7%) |
| $5,000 to $9,999 | 59 (1.6%) | 42 (1.6%) |
| $10,000 to $14,999 | 81 (2.1%) | 186 (7.1%) |
| $15,000 to $19,999 | 230 (6.1%) | 162 (6.2%) |
| $20,000 to $24,999 | 96 (2.5%) | 169 (6.5%) |
| $25,000 to $34,999 | 149 (4.0%) | 392 (15.0%) |
| $35,000 to $49,999 | 426 (11.3%) | 571 (21.8%) |
| $50,000 to $74,999 | 471 (12.5%) | 354 (13.5%) |
| $75,000 to $99,999 | 577 (15.3%) | 243 (9.3%) |
| $100,000 to $149,999 | 852 (22.6%) | 230 (8.8%) |
| $150,000 or more | 706 (18.7%) | 12 (0.5%) |
| Total | 3,772 (100.0%) | 2,614 (100.0%) |
Monthly Housing Cost Tiers in Dinuba
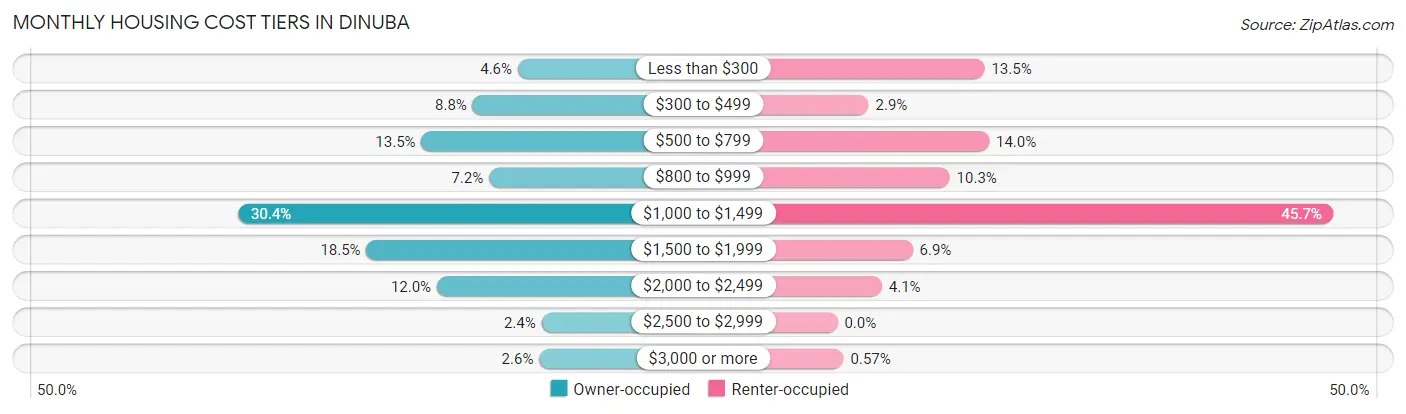
| Monthly Cost | Owner-occupied | Renter-occupied |
| Less than $300 | 173 (4.6%) | 354 (13.5%) |
| $300 to $499 | 330 (8.7%) | 75 (2.9%) |
| $500 to $799 | 508 (13.5%) | 365 (14.0%) |
| $800 to $999 | 273 (7.2%) | 270 (10.3%) |
| $1,000 to $1,499 | 1,145 (30.4%) | 1,194 (45.7%) |
| $1,500 to $1,999 | 699 (18.5%) | 181 (6.9%) |
| $2,000 to $2,499 | 454 (12.0%) | 107 (4.1%) |
| $2,500 to $2,999 | 91 (2.4%) | 0 (0.0%) |
| $3,000 or more | 99 (2.6%) | 15 (0.6%) |
| Total | 3,772 (100.0%) | 2,614 (100.0%) |
Physical Housing Characteristics in Dinuba
Housing Structures in Dinuba
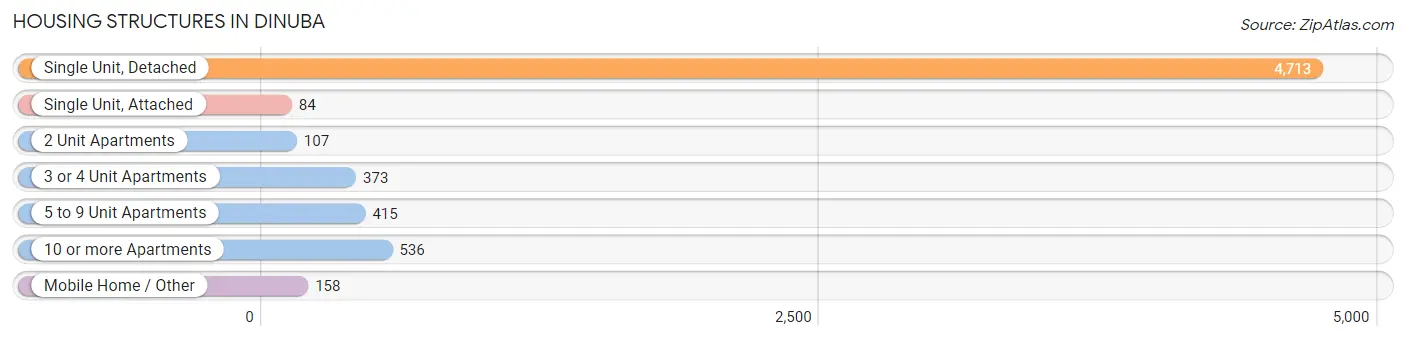
| Structure Type | # Housing Units | % Housing Units |
| Single Unit, Detached | 4,713 | 73.8% |
| Single Unit, Attached | 84 | 1.3% |
| 2 Unit Apartments | 107 | 1.7% |
| 3 or 4 Unit Apartments | 373 | 5.8% |
| 5 to 9 Unit Apartments | 415 | 6.5% |
| 10 or more Apartments | 536 | 8.4% |
| Mobile Home / Other | 158 | 2.5% |
| Total | 6,386 | 100.0% |
Housing Structures by Occupancy in Dinuba
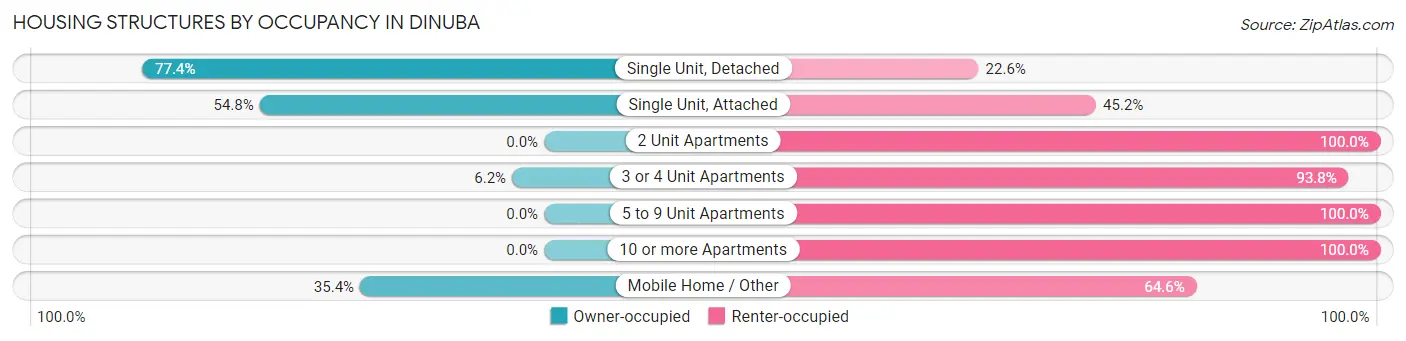
| Structure Type | Owner-occupied | Renter-occupied |
| Single Unit, Detached | 3,647 (77.4%) | 1,066 (22.6%) |
| Single Unit, Attached | 46 (54.8%) | 38 (45.2%) |
| 2 Unit Apartments | 0 (0.0%) | 107 (100.0%) |
| 3 or 4 Unit Apartments | 23 (6.2%) | 350 (93.8%) |
| 5 to 9 Unit Apartments | 0 (0.0%) | 415 (100.0%) |
| 10 or more Apartments | 0 (0.0%) | 536 (100.0%) |
| Mobile Home / Other | 56 (35.4%) | 102 (64.6%) |
| Total | 3,772 (59.1%) | 2,614 (40.9%) |
Housing Structures by Number of Rooms in Dinuba
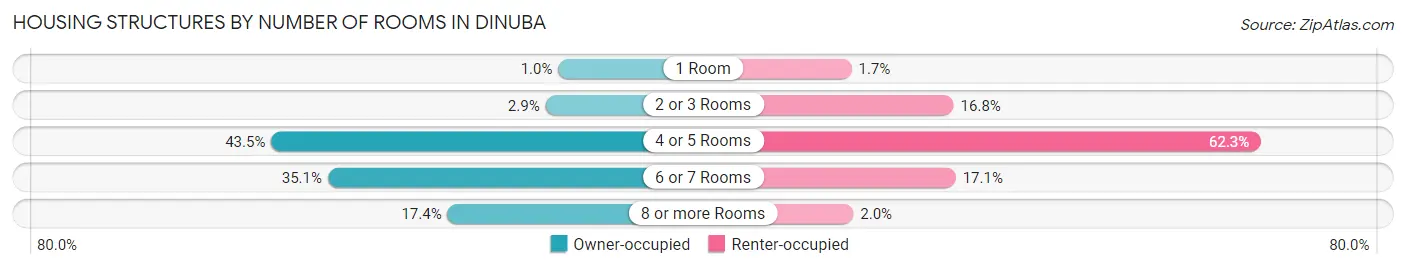
| Number of Rooms | Owner-occupied | Renter-occupied |
| 1 Room | 39 (1.0%) | 45 (1.7%) |
| 2 or 3 Rooms | 110 (2.9%) | 440 (16.8%) |
| 4 or 5 Rooms | 1,641 (43.5%) | 1,629 (62.3%) |
| 6 or 7 Rooms | 1,325 (35.1%) | 448 (17.1%) |
| 8 or more Rooms | 657 (17.4%) | 52 (2.0%) |
| Total | 3,772 (100.0%) | 2,614 (100.0%) |
Housing Structure by Heating Type in Dinuba
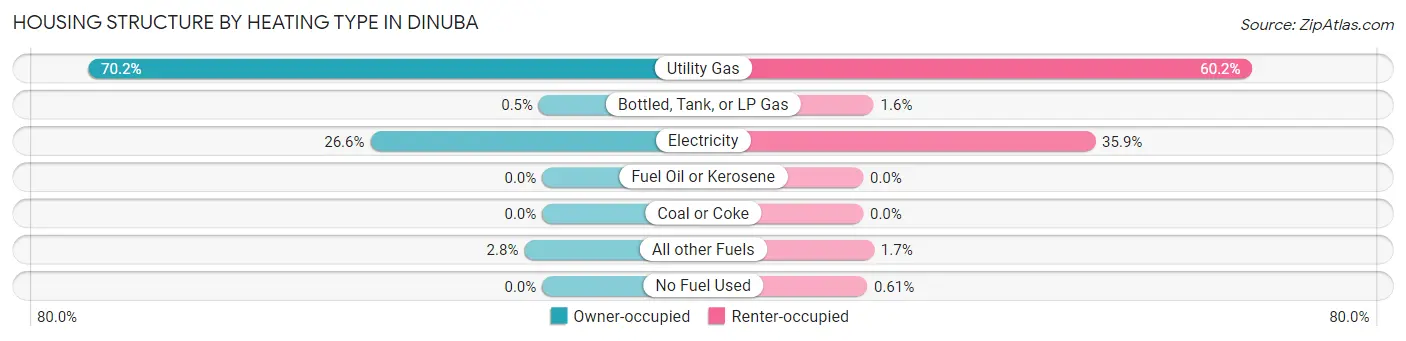
| Heating Type | Owner-occupied | Renter-occupied |
| Utility Gas | 2,647 (70.2%) | 1,573 (60.2%) |
| Bottled, Tank, or LP Gas | 19 (0.5%) | 43 (1.6%) |
| Electricity | 1,002 (26.6%) | 938 (35.9%) |
| Fuel Oil or Kerosene | 0 (0.0%) | 0 (0.0%) |
| Coal or Coke | 0 (0.0%) | 0 (0.0%) |
| All other Fuels | 104 (2.8%) | 44 (1.7%) |
| No Fuel Used | 0 (0.0%) | 16 (0.6%) |
| Total | 3,772 (100.0%) | 2,614 (100.0%) |
Household Vehicle Usage in Dinuba
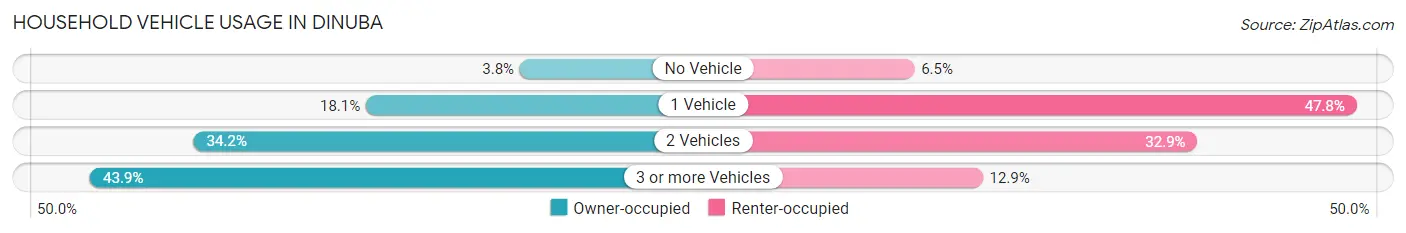
| Vehicles per Household | Owner-occupied | Renter-occupied |
| No Vehicle | 142 (3.8%) | 169 (6.5%) |
| 1 Vehicle | 684 (18.1%) | 1,249 (47.8%) |
| 2 Vehicles | 1,291 (34.2%) | 860 (32.9%) |
| 3 or more Vehicles | 1,655 (43.9%) | 336 (12.9%) |
| Total | 3,772 (100.0%) | 2,614 (100.0%) |
Real Estate & Mortgages in Dinuba
Real Estate and Mortgage Overview in Dinuba
| Characteristic | Without Mortgage | With Mortgage |
| Housing Units | 1,022 | 2,750 |
| Median Property Value | $231,400 | $263,900 |
| Median Household Income | $49,333 | $662 |
| Monthly Housing Costs | $569 | $99 |
| Real Estate Taxes | $1,870 | $142 |
Property Value by Mortgage Status in Dinuba
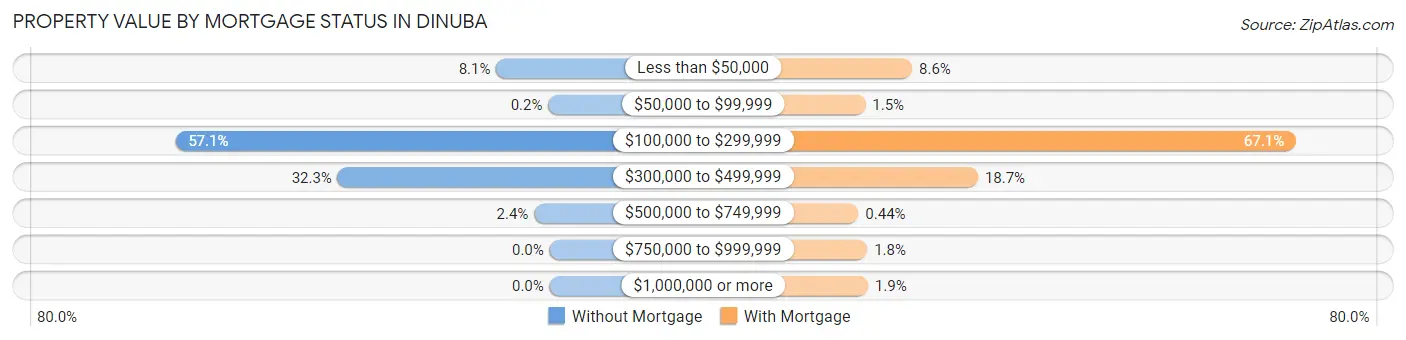
| Property Value | Without Mortgage | With Mortgage |
| Less than $50,000 | 83 (8.1%) | 237 (8.6%) |
| $50,000 to $99,999 | 2 (0.2%) | 41 (1.5%) |
| $100,000 to $299,999 | 583 (57.1%) | 1,846 (67.1%) |
| $300,000 to $499,999 | 330 (32.3%) | 513 (18.6%) |
| $500,000 to $749,999 | 24 (2.4%) | 12 (0.4%) |
| $750,000 to $999,999 | 0 (0.0%) | 49 (1.8%) |
| $1,000,000 or more | 0 (0.0%) | 52 (1.9%) |
| Total | 1,022 (100.0%) | 2,750 (100.0%) |
Household Income by Mortgage Status in Dinuba
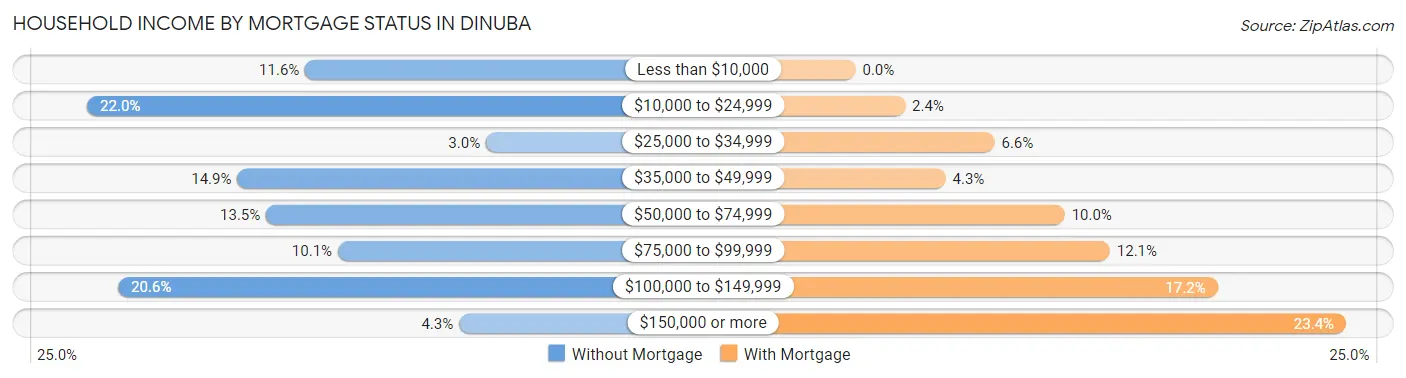
| Household Income | Without Mortgage | With Mortgage |
| Less than $10,000 | 119 (11.6%) | 0 (0.0%) |
| $10,000 to $24,999 | 225 (22.0%) | 65 (2.4%) |
| $25,000 to $34,999 | 31 (3.0%) | 182 (6.6%) |
| $35,000 to $49,999 | 152 (14.9%) | 118 (4.3%) |
| $50,000 to $74,999 | 138 (13.5%) | 274 (10.0%) |
| $75,000 to $99,999 | 103 (10.1%) | 333 (12.1%) |
| $100,000 to $149,999 | 210 (20.5%) | 474 (17.2%) |
| $150,000 or more | 44 (4.3%) | 642 (23.4%) |
| Total | 1,022 (100.0%) | 2,750 (100.0%) |
Property Value to Household Income Ratio in Dinuba
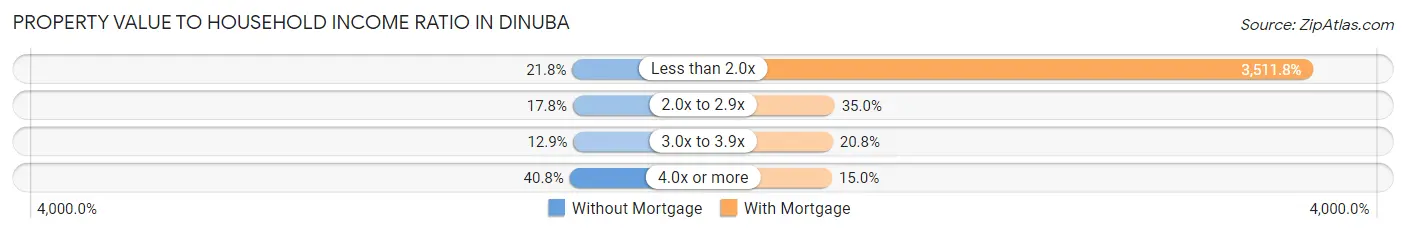
| Value-to-Income Ratio | Without Mortgage | With Mortgage |
| Less than 2.0x | 223 (21.8%) | 96,574 (3,511.8%) |
| 2.0x to 2.9x | 182 (17.8%) | 961 (34.9%) |
| 3.0x to 3.9x | 132 (12.9%) | 572 (20.8%) |
| 4.0x or more | 417 (40.8%) | 413 (15.0%) |
| Total | 1,022 (100.0%) | 2,750 (100.0%) |
Real Estate Taxes by Mortgage Status in Dinuba
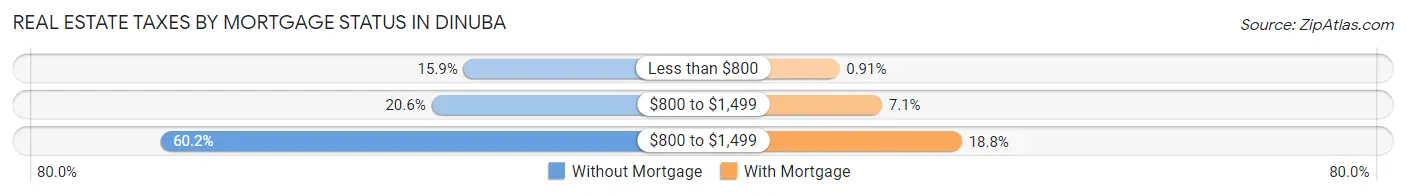
| Property Taxes | Without Mortgage | With Mortgage |
| Less than $800 | 162 (15.9%) | 25 (0.9%) |
| $800 to $1,499 | 210 (20.5%) | 196 (7.1%) |
| $800 to $1,499 | 615 (60.2%) | 517 (18.8%) |
| Total | 1,022 (100.0%) | 2,750 (100.0%) |
Health & Disability in Dinuba
Health Insurance Coverage by Age in Dinuba
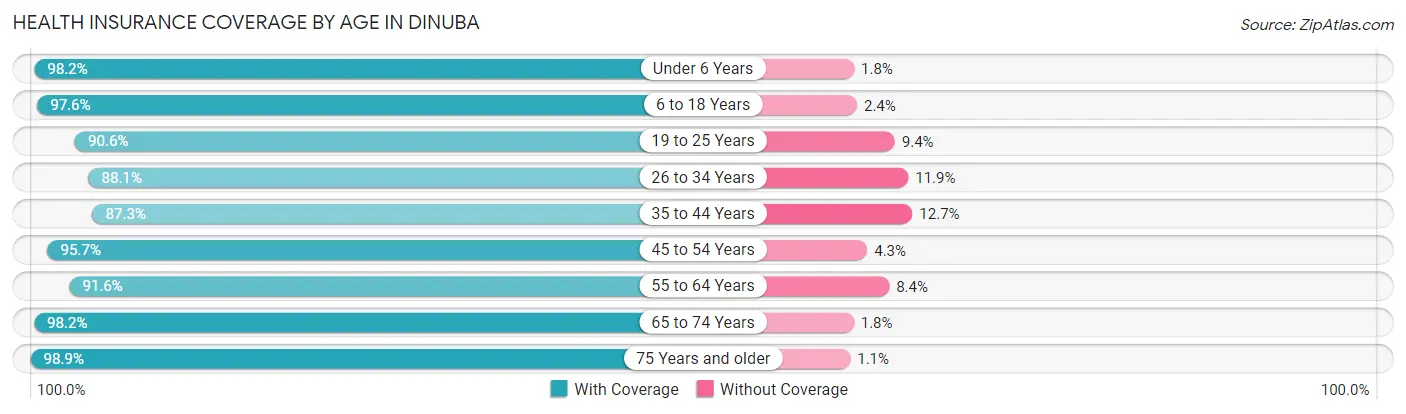
| Age Bracket | With Coverage | Without Coverage |
| Under 6 Years | 2,253 (98.2%) | 42 (1.8%) |
| 6 to 18 Years | 6,616 (97.6%) | 161 (2.4%) |
| 19 to 25 Years | 2,555 (90.6%) | 266 (9.4%) |
| 26 to 34 Years | 2,494 (88.1%) | 338 (11.9%) |
| 35 to 44 Years | 3,074 (87.3%) | 447 (12.7%) |
| 45 to 54 Years | 2,144 (95.7%) | 96 (4.3%) |
| 55 to 64 Years | 1,839 (91.6%) | 168 (8.4%) |
| 65 to 74 Years | 1,274 (98.2%) | 23 (1.8%) |
| 75 Years and older | 796 (98.9%) | 9 (1.1%) |
| Total | 23,045 (93.7%) | 1,550 (6.3%) |
Health Insurance Coverage by Citizenship Status in Dinuba
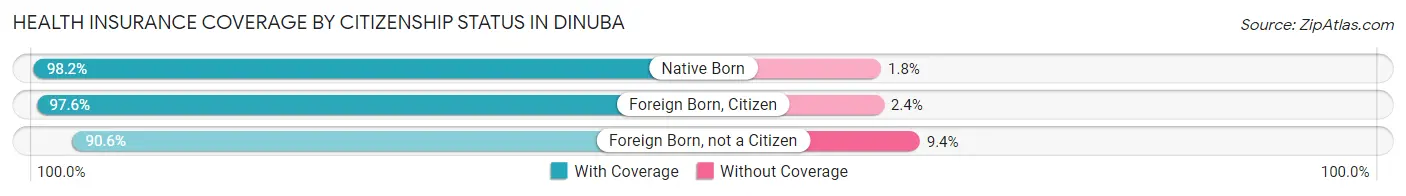
| Citizenship Status | With Coverage | Without Coverage |
| Native Born | 2,253 (98.2%) | 42 (1.8%) |
| Foreign Born, Citizen | 6,616 (97.6%) | 161 (2.4%) |
| Foreign Born, not a Citizen | 2,555 (90.6%) | 266 (9.4%) |
Health Insurance Coverage by Household Income in Dinuba
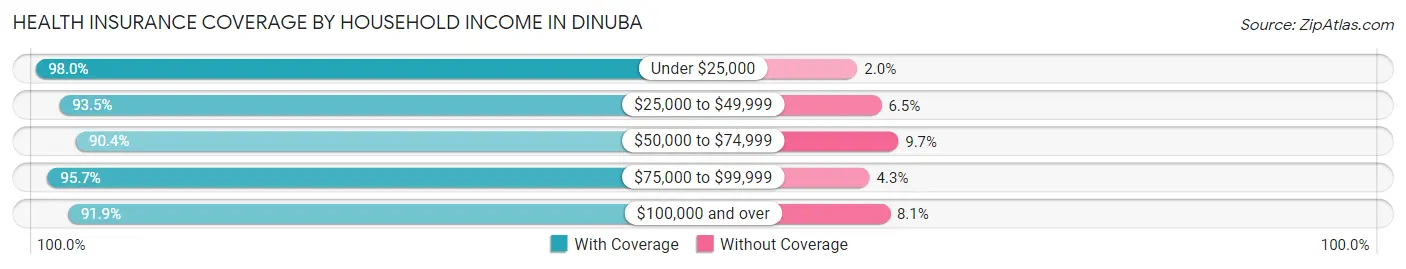
| Household Income | With Coverage | Without Coverage |
| Under $25,000 | 4,522 (98.0%) | 92 (2.0%) |
| $25,000 to $49,999 | 4,941 (93.5%) | 343 (6.5%) |
| $50,000 to $74,999 | 3,023 (90.3%) | 323 (9.7%) |
| $75,000 to $99,999 | 2,974 (95.7%) | 133 (4.3%) |
| $100,000 and over | 7,456 (91.9%) | 656 (8.1%) |
Public vs Private Health Insurance Coverage by Age in Dinuba
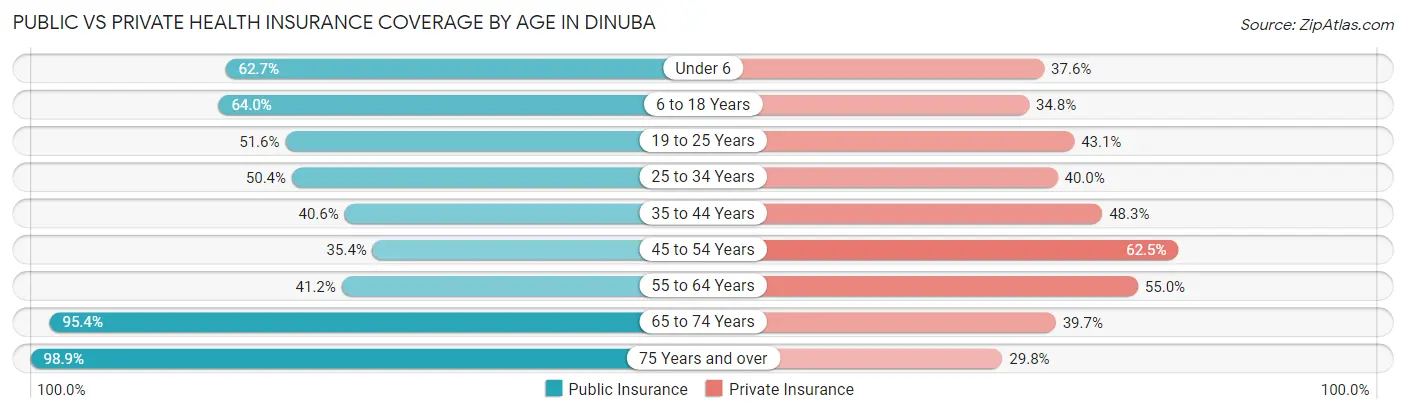
| Age Bracket | Public Insurance | Private Insurance |
| Under 6 | 1,439 (62.7%) | 862 (37.6%) |
| 6 to 18 Years | 4,338 (64.0%) | 2,355 (34.7%) |
| 19 to 25 Years | 1,456 (51.6%) | 1,217 (43.1%) |
| 25 to 34 Years | 1,427 (50.4%) | 1,134 (40.0%) |
| 35 to 44 Years | 1,430 (40.6%) | 1,702 (48.3%) |
| 45 to 54 Years | 793 (35.4%) | 1,399 (62.5%) |
| 55 to 64 Years | 826 (41.2%) | 1,103 (55.0%) |
| 65 to 74 Years | 1,237 (95.4%) | 515 (39.7%) |
| 75 Years and over | 796 (98.9%) | 240 (29.8%) |
| Total | 13,742 (55.9%) | 10,527 (42.8%) |
Disability Status by Sex by Age in Dinuba
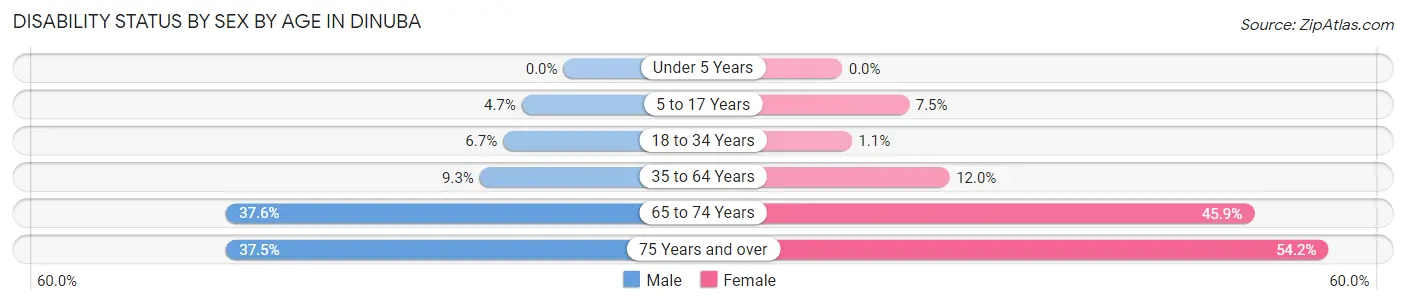
| Age Bracket | Male | Female |
| Under 5 Years | 0 (0.0%) | 0 (0.0%) |
| 5 to 17 Years | 162 (4.6%) | 227 (7.5%) |
| 18 to 34 Years | 207 (6.7%) | 34 (1.1%) |
| 35 to 64 Years | 342 (9.3%) | 490 (12.0%) |
| 65 to 74 Years | 208 (37.6%) | 341 (45.9%) |
| 75 Years and over | 140 (37.5%) | 234 (54.2%) |
Disability Class by Sex by Age in Dinuba
Disability Class: Hearing Difficulty
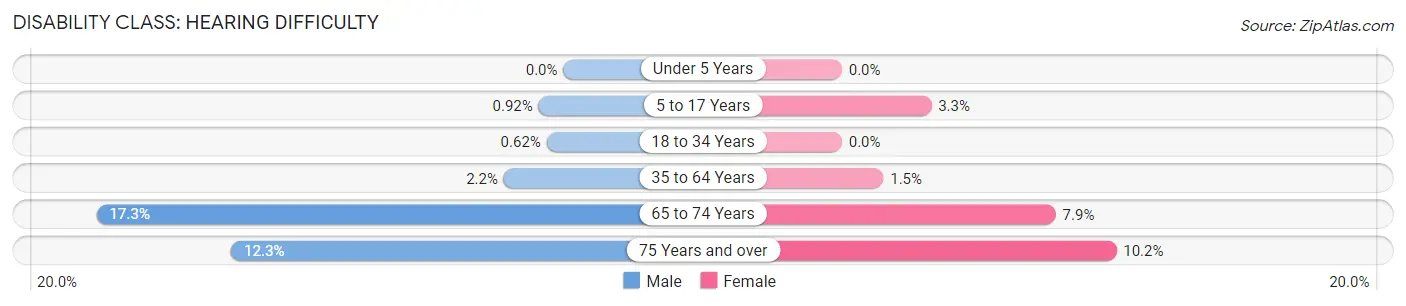
| Age Bracket | Male | Female |
| Under 5 Years | 0 (0.0%) | 0 (0.0%) |
| 5 to 17 Years | 32 (0.9%) | 101 (3.3%) |
| 18 to 34 Years | 19 (0.6%) | 0 (0.0%) |
| 35 to 64 Years | 81 (2.2%) | 63 (1.5%) |
| 65 to 74 Years | 96 (17.3%) | 59 (7.9%) |
| 75 Years and over | 46 (12.3%) | 44 (10.2%) |
Disability Class: Vision Difficulty
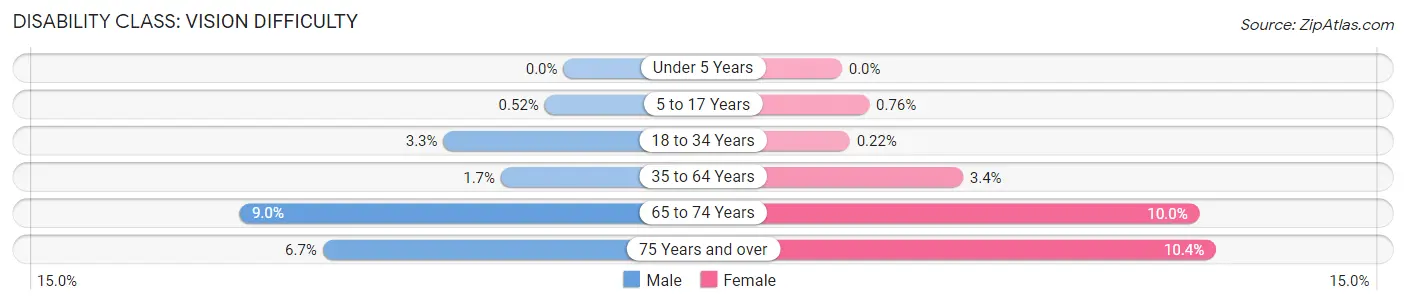
| Age Bracket | Male | Female |
| Under 5 Years | 0 (0.0%) | 0 (0.0%) |
| 5 to 17 Years | 18 (0.5%) | 23 (0.8%) |
| 18 to 34 Years | 103 (3.3%) | 7 (0.2%) |
| 35 to 64 Years | 64 (1.7%) | 138 (3.4%) |
| 65 to 74 Years | 50 (9.0%) | 74 (10.0%) |
| 75 Years and over | 25 (6.7%) | 45 (10.4%) |
Disability Class: Cognitive Difficulty
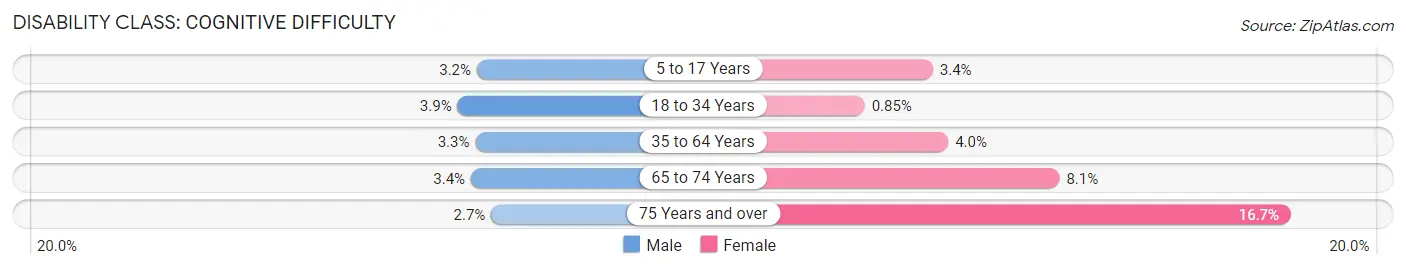
| Age Bracket | Male | Female |
| 5 to 17 Years | 112 (3.2%) | 103 (3.4%) |
| 18 to 34 Years | 121 (3.9%) | 27 (0.9%) |
| 35 to 64 Years | 120 (3.3%) | 162 (4.0%) |
| 65 to 74 Years | 19 (3.4%) | 60 (8.1%) |
| 75 Years and over | 10 (2.7%) | 72 (16.7%) |
Disability Class: Ambulatory Difficulty
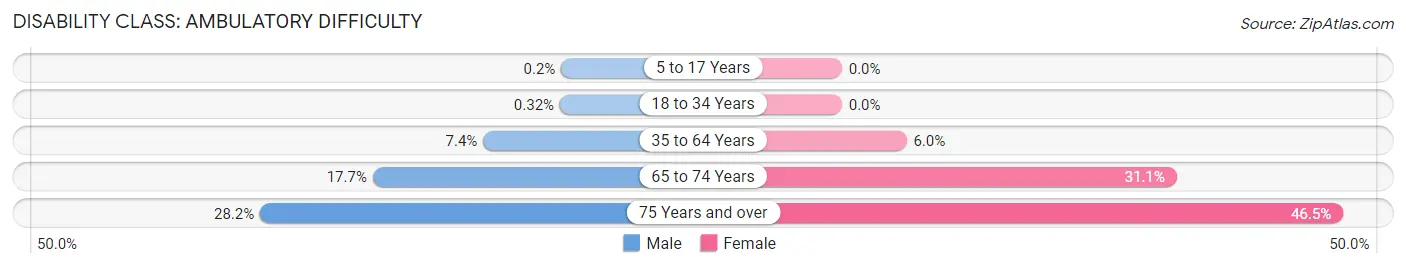
| Age Bracket | Male | Female |
| 5 to 17 Years | 7 (0.2%) | 0 (0.0%) |
| 18 to 34 Years | 10 (0.3%) | 0 (0.0%) |
| 35 to 64 Years | 273 (7.4%) | 246 (6.0%) |
| 65 to 74 Years | 98 (17.7%) | 231 (31.1%) |
| 75 Years and over | 105 (28.1%) | 201 (46.5%) |
Disability Class: Self-Care Difficulty
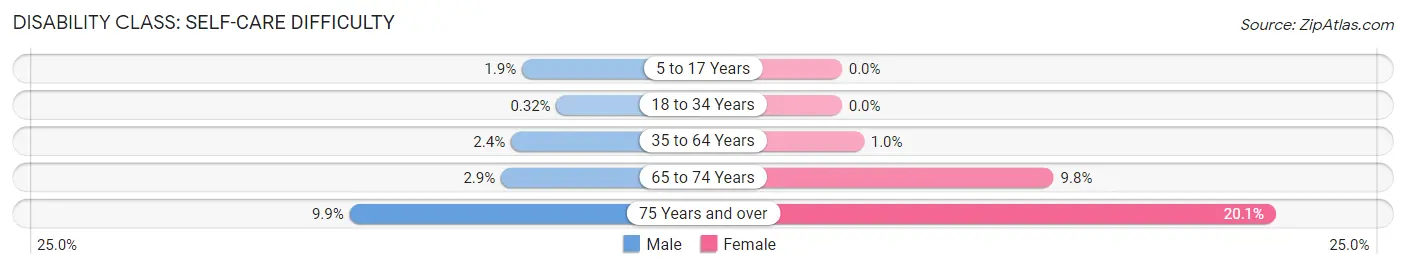
| Age Bracket | Male | Female |
| 5 to 17 Years | 67 (1.9%) | 0 (0.0%) |
| 18 to 34 Years | 10 (0.3%) | 0 (0.0%) |
| 35 to 64 Years | 89 (2.4%) | 42 (1.0%) |
| 65 to 74 Years | 16 (2.9%) | 73 (9.8%) |
| 75 Years and over | 37 (9.9%) | 87 (20.1%) |
Technology Access in Dinuba
Computing Device Access in Dinuba
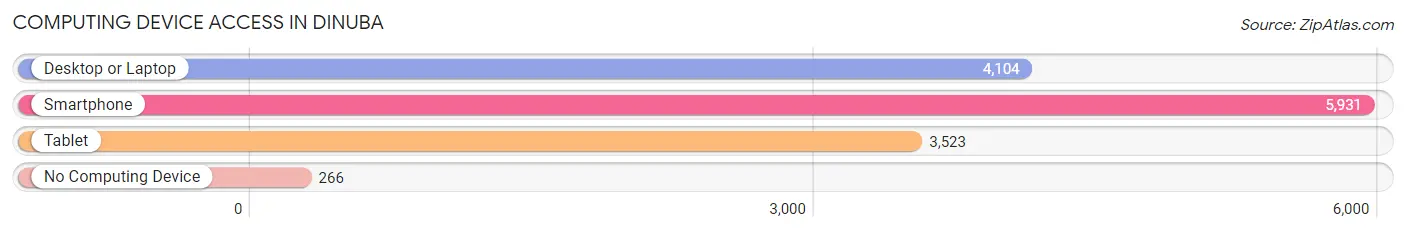
| Device Type | # Households | % Households |
| Desktop or Laptop | 4,104 | 64.3% |
| Smartphone | 5,931 | 92.9% |
| Tablet | 3,523 | 55.2% |
| No Computing Device | 266 | 4.2% |
| Total | 6,386 | 100.0% |
Internet Access in Dinuba
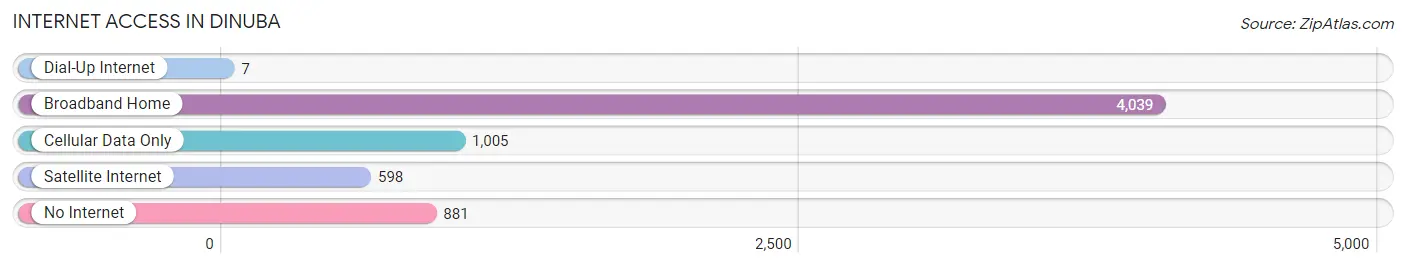
| Internet Type | # Households | % Households |
| Dial-Up Internet | 7 | 0.1% |
| Broadband Home | 4,039 | 63.2% |
| Cellular Data Only | 1,005 | 15.7% |
| Satellite Internet | 598 | 9.4% |
| No Internet | 881 | 13.8% |
| Total | 6,386 | 100.0% |
Dinuba Summary
Dinuba is a city located in Tulare County, California, United States. It is situated in the San Joaquin Valley, approximately 39 miles south of Fresno and 15 miles north of Visalia. The population was 21,453 at the 2010 census.
History
The area that is now Dinuba was originally inhabited by the Yokuts people. The first European to explore the area was Spanish explorer Pedro Fages in 1772. The area was later settled by ranchers in the late 19th century. The town was founded in 1874 by John R. Redding, who named it after his hometown of Dinuba, Illinois. The town was incorporated in 1908.
Geography
Dinuba is located at 36°32'25" North, 119°23'17" West (36.540278, -119.388333). According to the United States Census Bureau, the city has a total area of 5.2 square miles, all of it land.
Economy
Dinuba is a major agricultural center in the San Joaquin Valley. The city is home to a variety of agricultural businesses, including fruit and vegetable packing houses, dairies, and wineries. The city is also home to a number of manufacturing and distribution companies.
Demographics
As of the census of 2000, there were 18,857 people, 5,845 households, and 4,619 families residing in the city. The population density was 3,619.2 people per square mile (1,400.2/km²). There were 6,093 housing units at an average density of 1,179.2 per square mile (455.7/km²). The racial makeup of the city was 57.2% White, 0.7% African American, 1.2% Native American, 0.7% Asian, 0.1% Pacific Islander, 37.2% from other races, and 3.0% from two or more races. Hispanic or Latino of any race were 64.2% of the population.
There were 5,845 households out of which 41.2% had children under the age of 18 living with them, 54.2% were married couples living together, 15.2% had a female householder with no husband present, and 24.2% were non-families. 20.2% of all households were made up of individuals and 9.2% had someone living alone who was 65 years of age or older. The average household size was 3.17 and the average family size was 3.68.
In the city, the population was spread out with 33.2% under the age of 18, 10.7% from 18 to 24, 27.2% from 25 to 44, 17.7% from 45 to 64, and 11.2% who were 65 years of age or older. The median age was 30 years. For every 100 females, there were 95.2 males. For every 100 females age 18 and over, there were 91.2 males.
The median income for a household in the city was $27,845, and the median income for a family was $30,917. Males had a median income of $27,845 versus $20,945 for females. The per capita income for the city was $11,845. About 22.2% of families and 25.7% of the population were below the poverty line, including 33.2% of those under age 18 and 11.2% of those age 65 or over.
Common Questions
What is Per Capita Income in Dinuba?
Per Capita income in Dinuba is $20,547.
What is the Median Family Income in Dinuba?
Median Family Income in Dinuba is $55,477.
What is the Median Household income in Dinuba?
Median Household Income in Dinuba is $54,590.
What is Income or Wage Gap in Dinuba?
Income or Wage Gap in Dinuba is 10.1%.
Women in Dinuba earn 89.9 cents for every dollar earned by a man.
What is Family Income Deficit in Dinuba?
Family Income Deficit in Dinuba is $12,470.
Families that are below poverty line in Dinuba earn $12,470 less on average than the poverty threshold level.
What is Inequality or Gini Index in Dinuba?
Inequality or Gini Index in Dinuba is 0.45.
What is the Total Population of Dinuba?
Total Population of Dinuba is 24,713.
What is the Total Male Population of Dinuba?
Total Male Population of Dinuba is 12,312.
What is the Total Female Population of Dinuba?
Total Female Population of Dinuba is 12,401.
What is the Ratio of Males per 100 Females in Dinuba?
There are 99.28 Males per 100 Females in Dinuba.
What is the Ratio of Females per 100 Males in Dinuba?
There are 100.72 Females per 100 Males in Dinuba.
What is the Median Population Age in Dinuba?
Median Population Age in Dinuba is 28.2 Years.
What is the Average Family Size in Dinuba
Average Family Size in Dinuba is 4.1 People.
What is the Average Household Size in Dinuba
Average Household Size in Dinuba is 3.8 People.
How Large is the Labor Force in Dinuba?
There are 10,989 People in the Labor Forcein in Dinuba.
What is the Percentage of People in the Labor Force in Dinuba?
64.3% of People are in the Labor Force in Dinuba.
What is the Unemployment Rate in Dinuba?
Unemployment Rate in Dinuba is 11.0%.