Cities with the Lowest Percentage of Births to Unmarried Women over the Age of 35 in Missouri
RELATED REPORTS & OPTIONS
Lowest Illegitimacy | Women 35+
Missouri
Compare Cities
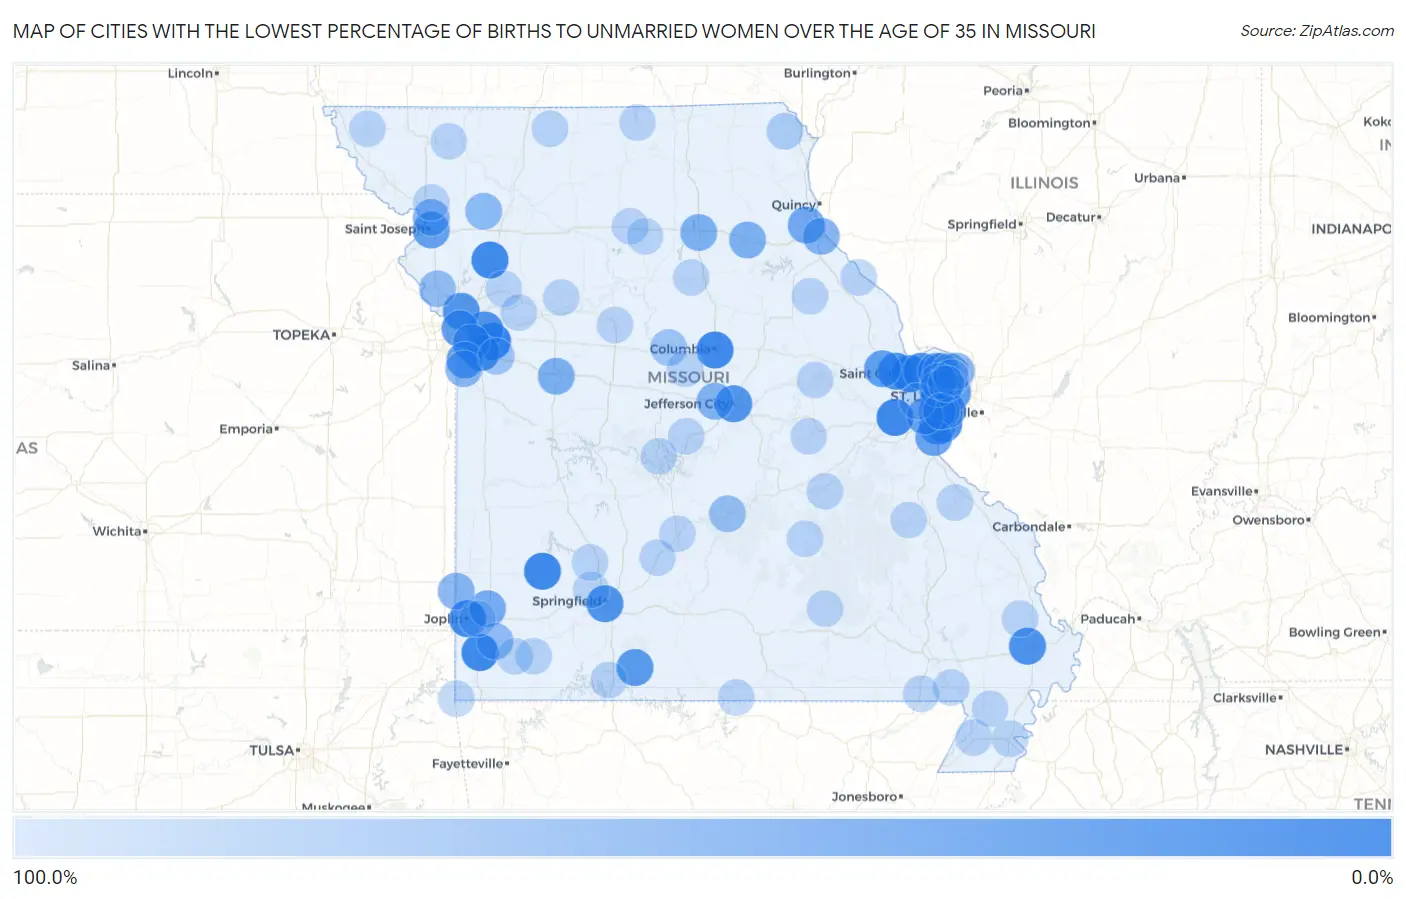
Map of Cities with the Lowest Percentage of Births to Unmarried Women over the Age of 35 in Missouri
100.0%
0.0%
Cities with the Lowest Percentage of Births to Unmarried Women over the Age of 35 in Missouri
| City | % Unmarried | vs State | vs National | |
| 1. | Blue Springs | 1.1% | 19.2%(-18.1)#1 | 20.1%(-19.0)#8 |
| 2. | St Peters | 2.4% | 19.2%(-16.8)#2 | 20.1%(-17.7)#38 |
| 3. | Greenfield | 5.3% | 19.2%(-13.9)#3 | 20.1%(-14.8)#135 |
| 4. | Neosho | 5.7% | 19.2%(-13.5)#4 | 20.1%(-14.4)#151 |
| 5. | Pacific | 6.5% | 19.2%(-12.7)#5 | 20.1%(-13.6)#187 |
| 6. | Columbia | 7.9% | 19.2%(-11.3)#6 | 20.1%(-12.2)#248 |
| 7. | Lathrop | 8.5% | 19.2%(-10.7)#7 | 20.1%(-11.6)#281 |
| 8. | Joplin | 13.1% | 19.2%(-6.10)#8 | 20.1%(-7.00)#497 |
| 9. | Oakville | 14.7% | 19.2%(-4.50)#9 | 20.1%(-5.40)#598 |
| 10. | O Fallon | 15.4% | 19.2%(-3.80)#10 | 20.1%(-4.70)#637 |
| 11. | Webster Groves | 16.7% | 19.2%(-2.50)#11 | 20.1%(-3.40)#708 |
| 12. | Sikeston | 16.9% | 19.2%(-2.30)#12 | 20.1%(-3.20)#729 |
| 13. | Affton | 17.8% | 19.2%(-1.40)#13 | 20.1%(-2.30)#768 |
| 14. | Independence | 18.8% | 19.2%(-0.400)#14 | 20.1%(-1.30)#825 |
| 15. | Rock Hill | 19.8% | 19.2%(+0.600)#15 | 20.1%(-0.300)#865 |
| 16. | Springfield | 19.9% | 19.2%(+0.700)#16 | 20.1%(-0.200)#868 |
| 17. | Lee S Summit | 20.3% | 19.2%(+1.10)#17 | 20.1%(+0.200)#895 |
| 18. | St Charles | 20.8% | 19.2%(+1.60)#18 | 20.1%(+0.700)#916 |
| 19. | Jefferson City | 21.4% | 19.2%(+2.20)#19 | 20.1%(+1.30)#948 |
| 20. | Gladstone | 24.5% | 19.2%(+5.30)#20 | 20.1%(+4.40)#1,084 |
| 21. | Arnold | 26.3% | 19.2%(+7.10)#21 | 20.1%(+6.20)#1,173 |
| 22. | University City | 26.7% | 19.2%(+7.50)#22 | 20.1%(+6.60)#1,185 |
| 23. | St Louis | 26.9% | 19.2%(+7.70)#23 | 20.1%(+6.80)#1,195 |
| 24. | Taneyville | 27.3% | 19.2%(+8.10)#24 | 20.1%(+7.20)#1,220 |
| 25. | Kansas City | 28.6% | 19.2%(+9.40)#25 | 20.1%(+8.50)#1,274 |
| 26. | Raytown | 30.2% | 19.2%(+11.0)#26 | 20.1%(+10.1)#1,354 |
| 27. | Lemay | 30.2% | 19.2%(+11.0)#27 | 20.1%(+10.1)#1,356 |
| 28. | Hazelwood | 31.6% | 19.2%(+12.4)#28 | 20.1%(+11.5)#1,406 |
| 29. | Sappington | 32.0% | 19.2%(+12.8)#29 | 20.1%(+11.9)#1,420 |
| 30. | Grandview | 33.3% | 19.2%(+14.1)#30 | 20.1%(+13.2)#1,462 |
| 31. | Wentzville | 33.6% | 19.2%(+14.4)#31 | 20.1%(+13.5)#1,512 |
| 32. | St Joseph | 35.1% | 19.2%(+15.9)#32 | 20.1%(+15.0)#1,569 |
| 33. | Barnhart | 38.7% | 19.2%(+19.5)#33 | 20.1%(+18.6)#1,707 |
| 34. | Murphy | 43.8% | 19.2%(+24.6)#34 | 20.1%(+23.7)#1,864 |
| 35. | Florissant | 44.8% | 19.2%(+25.6)#35 | 20.1%(+24.7)#1,900 |
| 36. | Palmyra | 45.0% | 19.2%(+25.8)#36 | 20.1%(+24.9)#1,906 |
| 37. | Olivette | 46.2% | 19.2%(+27.0)#37 | 20.1%(+26.1)#1,940 |
| 38. | Carthage | 48.3% | 19.2%(+29.1)#38 | 20.1%(+28.2)#1,996 |
| 39. | Warrensburg | 54.1% | 19.2%(+34.9)#39 | 20.1%(+34.0)#2,171 |
| 40. | Macon | 55.0% | 19.2%(+35.8)#40 | 20.1%(+34.9)#2,190 |
| 41. | Shelbina | 55.6% | 19.2%(+36.4)#41 | 20.1%(+35.5)#2,201 |
| 42. | Country Club | 57.1% | 19.2%(+37.9)#42 | 20.1%(+37.0)#2,231 |
| 43. | Hannibal | 57.6% | 19.2%(+38.4)#43 | 20.1%(+37.5)#2,247 |
| 44. | St Martins | 58.3% | 19.2%(+39.1)#44 | 20.1%(+38.2)#2,264 |
| 45. | Spanish Lake | 59.4% | 19.2%(+40.2)#45 | 20.1%(+39.3)#2,282 |
| 46. | Asbury | 60.0% | 19.2%(+40.8)#46 | 20.1%(+39.9)#2,305 |
| 47. | Belton | 64.3% | 19.2%(+45.1)#47 | 20.1%(+44.2)#2,398 |
| 48. | Maysville | 66.7% | 19.2%(+47.5)#48 | 20.1%(+46.6)#2,463 |
| 49. | Granby | 69.2% | 19.2%(+50.0)#49 | 20.1%(+49.1)#2,496 |
| 50. | Platte City | 72.7% | 19.2%(+53.5)#50 | 20.1%(+52.6)#2,542 |
| 51. | Waynesville | 75.0% | 19.2%(+55.8)#51 | 20.1%(+54.9)#2,566 |
| 52. | Boonville | 80.0% | 19.2%(+60.8)#52 | 20.1%(+59.9)#2,624 |
| 53. | Lake Lotawana | 80.0% | 19.2%(+60.8)#53 | 20.1%(+59.9)#2,625 |
| 54. | Kahoka | 92.3% | 19.2%(+73.1)#54 | 20.1%(+72.2)#2,718 |
| 55. | Ballwin | 100.0% | 19.2%(+80.8)#55 | 20.1%(+79.9)#2,747 |
| 56. | Lebanon | 100.0% | 19.2%(+80.8)#56 | 20.1%(+79.9)#2,820 |
| 57. | Marshall | 100.0% | 19.2%(+80.8)#57 | 20.1%(+79.9)#2,841 |
| 58. | Branson | 100.0% | 19.2%(+80.8)#58 | 20.1%(+79.9)#2,855 |
| 59. | Kennett | 100.0% | 19.2%(+80.8)#59 | 20.1%(+79.9)#2,909 |
| 60. | Black Jack | 100.0% | 19.2%(+80.8)#60 | 20.1%(+79.9)#3,026 |
| 61. | Willard | 100.0% | 19.2%(+80.8)#61 | 20.1%(+79.9)#3,033 |
| 62. | Savannah | 100.0% | 19.2%(+80.8)#62 | 20.1%(+79.9)#3,117 |
| 63. | Salem | 100.0% | 19.2%(+80.8)#63 | 20.1%(+79.9)#3,140 |
| 64. | Eldon | 100.0% | 19.2%(+80.8)#64 | 20.1%(+79.9)#3,159 |
| 65. | Brookfield | 100.0% | 19.2%(+80.8)#65 | 20.1%(+79.9)#3,182 |
| 66. | Woodson Terrace | 100.0% | 19.2%(+80.8)#66 | 20.1%(+79.9)#3,196 |
| 67. | Vandalia | 100.0% | 19.2%(+80.8)#67 | 20.1%(+79.9)#3,240 |
| 68. | Louisiana | 100.0% | 19.2%(+80.8)#68 | 20.1%(+79.9)#3,253 |
| 69. | Castle Point | 100.0% | 19.2%(+80.8)#69 | 20.1%(+79.9)#3,287 |
| 70. | Owensville | 100.0% | 19.2%(+80.8)#70 | 20.1%(+79.9)#3,307 |
| 71. | Green Park | 100.0% | 19.2%(+80.8)#71 | 20.1%(+79.9)#3,332 |
| 72. | Hayti | 100.0% | 19.2%(+80.8)#72 | 20.1%(+79.9)#3,386 |
| 73. | Marceline | 100.0% | 19.2%(+80.8)#73 | 20.1%(+79.9)#3,409 |
| 74. | Unionville | 100.0% | 19.2%(+80.8)#74 | 20.1%(+79.9)#3,490 |
| 75. | Huntsville | 100.0% | 19.2%(+80.8)#75 | 20.1%(+79.9)#3,507 |
| 76. | Bismarck | 100.0% | 19.2%(+80.8)#76 | 20.1%(+79.9)#3,536 |
| 77. | Duenweg | 100.0% | 19.2%(+80.8)#77 | 20.1%(+79.9)#3,545 |
| 78. | Steelville | 100.0% | 19.2%(+80.8)#78 | 20.1%(+79.9)#3,564 |
| 79. | Tarkio | 100.0% | 19.2%(+80.8)#79 | 20.1%(+79.9)#3,571 |
| 80. | Purdy | 100.0% | 19.2%(+80.8)#80 | 20.1%(+79.9)#3,595 |
| 81. | Oran | 100.0% | 19.2%(+80.8)#81 | 20.1%(+79.9)#3,659 |
| 82. | Laurie | 100.0% | 19.2%(+80.8)#82 | 20.1%(+79.9)#3,710 |
| 83. | Southwest City | 100.0% | 19.2%(+80.8)#83 | 20.1%(+79.9)#3,712 |
| 84. | Pasadena Park | 100.0% | 19.2%(+80.8)#84 | 20.1%(+79.9)#3,832 |
| 85. | Conway | 100.0% | 19.2%(+80.8)#85 | 20.1%(+79.9)#3,836 |
| 86. | Qulin | 100.0% | 19.2%(+80.8)#86 | 20.1%(+79.9)#3,837 |
| 87. | Gideon | 100.0% | 19.2%(+80.8)#87 | 20.1%(+79.9)#3,843 |
| 88. | Norborne | 100.0% | 19.2%(+80.8)#88 | 20.1%(+79.9)#3,864 |
| 89. | Morrisville | 100.0% | 19.2%(+80.8)#89 | 20.1%(+79.9)#3,916 |
| 90. | Ravenwood | 100.0% | 19.2%(+80.8)#90 | 20.1%(+79.9)#3,933 |
| 91. | Eminence | 100.0% | 19.2%(+80.8)#91 | 20.1%(+79.9)#3,970 |
| 92. | Crystal Lakes | 100.0% | 19.2%(+80.8)#92 | 20.1%(+79.9)#3,974 |
| 93. | Fairview | 100.0% | 19.2%(+80.8)#93 | 20.1%(+79.9)#4,003 |
| 94. | Neelyville | 100.0% | 19.2%(+80.8)#94 | 20.1%(+79.9)#4,051 |
| 95. | Bakersfield | 100.0% | 19.2%(+80.8)#95 | 20.1%(+79.9)#4,099 |
| 96. | Prairie Home | 100.0% | 19.2%(+80.8)#96 | 20.1%(+79.9)#4,114 |
| 97. | Cainsville | 100.0% | 19.2%(+80.8)#97 | 20.1%(+79.9)#4,117 |
| 98. | Weingarten | 100.0% | 19.2%(+80.8)#98 | 20.1%(+79.9)#4,149 |
| 99. | Mckittrick | 100.0% | 19.2%(+80.8)#99 | 20.1%(+79.9)#4,170 |
| 100. | Fleming | 100.0% | 19.2%(+80.8)#100 | 20.1%(+79.9)#4,176 |
Common Questions
What are the Top 10 Cities with the Lowest Percentage of Births to Unmarried Women over the Age of 35 in Missouri?
Top 10 Cities with the Lowest Percentage of Births to Unmarried Women over the Age of 35 in Missouri are:
#1
1.1%
#2
2.4%
#3
5.3%
#4
5.7%
#5
6.5%
#6
7.9%
#7
8.5%
#8
13.1%
#9
14.7%
#10
15.4%
What city has the Lowest Percentage of Births to Unmarried Women over the Age of 35 in Missouri?
Blue Springs has the Lowest Percentage of Births to Unmarried Women over the Age of 35 in Missouri with 1.1%.
What is the Percentage of Births to Unmarried Women over the Age of 35 in the State of Missouri?
Percentage of Births to Unmarried Women over the Age of 35 in Missouri is 19.2%.
What is the Percentage of Births to Unmarried Women over the Age of 35 in the United States?
Percentage of Births to Unmarried Women over the Age of 35 in the United States is 20.1%.