South San Jose Hills, CA Map & Demographics
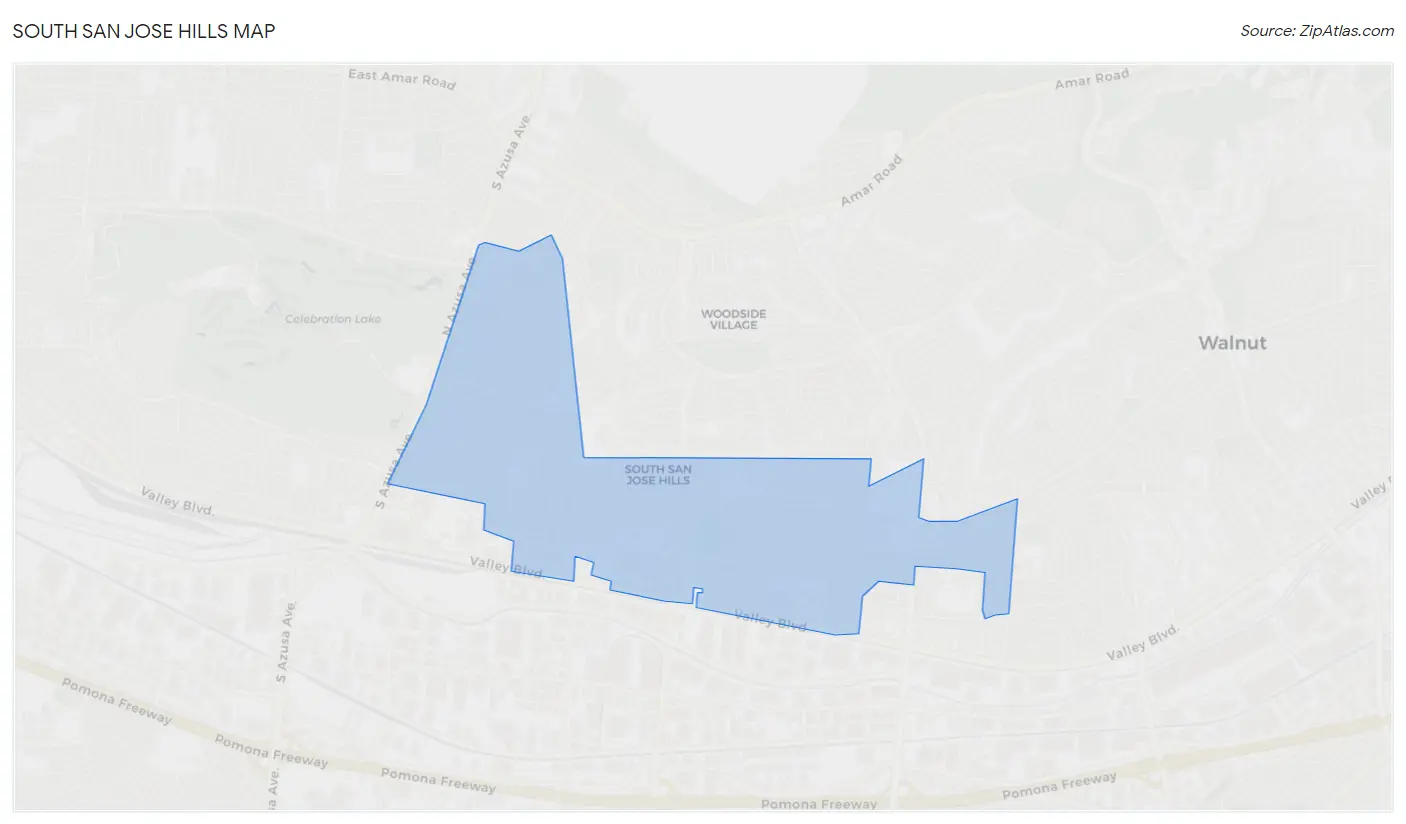
South San Jose Hills Map
South San Jose Hills Overview
$22,919
PER CAPITA INCOME
$83,750
AVG FAMILY INCOME
$87,961
AVG HOUSEHOLD INCOME
22.0%
WAGE / INCOME GAP [ % ]
78.0¢/ $1
WAGE / INCOME GAP [ $ ]
$13,973
FAMILY INCOME DEFICIT
0.34
INEQUALITY / GINI INDEX
18,717
TOTAL POPULATION
9,258
MALE POPULATION
9,459
FEMALE POPULATION
97.88
MALES / 100 FEMALES
102.17
FEMALES / 100 MALES
34.7
MEDIAN AGE
4.4
AVG FAMILY SIZE
4.5
AVG HOUSEHOLD SIZE
9,727
LABOR FORCE [ PEOPLE ]
65.0%
PERCENT IN LABOR FORCE
8.7%
UNEMPLOYMENT RATE
Income in South San Jose Hills
Income Overview in South San Jose Hills
Per Capita Income in South San Jose Hills is $22,919, while median incomes of families and households are $83,750 and $87,961 respectively.
| Characteristic | Number | Measure |
| Per Capita Income | 18,717 | $22,919 |
| Median Family Income | 3,667 | $83,750 |
| Mean Family Income | 3,667 | $91,627 |
| Median Household Income | 4,143 | $87,961 |
| Mean Household Income | 4,143 | $95,624 |
| Income Deficit | 3,667 | $13,973 |
| Wage / Income Gap (%) | 18,717 | 21.98% |
| Wage / Income Gap ($) | 18,717 | 78.02¢ per $1 |
| Gini / Inequality Index | 18,717 | 0.34 |
Earnings by Sex in South San Jose Hills
Average Earnings in South San Jose Hills are $32,412, $36,346 for men and $28,356 for women, a difference of 22.0%.
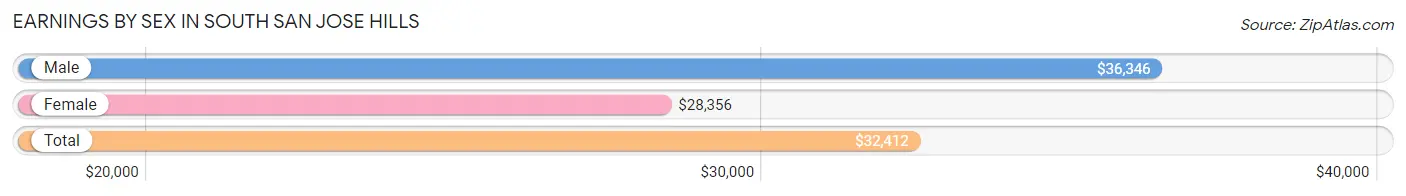
| Sex | Number | Average Earnings |
| Male | 5,588 (56.6%) | $36,346 |
| Female | 4,285 (43.4%) | $28,356 |
| Total | 9,873 (100.0%) | $32,412 |
Earnings by Sex by Income Bracket in South San Jose Hills
The most common earnings brackets in South San Jose Hills are $25,000 to $29,999 for men (538 | 9.6%) and $30,000 to $34,999 for women (624 | 14.6%).
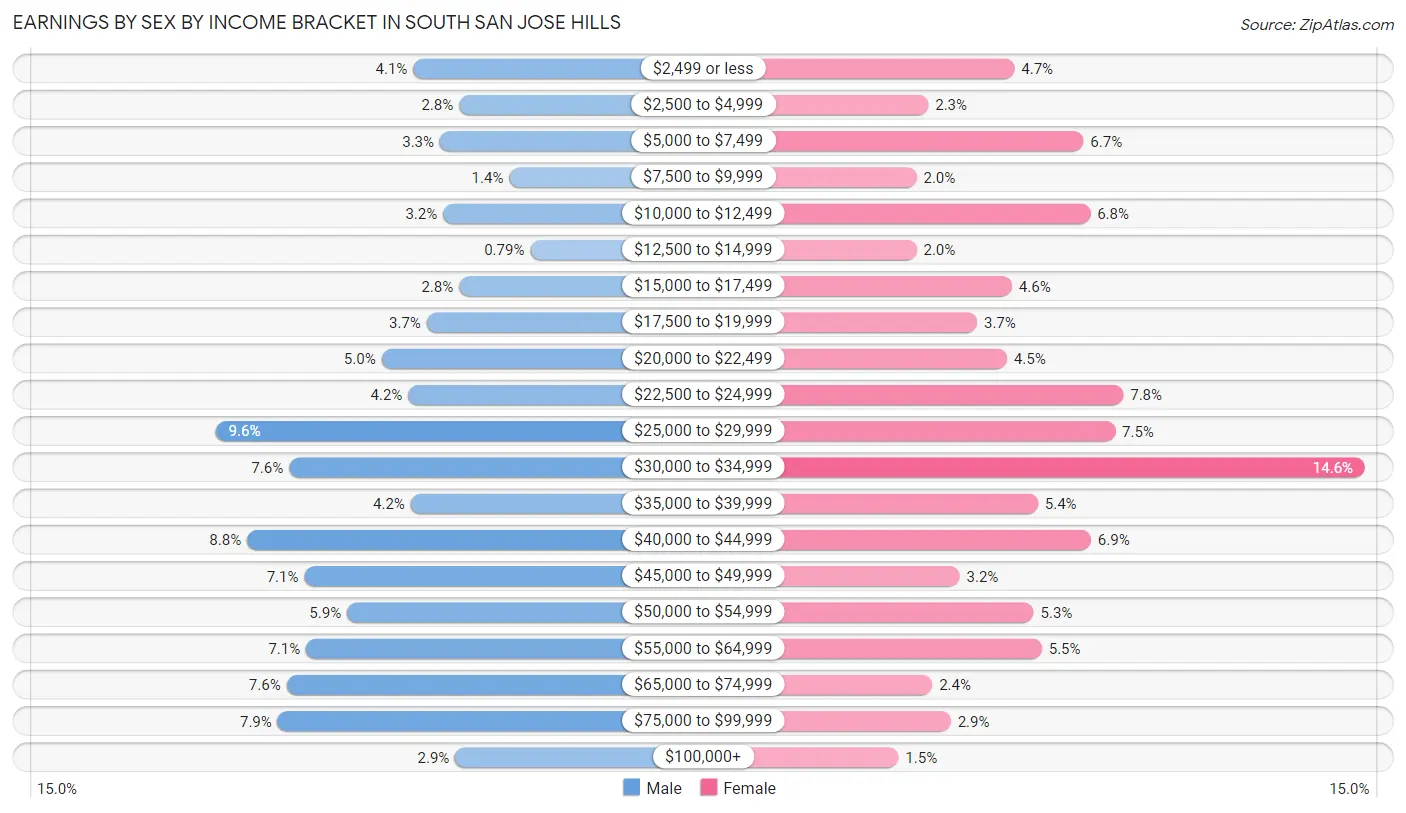
| Income | Male | Female |
| $2,499 or less | 228 (4.1%) | 202 (4.7%) |
| $2,500 to $4,999 | 156 (2.8%) | 98 (2.3%) |
| $5,000 to $7,499 | 186 (3.3%) | 285 (6.7%) |
| $7,500 to $9,999 | 77 (1.4%) | 84 (2.0%) |
| $10,000 to $12,499 | 181 (3.2%) | 293 (6.8%) |
| $12,500 to $14,999 | 44 (0.8%) | 84 (2.0%) |
| $15,000 to $17,499 | 156 (2.8%) | 199 (4.6%) |
| $17,500 to $19,999 | 207 (3.7%) | 157 (3.7%) |
| $20,000 to $22,499 | 278 (5.0%) | 193 (4.5%) |
| $22,500 to $24,999 | 236 (4.2%) | 333 (7.8%) |
| $25,000 to $29,999 | 538 (9.6%) | 323 (7.5%) |
| $30,000 to $34,999 | 423 (7.6%) | 624 (14.6%) |
| $35,000 to $39,999 | 232 (4.2%) | 230 (5.4%) |
| $40,000 to $44,999 | 489 (8.7%) | 294 (6.9%) |
| $45,000 to $49,999 | 399 (7.1%) | 136 (3.2%) |
| $50,000 to $54,999 | 332 (5.9%) | 225 (5.2%) |
| $55,000 to $64,999 | 396 (7.1%) | 235 (5.5%) |
| $65,000 to $74,999 | 427 (7.6%) | 103 (2.4%) |
| $75,000 to $99,999 | 441 (7.9%) | 125 (2.9%) |
| $100,000+ | 162 (2.9%) | 62 (1.5%) |
| Total | 5,588 (100.0%) | 4,285 (100.0%) |
Earnings by Sex by Educational Attainment in South San Jose Hills
Average earnings in South San Jose Hills are $42,344 for men and $31,355 for women, a difference of 26.0%. Men with an educational attainment of graduate degree enjoy the highest average annual earnings of $115,577, while those with less than high school education earn the least with $33,491. Women with an educational attainment of graduate degree earn the most with the average annual earnings of $59,018, while those with less than high school education have the smallest earnings of $23,460.
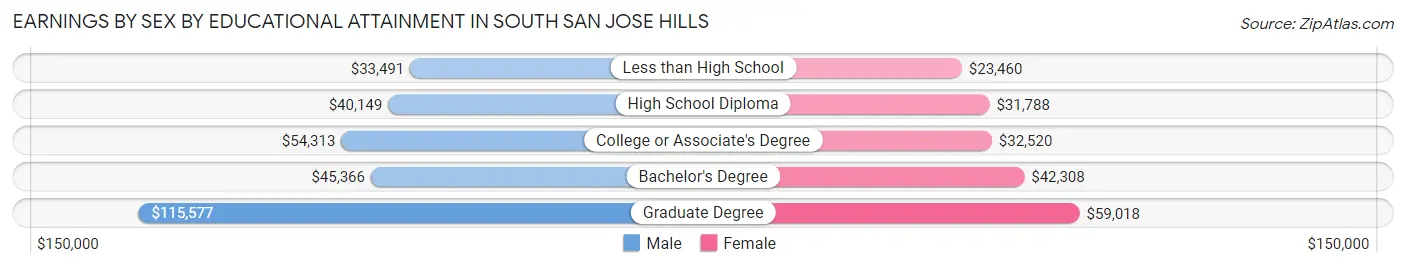
| Educational Attainment | Male Income | Female Income |
| Less than High School | $33,491 | $23,460 |
| High School Diploma | $40,149 | $31,788 |
| College or Associate's Degree | $54,313 | $32,520 |
| Bachelor's Degree | $45,366 | $42,308 |
| Graduate Degree | $115,577 | $59,018 |
| Total | $42,344 | $31,355 |
Family Income in South San Jose Hills
Family Income Brackets in South San Jose Hills
According to the South San Jose Hills family income data, there are 814 families falling into the $100,000 to $149,999 income range, which is the most common income bracket and makes up 22.2% of all families. Conversely, the $10,000 to $14,999 income bracket is the least frequent group with only 26 families (0.7%) belonging to this category.
| Income Bracket | # Families | % Families |
| Less than $10,000 | 128 | 3.5% |
| $10,000 to $14,999 | 26 | 0.7% |
| $15,000 to $24,999 | 205 | 5.6% |
| $25,000 to $34,999 | 330 | 9.0% |
| $35,000 to $49,999 | 297 | 8.1% |
| $50,000 to $74,999 | 638 | 17.4% |
| $75,000 to $99,999 | 609 | 16.6% |
| $100,000 to $149,999 | 814 | 22.2% |
| $150,000 to $199,999 | 389 | 10.6% |
| $200,000+ | 227 | 6.2% |
Family Income by Famaliy Size in South San Jose Hills
6-person families (303 | 8.3%) account for the highest median family income in South San Jose Hills with $123,750 per family, while 3-person families (857 | 23.4%) have the highest median income of $27,370 per family member.
| Income Bracket | # Families | Median Income |
| 2-Person Families | 928 (25.3%) | $48,750 |
| 3-Person Families | 857 (23.4%) | $82,109 |
| 4-Person Families | 530 (14.4%) | $77,976 |
| 5-Person Families | 524 (14.3%) | $88,676 |
| 6-Person Families | 303 (8.3%) | $123,750 |
| 7+ Person Families | 525 (14.3%) | $105,677 |
| Total | 3,667 (100.0%) | $83,750 |
Family Income by Number of Earners in South San Jose Hills
The median family income in South San Jose Hills is $83,750, with families comprising 3+ earners (1,126) having the highest median family income of $128,125, while families with no earners (383) have the lowest median family income of $28,715, accounting for 30.7% and 10.4% of families, respectively.
| Number of Earners | # Families | Median Income |
| No Earners | 383 (10.4%) | $28,715 |
| 1 Earner | 996 (27.2%) | $59,559 |
| 2 Earners | 1,162 (31.7%) | $87,551 |
| 3+ Earners | 1,126 (30.7%) | $128,125 |
| Total | 3,667 (100.0%) | $83,750 |
Household Income in South San Jose Hills
Household Income Brackets in South San Jose Hills
With 990 households falling in the category, the $100,000 to $149,999 income range is the most frequent in South San Jose Hills, accounting for 23.9% of all households. In contrast, only 62 households (1.5%) fall into the $10,000 to $14,999 income bracket, making it the least populous group.
| Income Bracket | # Households | % Households |
| Less than $10,000 | 108 | 2.6% |
| $10,000 to $14,999 | 62 | 1.5% |
| $15,000 to $24,999 | 124 | 3.0% |
| $25,000 to $34,999 | 249 | 6.0% |
| $35,000 to $49,999 | 377 | 9.1% |
| $50,000 to $74,999 | 899 | 21.7% |
| $75,000 to $99,999 | 642 | 15.5% |
| $100,000 to $149,999 | 990 | 23.9% |
| $150,000 to $199,999 | 398 | 9.6% |
| $200,000+ | 290 | 7.0% |
Household Income by Householder Age in South San Jose Hills
The median household income in South San Jose Hills is $87,961, with the highest median household income of $111,210 found in the 45 to 64 years age bracket for the primary householder. A total of 1,672 households (40.4%) fall into this category. Meanwhile, the 65+ years age bracket for the primary householder has the lowest median household income of $58,558, with 1,032 households (24.9%) in this group.
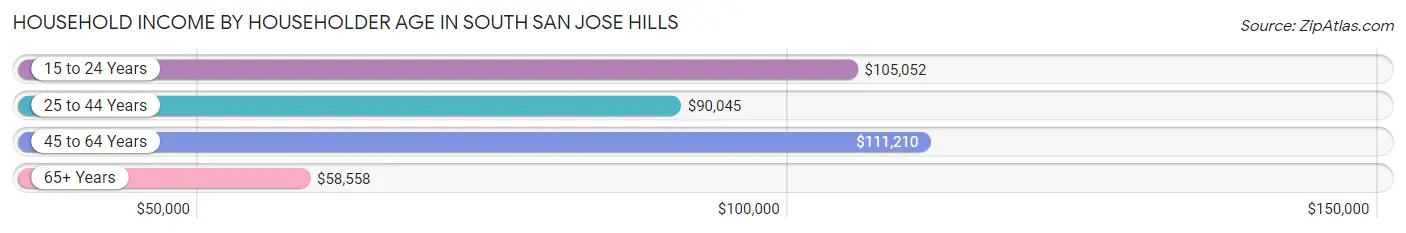
| Income Bracket | # Households | Median Income |
| 15 to 24 Years | 87 (2.1%) | $105,052 |
| 25 to 44 Years | 1,352 (32.6%) | $90,045 |
| 45 to 64 Years | 1,672 (40.4%) | $111,210 |
| 65+ Years | 1,032 (24.9%) | $58,558 |
| Total | 4,143 (100.0%) | $87,961 |
Poverty in South San Jose Hills
Income Below Poverty by Sex and Age in South San Jose Hills
With 13.4% poverty level for males and 15.7% for females among the residents of South San Jose Hills, 5 year old males and 15 year old females are the most vulnerable to poverty, with 65 males (54.6%) and 95 females (56.9%) in their respective age groups living below the poverty level.
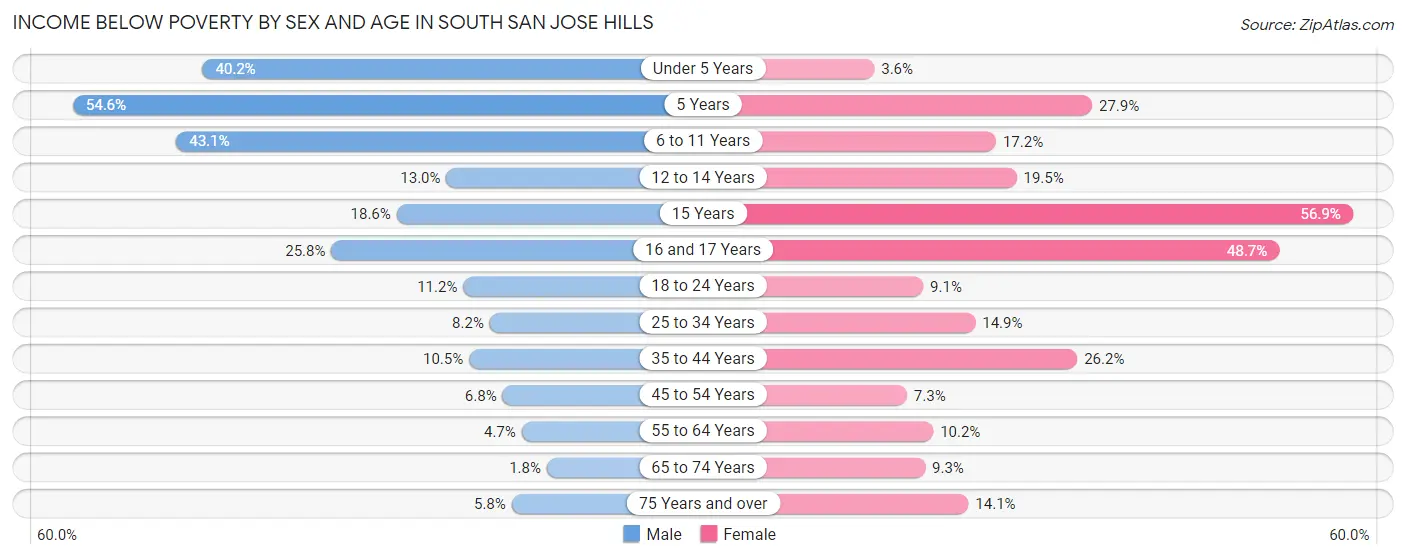
| Age Bracket | Male | Female |
| Under 5 Years | 207 (40.2%) | 14 (3.6%) |
| 5 Years | 65 (54.6%) | 17 (27.9%) |
| 6 to 11 Years | 275 (43.1%) | 91 (17.2%) |
| 12 to 14 Years | 43 (13.0%) | 108 (19.5%) |
| 15 Years | 26 (18.6%) | 95 (56.9%) |
| 16 and 17 Years | 77 (25.8%) | 187 (48.7%) |
| 18 to 24 Years | 101 (11.2%) | 79 (9.1%) |
| 25 to 34 Years | 141 (8.2%) | 226 (14.9%) |
| 35 to 44 Years | 126 (10.5%) | 284 (26.2%) |
| 45 to 54 Years | 83 (6.8%) | 88 (7.2%) |
| 55 to 64 Years | 49 (4.6%) | 108 (10.2%) |
| 65 to 74 Years | 11 (1.8%) | 83 (9.3%) |
| 75 Years and over | 22 (5.8%) | 78 (14.1%) |
| Total | 1,226 (13.4%) | 1,458 (15.7%) |
Income Above Poverty by Sex and Age in South San Jose Hills
According to the poverty statistics in South San Jose Hills, males aged 65 to 74 years and females aged under 5 years are the age groups that are most secure financially, with 98.2% of males and 96.4% of females in these age groups living above the poverty line.
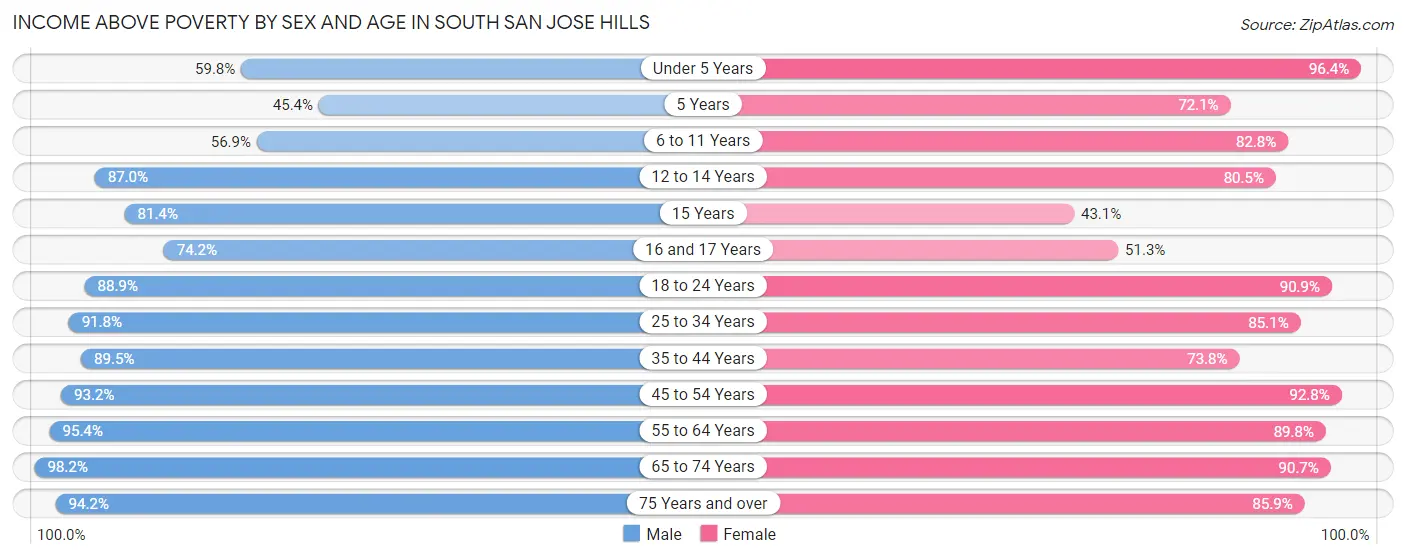
| Age Bracket | Male | Female |
| Under 5 Years | 308 (59.8%) | 373 (96.4%) |
| 5 Years | 54 (45.4%) | 44 (72.1%) |
| 6 to 11 Years | 363 (56.9%) | 439 (82.8%) |
| 12 to 14 Years | 287 (87.0%) | 447 (80.5%) |
| 15 Years | 114 (81.4%) | 72 (43.1%) |
| 16 and 17 Years | 221 (74.2%) | 197 (51.3%) |
| 18 to 24 Years | 805 (88.8%) | 793 (90.9%) |
| 25 to 34 Years | 1,578 (91.8%) | 1,294 (85.1%) |
| 35 to 44 Years | 1,074 (89.5%) | 799 (73.8%) |
| 45 to 54 Years | 1,142 (93.2%) | 1,126 (92.7%) |
| 55 to 64 Years | 1,005 (95.4%) | 953 (89.8%) |
| 65 to 74 Years | 588 (98.2%) | 811 (90.7%) |
| 75 Years and over | 360 (94.2%) | 475 (85.9%) |
| Total | 7,899 (86.6%) | 7,823 (84.3%) |
Income Below Poverty Among Married-Couple Families in South San Jose Hills
The poverty statistics for married-couple families in South San Jose Hills show that 3.9% or 81 of the total 2,063 families live below the poverty line. Families with 3 or 4 children have the highest poverty rate of 10.2%, comprising of 22 families. On the other hand, families with no children have the lowest poverty rate of 0.0%, which includes 0 families.
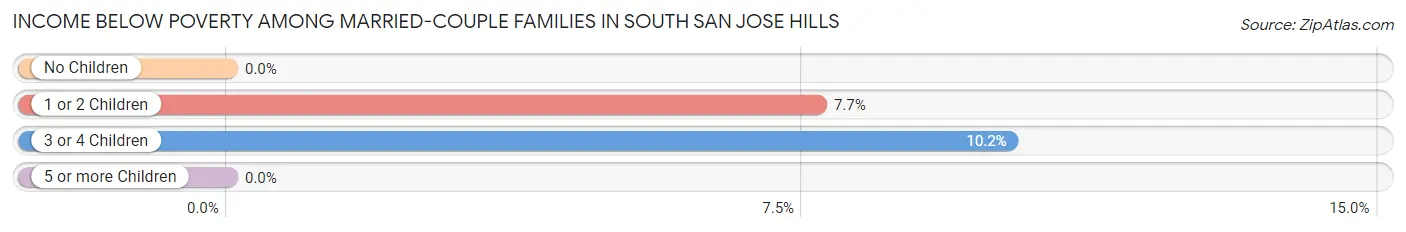
| Children | Above Poverty | Below Poverty |
| No Children | 1,060 (100.0%) | 0 (0.0%) |
| 1 or 2 Children | 708 (92.3%) | 59 (7.7%) |
| 3 or 4 Children | 194 (89.8%) | 22 (10.2%) |
| 5 or more Children | 20 (100.0%) | 0 (0.0%) |
| Total | 1,982 (96.1%) | 81 (3.9%) |
Income Below Poverty Among Single-Parent Households in South San Jose Hills
According to the poverty data in South San Jose Hills, 21.3% or 131 single-father households and 20.3% or 201 single-mother households are living below the poverty line. Among single-father households, those with 5 or more children have the highest poverty rate, with 74 households (100.0%) experiencing poverty. Likewise, among single-mother households, those with 3 or 4 children have the highest poverty rate, with 87 households (62.1%) falling below the poverty line.
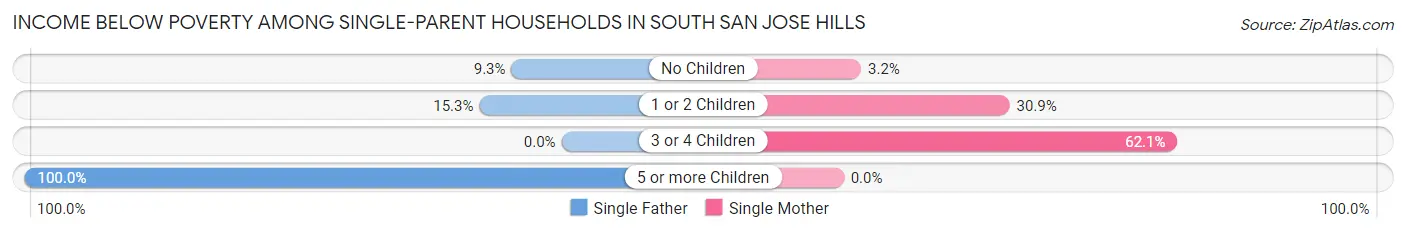
| Children | Single Father | Single Mother |
| No Children | 25 (9.3%) | 17 (3.2%) |
| 1 or 2 Children | 32 (15.3%) | 97 (30.9%) |
| 3 or 4 Children | 0 (0.0%) | 87 (62.1%) |
| 5 or more Children | 74 (100.0%) | 0 (0.0%) |
| Total | 131 (21.3%) | 201 (20.3%) |
Income Below Poverty Among Married-Couple vs Single-Parent Households in South San Jose Hills
The poverty data for South San Jose Hills shows that 81 of the married-couple family households (3.9%) and 332 of the single-parent households (20.7%) are living below the poverty level. Within the married-couple family households, those with 3 or 4 children have the highest poverty rate, with 22 households (10.2%) falling below the poverty line. Among the single-parent households, those with 5 or more children have the highest poverty rate, with 74 household (87.1%) living below poverty.
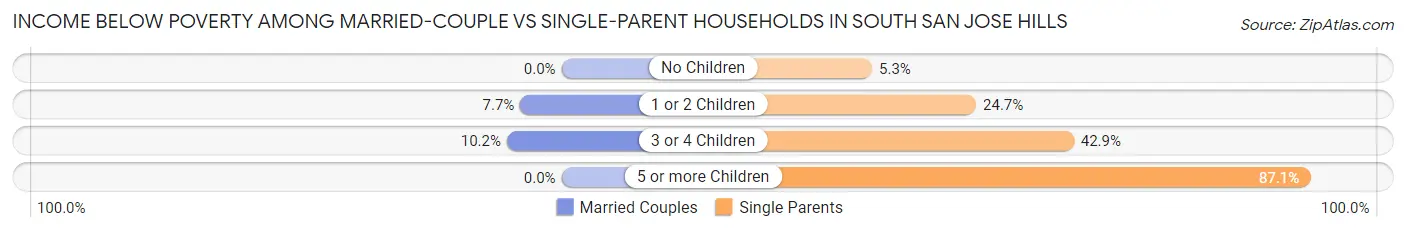
| Children | Married-Couple Families | Single-Parent Households |
| No Children | 0 (0.0%) | 42 (5.3%) |
| 1 or 2 Children | 59 (7.7%) | 129 (24.7%) |
| 3 or 4 Children | 22 (10.2%) | 87 (42.9%) |
| 5 or more Children | 0 (0.0%) | 74 (87.1%) |
| Total | 81 (3.9%) | 332 (20.7%) |
Race in South San Jose Hills
The most populous races in South San Jose Hills are Hispanic or Latino (16,111 | 86.1%), Some other Race (9,757 | 52.1%), and White / Caucasian (4,232 | 22.6%).
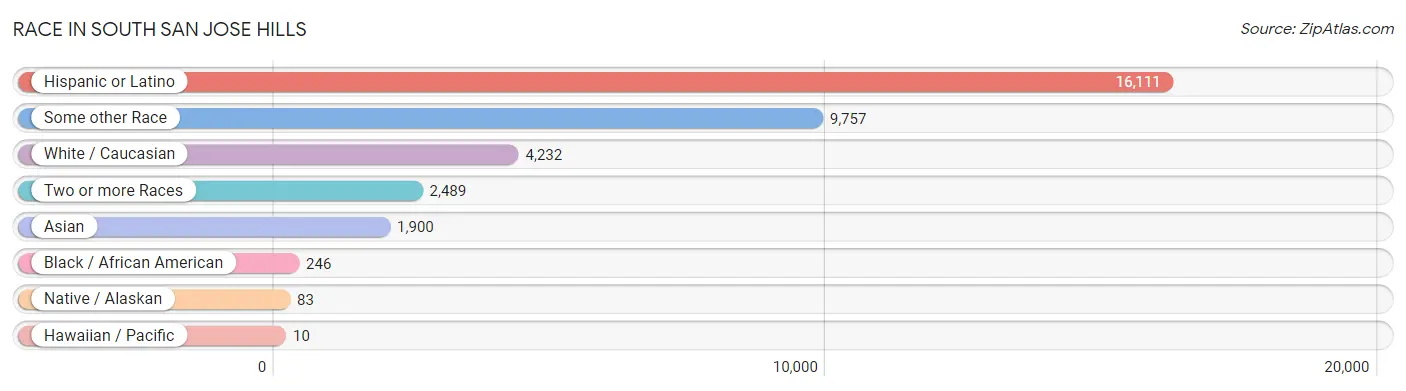
| Race | # Population | % Population |
| Asian | 1,900 | 10.2% |
| Black / African American | 246 | 1.3% |
| Hawaiian / Pacific | 10 | 0.1% |
| Hispanic or Latino | 16,111 | 86.1% |
| Native / Alaskan | 83 | 0.4% |
| White / Caucasian | 4,232 | 22.6% |
| Two or more Races | 2,489 | 13.3% |
| Some other Race | 9,757 | 52.1% |
| Total | 18,717 | 100.0% |
Ancestry in South San Jose Hills
The most populous ancestries reported in South San Jose Hills are Mexican (13,931 | 74.4%), Central American (1,425 | 7.6%), Indian (Asian) (1,166 | 6.2%), Salvadoran (1,007 | 5.4%), and Korean (741 | 4.0%), together accounting for 97.6% of all South San Jose Hills residents.
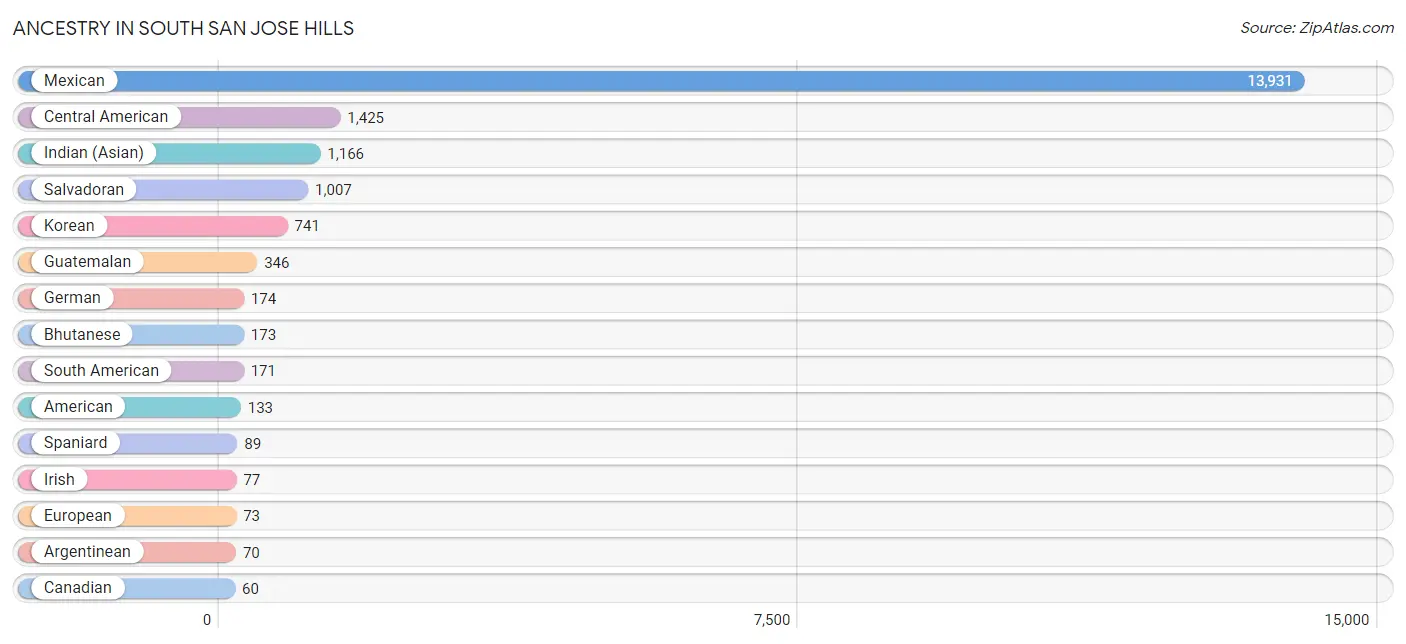
| Ancestry | # Population | % Population |
| American | 133 | 0.7% |
| Argentinean | 70 | 0.4% |
| Belizean | 21 | 0.1% |
| Bhutanese | 173 | 0.9% |
| Bolivian | 6 | 0.0% |
| Canadian | 60 | 0.3% |
| Central American | 1,425 | 7.6% |
| Central American Indian | 29 | 0.2% |
| Colombian | 17 | 0.1% |
| Cuban | 37 | 0.2% |
| Dutch | 4 | 0.0% |
| Ecuadorian | 25 | 0.1% |
| English | 60 | 0.3% |
| European | 73 | 0.4% |
| Filipino | 23 | 0.1% |
| French Canadian | 4 | 0.0% |
| German | 174 | 0.9% |
| Greek | 15 | 0.1% |
| Guatemalan | 346 | 1.8% |
| Honduran | 26 | 0.1% |
| Indian (Asian) | 1,166 | 6.2% |
| Irish | 77 | 0.4% |
| Italian | 47 | 0.3% |
| Japanese | 50 | 0.3% |
| Korean | 741 | 4.0% |
| Laotian | 10 | 0.1% |
| Mexican | 13,931 | 74.4% |
| Mexican American Indian | 52 | 0.3% |
| Mongolian | 5 | 0.0% |
| Peruvian | 53 | 0.3% |
| Polish | 9 | 0.1% |
| Puerto Rican | 7 | 0.0% |
| Salvadoran | 1,007 | 5.4% |
| Scottish | 17 | 0.1% |
| South American | 171 | 0.9% |
| Spaniard | 89 | 0.5% |
| Sri Lankan | 36 | 0.2% |
| Swiss | 25 | 0.1% |
| Thai | 53 | 0.3% | View All 39 Rows |
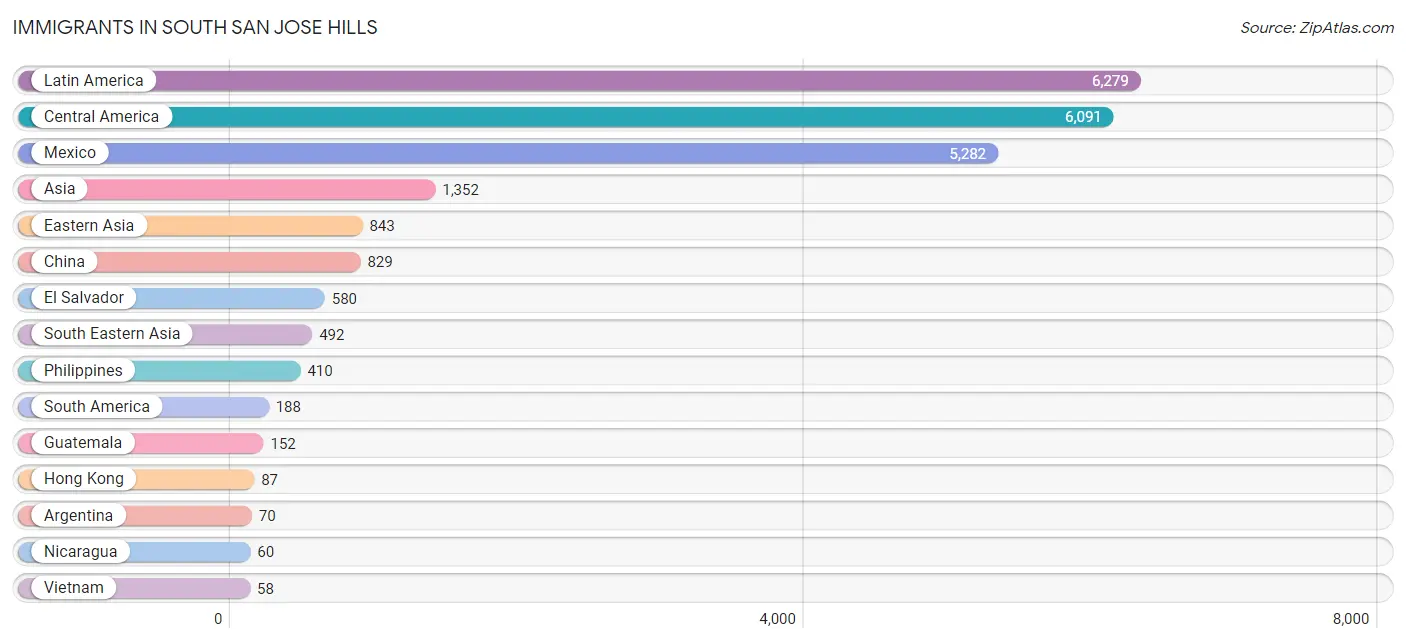
Immigrants in South San Jose Hills
The most numerous immigrant groups reported in South San Jose Hills came from Latin America (6,279 | 33.6%), Central America (6,091 | 32.5%), Mexico (5,282 | 28.2%), Asia (1,352 | 7.2%), and Eastern Asia (843 | 4.5%), together accounting for 106.0% of all South San Jose Hills residents.
| Immigration Origin | # Population | % Population |
| Africa | 14 | 0.1% |
| Argentina | 70 | 0.4% |
| Asia | 1,352 | 7.2% |
| Belize | 11 | 0.1% |
| Canada | 22 | 0.1% |
| Central America | 6,091 | 32.5% |
| China | 829 | 4.4% |
| Colombia | 11 | 0.1% |
| Eastern Asia | 843 | 4.5% |
| Eastern Europe | 4 | 0.0% |
| Ecuador | 54 | 0.3% |
| Egypt | 14 | 0.1% |
| El Salvador | 580 | 3.1% |
| Europe | 16 | 0.1% |
| Guatemala | 152 | 0.8% |
| Honduras | 6 | 0.0% |
| Hong Kong | 87 | 0.5% |
| India | 17 | 0.1% |
| Indonesia | 10 | 0.1% |
| Ireland | 12 | 0.1% |
| Japan | 14 | 0.1% |
| Latin America | 6,279 | 33.6% |
| Malaysia | 5 | 0.0% |
| Mexico | 5,282 | 28.2% |
| Nicaragua | 60 | 0.3% |
| Northern Africa | 14 | 0.1% |
| Northern Europe | 12 | 0.1% |
| Peru | 53 | 0.3% |
| Philippines | 410 | 2.2% |
| Russia | 4 | 0.0% |
| South America | 188 | 1.0% |
| South Central Asia | 17 | 0.1% |
| South Eastern Asia | 492 | 2.6% |
| Taiwan | 28 | 0.2% |
| Vietnam | 58 | 0.3% | View All 35 Rows |
Sex and Age in South San Jose Hills
Sex and Age in South San Jose Hills
The most populous age groups in South San Jose Hills are 25 to 29 Years (901 | 9.7%) for men and 10 to 14 Years (907 | 9.6%) for women.
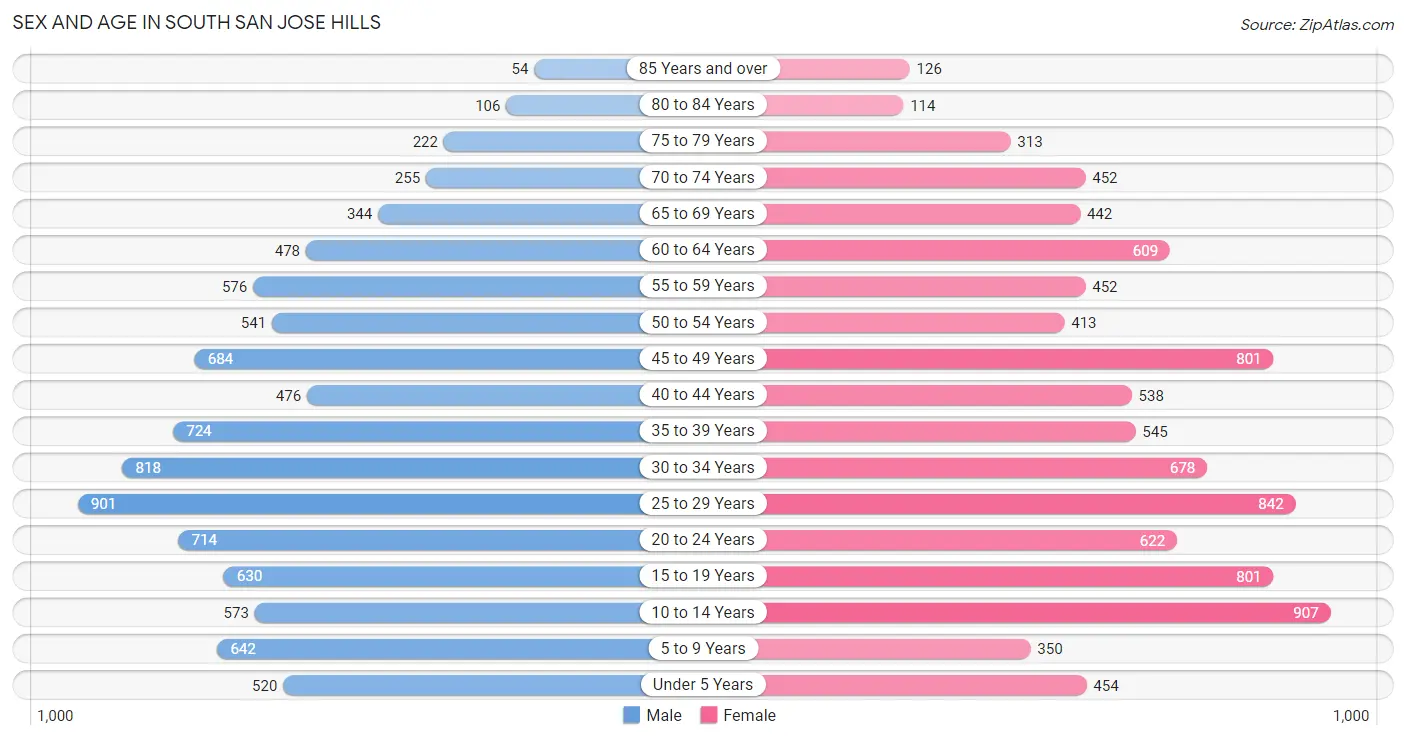
| Age Bracket | Male | Female |
| Under 5 Years | 520 (5.6%) | 454 (4.8%) |
| 5 to 9 Years | 642 (6.9%) | 350 (3.7%) |
| 10 to 14 Years | 573 (6.2%) | 907 (9.6%) |
| 15 to 19 Years | 630 (6.8%) | 801 (8.5%) |
| 20 to 24 Years | 714 (7.7%) | 622 (6.6%) |
| 25 to 29 Years | 901 (9.7%) | 842 (8.9%) |
| 30 to 34 Years | 818 (8.8%) | 678 (7.2%) |
| 35 to 39 Years | 724 (7.8%) | 545 (5.8%) |
| 40 to 44 Years | 476 (5.1%) | 538 (5.7%) |
| 45 to 49 Years | 684 (7.4%) | 801 (8.5%) |
| 50 to 54 Years | 541 (5.8%) | 413 (4.4%) |
| 55 to 59 Years | 576 (6.2%) | 452 (4.8%) |
| 60 to 64 Years | 478 (5.2%) | 609 (6.4%) |
| 65 to 69 Years | 344 (3.7%) | 442 (4.7%) |
| 70 to 74 Years | 255 (2.8%) | 452 (4.8%) |
| 75 to 79 Years | 222 (2.4%) | 313 (3.3%) |
| 80 to 84 Years | 106 (1.1%) | 114 (1.2%) |
| 85 Years and over | 54 (0.6%) | 126 (1.3%) |
| Total | 9,258 (100.0%) | 9,459 (100.0%) |
Families and Households in South San Jose Hills
Median Family Size in South San Jose Hills
The median family size in South San Jose Hills is 4.40 persons per family, with single female/mother families (990 | 27.0%) accounting for the largest median family size of 4.48 persons per family. On the other hand, married-couple families (2,063 | 56.3%) represent the smallest median family size with 4.35 persons per family.
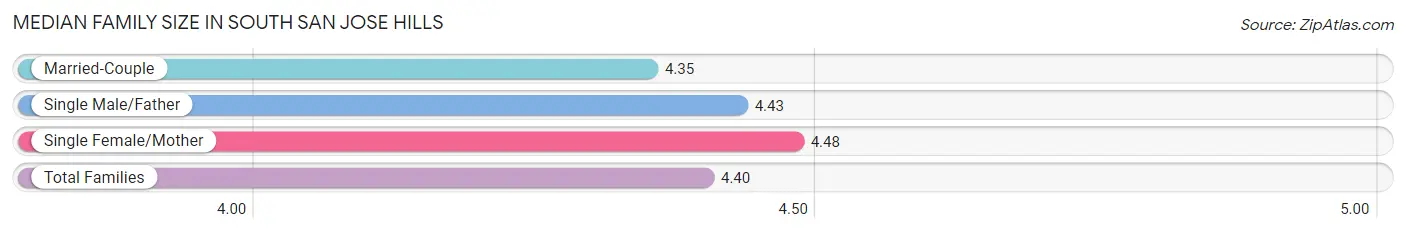
| Family Type | # Families | Family Size |
| Married-Couple | 2,063 (56.3%) | 4.35 |
| Single Male/Father | 614 (16.7%) | 4.43 |
| Single Female/Mother | 990 (27.0%) | 4.48 |
| Total Families | 3,667 (100.0%) | 4.40 |
Median Household Size in South San Jose Hills
The median household size in South San Jose Hills is 4.50 persons per household, with single male/father households (614 | 14.8%) accounting for the largest median household size of 5.27 persons per household. non-family households (476 | 11.5%) represent the smallest median household size with 1.89 persons per household.
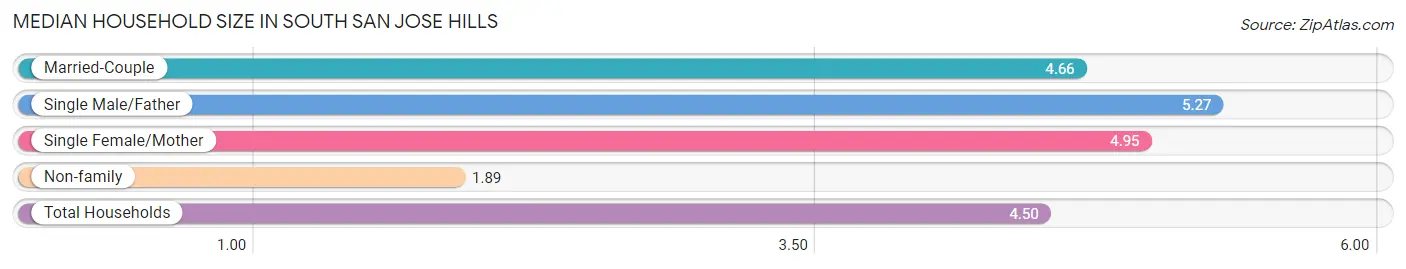
| Household Type | # Households | Household Size |
| Married-Couple | 2,063 (49.8%) | 4.66 |
| Single Male/Father | 614 (14.8%) | 5.27 |
| Single Female/Mother | 990 (23.9%) | 4.95 |
| Non-family | 476 (11.5%) | 1.89 |
| Total Households | 4,143 (100.0%) | 4.50 |
Household Size by Marriage Status in South San Jose Hills
Out of a total of 4,143 households in South San Jose Hills, 3,667 (88.5%) are family households, while 476 (11.5%) are nonfamily households. The most numerous type of family households are 3-person households, comprising 818, and the most common type of nonfamily households are 1-person households, comprising 317.
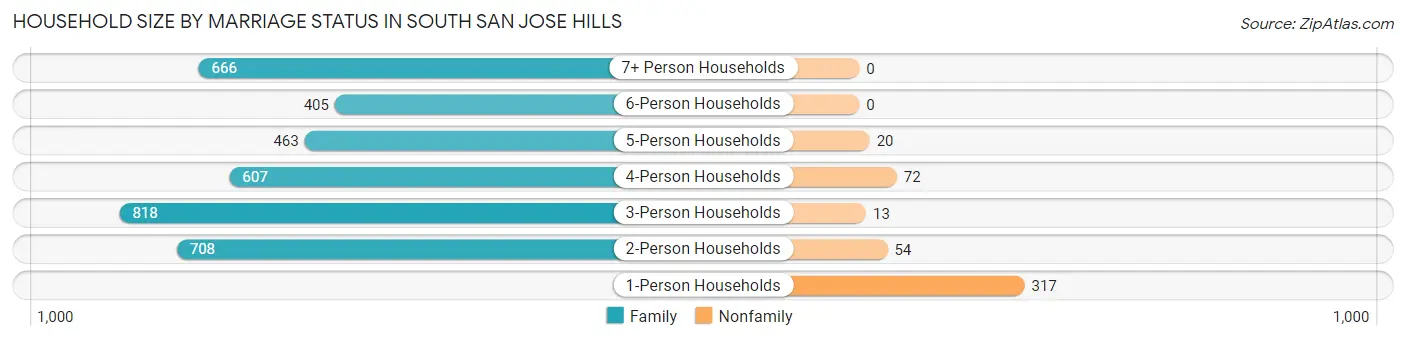
| Household Size | Family Households | Nonfamily Households |
| 1-Person Households | - | 317 (7.6%) |
| 2-Person Households | 708 (17.1%) | 54 (1.3%) |
| 3-Person Households | 818 (19.7%) | 13 (0.3%) |
| 4-Person Households | 607 (14.6%) | 72 (1.7%) |
| 5-Person Households | 463 (11.2%) | 20 (0.5%) |
| 6-Person Households | 405 (9.8%) | 0 (0.0%) |
| 7+ Person Households | 666 (16.1%) | 0 (0.0%) |
| Total | 3,667 (88.5%) | 476 (11.5%) |
Female Fertility in South San Jose Hills
Fertility by Age in South San Jose Hills
Average fertility rate in South San Jose Hills is 28.0 births per 1,000 women. Women in the age bracket of 20 to 34 years have the highest fertility rate with 59.0 births per 1,000 women. Women in the age bracket of 20 to 34 years acount for 92.0% of all women with births.
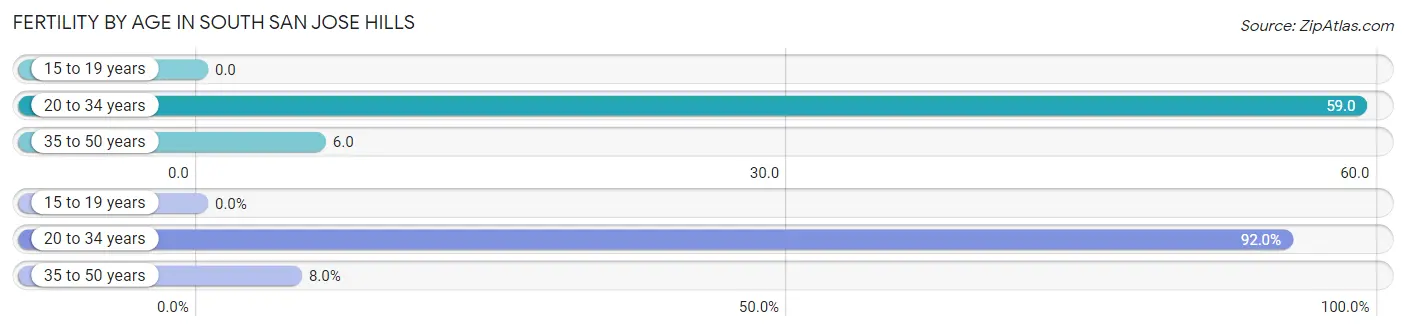
| Age Bracket | Women with Births | Births / 1,000 Women |
| 15 to 19 years | 0 (0.0%) | 0.0 |
| 20 to 34 years | 127 (92.0%) | 59.0 |
| 35 to 50 years | 11 (8.0%) | 6.0 |
| Total | 138 (100.0%) | 28.0 |
Fertility by Age by Marriage Status in South San Jose Hills
39.1% of women with births (138) in South San Jose Hills are married. The highest percentage of unmarried women with births falls into 20 to 34 years age bracket with 65.3% of them unmarried at the time of birth, while the lowest percentage of unmarried women with births belong to 35 to 50 years age bracket with 9.1% of them unmarried.
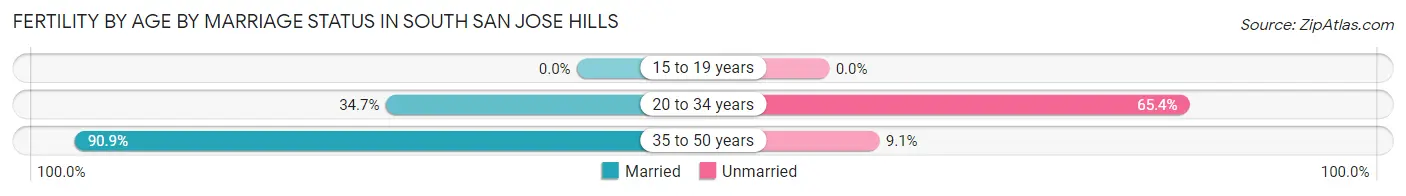
| Age Bracket | Married | Unmarried |
| 15 to 19 years | 0 (0.0%) | 0 (0.0%) |
| 20 to 34 years | 44 (34.6%) | 83 (65.3%) |
| 35 to 50 years | 10 (90.9%) | 1 (9.1%) |
| Total | 54 (39.1%) | 84 (60.9%) |
Fertility by Education in South San Jose Hills
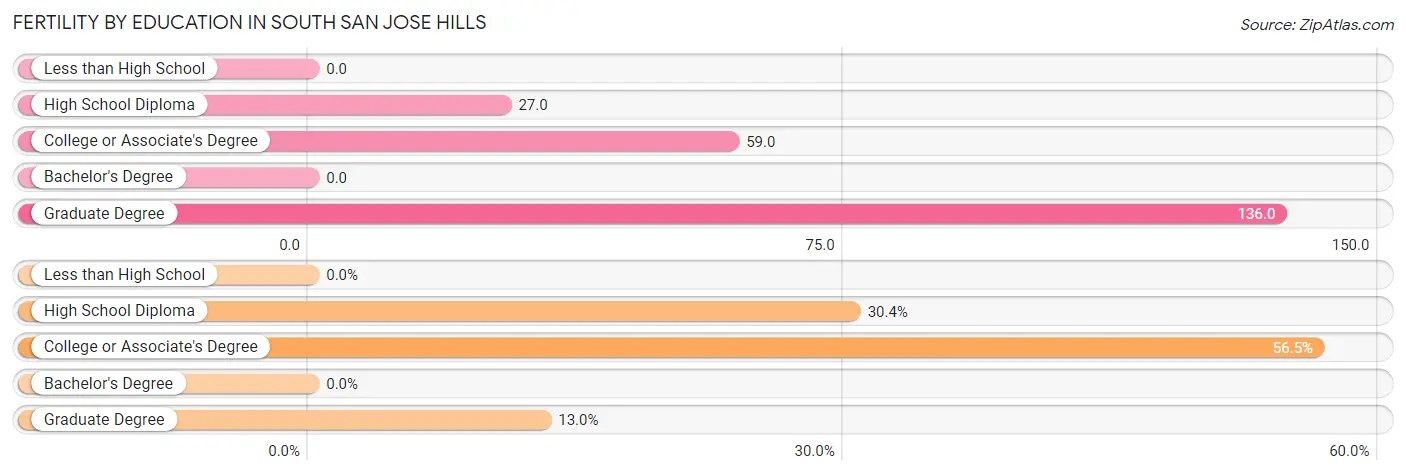
| Educational Attainment | Women with Births | Births / 1,000 Women |
| Less than High School | 0 (0.0%) | 0.0 |
| High School Diploma | 42 (30.4%) | 27.0 |
| College or Associate's Degree | 78 (56.5%) | 59.0 |
| Bachelor's Degree | 0 (0.0%) | 0.0 |
| Graduate Degree | 18 (13.0%) | 136.0 |
| Total | 138 (100.0%) | 28.0 |
Fertility by Education by Marriage Status in South San Jose Hills
60.9% of women with births in South San Jose Hills are unmarried. Women with the educational attainment of graduate degree are most likely to be married with 100.0% of them married at childbirth, while women with the educational attainment of high school diploma are least likely to be married with 78.6% of them unmarried at childbirth.
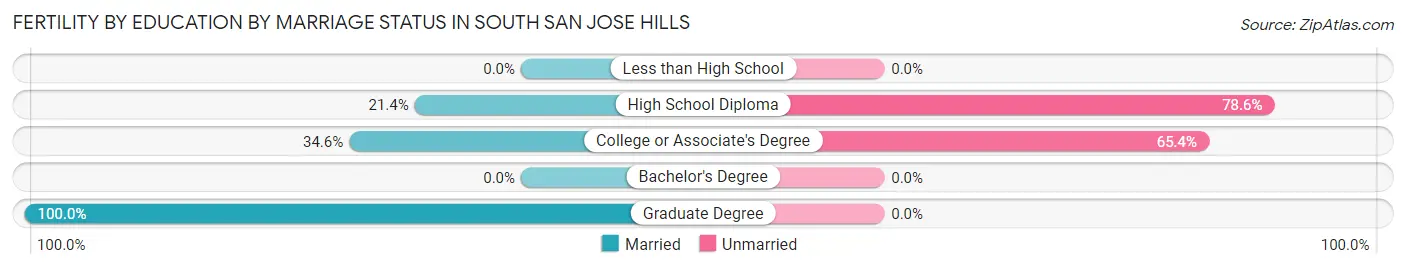
| Educational Attainment | Married | Unmarried |
| Less than High School | 0 (0.0%) | 0 (0.0%) |
| High School Diploma | 9 (21.4%) | 33 (78.6%) |
| College or Associate's Degree | 27 (34.6%) | 51 (65.4%) |
| Bachelor's Degree | 0 (0.0%) | 0 (0.0%) |
| Graduate Degree | 18 (100.0%) | 0 (0.0%) |
| Total | 54 (39.1%) | 84 (60.9%) |
Employment Characteristics in South San Jose Hills
Employment by Class of Employer in South San Jose Hills
Among the 8,545 employed individuals in South San Jose Hills, private company employees (6,346 | 74.3%), local government employees (668 | 7.8%), and self-employed (not incorporated) (608 | 7.1%) make up the most common classes of employment.
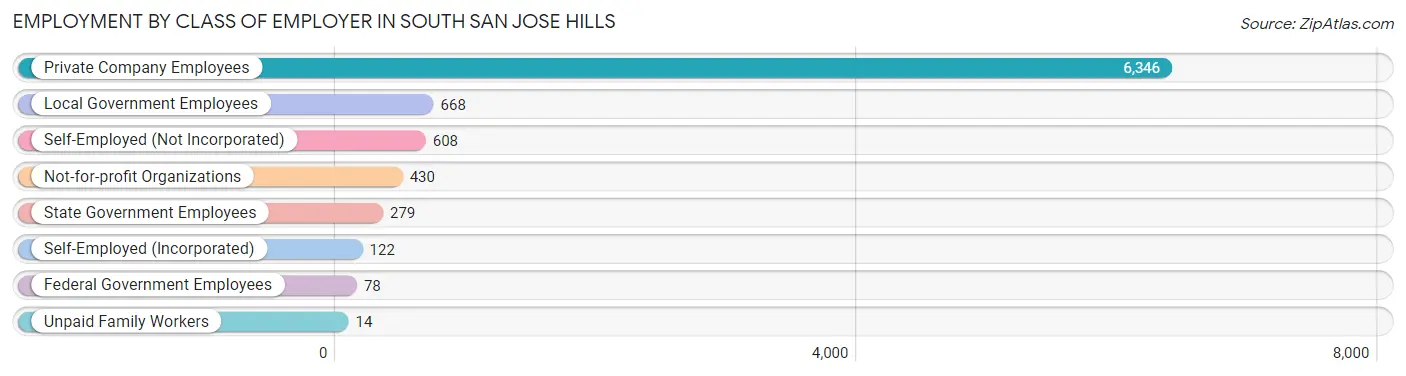
| Employer Class | # Employees | % Employees |
| Private Company Employees | 6,346 | 74.3% |
| Self-Employed (Incorporated) | 122 | 1.4% |
| Self-Employed (Not Incorporated) | 608 | 7.1% |
| Not-for-profit Organizations | 430 | 5.0% |
| Local Government Employees | 668 | 7.8% |
| State Government Employees | 279 | 3.3% |
| Federal Government Employees | 78 | 0.9% |
| Unpaid Family Workers | 14 | 0.2% |
| Total | 8,545 | 100.0% |
Employment Status by Age in South San Jose Hills
According to the labor force statistics for South San Jose Hills, out of the total population over 16 years of age (14,964), 65.0% or 9,727 individuals are in the labor force, with 8.7% or 846 of them unemployed. The age group with the highest labor force participation rate is 25 to 29 years, with 87.4% or 1,523 individuals in the labor force. Within the labor force, the 16 to 19 years age range has the highest percentage of unemployed individuals, with 24.4% or 58 of them being unemployed.
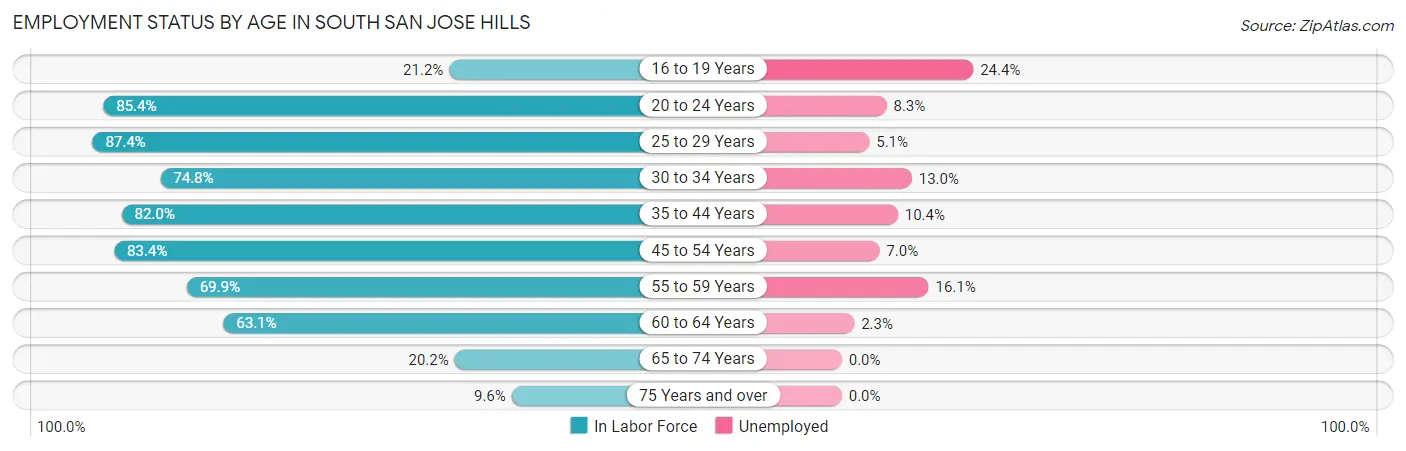
| Age Bracket | In Labor Force | Unemployed |
| 16 to 19 Years | 238 (21.2%) | 58 (24.4%) |
| 20 to 24 Years | 1,141 (85.4%) | 95 (8.3%) |
| 25 to 29 Years | 1,523 (87.4%) | 78 (5.1%) |
| 30 to 34 Years | 1,119 (74.8%) | 145 (13.0%) |
| 35 to 44 Years | 1,872 (82.0%) | 195 (10.4%) |
| 45 to 54 Years | 2,034 (83.4%) | 142 (7.0%) |
| 55 to 59 Years | 719 (69.9%) | 116 (16.1%) |
| 60 to 64 Years | 686 (63.1%) | 16 (2.3%) |
| 65 to 74 Years | 302 (20.2%) | 0 (0.0%) |
| 75 Years and over | 90 (9.6%) | 0 (0.0%) |
| Total | 9,727 (65.0%) | 846 (8.7%) |
Employment Status by Educational Attainment in South San Jose Hills
According to labor force statistics for South San Jose Hills, 78.9% of individuals (7,950) out of the total population between 25 and 64 years of age (10,076) are in the labor force, with 8.7% or 692 of them being unemployed. The group with the highest labor force participation rate are those with the educational attainment of bachelor's degree or higher, with 85.3% or 980 individuals in the labor force. Within the labor force, individuals with bachelor's degree or higher education have the highest percentage of unemployment, with 11.0% or 108 of them being unemployed.
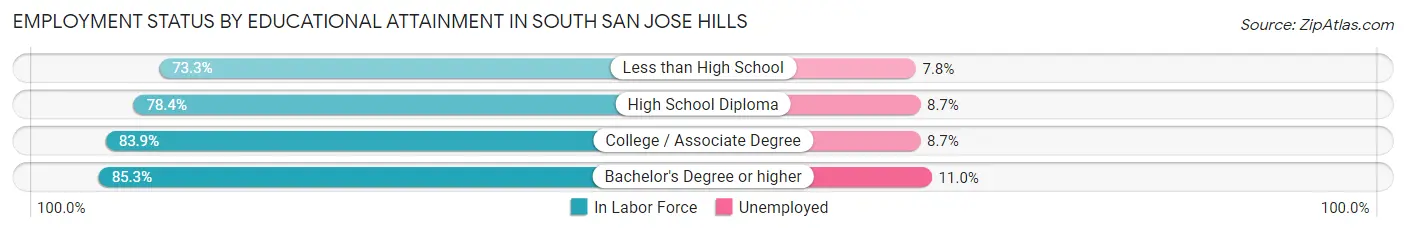
| Educational Attainment | In Labor Force | Unemployed |
| Less than High School | 2,255 (73.3%) | 240 (7.8%) |
| High School Diploma | 2,709 (78.4%) | 301 (8.7%) |
| College / Associate Degree | 2,010 (83.9%) | 208 (8.7%) |
| Bachelor's Degree or higher | 980 (85.3%) | 126 (11.0%) |
| Total | 7,950 (78.9%) | 877 (8.7%) |
Employment Occupations by Sex in South San Jose Hills
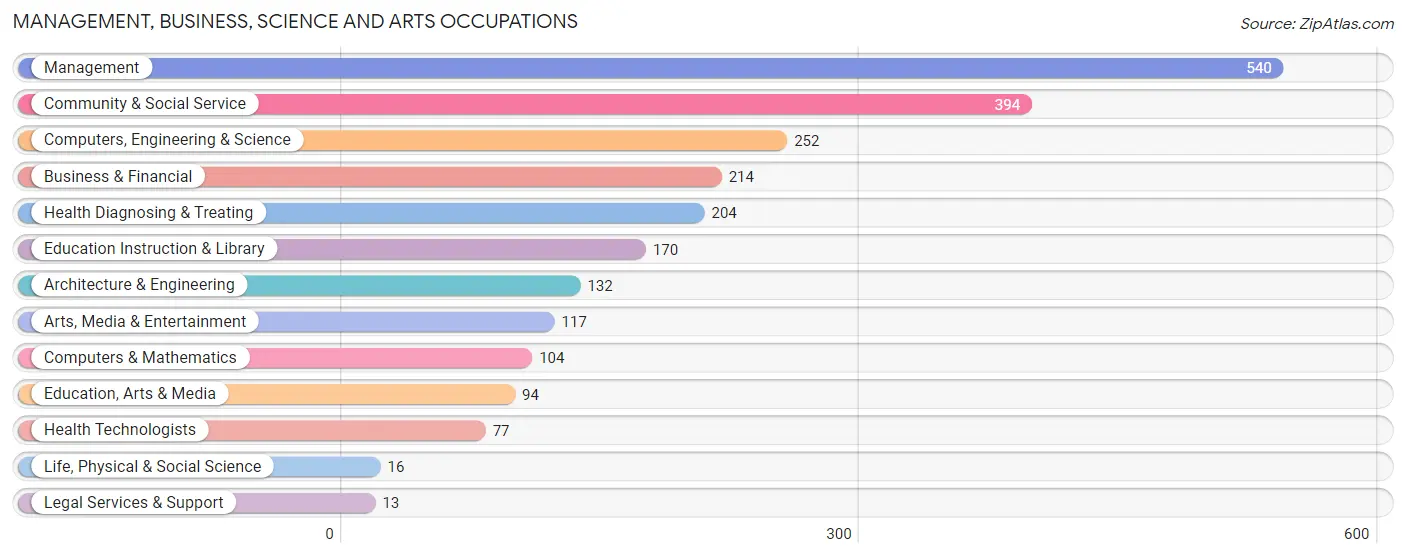
Management, Business, Science and Arts Occupations
The most common Management, Business, Science and Arts occupations in South San Jose Hills are Management (540 | 6.1%), Community & Social Service (394 | 4.4%), Computers, Engineering & Science (252 | 2.8%), Business & Financial (214 | 2.4%), and Health Diagnosing & Treating (204 | 2.3%).
Management, Business, Science and Arts Occupations by Sex
Within the Management, Business, Science and Arts occupations in South San Jose Hills, the most male-oriented occupations are Life, Physical & Social Science (100.0%), Computers & Mathematics (88.5%), and Computers, Engineering & Science (82.9%), while the most female-oriented occupations are Legal Services & Support (100.0%), Education, Arts & Media (79.8%), and Education Instruction & Library (78.2%).
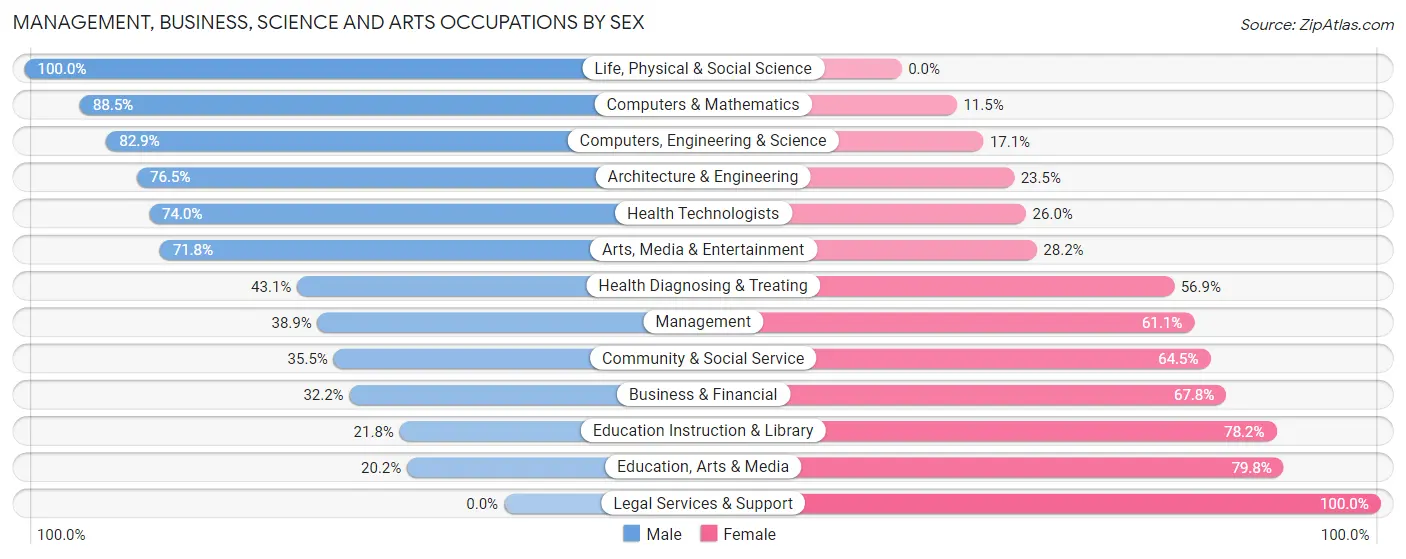
| Occupation | Male | Female |
| Management | 210 (38.9%) | 330 (61.1%) |
| Business & Financial | 69 (32.2%) | 145 (67.8%) |
| Computers, Engineering & Science | 209 (82.9%) | 43 (17.1%) |
| Computers & Mathematics | 92 (88.5%) | 12 (11.5%) |
| Architecture & Engineering | 101 (76.5%) | 31 (23.5%) |
| Life, Physical & Social Science | 16 (100.0%) | 0 (0.0%) |
| Community & Social Service | 140 (35.5%) | 254 (64.5%) |
| Education, Arts & Media | 19 (20.2%) | 75 (79.8%) |
| Legal Services & Support | 0 (0.0%) | 13 (100.0%) |
| Education Instruction & Library | 37 (21.8%) | 133 (78.2%) |
| Arts, Media & Entertainment | 84 (71.8%) | 33 (28.2%) |
| Health Diagnosing & Treating | 88 (43.1%) | 116 (56.9%) |
| Health Technologists | 57 (74.0%) | 20 (26.0%) |
| Total (Category) | 716 (44.6%) | 888 (55.4%) |
| Total (Overall) | 4,928 (55.5%) | 3,947 (44.5%) |
Services Occupations
The most common Services occupations in South San Jose Hills are Food Preparation & Serving (596 | 6.7%), Cleaning & Maintenance (588 | 6.6%), Healthcare Support (395 | 4.4%), Personal Care & Service (232 | 2.6%), and Security & Protection (52 | 0.6%).
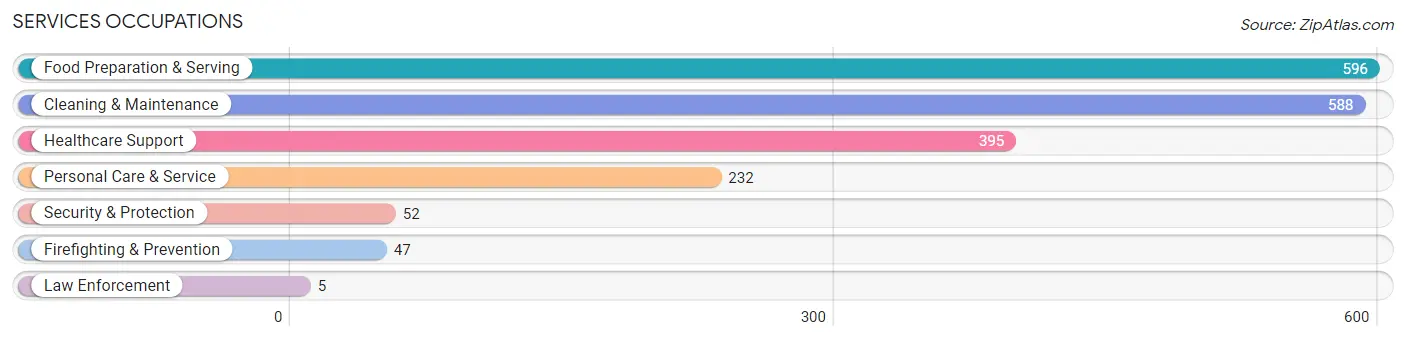
Services Occupations by Sex
Within the Services occupations in South San Jose Hills, the most male-oriented occupations are Law Enforcement (100.0%), Security & Protection (75.0%), and Firefighting & Prevention (72.3%), while the most female-oriented occupations are Healthcare Support (70.4%), Personal Care & Service (65.5%), and Food Preparation & Serving (53.5%).
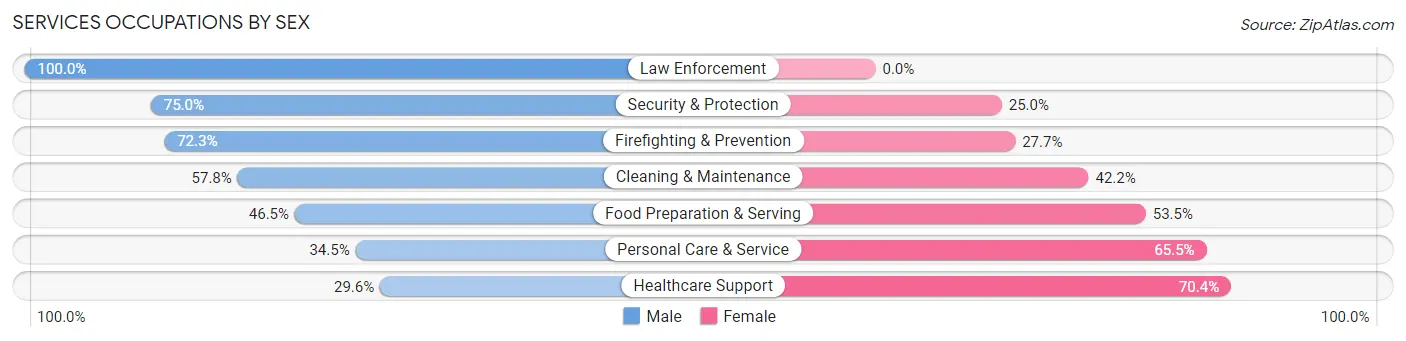
| Occupation | Male | Female |
| Healthcare Support | 117 (29.6%) | 278 (70.4%) |
| Security & Protection | 39 (75.0%) | 13 (25.0%) |
| Firefighting & Prevention | 34 (72.3%) | 13 (27.7%) |
| Law Enforcement | 5 (100.0%) | 0 (0.0%) |
| Food Preparation & Serving | 277 (46.5%) | 319 (53.5%) |
| Cleaning & Maintenance | 340 (57.8%) | 248 (42.2%) |
| Personal Care & Service | 80 (34.5%) | 152 (65.5%) |
| Total (Category) | 853 (45.8%) | 1,010 (54.2%) |
| Total (Overall) | 4,928 (55.5%) | 3,947 (44.5%) |
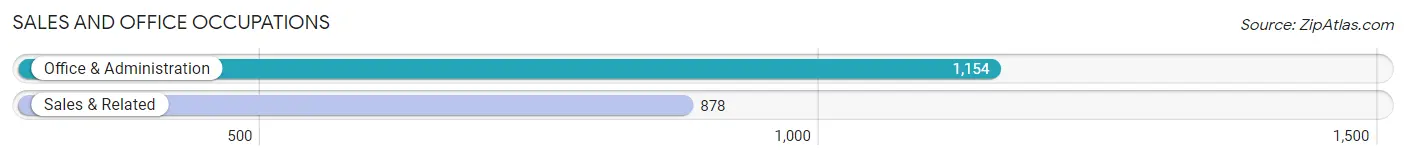
Sales and Office Occupations
The most common Sales and Office occupations in South San Jose Hills are Office & Administration (1,154 | 13.0%), and Sales & Related (878 | 9.9%).
Sales and Office Occupations by Sex
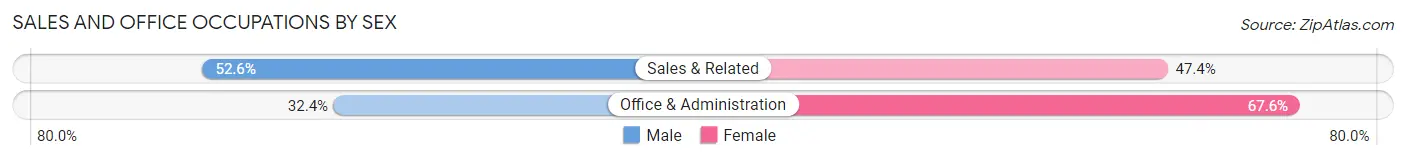
| Occupation | Male | Female |
| Sales & Related | 462 (52.6%) | 416 (47.4%) |
| Office & Administration | 374 (32.4%) | 780 (67.6%) |
| Total (Category) | 836 (41.1%) | 1,196 (58.9%) |
| Total (Overall) | 4,928 (55.5%) | 3,947 (44.5%) |
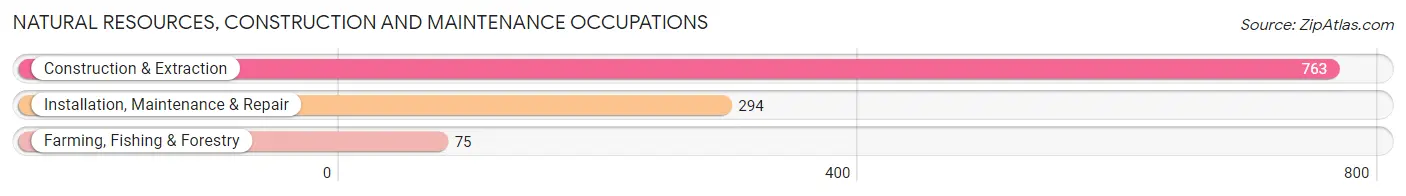
Natural Resources, Construction and Maintenance Occupations
The most common Natural Resources, Construction and Maintenance occupations in South San Jose Hills are Construction & Extraction (763 | 8.6%), Installation, Maintenance & Repair (294 | 3.3%), and Farming, Fishing & Forestry (75 | 0.9%).
Natural Resources, Construction and Maintenance Occupations by Sex
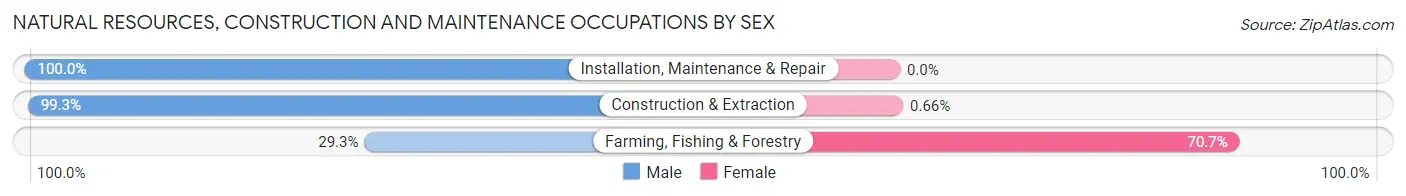
| Occupation | Male | Female |
| Farming, Fishing & Forestry | 22 (29.3%) | 53 (70.7%) |
| Construction & Extraction | 758 (99.3%) | 5 (0.7%) |
| Installation, Maintenance & Repair | 294 (100.0%) | 0 (0.0%) |
| Total (Category) | 1,074 (94.9%) | 58 (5.1%) |
| Total (Overall) | 4,928 (55.5%) | 3,947 (44.5%) |
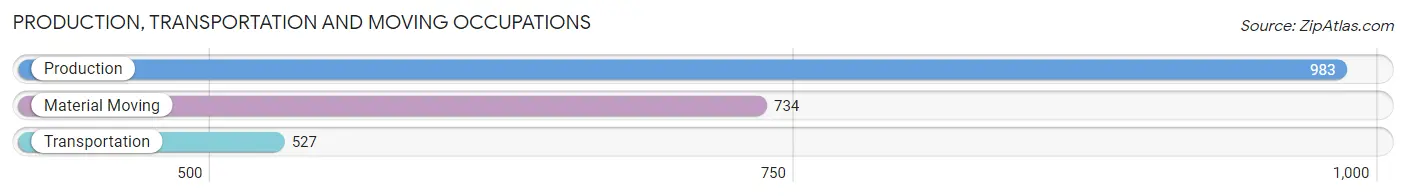
Production, Transportation and Moving Occupations
The most common Production, Transportation and Moving occupations in South San Jose Hills are Production (983 | 11.1%), Material Moving (734 | 8.3%), and Transportation (527 | 5.9%).
Production, Transportation and Moving Occupations by Sex
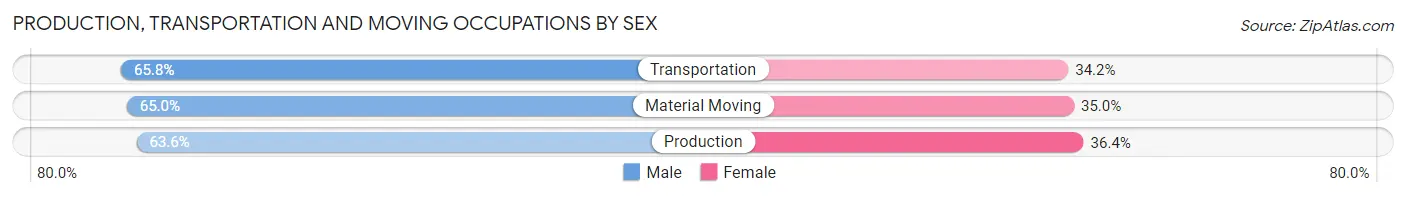
| Occupation | Male | Female |
| Production | 625 (63.6%) | 358 (36.4%) |
| Transportation | 347 (65.8%) | 180 (34.2%) |
| Material Moving | 477 (65.0%) | 257 (35.0%) |
| Total (Category) | 1,449 (64.6%) | 795 (35.4%) |
| Total (Overall) | 4,928 (55.5%) | 3,947 (44.5%) |
Employment Industries by Sex in South San Jose Hills
Employment Industries in South San Jose Hills
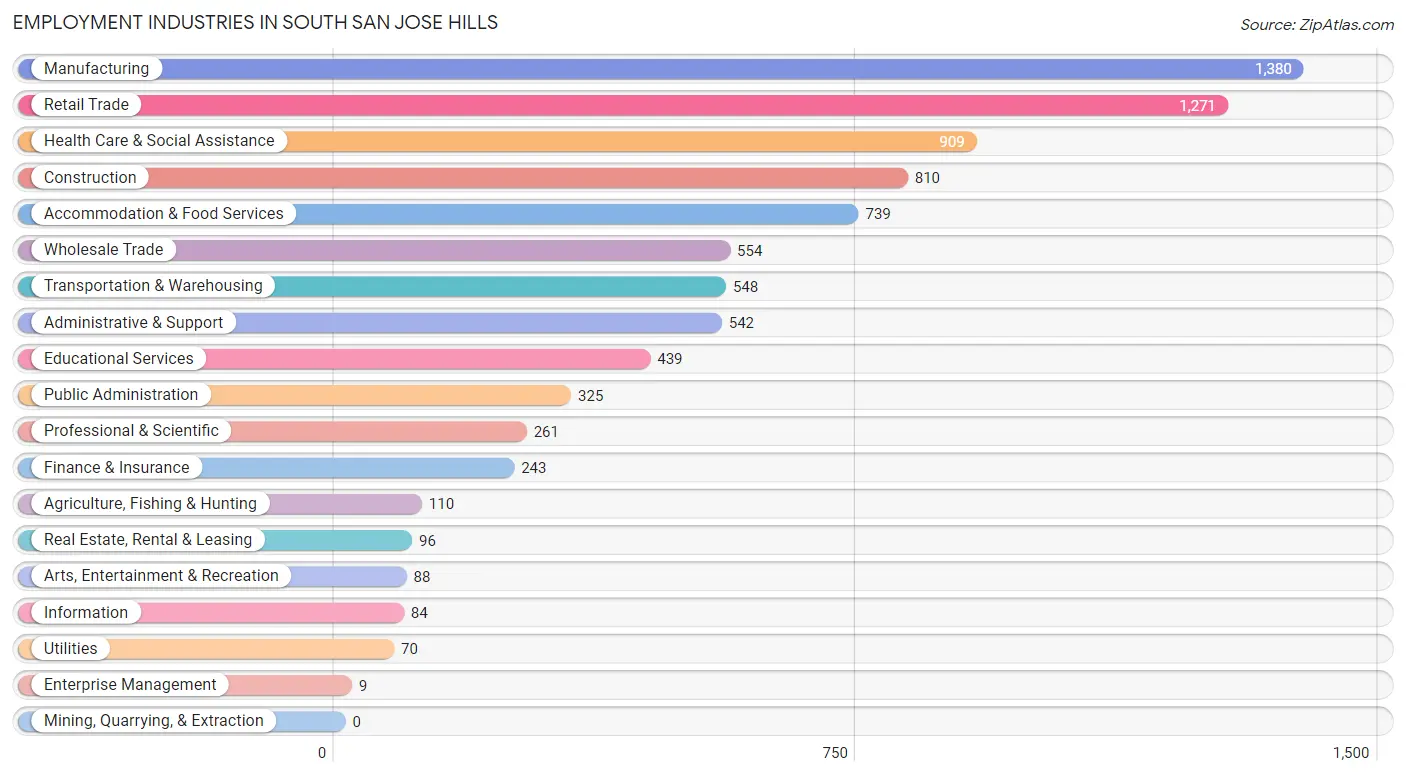
The major employment industries in South San Jose Hills include Manufacturing (1,380 | 15.5%), Retail Trade (1,271 | 14.3%), Health Care & Social Assistance (909 | 10.2%), Construction (810 | 9.1%), and Accommodation & Food Services (739 | 8.3%).
Employment Industries by Sex in South San Jose Hills
The South San Jose Hills industries that see more men than women are Construction (95.9%), Information (91.7%), and Utilities (77.1%), whereas the industries that tend to have a higher number of women are Enterprise Management (100.0%), Agriculture, Fishing & Hunting (80.0%), and Finance & Insurance (70.4%).
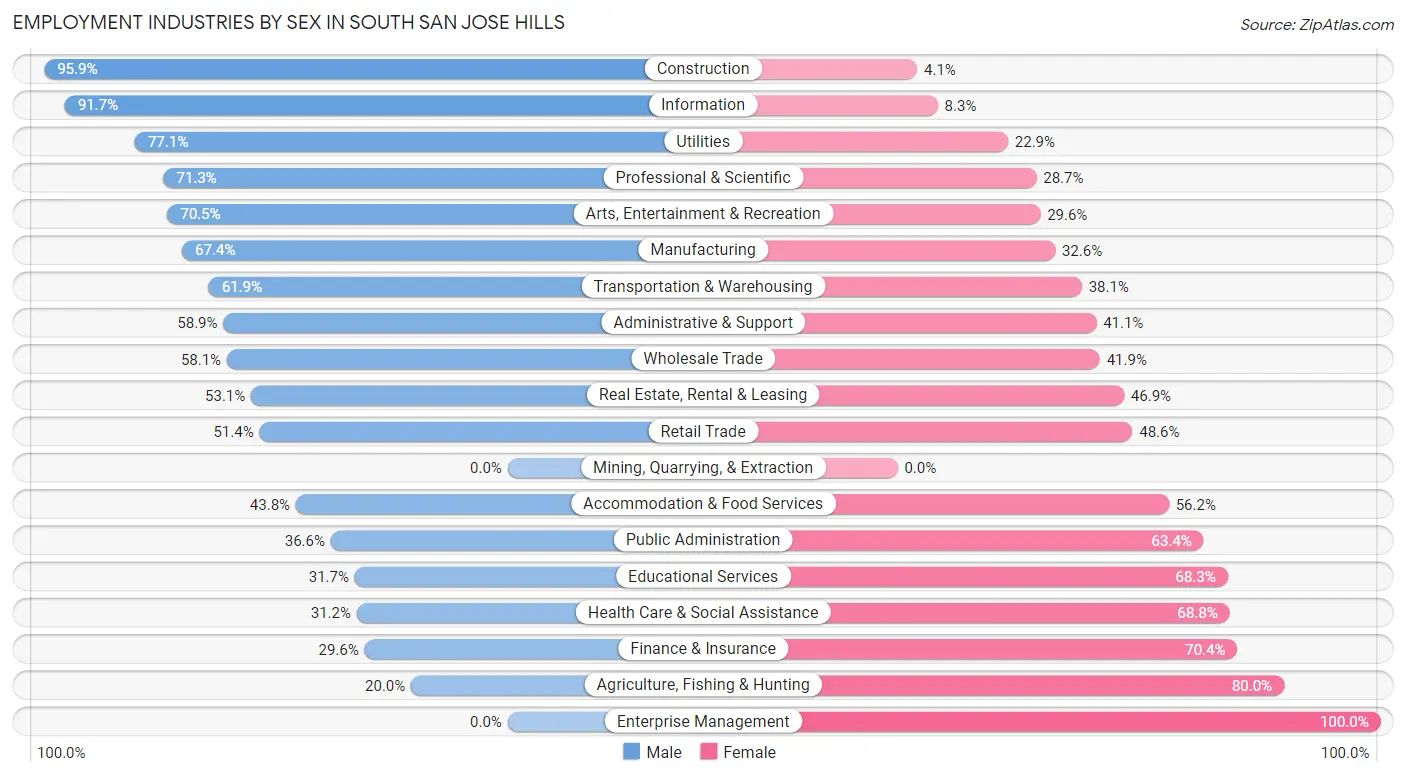
| Industry | Male | Female |
| Agriculture, Fishing & Hunting | 22 (20.0%) | 88 (80.0%) |
| Mining, Quarrying, & Extraction | 0 (0.0%) | 0 (0.0%) |
| Construction | 777 (95.9%) | 33 (4.1%) |
| Manufacturing | 930 (67.4%) | 450 (32.6%) |
| Wholesale Trade | 322 (58.1%) | 232 (41.9%) |
| Retail Trade | 653 (51.4%) | 618 (48.6%) |
| Transportation & Warehousing | 339 (61.9%) | 209 (38.1%) |
| Utilities | 54 (77.1%) | 16 (22.9%) |
| Information | 77 (91.7%) | 7 (8.3%) |
| Finance & Insurance | 72 (29.6%) | 171 (70.4%) |
| Real Estate, Rental & Leasing | 51 (53.1%) | 45 (46.9%) |
| Professional & Scientific | 186 (71.3%) | 75 (28.7%) |
| Enterprise Management | 0 (0.0%) | 9 (100.0%) |
| Administrative & Support | 319 (58.9%) | 223 (41.1%) |
| Educational Services | 139 (31.7%) | 300 (68.3%) |
| Health Care & Social Assistance | 284 (31.2%) | 625 (68.8%) |
| Arts, Entertainment & Recreation | 62 (70.5%) | 26 (29.5%) |
| Accommodation & Food Services | 324 (43.8%) | 415 (56.2%) |
| Public Administration | 119 (36.6%) | 206 (63.4%) |
| Total | 4,928 (55.5%) | 3,947 (44.5%) |
Education in South San Jose Hills
School Enrollment in South San Jose Hills
The most common levels of schooling among the 4,872 students in South San Jose Hills are high school (1,405 | 28.8%), middle school (1,047 | 21.5%), and college / undergraduate (1,025 | 21.0%).
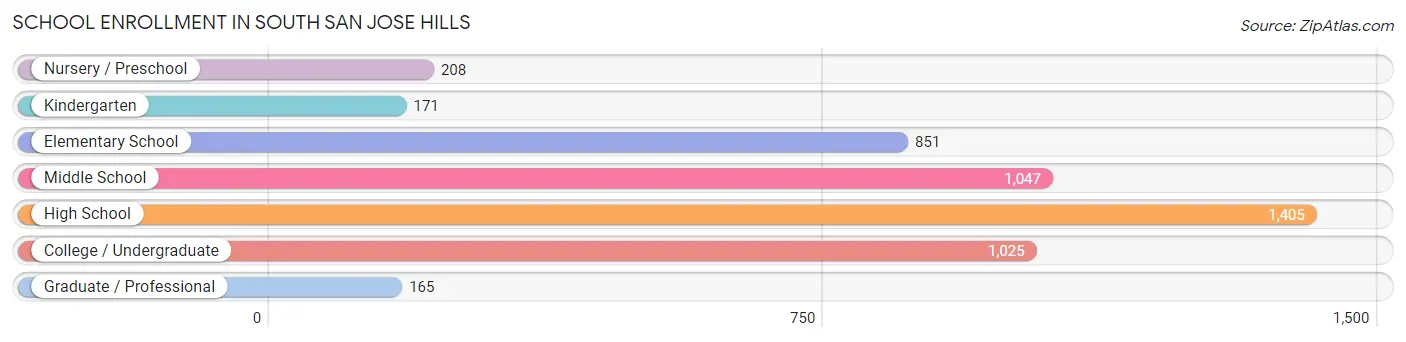
| School Level | # Students | % Students |
| Nursery / Preschool | 208 | 4.3% |
| Kindergarten | 171 | 3.5% |
| Elementary School | 851 | 17.5% |
| Middle School | 1,047 | 21.5% |
| High School | 1,405 | 28.8% |
| College / Undergraduate | 1,025 | 21.0% |
| Graduate / Professional | 165 | 3.4% |
| Total | 4,872 | 100.0% |
School Enrollment by Age by Funding Source in South San Jose Hills
Out of a total of 4,872 students who are enrolled in schools in South San Jose Hills, 224 (4.6%) attend a private institution, while the remaining 4,648 (95.4%) are enrolled in public schools. The age group of 25 to 34 year olds has the highest likelihood of being enrolled in private schools, with 78 (17.7% in the age bracket) enrolled. Conversely, the age group of 10 to 14 year olds has the lowest likelihood of being enrolled in a private school, with 1,465 (100.0% in the age bracket) attending a public institution.
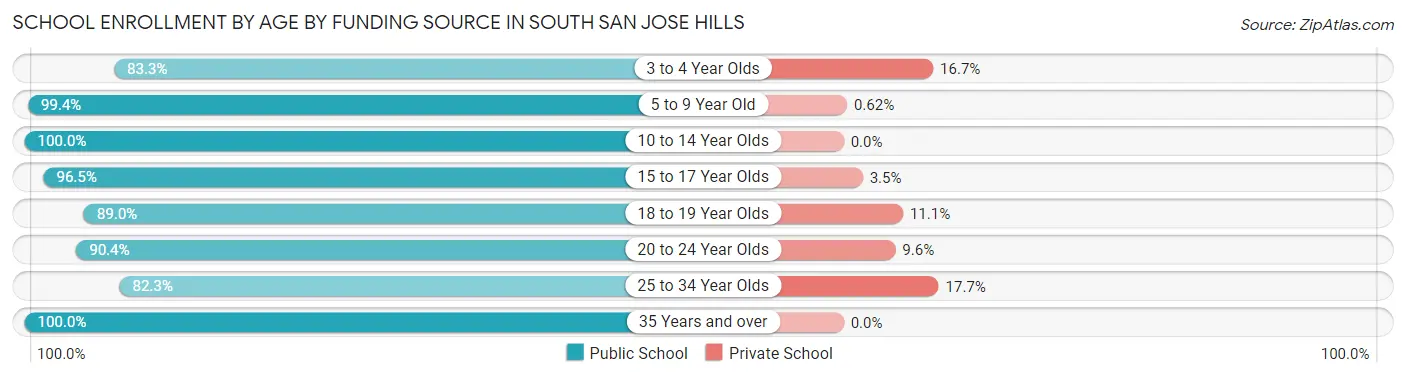
| Age Bracket | Public School | Private School |
| 3 to 4 Year Olds | 115 (83.3%) | 23 (16.7%) |
| 5 to 9 Year Old | 964 (99.4%) | 6 (0.6%) |
| 10 to 14 Year Olds | 1,465 (100.0%) | 0 (0.0%) |
| 15 to 17 Year Olds | 954 (96.5%) | 35 (3.5%) |
| 18 to 19 Year Olds | 314 (88.9%) | 39 (11.1%) |
| 20 to 24 Year Olds | 422 (90.4%) | 45 (9.6%) |
| 25 to 34 Year Olds | 363 (82.3%) | 78 (17.7%) |
| 35 Years and over | 49 (100.0%) | 0 (0.0%) |
| Total | 4,648 (95.4%) | 224 (4.6%) |
Educational Attainment by Field of Study in South San Jose Hills
Business (293 | 20.5%), engineering (261 | 18.2%), social sciences (216 | 15.1%), science & technology (125 | 8.7%), and literature & languages (115 | 8.0%) are the most common fields of study among 1,432 individuals in South San Jose Hills who have obtained a bachelor's degree or higher.
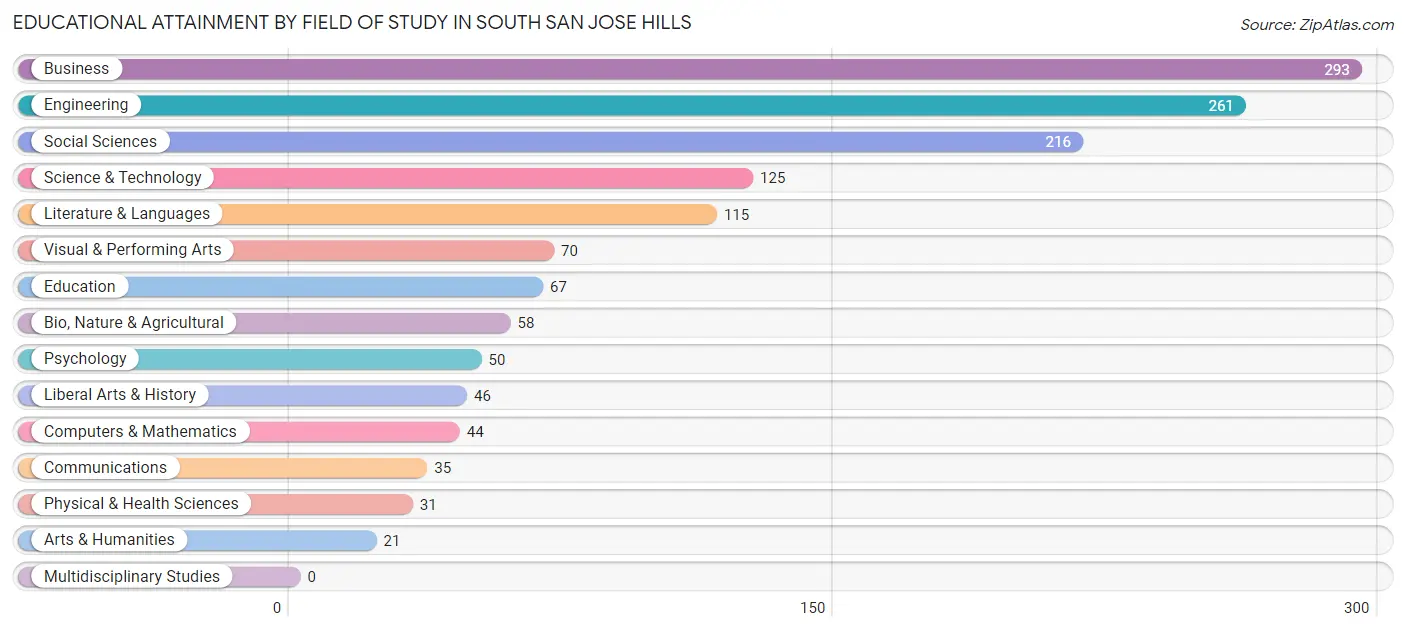
| Field of Study | # Graduates | % Graduates |
| Computers & Mathematics | 44 | 3.1% |
| Bio, Nature & Agricultural | 58 | 4.1% |
| Physical & Health Sciences | 31 | 2.2% |
| Psychology | 50 | 3.5% |
| Social Sciences | 216 | 15.1% |
| Engineering | 261 | 18.2% |
| Multidisciplinary Studies | 0 | 0.0% |
| Science & Technology | 125 | 8.7% |
| Business | 293 | 20.5% |
| Education | 67 | 4.7% |
| Literature & Languages | 115 | 8.0% |
| Liberal Arts & History | 46 | 3.2% |
| Visual & Performing Arts | 70 | 4.9% |
| Communications | 35 | 2.4% |
| Arts & Humanities | 21 | 1.5% |
| Total | 1,432 | 100.0% |
Transportation & Commute in South San Jose Hills
Vehicle Availability by Sex in South San Jose Hills
The most prevalent vehicle ownership categories in South San Jose Hills are males with 2 vehicles (1,362, accounting for 28.3%) and females with 2 vehicles (778, making up 36.6%).
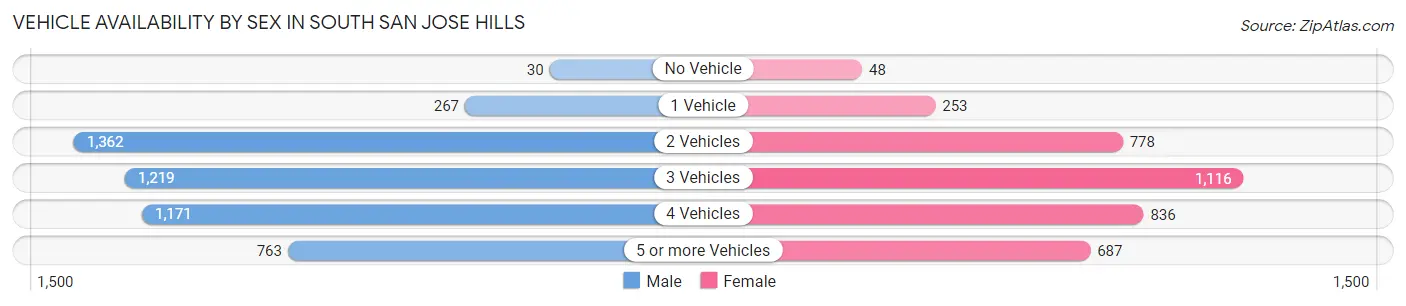
| Vehicles Available | Male | Female |
| No Vehicle | 30 (0.6%) | 48 (1.3%) |
| 1 Vehicle | 267 (5.6%) | 253 (6.8%) |
| 2 Vehicles | 1,362 (28.3%) | 778 (20.9%) |
| 3 Vehicles | 1,219 (25.3%) | 1,116 (30.0%) |
| 4 Vehicles | 1,171 (24.3%) | 836 (22.5%) |
| 5 or more Vehicles | 763 (15.9%) | 687 (18.5%) |
| Total | 4,812 (100.0%) | 3,718 (100.0%) |
Commute Time in South San Jose Hills
The most frequently occuring commute durations in South San Jose Hills are 15 to 19 minutes (1,629 commuters, 19.7%), 30 to 34 minutes (1,305 commuters, 15.8%), and 10 to 14 minutes (1,288 commuters, 15.6%).
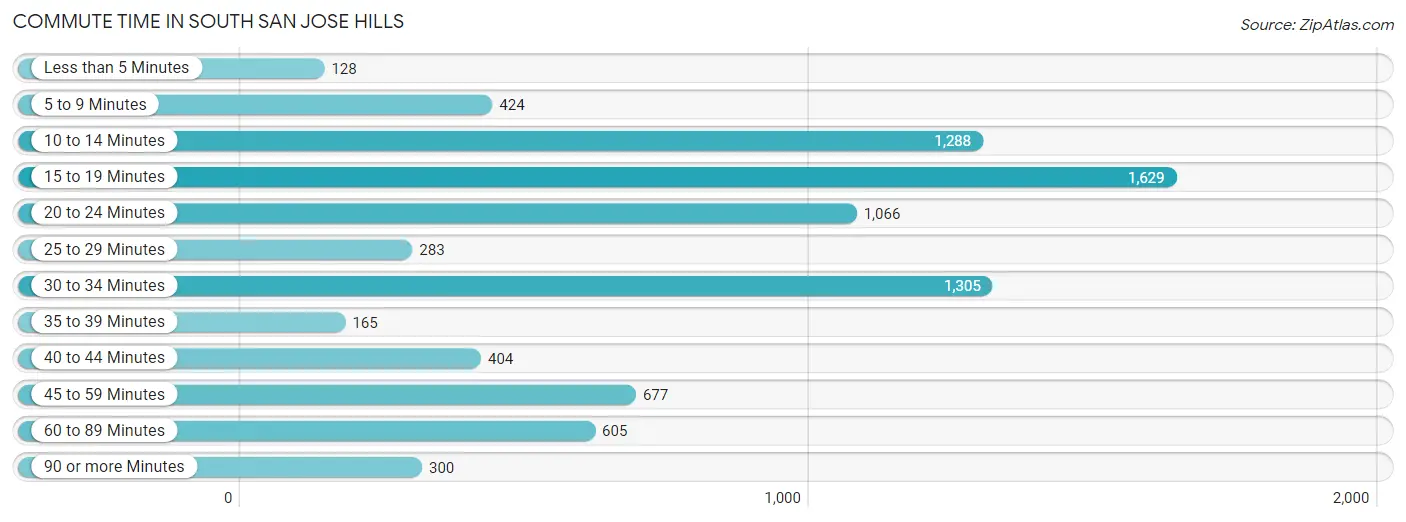
| Commute Time | # Commuters | % Commuters |
| Less than 5 Minutes | 128 | 1.5% |
| 5 to 9 Minutes | 424 | 5.1% |
| 10 to 14 Minutes | 1,288 | 15.6% |
| 15 to 19 Minutes | 1,629 | 19.7% |
| 20 to 24 Minutes | 1,066 | 12.9% |
| 25 to 29 Minutes | 283 | 3.4% |
| 30 to 34 Minutes | 1,305 | 15.8% |
| 35 to 39 Minutes | 165 | 2.0% |
| 40 to 44 Minutes | 404 | 4.9% |
| 45 to 59 Minutes | 677 | 8.2% |
| 60 to 89 Minutes | 605 | 7.3% |
| 90 or more Minutes | 300 | 3.6% |
Commute Time by Sex in South San Jose Hills
The most common commute times in South San Jose Hills are 15 to 19 minutes (904 commuters, 19.4%) for males and 15 to 19 minutes (725 commuters, 20.1%) for females.
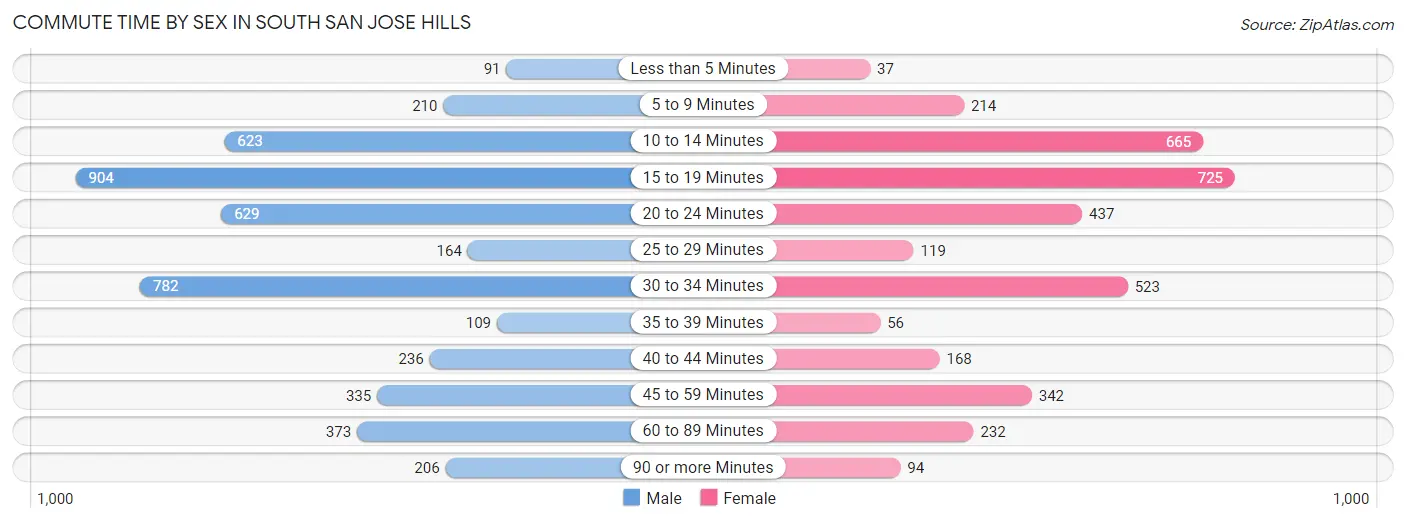
| Commute Time | Male | Female |
| Less than 5 Minutes | 91 (1.9%) | 37 (1.0%) |
| 5 to 9 Minutes | 210 (4.5%) | 214 (5.9%) |
| 10 to 14 Minutes | 623 (13.4%) | 665 (18.4%) |
| 15 to 19 Minutes | 904 (19.4%) | 725 (20.1%) |
| 20 to 24 Minutes | 629 (13.5%) | 437 (12.1%) |
| 25 to 29 Minutes | 164 (3.5%) | 119 (3.3%) |
| 30 to 34 Minutes | 782 (16.8%) | 523 (14.5%) |
| 35 to 39 Minutes | 109 (2.3%) | 56 (1.5%) |
| 40 to 44 Minutes | 236 (5.1%) | 168 (4.6%) |
| 45 to 59 Minutes | 335 (7.2%) | 342 (9.5%) |
| 60 to 89 Minutes | 373 (8.0%) | 232 (6.4%) |
| 90 or more Minutes | 206 (4.4%) | 94 (2.6%) |
Time of Departure to Work by Sex in South San Jose Hills
The most frequent times of departure to work in South San Jose Hills are 7:00 AM to 7:29 AM (682, 14.6%) for males and 7:00 AM to 7:29 AM (522, 14.4%) for females.
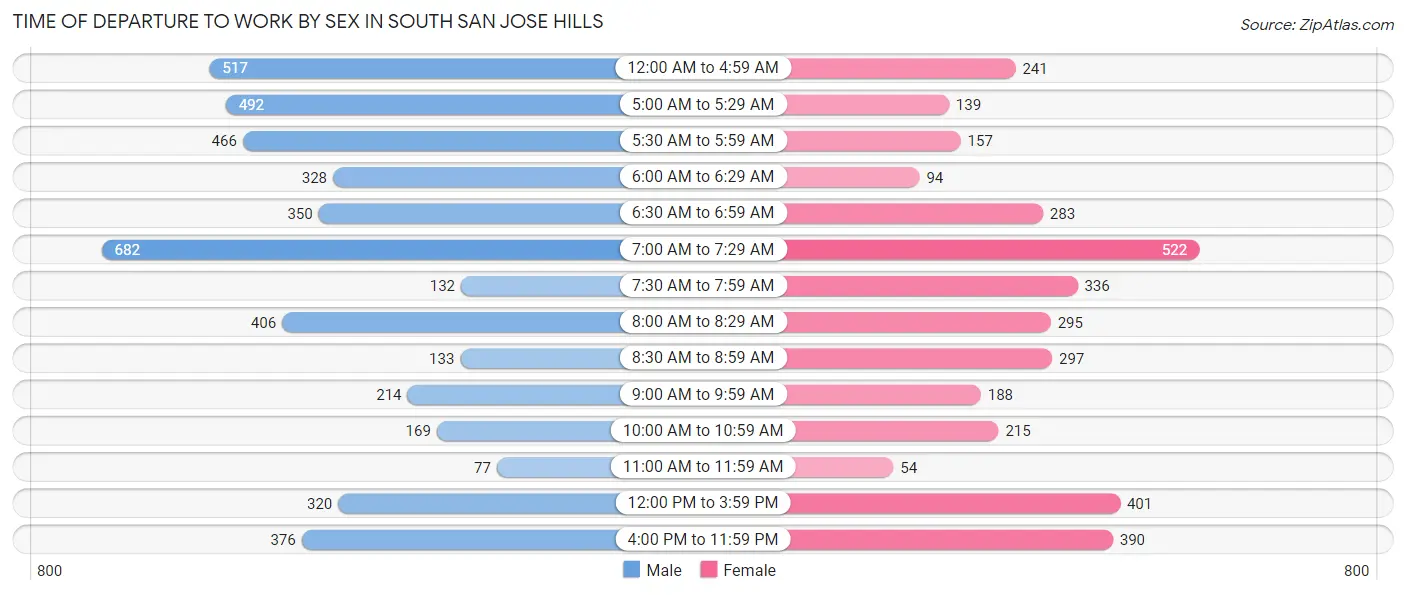
| Time of Departure | Male | Female |
| 12:00 AM to 4:59 AM | 517 (11.1%) | 241 (6.7%) |
| 5:00 AM to 5:29 AM | 492 (10.5%) | 139 (3.8%) |
| 5:30 AM to 5:59 AM | 466 (10.0%) | 157 (4.3%) |
| 6:00 AM to 6:29 AM | 328 (7.0%) | 94 (2.6%) |
| 6:30 AM to 6:59 AM | 350 (7.5%) | 283 (7.8%) |
| 7:00 AM to 7:29 AM | 682 (14.6%) | 522 (14.4%) |
| 7:30 AM to 7:59 AM | 132 (2.8%) | 336 (9.3%) |
| 8:00 AM to 8:29 AM | 406 (8.7%) | 295 (8.2%) |
| 8:30 AM to 8:59 AM | 133 (2.9%) | 297 (8.2%) |
| 9:00 AM to 9:59 AM | 214 (4.6%) | 188 (5.2%) |
| 10:00 AM to 10:59 AM | 169 (3.6%) | 215 (5.9%) |
| 11:00 AM to 11:59 AM | 77 (1.7%) | 54 (1.5%) |
| 12:00 PM to 3:59 PM | 320 (6.9%) | 401 (11.1%) |
| 4:00 PM to 11:59 PM | 376 (8.1%) | 390 (10.8%) |
| Total | 4,662 (100.0%) | 3,612 (100.0%) |
Housing Occupancy in South San Jose Hills
Occupancy by Ownership in South San Jose Hills
Of the total 4,143 dwellings in South San Jose Hills, owner-occupied units account for 3,179 (76.7%), while renter-occupied units make up 964 (23.3%).
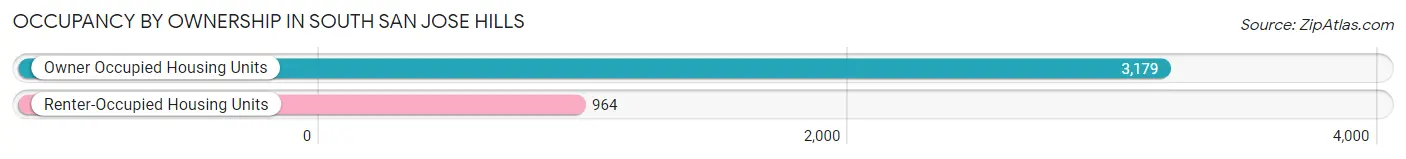
| Occupancy | # Housing Units | % Housing Units |
| Owner Occupied Housing Units | 3,179 | 76.7% |
| Renter-Occupied Housing Units | 964 | 23.3% |
| Total Occupied Housing Units | 4,143 | 100.0% |
Occupancy by Household Size in South San Jose Hills
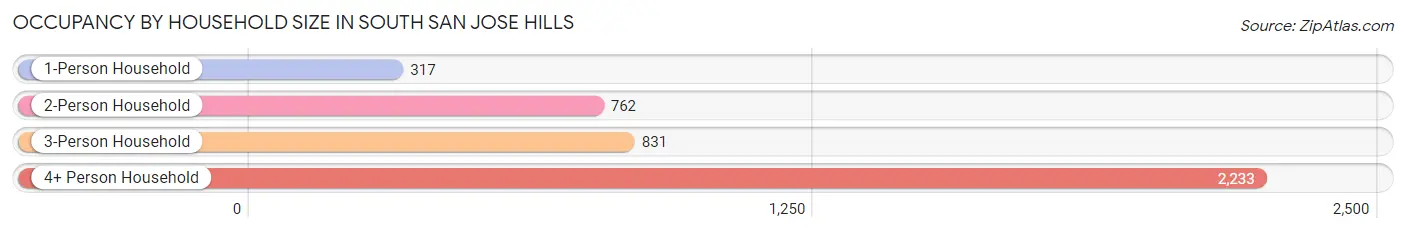
| Household Size | # Housing Units | % Housing Units |
| 1-Person Household | 317 | 7.6% |
| 2-Person Household | 762 | 18.4% |
| 3-Person Household | 831 | 20.1% |
| 4+ Person Household | 2,233 | 53.9% |
| Total Housing Units | 4,143 | 100.0% |
Occupancy by Ownership by Household Size in South San Jose Hills
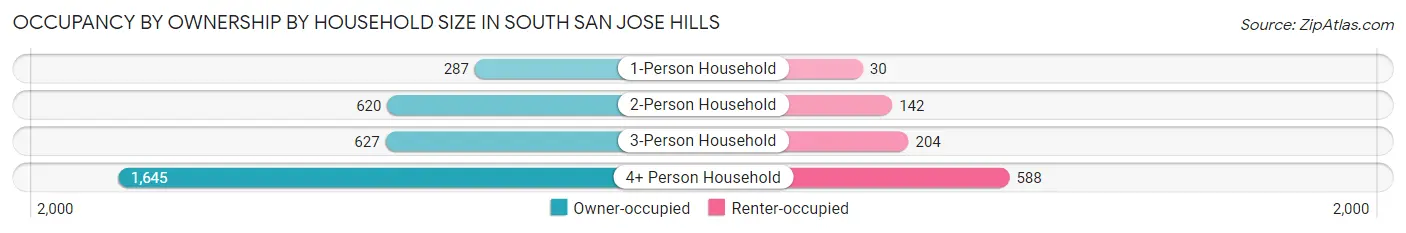
| Household Size | Owner-occupied | Renter-occupied |
| 1-Person Household | 287 (90.5%) | 30 (9.5%) |
| 2-Person Household | 620 (81.4%) | 142 (18.6%) |
| 3-Person Household | 627 (75.4%) | 204 (24.5%) |
| 4+ Person Household | 1,645 (73.7%) | 588 (26.3%) |
| Total Housing Units | 3,179 (76.7%) | 964 (23.3%) |
Occupancy by Educational Attainment in South San Jose Hills
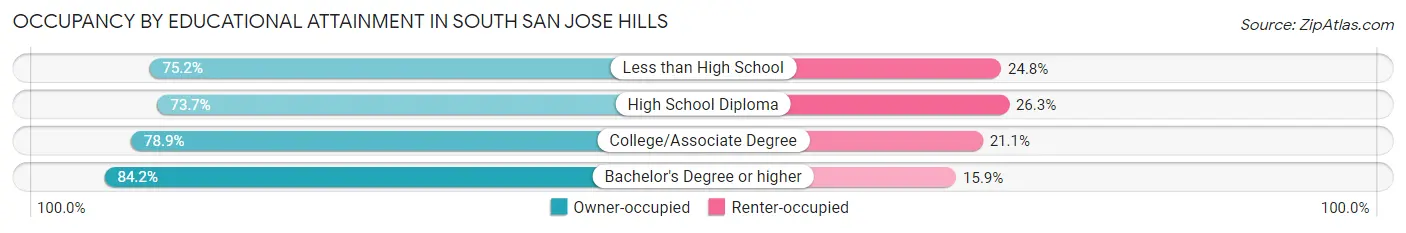
| Household Size | Owner-occupied | Renter-occupied |
| Less than High School | 1,157 (75.2%) | 381 (24.8%) |
| High School Diploma | 828 (73.7%) | 296 (26.3%) |
| College/Associate Degree | 780 (78.9%) | 209 (21.1%) |
| Bachelor's Degree or higher | 414 (84.2%) | 78 (15.9%) |
Occupancy by Age of Householder in South San Jose Hills
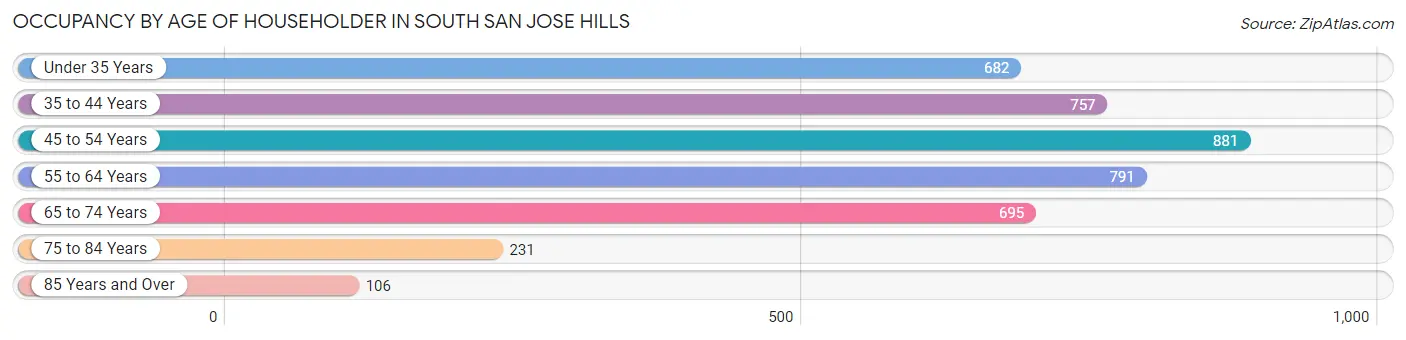
| Age Bracket | # Households | % Households |
| Under 35 Years | 682 | 16.5% |
| 35 to 44 Years | 757 | 18.3% |
| 45 to 54 Years | 881 | 21.3% |
| 55 to 64 Years | 791 | 19.1% |
| 65 to 74 Years | 695 | 16.8% |
| 75 to 84 Years | 231 | 5.6% |
| 85 Years and Over | 106 | 2.6% |
| Total | 4,143 | 100.0% |
Housing Finances in South San Jose Hills
Median Income by Occupancy in South San Jose Hills
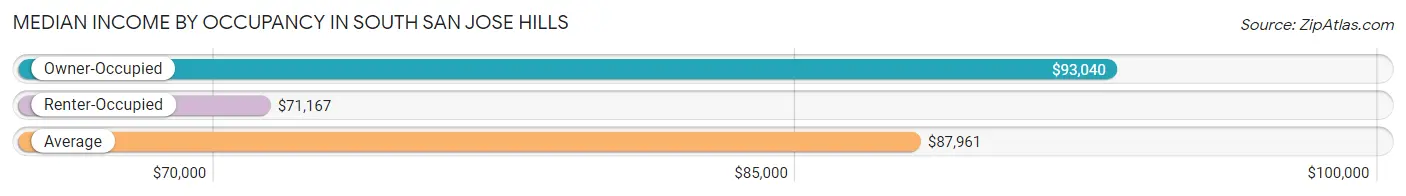
| Occupancy Type | # Households | Median Income |
| Owner-Occupied | 3,179 (76.7%) | $93,040 |
| Renter-Occupied | 964 (23.3%) | $71,167 |
| Average | 4,143 (100.0%) | $87,961 |
Occupancy by Householder Income Bracket in South San Jose Hills
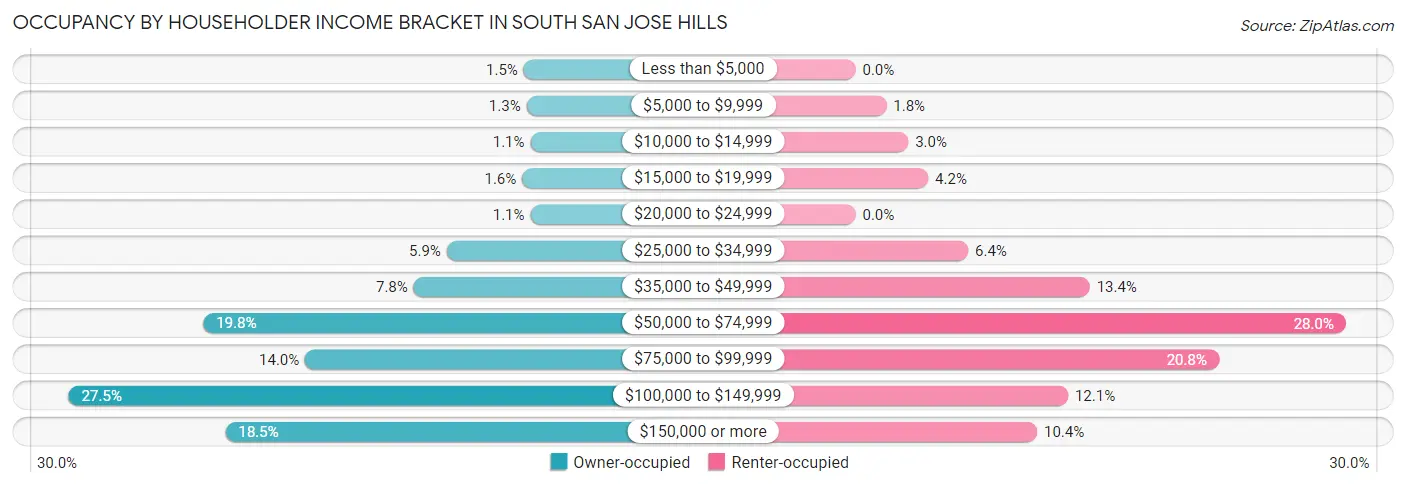
| Income Bracket | Owner-occupied | Renter-occupied |
| Less than $5,000 | 47 (1.5%) | 0 (0.0%) |
| $5,000 to $9,999 | 42 (1.3%) | 17 (1.8%) |
| $10,000 to $14,999 | 35 (1.1%) | 29 (3.0%) |
| $15,000 to $19,999 | 50 (1.6%) | 40 (4.2%) |
| $20,000 to $24,999 | 35 (1.1%) | 0 (0.0%) |
| $25,000 to $34,999 | 187 (5.9%) | 62 (6.4%) |
| $35,000 to $49,999 | 247 (7.8%) | 129 (13.4%) |
| $50,000 to $74,999 | 629 (19.8%) | 270 (28.0%) |
| $75,000 to $99,999 | 444 (14.0%) | 200 (20.7%) |
| $100,000 to $149,999 | 874 (27.5%) | 117 (12.1%) |
| $150,000 or more | 589 (18.5%) | 100 (10.4%) |
| Total | 3,179 (100.0%) | 964 (100.0%) |
Monthly Housing Cost Tiers in South San Jose Hills
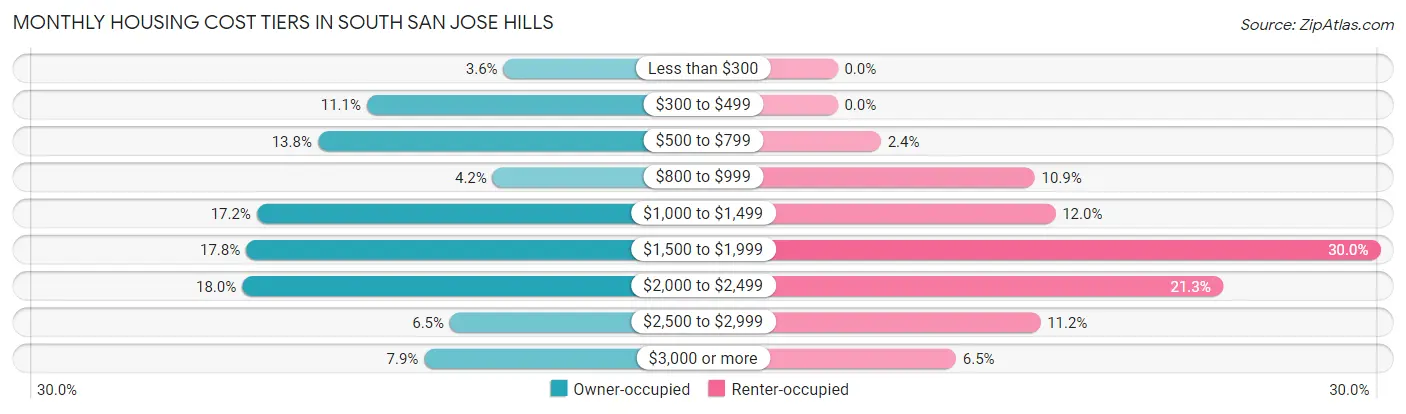
| Monthly Cost | Owner-occupied | Renter-occupied |
| Less than $300 | 113 (3.5%) | 0 (0.0%) |
| $300 to $499 | 353 (11.1%) | 0 (0.0%) |
| $500 to $799 | 439 (13.8%) | 23 (2.4%) |
| $800 to $999 | 132 (4.2%) | 105 (10.9%) |
| $1,000 to $1,499 | 546 (17.2%) | 116 (12.0%) |
| $1,500 to $1,999 | 565 (17.8%) | 289 (30.0%) |
| $2,000 to $2,499 | 572 (18.0%) | 205 (21.3%) |
| $2,500 to $2,999 | 207 (6.5%) | 108 (11.2%) |
| $3,000 or more | 252 (7.9%) | 63 (6.5%) |
| Total | 3,179 (100.0%) | 964 (100.0%) |
Physical Housing Characteristics in South San Jose Hills
Housing Structures in South San Jose Hills
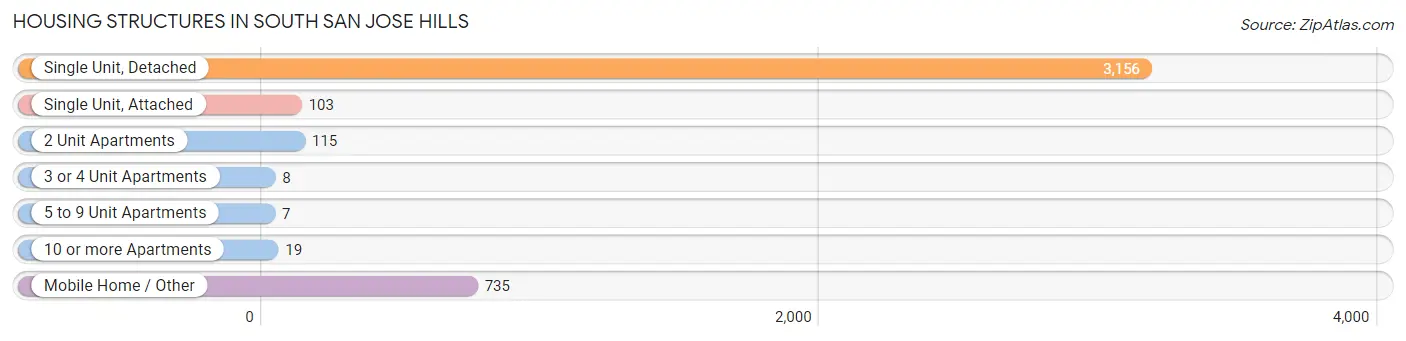
| Structure Type | # Housing Units | % Housing Units |
| Single Unit, Detached | 3,156 | 76.2% |
| Single Unit, Attached | 103 | 2.5% |
| 2 Unit Apartments | 115 | 2.8% |
| 3 or 4 Unit Apartments | 8 | 0.2% |
| 5 to 9 Unit Apartments | 7 | 0.2% |
| 10 or more Apartments | 19 | 0.5% |
| Mobile Home / Other | 735 | 17.7% |
| Total | 4,143 | 100.0% |
Housing Structures by Occupancy in South San Jose Hills
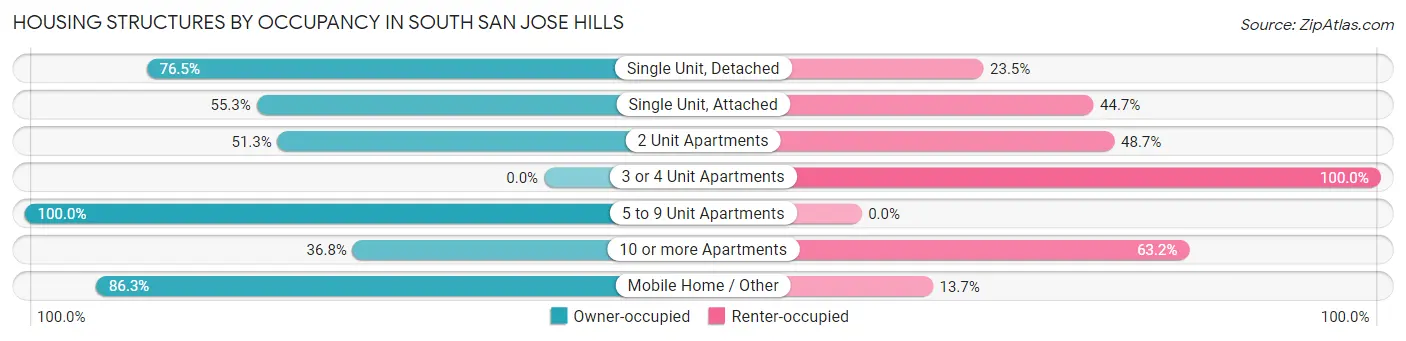
| Structure Type | Owner-occupied | Renter-occupied |
| Single Unit, Detached | 2,415 (76.5%) | 741 (23.5%) |
| Single Unit, Attached | 57 (55.3%) | 46 (44.7%) |
| 2 Unit Apartments | 59 (51.3%) | 56 (48.7%) |
| 3 or 4 Unit Apartments | 0 (0.0%) | 8 (100.0%) |
| 5 to 9 Unit Apartments | 7 (100.0%) | 0 (0.0%) |
| 10 or more Apartments | 7 (36.8%) | 12 (63.2%) |
| Mobile Home / Other | 634 (86.3%) | 101 (13.7%) |
| Total | 3,179 (76.7%) | 964 (23.3%) |
Housing Structures by Number of Rooms in South San Jose Hills
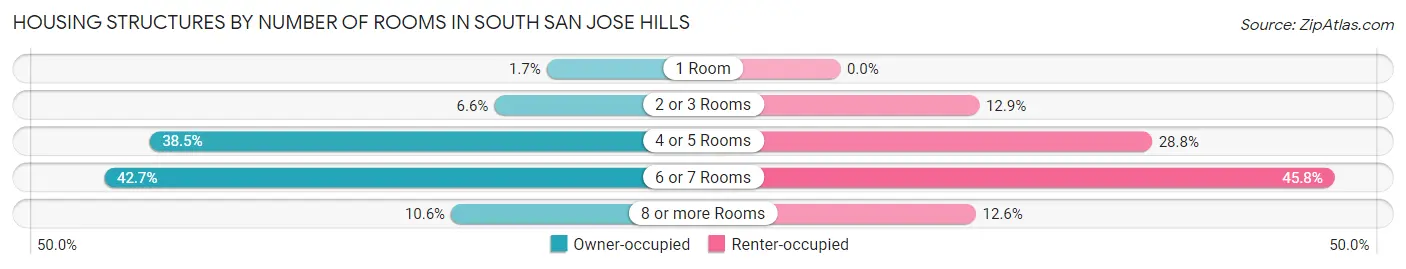
| Number of Rooms | Owner-occupied | Renter-occupied |
| 1 Room | 55 (1.7%) | 0 (0.0%) |
| 2 or 3 Rooms | 209 (6.6%) | 124 (12.9%) |
| 4 or 5 Rooms | 1,223 (38.5%) | 278 (28.8%) |
| 6 or 7 Rooms | 1,356 (42.6%) | 441 (45.8%) |
| 8 or more Rooms | 336 (10.6%) | 121 (12.6%) |
| Total | 3,179 (100.0%) | 964 (100.0%) |
Housing Structure by Heating Type in South San Jose Hills
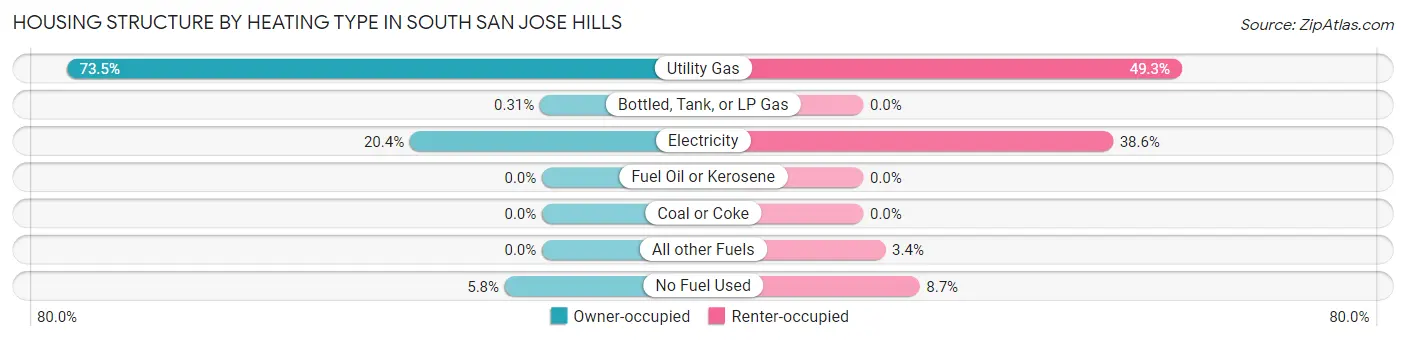
| Heating Type | Owner-occupied | Renter-occupied |
| Utility Gas | 2,337 (73.5%) | 475 (49.3%) |
| Bottled, Tank, or LP Gas | 10 (0.3%) | 0 (0.0%) |
| Electricity | 649 (20.4%) | 372 (38.6%) |
| Fuel Oil or Kerosene | 0 (0.0%) | 0 (0.0%) |
| Coal or Coke | 0 (0.0%) | 0 (0.0%) |
| All other Fuels | 0 (0.0%) | 33 (3.4%) |
| No Fuel Used | 183 (5.8%) | 84 (8.7%) |
| Total | 3,179 (100.0%) | 964 (100.0%) |
Household Vehicle Usage in South San Jose Hills
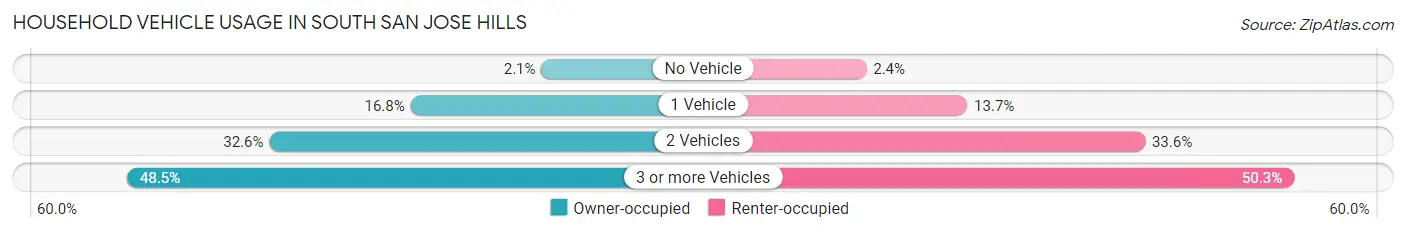
| Vehicles per Household | Owner-occupied | Renter-occupied |
| No Vehicle | 67 (2.1%) | 23 (2.4%) |
| 1 Vehicle | 533 (16.8%) | 132 (13.7%) |
| 2 Vehicles | 1,036 (32.6%) | 324 (33.6%) |
| 3 or more Vehicles | 1,543 (48.5%) | 485 (50.3%) |
| Total | 3,179 (100.0%) | 964 (100.0%) |
Real Estate & Mortgages in South San Jose Hills
Real Estate and Mortgage Overview in South San Jose Hills
| Characteristic | Without Mortgage | With Mortgage |
| Housing Units | 1,234 | 1,945 |
| Median Property Value | $428,900 | $539,600 |
| Median Household Income | $66,000 | $352 |
| Monthly Housing Costs | $615 | $242 |
| Real Estate Taxes | $1,827 | $53 |
Property Value by Mortgage Status in South San Jose Hills
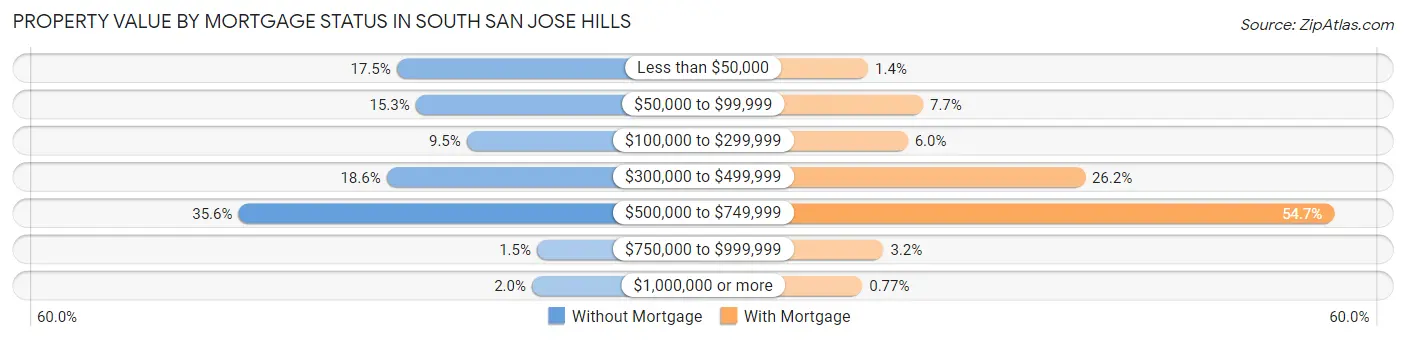
| Property Value | Without Mortgage | With Mortgage |
| Less than $50,000 | 216 (17.5%) | 28 (1.4%) |
| $50,000 to $99,999 | 189 (15.3%) | 150 (7.7%) |
| $100,000 to $299,999 | 117 (9.5%) | 116 (6.0%) |
| $300,000 to $499,999 | 230 (18.6%) | 510 (26.2%) |
| $500,000 to $749,999 | 439 (35.6%) | 1,064 (54.7%) |
| $750,000 to $999,999 | 18 (1.5%) | 62 (3.2%) |
| $1,000,000 or more | 25 (2.0%) | 15 (0.8%) |
| Total | 1,234 (100.0%) | 1,945 (100.0%) |
Household Income by Mortgage Status in South San Jose Hills
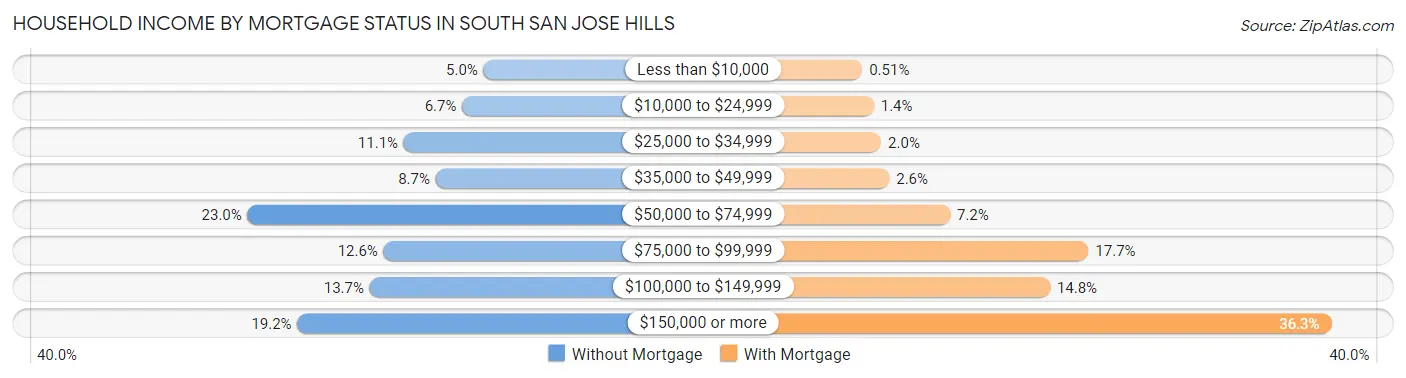
| Household Income | Without Mortgage | With Mortgage |
| Less than $10,000 | 62 (5.0%) | 10 (0.5%) |
| $10,000 to $24,999 | 82 (6.7%) | 27 (1.4%) |
| $25,000 to $34,999 | 137 (11.1%) | 38 (1.9%) |
| $35,000 to $49,999 | 107 (8.7%) | 50 (2.6%) |
| $50,000 to $74,999 | 284 (23.0%) | 140 (7.2%) |
| $75,000 to $99,999 | 156 (12.6%) | 345 (17.7%) |
| $100,000 to $149,999 | 169 (13.7%) | 288 (14.8%) |
| $150,000 or more | 237 (19.2%) | 705 (36.2%) |
| Total | 1,234 (100.0%) | 1,945 (100.0%) |
Property Value to Household Income Ratio in South San Jose Hills
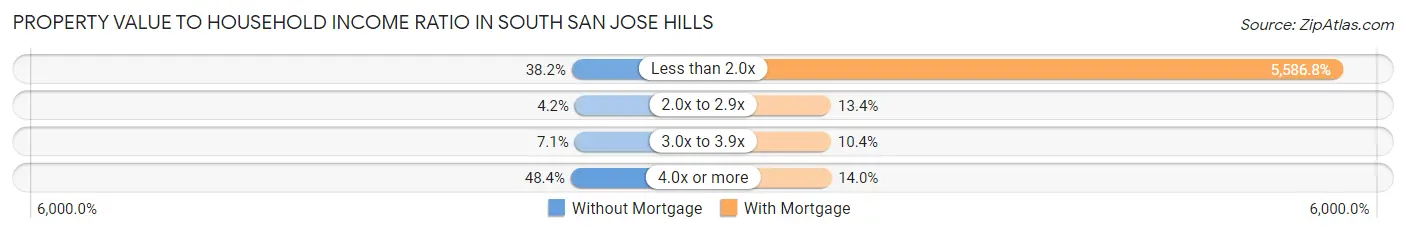
| Value-to-Income Ratio | Without Mortgage | With Mortgage |
| Less than 2.0x | 471 (38.2%) | 108,664 (5,586.8%) |
| 2.0x to 2.9x | 52 (4.2%) | 261 (13.4%) |
| 3.0x to 3.9x | 88 (7.1%) | 202 (10.4%) |
| 4.0x or more | 597 (48.4%) | 273 (14.0%) |
| Total | 1,234 (100.0%) | 1,945 (100.0%) |
Real Estate Taxes by Mortgage Status in South San Jose Hills
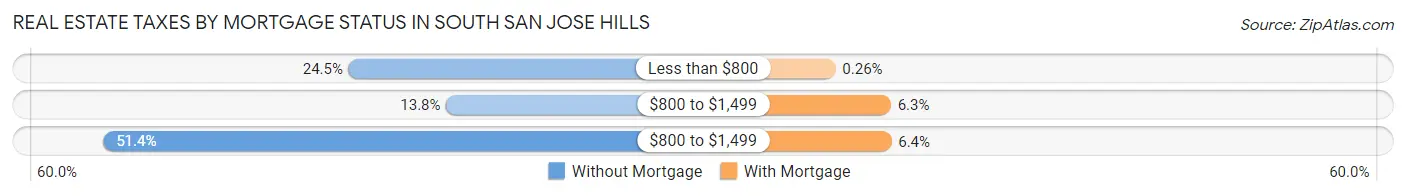
| Property Taxes | Without Mortgage | With Mortgage |
| Less than $800 | 302 (24.5%) | 5 (0.3%) |
| $800 to $1,499 | 170 (13.8%) | 123 (6.3%) |
| $800 to $1,499 | 634 (51.4%) | 124 (6.4%) |
| Total | 1,234 (100.0%) | 1,945 (100.0%) |
Health & Disability in South San Jose Hills
Health Insurance Coverage by Age in South San Jose Hills
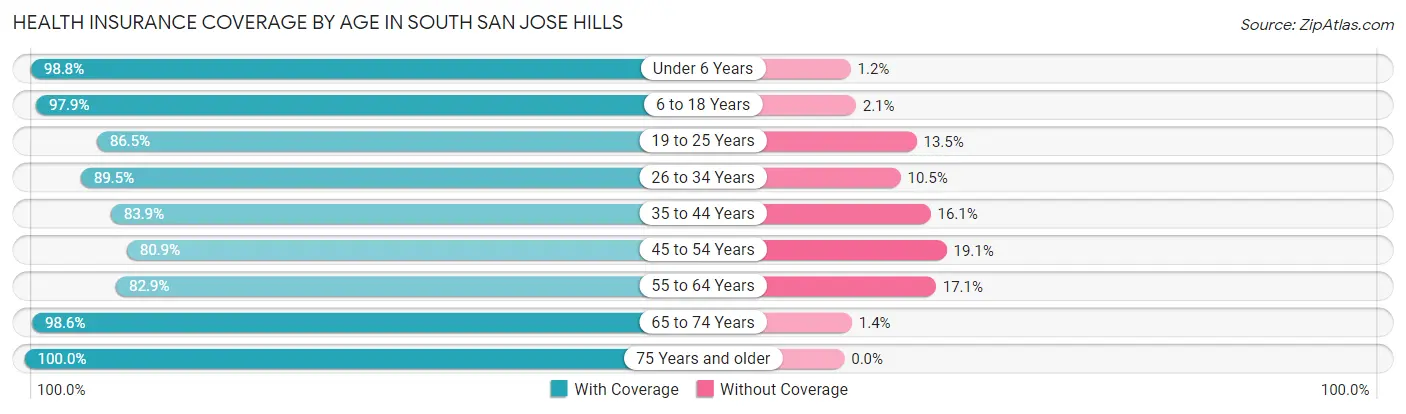
| Age Bracket | With Coverage | Without Coverage |
| Under 6 Years | 1,175 (98.8%) | 14 (1.2%) |
| 6 to 18 Years | 3,388 (97.9%) | 74 (2.1%) |
| 19 to 25 Years | 1,561 (86.5%) | 243 (13.5%) |
| 26 to 34 Years | 2,679 (89.5%) | 314 (10.5%) |
| 35 to 44 Years | 1,916 (83.9%) | 367 (16.1%) |
| 45 to 54 Years | 1,974 (80.9%) | 465 (19.1%) |
| 55 to 64 Years | 1,754 (82.9%) | 361 (17.1%) |
| 65 to 74 Years | 1,472 (98.6%) | 21 (1.4%) |
| 75 Years and older | 935 (100.0%) | 0 (0.0%) |
| Total | 16,854 (90.1%) | 1,859 (9.9%) |
Health Insurance Coverage by Citizenship Status in South San Jose Hills
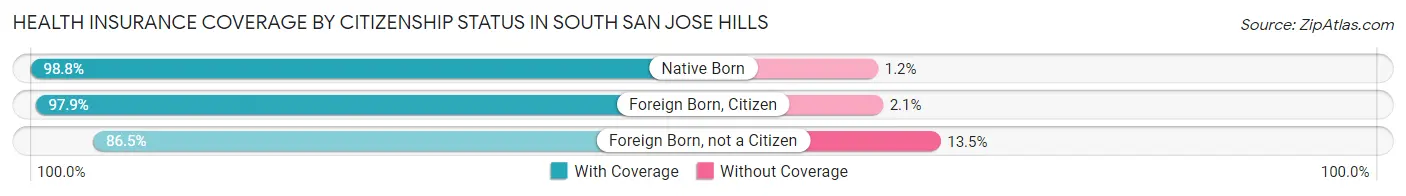
| Citizenship Status | With Coverage | Without Coverage |
| Native Born | 1,175 (98.8%) | 14 (1.2%) |
| Foreign Born, Citizen | 3,388 (97.9%) | 74 (2.1%) |
| Foreign Born, not a Citizen | 1,561 (86.5%) | 243 (13.5%) |
Health Insurance Coverage by Household Income in South San Jose Hills
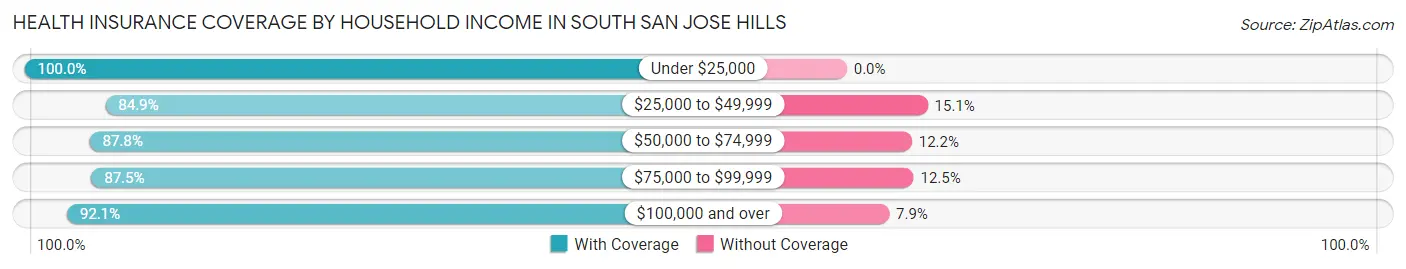
| Household Income | With Coverage | Without Coverage |
| Under $25,000 | 694 (100.0%) | 0 (0.0%) |
| $25,000 to $49,999 | 1,626 (84.9%) | 290 (15.1%) |
| $50,000 to $74,999 | 3,331 (87.8%) | 462 (12.2%) |
| $75,000 to $99,999 | 2,568 (87.5%) | 367 (12.5%) |
| $100,000 and over | 8,565 (92.1%) | 737 (7.9%) |
Public vs Private Health Insurance Coverage by Age in South San Jose Hills
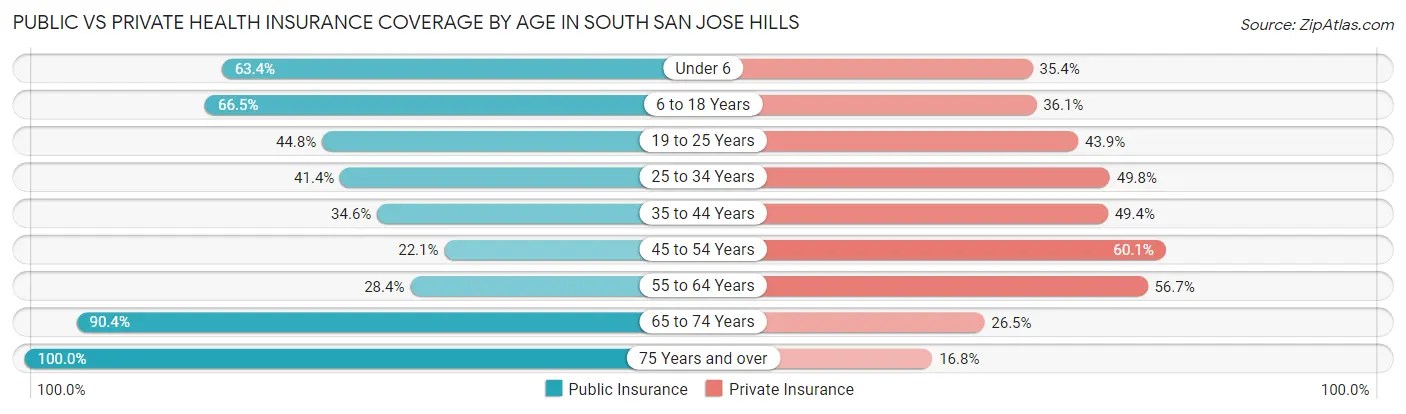
| Age Bracket | Public Insurance | Private Insurance |
| Under 6 | 754 (63.4%) | 421 (35.4%) |
| 6 to 18 Years | 2,302 (66.5%) | 1,249 (36.1%) |
| 19 to 25 Years | 808 (44.8%) | 791 (43.9%) |
| 25 to 34 Years | 1,240 (41.4%) | 1,489 (49.7%) |
| 35 to 44 Years | 789 (34.6%) | 1,127 (49.4%) |
| 45 to 54 Years | 539 (22.1%) | 1,466 (60.1%) |
| 55 to 64 Years | 601 (28.4%) | 1,200 (56.7%) |
| 65 to 74 Years | 1,349 (90.3%) | 395 (26.5%) |
| 75 Years and over | 935 (100.0%) | 157 (16.8%) |
| Total | 9,317 (49.8%) | 8,295 (44.3%) |
Disability Status by Sex by Age in South San Jose Hills
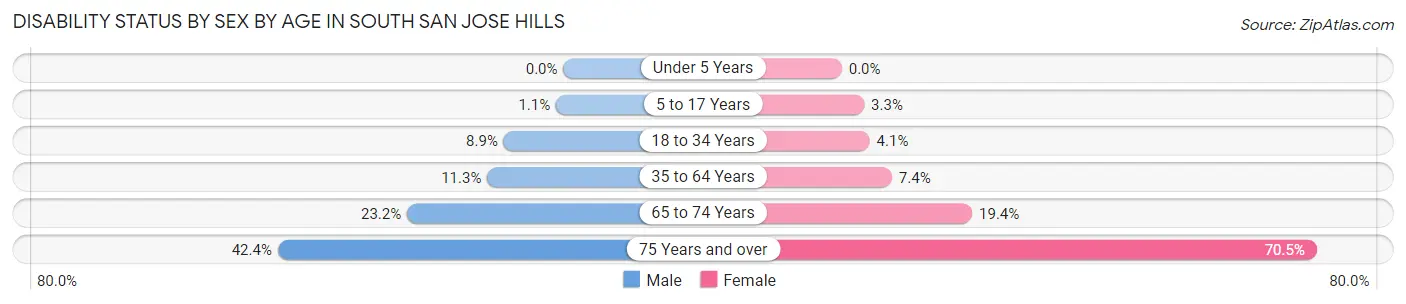
| Age Bracket | Male | Female |
| Under 5 Years | 0 (0.0%) | 0 (0.0%) |
| 5 to 17 Years | 18 (1.1%) | 60 (3.3%) |
| 18 to 34 Years | 232 (8.8%) | 99 (4.1%) |
| 35 to 64 Years | 393 (11.3%) | 250 (7.4%) |
| 65 to 74 Years | 139 (23.2%) | 173 (19.4%) |
| 75 Years and over | 162 (42.4%) | 390 (70.5%) |
Disability Class by Sex by Age in South San Jose Hills
Disability Class: Hearing Difficulty
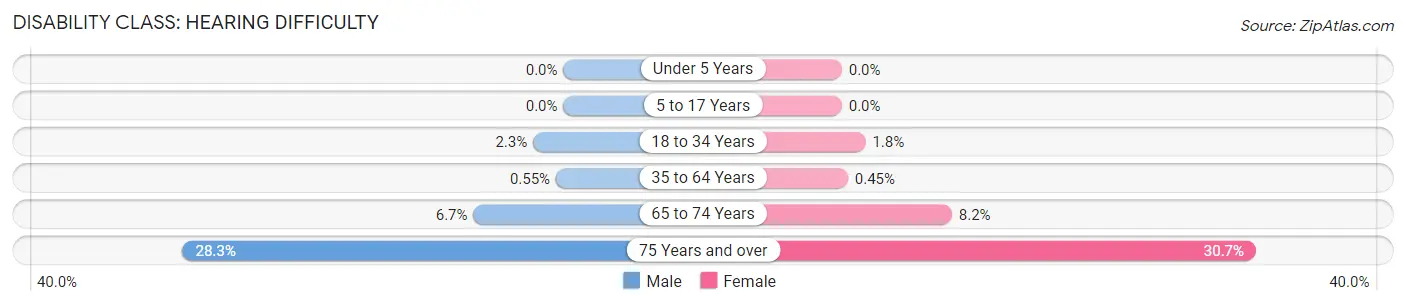
| Age Bracket | Male | Female |
| Under 5 Years | 0 (0.0%) | 0 (0.0%) |
| 5 to 17 Years | 0 (0.0%) | 0 (0.0%) |
| 18 to 34 Years | 59 (2.2%) | 42 (1.8%) |
| 35 to 64 Years | 19 (0.5%) | 15 (0.4%) |
| 65 to 74 Years | 40 (6.7%) | 73 (8.2%) |
| 75 Years and over | 108 (28.3%) | 170 (30.7%) |
Disability Class: Vision Difficulty
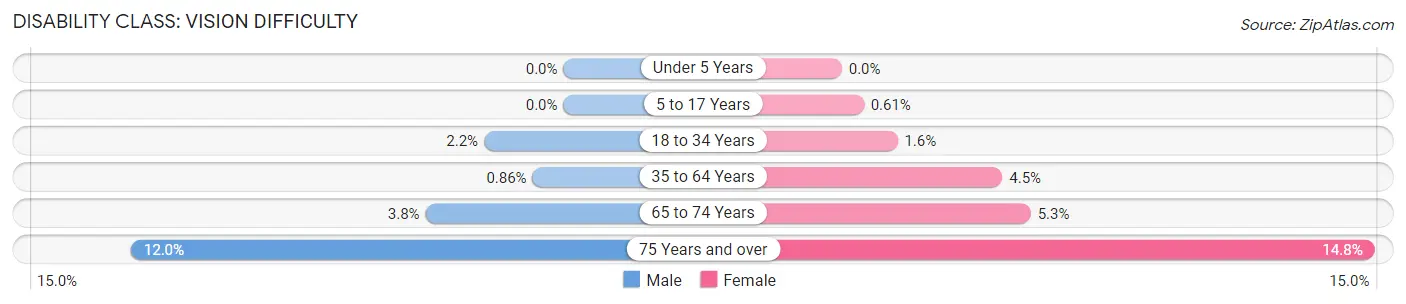
| Age Bracket | Male | Female |
| Under 5 Years | 0 (0.0%) | 0 (0.0%) |
| 5 to 17 Years | 0 (0.0%) | 11 (0.6%) |
| 18 to 34 Years | 58 (2.2%) | 37 (1.5%) |
| 35 to 64 Years | 30 (0.9%) | 150 (4.5%) |
| 65 to 74 Years | 23 (3.8%) | 47 (5.3%) |
| 75 Years and over | 46 (12.0%) | 82 (14.8%) |
Disability Class: Cognitive Difficulty
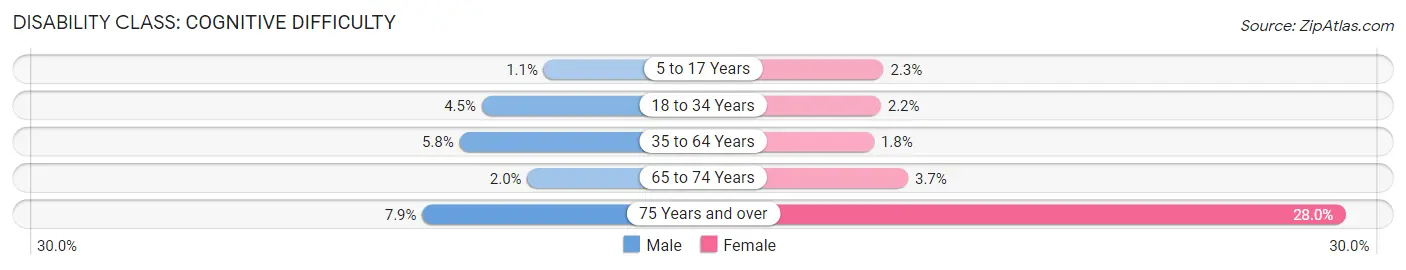
| Age Bracket | Male | Female |
| 5 to 17 Years | 18 (1.1%) | 42 (2.3%) |
| 18 to 34 Years | 119 (4.5%) | 52 (2.2%) |
| 35 to 64 Years | 201 (5.8%) | 60 (1.8%) |
| 65 to 74 Years | 12 (2.0%) | 33 (3.7%) |
| 75 Years and over | 30 (7.9%) | 155 (28.0%) |
Disability Class: Ambulatory Difficulty
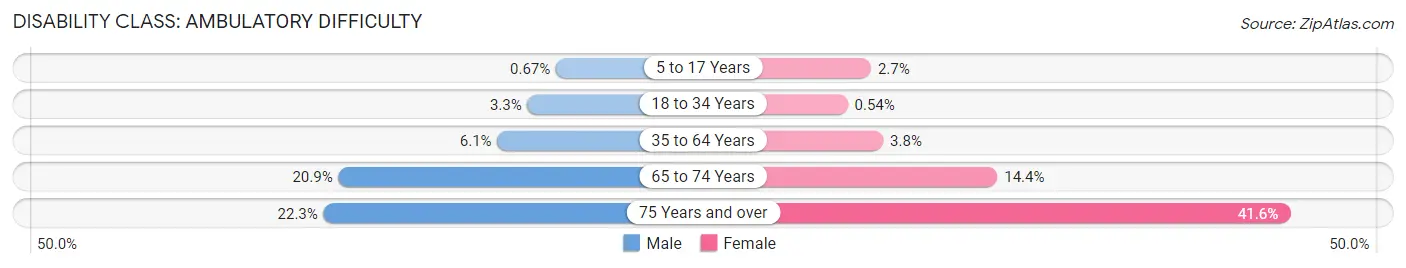
| Age Bracket | Male | Female |
| 5 to 17 Years | 11 (0.7%) | 49 (2.7%) |
| 18 to 34 Years | 87 (3.3%) | 13 (0.5%) |
| 35 to 64 Years | 213 (6.1%) | 129 (3.8%) |
| 65 to 74 Years | 125 (20.9%) | 129 (14.4%) |
| 75 Years and over | 85 (22.3%) | 230 (41.6%) |
Disability Class: Self-Care Difficulty
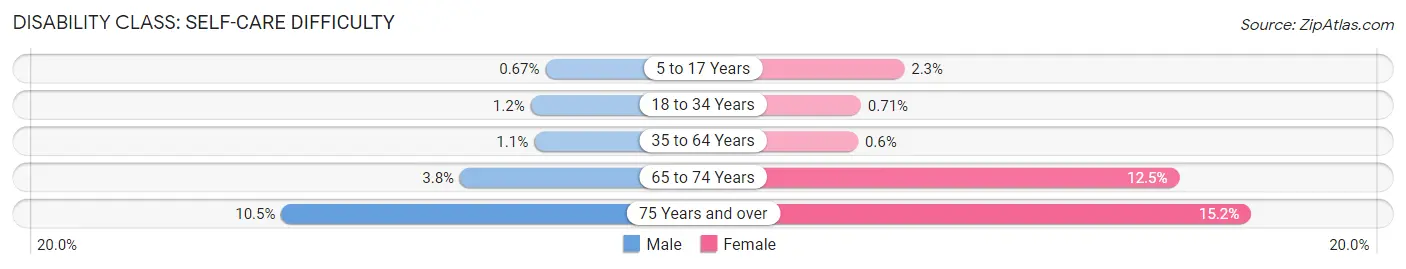
| Age Bracket | Male | Female |
| 5 to 17 Years | 11 (0.7%) | 42 (2.3%) |
| 18 to 34 Years | 32 (1.2%) | 17 (0.7%) |
| 35 to 64 Years | 38 (1.1%) | 20 (0.6%) |
| 65 to 74 Years | 23 (3.8%) | 112 (12.5%) |
| 75 Years and over | 40 (10.5%) | 84 (15.2%) |
Technology Access in South San Jose Hills
Computing Device Access in South San Jose Hills
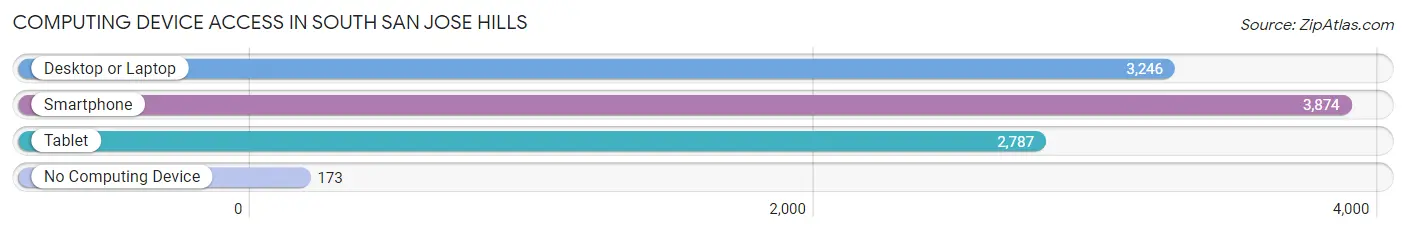
| Device Type | # Households | % Households |
| Desktop or Laptop | 3,246 | 78.3% |
| Smartphone | 3,874 | 93.5% |
| Tablet | 2,787 | 67.3% |
| No Computing Device | 173 | 4.2% |
| Total | 4,143 | 100.0% |
Internet Access in South San Jose Hills
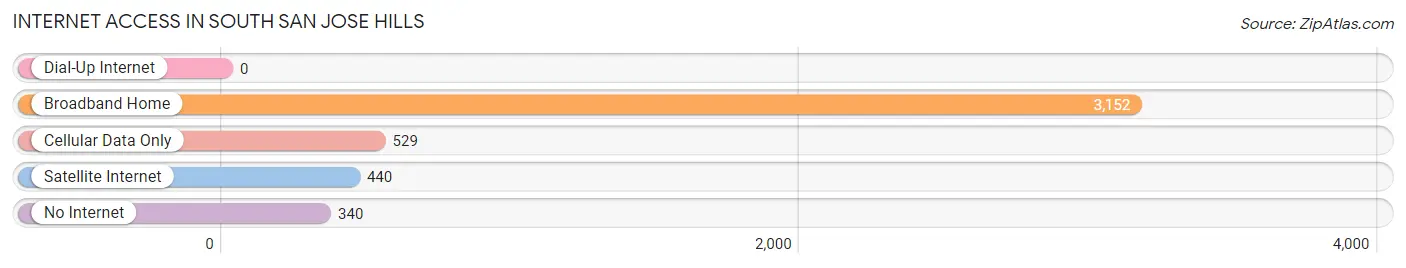
| Internet Type | # Households | % Households |
| Dial-Up Internet | 0 | 0.0% |
| Broadband Home | 3,152 | 76.1% |
| Cellular Data Only | 529 | 12.8% |
| Satellite Internet | 440 | 10.6% |
| No Internet | 340 | 8.2% |
| Total | 4,143 | 100.0% |
South San Jose Hills Summary
San Jose Hills is a census-designated place (CDP) located in Los Angeles County, California. It is located in the San Gabriel Valley, just south of the city of San Jose. The population was 8,919 at the 2010 census, up from 8,717 at the 2000 census.
History
San Jose Hills was originally part of the Rancho San Jose, a Mexican land grant given to Antonio Maria Lugo in 1845. The area was later developed as a citrus and walnut grove. In the early 1900s, the area was subdivided and developed as a residential community.
Geography
San Jose Hills is located at 34°2'17" North, 118°2'17" West (34.038, -118.038). It is bordered by the cities of La Puente to the north, West Covina to the east, and Industry to the south.
According to the United States Census Bureau, the CDP has a total area of 1.2 square miles (3.2 km2), all of it land.
Economy
San Jose Hills is primarily a residential community, with no major employers located within the CDP. The nearest major employers are located in the nearby cities of La Puente, West Covina, and Industry.
Demographics
As of the census of 2000, there were 8,717 people, 2,717 households, and 2,093 families residing in the CDP. The population density was 7,093.3 people per square mile (2,737.2/km2). There were 2,817 housing units at an average density of 2,310.2 per square mile (892.2/km2). The racial makeup of the CDP was 57.2% White, 1.2% African American, 1.2% Native American, 8.2% Asian, 0.2% Pacific Islander, 28.2% from other races, and 4.0% from two or more races. Hispanic or Latino of any race were 63.2% of the population.
There were 2,717 households, out of which 37.2% had children under the age of 18 living with them, 51.2% were married couples living together, 15.2% had a female householder with no husband present, and 25.2% were non-families. 19.2% of all households were made up of individuals, and 6.2% had someone living alone who was 65 years of age or older. The average household size was 3.2 and the average family size was 3.6.
In the CDP, the population was spread out, with 28.2% under the age of 18, 10.2% from 18 to 24, 32.2% from 25 to 44, 19.2% from 45 to 64, and 10.2% who were 65 years of age or older. The median age was 32 years. For every 100 females, there were 97.2 males. For every 100 females age 18 and over, there were 94.2 males.
The median income for a household in the CDP was $41,944, and the median income for a family was $45,938. Males had a median income of $31,944 versus $27,944 for females. The per capita income for the CDP was $15,944. About 11.2% of families and 13.2% of the population were below the poverty line, including 17.2% of those under age 18 and 8.2% of those age 65 or over.
Common Questions
What is Per Capita Income in South San Jose Hills?
Per Capita income in South San Jose Hills is $22,919.
What is the Median Family Income in South San Jose Hills?
Median Family Income in South San Jose Hills is $83,750.
What is the Median Household income in South San Jose Hills?
Median Household Income in South San Jose Hills is $87,961.
What is Income or Wage Gap in South San Jose Hills?
Income or Wage Gap in South San Jose Hills is 22.0%.
Women in South San Jose Hills earn 78.0 cents for every dollar earned by a man.
What is Family Income Deficit in South San Jose Hills?
Family Income Deficit in South San Jose Hills is $13,973.
Families that are below poverty line in South San Jose Hills earn $13,973 less on average than the poverty threshold level.
What is Inequality or Gini Index in South San Jose Hills?
Inequality or Gini Index in South San Jose Hills is 0.34.
What is the Total Population of South San Jose Hills?
Total Population of South San Jose Hills is 18,717.
What is the Total Male Population of South San Jose Hills?
Total Male Population of South San Jose Hills is 9,258.
What is the Total Female Population of South San Jose Hills?
Total Female Population of South San Jose Hills is 9,459.
What is the Ratio of Males per 100 Females in South San Jose Hills?
There are 97.88 Males per 100 Females in South San Jose Hills.
What is the Ratio of Females per 100 Males in South San Jose Hills?
There are 102.17 Females per 100 Males in South San Jose Hills.
What is the Median Population Age in South San Jose Hills?
Median Population Age in South San Jose Hills is 34.7 Years.
What is the Average Family Size in South San Jose Hills
Average Family Size in South San Jose Hills is 4.4 People.
What is the Average Household Size in South San Jose Hills
Average Household Size in South San Jose Hills is 4.5 People.
How Large is the Labor Force in South San Jose Hills?
There are 9,727 People in the Labor Forcein in South San Jose Hills.
What is the Percentage of People in the Labor Force in South San Jose Hills?
65.0% of People are in the Labor Force in South San Jose Hills.
What is the Unemployment Rate in South San Jose Hills?
Unemployment Rate in South San Jose Hills is 8.7%.