Cities with the Lowest Percentage of Births to Unmarried Women over the Age of 35 in Massachusetts
RELATED REPORTS & OPTIONS
Lowest Illegitimacy | Women 35+
Massachusetts
Compare Cities
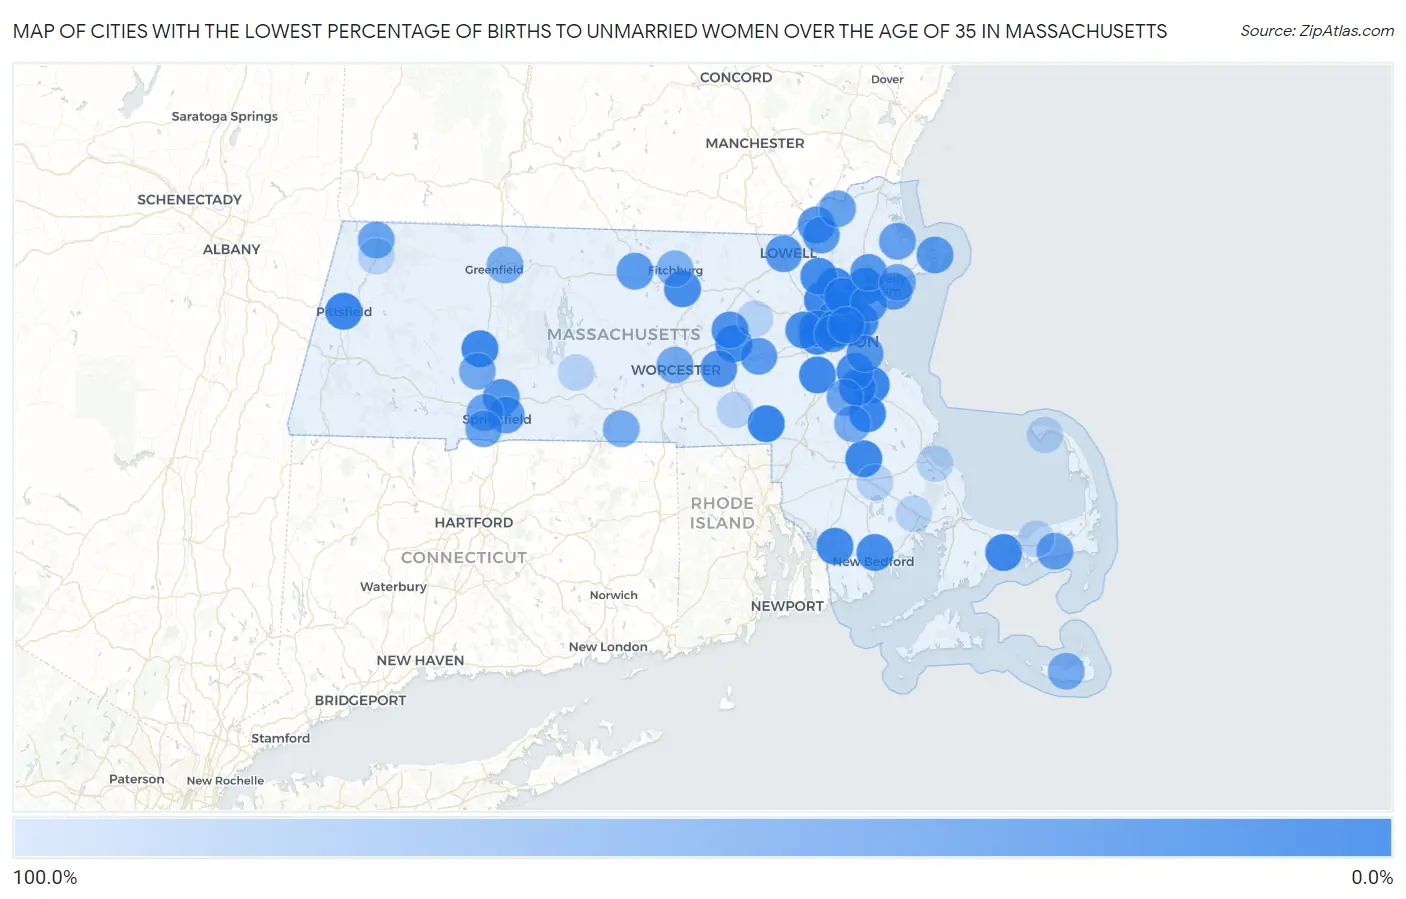
Map of Cities with the Lowest Percentage of Births to Unmarried Women over the Age of 35 in Massachusetts
100.0%
0.0%
Cities with the Lowest Percentage of Births to Unmarried Women over the Age of 35 in Massachusetts
| City | % Unmarried | vs State | vs National | |
| 1. | Malden | 1.3% | 14.4%(-13.1)#1 | 20.1%(-18.8)#11 |
| 2. | Franklin Town | 1.9% | 14.4%(-12.5)#2 | 20.1%(-18.2)#21 |
| 3. | Pittsfield | 4.3% | 14.4%(-10.1)#3 | 20.1%(-15.8)#84 |
| 4. | Weymouth Town | 4.5% | 14.4%(-9.90)#4 | 20.1%(-15.6)#91 |
| 5. | Woburn | 4.6% | 14.4%(-9.80)#5 | 20.1%(-15.5)#102 |
| 6. | Peabody | 4.7% | 14.4%(-9.70)#6 | 20.1%(-15.4)#103 |
| 7. | Abington | 5.0% | 14.4%(-9.40)#7 | 20.1%(-15.1)#120 |
| 8. | Medford | 5.2% | 14.4%(-9.20)#8 | 20.1%(-14.9)#128 |
| 9. | Marlborough | 5.6% | 14.4%(-8.80)#9 | 20.1%(-14.5)#145 |
| 10. | Bridgewater Town | 5.9% | 14.4%(-8.50)#10 | 20.1%(-14.2)#162 |
| 11. | Northampton | 6.6% | 14.4%(-7.80)#11 | 20.1%(-13.5)#189 |
| 12. | Barnstable Town | 6.9% | 14.4%(-7.50)#12 | 20.1%(-13.2)#197 |
| 13. | Reading | 6.9% | 14.4%(-7.50)#13 | 20.1%(-13.2)#200 |
| 14. | Braintree Town | 7.0% | 14.4%(-7.40)#14 | 20.1%(-13.1)#206 |
| 15. | Chelsea | 7.5% | 14.4%(-6.90)#15 | 20.1%(-12.6)#228 |
| 16. | Watertown Town | 8.4% | 14.4%(-6.00)#16 | 20.1%(-11.7)#276 |
| 17. | Dedham | 8.5% | 14.4%(-5.90)#17 | 20.1%(-11.6)#280 |
| 18. | Fall River | 9.5% | 14.4%(-4.90)#18 | 20.1%(-10.6)#321 |
| 19. | Melrose | 9.7% | 14.4%(-4.70)#19 | 20.1%(-10.4)#334 |
| 20. | Wilmington | 11.8% | 14.4%(-2.60)#20 | 20.1%(-8.30)#425 |
| 21. | Quincy | 13.2% | 14.4%(-1.20)#21 | 20.1%(-6.90)#500 |
| 22. | Leominster | 13.5% | 14.4%(-0.900)#22 | 20.1%(-6.60)#519 |
| 23. | Belmont | 13.5% | 14.4%(-0.900)#23 | 20.1%(-6.60)#521 |
| 24. | New Bedford | 13.6% | 14.4%(-0.800)#24 | 20.1%(-6.50)#522 |
| 25. | Waltham | 15.6% | 14.4%(+1.20)#25 | 20.1%(-4.50)#651 |
| 26. | Somerville | 15.8% | 14.4%(+1.40)#26 | 20.1%(-4.30)#659 |
| 27. | Revere | 16.2% | 14.4%(+1.80)#27 | 20.1%(-3.90)#682 |
| 28. | Hudson | 19.5% | 14.4%(+5.10)#28 | 20.1%(-0.600)#855 |
| 29. | Greenfield | 19.8% | 14.4%(+5.40)#29 | 20.1%(-0.300)#864 |
| 30. | Westborough | 20.6% | 14.4%(+6.20)#30 | 20.1%(+0.500)#913 |
| 31. | Methuen Town | 21.4% | 14.4%(+7.00)#31 | 20.1%(+1.30)#947 |
| 32. | Chicopee | 22.4% | 14.4%(+8.00)#32 | 20.1%(+2.30)#1,001 |
| 33. | Wakefield | 22.5% | 14.4%(+8.10)#33 | 20.1%(+2.40)#1,007 |
| 34. | Salem | 22.9% | 14.4%(+8.50)#34 | 20.1%(+2.80)#1,016 |
| 35. | Lynn | 24.2% | 14.4%(+9.80)#35 | 20.1%(+4.10)#1,073 |
| 36. | Cambridge | 24.3% | 14.4%(+9.90)#36 | 20.1%(+4.20)#1,078 |
| 37. | Lowell | 25.9% | 14.4%(+11.5)#37 | 20.1%(+5.80)#1,149 |
| 38. | Danvers | 26.0% | 14.4%(+11.6)#38 | 20.1%(+5.90)#1,158 |
| 39. | Lawrence | 26.9% | 14.4%(+12.5)#39 | 20.1%(+6.80)#1,196 |
| 40. | Gloucester | 27.8% | 14.4%(+13.4)#40 | 20.1%(+7.70)#1,236 |
| 41. | Boston | 28.3% | 14.4%(+13.9)#41 | 20.1%(+8.20)#1,262 |
| 42. | Gardner | 29.1% | 14.4%(+14.7)#42 | 20.1%(+9.00)#1,299 |
| 43. | Springfield | 29.7% | 14.4%(+15.3)#43 | 20.1%(+9.60)#1,327 |
| 44. | Framingham | 30.0% | 14.4%(+15.6)#44 | 20.1%(+9.90)#1,337 |
| 45. | Dennis Port | 36.8% | 14.4%(+22.4)#45 | 20.1%(+16.7)#1,629 |
| 46. | Ipswich | 38.1% | 14.4%(+23.7)#46 | 20.1%(+18.0)#1,686 |
| 47. | West Springfield Town | 38.5% | 14.4%(+24.1)#47 | 20.1%(+18.4)#1,700 |
| 48. | Haverhill | 38.6% | 14.4%(+24.2)#48 | 20.1%(+18.5)#1,704 |
| 49. | Everett | 39.2% | 14.4%(+24.8)#49 | 20.1%(+19.1)#1,719 |
| 50. | North Adams | 40.7% | 14.4%(+26.3)#50 | 20.1%(+20.6)#1,776 |
| 51. | Agawam Town | 41.1% | 14.4%(+26.7)#51 | 20.1%(+21.0)#1,784 |
| 52. | Randolph Town | 44.0% | 14.4%(+29.6)#52 | 20.1%(+23.9)#1,870 |
| 53. | Beverly | 46.0% | 14.4%(+31.6)#53 | 20.1%(+25.9)#1,937 |
| 54. | Easthampton Town | 46.9% | 14.4%(+32.5)#54 | 20.1%(+26.8)#1,954 |
| 55. | Worcester | 47.0% | 14.4%(+32.6)#55 | 20.1%(+26.9)#1,955 |
| 56. | Brockton | 50.3% | 14.4%(+35.9)#56 | 20.1%(+30.2)#2,080 |
| 57. | Nantucket | 50.7% | 14.4%(+36.3)#57 | 20.1%(+30.6)#2,088 |
| 58. | Southbridge Town | 51.5% | 14.4%(+37.1)#58 | 20.1%(+31.4)#2,105 |
| 59. | Turners Falls | 54.5% | 14.4%(+40.1)#59 | 20.1%(+34.4)#2,180 |
| 60. | Fitchburg | 57.1% | 14.4%(+42.7)#60 | 20.1%(+37.0)#2,224 |
| 61. | Maynard | 100.0% | 14.4%(+85.6)#61 | 20.1%(+79.9)#2,899 |
| 62. | Middleborough Center | 100.0% | 14.4%(+85.6)#62 | 20.1%(+79.9)#2,985 |
| 63. | Plymouth | 100.0% | 14.4%(+85.6)#63 | 20.1%(+79.9)#2,993 |
| 64. | Ware | 100.0% | 14.4%(+85.6)#64 | 20.1%(+79.9)#3,041 |
| 65. | Yarmouth Port | 100.0% | 14.4%(+85.6)#65 | 20.1%(+79.9)#3,057 |
| 66. | Adams | 100.0% | 14.4%(+85.6)#66 | 20.1%(+79.9)#3,077 |
| 67. | Hopedale | 100.0% | 14.4%(+85.6)#67 | 20.1%(+79.9)#3,183 |
| 68. | Provincetown | 100.0% | 14.4%(+85.6)#68 | 20.1%(+79.9)#3,236 |
| 69. | West Wareham | 100.0% | 14.4%(+85.6)#69 | 20.1%(+79.9)#3,350 |
1
2Common Questions
What are the Top 10 Cities with the Lowest Percentage of Births to Unmarried Women over the Age of 35 in Massachusetts?
Top 10 Cities with the Lowest Percentage of Births to Unmarried Women over the Age of 35 in Massachusetts are:
What city has the Lowest Percentage of Births to Unmarried Women over the Age of 35 in Massachusetts?
Malden has the Lowest Percentage of Births to Unmarried Women over the Age of 35 in Massachusetts with 1.3%.
What is the Percentage of Births to Unmarried Women over the Age of 35 in the State of Massachusetts?
Percentage of Births to Unmarried Women over the Age of 35 in Massachusetts is 14.4%.
What is the Percentage of Births to Unmarried Women over the Age of 35 in the United States?
Percentage of Births to Unmarried Women over the Age of 35 in the United States is 20.1%.