Cities with the Lowest Percentage of Births to Unmarried Women over the Age of 35 in South Carolina

RELATED REPORTS & OPTIONS

Lowest Illegitimacy | Women 35+
Population
Families and Households
Female Fertility
Female Fertility (Unmarried)
Race (Community Size)
Race (Percentage)
Ancestry (Community Size)
AfghanAfricanAlaska NativeAlaskan AthabascanAlbanianAleutAlsatianAmericanApacheArabArapahoArgentineanArmenianAssyrian / Chaldean / SyriacAustralianAustrianBahamianBangladeshiBarbadianBasqueBelgianBelizeanBermudanBhutaneseBlackfeetBolivianBrazilianBritishBritish West IndianBulgarianBurmeseCajunCambodianCanadianCape VerdeanCarpatho RusynCelticCentral AmericanCentral American IndianCherokeeCheyenneChickasawChileanChineseChippewaChoctawColombianColvilleComancheCosta RicanCreeCreekCroatianCrowCubanCypriotCzechCzechoslovakianDanishDelawareDominicanDutchDutch West IndianEastern EuropeanEcuadorianEgyptianEnglishEstonianEthiopianEuropeanFijianFilipinoFinnishFrenchFrench American IndianFrench CanadianGermanGerman RussianGhanaianGreekGuamanian / ChamorroGuatemalanGuyaneseHaitianHmongHonduranHopiHoumaHungarianIcelanderIndian (Asian)IndonesianInupiatIranianIraqiIrishIroquoisIsraeliItalianJamaicanJapaneseJordanianKenyanKiowaKoreanLaotianLatvianLebaneseLiberianLithuanianLumbeeLuxembourgerMacedonianMalaysianMalteseMarshalleseMenomineeMexicanMexican American IndianMongolianMoroccanNative HawaiianNavajoNepaleseNew ZealanderNicaraguanNigerianNorthern EuropeanNorwegianOkinawanOsageOttawaPaiutePakistaniPalestinianPanamanianParaguayanPennsylvania GermanPeruvianPimaPolishPortuguesePotawatomiPuebloPuerto RicanPuget Sound SalishRomanianRussianSalvadoranSamoanScandinavianScotch-IrishScottishSeminoleSenegaleseSerbianShoshoneSierra LeoneanSiouxSlavicSlovakSloveneSomaliSouth AfricanSouth AmericanSouth American IndianSoviet UnionSpaniardSpanishSpanish AmericanSpanish American IndianSri LankanSubsaharan AfricanSudaneseSwedishSwissSyrianTaiwaneseThaiTlingit-HaidaTohono O'OdhamTonganTrinidadian and TobagonianTsimshianTurkishU.S. Virgin IslanderUgandanUkrainianUruguayanUteVenezuelanVietnameseWelshWest IndianYakamaYaquiYugoslavianYumanYup'ikZimbabwean
Ancestry (Percentage)
AfghanAfricanAlaska NativeAlaskan AthabascanAlbanianAleutAlsatianAmericanApacheArabArapahoArgentineanArmenianAssyrian / Chaldean / SyriacAustralianAustrianBahamianBangladeshiBarbadianBasqueBelgianBelizeanBermudanBhutaneseBlackfeetBolivianBrazilianBritishBritish West IndianBulgarianBurmeseCajunCambodianCanadianCape VerdeanCarpatho RusynCelticCentral AmericanCentral American IndianCherokeeCheyenneChickasawChileanChineseChippewaChoctawColombianColvilleComancheCosta RicanCreeCreekCroatianCrowCubanCypriotCzechCzechoslovakianDanishDelawareDominicanDutchDutch West IndianEastern EuropeanEcuadorianEgyptianEnglishEstonianEthiopianEuropeanFijianFilipinoFinnishFrenchFrench American IndianFrench CanadianGermanGerman RussianGhanaianGreekGuamanian / ChamorroGuatemalanGuyaneseHaitianHmongHonduranHopiHoumaHungarianIcelanderIndian (Asian)IndonesianInupiatIranianIraqiIrishIroquoisIsraeliItalianJamaicanJapaneseJordanianKenyanKiowaKoreanLaotianLatvianLebaneseLiberianLithuanianLumbeeLuxembourgerMacedonianMalaysianMalteseMarshalleseMenomineeMexicanMexican American IndianMongolianMoroccanNative HawaiianNavajoNepaleseNew ZealanderNicaraguanNigerianNorthern EuropeanNorwegianOkinawanOsageOttawaPaiutePakistaniPalestinianPanamanianParaguayanPennsylvania GermanPeruvianPimaPolishPortuguesePotawatomiPuebloPuerto RicanPuget Sound SalishRomanianRussianSalvadoranSamoanScandinavianScotch-IrishScottishSeminoleSenegaleseSerbianShoshoneSierra LeoneanSiouxSlavicSlovakSloveneSomaliSouth AfricanSouth AmericanSouth American IndianSoviet UnionSpaniardSpanishSpanish AmericanSpanish American IndianSri LankanSubsaharan AfricanSudaneseSwedishSwissSyrianTaiwaneseThaiTlingit-HaidaTohono O'OdhamTonganTrinidadian and TobagonianTsimshianTurkishU.S. Virgin IslanderUgandanUkrainianUruguayanUteVenezuelanVietnameseWelshWest IndianYakamaYaquiYugoslavianYumanYup'ikZimbabwean
Immigrant Origin (Total)
AfghanistanAfricaAlbaniaArgentinaArmeniaAsiaAustraliaAustriaAzoresBahamasBangladeshBarbadosBelarusBelgiumBelizeBoliviaBosnia and HerzegovinaBrazilBulgariaBurma / MyanmarCabo VerdeCambodiaCameroonCanadaCaribbeanCentral AmericaChileChinaColombiaCongoCosta RicaCroatiaCubaCzechoslovakiaDenmarkDominicaDominican RepublicEastern AfricaEastern AsiaEastern EuropeEcuadorEgyptEl SalvadorEnglandEritreaEthiopiaEuropeFijiFranceGermanyGhanaGreeceGrenadaGuatemalaGuyanaHaitiHondurasHong KongHungaryIndiaIndonesiaIranIraqIrelandIsraelItalyJamaicaJapanJordanKazakhstanKenyaKoreaKuwaitLaosLatin AmericaLatviaLebanonLiberiaLithuaniaMalaysiaMexicoMicronesiaMiddle AfricaMoldovaMoroccoNepalNetherlandsNicaraguaNigeriaNorth MacedoniaNorthern AfricaNorthern EuropeNorwayOceaniaPakistanPanamaPeruPhilippinesPolandPortugalRomaniaRussiaSaudi ArabiaScotlandSenegalSerbiaSierra LeoneSingaporeSomaliaSouth AfricaSouth AmericaSouth Central AsiaSouth Eastern AsiaSouthern EuropeSpainSri LankaSt. Vincent and the GrenadinesSudanSwedenSwitzerlandSyriaTaiwanThailandTrinidad and TobagoTurkeyUgandaUkraineUruguayUzbekistanVenezuelaVietnamWest IndiesWestern AfricaWestern AsiaWestern EuropeYemenZaireZimbabwe
Immigrant Origin (Percentage)
AfghanistanAfricaAlbaniaArgentinaArmeniaAsiaAustraliaAustriaAzoresBahamasBangladeshBarbadosBelarusBelgiumBelizeBoliviaBosnia and HerzegovinaBrazilBulgariaBurma / MyanmarCabo VerdeCambodiaCameroonCanadaCaribbeanCentral AmericaChileChinaColombiaCongoCosta RicaCroatiaCubaCzechoslovakiaDenmarkDominicaDominican RepublicEastern AfricaEastern AsiaEastern EuropeEcuadorEgyptEl SalvadorEnglandEritreaEthiopiaEuropeFijiFranceGermanyGhanaGreeceGrenadaGuatemalaGuyanaHaitiHondurasHong KongHungaryIndiaIndonesiaIranIraqIrelandIsraelItalyJamaicaJapanJordanKazakhstanKenyaKoreaKuwaitLaosLatin AmericaLatviaLebanonLiberiaLithuaniaMalaysiaMexicoMicronesiaMiddle AfricaMoldovaMoroccoNepalNetherlandsNicaraguaNigeriaNorth MacedoniaNorthern AfricaNorthern EuropeNorwayOceaniaPakistanPanamaPeruPhilippinesPolandPortugalRomaniaRussiaSaudi ArabiaScotlandSenegalSerbiaSierra LeoneSingaporeSomaliaSouth AfricaSouth AmericaSouth Central AsiaSouth Eastern AsiaSouthern EuropeSpainSri LankaSt. Vincent and the GrenadinesSudanSwedenSwitzerlandSyriaTaiwanThailandTrinidad and TobagoTurkeyUgandaUkraineUruguayUzbekistanVenezuelaVietnamWest IndiesWestern AfricaWestern AsiaWestern EuropeYemenZaireZimbabwe
Income
Income (Families)
Income (Households)
Poverty
Poverty (Families)
Unemployment
Employment Occupations
Employment Industries
Employer Class
Commute Time
Commute Means
School Enrollment
Education by Degree Field
Occupancy
Finances
Physical Characteristics
South Carolina
Compare Cities
Comparison Subject

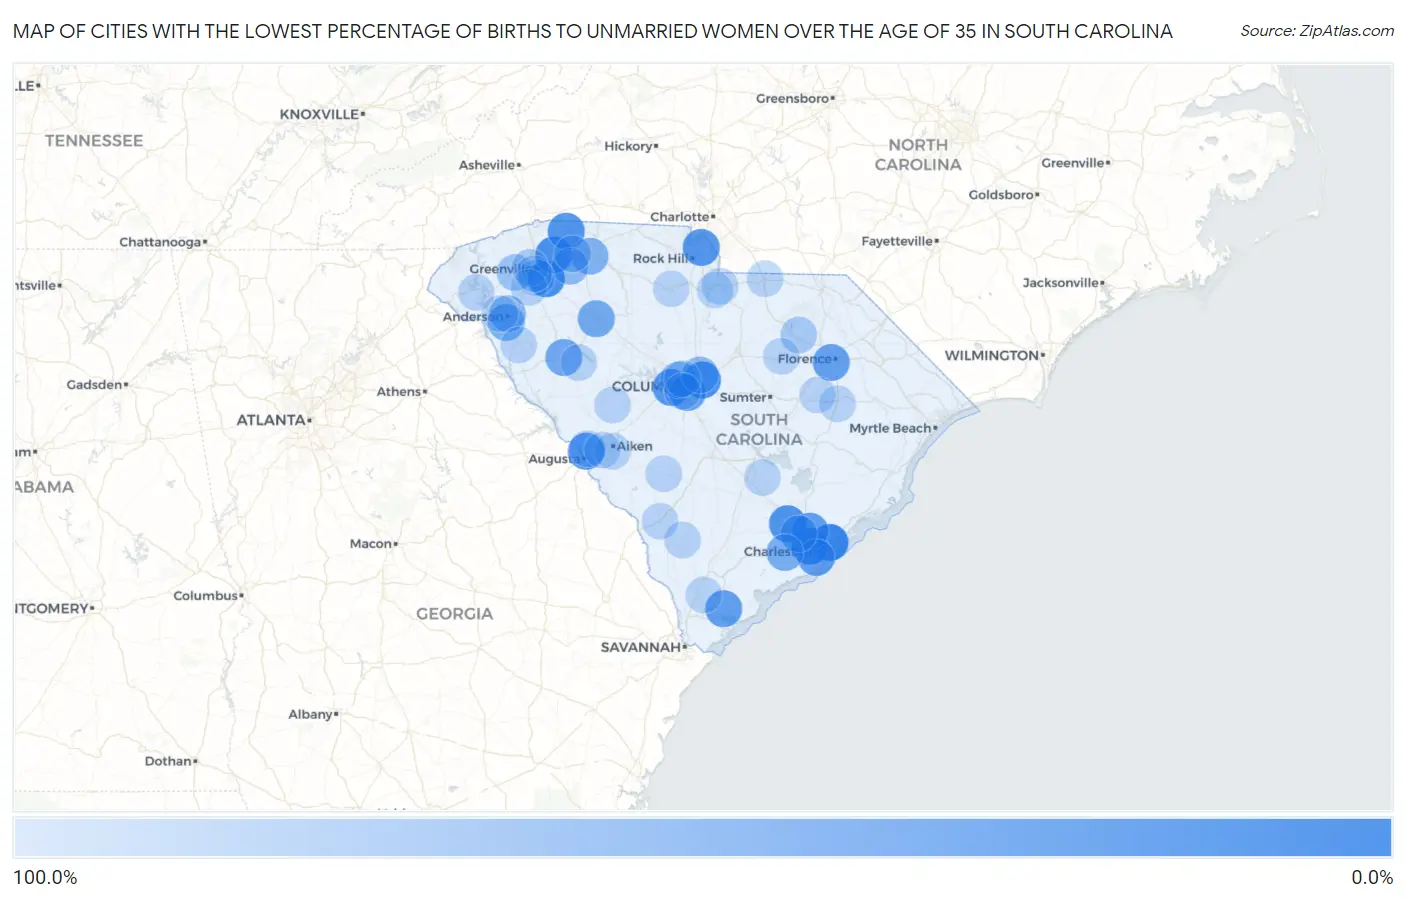
Map of Cities with the Lowest Percentage of Births to Unmarried Women over the Age of 35 in South Carolina

100.0%
0.0%
Cities with the Lowest Percentage of Births to Unmarried Women over the Age of 35 in South Carolina Map

Cities with the Lowest Percentage of Births to Unmarried Women over the Age of 35 in South Carolina

City % Unmarried vs State vs National
1.Mount Pleasant2.3%25.7%(-23.4)#120.1%(-17.8)#32
2.Charleston9.8%25.7%(-15.9)#220.1%(-10.3)#336
3.Mauldin12.8%25.7%(-12.9)#320.1%(-7.30)#480
4.Greer17.6%25.7%(-8.10)#420.1%(-2.50)#761
5.Columbia18.0%25.7%(-7.70)#520.1%(-2.10)#781
6.Summerville20.6%25.7%(-5.10)#620.1%(+0.500)#906
7.Campobello22.2%25.7%(-3.50)#720.1%(+2.10)#998
8.Fort Mill24.6%25.7%(-1.10)#820.1%(+4.50)#1,089
9.Lexington25.8%25.7%(+0.100)#920.1%(+5.70)#1,144
10.North Augusta26.3%25.7%(+0.600)#1020.1%(+6.20)#1,172
11.Hanahan31.1%25.7%(+5.40)#1120.1%(+11.0)#1,387
12.Port Royal34.9%25.7%(+9.20)#1220.1%(+14.8)#1,558
13.James Island35.7%25.7%(+10.0)#1320.1%(+15.6)#1,592
14.Cayce36.0%25.7%(+10.3)#1420.1%(+15.9)#1,604
15.Florence37.2%25.7%(+11.5)#1520.1%(+17.1)#1,640
16.Greenwood47.9%25.7%(+22.2)#1620.1%(+27.8)#1,983
17.Clinton48.0%25.7%(+22.3)#1720.1%(+27.9)#1,987
18.North Charleston50.9%25.7%(+25.2)#1820.1%(+30.8)#2,089
19.Ravenel52.7%25.7%(+27.0)#1920.1%(+32.6)#2,140
20.Homeland Park56.8%25.7%(+31.1)#2020.1%(+36.7)#2,220
21.Carolina Forest58.1%25.7%(+32.4)#2120.1%(+38.0)#2,260
22.Spartanburg58.6%25.7%(+32.9)#2220.1%(+38.5)#2,271
23.Seven Oaks62.5%25.7%(+36.8)#2320.1%(+42.4)#2,356
24.Anderson65.1%25.7%(+39.4)#2420.1%(+45.0)#2,425
25.Dentsville68.2%25.7%(+42.5)#2520.1%(+48.1)#2,480
26.Reidville71.4%25.7%(+45.7)#2620.1%(+51.3)#2,526
27.Wellford77.3%25.7%(+51.6)#2720.1%(+57.2)#2,597
28.Easley80.3%25.7%(+54.6)#2820.1%(+60.2)#2,631
29.Hartsville88.5%25.7%(+62.8)#2920.1%(+68.4)#2,697
30.Parker89.5%25.7%(+63.8)#3020.1%(+69.4)#2,702
31.Aiken100.0%25.7%(+74.3)#3120.1%(+79.9)#2,745
32.St Andrews100.0%25.7%(+74.3)#3220.1%(+79.9)#2,774
33.Gantt100.0%25.7%(+74.3)#3320.1%(+79.9)#2,827
34.Lancaster100.0%25.7%(+74.3)#3420.1%(+79.9)#2,963
35.Centerville100.0%25.7%(+74.3)#3520.1%(+79.9)#3,003
36.White Knoll100.0%25.7%(+74.3)#3620.1%(+79.9)#3,005
37.Lake City100.0%25.7%(+74.3)#3720.1%(+79.9)#3,050
38.Belvedere100.0%25.7%(+74.3)#3820.1%(+79.9)#3,070
39.Piedmont100.0%25.7%(+74.3)#3920.1%(+79.9)#3,087
40.Chester100.0%25.7%(+74.3)#4020.1%(+79.9)#3,107
41.Ridgeland100.0%25.7%(+74.3)#4120.1%(+79.9)#3,210
42.Dunean100.0%25.7%(+74.3)#4220.1%(+79.9)#3,237
43.Hilltop100.0%25.7%(+74.3)#4320.1%(+79.9)#3,252
44.Gloverville100.0%25.7%(+74.3)#4420.1%(+79.9)#3,271
45.Bishopville100.0%25.7%(+74.3)#4520.1%(+79.9)#3,283
46.Pageland100.0%25.7%(+74.3)#4620.1%(+79.9)#3,322
47.Hampton100.0%25.7%(+74.3)#4720.1%(+79.9)#3,323
48.Springdale100.0%25.7%(+74.3)#4820.1%(+79.9)#3,327
49.Allendale100.0%25.7%(+74.3)#4920.1%(+79.9)#3,329
50.Ninety Six100.0%25.7%(+74.3)#5020.1%(+79.9)#3,353
51.Blackville100.0%25.7%(+74.3)#5120.1%(+79.9)#3,443
52.Irwin100.0%25.7%(+74.3)#5220.1%(+79.9)#3,476
53.Utica100.0%25.7%(+74.3)#5320.1%(+79.9)#3,528
54.Holly Hill100.0%25.7%(+74.3)#5420.1%(+79.9)#3,592
55.Beech Island100.0%25.7%(+74.3)#5520.1%(+79.9)#3,600
56.Olanta100.0%25.7%(+74.3)#5620.1%(+79.9)#3,890
57.Antreville100.0%25.7%(+74.3)#5720.1%(+79.9)#4,060
58.Ward100.0%25.7%(+74.3)#5820.1%(+79.9)#4,080
59.Green Sea100.0%25.7%(+74.3)#5920.1%(+79.9)#4,183

Common Questions

What are the Top 10 Cities with the Lowest Percentage of Births to Unmarried Women over the Age of 35 in South Carolina?
Top 10 Cities with the Lowest Percentage of Births to Unmarried Women over the Age of 35 in South Carolina are:
What city has the Lowest Percentage of Births to Unmarried Women over the Age of 35 in South Carolina?
Mount Pleasant has the Lowest Percentage of Births to Unmarried Women over the Age of 35 in South Carolina with 2.3%.
What is the Percentage of Births to Unmarried Women over the Age of 35 in the State of South Carolina?
Percentage of Births to Unmarried Women over the Age of 35 in South Carolina is 25.7%.
What is the Percentage of Births to Unmarried Women over the Age of 35 in the United States?
Percentage of Births to Unmarried Women over the Age of 35 in the United States is 20.1%.