Cities with the Lowest Percentage of Births to Unmarried Women over the Age of 35 in North Carolina
RELATED REPORTS & OPTIONS
Lowest Illegitimacy | Women 35+
North Carolina
Compare Cities
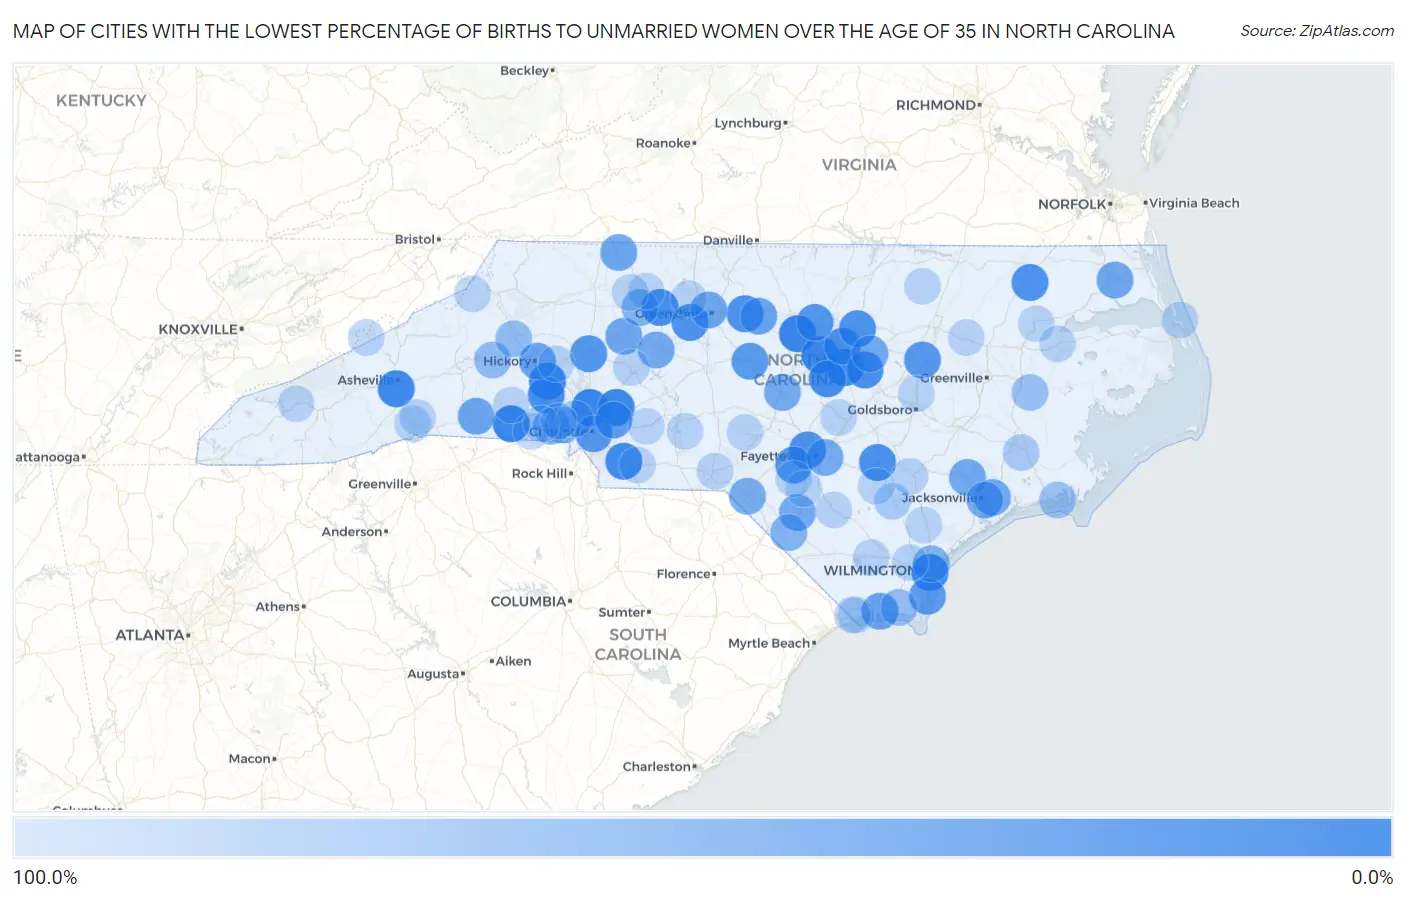
Map of Cities with the Lowest Percentage of Births to Unmarried Women over the Age of 35 in North Carolina
100.0%
0.0%
Cities with the Lowest Percentage of Births to Unmarried Women over the Age of 35 in North Carolina
| City | % Unmarried | vs State | vs National | |
| 1. | Garner | 0.70% | 19.1%(-18.4)#1 | 20.1%(-19.4)#3 |
| 2. | Chapel Hill | 1.1% | 19.1%(-18.0)#2 | 20.1%(-19.0)#7 |
| 3. | Cary | 2.1% | 19.1%(-17.0)#3 | 20.1%(-18.0)#23 |
| 4. | Huntersville | 2.3% | 19.1%(-16.8)#4 | 20.1%(-17.8)#33 |
| 5. | Shelby | 2.3% | 19.1%(-16.8)#5 | 20.1%(-17.8)#35 |
| 6. | Maiden | 4.3% | 19.1%(-14.8)#6 | 20.1%(-15.8)#86 |
| 7. | Concord | 5.9% | 19.1%(-13.2)#7 | 20.1%(-14.2)#156 |
| 8. | Asheville | 6.8% | 19.1%(-12.3)#8 | 20.1%(-13.3)#195 |
| 9. | Fuquay Varina | 8.2% | 19.1%(-10.9)#9 | 20.1%(-11.9)#266 |
| 10. | Wilmington | 8.3% | 19.1%(-10.8)#10 | 20.1%(-11.8)#270 |
| 11. | Monroe | 8.8% | 19.1%(-10.3)#11 | 20.1%(-11.3)#295 |
| 12. | Lincolnton | 12.5% | 19.1%(-6.60)#12 | 20.1%(-7.60)#462 |
| 13. | Winston Salem | 13.0% | 19.1%(-6.10)#13 | 20.1%(-7.10)#488 |
| 14. | Clinton | 13.3% | 19.1%(-5.80)#14 | 20.1%(-6.80)#507 |
| 15. | Raleigh | 13.9% | 19.1%(-5.20)#15 | 20.1%(-6.20)#540 |
| 16. | Clayton | 14.0% | 19.1%(-5.10)#16 | 20.1%(-6.10)#553 |
| 17. | High Point | 16.8% | 19.1%(-2.30)#17 | 20.1%(-3.30)#716 |
| 18. | Fayetteville | 16.9% | 19.1%(-2.20)#18 | 20.1%(-3.20)#723 |
| 19. | Burlington | 16.9% | 19.1%(-2.20)#19 | 20.1%(-3.20)#725 |
| 20. | Wake Forest | 17.1% | 19.1%(-2.00)#20 | 20.1%(-3.00)#735 |
| 21. | Ahoskie | 18.2% | 19.1%(-0.900)#21 | 20.1%(-1.90)#796 |
| 22. | Statesville | 21.6% | 19.1%(+2.50)#22 | 20.1%(+1.50)#964 |
| 23. | Durham | 22.0% | 19.1%(+2.90)#23 | 20.1%(+1.90)#977 |
| 24. | Rockfish | 22.2% | 19.1%(+3.10)#24 | 20.1%(+2.10)#994 |
| 25. | Charlotte | 23.8% | 19.1%(+4.70)#25 | 20.1%(+3.70)#1,062 |
| 26. | Wilson | 26.3% | 19.1%(+7.20)#26 | 20.1%(+6.20)#1,170 |
| 27. | Siler City | 27.2% | 19.1%(+8.10)#27 | 20.1%(+7.10)#1,209 |
| 28. | Harrisburg | 29.0% | 19.1%(+9.90)#28 | 20.1%(+8.90)#1,297 |
| 29. | Carolina Beach | 30.0% | 19.1%(+10.9)#29 | 20.1%(+9.90)#1,345 |
| 30. | Anderson Creek | 34.9% | 19.1%(+15.8)#30 | 20.1%(+14.8)#1,559 |
| 31. | Holden Beach | 37.5% | 19.1%(+18.4)#31 | 20.1%(+17.4)#1,661 |
| 32. | Graham | 38.1% | 19.1%(+19.0)#32 | 20.1%(+18.0)#1,685 |
| 33. | Hickory | 38.2% | 19.1%(+19.1)#33 | 20.1%(+18.1)#1,692 |
| 34. | Forest City | 41.2% | 19.1%(+22.1)#34 | 20.1%(+21.1)#1,792 |
| 35. | Mocksville | 42.9% | 19.1%(+23.8)#35 | 20.1%(+22.8)#1,832 |
| 36. | Elizabeth City | 43.4% | 19.1%(+24.3)#36 | 20.1%(+23.3)#1,850 |
| 37. | Mount Airy | 44.0% | 19.1%(+24.9)#37 | 20.1%(+23.9)#1,873 |
| 38. | Greensboro | 44.2% | 19.1%(+25.1)#38 | 20.1%(+24.1)#1,878 |
| 39. | Richlands | 45.5% | 19.1%(+26.4)#39 | 20.1%(+25.4)#1,921 |
| 40. | Piney Green | 45.8% | 19.1%(+26.7)#40 | 20.1%(+25.7)#1,934 |
| 41. | Lexington | 46.4% | 19.1%(+27.3)#41 | 20.1%(+26.3)#1,945 |
| 42. | Lumberton | 46.7% | 19.1%(+27.6)#42 | 20.1%(+26.6)#1,948 |
| 43. | Wendell | 46.7% | 19.1%(+27.6)#43 | 20.1%(+26.6)#1,950 |
| 44. | Jacksonville | 48.1% | 19.1%(+29.0)#44 | 20.1%(+28.0)#1,990 |
| 45. | Governors Club | 48.4% | 19.1%(+29.3)#45 | 20.1%(+28.3)#1,998 |
| 46. | Sanford | 49.0% | 19.1%(+29.9)#46 | 20.1%(+28.9)#2,010 |
| 47. | Vander | 50.0% | 19.1%(+30.9)#47 | 20.1%(+29.9)#2,058 |
| 48. | Laurinburg | 52.5% | 19.1%(+33.4)#48 | 20.1%(+32.4)#2,133 |
| 49. | Gastonia | 53.2% | 19.1%(+34.1)#49 | 20.1%(+33.1)#2,151 |
| 50. | Lowell | 57.9% | 19.1%(+38.8)#50 | 20.1%(+37.8)#2,254 |
| 51. | Kings Grant | 59.3% | 19.1%(+40.2)#51 | 20.1%(+39.2)#2,281 |
| 52. | Fairmont | 60.0% | 19.1%(+40.9)#52 | 20.1%(+39.9)#2,302 |
| 53. | Lewisville | 62.1% | 19.1%(+43.0)#53 | 20.1%(+42.0)#2,345 |
| 54. | Morganton | 69.6% | 19.1%(+50.5)#54 | 20.1%(+49.5)#2,504 |
| 55. | Lenoir | 72.1% | 19.1%(+53.0)#55 | 20.1%(+52.0)#2,534 |
| 56. | Oak Island | 74.2% | 19.1%(+55.1)#56 | 20.1%(+54.1)#2,558 |
| 57. | River Road | 76.1% | 19.1%(+57.0)#57 | 20.1%(+56.0)#2,584 |
| 58. | Morehead City | 78.6% | 19.1%(+59.5)#58 | 20.1%(+58.5)#2,617 |
| 59. | Mount Holly | 83.5% | 19.1%(+64.4)#59 | 20.1%(+63.4)#2,659 |
| 60. | Harrells | 90.0% | 19.1%(+70.9)#60 | 20.1%(+69.9)#2,707 |
| 61. | New Bern | 90.1% | 19.1%(+71.0)#61 | 20.1%(+70.0)#2,708 |
| 62. | Salisbury | 100.0% | 19.1%(+80.9)#62 | 20.1%(+79.9)#2,742 |
| 63. | Kings Mountain | 100.0% | 19.1%(+80.9)#63 | 20.1%(+79.9)#2,884 |
| 64. | Tarboro | 100.0% | 19.1%(+80.9)#64 | 20.1%(+79.9)#2,894 |
| 65. | Rockingham | 100.0% | 19.1%(+80.9)#65 | 20.1%(+79.9)#2,945 |
| 66. | Kill Devil Hills | 100.0% | 19.1%(+80.9)#66 | 20.1%(+79.9)#2,991 |
| 67. | Oak Ridge | 100.0% | 19.1%(+80.9)#67 | 20.1%(+79.9)#2,994 |
| 68. | East Flat Rock | 100.0% | 19.1%(+80.9)#68 | 20.1%(+79.9)#3,059 |
| 69. | Bessemer City | 100.0% | 19.1%(+80.9)#69 | 20.1%(+79.9)#3,093 |
| 70. | Erwin | 100.0% | 19.1%(+80.9)#70 | 20.1%(+79.9)#3,145 |
| 71. | Ranlo | 100.0% | 19.1%(+80.9)#71 | 20.1%(+79.9)#3,155 |
| 72. | Sunset Beach | 100.0% | 19.1%(+80.9)#72 | 20.1%(+79.9)#3,177 |
| 73. | Wingate | 100.0% | 19.1%(+80.9)#73 | 20.1%(+79.9)#3,191 |
| 74. | Dana | 100.0% | 19.1%(+80.9)#74 | 20.1%(+79.9)#3,220 |
| 75. | Windsor | 100.0% | 19.1%(+80.9)#75 | 20.1%(+79.9)#3,231 |
| 76. | Plymouth | 100.0% | 19.1%(+80.9)#76 | 20.1%(+79.9)#3,244 |
| 77. | Burgaw | 100.0% | 19.1%(+80.9)#77 | 20.1%(+79.9)#3,257 |
| 78. | Tobaccoville | 100.0% | 19.1%(+80.9)#78 | 20.1%(+79.9)#3,351 |
| 79. | Calabash | 100.0% | 19.1%(+80.9)#79 | 20.1%(+79.9)#3,358 |
| 80. | St Pauls | 100.0% | 19.1%(+80.9)#80 | 20.1%(+79.9)#3,397 |
| 81. | Navassa | 100.0% | 19.1%(+80.9)#81 | 20.1%(+79.9)#3,455 |
| 82. | Claremont | 100.0% | 19.1%(+80.9)#82 | 20.1%(+79.9)#3,467 |
| 83. | Bryson City | 100.0% | 19.1%(+80.9)#83 | 20.1%(+79.9)#3,531 |
| 84. | Mount Gilead | 100.0% | 19.1%(+80.9)#84 | 20.1%(+79.9)#3,679 |
| 85. | Magnolia | 100.0% | 19.1%(+80.9)#85 | 20.1%(+79.9)#3,731 |
| 86. | Hollister | 100.0% | 19.1%(+80.9)#86 | 20.1%(+79.9)#3,775 |
| 87. | Taylortown | 100.0% | 19.1%(+80.9)#87 | 20.1%(+79.9)#3,792 |
| 88. | Beech Mountain | 100.0% | 19.1%(+80.9)#88 | 20.1%(+79.9)#3,795 |
| 89. | Ingold | 100.0% | 19.1%(+80.9)#89 | 20.1%(+79.9)#3,815 |
| 90. | East Bend | 100.0% | 19.1%(+80.9)#90 | 20.1%(+79.9)#3,824 |
| 91. | Pikeville | 100.0% | 19.1%(+80.9)#91 | 20.1%(+79.9)#3,854 |
| 92. | Red Cross | 100.0% | 19.1%(+80.9)#92 | 20.1%(+79.9)#3,855 |
| 93. | Lawndale | 100.0% | 19.1%(+80.9)#93 | 20.1%(+79.9)#3,885 |
| 94. | Bolton | 100.0% | 19.1%(+80.9)#94 | 20.1%(+79.9)#3,895 |
| 95. | Hot Springs | 100.0% | 19.1%(+80.9)#95 | 20.1%(+79.9)#3,941 |
| 96. | Dublin | 100.0% | 19.1%(+80.9)#96 | 20.1%(+79.9)#3,977 |
| 97. | Lumber Bridge | 100.0% | 19.1%(+80.9)#97 | 20.1%(+79.9)#4,180 |
Common Questions
What are the Top 10 Cities with the Lowest Percentage of Births to Unmarried Women over the Age of 35 in North Carolina?
Top 10 Cities with the Lowest Percentage of Births to Unmarried Women over the Age of 35 in North Carolina are:
#1
0.0%
#2
0.0%
#3
0.0%
#4
0.70%
#5
1.1%
#6
2.1%
#7
2.3%
#8
2.3%
#9
4.3%
#10
5.9%
What city has the Lowest Percentage of Births to Unmarried Women over the Age of 35 in North Carolina?
Garner has the Lowest Percentage of Births to Unmarried Women over the Age of 35 in North Carolina with 0.70%.
What is the Percentage of Births to Unmarried Women over the Age of 35 in the State of North Carolina?
Percentage of Births to Unmarried Women over the Age of 35 in North Carolina is 19.1%.
What is the Percentage of Births to Unmarried Women over the Age of 35 in the United States?
Percentage of Births to Unmarried Women over the Age of 35 in the United States is 20.1%.