Torrance, CA Map & Demographics
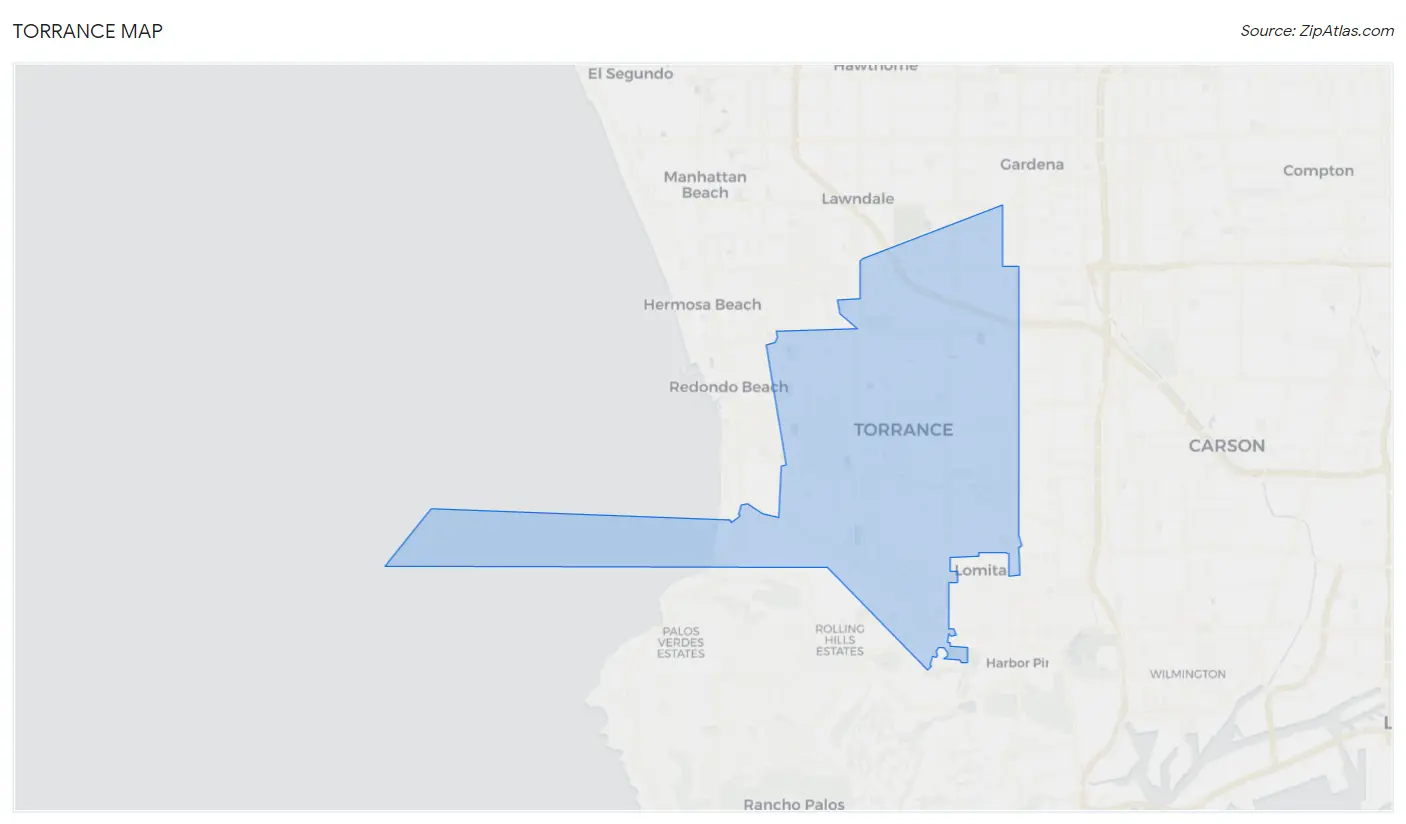
Torrance Map
Torrance Overview
$54,737
PER CAPITA INCOME
$133,064
AVG FAMILY INCOME
$109,554
AVG HOUSEHOLD INCOME
25.5%
WAGE / INCOME GAP [ % ]
74.5¢/ $1
WAGE / INCOME GAP [ $ ]
$10,293
FAMILY INCOME DEFICIT
0.44
INEQUALITY / GINI INDEX
145,454
TOTAL POPULATION
71,576
MALE POPULATION
73,878
FEMALE POPULATION
96.88
MALES / 100 FEMALES
103.22
FEMALES / 100 MALES
42.9
MEDIAN AGE
3.2
AVG FAMILY SIZE
2.6
AVG HOUSEHOLD SIZE
76,324
LABOR FORCE [ PEOPLE ]
64.5%
PERCENT IN LABOR FORCE
5.3%
UNEMPLOYMENT RATE
Income in Torrance
Income Overview in Torrance
Per Capita Income in Torrance is $54,737, while median incomes of families and households are $133,064 and $109,554 respectively.
| Characteristic | Number | Measure |
| Per Capita Income | 145,454 | $54,737 |
| Median Family Income | 36,945 | $133,064 |
| Mean Family Income | 36,945 | $160,975 |
| Median Household Income | 55,719 | $109,554 |
| Mean Household Income | 55,719 | $140,133 |
| Income Deficit | 36,945 | $10,293 |
| Wage / Income Gap (%) | 145,454 | 25.46% |
| Wage / Income Gap ($) | 145,454 | 74.54¢ per $1 |
| Gini / Inequality Index | 145,454 | 0.44 |
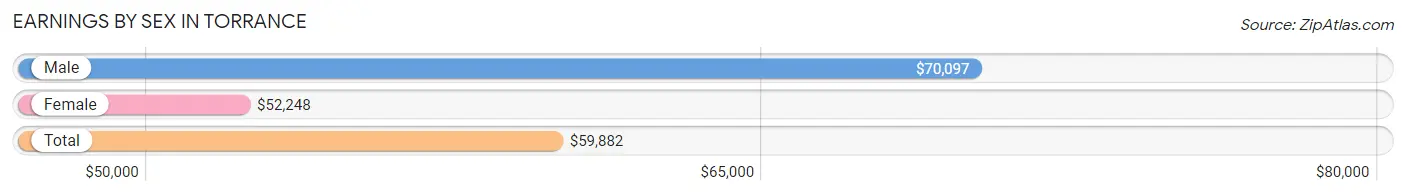
Earnings by Sex in Torrance
Average Earnings in Torrance are $59,882, $70,097 for men and $52,248 for women, a difference of 25.5%.
| Sex | Number | Average Earnings |
| Male | 42,585 (54.4%) | $70,097 |
| Female | 35,746 (45.6%) | $52,248 |
| Total | 78,331 (100.0%) | $59,882 |
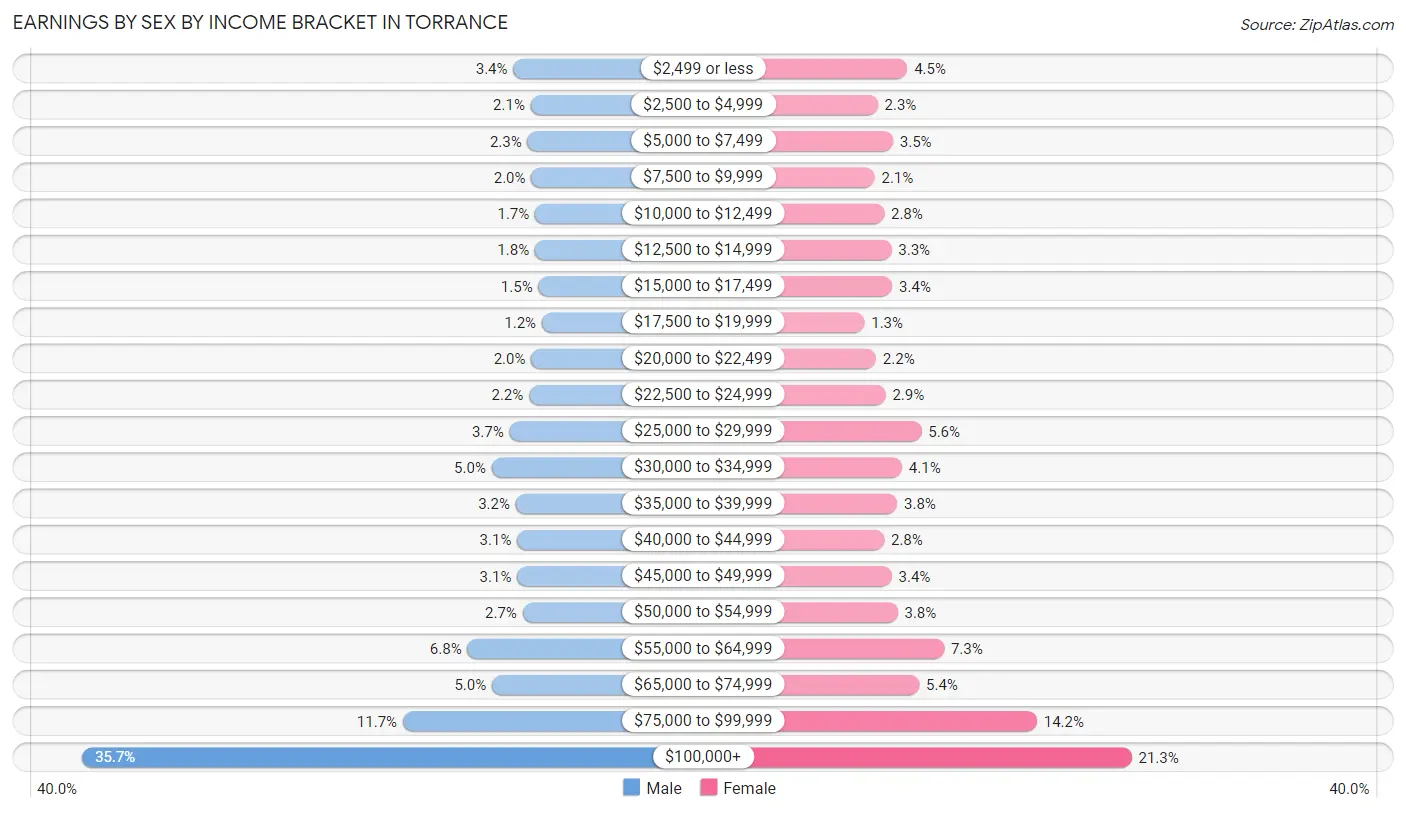
Earnings by Sex by Income Bracket in Torrance
The most common earnings brackets in Torrance are $100,000+ for men (15,203 | 35.7%) and $100,000+ for women (7,627 | 21.3%).
| Income | Male | Female |
| $2,499 or less | 1,434 (3.4%) | 1,618 (4.5%) |
| $2,500 to $4,999 | 882 (2.1%) | 826 (2.3%) |
| $5,000 to $7,499 | 983 (2.3%) | 1,234 (3.5%) |
| $7,500 to $9,999 | 859 (2.0%) | 742 (2.1%) |
| $10,000 to $12,499 | 743 (1.7%) | 999 (2.8%) |
| $12,500 to $14,999 | 745 (1.8%) | 1,193 (3.3%) |
| $15,000 to $17,499 | 636 (1.5%) | 1,217 (3.4%) |
| $17,500 to $19,999 | 525 (1.2%) | 470 (1.3%) |
| $20,000 to $22,499 | 866 (2.0%) | 778 (2.2%) |
| $22,500 to $24,999 | 934 (2.2%) | 1,035 (2.9%) |
| $25,000 to $29,999 | 1,559 (3.7%) | 1,994 (5.6%) |
| $30,000 to $34,999 | 2,123 (5.0%) | 1,477 (4.1%) |
| $35,000 to $39,999 | 1,358 (3.2%) | 1,349 (3.8%) |
| $40,000 to $44,999 | 1,311 (3.1%) | 999 (2.8%) |
| $45,000 to $49,999 | 1,313 (3.1%) | 1,201 (3.4%) |
| $50,000 to $54,999 | 1,136 (2.7%) | 1,358 (3.8%) |
| $55,000 to $64,999 | 2,898 (6.8%) | 2,602 (7.3%) |
| $65,000 to $74,999 | 2,115 (5.0%) | 1,937 (5.4%) |
| $75,000 to $99,999 | 4,962 (11.7%) | 5,090 (14.2%) |
| $100,000+ | 15,203 (35.7%) | 7,627 (21.3%) |
| Total | 42,585 (100.0%) | 35,746 (100.0%) |
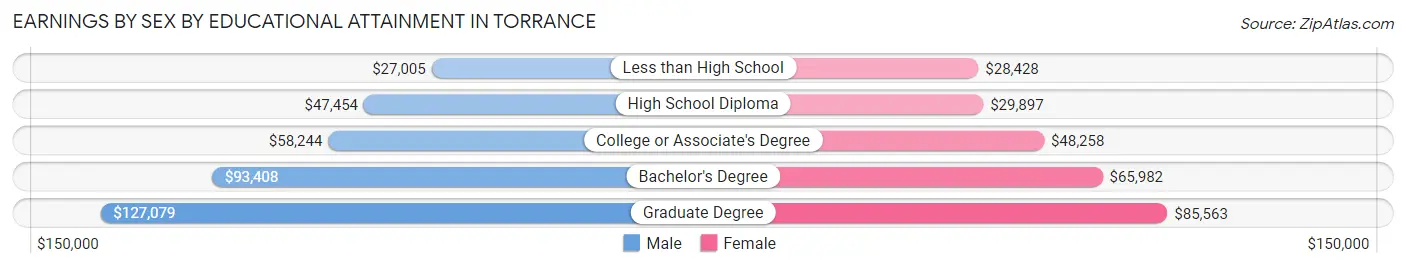
Earnings by Sex by Educational Attainment in Torrance
Average earnings in Torrance are $77,113 for men and $58,028 for women, a difference of 24.7%. Men with an educational attainment of graduate degree enjoy the highest average annual earnings of $127,079, while those with less than high school education earn the least with $27,005. Women with an educational attainment of graduate degree earn the most with the average annual earnings of $85,563, while those with less than high school education have the smallest earnings of $28,428.
| Educational Attainment | Male Income | Female Income |
| Less than High School | $27,005 | $28,428 |
| High School Diploma | $47,454 | $29,897 |
| College or Associate's Degree | $58,244 | $48,258 |
| Bachelor's Degree | $93,408 | $65,982 |
| Graduate Degree | $127,079 | $85,563 |
| Total | $77,113 | $58,028 |
Family Income in Torrance
Family Income Brackets in Torrance
According to the Torrance family income data, there are 10,418 families falling into the $200,000+ income range, which is the most common income bracket and makes up 28.2% of all families. Conversely, the $10,000 to $14,999 income bracket is the least frequent group with only 259 families (0.7%) belonging to this category.
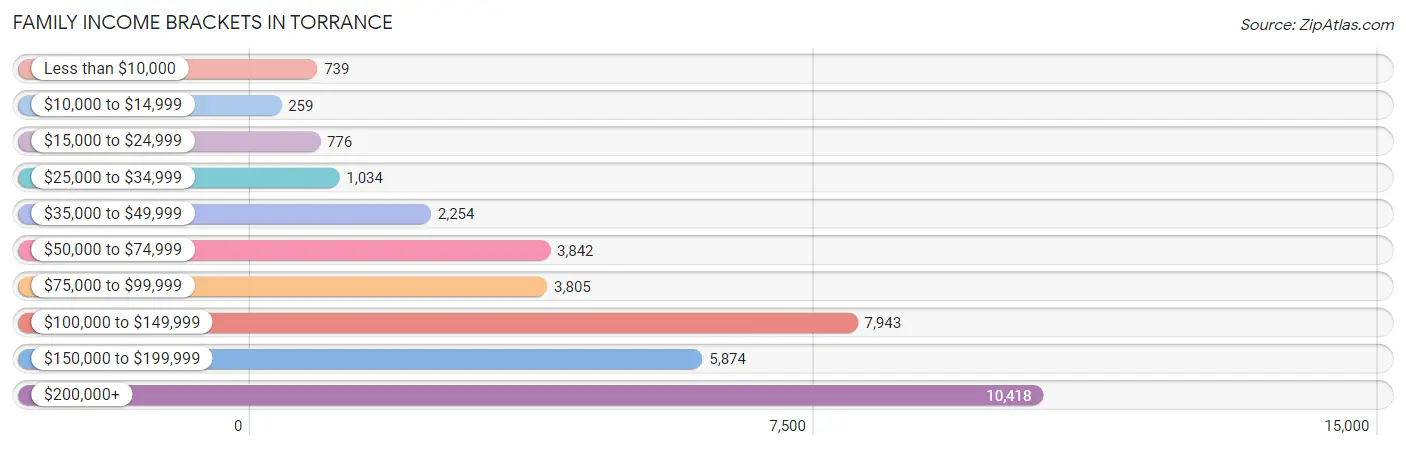
| Income Bracket | # Families | % Families |
| Less than $10,000 | 739 | 2.0% |
| $10,000 to $14,999 | 259 | 0.7% |
| $15,000 to $24,999 | 776 | 2.1% |
| $25,000 to $34,999 | 1,034 | 2.8% |
| $35,000 to $49,999 | 2,254 | 6.1% |
| $50,000 to $74,999 | 3,842 | 10.4% |
| $75,000 to $99,999 | 3,805 | 10.3% |
| $100,000 to $149,999 | 7,943 | 21.5% |
| $150,000 to $199,999 | 5,874 | 15.9% |
| $200,000+ | 10,418 | 28.2% |
Family Income by Famaliy Size in Torrance
7+ person families (179 | 0.5%) account for the highest median family income in Torrance with $250,001 per family, while 2-person families (15,220 | 41.2%) have the highest median income of $55,561 per family member.
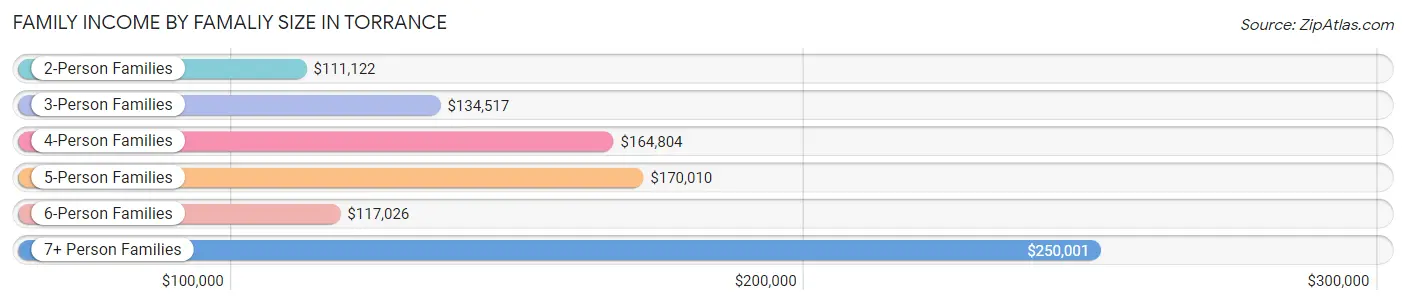
| Income Bracket | # Families | Median Income |
| 2-Person Families | 15,220 (41.2%) | $111,122 |
| 3-Person Families | 9,791 (26.5%) | $134,517 |
| 4-Person Families | 8,163 (22.1%) | $164,804 |
| 5-Person Families | 2,791 (7.5%) | $170,010 |
| 6-Person Families | 801 (2.2%) | $117,026 |
| 7+ Person Families | 179 (0.5%) | $250,001 |
| Total | 36,945 (100.0%) | $133,064 |
Family Income by Number of Earners in Torrance
The median family income in Torrance is $133,064, with families comprising 3+ earners (5,107) having the highest median family income of $180,337, while families with no earners (4,445) have the lowest median family income of $65,276, accounting for 13.8% and 12.0% of families, respectively.
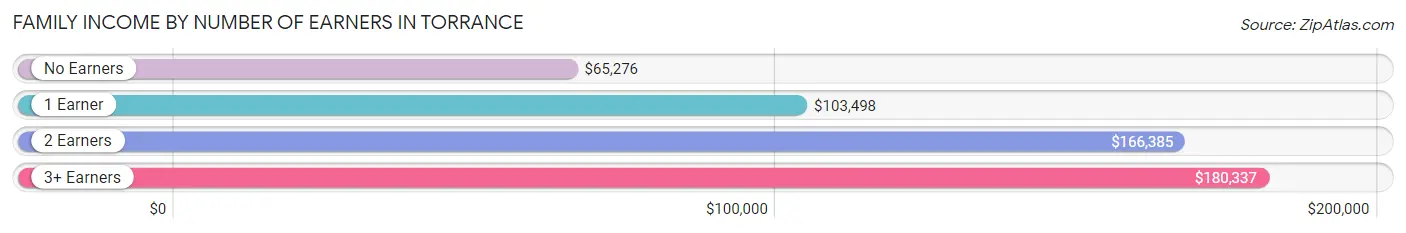
| Number of Earners | # Families | Median Income |
| No Earners | 4,445 (12.0%) | $65,276 |
| 1 Earner | 11,629 (31.5%) | $103,498 |
| 2 Earners | 15,764 (42.7%) | $166,385 |
| 3+ Earners | 5,107 (13.8%) | $180,337 |
| Total | 36,945 (100.0%) | $133,064 |
Household Income in Torrance
Household Income Brackets in Torrance
With 11,924 households falling in the category, the $200,000+ income range is the most frequent in Torrance, accounting for 21.4% of all households. In contrast, only 947 households (1.7%) fall into the $10,000 to $14,999 income bracket, making it the least populous group.
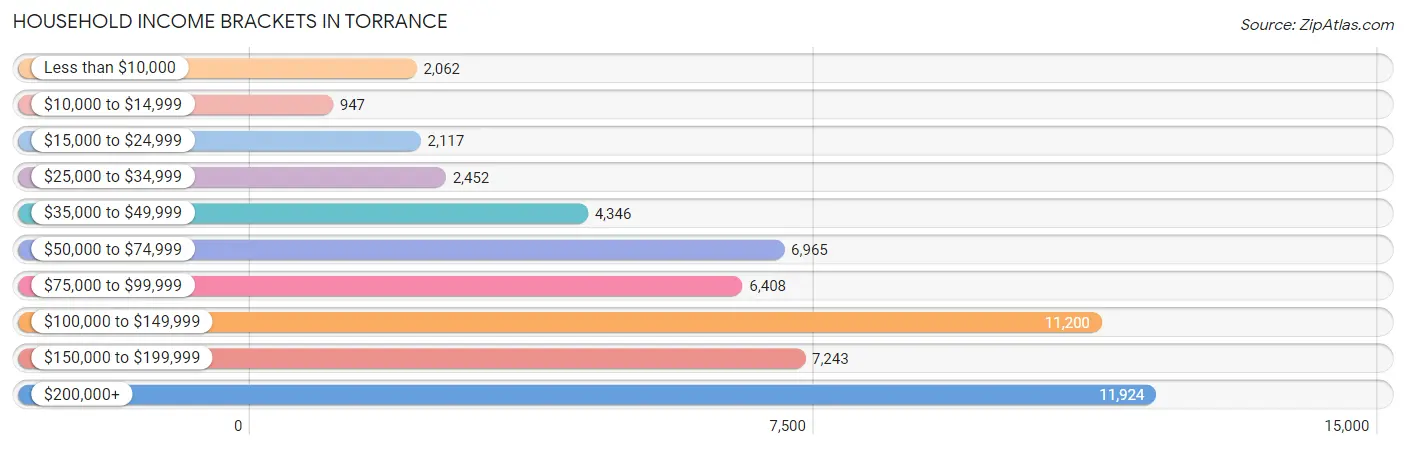
| Income Bracket | # Households | % Households |
| Less than $10,000 | 2,062 | 3.7% |
| $10,000 to $14,999 | 947 | 1.7% |
| $15,000 to $24,999 | 2,117 | 3.8% |
| $25,000 to $34,999 | 2,452 | 4.4% |
| $35,000 to $49,999 | 4,346 | 7.8% |
| $50,000 to $74,999 | 6,965 | 12.5% |
| $75,000 to $99,999 | 6,408 | 11.5% |
| $100,000 to $149,999 | 11,200 | 20.1% |
| $150,000 to $199,999 | 7,243 | 13.0% |
| $200,000+ | 11,924 | 21.4% |
Household Income by Householder Age in Torrance
The median household income in Torrance is $109,554, with the highest median household income of $126,306 found in the 45 to 64 years age bracket for the primary householder. A total of 23,484 households (42.1%) fall into this category. Meanwhile, the 65+ years age bracket for the primary householder has the lowest median household income of $71,555, with 15,527 households (27.9%) in this group.
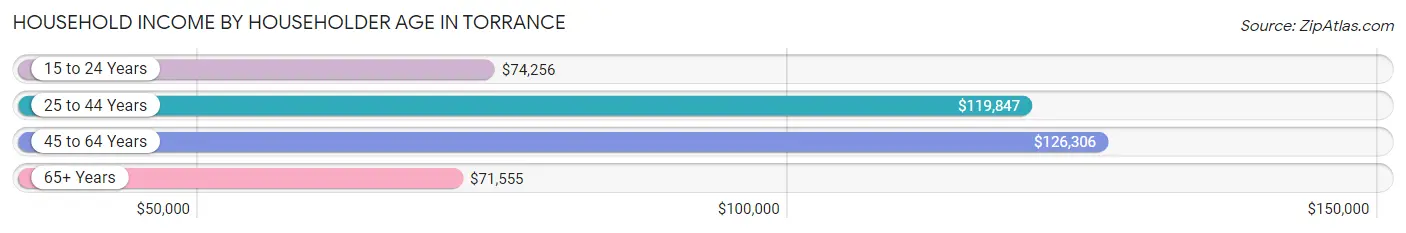
| Income Bracket | # Households | Median Income |
| 15 to 24 Years | 593 (1.1%) | $74,256 |
| 25 to 44 Years | 16,115 (28.9%) | $119,847 |
| 45 to 64 Years | 23,484 (42.1%) | $126,306 |
| 65+ Years | 15,527 (27.9%) | $71,555 |
| Total | 55,719 (100.0%) | $109,554 |
Poverty in Torrance
Income Below Poverty by Sex and Age in Torrance
With 5.4% poverty level for males and 7.9% for females among the residents of Torrance, 16 and 17 year old males and 75 year old and over females are the most vulnerable to poverty, with 175 males (9.8%) and 911 females (12.8%) in their respective age groups living below the poverty level.
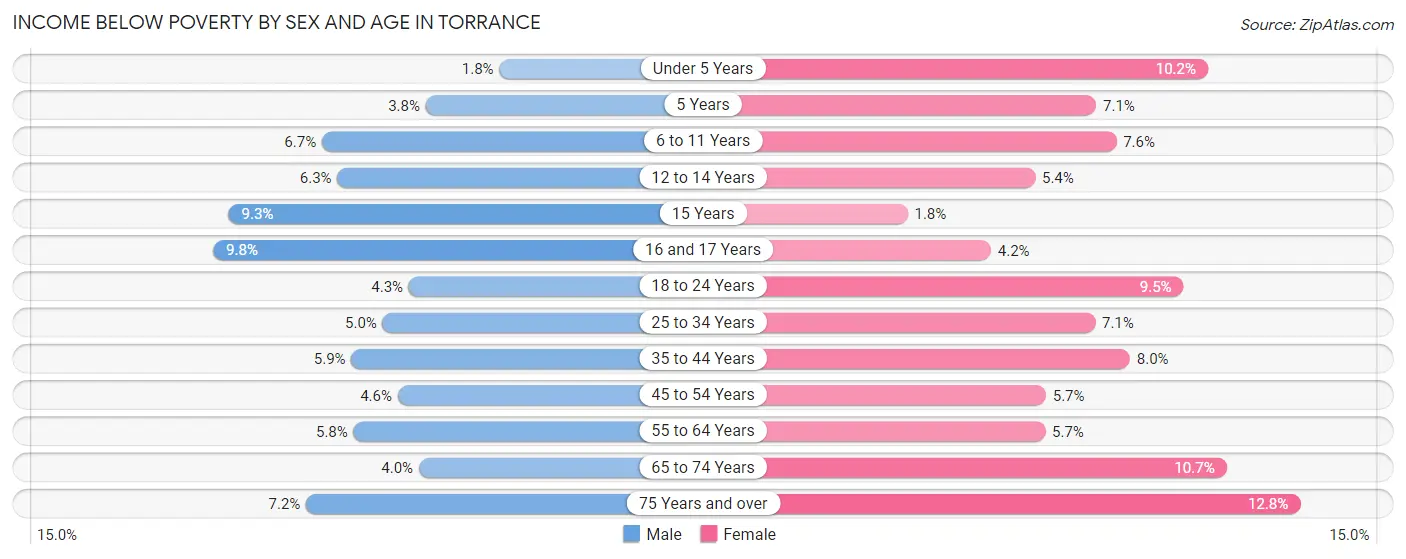
| Age Bracket | Male | Female |
| Under 5 Years | 67 (1.8%) | 366 (10.2%) |
| 5 Years | 29 (3.8%) | 56 (7.1%) |
| 6 to 11 Years | 363 (6.7%) | 376 (7.6%) |
| 12 to 14 Years | 189 (6.3%) | 153 (5.4%) |
| 15 Years | 102 (9.3%) | 11 (1.8%) |
| 16 and 17 Years | 175 (9.8%) | 54 (4.2%) |
| 18 to 24 Years | 208 (4.3%) | 415 (9.5%) |
| 25 to 34 Years | 441 (5.0%) | 611 (7.0%) |
| 35 to 44 Years | 589 (5.9%) | 789 (8.0%) |
| 45 to 54 Years | 470 (4.6%) | 635 (5.7%) |
| 55 to 64 Years | 648 (5.8%) | 600 (5.7%) |
| 65 to 74 Years | 244 (4.0%) | 794 (10.7%) |
| 75 Years and over | 304 (7.2%) | 911 (12.8%) |
| Total | 3,829 (5.4%) | 5,771 (7.9%) |
Income Above Poverty by Sex and Age in Torrance
According to the poverty statistics in Torrance, males aged under 5 years and females aged 15 years are the age groups that are most secure financially, with 98.2% of males and 98.2% of females in these age groups living above the poverty line.
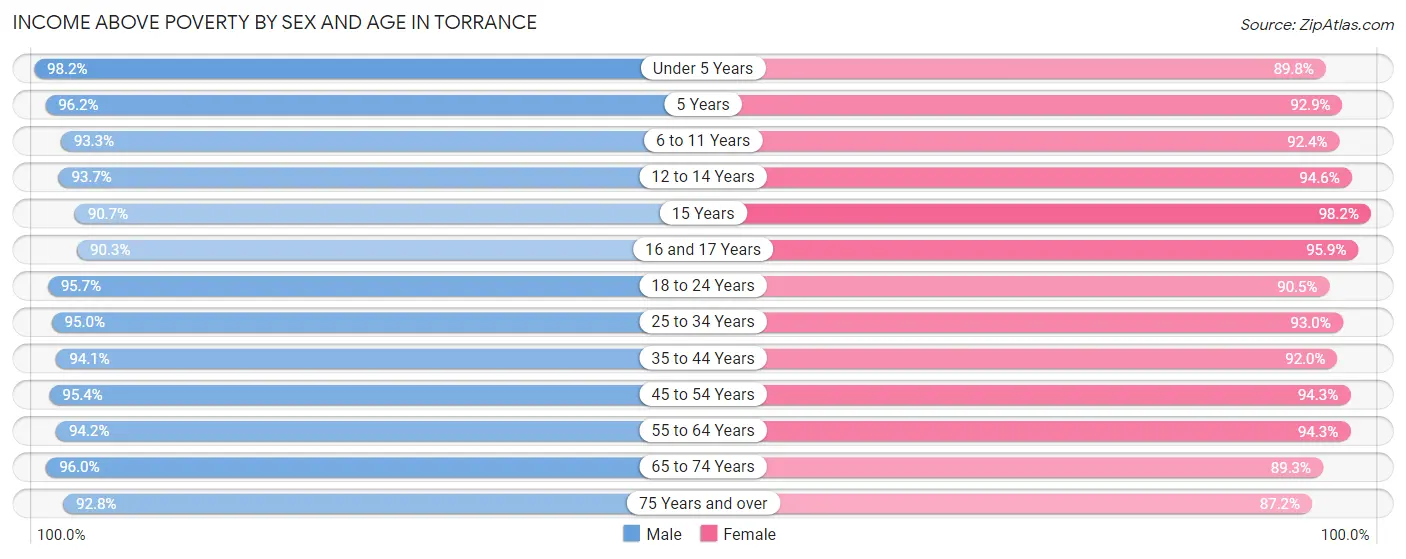
| Age Bracket | Male | Female |
| Under 5 Years | 3,703 (98.2%) | 3,227 (89.8%) |
| 5 Years | 729 (96.2%) | 735 (92.9%) |
| 6 to 11 Years | 5,037 (93.3%) | 4,546 (92.4%) |
| 12 to 14 Years | 2,818 (93.7%) | 2,692 (94.6%) |
| 15 Years | 992 (90.7%) | 591 (98.2%) |
| 16 and 17 Years | 1,620 (90.2%) | 1,246 (95.9%) |
| 18 to 24 Years | 4,632 (95.7%) | 3,948 (90.5%) |
| 25 to 34 Years | 8,328 (95.0%) | 8,052 (92.9%) |
| 35 to 44 Years | 9,396 (94.1%) | 9,046 (92.0%) |
| 45 to 54 Years | 9,716 (95.4%) | 10,549 (94.3%) |
| 55 to 64 Years | 10,447 (94.2%) | 10,004 (94.3%) |
| 65 to 74 Years | 5,833 (96.0%) | 6,622 (89.3%) |
| 75 Years and over | 3,943 (92.8%) | 6,228 (87.2%) |
| Total | 67,194 (94.6%) | 67,486 (92.1%) |
Income Below Poverty Among Married-Couple Families in Torrance
The poverty statistics for married-couple families in Torrance show that 2.8% or 803 of the total 29,132 families live below the poverty line. Families with 3 or 4 children have the highest poverty rate of 11.3%, comprising of 181 families. On the other hand, families with no children have the lowest poverty rate of 2.1%, which includes 342 families.
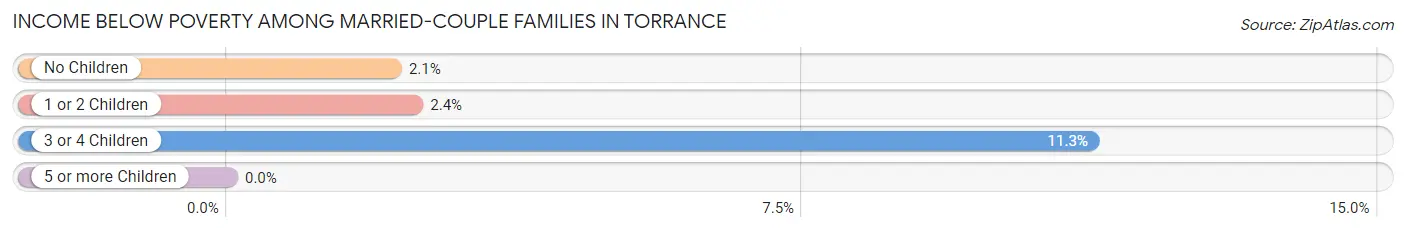
| Children | Above Poverty | Below Poverty |
| No Children | 15,630 (97.9%) | 342 (2.1%) |
| 1 or 2 Children | 11,271 (97.6%) | 280 (2.4%) |
| 3 or 4 Children | 1,428 (88.7%) | 181 (11.3%) |
| 5 or more Children | 0 (0.0%) | 0 (0.0%) |
| Total | 28,329 (97.2%) | 803 (2.8%) |
Income Below Poverty Among Single-Parent Households in Torrance
According to the poverty data in Torrance, 6.3% or 133 single-father households and 13.4% or 767 single-mother households are living below the poverty line. Among single-father households, those with 3 or 4 children have the highest poverty rate, with 5 households (29.4%) experiencing poverty. Likewise, among single-mother households, those with 3 or 4 children have the highest poverty rate, with 43 households (25.2%) falling below the poverty line.
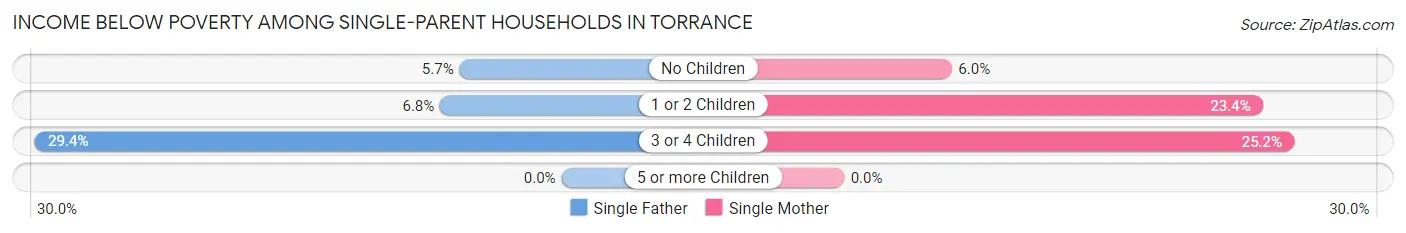
| Children | Single Father | Single Mother |
| No Children | 71 (5.7%) | 198 (6.0%) |
| 1 or 2 Children | 57 (6.8%) | 526 (23.4%) |
| 3 or 4 Children | 5 (29.4%) | 43 (25.2%) |
| 5 or more Children | 0 (0.0%) | 0 (0.0%) |
| Total | 133 (6.3%) | 767 (13.4%) |
Income Below Poverty Among Married-Couple vs Single-Parent Households in Torrance
The poverty data for Torrance shows that 803 of the married-couple family households (2.8%) and 900 of the single-parent households (11.5%) are living below the poverty level. Within the married-couple family households, those with 3 or 4 children have the highest poverty rate, with 181 households (11.3%) falling below the poverty line. Among the single-parent households, those with 3 or 4 children have the highest poverty rate, with 48 household (25.5%) living below poverty.
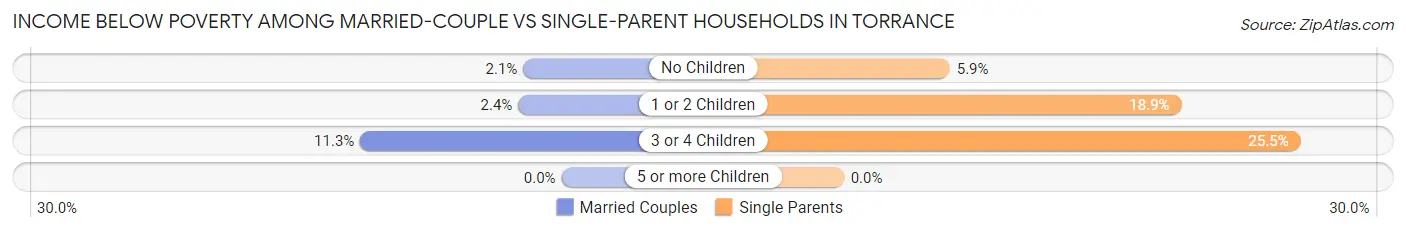
| Children | Married-Couple Families | Single-Parent Households |
| No Children | 342 (2.1%) | 269 (5.9%) |
| 1 or 2 Children | 280 (2.4%) | 583 (18.9%) |
| 3 or 4 Children | 181 (11.3%) | 48 (25.5%) |
| 5 or more Children | 0 (0.0%) | 0 (0.0%) |
| Total | 803 (2.8%) | 900 (11.5%) |
Race in Torrance
The most populous races in Torrance are White / Caucasian (56,586 | 38.9%), Asian (55,048 | 37.9%), and Hispanic or Latino (28,062 | 19.3%).
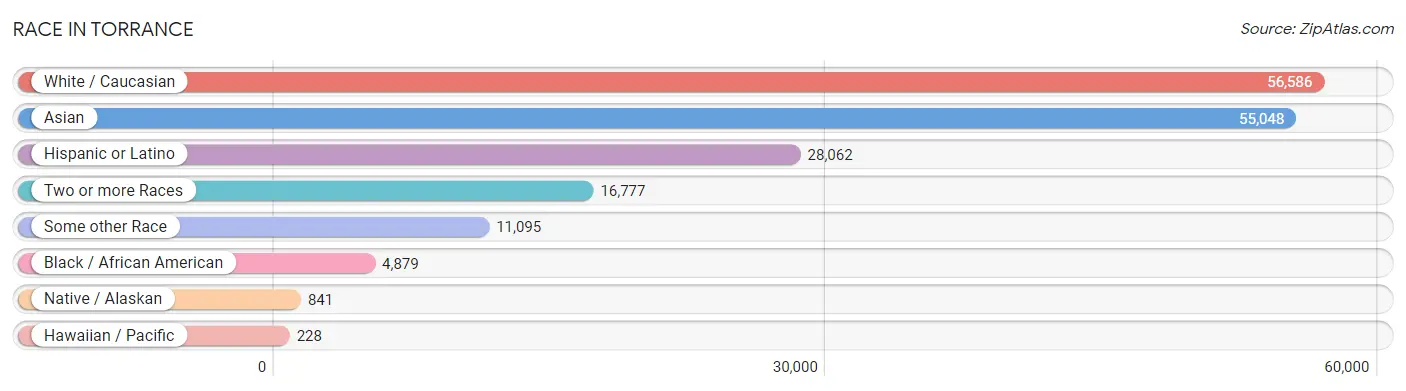
| Race | # Population | % Population |
| Asian | 55,048 | 37.9% |
| Black / African American | 4,879 | 3.4% |
| Hawaiian / Pacific | 228 | 0.2% |
| Hispanic or Latino | 28,062 | 19.3% |
| Native / Alaskan | 841 | 0.6% |
| White / Caucasian | 56,586 | 38.9% |
| Two or more Races | 16,777 | 11.5% |
| Some other Race | 11,095 | 7.6% |
| Total | 145,454 | 100.0% |
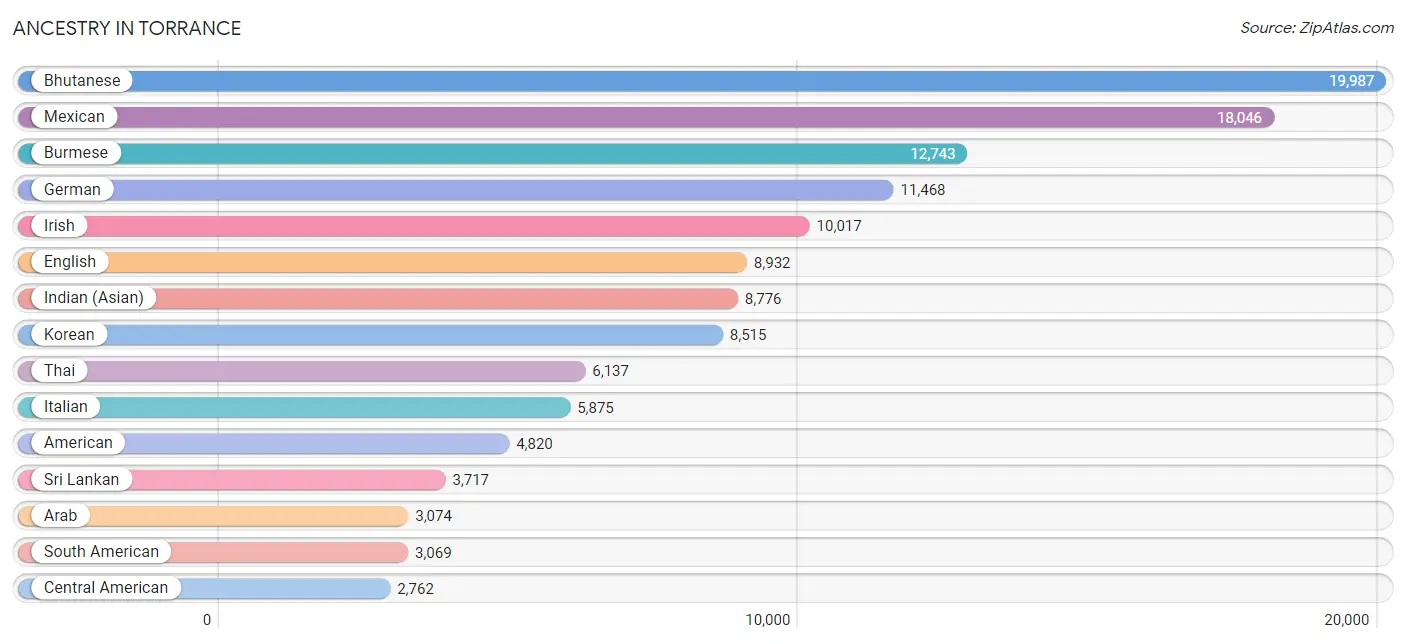
Ancestry in Torrance
The most populous ancestries reported in Torrance are Bhutanese (19,987 | 13.7%), Mexican (18,046 | 12.4%), Burmese (12,743 | 8.8%), German (11,468 | 7.9%), and Irish (10,017 | 6.9%), together accounting for 49.7% of all Torrance residents.
| Ancestry | # Population | % Population |
| Afghan | 340 | 0.2% |
| African | 73 | 0.1% |
| American | 4,820 | 3.3% |
| Apache | 165 | 0.1% |
| Arab | 3,074 | 2.1% |
| Argentinean | 392 | 0.3% |
| Armenian | 419 | 0.3% |
| Assyrian / Chaldean / Syriac | 17 | 0.0% |
| Australian | 44 | 0.0% |
| Austrian | 159 | 0.1% |
| Bangladeshi | 191 | 0.1% |
| Basque | 14 | 0.0% |
| Belgian | 91 | 0.1% |
| Belizean | 223 | 0.2% |
| Bhutanese | 19,987 | 13.7% |
| Blackfeet | 65 | 0.0% |
| Bolivian | 90 | 0.1% |
| Brazilian | 700 | 0.5% |
| British | 683 | 0.5% |
| Bulgarian | 98 | 0.1% |
| Burmese | 12,743 | 8.8% |
| Cajun | 15 | 0.0% |
| Cambodian | 2 | 0.0% |
| Canadian | 295 | 0.2% |
| Central American | 2,762 | 1.9% |
| Central American Indian | 122 | 0.1% |
| Cherokee | 223 | 0.2% |
| Chilean | 137 | 0.1% |
| Chinese | 12 | 0.0% |
| Choctaw | 15 | 0.0% |
| Colombian | 714 | 0.5% |
| Costa Rican | 199 | 0.1% |
| Croatian | 335 | 0.2% |
| Crow | 14 | 0.0% |
| Cuban | 968 | 0.7% |
| Czech | 286 | 0.2% |
| Czechoslovakian | 49 | 0.0% |
| Danish | 632 | 0.4% |
| Dominican | 46 | 0.0% |
| Dutch | 1,695 | 1.2% |
| Eastern European | 352 | 0.2% |
| Ecuadorian | 614 | 0.4% |
| Egyptian | 636 | 0.4% |
| English | 8,932 | 6.1% |
| Estonian | 6 | 0.0% |
| European | 1,658 | 1.1% |
| Filipino | 1,003 | 0.7% |
| Finnish | 114 | 0.1% |
| French | 1,763 | 1.2% |
| French Canadian | 457 | 0.3% |
| German | 11,468 | 7.9% |
| Ghanaian | 45 | 0.0% |
| Greek | 462 | 0.3% |
| Guamanian / Chamorro | 145 | 0.1% |
| Guatemalan | 560 | 0.4% |
| Guyanese | 20 | 0.0% |
| Haitian | 22 | 0.0% |
| Honduran | 102 | 0.1% |
| Hopi | 39 | 0.0% |
| Hungarian | 533 | 0.4% |
| Icelander | 30 | 0.0% |
| Indian (Asian) | 8,776 | 6.0% |
| Indonesian | 634 | 0.4% |
| Inupiat | 5 | 0.0% |
| Iranian | 566 | 0.4% |
| Irish | 10,017 | 6.9% |
| Iroquois | 27 | 0.0% |
| Israeli | 25 | 0.0% |
| Italian | 5,875 | 4.0% |
| Jamaican | 159 | 0.1% |
| Japanese | 455 | 0.3% |
| Jordanian | 261 | 0.2% |
| Korean | 8,515 | 5.9% |
| Laotian | 293 | 0.2% |
| Latvian | 65 | 0.0% |
| Lebanese | 870 | 0.6% |
| Lithuanian | 236 | 0.2% |
| Malaysian | 65 | 0.0% |
| Mexican | 18,046 | 12.4% |
| Mexican American Indian | 91 | 0.1% |
| Mongolian | 105 | 0.1% |
| Native Hawaiian | 338 | 0.2% |
| Navajo | 54 | 0.0% |
| Nicaraguan | 275 | 0.2% |
| Nigerian | 275 | 0.2% |
| Northern European | 399 | 0.3% |
| Norwegian | 1,496 | 1.0% |
| Okinawan | 15 | 0.0% |
| Paiute | 250 | 0.2% |
| Pakistani | 608 | 0.4% |
| Palestinian | 439 | 0.3% |
| Panamanian | 162 | 0.1% |
| Pennsylvania German | 23 | 0.0% |
| Peruvian | 866 | 0.6% |
| Polish | 2,222 | 1.5% |
| Portuguese | 609 | 0.4% |
| Pueblo | 78 | 0.1% |
| Puerto Rican | 1,126 | 0.8% |
| Romanian | 103 | 0.1% |
| Russian | 1,519 | 1.0% |
| Salvadoran | 1,454 | 1.0% |
| Samoan | 260 | 0.2% |
| Scandinavian | 350 | 0.2% |
| Scotch-Irish | 613 | 0.4% |
| Scottish | 1,506 | 1.0% |
| Seminole | 25 | 0.0% |
| Serbian | 50 | 0.0% |
| Sioux | 10 | 0.0% |
| Slavic | 117 | 0.1% |
| Slovak | 306 | 0.2% |
| Slovene | 29 | 0.0% |
| South African | 52 | 0.0% |
| South American | 3,069 | 2.1% |
| South American Indian | 82 | 0.1% |
| Spaniard | 679 | 0.5% |
| Spanish | 675 | 0.5% |
| Spanish American | 5 | 0.0% |
| Sri Lankan | 3,717 | 2.6% |
| Subsaharan African | 537 | 0.4% |
| Sudanese | 42 | 0.0% |
| Swedish | 1,083 | 0.7% |
| Swiss | 372 | 0.3% |
| Syrian | 105 | 0.1% |
| Thai | 6,137 | 4.2% |
| Tohono O'Odham | 50 | 0.0% |
| Tongan | 114 | 0.1% |
| Trinidadian and Tobagonian | 17 | 0.0% |
| Turkish | 74 | 0.1% |
| Ukrainian | 356 | 0.2% |
| Venezuelan | 228 | 0.2% |
| Vietnamese | 103 | 0.1% |
| Welsh | 330 | 0.2% |
| Yaqui | 7 | 0.0% |
| Yugoslavian | 37 | 0.0% |
| Yuman | 170 | 0.1% | View All 135 Rows |
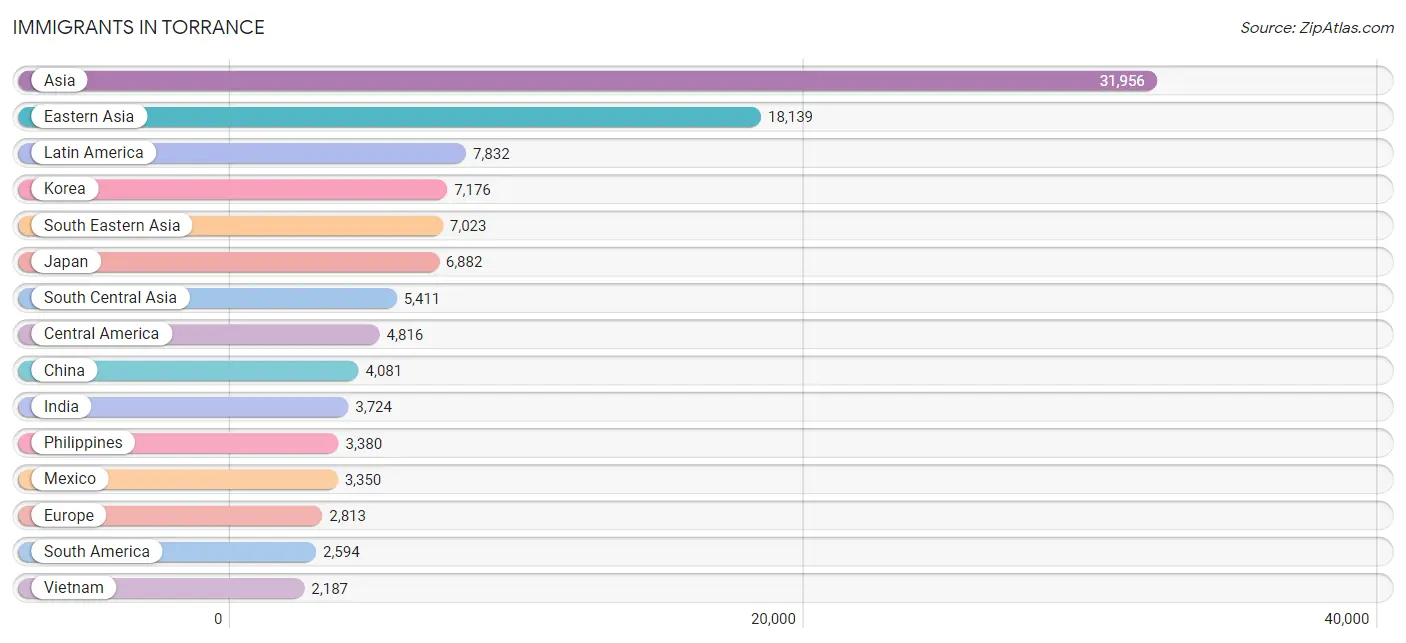
Immigrants in Torrance
The most numerous immigrant groups reported in Torrance came from Asia (31,956 | 22.0%), Eastern Asia (18,139 | 12.5%), Latin America (7,832 | 5.4%), Korea (7,176 | 4.9%), and South Eastern Asia (7,023 | 4.8%), together accounting for 49.6% of all Torrance residents.
| Immigration Origin | # Population | % Population |
| Afghanistan | 180 | 0.1% |
| Africa | 1,043 | 0.7% |
| Argentina | 286 | 0.2% |
| Armenia | 10 | 0.0% |
| Asia | 31,956 | 22.0% |
| Australia | 61 | 0.0% |
| Austria | 30 | 0.0% |
| Bangladesh | 79 | 0.1% |
| Belarus | 382 | 0.3% |
| Belgium | 23 | 0.0% |
| Belize | 143 | 0.1% |
| Bolivia | 46 | 0.0% |
| Brazil | 804 | 0.5% |
| Bulgaria | 60 | 0.0% |
| Cabo Verde | 8 | 0.0% |
| Cambodia | 38 | 0.0% |
| Canada | 484 | 0.3% |
| Caribbean | 422 | 0.3% |
| Central America | 4,816 | 3.3% |
| Chile | 105 | 0.1% |
| China | 4,081 | 2.8% |
| Colombia | 175 | 0.1% |
| Costa Rica | 78 | 0.1% |
| Croatia | 4 | 0.0% |
| Cuba | 332 | 0.2% |
| Czechoslovakia | 68 | 0.1% |
| Eastern Africa | 132 | 0.1% |
| Eastern Asia | 18,139 | 12.5% |
| Eastern Europe | 1,251 | 0.9% |
| Ecuador | 369 | 0.3% |
| Egypt | 528 | 0.4% |
| El Salvador | 686 | 0.5% |
| England | 272 | 0.2% |
| Europe | 2,813 | 1.9% |
| Fiji | 38 | 0.0% |
| France | 119 | 0.1% |
| Germany | 293 | 0.2% |
| Greece | 32 | 0.0% |
| Guatemala | 286 | 0.2% |
| Guyana | 10 | 0.0% |
| Honduras | 54 | 0.0% |
| Hong Kong | 401 | 0.3% |
| Hungary | 19 | 0.0% |
| India | 3,724 | 2.6% |
| Indonesia | 260 | 0.2% |
| Iran | 559 | 0.4% |
| Iraq | 45 | 0.0% |
| Ireland | 61 | 0.0% |
| Israel | 55 | 0.0% |
| Italy | 99 | 0.1% |
| Jamaica | 64 | 0.0% |
| Japan | 6,882 | 4.7% |
| Jordan | 322 | 0.2% |
| Kazakhstan | 23 | 0.0% |
| Kenya | 37 | 0.0% |
| Korea | 7,176 | 4.9% |
| Kuwait | 110 | 0.1% |
| Laos | 19 | 0.0% |
| Latin America | 7,832 | 5.4% |
| Lebanon | 403 | 0.3% |
| Liberia | 16 | 0.0% |
| Lithuania | 22 | 0.0% |
| Malaysia | 112 | 0.1% |
| Mexico | 3,350 | 2.3% |
| Moldova | 24 | 0.0% |
| Morocco | 22 | 0.0% |
| Nepal | 86 | 0.1% |
| Netherlands | 57 | 0.0% |
| Nicaragua | 115 | 0.1% |
| Nigeria | 255 | 0.2% |
| Northern Africa | 550 | 0.4% |
| Northern Europe | 737 | 0.5% |
| Oceania | 115 | 0.1% |
| Pakistan | 595 | 0.4% |
| Panama | 104 | 0.1% |
| Peru | 653 | 0.4% |
| Philippines | 3,380 | 2.3% |
| Poland | 116 | 0.1% |
| Portugal | 14 | 0.0% |
| Romania | 83 | 0.1% |
| Russia | 186 | 0.1% |
| Scotland | 103 | 0.1% |
| Serbia | 36 | 0.0% |
| Singapore | 52 | 0.0% |
| South Africa | 72 | 0.1% |
| South America | 2,594 | 1.8% |
| South Central Asia | 5,411 | 3.7% |
| South Eastern Asia | 7,023 | 4.8% |
| Southern Europe | 224 | 0.2% |
| Spain | 79 | 0.1% |
| Sri Lanka | 165 | 0.1% |
| Sweden | 64 | 0.0% |
| Switzerland | 79 | 0.1% |
| Syria | 177 | 0.1% |
| Taiwan | 1,335 | 0.9% |
| Thailand | 397 | 0.3% |
| Trinidad and Tobago | 26 | 0.0% |
| Turkey | 14 | 0.0% |
| Uganda | 30 | 0.0% |
| Ukraine | 229 | 0.2% |
| Venezuela | 146 | 0.1% |
| Vietnam | 2,187 | 1.5% |
| Western Africa | 289 | 0.2% |
| Western Asia | 1,194 | 0.8% |
| Western Europe | 601 | 0.4% | View All 105 Rows |
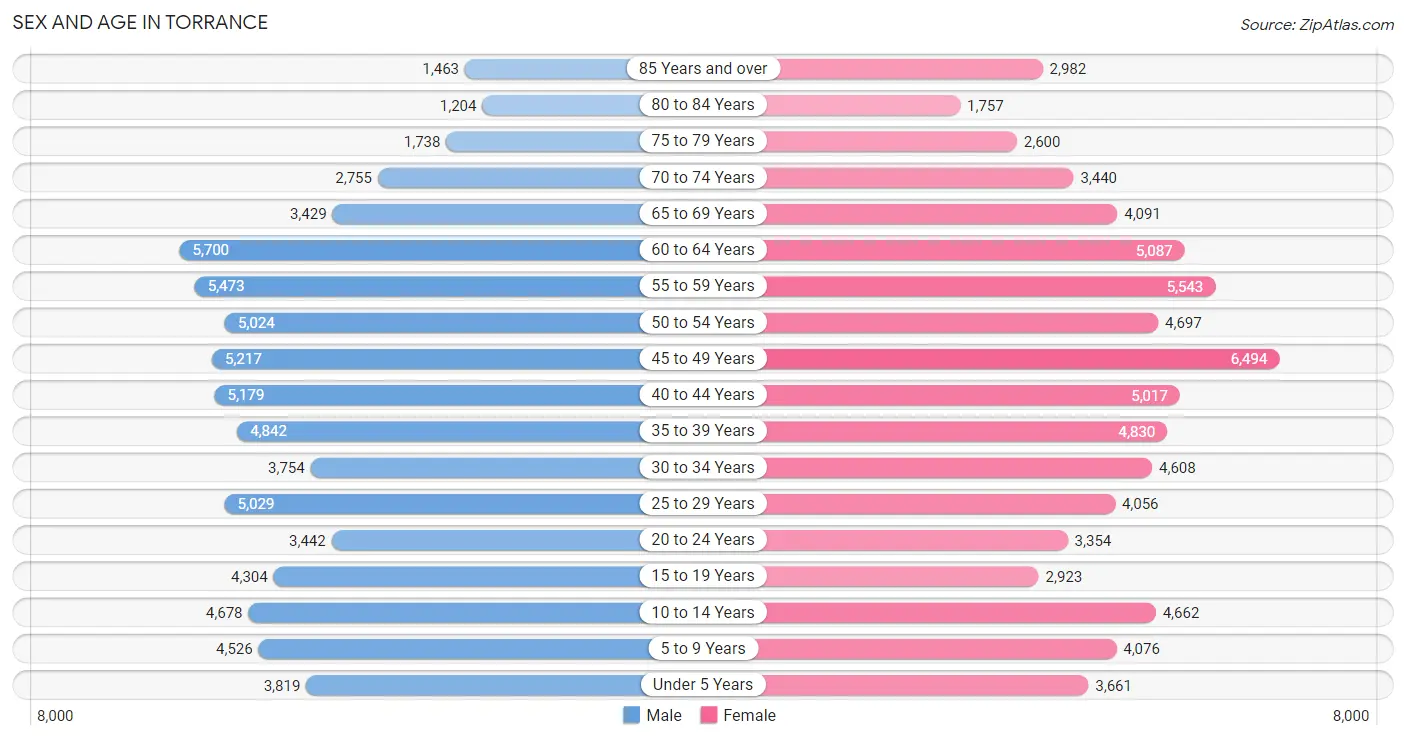
Sex and Age in Torrance
Sex and Age in Torrance
The most populous age groups in Torrance are 60 to 64 Years (5,700 | 8.0%) for men and 45 to 49 Years (6,494 | 8.8%) for women.
| Age Bracket | Male | Female |
| Under 5 Years | 3,819 (5.3%) | 3,661 (5.0%) |
| 5 to 9 Years | 4,526 (6.3%) | 4,076 (5.5%) |
| 10 to 14 Years | 4,678 (6.5%) | 4,662 (6.3%) |
| 15 to 19 Years | 4,304 (6.0%) | 2,923 (4.0%) |
| 20 to 24 Years | 3,442 (4.8%) | 3,354 (4.5%) |
| 25 to 29 Years | 5,029 (7.0%) | 4,056 (5.5%) |
| 30 to 34 Years | 3,754 (5.2%) | 4,608 (6.2%) |
| 35 to 39 Years | 4,842 (6.8%) | 4,830 (6.5%) |
| 40 to 44 Years | 5,179 (7.2%) | 5,017 (6.8%) |
| 45 to 49 Years | 5,217 (7.3%) | 6,494 (8.8%) |
| 50 to 54 Years | 5,024 (7.0%) | 4,697 (6.4%) |
| 55 to 59 Years | 5,473 (7.6%) | 5,543 (7.5%) |
| 60 to 64 Years | 5,700 (8.0%) | 5,087 (6.9%) |
| 65 to 69 Years | 3,429 (4.8%) | 4,091 (5.5%) |
| 70 to 74 Years | 2,755 (3.8%) | 3,440 (4.7%) |
| 75 to 79 Years | 1,738 (2.4%) | 2,600 (3.5%) |
| 80 to 84 Years | 1,204 (1.7%) | 1,757 (2.4%) |
| 85 Years and over | 1,463 (2.0%) | 2,982 (4.0%) |
| Total | 71,576 (100.0%) | 73,878 (100.0%) |
Families and Households in Torrance
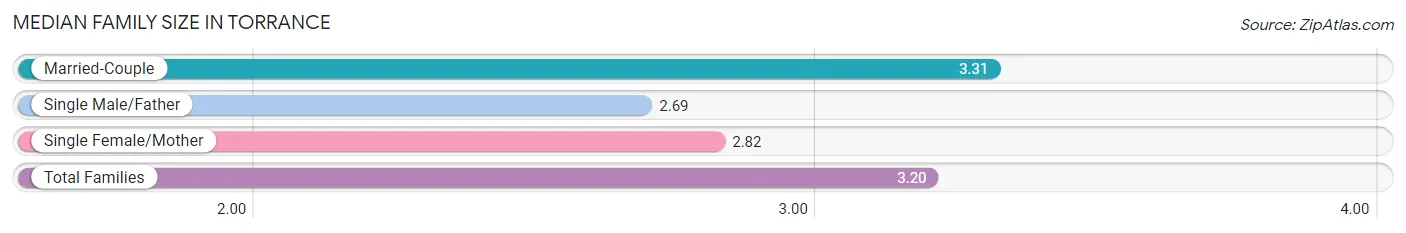
Median Family Size in Torrance
The median family size in Torrance is 3.20 persons per family, with married-couple families (29,132 | 78.8%) accounting for the largest median family size of 3.31 persons per family. On the other hand, single male/father families (2,104 | 5.7%) represent the smallest median family size with 2.69 persons per family.
| Family Type | # Families | Family Size |
| Married-Couple | 29,132 (78.8%) | 3.31 |
| Single Male/Father | 2,104 (5.7%) | 2.69 |
| Single Female/Mother | 5,709 (15.4%) | 2.82 |
| Total Families | 36,945 (100.0%) | 3.20 |
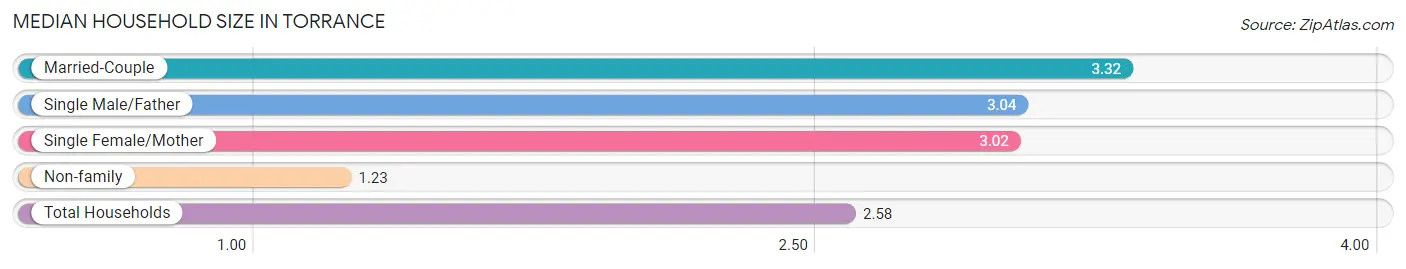
Median Household Size in Torrance
The median household size in Torrance is 2.58 persons per household, with married-couple households (29,132 | 52.3%) accounting for the largest median household size of 3.32 persons per household. non-family households (18,774 | 33.7%) represent the smallest median household size with 1.23 persons per household.
| Household Type | # Households | Household Size |
| Married-Couple | 29,132 (52.3%) | 3.32 |
| Single Male/Father | 2,104 (3.8%) | 3.04 |
| Single Female/Mother | 5,709 (10.2%) | 3.02 |
| Non-family | 18,774 (33.7%) | 1.23 |
| Total Households | 55,719 (100.0%) | 2.58 |
Household Size by Marriage Status in Torrance
Out of a total of 55,719 households in Torrance, 36,945 (66.3%) are family households, while 18,774 (33.7%) are nonfamily households. The most numerous type of family households are 2-person households, comprising 14,218, and the most common type of nonfamily households are 1-person households, comprising 15,270.
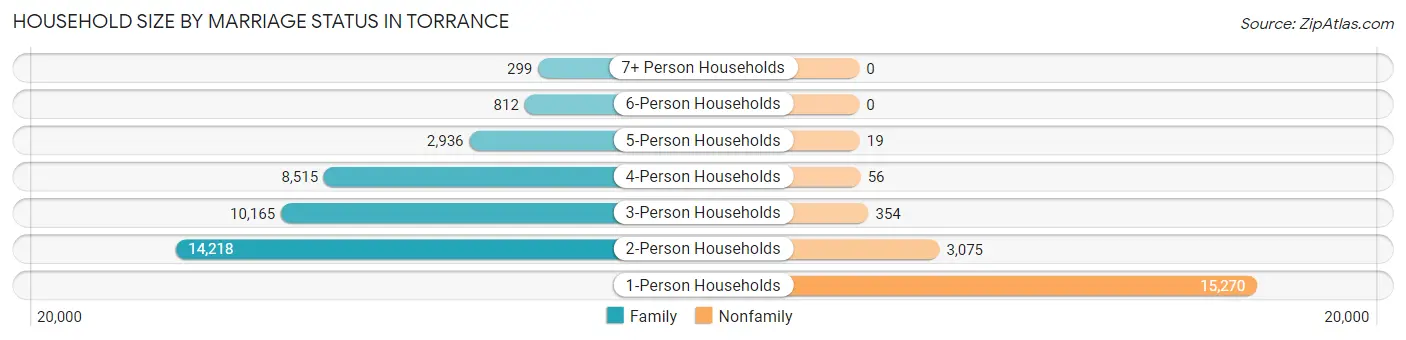
| Household Size | Family Households | Nonfamily Households |
| 1-Person Households | - | 15,270 (27.4%) |
| 2-Person Households | 14,218 (25.5%) | 3,075 (5.5%) |
| 3-Person Households | 10,165 (18.2%) | 354 (0.6%) |
| 4-Person Households | 8,515 (15.3%) | 56 (0.1%) |
| 5-Person Households | 2,936 (5.3%) | 19 (0.0%) |
| 6-Person Households | 812 (1.5%) | 0 (0.0%) |
| 7+ Person Households | 299 (0.5%) | 0 (0.0%) |
| Total | 36,945 (66.3%) | 18,774 (33.7%) |
Female Fertility in Torrance
Fertility by Age in Torrance
Average fertility rate in Torrance is 37.0 births per 1,000 women. Women in the age bracket of 20 to 34 years have the highest fertility rate with 69.0 births per 1,000 women. Women in the age bracket of 20 to 34 years acount for 68.3% of all women with births.
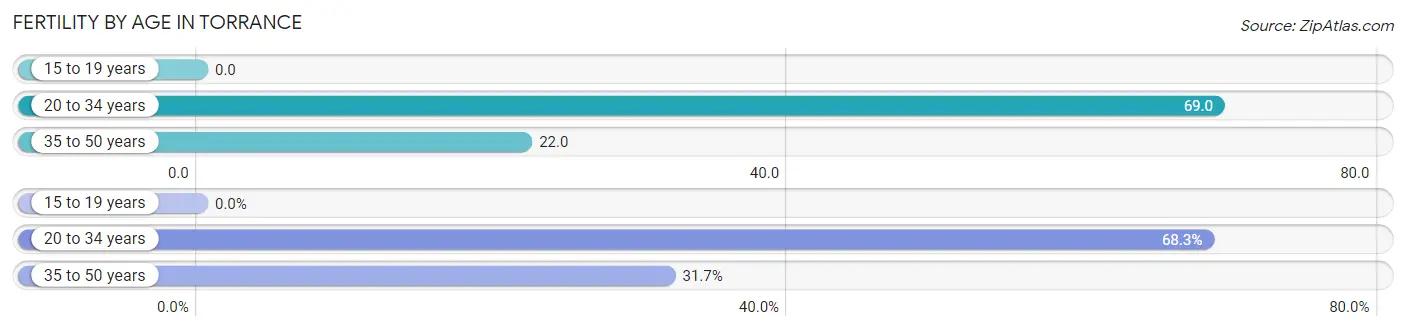
| Age Bracket | Women with Births | Births / 1,000 Women |
| 15 to 19 years | 0 (0.0%) | 0.0 |
| 20 to 34 years | 824 (68.3%) | 69.0 |
| 35 to 50 years | 383 (31.7%) | 22.0 |
| Total | 1,207 (100.0%) | 37.0 |
Fertility by Age by Marriage Status in Torrance
67.7% of women with births (1,207) in Torrance are married. The highest percentage of unmarried women with births falls into 20 to 34 years age bracket with 44.1% of them unmarried at the time of birth, while the lowest percentage of unmarried women with births belong to 35 to 50 years age bracket with 7.1% of them unmarried.
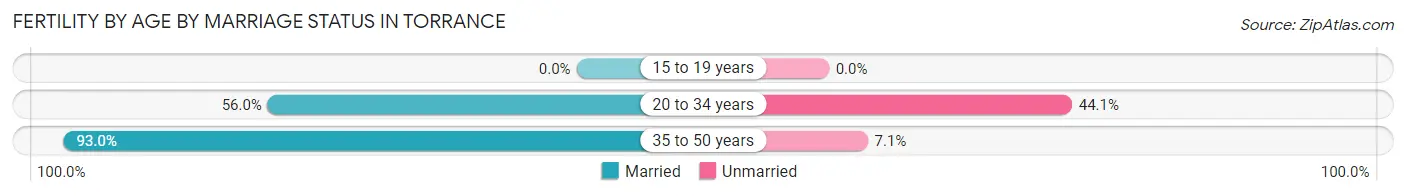
| Age Bracket | Married | Unmarried |
| 15 to 19 years | 0 (0.0%) | 0 (0.0%) |
| 20 to 34 years | 461 (55.9%) | 363 (44.1%) |
| 35 to 50 years | 356 (92.9%) | 27 (7.0%) |
| Total | 817 (67.7%) | 390 (32.3%) |
Fertility by Education in Torrance
Average fertility rate in Torrance is 37.0 births per 1,000 women. Women with the education attainment of high school diploma have the highest fertility rate of 83.0 births per 1,000 women, while women with the education attainment of less than high school have the lowest fertility at 9.0 births per 1,000 women. Women with the education attainment of bachelor's degree represent 27.5% of all women with births.
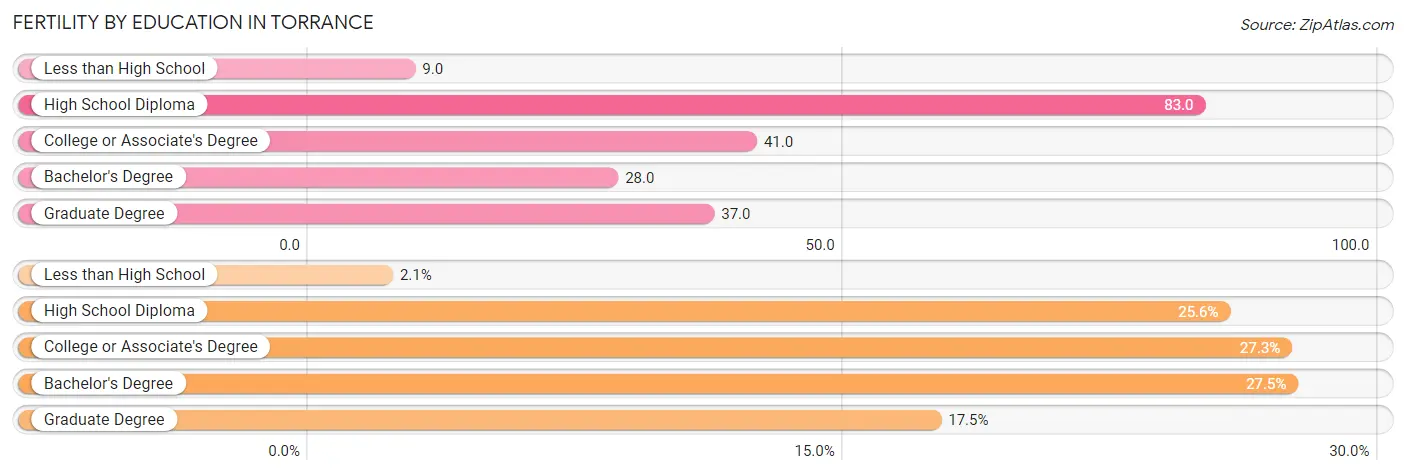
| Educational Attainment | Women with Births | Births / 1,000 Women |
| Less than High School | 25 (2.1%) | 9.0 |
| High School Diploma | 309 (25.6%) | 83.0 |
| College or Associate's Degree | 330 (27.3%) | 41.0 |
| Bachelor's Degree | 332 (27.5%) | 28.0 |
| Graduate Degree | 211 (17.5%) | 37.0 |
| Total | 1,207 (100.0%) | 37.0 |
Fertility by Education by Marriage Status in Torrance
32.3% of women with births in Torrance are unmarried. Women with the educational attainment of less than high school are most likely to be married with 100.0% of them married at childbirth, while women with the educational attainment of high school diploma are least likely to be married with 85.8% of them unmarried at childbirth.
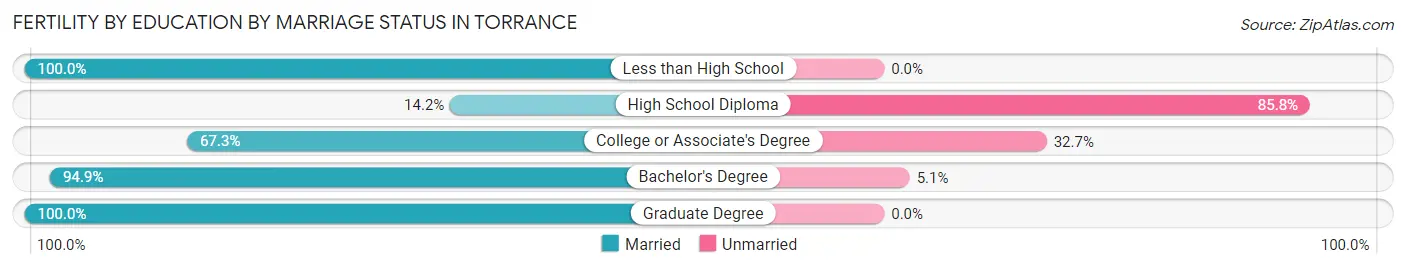
| Educational Attainment | Married | Unmarried |
| Less than High School | 25 (100.0%) | 0 (0.0%) |
| High School Diploma | 44 (14.2%) | 265 (85.8%) |
| College or Associate's Degree | 222 (67.3%) | 108 (32.7%) |
| Bachelor's Degree | 315 (94.9%) | 17 (5.1%) |
| Graduate Degree | 211 (100.0%) | 0 (0.0%) |
| Total | 817 (67.7%) | 390 (32.3%) |
Employment Characteristics in Torrance
Employment by Class of Employer in Torrance
Among the 70,216 employed individuals in Torrance, private company employees (48,745 | 69.4%), local government employees (5,773 | 8.2%), and not-for-profit organizations (5,094 | 7.2%) make up the most common classes of employment.
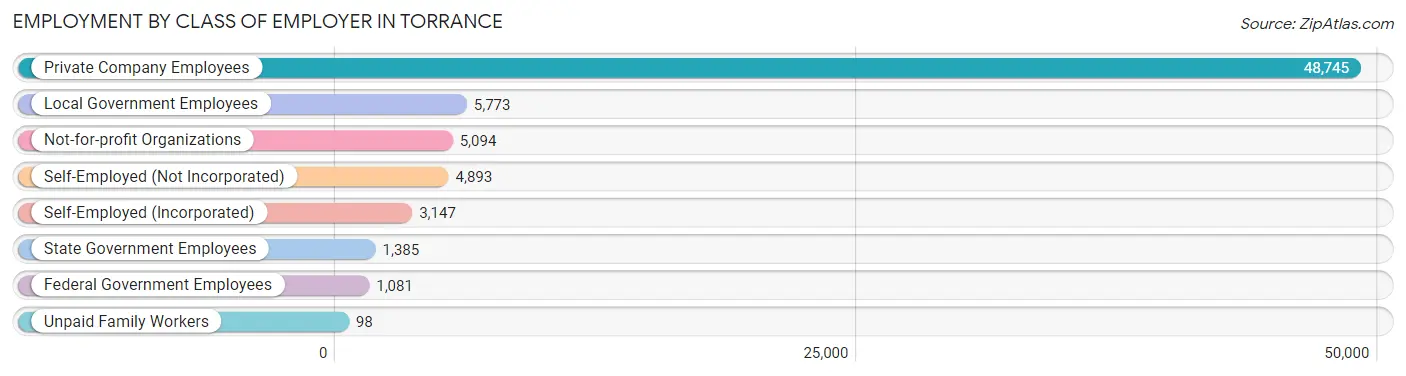
| Employer Class | # Employees | % Employees |
| Private Company Employees | 48,745 | 69.4% |
| Self-Employed (Incorporated) | 3,147 | 4.5% |
| Self-Employed (Not Incorporated) | 4,893 | 7.0% |
| Not-for-profit Organizations | 5,094 | 7.2% |
| Local Government Employees | 5,773 | 8.2% |
| State Government Employees | 1,385 | 2.0% |
| Federal Government Employees | 1,081 | 1.5% |
| Unpaid Family Workers | 98 | 0.1% |
| Total | 70,216 | 100.0% |
Employment Status by Age in Torrance
According to the labor force statistics for Torrance, out of the total population over 16 years of age (118,332), 64.5% or 76,324 individuals are in the labor force, with 5.3% or 4,045 of them unemployed. The age group with the highest labor force participation rate is 30 to 34 years, with 88.5% or 7,400 individuals in the labor force. Within the labor force, the 20 to 24 years age range has the highest percentage of unemployed individuals, with 17.6% or 856 of them being unemployed.

| Age Bracket | In Labor Force | Unemployed |
| 16 to 19 Years | 1,592 (28.8%) | 75 (4.7%) |
| 20 to 24 Years | 4,866 (71.6%) | 856 (17.6%) |
| 25 to 29 Years | 7,895 (86.9%) | 276 (3.5%) |
| 30 to 34 Years | 7,400 (88.5%) | 644 (8.7%) |
| 35 to 44 Years | 16,391 (82.5%) | 656 (4.0%) |
| 45 to 54 Years | 18,281 (85.3%) | 731 (4.0%) |
| 55 to 59 Years | 8,383 (76.1%) | 268 (3.2%) |
| 60 to 64 Years | 7,076 (65.6%) | 368 (5.2%) |
| 65 to 74 Years | 3,785 (27.6%) | 129 (3.4%) |
| 75 Years and over | 634 (5.4%) | 56 (8.9%) |
| Total | 76,324 (64.5%) | 4,045 (5.3%) |
Employment Status by Educational Attainment in Torrance
According to labor force statistics for Torrance, 81.2% of individuals (65,407) out of the total population between 25 and 64 years of age (80,550) are in the labor force, with 4.5% or 2,943 of them being unemployed. The group with the highest labor force participation rate are those with the educational attainment of bachelor's degree or higher, with 84.9% or 38,643 individuals in the labor force. Within the labor force, individuals with less than high school education have the highest percentage of unemployment, with 9.1% or 149 of them being unemployed.
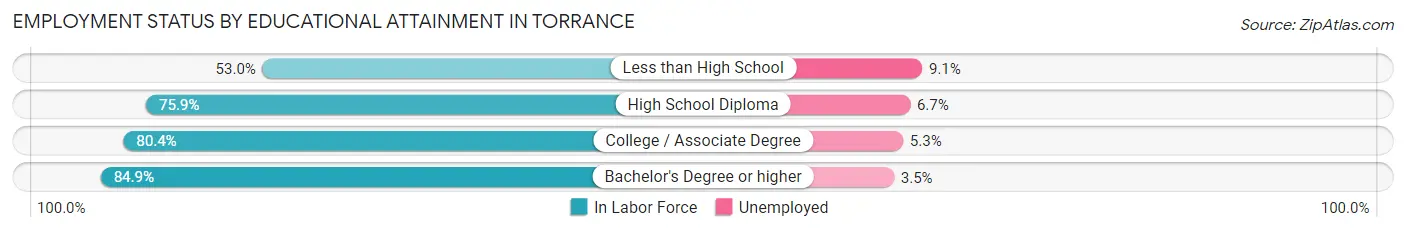
| Educational Attainment | In Labor Force | Unemployed |
| Less than High School | 1,633 (53.0%) | 280 (9.1%) |
| High School Diploma | 8,810 (75.9%) | 778 (6.7%) |
| College / Associate Degree | 16,357 (80.4%) | 1,078 (5.3%) |
| Bachelor's Degree or higher | 38,643 (84.9%) | 1,593 (3.5%) |
| Total | 65,407 (81.2%) | 3,625 (4.5%) |
Employment Occupations by Sex in Torrance
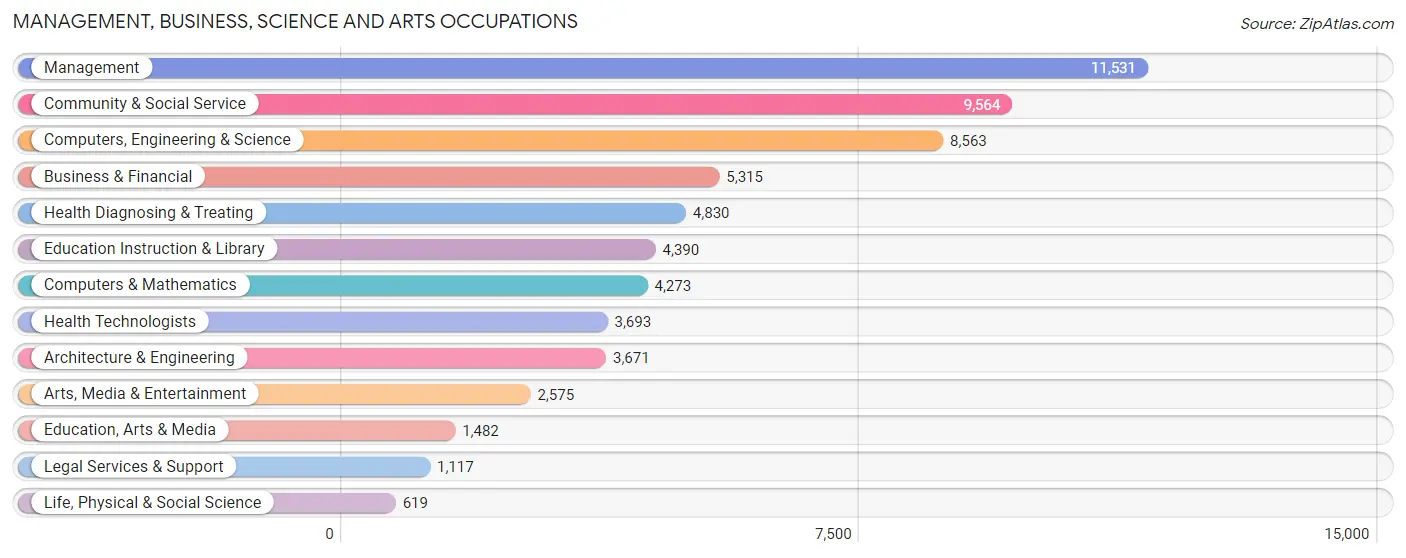
Management, Business, Science and Arts Occupations
The most common Management, Business, Science and Arts occupations in Torrance are Management (11,531 | 16.0%), Community & Social Service (9,564 | 13.3%), Computers, Engineering & Science (8,563 | 11.9%), Business & Financial (5,315 | 7.4%), and Health Diagnosing & Treating (4,830 | 6.7%).
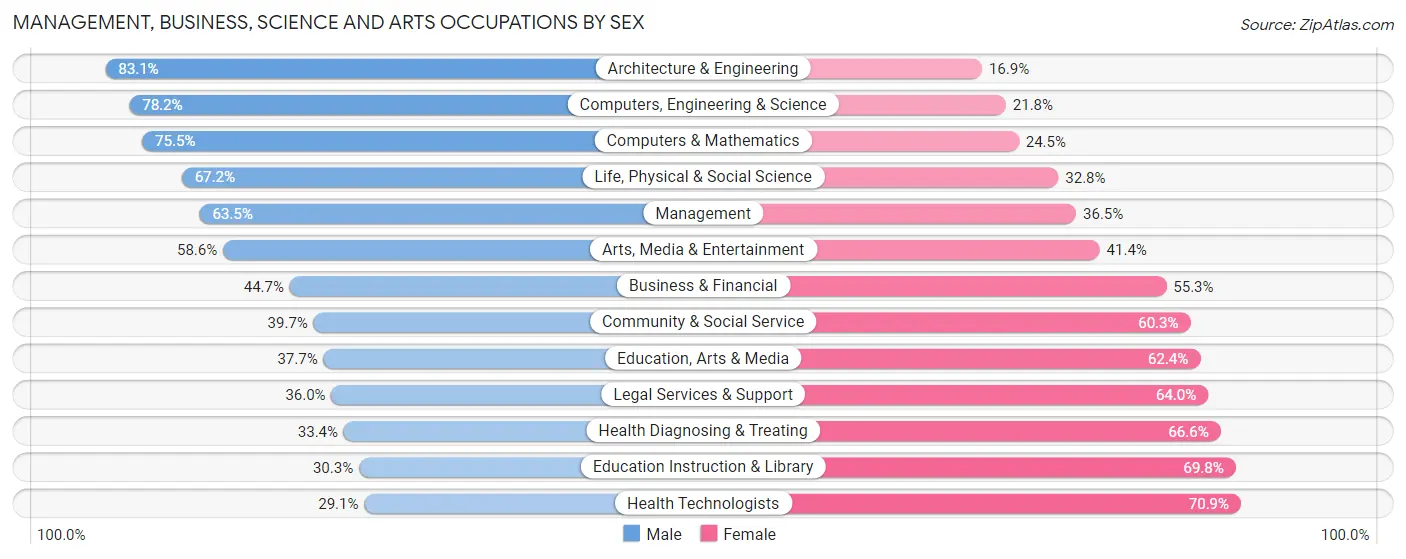
Management, Business, Science and Arts Occupations by Sex
Within the Management, Business, Science and Arts occupations in Torrance, the most male-oriented occupations are Architecture & Engineering (83.1%), Computers, Engineering & Science (78.2%), and Computers & Mathematics (75.5%), while the most female-oriented occupations are Health Technologists (70.9%), Education Instruction & Library (69.8%), and Health Diagnosing & Treating (66.6%).
| Occupation | Male | Female |
| Management | 7,323 (63.5%) | 4,208 (36.5%) |
| Business & Financial | 2,375 (44.7%) | 2,940 (55.3%) |
| Computers, Engineering & Science | 6,693 (78.2%) | 1,870 (21.8%) |
| Computers & Mathematics | 3,225 (75.5%) | 1,048 (24.5%) |
| Architecture & Engineering | 3,052 (83.1%) | 619 (16.9%) |
| Life, Physical & Social Science | 416 (67.2%) | 203 (32.8%) |
| Community & Social Service | 3,797 (39.7%) | 5,767 (60.3%) |
| Education, Arts & Media | 558 (37.7%) | 924 (62.4%) |
| Legal Services & Support | 402 (36.0%) | 715 (64.0%) |
| Education Instruction & Library | 1,328 (30.2%) | 3,062 (69.8%) |
| Arts, Media & Entertainment | 1,509 (58.6%) | 1,066 (41.4%) |
| Health Diagnosing & Treating | 1,613 (33.4%) | 3,217 (66.6%) |
| Health Technologists | 1,076 (29.1%) | 2,617 (70.9%) |
| Total (Category) | 21,801 (54.8%) | 18,002 (45.2%) |
| Total (Overall) | 39,256 (54.5%) | 32,793 (45.5%) |
Services Occupations
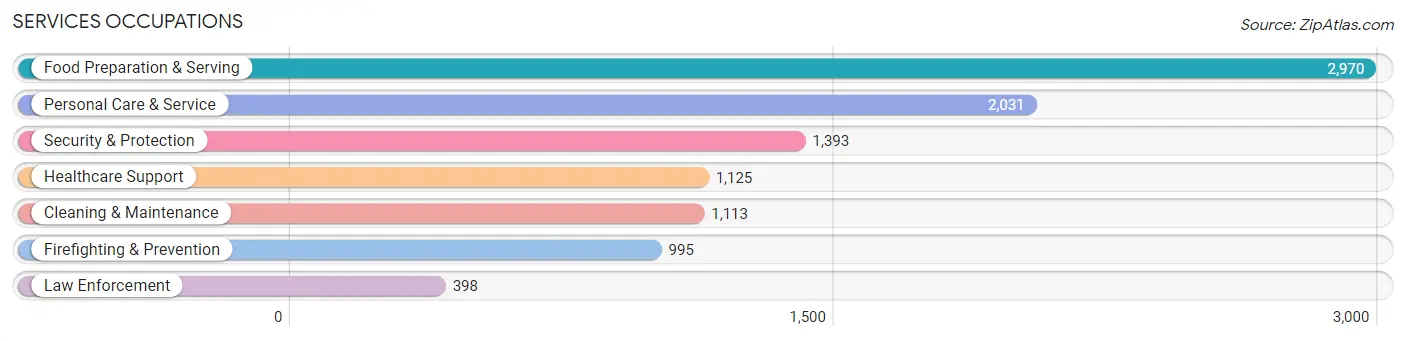
The most common Services occupations in Torrance are Food Preparation & Serving (2,970 | 4.1%), Personal Care & Service (2,031 | 2.8%), Security & Protection (1,393 | 1.9%), Healthcare Support (1,125 | 1.6%), and Cleaning & Maintenance (1,113 | 1.5%).
Services Occupations by Sex
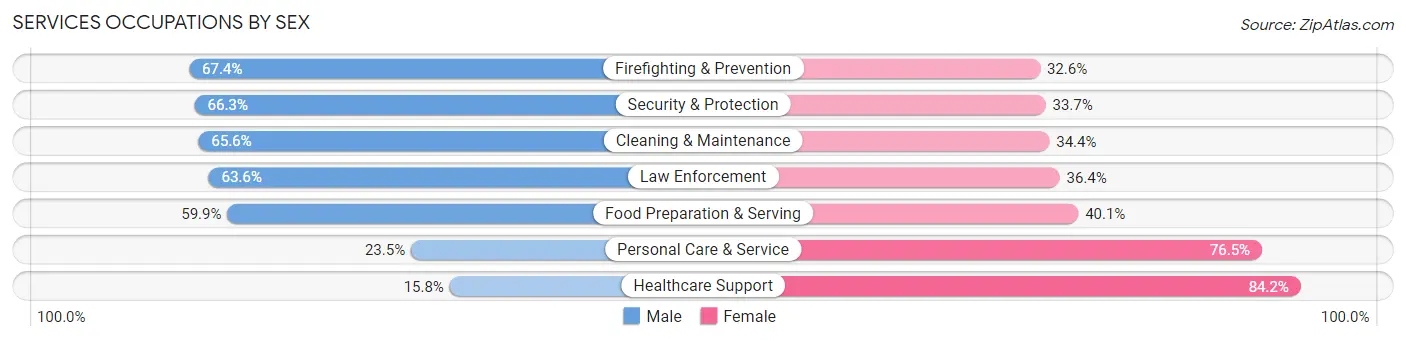
Within the Services occupations in Torrance, the most male-oriented occupations are Firefighting & Prevention (67.4%), Security & Protection (66.3%), and Cleaning & Maintenance (65.6%), while the most female-oriented occupations are Healthcare Support (84.2%), Personal Care & Service (76.5%), and Food Preparation & Serving (40.1%).
| Occupation | Male | Female |
| Healthcare Support | 178 (15.8%) | 947 (84.2%) |
| Security & Protection | 924 (66.3%) | 469 (33.7%) |
| Firefighting & Prevention | 671 (67.4%) | 324 (32.6%) |
| Law Enforcement | 253 (63.6%) | 145 (36.4%) |
| Food Preparation & Serving | 1,778 (59.9%) | 1,192 (40.1%) |
| Cleaning & Maintenance | 730 (65.6%) | 383 (34.4%) |
| Personal Care & Service | 477 (23.5%) | 1,554 (76.5%) |
| Total (Category) | 4,087 (47.3%) | 4,545 (52.6%) |
| Total (Overall) | 39,256 (54.5%) | 32,793 (45.5%) |
Sales and Office Occupations
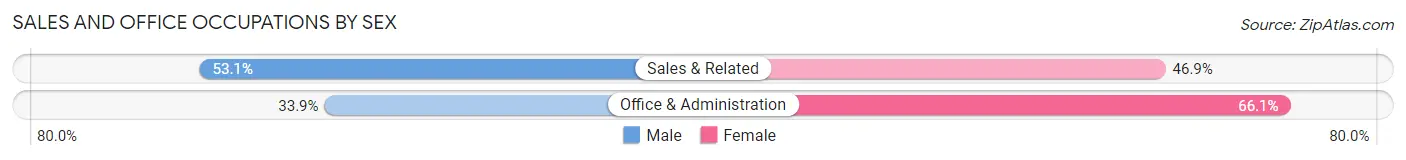
The most common Sales and Office occupations in Torrance are Office & Administration (8,498 | 11.8%), and Sales & Related (6,557 | 9.1%).

Sales and Office Occupations by Sex
| Occupation | Male | Female |
| Sales & Related | 3,480 (53.1%) | 3,077 (46.9%) |
| Office & Administration | 2,879 (33.9%) | 5,619 (66.1%) |
| Total (Category) | 6,359 (42.2%) | 8,696 (57.8%) |
| Total (Overall) | 39,256 (54.5%) | 32,793 (45.5%) |
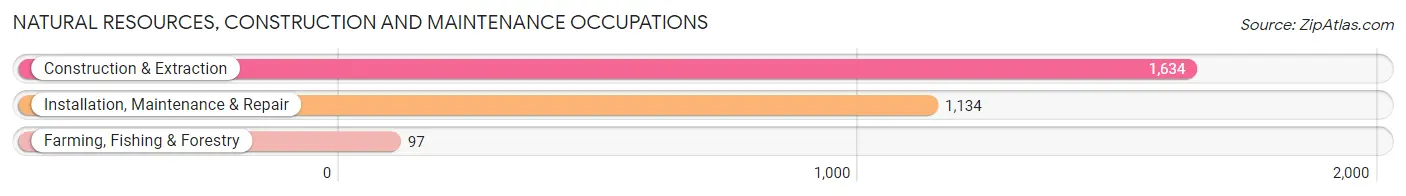
Natural Resources, Construction and Maintenance Occupations
The most common Natural Resources, Construction and Maintenance occupations in Torrance are Construction & Extraction (1,634 | 2.3%), Installation, Maintenance & Repair (1,134 | 1.6%), and Farming, Fishing & Forestry (97 | 0.1%).
Natural Resources, Construction and Maintenance Occupations by Sex
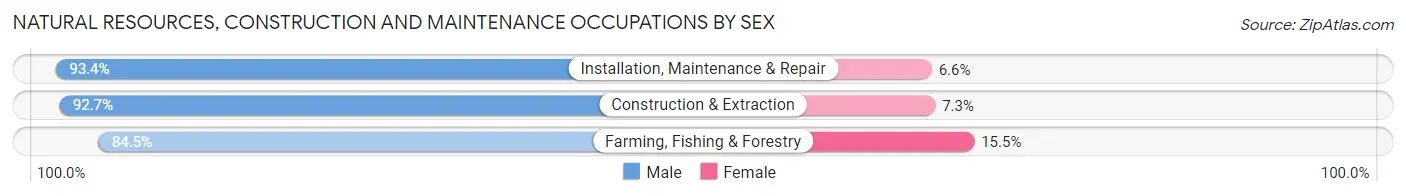
| Occupation | Male | Female |
| Farming, Fishing & Forestry | 82 (84.5%) | 15 (15.5%) |
| Construction & Extraction | 1,514 (92.7%) | 120 (7.3%) |
| Installation, Maintenance & Repair | 1,059 (93.4%) | 75 (6.6%) |
| Total (Category) | 2,655 (92.7%) | 210 (7.3%) |
| Total (Overall) | 39,256 (54.5%) | 32,793 (45.5%) |
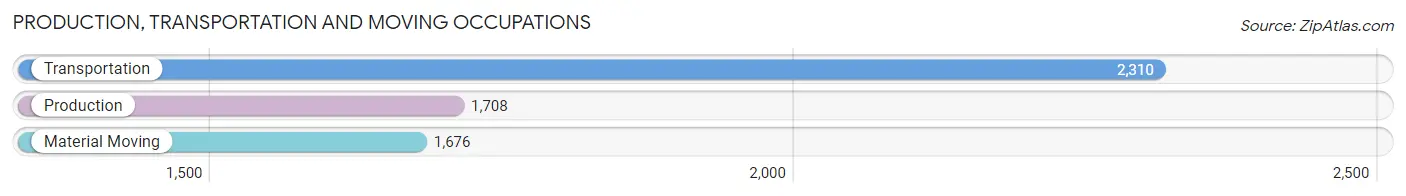
Production, Transportation and Moving Occupations
The most common Production, Transportation and Moving occupations in Torrance are Transportation (2,310 | 3.2%), Production (1,708 | 2.4%), and Material Moving (1,676 | 2.3%).
Production, Transportation and Moving Occupations by Sex
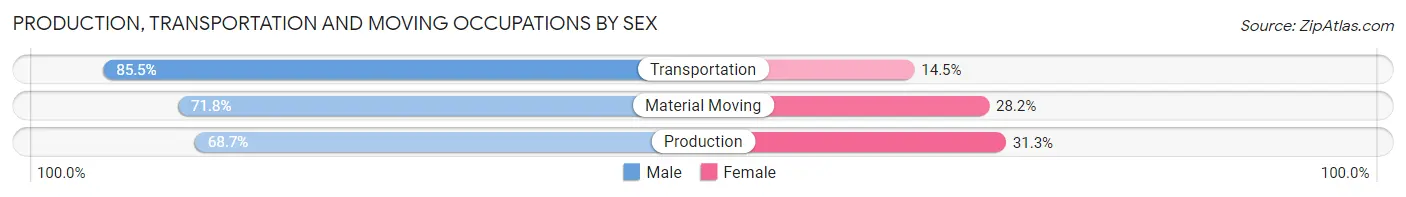
| Occupation | Male | Female |
| Production | 1,174 (68.7%) | 534 (31.3%) |
| Transportation | 1,976 (85.5%) | 334 (14.5%) |
| Material Moving | 1,204 (71.8%) | 472 (28.2%) |
| Total (Category) | 4,354 (76.5%) | 1,340 (23.5%) |
| Total (Overall) | 39,256 (54.5%) | 32,793 (45.5%) |
Employment Industries by Sex in Torrance
Employment Industries in Torrance
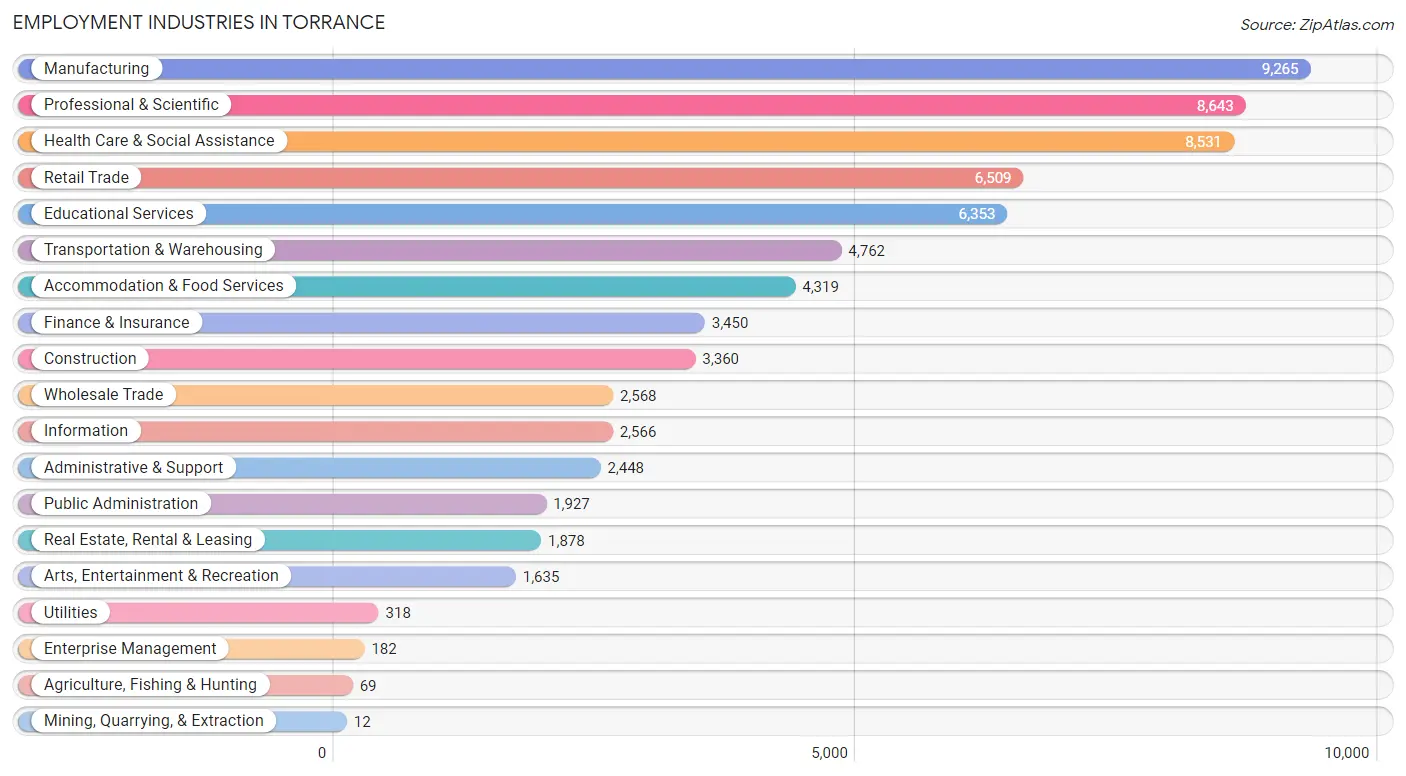
The major employment industries in Torrance include Manufacturing (9,265 | 12.9%), Professional & Scientific (8,643 | 12.0%), Health Care & Social Assistance (8,531 | 11.8%), Retail Trade (6,509 | 9.0%), and Educational Services (6,353 | 8.8%).
Employment Industries by Sex in Torrance
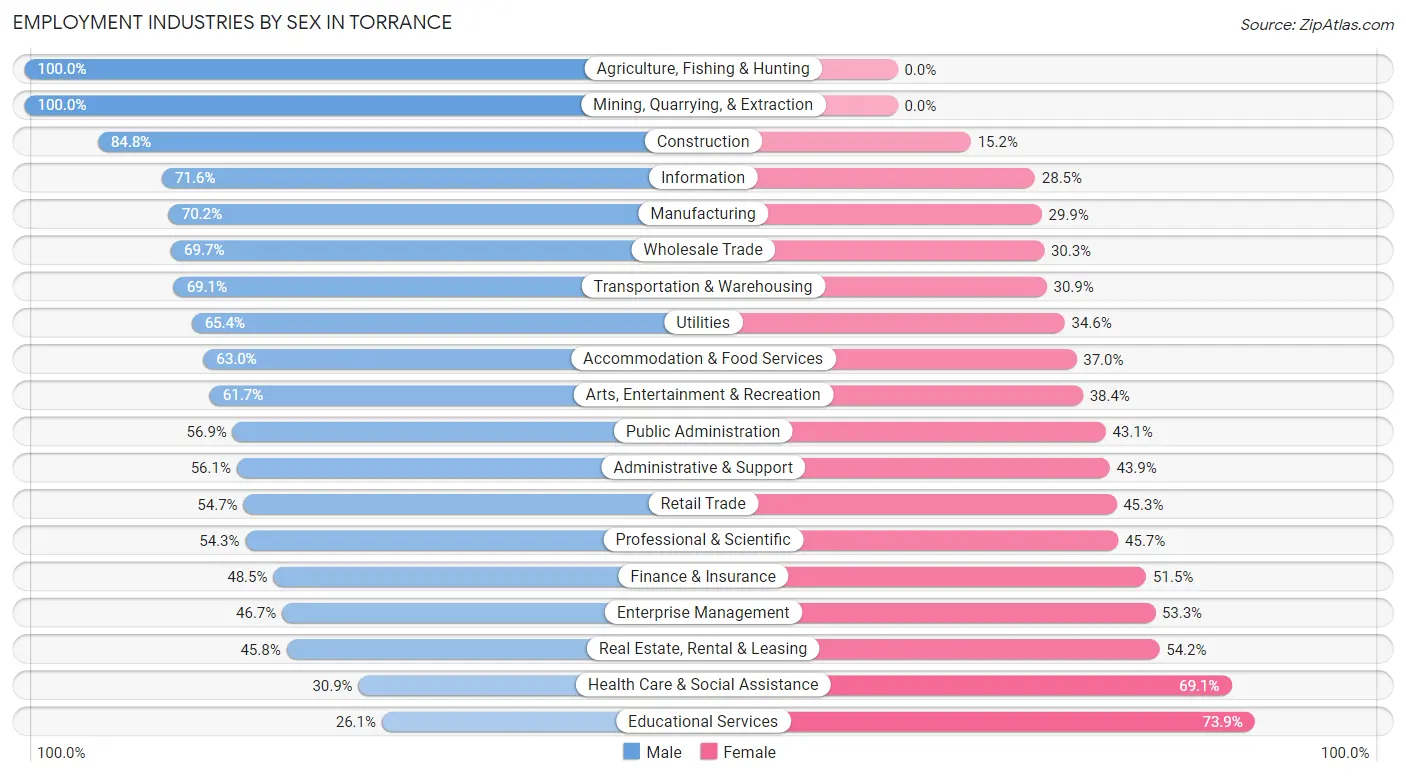
The Torrance industries that see more men than women are Agriculture, Fishing & Hunting (100.0%), Mining, Quarrying, & Extraction (100.0%), and Construction (84.8%), whereas the industries that tend to have a higher number of women are Educational Services (73.9%), Health Care & Social Assistance (69.1%), and Real Estate, Rental & Leasing (54.2%).
| Industry | Male | Female |
| Agriculture, Fishing & Hunting | 69 (100.0%) | 0 (0.0%) |
| Mining, Quarrying, & Extraction | 12 (100.0%) | 0 (0.0%) |
| Construction | 2,850 (84.8%) | 510 (15.2%) |
| Manufacturing | 6,499 (70.2%) | 2,766 (29.8%) |
| Wholesale Trade | 1,789 (69.7%) | 779 (30.3%) |
| Retail Trade | 3,561 (54.7%) | 2,948 (45.3%) |
| Transportation & Warehousing | 3,292 (69.1%) | 1,470 (30.9%) |
| Utilities | 208 (65.4%) | 110 (34.6%) |
| Information | 1,836 (71.6%) | 730 (28.4%) |
| Finance & Insurance | 1,674 (48.5%) | 1,776 (51.5%) |
| Real Estate, Rental & Leasing | 860 (45.8%) | 1,018 (54.2%) |
| Professional & Scientific | 4,695 (54.3%) | 3,948 (45.7%) |
| Enterprise Management | 85 (46.7%) | 97 (53.3%) |
| Administrative & Support | 1,373 (56.1%) | 1,075 (43.9%) |
| Educational Services | 1,656 (26.1%) | 4,697 (73.9%) |
| Health Care & Social Assistance | 2,636 (30.9%) | 5,895 (69.1%) |
| Arts, Entertainment & Recreation | 1,008 (61.7%) | 627 (38.4%) |
| Accommodation & Food Services | 2,720 (63.0%) | 1,599 (37.0%) |
| Public Administration | 1,097 (56.9%) | 830 (43.1%) |
| Total | 39,256 (54.5%) | 32,793 (45.5%) |
Education in Torrance
School Enrollment in Torrance
The most common levels of schooling among the 34,658 students in Torrance are college / undergraduate (7,273 | 21.0%), middle school (7,171 | 20.7%), and elementary school (7,075 | 20.4%).

| School Level | # Students | % Students |
| Nursery / Preschool | 2,446 | 7.1% |
| Kindergarten | 1,734 | 5.0% |
| Elementary School | 7,075 | 20.4% |
| Middle School | 7,171 | 20.7% |
| High School | 6,775 | 19.6% |
| College / Undergraduate | 7,273 | 21.0% |
| Graduate / Professional | 2,184 | 6.3% |
| Total | 34,658 | 100.0% |
School Enrollment by Age by Funding Source in Torrance
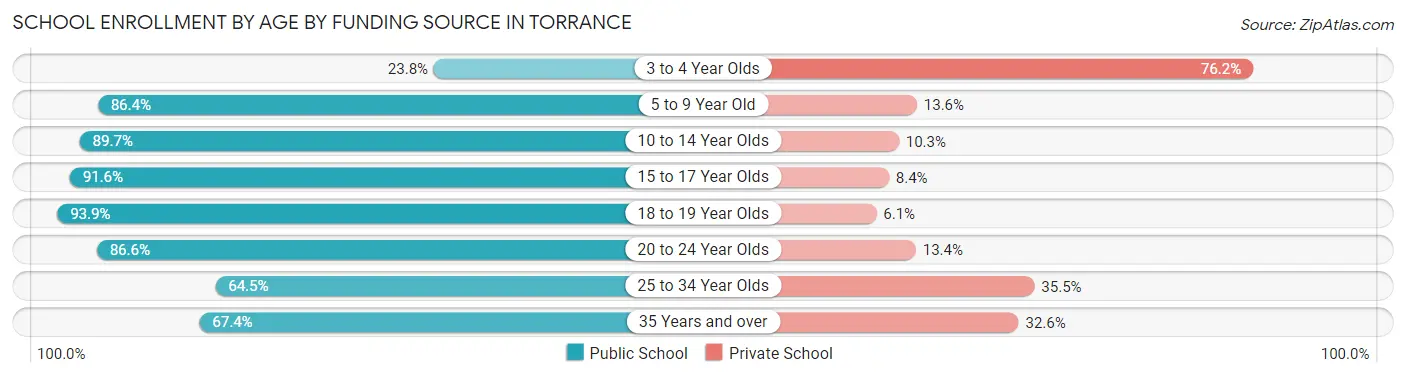
Out of a total of 34,658 students who are enrolled in schools in Torrance, 6,169 (17.8%) attend a private institution, while the remaining 28,489 (82.2%) are enrolled in public schools. The age group of 3 to 4 year olds has the highest likelihood of being enrolled in private schools, with 1,441 (76.2% in the age bracket) enrolled. Conversely, the age group of 18 to 19 year olds has the lowest likelihood of being enrolled in a private school, with 1,977 (93.9% in the age bracket) attending a public institution.
| Age Bracket | Public School | Private School |
| 3 to 4 Year Olds | 449 (23.8%) | 1,441 (76.2%) |
| 5 to 9 Year Old | 7,278 (86.4%) | 1,149 (13.6%) |
| 10 to 14 Year Olds | 8,292 (89.7%) | 948 (10.3%) |
| 15 to 17 Year Olds | 4,371 (91.6%) | 402 (8.4%) |
| 18 to 19 Year Olds | 1,977 (93.9%) | 128 (6.1%) |
| 20 to 24 Year Olds | 3,020 (86.6%) | 469 (13.4%) |
| 25 to 34 Year Olds | 1,724 (64.5%) | 950 (35.5%) |
| 35 Years and over | 1,389 (67.4%) | 671 (32.6%) |
| Total | 28,489 (82.2%) | 6,169 (17.8%) |
Educational Attainment by Field of Study in Torrance
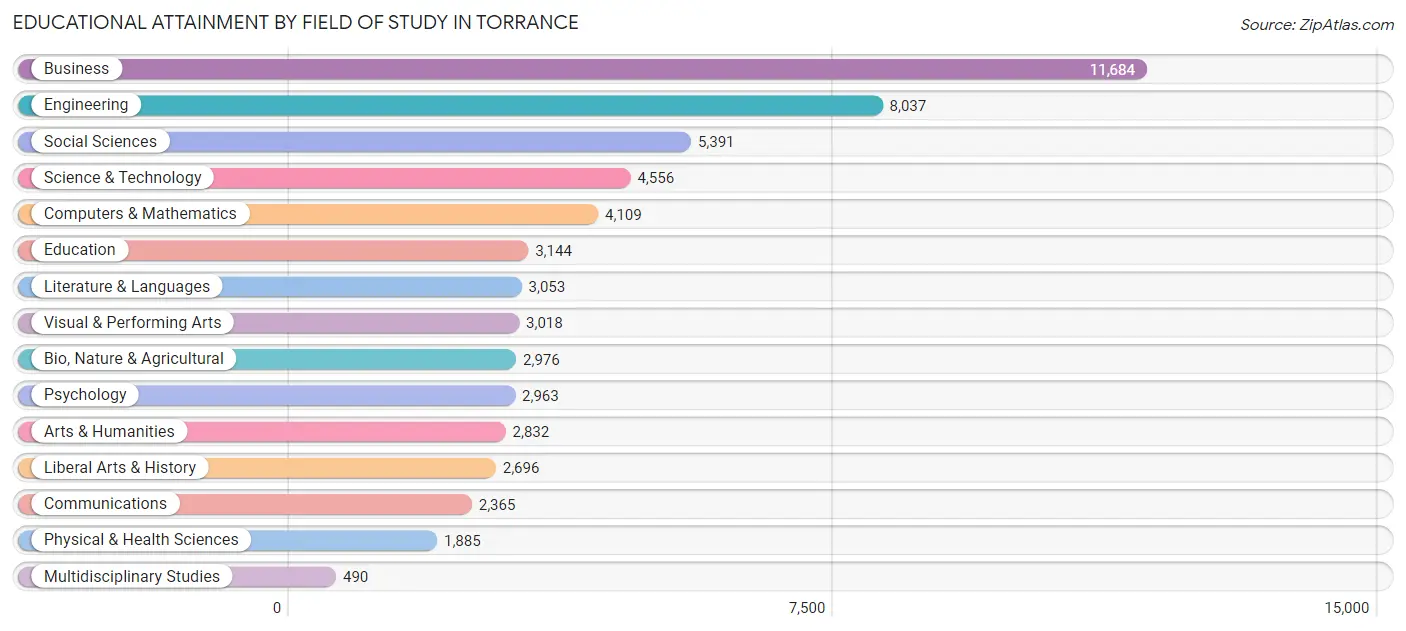
Business (11,684 | 19.7%), engineering (8,037 | 13.6%), social sciences (5,391 | 9.1%), science & technology (4,556 | 7.7%), and computers & mathematics (4,109 | 6.9%) are the most common fields of study among 59,199 individuals in Torrance who have obtained a bachelor's degree or higher.
| Field of Study | # Graduates | % Graduates |
| Computers & Mathematics | 4,109 | 6.9% |
| Bio, Nature & Agricultural | 2,976 | 5.0% |
| Physical & Health Sciences | 1,885 | 3.2% |
| Psychology | 2,963 | 5.0% |
| Social Sciences | 5,391 | 9.1% |
| Engineering | 8,037 | 13.6% |
| Multidisciplinary Studies | 490 | 0.8% |
| Science & Technology | 4,556 | 7.7% |
| Business | 11,684 | 19.7% |
| Education | 3,144 | 5.3% |
| Literature & Languages | 3,053 | 5.2% |
| Liberal Arts & History | 2,696 | 4.5% |
| Visual & Performing Arts | 3,018 | 5.1% |
| Communications | 2,365 | 4.0% |
| Arts & Humanities | 2,832 | 4.8% |
| Total | 59,199 | 100.0% |
Transportation & Commute in Torrance
Vehicle Availability by Sex in Torrance
The most prevalent vehicle ownership categories in Torrance are males with 2 vehicles (17,719, accounting for 45.9%) and females with 2 vehicles (14,268, making up 56.2%).
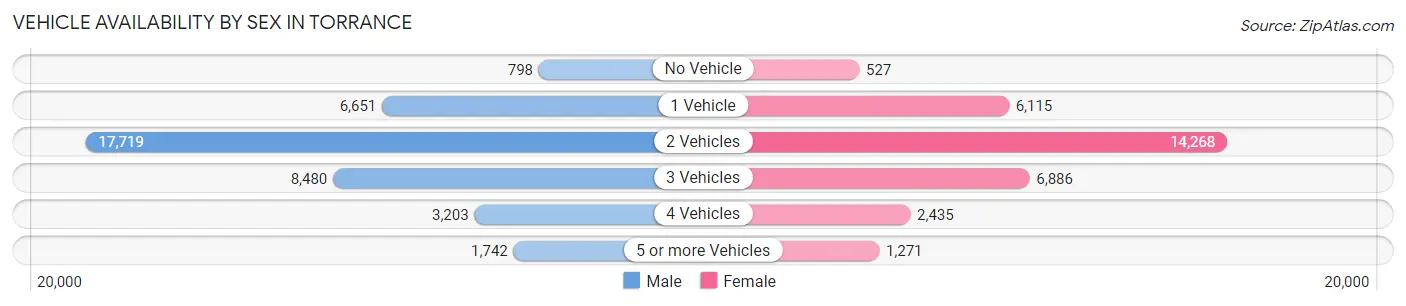
| Vehicles Available | Male | Female |
| No Vehicle | 798 (2.1%) | 527 (1.7%) |
| 1 Vehicle | 6,651 (17.2%) | 6,115 (19.4%) |
| 2 Vehicles | 17,719 (45.9%) | 14,268 (45.3%) |
| 3 Vehicles | 8,480 (22.0%) | 6,886 (21.9%) |
| 4 Vehicles | 3,203 (8.3%) | 2,435 (7.7%) |
| 5 or more Vehicles | 1,742 (4.5%) | 1,271 (4.0%) |
| Total | 38,593 (100.0%) | 31,502 (100.0%) |
Commute Time in Torrance
The most frequently occuring commute durations in Torrance are 15 to 19 minutes (9,347 commuters, 15.8%), 10 to 14 minutes (9,259 commuters, 15.7%), and 20 to 24 minutes (8,383 commuters, 14.2%).
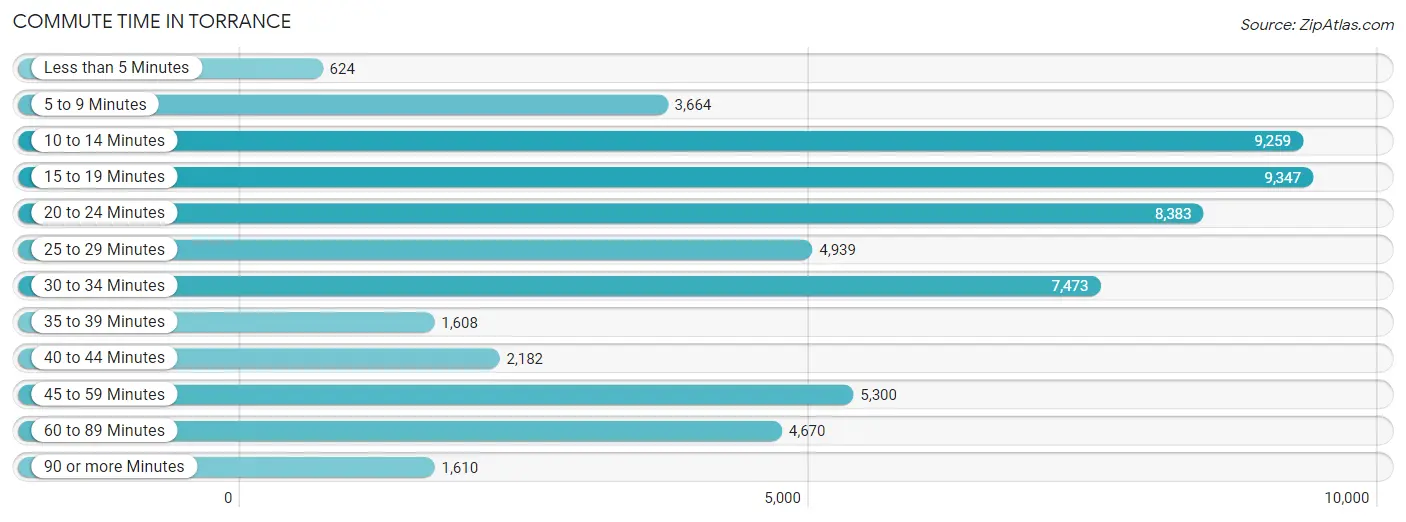
| Commute Time | # Commuters | % Commuters |
| Less than 5 Minutes | 624 | 1.1% |
| 5 to 9 Minutes | 3,664 | 6.2% |
| 10 to 14 Minutes | 9,259 | 15.7% |
| 15 to 19 Minutes | 9,347 | 15.8% |
| 20 to 24 Minutes | 8,383 | 14.2% |
| 25 to 29 Minutes | 4,939 | 8.4% |
| 30 to 34 Minutes | 7,473 | 12.7% |
| 35 to 39 Minutes | 1,608 | 2.7% |
| 40 to 44 Minutes | 2,182 | 3.7% |
| 45 to 59 Minutes | 5,300 | 9.0% |
| 60 to 89 Minutes | 4,670 | 7.9% |
| 90 or more Minutes | 1,610 | 2.7% |
Commute Time by Sex in Torrance
The most common commute times in Torrance are 15 to 19 minutes (4,982 commuters, 15.1%) for males and 10 to 14 minutes (4,398 commuters, 16.9%) for females.
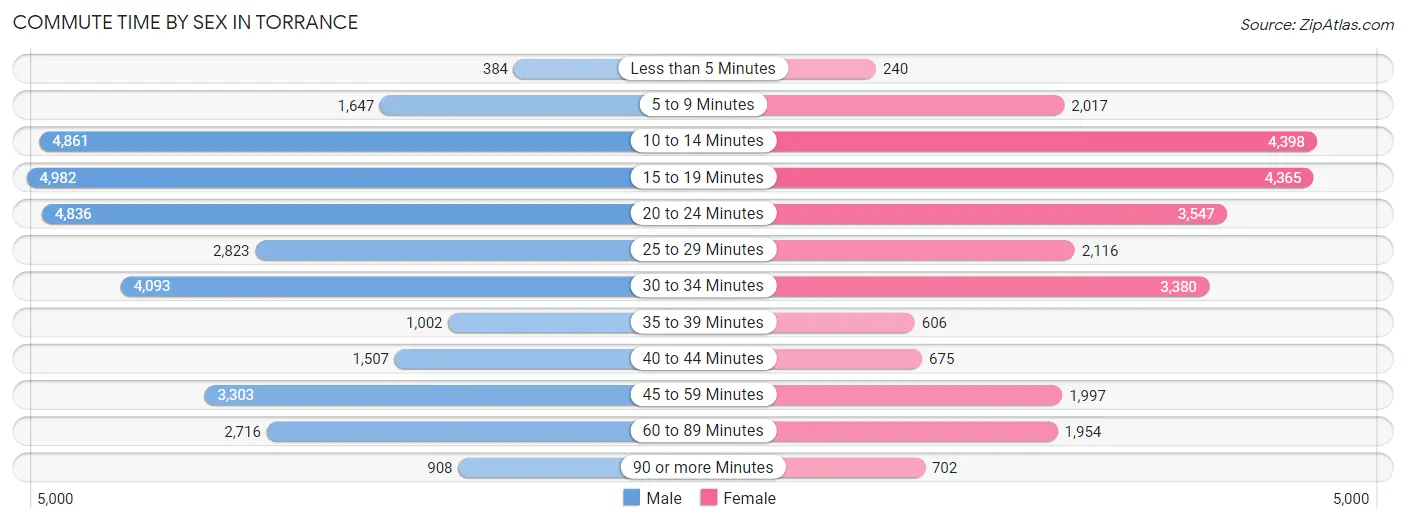
| Commute Time | Male | Female |
| Less than 5 Minutes | 384 (1.2%) | 240 (0.9%) |
| 5 to 9 Minutes | 1,647 (5.0%) | 2,017 (7.8%) |
| 10 to 14 Minutes | 4,861 (14.7%) | 4,398 (16.9%) |
| 15 to 19 Minutes | 4,982 (15.1%) | 4,365 (16.8%) |
| 20 to 24 Minutes | 4,836 (14.6%) | 3,547 (13.6%) |
| 25 to 29 Minutes | 2,823 (8.5%) | 2,116 (8.1%) |
| 30 to 34 Minutes | 4,093 (12.4%) | 3,380 (13.0%) |
| 35 to 39 Minutes | 1,002 (3.0%) | 606 (2.3%) |
| 40 to 44 Minutes | 1,507 (4.6%) | 675 (2.6%) |
| 45 to 59 Minutes | 3,303 (10.0%) | 1,997 (7.7%) |
| 60 to 89 Minutes | 2,716 (8.2%) | 1,954 (7.5%) |
| 90 or more Minutes | 908 (2.8%) | 702 (2.7%) |
Time of Departure to Work by Sex in Torrance
The most frequent times of departure to work in Torrance are 8:00 AM to 8:29 AM (4,552, 13.8%) for males and 7:30 AM to 7:59 AM (3,813, 14.7%) for females.
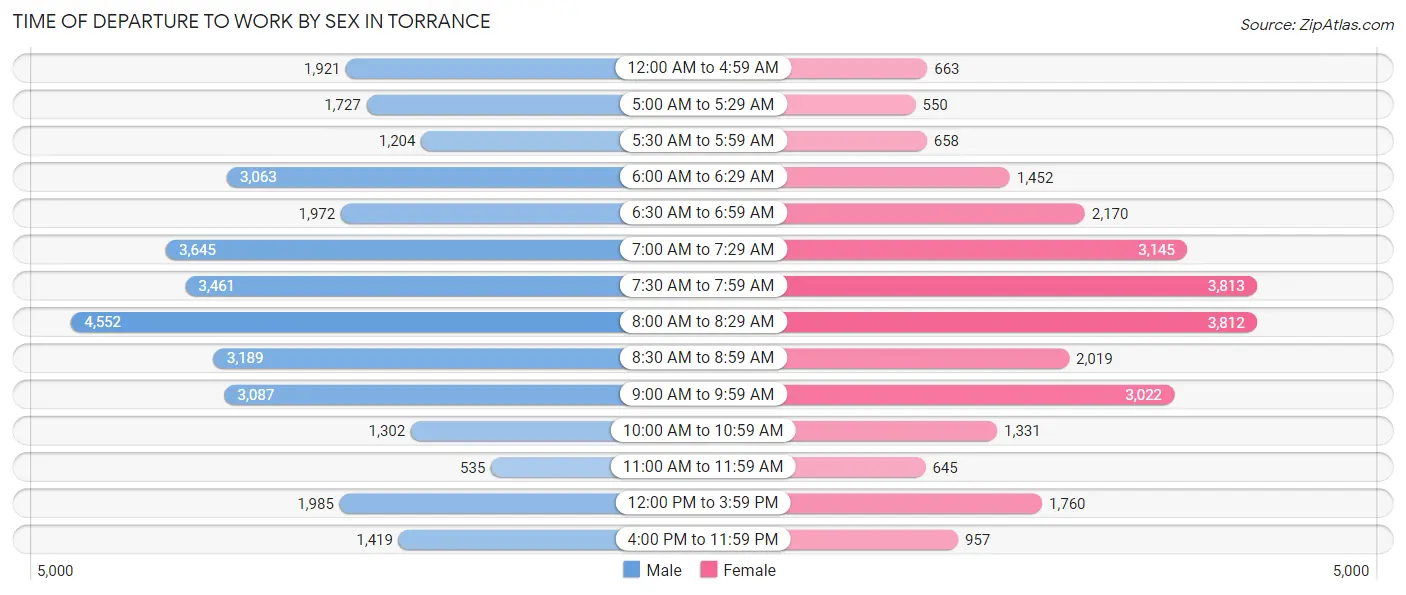
| Time of Departure | Male | Female |
| 12:00 AM to 4:59 AM | 1,921 (5.8%) | 663 (2.5%) |
| 5:00 AM to 5:29 AM | 1,727 (5.2%) | 550 (2.1%) |
| 5:30 AM to 5:59 AM | 1,204 (3.6%) | 658 (2.5%) |
| 6:00 AM to 6:29 AM | 3,063 (9.3%) | 1,452 (5.6%) |
| 6:30 AM to 6:59 AM | 1,972 (6.0%) | 2,170 (8.4%) |
| 7:00 AM to 7:29 AM | 3,645 (11.0%) | 3,145 (12.1%) |
| 7:30 AM to 7:59 AM | 3,461 (10.5%) | 3,813 (14.7%) |
| 8:00 AM to 8:29 AM | 4,552 (13.8%) | 3,812 (14.7%) |
| 8:30 AM to 8:59 AM | 3,189 (9.7%) | 2,019 (7.8%) |
| 9:00 AM to 9:59 AM | 3,087 (9.3%) | 3,022 (11.6%) |
| 10:00 AM to 10:59 AM | 1,302 (3.9%) | 1,331 (5.1%) |
| 11:00 AM to 11:59 AM | 535 (1.6%) | 645 (2.5%) |
| 12:00 PM to 3:59 PM | 1,985 (6.0%) | 1,760 (6.8%) |
| 4:00 PM to 11:59 PM | 1,419 (4.3%) | 957 (3.7%) |
| Total | 33,062 (100.0%) | 25,997 (100.0%) |
Housing Occupancy in Torrance
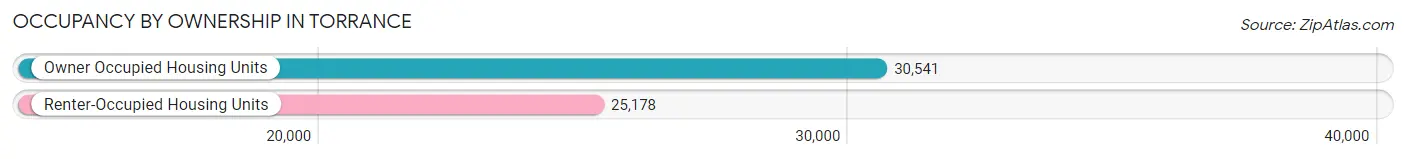
Occupancy by Ownership in Torrance
Of the total 55,719 dwellings in Torrance, owner-occupied units account for 30,541 (54.8%), while renter-occupied units make up 25,178 (45.2%).
| Occupancy | # Housing Units | % Housing Units |
| Owner Occupied Housing Units | 30,541 | 54.8% |
| Renter-Occupied Housing Units | 25,178 | 45.2% |
| Total Occupied Housing Units | 55,719 | 100.0% |
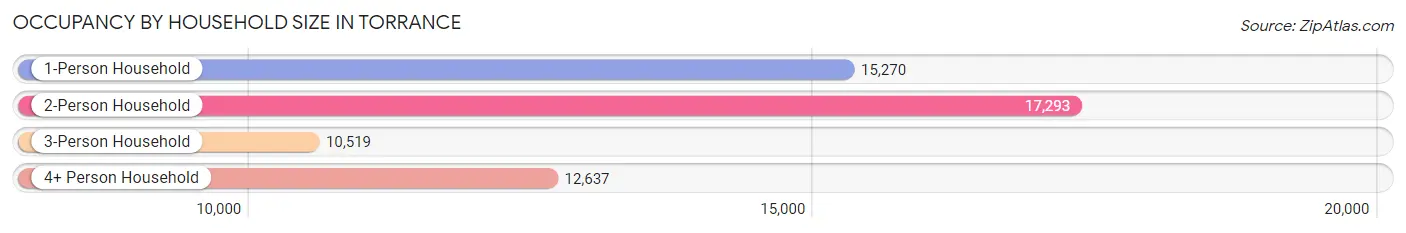
Occupancy by Household Size in Torrance
| Household Size | # Housing Units | % Housing Units |
| 1-Person Household | 15,270 | 27.4% |
| 2-Person Household | 17,293 | 31.0% |
| 3-Person Household | 10,519 | 18.9% |
| 4+ Person Household | 12,637 | 22.7% |
| Total Housing Units | 55,719 | 100.0% |
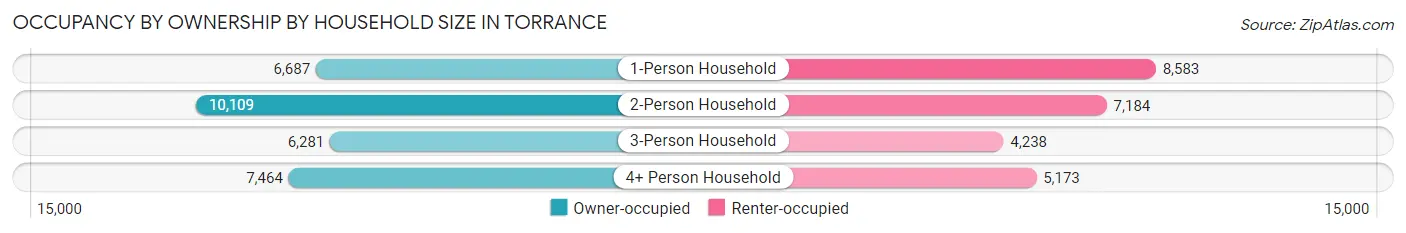
Occupancy by Ownership by Household Size in Torrance
| Household Size | Owner-occupied | Renter-occupied |
| 1-Person Household | 6,687 (43.8%) | 8,583 (56.2%) |
| 2-Person Household | 10,109 (58.5%) | 7,184 (41.5%) |
| 3-Person Household | 6,281 (59.7%) | 4,238 (40.3%) |
| 4+ Person Household | 7,464 (59.1%) | 5,173 (40.9%) |
| Total Housing Units | 30,541 (54.8%) | 25,178 (45.2%) |
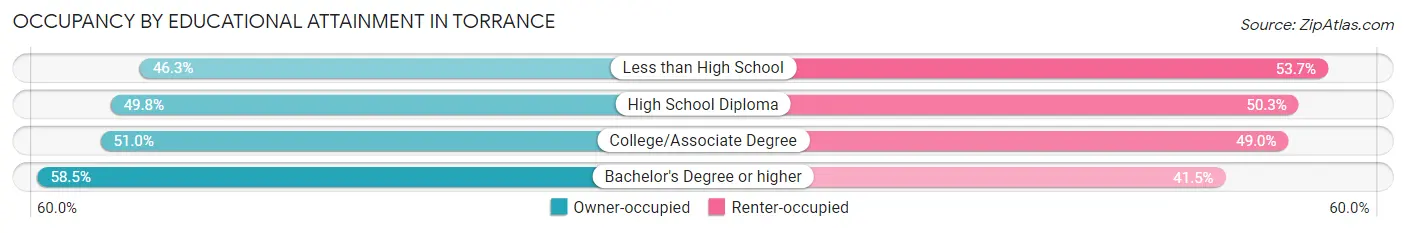
Occupancy by Educational Attainment in Torrance
| Household Size | Owner-occupied | Renter-occupied |
| Less than High School | 881 (46.3%) | 1,023 (53.7%) |
| High School Diploma | 3,855 (49.7%) | 3,893 (50.2%) |
| College/Associate Degree | 7,663 (51.0%) | 7,371 (49.0%) |
| Bachelor's Degree or higher | 18,142 (58.5%) | 12,891 (41.5%) |
Occupancy by Age of Householder in Torrance
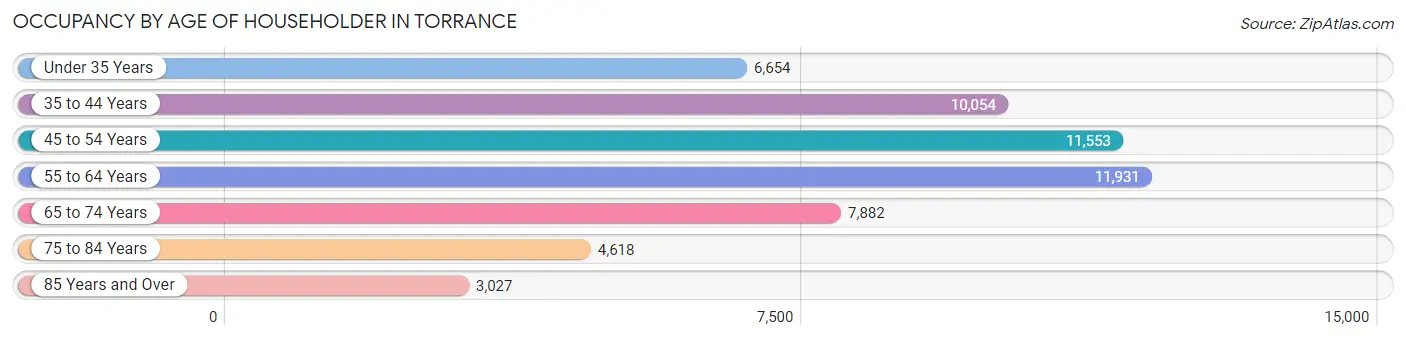
| Age Bracket | # Households | % Households |
| Under 35 Years | 6,654 | 11.9% |
| 35 to 44 Years | 10,054 | 18.0% |
| 45 to 54 Years | 11,553 | 20.7% |
| 55 to 64 Years | 11,931 | 21.4% |
| 65 to 74 Years | 7,882 | 14.1% |
| 75 to 84 Years | 4,618 | 8.3% |
| 85 Years and Over | 3,027 | 5.4% |
| Total | 55,719 | 100.0% |
Housing Finances in Torrance
Median Income by Occupancy in Torrance
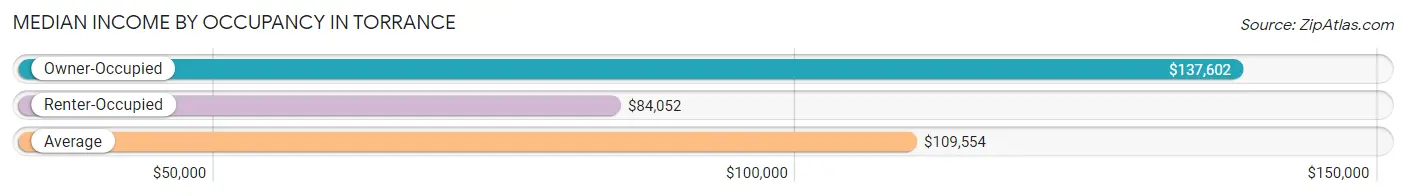
| Occupancy Type | # Households | Median Income |
| Owner-Occupied | 30,541 (54.8%) | $137,602 |
| Renter-Occupied | 25,178 (45.2%) | $84,052 |
| Average | 55,719 (100.0%) | $109,554 |
Occupancy by Householder Income Bracket in Torrance
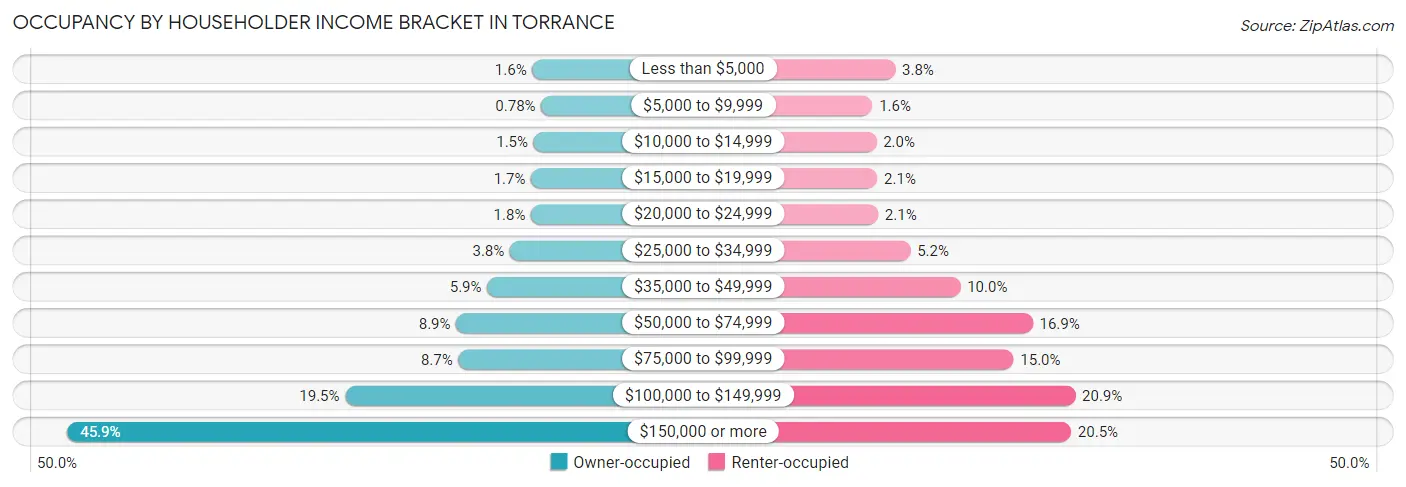
| Income Bracket | Owner-occupied | Renter-occupied |
| Less than $5,000 | 497 (1.6%) | 949 (3.8%) |
| $5,000 to $9,999 | 237 (0.8%) | 401 (1.6%) |
| $10,000 to $14,999 | 459 (1.5%) | 497 (2.0%) |
| $15,000 to $19,999 | 531 (1.7%) | 519 (2.1%) |
| $20,000 to $24,999 | 533 (1.8%) | 536 (2.1%) |
| $25,000 to $34,999 | 1,148 (3.8%) | 1,311 (5.2%) |
| $35,000 to $49,999 | 1,810 (5.9%) | 2,509 (10.0%) |
| $50,000 to $74,999 | 2,711 (8.9%) | 4,244 (16.9%) |
| $75,000 to $99,999 | 2,649 (8.7%) | 3,783 (15.0%) |
| $100,000 to $149,999 | 5,939 (19.5%) | 5,265 (20.9%) |
| $150,000 or more | 14,027 (45.9%) | 5,164 (20.5%) |
| Total | 30,541 (100.0%) | 25,178 (100.0%) |
Monthly Housing Cost Tiers in Torrance
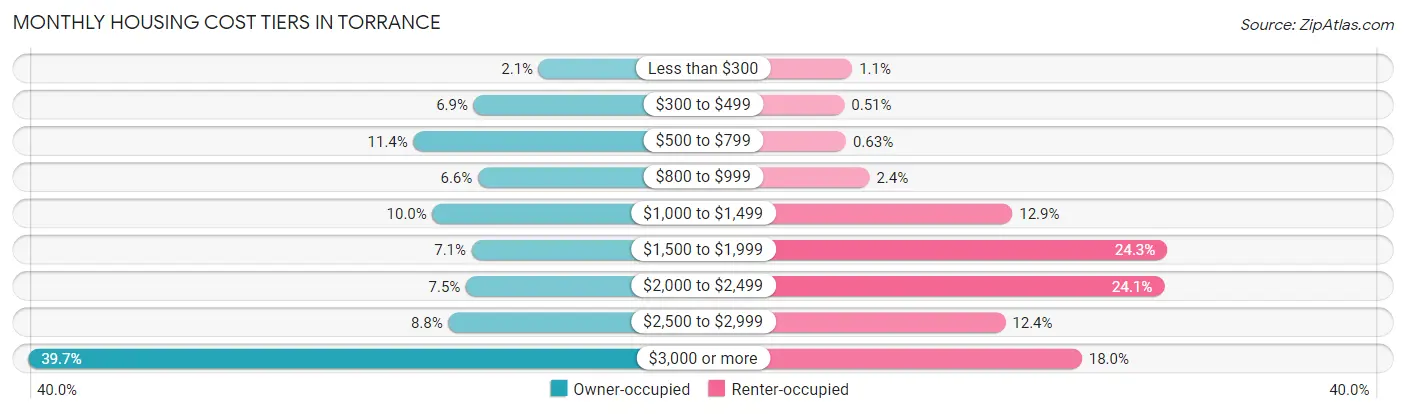
| Monthly Cost | Owner-occupied | Renter-occupied |
| Less than $300 | 648 (2.1%) | 275 (1.1%) |
| $300 to $499 | 2,114 (6.9%) | 128 (0.5%) |
| $500 to $799 | 3,467 (11.4%) | 159 (0.6%) |
| $800 to $999 | 2,016 (6.6%) | 595 (2.4%) |
| $1,000 to $1,499 | 3,039 (10.0%) | 3,242 (12.9%) |
| $1,500 to $1,999 | 2,155 (7.1%) | 6,113 (24.3%) |
| $2,000 to $2,499 | 2,284 (7.5%) | 6,058 (24.1%) |
| $2,500 to $2,999 | 2,683 (8.8%) | 3,115 (12.4%) |
| $3,000 or more | 12,135 (39.7%) | 4,532 (18.0%) |
| Total | 30,541 (100.0%) | 25,178 (100.0%) |
Physical Housing Characteristics in Torrance
Housing Structures in Torrance
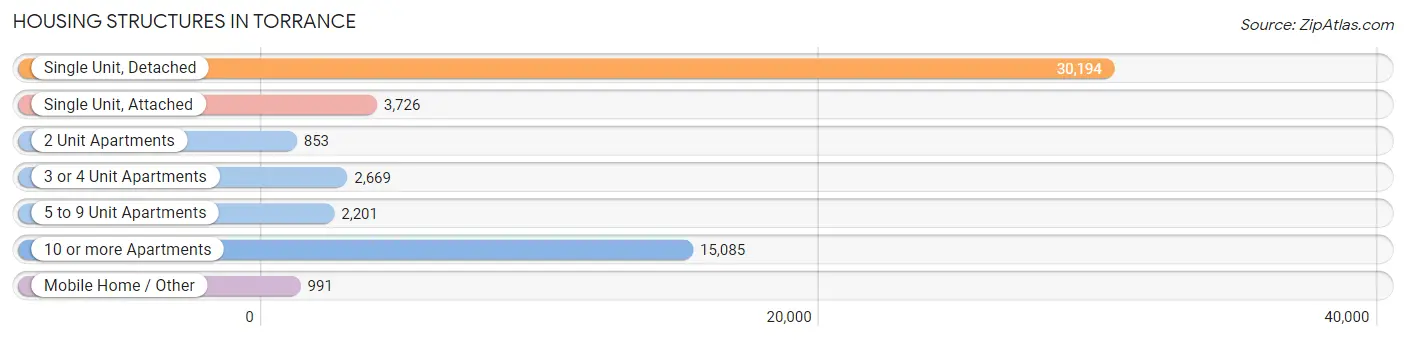
| Structure Type | # Housing Units | % Housing Units |
| Single Unit, Detached | 30,194 | 54.2% |
| Single Unit, Attached | 3,726 | 6.7% |
| 2 Unit Apartments | 853 | 1.5% |
| 3 or 4 Unit Apartments | 2,669 | 4.8% |
| 5 to 9 Unit Apartments | 2,201 | 4.0% |
| 10 or more Apartments | 15,085 | 27.1% |
| Mobile Home / Other | 991 | 1.8% |
| Total | 55,719 | 100.0% |
Housing Structures by Occupancy in Torrance
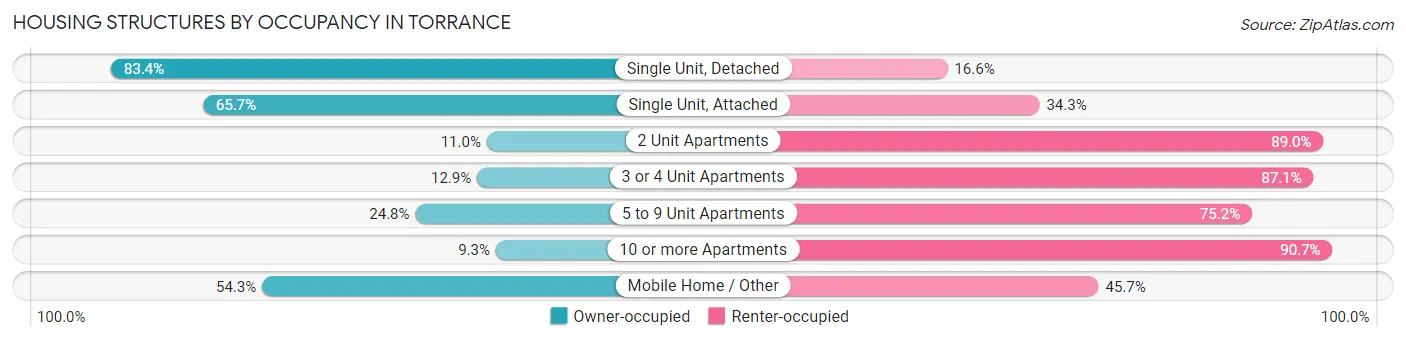
| Structure Type | Owner-occupied | Renter-occupied |
| Single Unit, Detached | 25,175 (83.4%) | 5,019 (16.6%) |
| Single Unit, Attached | 2,447 (65.7%) | 1,279 (34.3%) |
| 2 Unit Apartments | 94 (11.0%) | 759 (89.0%) |
| 3 or 4 Unit Apartments | 344 (12.9%) | 2,325 (87.1%) |
| 5 to 9 Unit Apartments | 545 (24.8%) | 1,656 (75.2%) |
| 10 or more Apartments | 1,398 (9.3%) | 13,687 (90.7%) |
| Mobile Home / Other | 538 (54.3%) | 453 (45.7%) |
| Total | 30,541 (54.8%) | 25,178 (45.2%) |
Housing Structures by Number of Rooms in Torrance
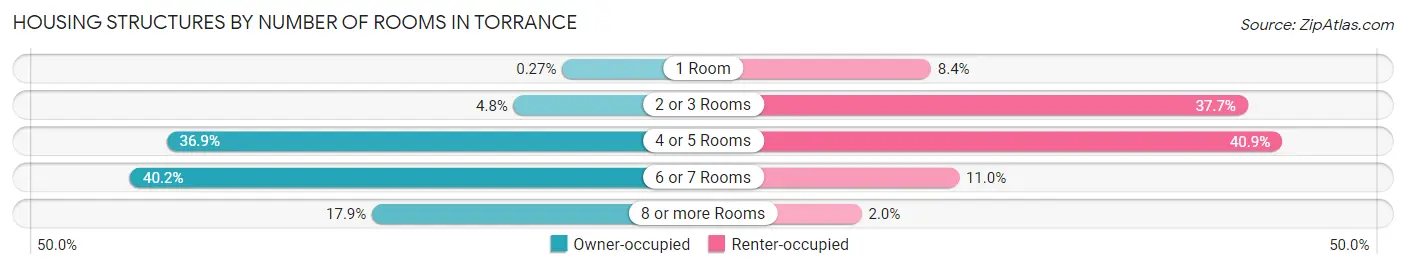
| Number of Rooms | Owner-occupied | Renter-occupied |
| 1 Room | 81 (0.3%) | 2,117 (8.4%) |
| 2 or 3 Rooms | 1,456 (4.8%) | 9,494 (37.7%) |
| 4 or 5 Rooms | 11,259 (36.9%) | 10,292 (40.9%) |
| 6 or 7 Rooms | 12,289 (40.2%) | 2,771 (11.0%) |
| 8 or more Rooms | 5,456 (17.9%) | 504 (2.0%) |
| Total | 30,541 (100.0%) | 25,178 (100.0%) |
Housing Structure by Heating Type in Torrance
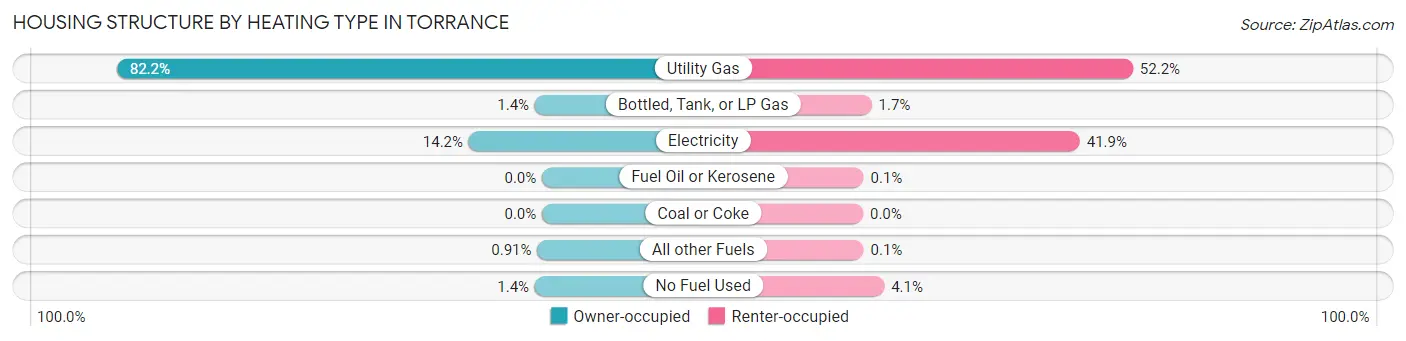
| Heating Type | Owner-occupied | Renter-occupied |
| Utility Gas | 25,098 (82.2%) | 13,130 (52.1%) |
| Bottled, Tank, or LP Gas | 420 (1.4%) | 419 (1.7%) |
| Electricity | 4,321 (14.1%) | 10,548 (41.9%) |
| Fuel Oil or Kerosene | 0 (0.0%) | 25 (0.1%) |
| Coal or Coke | 0 (0.0%) | 0 (0.0%) |
| All other Fuels | 279 (0.9%) | 25 (0.1%) |
| No Fuel Used | 423 (1.4%) | 1,031 (4.1%) |
| Total | 30,541 (100.0%) | 25,178 (100.0%) |
Household Vehicle Usage in Torrance
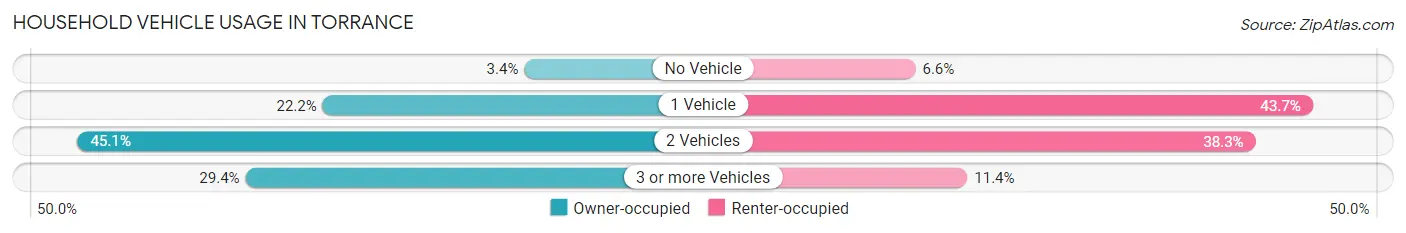
| Vehicles per Household | Owner-occupied | Renter-occupied |
| No Vehicle | 1,025 (3.4%) | 1,660 (6.6%) |
| 1 Vehicle | 6,778 (22.2%) | 10,993 (43.7%) |
| 2 Vehicles | 13,762 (45.1%) | 9,648 (38.3%) |
| 3 or more Vehicles | 8,976 (29.4%) | 2,877 (11.4%) |
| Total | 30,541 (100.0%) | 25,178 (100.0%) |
Real Estate & Mortgages in Torrance
Real Estate and Mortgage Overview in Torrance
| Characteristic | Without Mortgage | With Mortgage |
| Housing Units | 10,942 | 19,599 |
| Median Property Value | $922,800 | $983,000 |
| Median Household Income | $94,899 | $10,644 |
| Monthly Housing Costs | $752 | $12,051 |
| Real Estate Taxes | $4,328 | $206 |
Property Value by Mortgage Status in Torrance
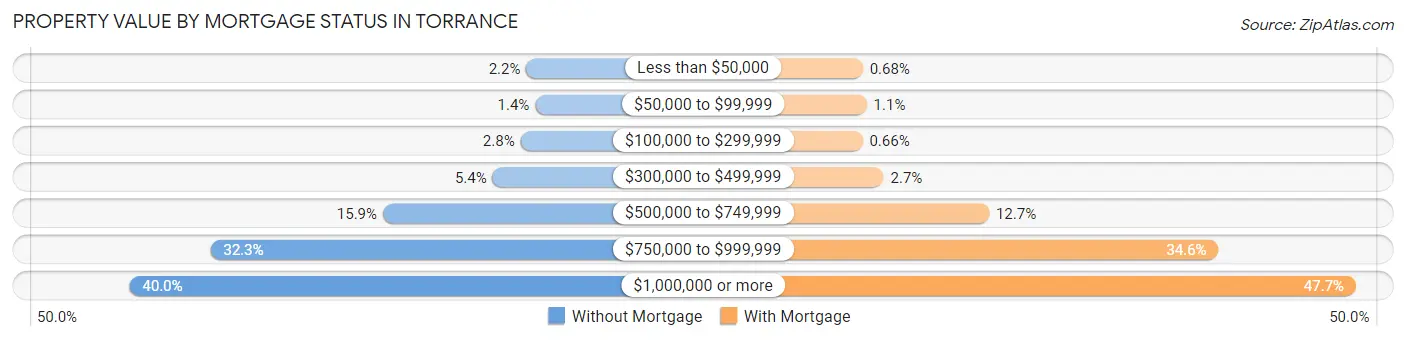
| Property Value | Without Mortgage | With Mortgage |
| Less than $50,000 | 243 (2.2%) | 134 (0.7%) |
| $50,000 to $99,999 | 150 (1.4%) | 208 (1.1%) |
| $100,000 to $299,999 | 303 (2.8%) | 130 (0.7%) |
| $300,000 to $499,999 | 594 (5.4%) | 523 (2.7%) |
| $500,000 to $749,999 | 1,738 (15.9%) | 2,492 (12.7%) |
| $750,000 to $999,999 | 3,535 (32.3%) | 6,774 (34.6%) |
| $1,000,000 or more | 4,379 (40.0%) | 9,338 (47.6%) |
| Total | 10,942 (100.0%) | 19,599 (100.0%) |
Household Income by Mortgage Status in Torrance
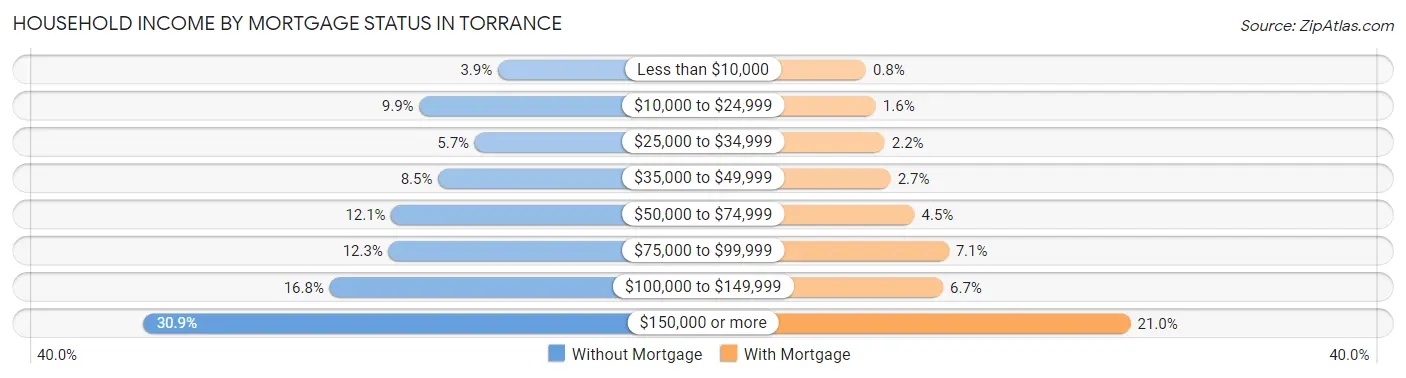
| Household Income | Without Mortgage | With Mortgage |
| Less than $10,000 | 430 (3.9%) | 157 (0.8%) |
| $10,000 to $24,999 | 1,085 (9.9%) | 304 (1.5%) |
| $25,000 to $34,999 | 623 (5.7%) | 438 (2.2%) |
| $35,000 to $49,999 | 928 (8.5%) | 525 (2.7%) |
| $50,000 to $74,999 | 1,319 (12.0%) | 882 (4.5%) |
| $75,000 to $99,999 | 1,341 (12.3%) | 1,392 (7.1%) |
| $100,000 to $149,999 | 1,833 (16.8%) | 1,308 (6.7%) |
| $150,000 or more | 3,383 (30.9%) | 4,106 (20.9%) |
| Total | 10,942 (100.0%) | 19,599 (100.0%) |
Property Value to Household Income Ratio in Torrance
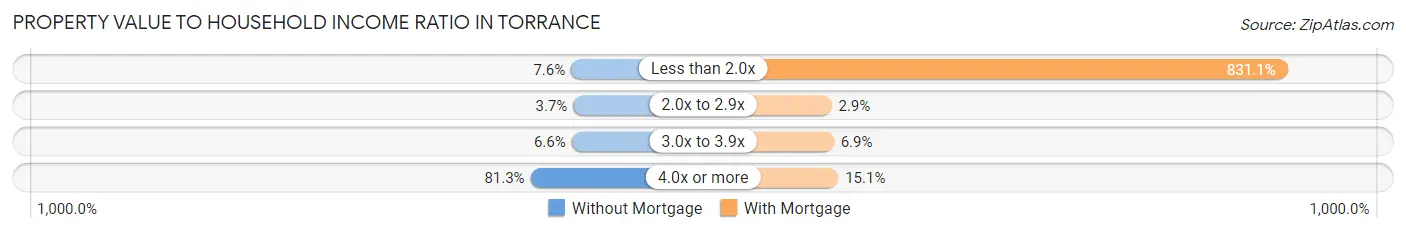
| Value-to-Income Ratio | Without Mortgage | With Mortgage |
| Less than 2.0x | 828 (7.6%) | 162,883 (831.1%) |
| 2.0x to 2.9x | 407 (3.7%) | 575 (2.9%) |
| 3.0x to 3.9x | 724 (6.6%) | 1,342 (6.9%) |
| 4.0x or more | 8,900 (81.3%) | 2,966 (15.1%) |
| Total | 10,942 (100.0%) | 19,599 (100.0%) |
Real Estate Taxes by Mortgage Status in Torrance
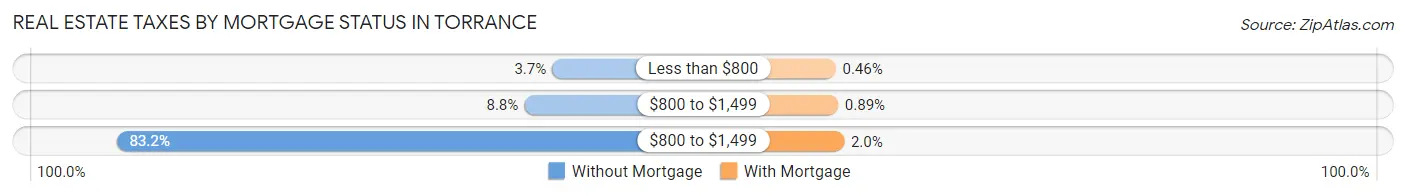
| Property Taxes | Without Mortgage | With Mortgage |
| Less than $800 | 401 (3.7%) | 91 (0.5%) |
| $800 to $1,499 | 959 (8.8%) | 175 (0.9%) |
| $800 to $1,499 | 9,105 (83.2%) | 391 (2.0%) |
| Total | 10,942 (100.0%) | 19,599 (100.0%) |
Health & Disability in Torrance
Health Insurance Coverage by Age in Torrance
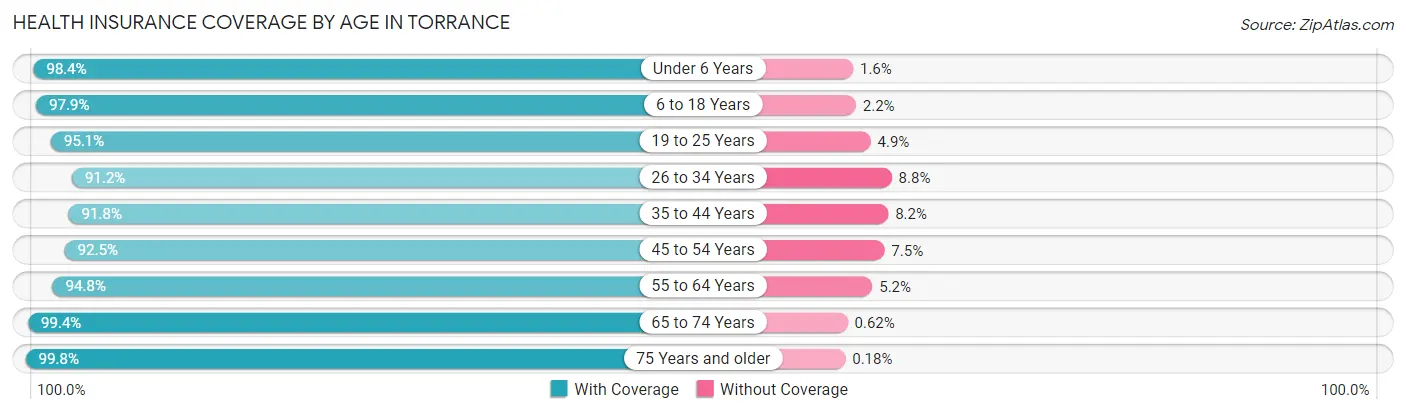
| Age Bracket | With Coverage | Without Coverage |
| Under 6 Years | 8,958 (98.4%) | 148 (1.6%) |
| 6 to 18 Years | 22,137 (97.9%) | 486 (2.1%) |
| 19 to 25 Years | 8,852 (95.1%) | 456 (4.9%) |
| 26 to 34 Years | 14,310 (91.2%) | 1,386 (8.8%) |
| 35 to 44 Years | 18,110 (91.8%) | 1,615 (8.2%) |
| 45 to 54 Years | 19,771 (92.5%) | 1,599 (7.5%) |
| 55 to 64 Years | 20,567 (94.8%) | 1,132 (5.2%) |
| 65 to 74 Years | 13,409 (99.4%) | 84 (0.6%) |
| 75 Years and older | 11,365 (99.8%) | 21 (0.2%) |
| Total | 137,479 (95.2%) | 6,927 (4.8%) |
Health Insurance Coverage by Citizenship Status in Torrance
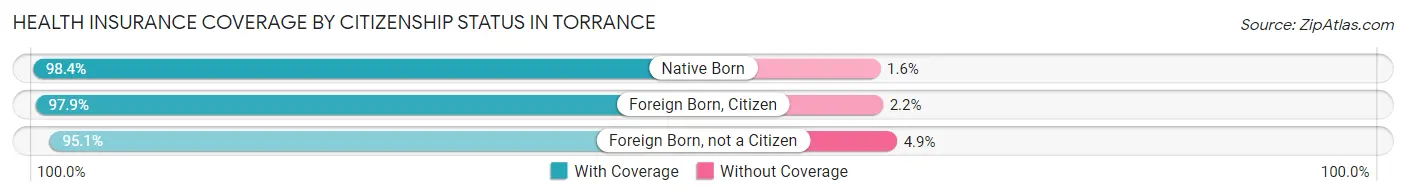
| Citizenship Status | With Coverage | Without Coverage |
| Native Born | 8,958 (98.4%) | 148 (1.6%) |
| Foreign Born, Citizen | 22,137 (97.9%) | 486 (2.1%) |
| Foreign Born, not a Citizen | 8,852 (95.1%) | 456 (4.9%) |
Health Insurance Coverage by Household Income in Torrance
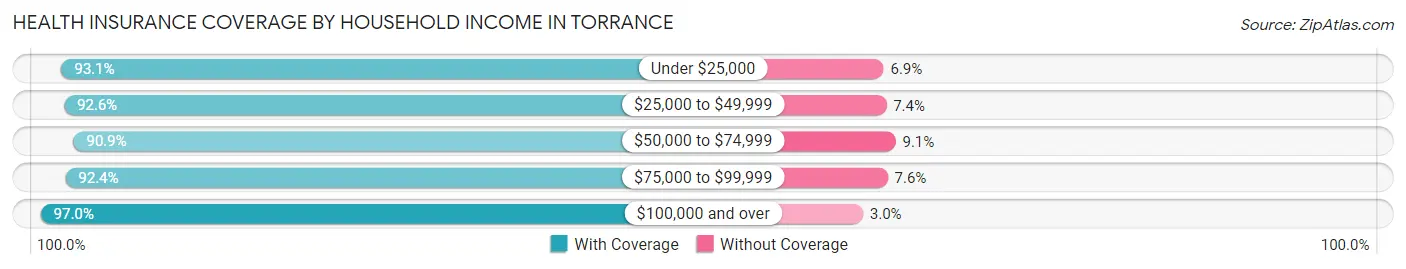
| Household Income | With Coverage | Without Coverage |
| Under $25,000 | 7,525 (93.1%) | 556 (6.9%) |
| $25,000 to $49,999 | 12,290 (92.6%) | 979 (7.4%) |
| $50,000 to $74,999 | 14,607 (90.9%) | 1,468 (9.1%) |
| $75,000 to $99,999 | 13,431 (92.4%) | 1,111 (7.6%) |
| $100,000 and over | 88,728 (97.0%) | 2,758 (3.0%) |
Public vs Private Health Insurance Coverage by Age in Torrance
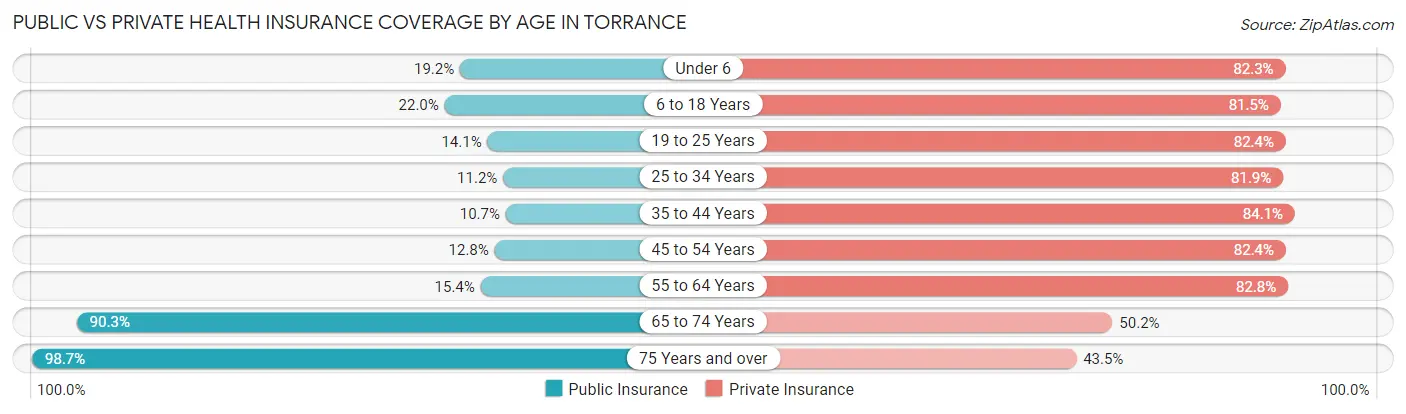
| Age Bracket | Public Insurance | Private Insurance |
| Under 6 | 1,746 (19.2%) | 7,498 (82.3%) |
| 6 to 18 Years | 4,987 (22.0%) | 18,428 (81.5%) |
| 19 to 25 Years | 1,311 (14.1%) | 7,671 (82.4%) |
| 25 to 34 Years | 1,754 (11.2%) | 12,857 (81.9%) |
| 35 to 44 Years | 2,106 (10.7%) | 16,588 (84.1%) |
| 45 to 54 Years | 2,727 (12.8%) | 17,614 (82.4%) |
| 55 to 64 Years | 3,334 (15.4%) | 17,973 (82.8%) |
| 65 to 74 Years | 12,189 (90.3%) | 6,778 (50.2%) |
| 75 Years and over | 11,232 (98.7%) | 4,954 (43.5%) |
| Total | 41,386 (28.7%) | 110,361 (76.4%) |
Disability Status by Sex by Age in Torrance
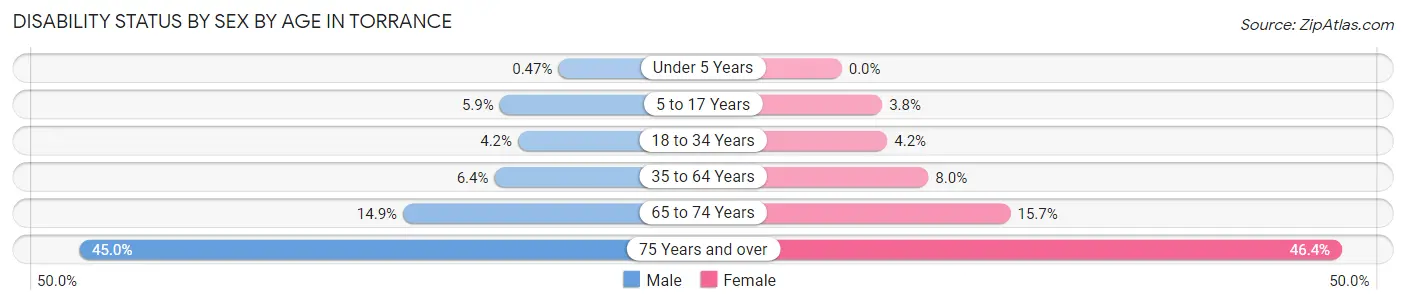
| Age Bracket | Male | Female |
| Under 5 Years | 18 (0.5%) | 0 (0.0%) |
| 5 to 17 Years | 716 (5.9%) | 399 (3.7%) |
| 18 to 34 Years | 570 (4.2%) | 551 (4.2%) |
| 35 to 64 Years | 1,998 (6.4%) | 2,543 (8.0%) |
| 65 to 74 Years | 905 (14.9%) | 1,161 (15.7%) |
| 75 Years and over | 1,909 (45.0%) | 3,313 (46.4%) |
Disability Class by Sex by Age in Torrance
Disability Class: Hearing Difficulty
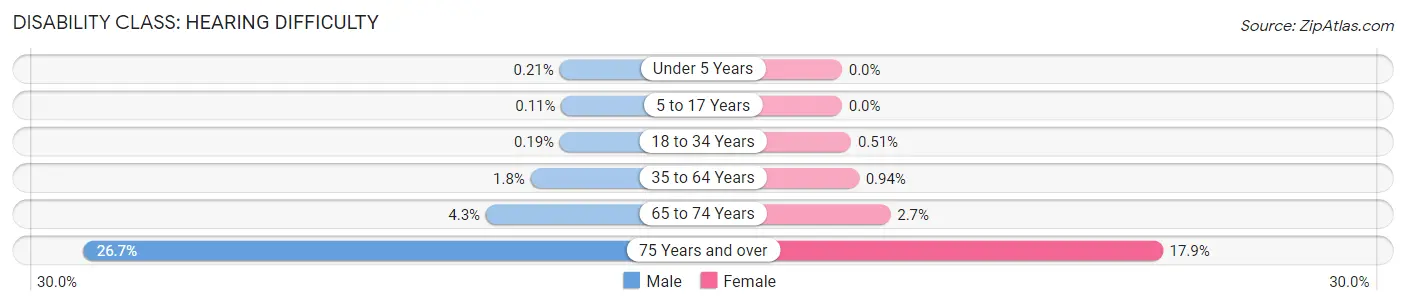
| Age Bracket | Male | Female |
| Under 5 Years | 8 (0.2%) | 0 (0.0%) |
| 5 to 17 Years | 13 (0.1%) | 0 (0.0%) |
| 18 to 34 Years | 25 (0.2%) | 66 (0.5%) |
| 35 to 64 Years | 567 (1.8%) | 298 (0.9%) |
| 65 to 74 Years | 262 (4.3%) | 200 (2.7%) |
| 75 Years and over | 1,134 (26.7%) | 1,275 (17.9%) |
Disability Class: Vision Difficulty
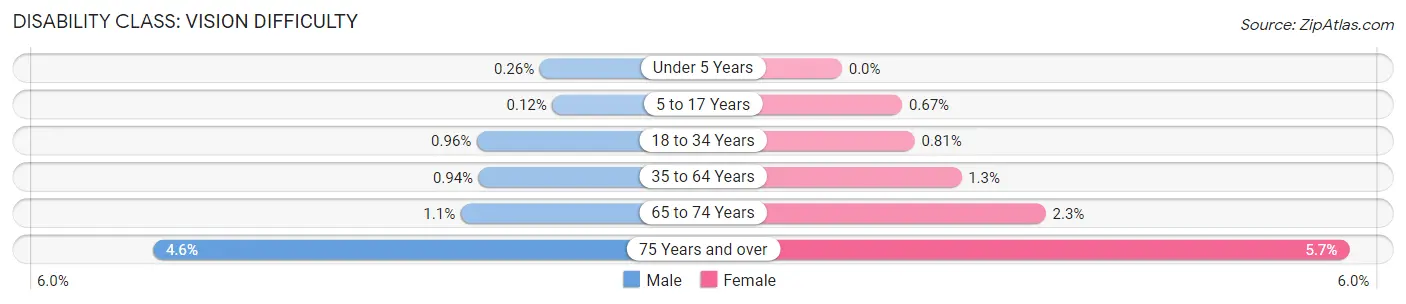
| Age Bracket | Male | Female |
| Under 5 Years | 10 (0.3%) | 0 (0.0%) |
| 5 to 17 Years | 14 (0.1%) | 71 (0.7%) |
| 18 to 34 Years | 130 (1.0%) | 105 (0.8%) |
| 35 to 64 Years | 292 (0.9%) | 421 (1.3%) |
| 65 to 74 Years | 69 (1.1%) | 168 (2.3%) |
| 75 Years and over | 194 (4.6%) | 403 (5.7%) |
Disability Class: Cognitive Difficulty
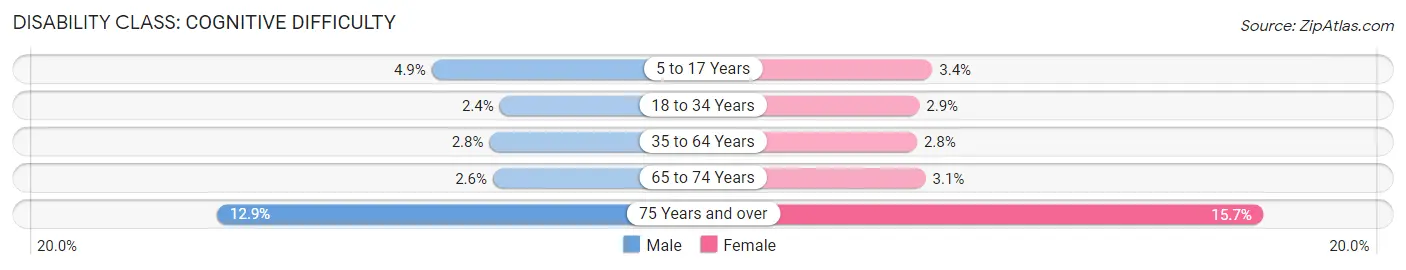
| Age Bracket | Male | Female |
| 5 to 17 Years | 591 (4.9%) | 357 (3.4%) |
| 18 to 34 Years | 320 (2.4%) | 375 (2.9%) |
| 35 to 64 Years | 856 (2.8%) | 882 (2.8%) |
| 65 to 74 Years | 159 (2.6%) | 231 (3.1%) |
| 75 Years and over | 546 (12.9%) | 1,118 (15.7%) |
Disability Class: Ambulatory Difficulty
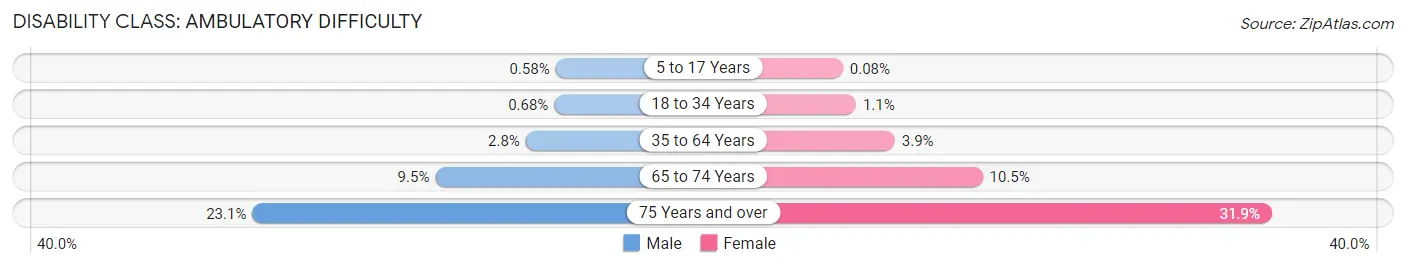
| Age Bracket | Male | Female |
| 5 to 17 Years | 70 (0.6%) | 9 (0.1%) |
| 18 to 34 Years | 92 (0.7%) | 137 (1.1%) |
| 35 to 64 Years | 874 (2.8%) | 1,246 (3.9%) |
| 65 to 74 Years | 578 (9.5%) | 775 (10.4%) |
| 75 Years and over | 981 (23.1%) | 2,279 (31.9%) |
Disability Class: Self-Care Difficulty
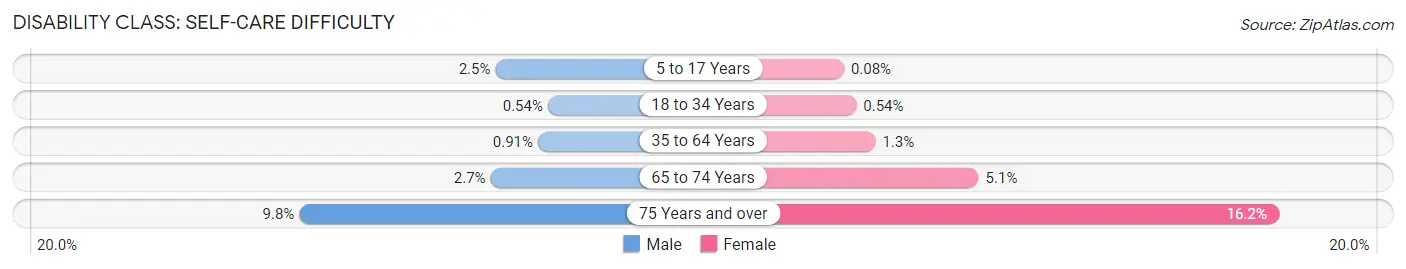
| Age Bracket | Male | Female |
| 5 to 17 Years | 301 (2.5%) | 9 (0.1%) |
| 18 to 34 Years | 73 (0.5%) | 70 (0.5%) |
| 35 to 64 Years | 283 (0.9%) | 396 (1.3%) |
| 65 to 74 Years | 162 (2.7%) | 377 (5.1%) |
| 75 Years and over | 415 (9.8%) | 1,158 (16.2%) |
Technology Access in Torrance
Computing Device Access in Torrance
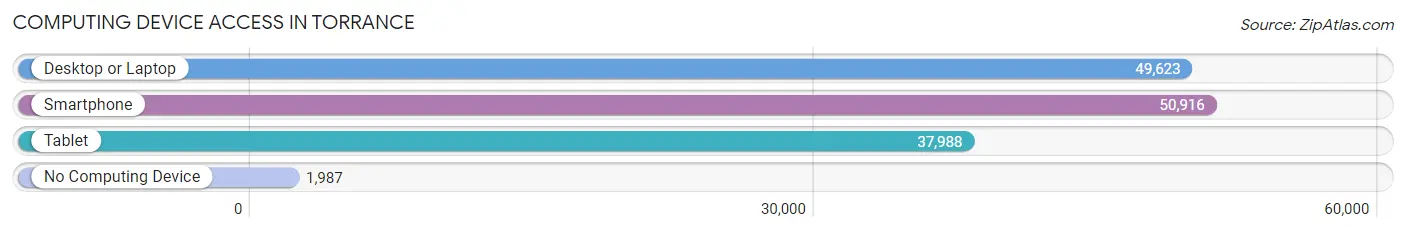
| Device Type | # Households | % Households |
| Desktop or Laptop | 49,623 | 89.1% |
| Smartphone | 50,916 | 91.4% |
| Tablet | 37,988 | 68.2% |
| No Computing Device | 1,987 | 3.6% |
| Total | 55,719 | 100.0% |
Internet Access in Torrance
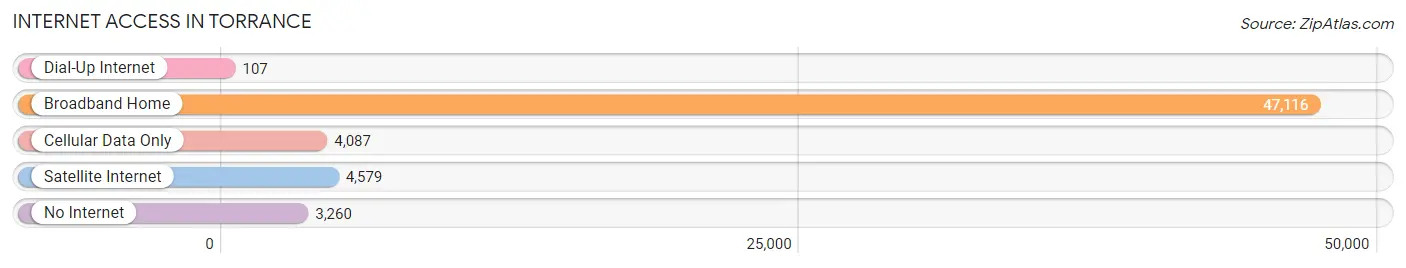
| Internet Type | # Households | % Households |
| Dial-Up Internet | 107 | 0.2% |
| Broadband Home | 47,116 | 84.6% |
| Cellular Data Only | 4,087 | 7.3% |
| Satellite Internet | 4,579 | 8.2% |
| No Internet | 3,260 | 5.9% |
| Total | 55,719 | 100.0% |
Torrance Summary
Torrance is a city located in the South Bay region of Los Angeles County, California. It is the eighth largest city in Los Angeles County and the 33rd largest city in the state of California. The city is bordered by the cities of Redondo Beach, Lawndale, Gardena, Hawthorne, and Lomita. Torrance is known for its low crime rate, excellent schools, and its proximity to the beach.
History
The area that is now Torrance was originally inhabited by the Tongva Native American tribe. The first Europeans to settle in the area were the Spanish, who established the Rancho San Pedro in 1784. The land was later acquired by the Bixby family, who established the Bixby Land Company in 1888. The company developed the area into a farming and ranching community, and the city of Torrance was officially incorporated in 1921.
Geography
Torrance is located in the South Bay region of Los Angeles County, approximately 20 miles south of downtown Los Angeles. The city covers an area of 21.2 square miles and has a population of 147,000. The city is bordered by the cities of Redondo Beach, Lawndale, Gardena, Hawthorne, and Lomita. The city is situated on the Palos Verdes Peninsula, and is home to several beaches, including Torrance Beach, Redondo Beach, and Cabrillo Beach.
Economy
Torrance is home to a diverse economy, with a variety of industries represented. The city is home to several major corporations, including Honda, Toyota, and Honeywell. The city is also home to a number of smaller businesses, including restaurants, retail stores, and professional services. The city is also home to several educational institutions, including El Camino College and the University of Southern California.
Demographics
As of the 2010 census, Torrance had a population of 147,000. The racial makeup of the city was 63.2% White, 11.2% Asian, 8.3% African American, 0.5% Native American, 0.2% Pacific Islander, and 16.8% from other races. The median household income was $68,000, and the median age was 38. The city is home to a large number of immigrants, with over 20% of the population born outside of the United States.
Torrance is a diverse and vibrant city, with a rich history and a strong economy. The city is home to a variety of industries, educational institutions, and businesses, and is a popular destination for tourists and residents alike. The city is known for its low crime rate, excellent schools, and its proximity to the beach.
Common Questions
What is Per Capita Income in Torrance?
Per Capita income in Torrance is $54,737.
What is the Median Family Income in Torrance?
Median Family Income in Torrance is $133,064.
What is the Median Household income in Torrance?
Median Household Income in Torrance is $109,554.
What is Income or Wage Gap in Torrance?
Income or Wage Gap in Torrance is 25.5%.
Women in Torrance earn 74.5 cents for every dollar earned by a man.
What is Family Income Deficit in Torrance?
Family Income Deficit in Torrance is $10,293.
Families that are below poverty line in Torrance earn $10,293 less on average than the poverty threshold level.
What is Inequality or Gini Index in Torrance?
Inequality or Gini Index in Torrance is 0.44.
What is the Total Population of Torrance?
Total Population of Torrance is 145,454.
What is the Total Male Population of Torrance?
Total Male Population of Torrance is 71,576.
What is the Total Female Population of Torrance?
Total Female Population of Torrance is 73,878.
What is the Ratio of Males per 100 Females in Torrance?
There are 96.88 Males per 100 Females in Torrance.
What is the Ratio of Females per 100 Males in Torrance?
There are 103.22 Females per 100 Males in Torrance.
What is the Median Population Age in Torrance?
Median Population Age in Torrance is 42.9 Years.
What is the Average Family Size in Torrance
Average Family Size in Torrance is 3.2 People.
What is the Average Household Size in Torrance
Average Household Size in Torrance is 2.6 People.
How Large is the Labor Force in Torrance?
There are 76,324 People in the Labor Forcein in Torrance.
What is the Percentage of People in the Labor Force in Torrance?
64.5% of People are in the Labor Force in Torrance.
What is the Unemployment Rate in Torrance?
Unemployment Rate in Torrance is 5.3%.