Vineyard, CA Map & Demographics
Vineyard Map
Vineyard Overview
$36,960
PER CAPITA INCOME
$116,189
AVG FAMILY INCOME
$108,607
AVG HOUSEHOLD INCOME
11.8%
WAGE / INCOME GAP [ % ]
88.2¢/ $1
WAGE / INCOME GAP [ $ ]
$11,760
FAMILY INCOME DEFICIT
0.39
INEQUALITY / GINI INDEX
42,657
TOTAL POPULATION
21,530
MALE POPULATION
21,127
FEMALE POPULATION
101.91
MALES / 100 FEMALES
98.13
FEMALES / 100 MALES
36.8
MEDIAN AGE
3.7
AVG FAMILY SIZE
3.4
AVG HOUSEHOLD SIZE
20,507
LABOR FORCE [ PEOPLE ]
62.3%
PERCENT IN LABOR FORCE
4.8%
UNEMPLOYMENT RATE
Income in Vineyard
Income Overview in Vineyard
Per Capita Income in Vineyard is $36,960, while median incomes of families and households are $116,189 and $108,607 respectively.
| Characteristic | Number | Measure |
| Per Capita Income | 42,657 | $36,960 |
| Median Family Income | 10,180 | $116,189 |
| Mean Family Income | 10,180 | $130,461 |
| Median Household Income | 12,484 | $108,607 |
| Mean Household Income | 12,484 | $124,054 |
| Income Deficit | 10,180 | $11,760 |
| Wage / Income Gap (%) | 42,657 | 11.81% |
| Wage / Income Gap ($) | 42,657 | 88.19¢ per $1 |
| Gini / Inequality Index | 42,657 | 0.39 |
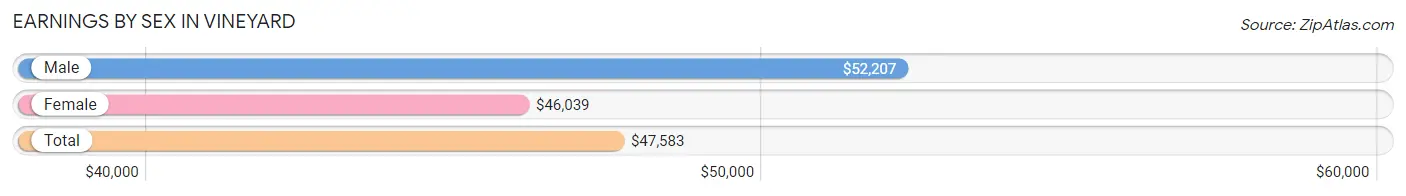
Earnings by Sex in Vineyard
Average Earnings in Vineyard are $47,583, $52,207 for men and $46,039 for women, a difference of 11.8%.
| Sex | Number | Average Earnings |
| Male | 11,087 (52.6%) | $52,207 |
| Female | 9,984 (47.4%) | $46,039 |
| Total | 21,071 (100.0%) | $47,583 |
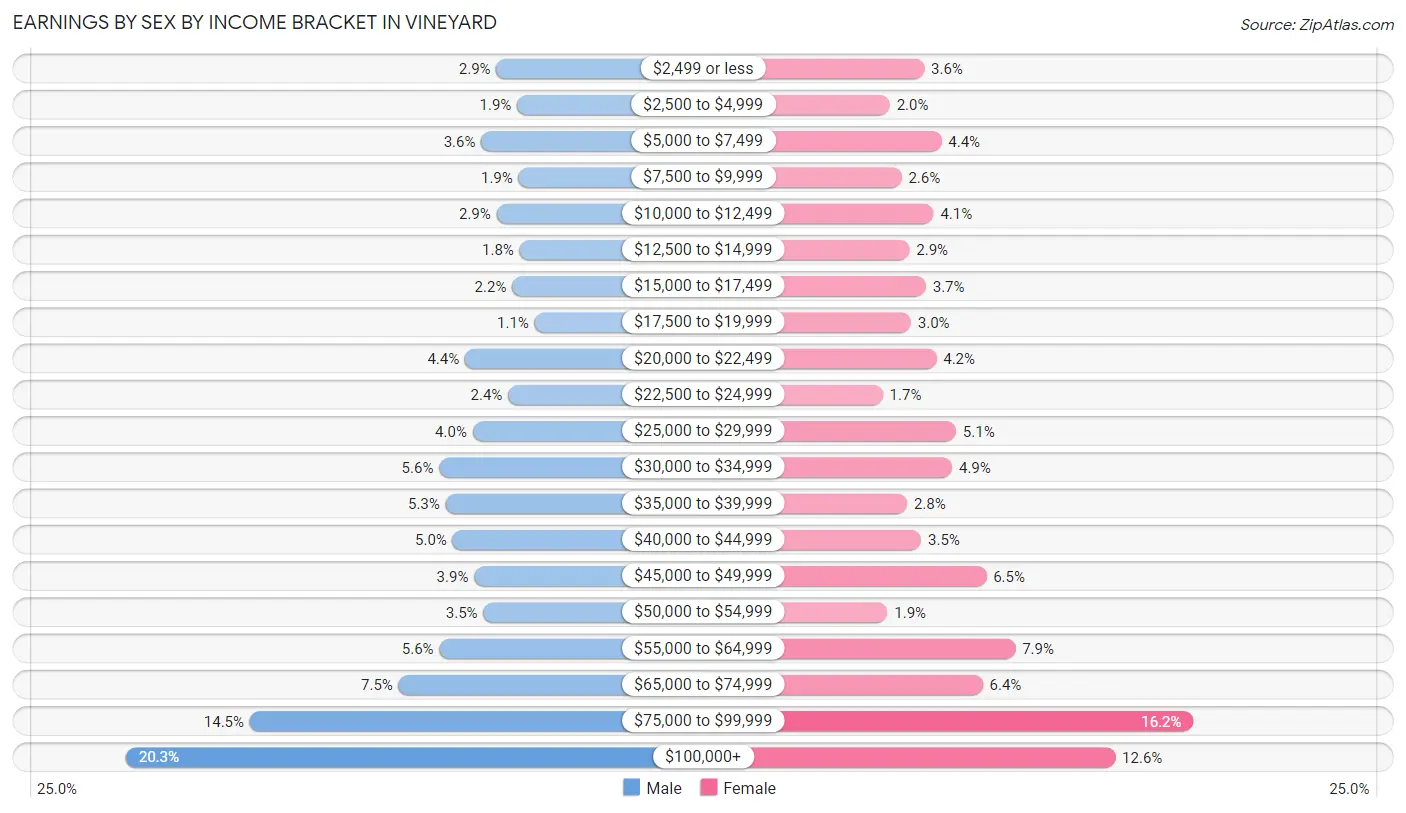
Earnings by Sex by Income Bracket in Vineyard
The most common earnings brackets in Vineyard are $100,000+ for men (2,246 | 20.3%) and $75,000 to $99,999 for women (1,620 | 16.2%).
| Income | Male | Female |
| $2,499 or less | 321 (2.9%) | 361 (3.6%) |
| $2,500 to $4,999 | 214 (1.9%) | 201 (2.0%) |
| $5,000 to $7,499 | 400 (3.6%) | 442 (4.4%) |
| $7,500 to $9,999 | 206 (1.9%) | 256 (2.6%) |
| $10,000 to $12,499 | 320 (2.9%) | 405 (4.1%) |
| $12,500 to $14,999 | 201 (1.8%) | 293 (2.9%) |
| $15,000 to $17,499 | 239 (2.2%) | 369 (3.7%) |
| $17,500 to $19,999 | 123 (1.1%) | 300 (3.0%) |
| $20,000 to $22,499 | 485 (4.4%) | 418 (4.2%) |
| $22,500 to $24,999 | 260 (2.4%) | 168 (1.7%) |
| $25,000 to $29,999 | 445 (4.0%) | 510 (5.1%) |
| $30,000 to $34,999 | 619 (5.6%) | 492 (4.9%) |
| $35,000 to $39,999 | 585 (5.3%) | 282 (2.8%) |
| $40,000 to $44,999 | 549 (5.0%) | 347 (3.5%) |
| $45,000 to $49,999 | 437 (3.9%) | 652 (6.5%) |
| $50,000 to $54,999 | 389 (3.5%) | 190 (1.9%) |
| $55,000 to $64,999 | 617 (5.6%) | 788 (7.9%) |
| $65,000 to $74,999 | 829 (7.5%) | 635 (6.4%) |
| $75,000 to $99,999 | 1,602 (14.4%) | 1,620 (16.2%) |
| $100,000+ | 2,246 (20.3%) | 1,255 (12.6%) |
| Total | 11,087 (100.0%) | 9,984 (100.0%) |
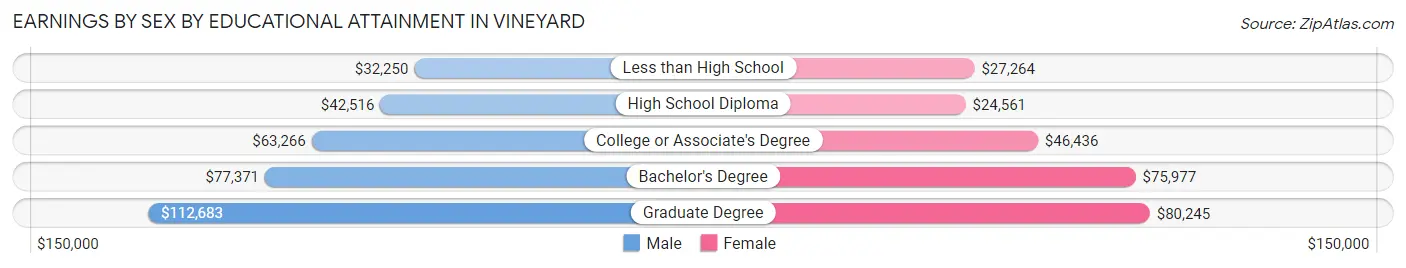
Earnings by Sex by Educational Attainment in Vineyard
Average earnings in Vineyard are $60,839 for men and $49,970 for women, a difference of 17.9%. Men with an educational attainment of graduate degree enjoy the highest average annual earnings of $112,683, while those with less than high school education earn the least with $32,250. Women with an educational attainment of graduate degree earn the most with the average annual earnings of $80,245, while those with high school diploma education have the smallest earnings of $24,561.
| Educational Attainment | Male Income | Female Income |
| Less than High School | $32,250 | $27,264 |
| High School Diploma | $42,516 | $24,561 |
| College or Associate's Degree | $63,266 | $46,436 |
| Bachelor's Degree | $77,371 | $75,977 |
| Graduate Degree | $112,683 | $80,245 |
| Total | $60,839 | $49,970 |
Family Income in Vineyard
Family Income Brackets in Vineyard
According to the Vineyard family income data, there are 2,331 families falling into the $100,000 to $149,999 income range, which is the most common income bracket and makes up 22.9% of all families. Conversely, the $10,000 to $14,999 income bracket is the least frequent group with only 61 families (0.6%) belonging to this category.
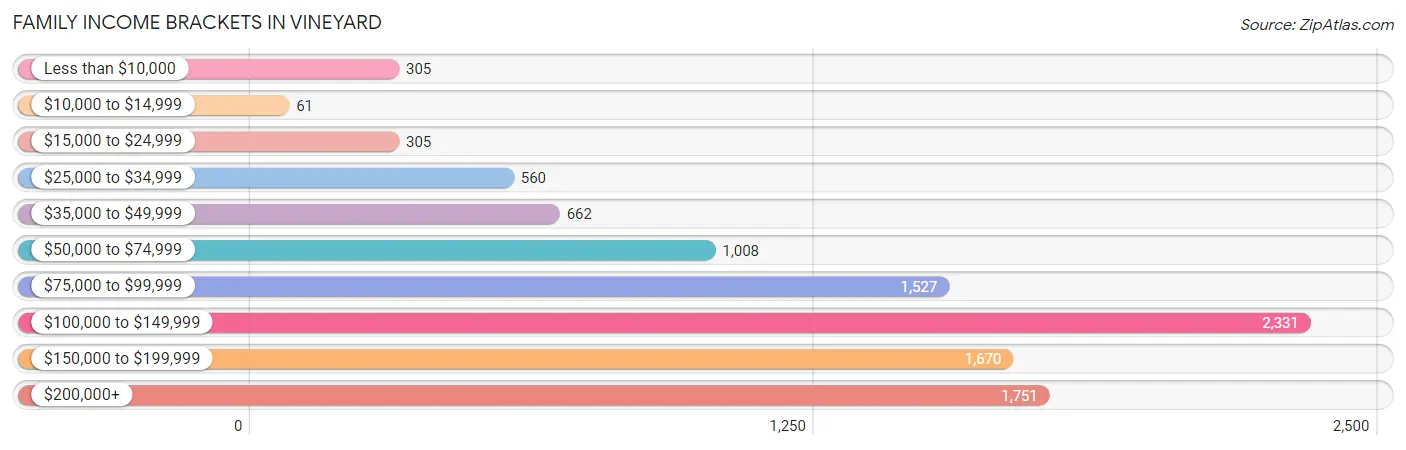
| Income Bracket | # Families | % Families |
| Less than $10,000 | 305 | 3.0% |
| $10,000 to $14,999 | 61 | 0.6% |
| $15,000 to $24,999 | 305 | 3.0% |
| $25,000 to $34,999 | 560 | 5.5% |
| $35,000 to $49,999 | 662 | 6.5% |
| $50,000 to $74,999 | 1,008 | 9.9% |
| $75,000 to $99,999 | 1,527 | 15.0% |
| $100,000 to $149,999 | 2,331 | 22.9% |
| $150,000 to $199,999 | 1,670 | 16.4% |
| $200,000+ | 1,751 | 17.2% |
Family Income by Famaliy Size in Vineyard
6-person families (462 | 4.5%) account for the highest median family income in Vineyard with $133,621 per family, while 2-person families (2,991 | 29.4%) have the highest median income of $50,128 per family member.
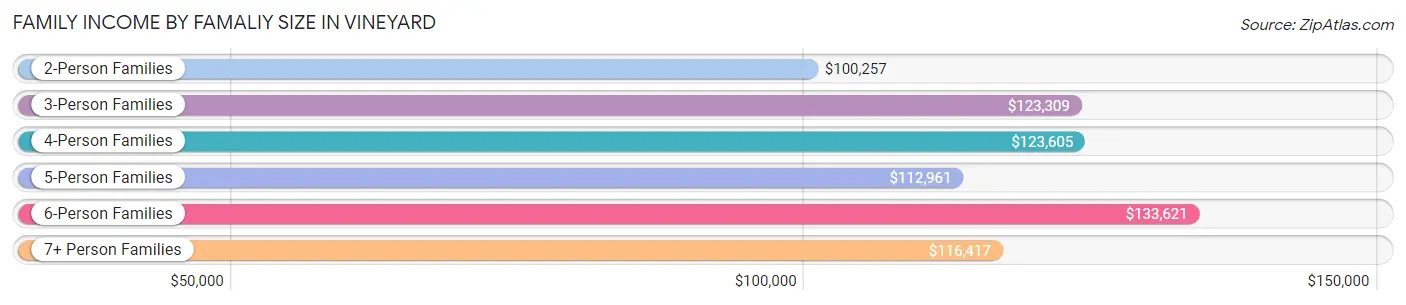
| Income Bracket | # Families | Median Income |
| 2-Person Families | 2,991 (29.4%) | $100,257 |
| 3-Person Families | 2,106 (20.7%) | $123,309 |
| 4-Person Families | 2,951 (29.0%) | $123,605 |
| 5-Person Families | 1,145 (11.3%) | $112,961 |
| 6-Person Families | 462 (4.5%) | $133,621 |
| 7+ Person Families | 525 (5.2%) | $116,417 |
| Total | 10,180 (100.0%) | $116,189 |
Family Income by Number of Earners in Vineyard
The median family income in Vineyard is $116,189, with families comprising 3+ earners (1,554) having the highest median family income of $155,294, while families with 1 earner (2,811) have the lowest median family income of $68,367, accounting for 15.3% and 27.6% of families, respectively.
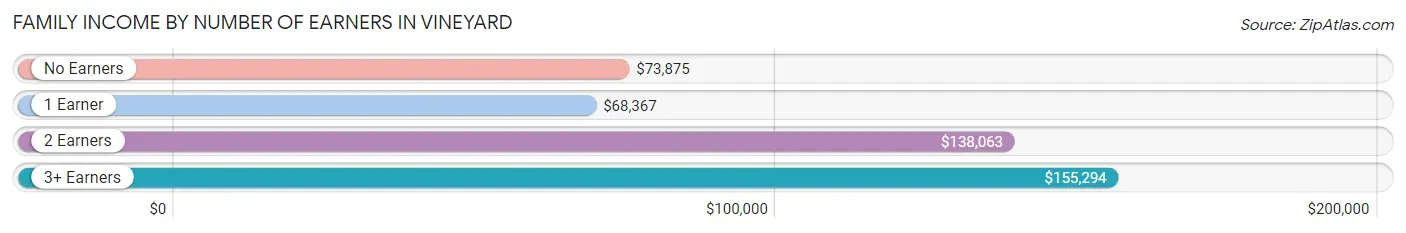
| Number of Earners | # Families | Median Income |
| No Earners | 1,127 (11.1%) | $73,875 |
| 1 Earner | 2,811 (27.6%) | $68,367 |
| 2 Earners | 4,688 (46.1%) | $138,063 |
| 3+ Earners | 1,554 (15.3%) | $155,294 |
| Total | 10,180 (100.0%) | $116,189 |
Household Income in Vineyard
Household Income Brackets in Vineyard
With 2,759 households falling in the category, the $100,000 to $149,999 income range is the most frequent in Vineyard, accounting for 22.1% of all households. In contrast, only 125 households (1.0%) fall into the $10,000 to $14,999 income bracket, making it the least populous group.
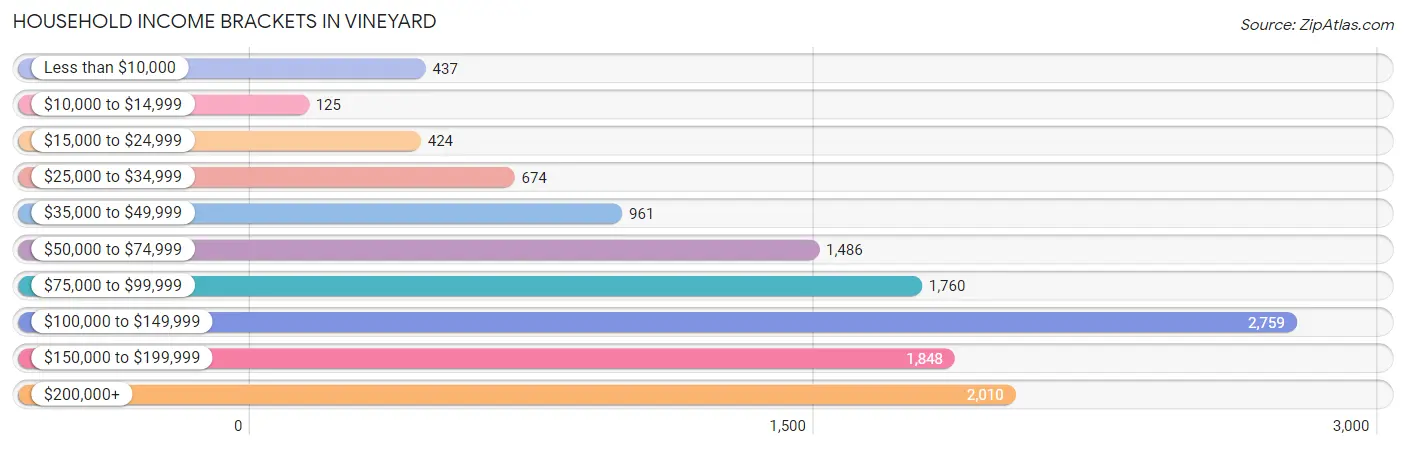
| Income Bracket | # Households | % Households |
| Less than $10,000 | 437 | 3.5% |
| $10,000 to $14,999 | 125 | 1.0% |
| $15,000 to $24,999 | 424 | 3.4% |
| $25,000 to $34,999 | 674 | 5.4% |
| $35,000 to $49,999 | 961 | 7.7% |
| $50,000 to $74,999 | 1,486 | 11.9% |
| $75,000 to $99,999 | 1,760 | 14.1% |
| $100,000 to $149,999 | 2,759 | 22.1% |
| $150,000 to $199,999 | 1,848 | 14.8% |
| $200,000+ | 2,010 | 16.1% |
Household Income by Householder Age in Vineyard
The median household income in Vineyard is $108,607, with the highest median household income of $120,441 found in the 45 to 64 years age bracket for the primary householder. A total of 5,248 households (42.0%) fall into this category. Meanwhile, the 15 to 24 years age bracket for the primary householder has the lowest median household income of $0, with 136 households (1.1%) in this group.
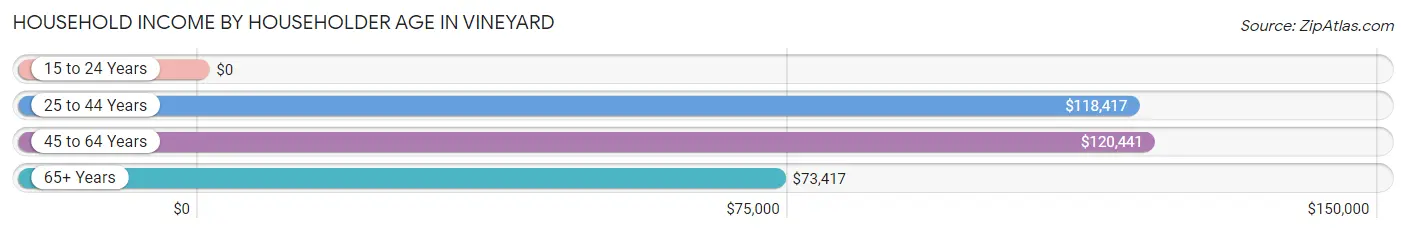
| Income Bracket | # Households | Median Income |
| 15 to 24 Years | 136 (1.1%) | $0 |
| 25 to 44 Years | 4,519 (36.2%) | $118,417 |
| 45 to 64 Years | 5,248 (42.0%) | $120,441 |
| 65+ Years | 2,581 (20.7%) | $73,417 |
| Total | 12,484 (100.0%) | $108,607 |
Poverty in Vineyard
Income Below Poverty by Sex and Age in Vineyard
With 10.9% poverty level for males and 13.3% for females among the residents of Vineyard, 15 year old males and 16 and 17 year old females are the most vulnerable to poverty, with 105 males (33.1%) and 201 females (33.8%) in their respective age groups living below the poverty level.
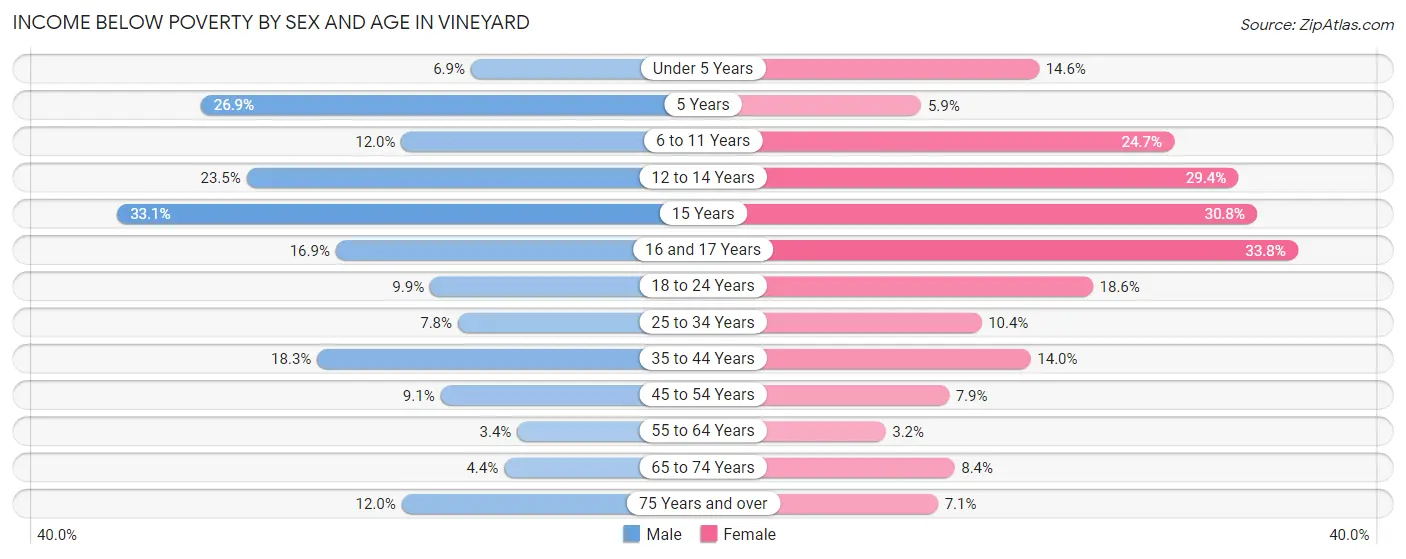
| Age Bracket | Male | Female |
| Under 5 Years | 105 (6.9%) | 190 (14.6%) |
| 5 Years | 60 (26.9%) | 11 (5.9%) |
| 6 to 11 Years | 228 (12.0%) | 454 (24.6%) |
| 12 to 14 Years | 194 (23.5%) | 273 (29.4%) |
| 15 Years | 105 (33.1%) | 118 (30.8%) |
| 16 and 17 Years | 131 (16.9%) | 201 (33.8%) |
| 18 to 24 Years | 211 (9.9%) | 253 (18.6%) |
| 25 to 34 Years | 219 (7.8%) | 279 (10.3%) |
| 35 to 44 Years | 535 (18.3%) | 483 (14.0%) |
| 45 to 54 Years | 247 (9.1%) | 207 (7.9%) |
| 55 to 64 Years | 85 (3.4%) | 87 (3.2%) |
| 65 to 74 Years | 74 (4.4%) | 150 (8.4%) |
| 75 Years and over | 128 (12.0%) | 81 (7.1%) |
| Total | 2,322 (10.9%) | 2,787 (13.3%) |
Income Above Poverty by Sex and Age in Vineyard
According to the poverty statistics in Vineyard, males aged 55 to 64 years and females aged 55 to 64 years are the age groups that are most secure financially, with 96.6% of males and 96.8% of females in these age groups living above the poverty line.
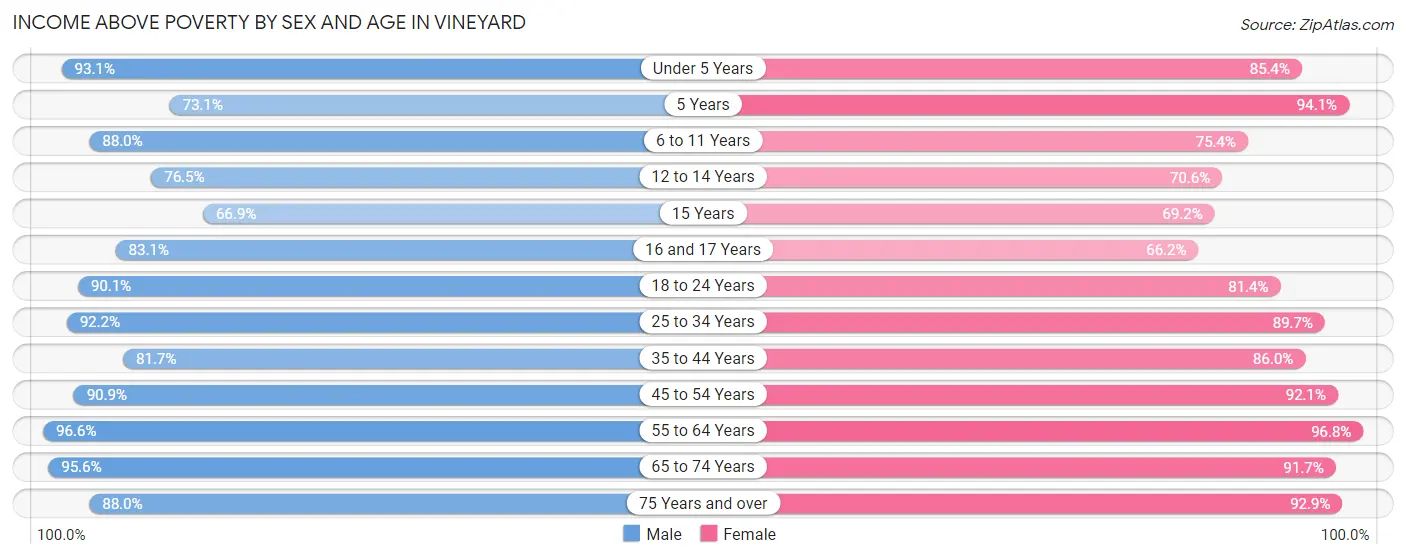
| Age Bracket | Male | Female |
| Under 5 Years | 1,423 (93.1%) | 1,110 (85.4%) |
| 5 Years | 163 (73.1%) | 176 (94.1%) |
| 6 to 11 Years | 1,667 (88.0%) | 1,388 (75.3%) |
| 12 to 14 Years | 631 (76.5%) | 655 (70.6%) |
| 15 Years | 212 (66.9%) | 265 (69.2%) |
| 16 and 17 Years | 644 (83.1%) | 393 (66.2%) |
| 18 to 24 Years | 1,920 (90.1%) | 1,106 (81.4%) |
| 25 to 34 Years | 2,578 (92.2%) | 2,417 (89.6%) |
| 35 to 44 Years | 2,392 (81.7%) | 2,968 (86.0%) |
| 45 to 54 Years | 2,460 (90.9%) | 2,401 (92.1%) |
| 55 to 64 Years | 2,390 (96.6%) | 2,609 (96.8%) |
| 65 to 74 Years | 1,608 (95.6%) | 1,647 (91.6%) |
| 75 Years and over | 938 (88.0%) | 1,056 (92.9%) |
| Total | 19,026 (89.1%) | 18,191 (86.7%) |
Income Below Poverty Among Married-Couple Families in Vineyard
The poverty statistics for married-couple families in Vineyard show that 5.7% or 455 of the total 7,934 families live below the poverty line. Families with 3 or 4 children have the highest poverty rate of 19.1%, comprising of 150 families. On the other hand, families with no children have the lowest poverty rate of 2.5%, which includes 94 families.
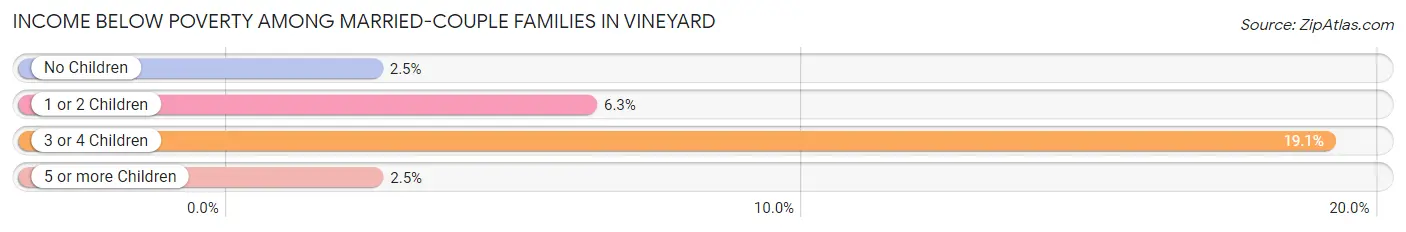
| Children | Above Poverty | Below Poverty |
| No Children | 3,634 (97.5%) | 94 (2.5%) |
| 1 or 2 Children | 3,133 (93.8%) | 209 (6.2%) |
| 3 or 4 Children | 635 (80.9%) | 150 (19.1%) |
| 5 or more Children | 77 (97.5%) | 2 (2.5%) |
| Total | 7,479 (94.3%) | 455 (5.7%) |
Income Below Poverty Among Single-Parent Households in Vineyard
According to the poverty data in Vineyard, 25.0% or 140 single-father households and 18.7% or 315 single-mother households are living below the poverty line. Among single-father households, those with 1 or 2 children have the highest poverty rate, with 140 households (55.3%) experiencing poverty. Likewise, among single-mother households, those with 5 or more children have the highest poverty rate, with 98 households (100.0%) falling below the poverty line.
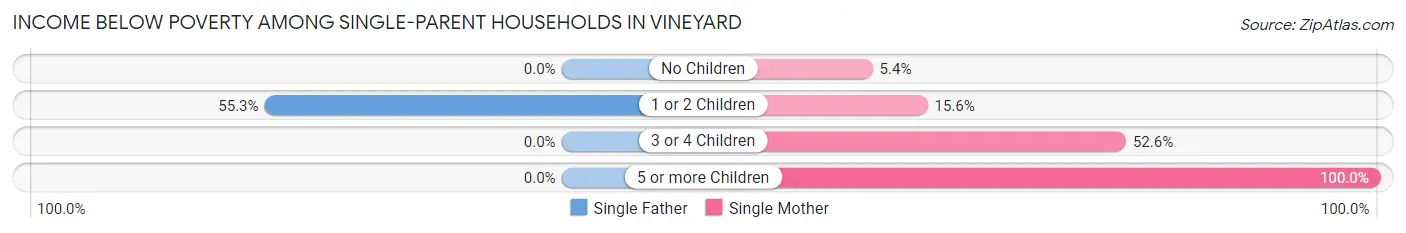
| Children | Single Father | Single Mother |
| No Children | 0 (0.0%) | 39 (5.4%) |
| 1 or 2 Children | 140 (55.3%) | 117 (15.6%) |
| 3 or 4 Children | 0 (0.0%) | 61 (52.6%) |
| 5 or more Children | 0 (0.0%) | 98 (100.0%) |
| Total | 140 (25.0%) | 315 (18.7%) |
Income Below Poverty Among Married-Couple vs Single-Parent Households in Vineyard
The poverty data for Vineyard shows that 455 of the married-couple family households (5.7%) and 455 of the single-parent households (20.3%) are living below the poverty level. Within the married-couple family households, those with 3 or 4 children have the highest poverty rate, with 150 households (19.1%) falling below the poverty line. Among the single-parent households, those with 5 or more children have the highest poverty rate, with 98 household (100.0%) living below poverty.
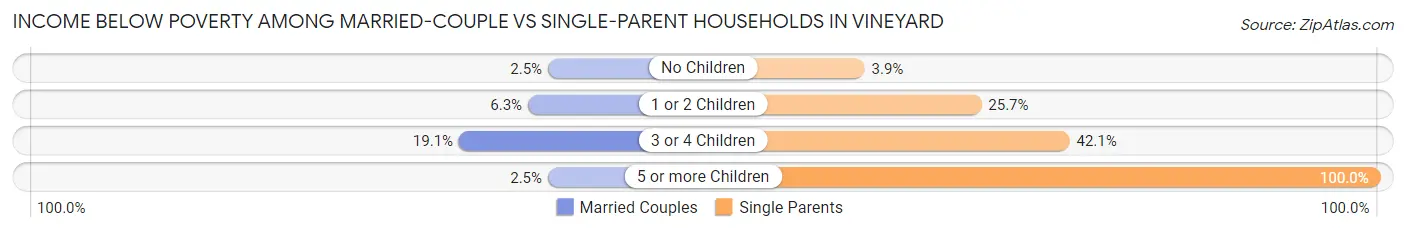
| Children | Married-Couple Families | Single-Parent Households |
| No Children | 94 (2.5%) | 39 (3.9%) |
| 1 or 2 Children | 209 (6.2%) | 257 (25.7%) |
| 3 or 4 Children | 150 (19.1%) | 61 (42.1%) |
| 5 or more Children | 2 (2.5%) | 98 (100.0%) |
| Total | 455 (5.7%) | 455 (20.3%) |
Race in Vineyard
The most populous races in Vineyard are Asian (16,150 | 37.9%), White / Caucasian (13,349 | 31.3%), and Hispanic or Latino (8,732 | 20.5%).
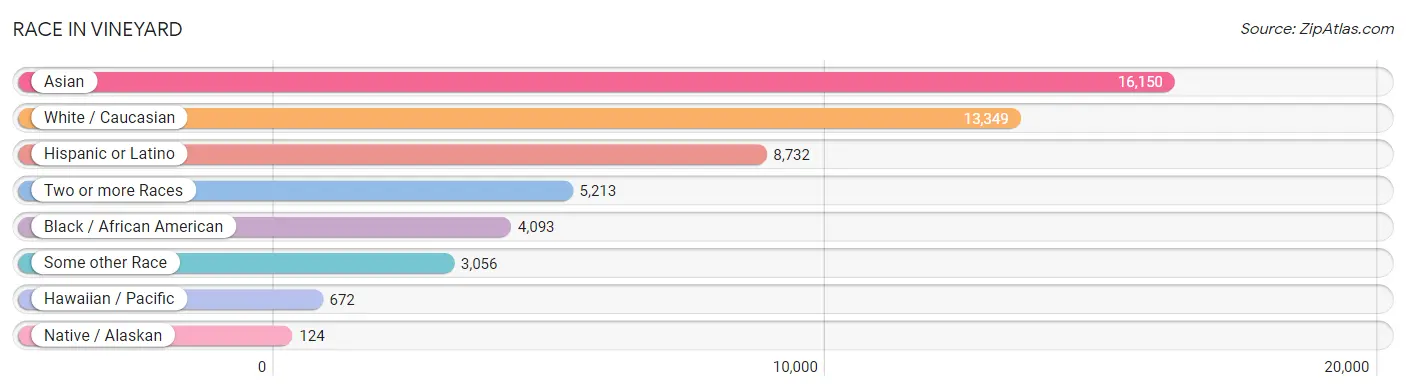
| Race | # Population | % Population |
| Asian | 16,150 | 37.9% |
| Black / African American | 4,093 | 9.6% |
| Hawaiian / Pacific | 672 | 1.6% |
| Hispanic or Latino | 8,732 | 20.5% |
| Native / Alaskan | 124 | 0.3% |
| White / Caucasian | 13,349 | 31.3% |
| Two or more Races | 5,213 | 12.2% |
| Some other Race | 3,056 | 7.2% |
| Total | 42,657 | 100.0% |
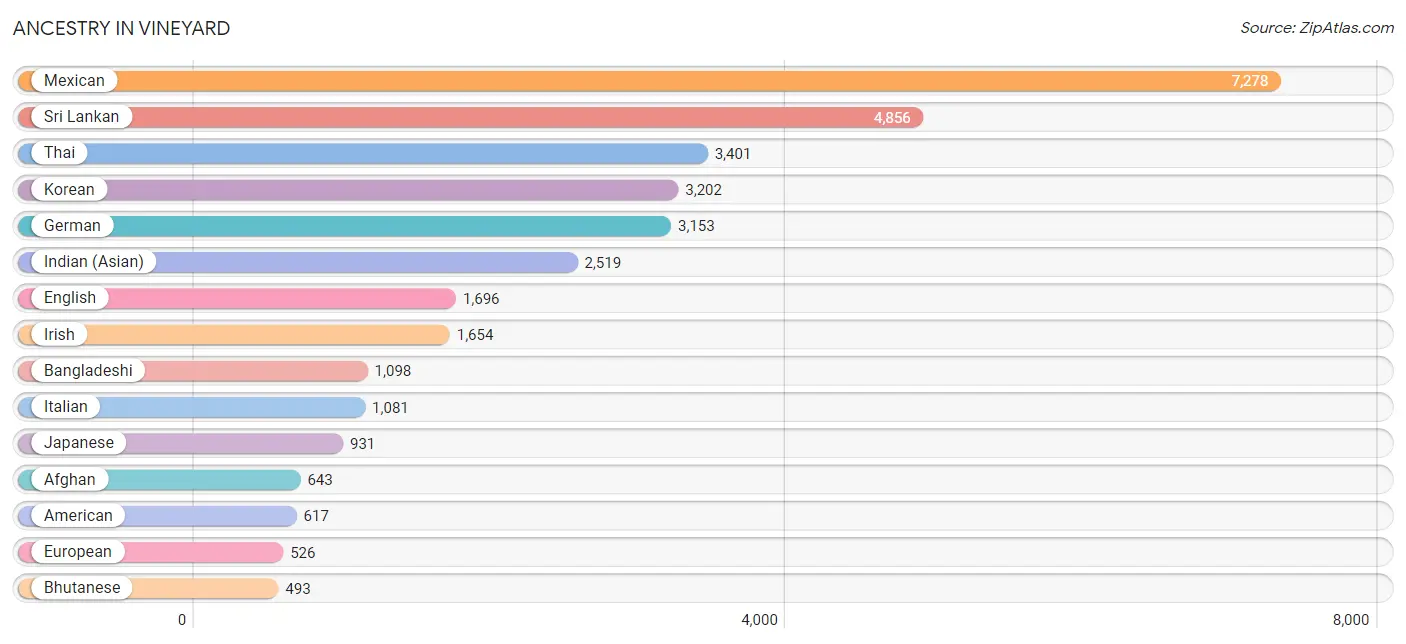
Ancestry in Vineyard
The most populous ancestries reported in Vineyard are Mexican (7,278 | 17.1%), Sri Lankan (4,856 | 11.4%), Thai (3,401 | 8.0%), Korean (3,202 | 7.5%), and German (3,153 | 7.4%), together accounting for 51.3% of all Vineyard residents.
| Ancestry | # Population | % Population |
| Afghan | 643 | 1.5% |
| African | 47 | 0.1% |
| American | 617 | 1.5% |
| Apache | 60 | 0.1% |
| Arab | 379 | 0.9% |
| Armenian | 48 | 0.1% |
| Assyrian / Chaldean / Syriac | 143 | 0.3% |
| Australian | 12 | 0.0% |
| Austrian | 64 | 0.2% |
| Bangladeshi | 1,098 | 2.6% |
| Bhutanese | 493 | 1.2% |
| Blackfeet | 47 | 0.1% |
| Brazilian | 145 | 0.3% |
| British | 59 | 0.1% |
| Burmese | 149 | 0.4% |
| Canadian | 11 | 0.0% |
| Central American | 406 | 0.9% |
| Central American Indian | 17 | 0.0% |
| Cherokee | 101 | 0.2% |
| Chinese | 43 | 0.1% |
| Choctaw | 54 | 0.1% |
| Colombian | 103 | 0.2% |
| Comanche | 21 | 0.1% |
| Croatian | 7 | 0.0% |
| Cuban | 83 | 0.2% |
| Danish | 56 | 0.1% |
| Dutch | 252 | 0.6% |
| Eastern European | 16 | 0.0% |
| Egyptian | 30 | 0.1% |
| English | 1,696 | 4.0% |
| Ethiopian | 21 | 0.1% |
| European | 526 | 1.2% |
| Finnish | 40 | 0.1% |
| French | 456 | 1.1% |
| French Canadian | 18 | 0.0% |
| German | 3,153 | 7.4% |
| Greek | 460 | 1.1% |
| Guamanian / Chamorro | 158 | 0.4% |
| Guatemalan | 7 | 0.0% |
| Haitian | 1 | 0.0% |
| Hungarian | 10 | 0.0% |
| Indian (Asian) | 2,519 | 5.9% |
| Iranian | 27 | 0.1% |
| Irish | 1,654 | 3.9% |
| Italian | 1,081 | 2.5% |
| Jamaican | 4 | 0.0% |
| Japanese | 931 | 2.2% |
| Kenyan | 13 | 0.0% |
| Korean | 3,202 | 7.5% |
| Laotian | 82 | 0.2% |
| Lebanese | 77 | 0.2% |
| Malaysian | 231 | 0.5% |
| Maltese | 7 | 0.0% |
| Mexican | 7,278 | 17.1% |
| Mexican American Indian | 28 | 0.1% |
| Native Hawaiian | 77 | 0.2% |
| Nepalese | 400 | 0.9% |
| Nicaraguan | 147 | 0.3% |
| Norwegian | 173 | 0.4% |
| Pakistani | 29 | 0.1% |
| Palestinian | 90 | 0.2% |
| Panamanian | 50 | 0.1% |
| Pennsylvania German | 13 | 0.0% |
| Peruvian | 179 | 0.4% |
| Polish | 392 | 0.9% |
| Portuguese | 254 | 0.6% |
| Puerto Rican | 236 | 0.5% |
| Romanian | 112 | 0.3% |
| Russian | 197 | 0.5% |
| Salvadoran | 202 | 0.5% |
| Samoan | 123 | 0.3% |
| Scandinavian | 47 | 0.1% |
| Scotch-Irish | 277 | 0.6% |
| Scottish | 163 | 0.4% |
| Serbian | 17 | 0.0% |
| Shoshone | 5 | 0.0% |
| Slovene | 9 | 0.0% |
| South American | 282 | 0.7% |
| Spaniard | 70 | 0.2% |
| Spanish | 132 | 0.3% |
| Spanish American | 70 | 0.2% |
| Sri Lankan | 4,856 | 11.4% |
| Subsaharan African | 97 | 0.2% |
| Swedish | 187 | 0.4% |
| Swiss | 88 | 0.2% |
| Thai | 3,401 | 8.0% |
| Tlingit-Haida | 50 | 0.1% |
| Tongan | 126 | 0.3% |
| Ukrainian | 234 | 0.5% |
| Welsh | 120 | 0.3% |
| West Indian | 8 | 0.0% | View All 91 Rows |
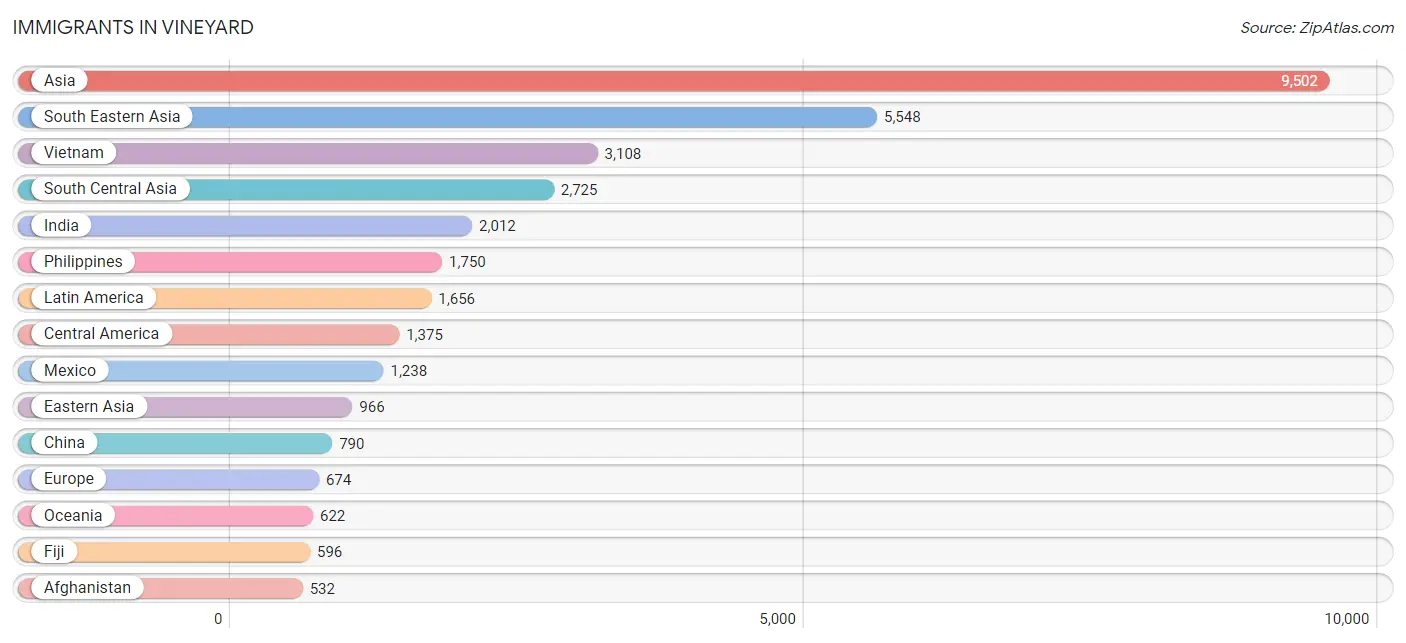
Immigrants in Vineyard
The most numerous immigrant groups reported in Vineyard came from Asia (9,502 | 22.3%), South Eastern Asia (5,548 | 13.0%), Vietnam (3,108 | 7.3%), South Central Asia (2,725 | 6.4%), and India (2,012 | 4.7%), together accounting for 53.7% of all Vineyard residents.
| Immigration Origin | # Population | % Population |
| Afghanistan | 532 | 1.3% |
| Africa | 142 | 0.3% |
| Armenia | 19 | 0.0% |
| Asia | 9,502 | 22.3% |
| Azores | 2 | 0.0% |
| Belarus | 76 | 0.2% |
| Brazil | 30 | 0.1% |
| Cambodia | 111 | 0.3% |
| Cameroon | 1 | 0.0% |
| Canada | 17 | 0.0% |
| Caribbean | 74 | 0.2% |
| Central America | 1,375 | 3.2% |
| China | 790 | 1.8% |
| Colombia | 22 | 0.1% |
| Eastern Africa | 20 | 0.1% |
| Eastern Asia | 966 | 2.3% |
| Eastern Europe | 452 | 1.1% |
| Egypt | 14 | 0.0% |
| El Salvador | 88 | 0.2% |
| England | 23 | 0.1% |
| Ethiopia | 7 | 0.0% |
| Europe | 674 | 1.6% |
| Fiji | 596 | 1.4% |
| France | 13 | 0.0% |
| Germany | 124 | 0.3% |
| Greece | 29 | 0.1% |
| Hong Kong | 76 | 0.2% |
| Hungary | 31 | 0.1% |
| India | 2,012 | 4.7% |
| Indonesia | 29 | 0.1% |
| Iraq | 82 | 0.2% |
| Ireland | 5 | 0.0% |
| Israel | 49 | 0.1% |
| Jamaica | 4 | 0.0% |
| Japan | 94 | 0.2% |
| Jordan | 6 | 0.0% |
| Kazakhstan | 23 | 0.1% |
| Kenya | 13 | 0.0% |
| Korea | 82 | 0.2% |
| Laos | 291 | 0.7% |
| Latin America | 1,656 | 3.9% |
| Mexico | 1,238 | 2.9% |
| Middle Africa | 1 | 0.0% |
| Moldova | 46 | 0.1% |
| Morocco | 62 | 0.2% |
| Nepal | 27 | 0.1% |
| Netherlands | 11 | 0.0% |
| Nicaragua | 44 | 0.1% |
| Northern Africa | 113 | 0.3% |
| Northern Europe | 42 | 0.1% |
| Oceania | 622 | 1.5% |
| Pakistan | 113 | 0.3% |
| Panama | 5 | 0.0% |
| Peru | 155 | 0.4% |
| Philippines | 1,750 | 4.1% |
| Poland | 101 | 0.2% |
| Portugal | 2 | 0.0% |
| Russia | 33 | 0.1% |
| Saudi Arabia | 46 | 0.1% |
| Scotland | 4 | 0.0% |
| Sierra Leone | 8 | 0.0% |
| Singapore | 16 | 0.0% |
| South America | 207 | 0.5% |
| South Central Asia | 2,725 | 6.4% |
| South Eastern Asia | 5,548 | 13.0% |
| Southern Europe | 31 | 0.1% |
| Sweden | 2 | 0.0% |
| Switzerland | 1 | 0.0% |
| Syria | 20 | 0.1% |
| Taiwan | 49 | 0.1% |
| Thailand | 243 | 0.6% |
| Trinidad and Tobago | 70 | 0.2% |
| Ukraine | 122 | 0.3% |
| Uzbekistan | 18 | 0.0% |
| Vietnam | 3,108 | 7.3% |
| Western Africa | 8 | 0.0% |
| Western Asia | 222 | 0.5% |
| Western Europe | 149 | 0.4% | View All 78 Rows |
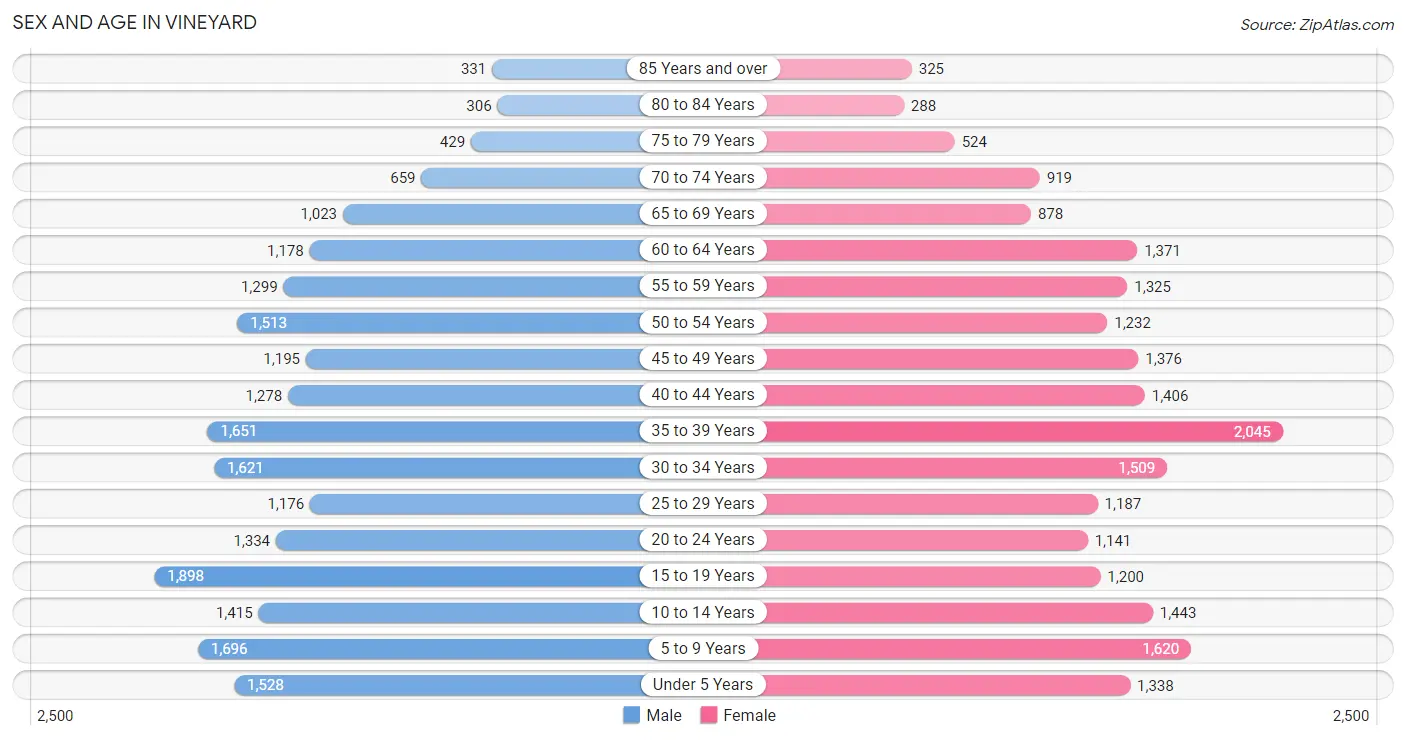
Sex and Age in Vineyard
Sex and Age in Vineyard
The most populous age groups in Vineyard are 15 to 19 Years (1,898 | 8.8%) for men and 35 to 39 Years (2,045 | 9.7%) for women.
| Age Bracket | Male | Female |
| Under 5 Years | 1,528 (7.1%) | 1,338 (6.3%) |
| 5 to 9 Years | 1,696 (7.9%) | 1,620 (7.7%) |
| 10 to 14 Years | 1,415 (6.6%) | 1,443 (6.8%) |
| 15 to 19 Years | 1,898 (8.8%) | 1,200 (5.7%) |
| 20 to 24 Years | 1,334 (6.2%) | 1,141 (5.4%) |
| 25 to 29 Years | 1,176 (5.5%) | 1,187 (5.6%) |
| 30 to 34 Years | 1,621 (7.5%) | 1,509 (7.1%) |
| 35 to 39 Years | 1,651 (7.7%) | 2,045 (9.7%) |
| 40 to 44 Years | 1,278 (5.9%) | 1,406 (6.7%) |
| 45 to 49 Years | 1,195 (5.6%) | 1,376 (6.5%) |
| 50 to 54 Years | 1,513 (7.0%) | 1,232 (5.8%) |
| 55 to 59 Years | 1,299 (6.0%) | 1,325 (6.3%) |
| 60 to 64 Years | 1,178 (5.5%) | 1,371 (6.5%) |
| 65 to 69 Years | 1,023 (4.8%) | 878 (4.2%) |
| 70 to 74 Years | 659 (3.1%) | 919 (4.3%) |
| 75 to 79 Years | 429 (2.0%) | 524 (2.5%) |
| 80 to 84 Years | 306 (1.4%) | 288 (1.4%) |
| 85 Years and over | 331 (1.5%) | 325 (1.5%) |
| Total | 21,530 (100.0%) | 21,127 (100.0%) |
Families and Households in Vineyard
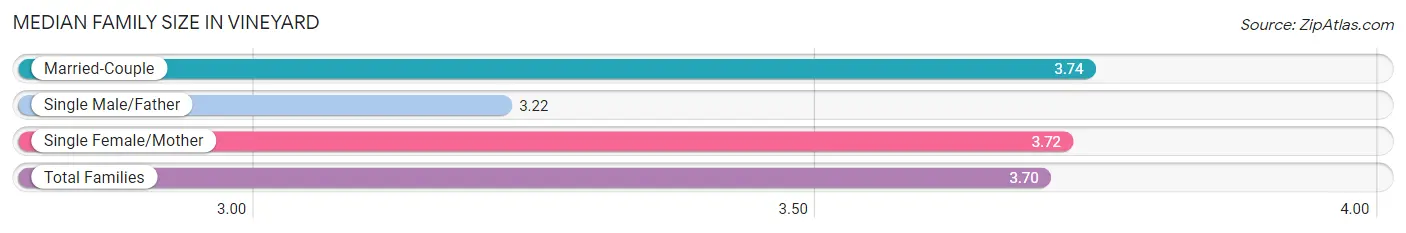
Median Family Size in Vineyard
The median family size in Vineyard is 3.70 persons per family, with married-couple families (7,934 | 77.9%) accounting for the largest median family size of 3.74 persons per family. On the other hand, single male/father families (561 | 5.5%) represent the smallest median family size with 3.22 persons per family.
| Family Type | # Families | Family Size |
| Married-Couple | 7,934 (77.9%) | 3.74 |
| Single Male/Father | 561 (5.5%) | 3.22 |
| Single Female/Mother | 1,685 (16.6%) | 3.72 |
| Total Families | 10,180 (100.0%) | 3.70 |
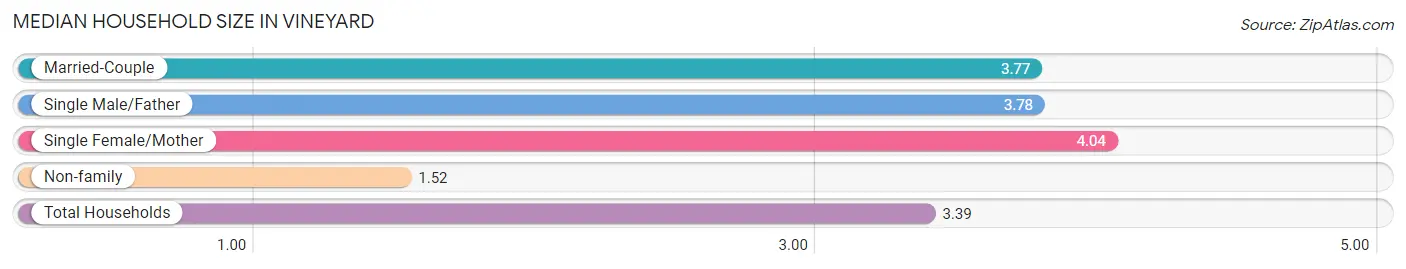
Median Household Size in Vineyard
The median household size in Vineyard is 3.39 persons per household, with single female/mother households (1,685 | 13.5%) accounting for the largest median household size of 4.04 persons per household. non-family households (2,304 | 18.5%) represent the smallest median household size with 1.52 persons per household.
| Household Type | # Households | Household Size |
| Married-Couple | 7,934 (63.5%) | 3.77 |
| Single Male/Father | 561 (4.5%) | 3.78 |
| Single Female/Mother | 1,685 (13.5%) | 4.04 |
| Non-family | 2,304 (18.5%) | 1.52 |
| Total Households | 12,484 (100.0%) | 3.39 |
Household Size by Marriage Status in Vineyard
Out of a total of 12,484 households in Vineyard, 10,180 (81.5%) are family households, while 2,304 (18.5%) are nonfamily households. The most numerous type of family households are 2-person households, comprising 2,771, and the most common type of nonfamily households are 1-person households, comprising 1,709.
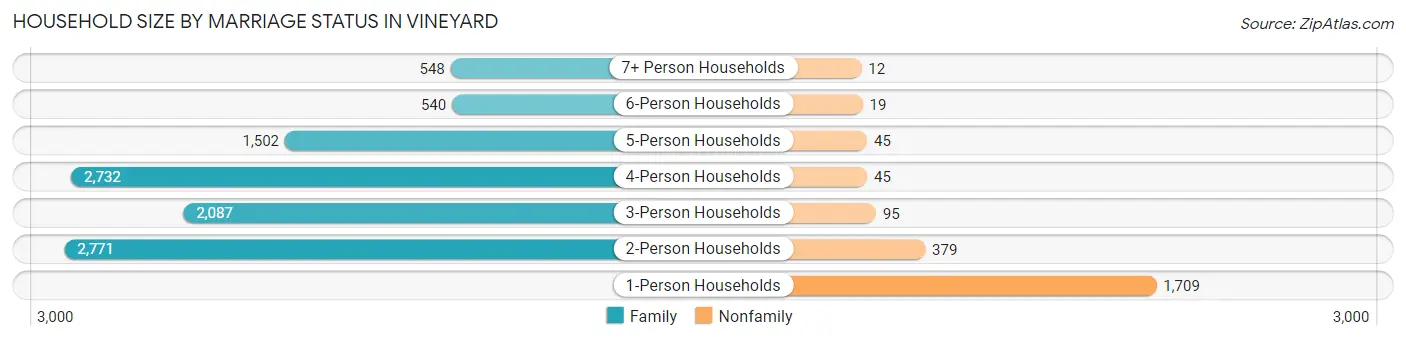
| Household Size | Family Households | Nonfamily Households |
| 1-Person Households | - | 1,709 (13.7%) |
| 2-Person Households | 2,771 (22.2%) | 379 (3.0%) |
| 3-Person Households | 2,087 (16.7%) | 95 (0.8%) |
| 4-Person Households | 2,732 (21.9%) | 45 (0.4%) |
| 5-Person Households | 1,502 (12.0%) | 45 (0.4%) |
| 6-Person Households | 540 (4.3%) | 19 (0.2%) |
| 7+ Person Households | 548 (4.4%) | 12 (0.1%) |
| Total | 10,180 (81.5%) | 2,304 (18.5%) |
Female Fertility in Vineyard
Fertility by Age in Vineyard
Average fertility rate in Vineyard is 54.0 births per 1,000 women. Women in the age bracket of 20 to 34 years have the highest fertility rate with 78.0 births per 1,000 women. Women in the age bracket of 20 to 34 years acount for 54.2% of all women with births.
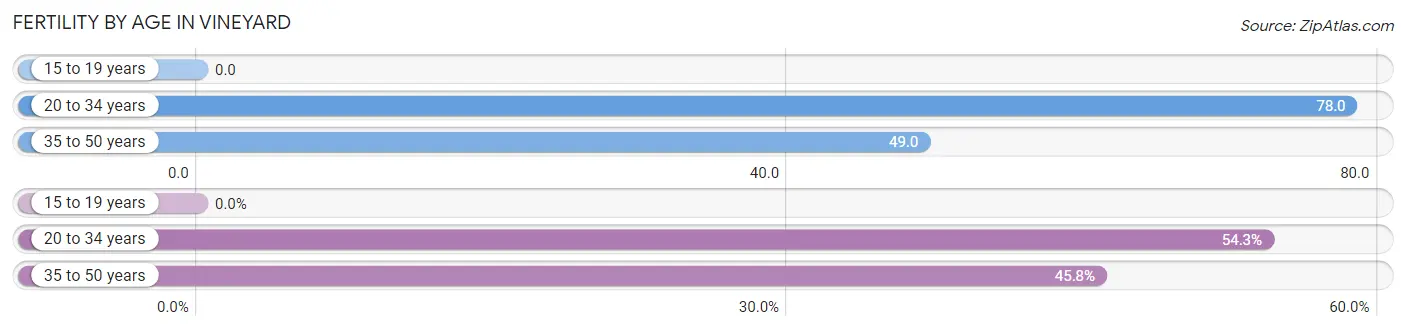
| Age Bracket | Women with Births | Births / 1,000 Women |
| 15 to 19 years | 0 (0.0%) | 0.0 |
| 20 to 34 years | 300 (54.2%) | 78.0 |
| 35 to 50 years | 253 (45.8%) | 49.0 |
| Total | 553 (100.0%) | 54.0 |
Fertility by Age by Marriage Status in Vineyard
88.1% of women with births (553) in Vineyard are married. The highest percentage of unmarried women with births falls into 20 to 34 years age bracket with 16.7% of them unmarried at the time of birth, while the lowest percentage of unmarried women with births belong to 35 to 50 years age bracket with 6.3% of them unmarried.
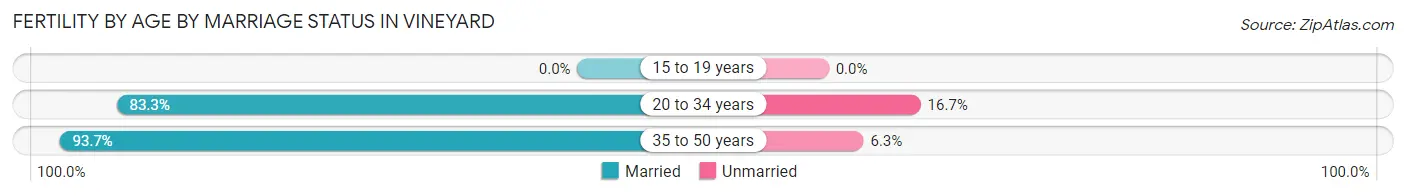
| Age Bracket | Married | Unmarried |
| 15 to 19 years | 0 (0.0%) | 0 (0.0%) |
| 20 to 34 years | 250 (83.3%) | 50 (16.7%) |
| 35 to 50 years | 237 (93.7%) | 16 (6.3%) |
| Total | 487 (88.1%) | 66 (11.9%) |
Fertility by Education in Vineyard
Average fertility rate in Vineyard is 54.0 births per 1,000 women. Women with the education attainment of bachelor's degree have the highest fertility rate of 73.0 births per 1,000 women, while women with the education attainment of graduate degree have the lowest fertility at 40.0 births per 1,000 women. Women with the education attainment of bachelor's degree represent 28.0% of all women with births.
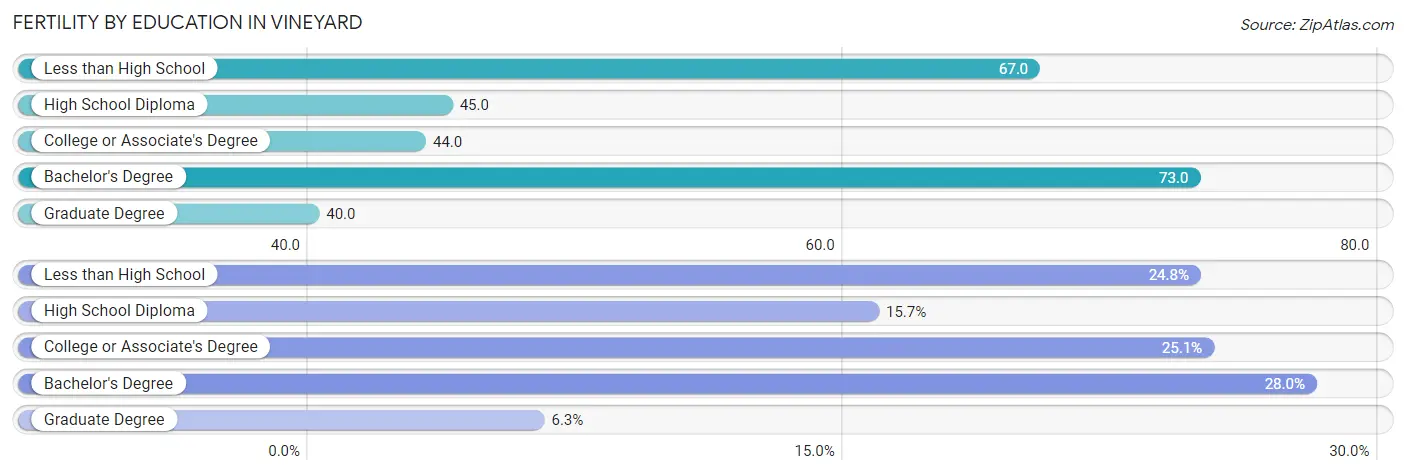
| Educational Attainment | Women with Births | Births / 1,000 Women |
| Less than High School | 137 (24.8%) | 67.0 |
| High School Diploma | 87 (15.7%) | 45.0 |
| College or Associate's Degree | 139 (25.1%) | 44.0 |
| Bachelor's Degree | 155 (28.0%) | 73.0 |
| Graduate Degree | 35 (6.3%) | 40.0 |
| Total | 553 (100.0%) | 54.0 |
Fertility by Education by Marriage Status in Vineyard
11.9% of women with births in Vineyard are unmarried. Women with the educational attainment of graduate degree are most likely to be married with 100.0% of them married at childbirth, while women with the educational attainment of bachelor's degree are least likely to be married with 20.6% of them unmarried at childbirth.
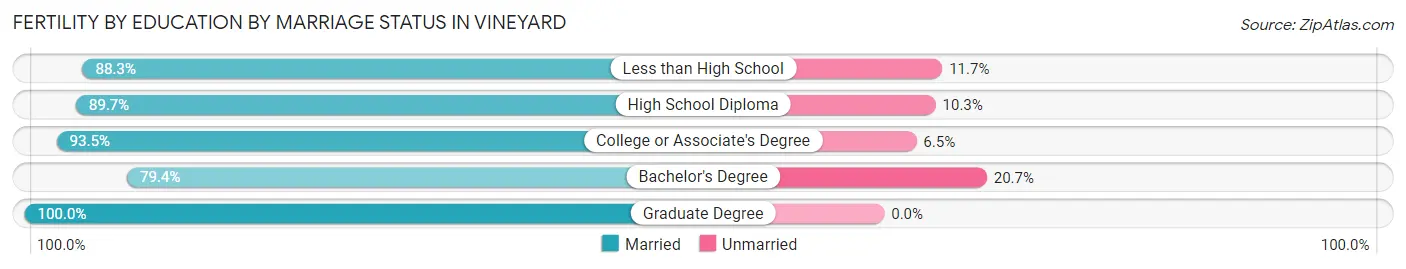
| Educational Attainment | Married | Unmarried |
| Less than High School | 121 (88.3%) | 16 (11.7%) |
| High School Diploma | 78 (89.7%) | 9 (10.3%) |
| College or Associate's Degree | 130 (93.5%) | 9 (6.5%) |
| Bachelor's Degree | 123 (79.3%) | 32 (20.6%) |
| Graduate Degree | 35 (100.0%) | 0 (0.0%) |
| Total | 487 (88.1%) | 66 (11.9%) |
Employment Characteristics in Vineyard
Employment by Class of Employer in Vineyard
Among the 19,060 employed individuals in Vineyard, private company employees (10,669 | 56.0%), state government employees (3,253 | 17.1%), and local government employees (1,888 | 9.9%) make up the most common classes of employment.
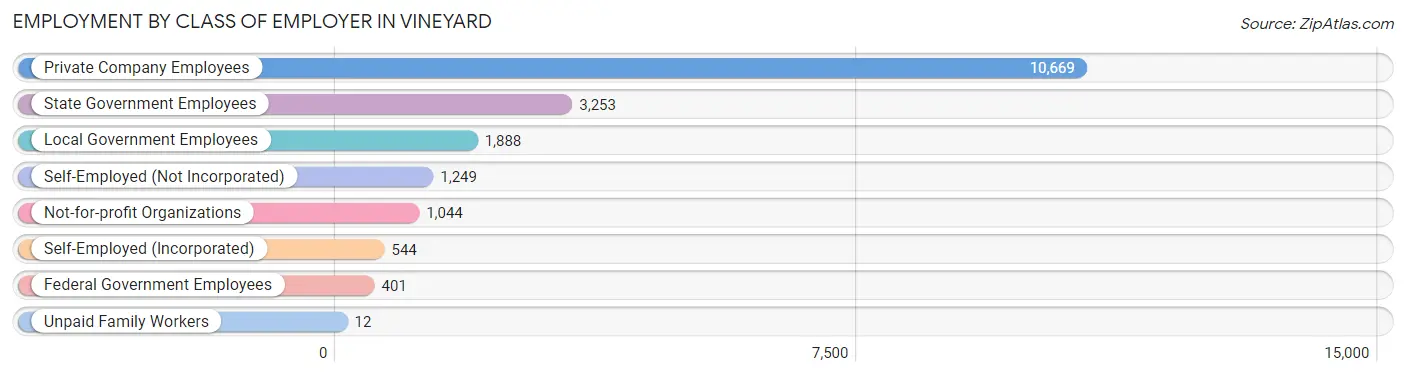
| Employer Class | # Employees | % Employees |
| Private Company Employees | 10,669 | 56.0% |
| Self-Employed (Incorporated) | 544 | 2.9% |
| Self-Employed (Not Incorporated) | 1,249 | 6.6% |
| Not-for-profit Organizations | 1,044 | 5.5% |
| Local Government Employees | 1,888 | 9.9% |
| State Government Employees | 3,253 | 17.1% |
| Federal Government Employees | 401 | 2.1% |
| Unpaid Family Workers | 12 | 0.1% |
| Total | 19,060 | 100.0% |
Employment Status by Age in Vineyard
According to the labor force statistics for Vineyard, out of the total population over 16 years of age (32,916), 62.3% or 20,507 individuals are in the labor force, with 4.8% or 984 of them unemployed. The age group with the highest labor force participation rate is 30 to 34 years, with 85.7% or 2,682 individuals in the labor force. Within the labor force, the 75 years and over age range has the highest percentage of unemployed individuals, with 14.0% or 14 of them being unemployed.
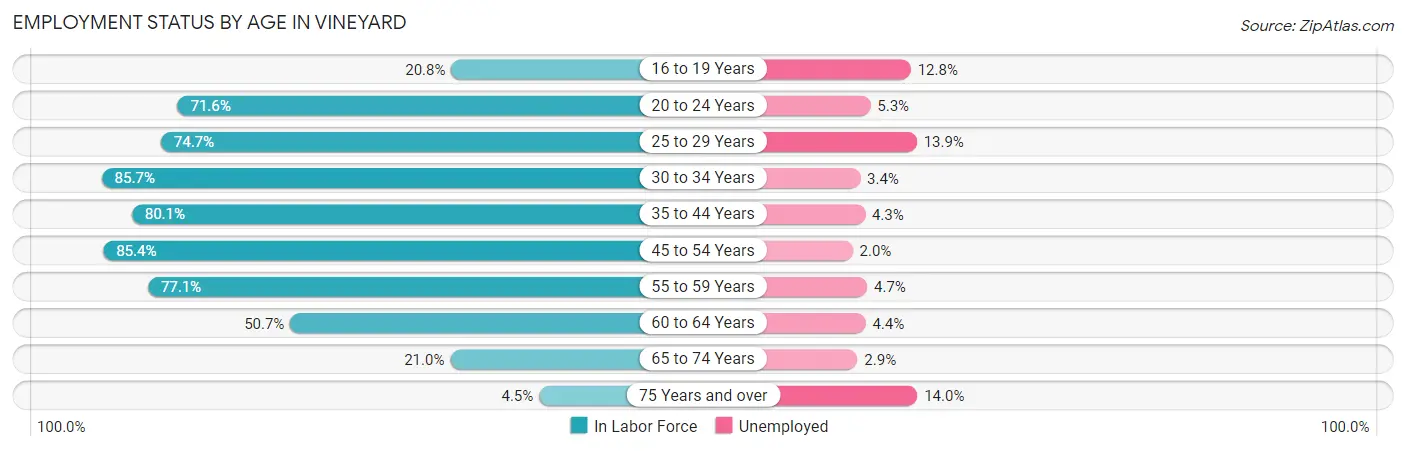
| Age Bracket | In Labor Force | Unemployed |
| 16 to 19 Years | 499 (20.8%) | 64 (12.8%) |
| 20 to 24 Years | 1,772 (71.6%) | 94 (5.3%) |
| 25 to 29 Years | 1,765 (74.7%) | 245 (13.9%) |
| 30 to 34 Years | 2,682 (85.7%) | 91 (3.4%) |
| 35 to 44 Years | 5,110 (80.1%) | 220 (4.3%) |
| 45 to 54 Years | 4,540 (85.4%) | 91 (2.0%) |
| 55 to 59 Years | 2,023 (77.1%) | 95 (4.7%) |
| 60 to 64 Years | 1,292 (50.7%) | 57 (4.4%) |
| 65 to 74 Years | 731 (21.0%) | 21 (2.9%) |
| 75 Years and over | 99 (4.5%) | 14 (14.0%) |
| Total | 20,507 (62.3%) | 984 (4.8%) |
Employment Status by Educational Attainment in Vineyard
According to labor force statistics for Vineyard, 77.9% of individuals (17,420) out of the total population between 25 and 64 years of age (22,362) are in the labor force, with 4.6% or 801 of them being unemployed. The group with the highest labor force participation rate are those with the educational attainment of bachelor's degree or higher, with 89.5% or 6,425 individuals in the labor force. Within the labor force, individuals with high school diploma education have the highest percentage of unemployment, with 10.0% or 363 of them being unemployed.
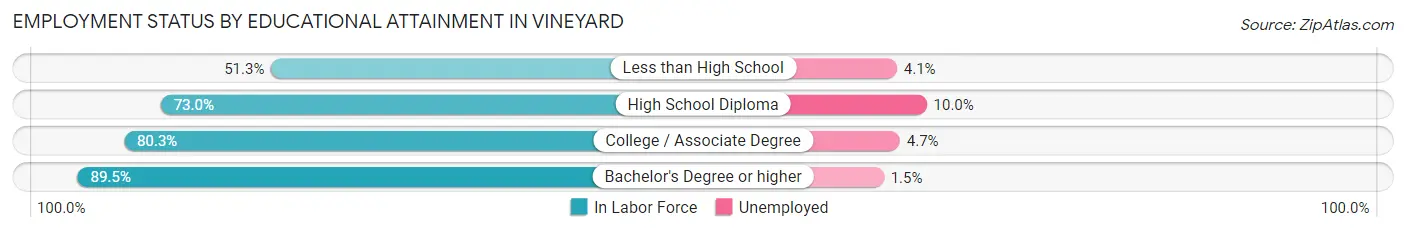
| Educational Attainment | In Labor Force | Unemployed |
| Less than High School | 1,479 (51.3%) | 118 (4.1%) |
| High School Diploma | 3,626 (73.0%) | 497 (10.0%) |
| College / Associate Degree | 5,888 (80.3%) | 345 (4.7%) |
| Bachelor's Degree or higher | 6,425 (89.5%) | 108 (1.5%) |
| Total | 17,420 (77.9%) | 1,029 (4.6%) |
Employment Occupations by Sex in Vineyard
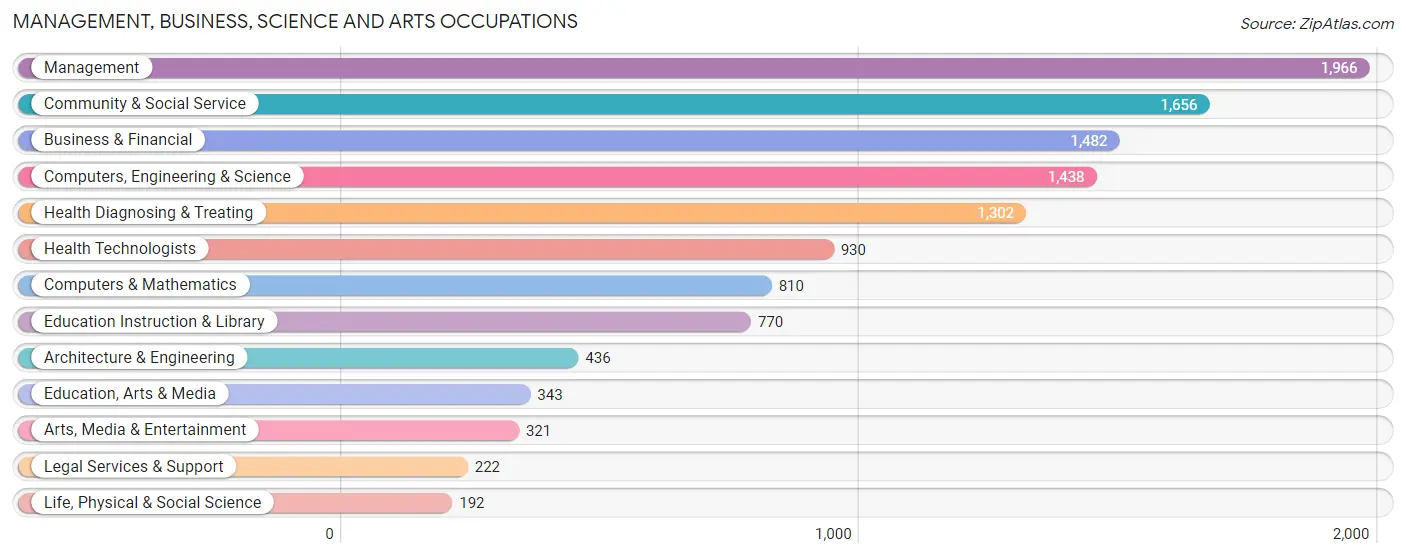
Management, Business, Science and Arts Occupations
The most common Management, Business, Science and Arts occupations in Vineyard are Management (1,966 | 10.1%), Community & Social Service (1,656 | 8.5%), Business & Financial (1,482 | 7.6%), Computers, Engineering & Science (1,438 | 7.4%), and Health Diagnosing & Treating (1,302 | 6.7%).
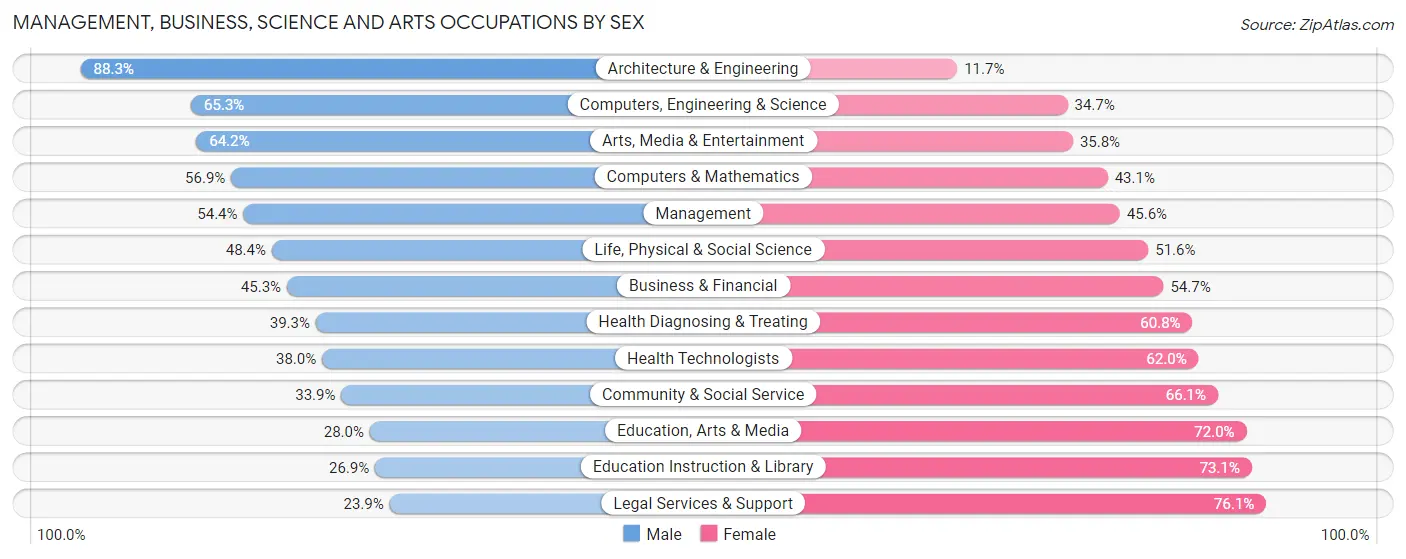
Management, Business, Science and Arts Occupations by Sex
Within the Management, Business, Science and Arts occupations in Vineyard, the most male-oriented occupations are Architecture & Engineering (88.3%), Computers, Engineering & Science (65.3%), and Arts, Media & Entertainment (64.2%), while the most female-oriented occupations are Legal Services & Support (76.1%), Education Instruction & Library (73.1%), and Education, Arts & Media (72.0%).
| Occupation | Male | Female |
| Management | 1,069 (54.4%) | 897 (45.6%) |
| Business & Financial | 671 (45.3%) | 811 (54.7%) |
| Computers, Engineering & Science | 939 (65.3%) | 499 (34.7%) |
| Computers & Mathematics | 461 (56.9%) | 349 (43.1%) |
| Architecture & Engineering | 385 (88.3%) | 51 (11.7%) |
| Life, Physical & Social Science | 93 (48.4%) | 99 (51.6%) |
| Community & Social Service | 562 (33.9%) | 1,094 (66.1%) |
| Education, Arts & Media | 96 (28.0%) | 247 (72.0%) |
| Legal Services & Support | 53 (23.9%) | 169 (76.1%) |
| Education Instruction & Library | 207 (26.9%) | 563 (73.1%) |
| Arts, Media & Entertainment | 206 (64.2%) | 115 (35.8%) |
| Health Diagnosing & Treating | 511 (39.3%) | 791 (60.8%) |
| Health Technologists | 353 (38.0%) | 577 (62.0%) |
| Total (Category) | 3,752 (47.8%) | 4,092 (52.2%) |
| Total (Overall) | 10,230 (52.4%) | 9,295 (47.6%) |
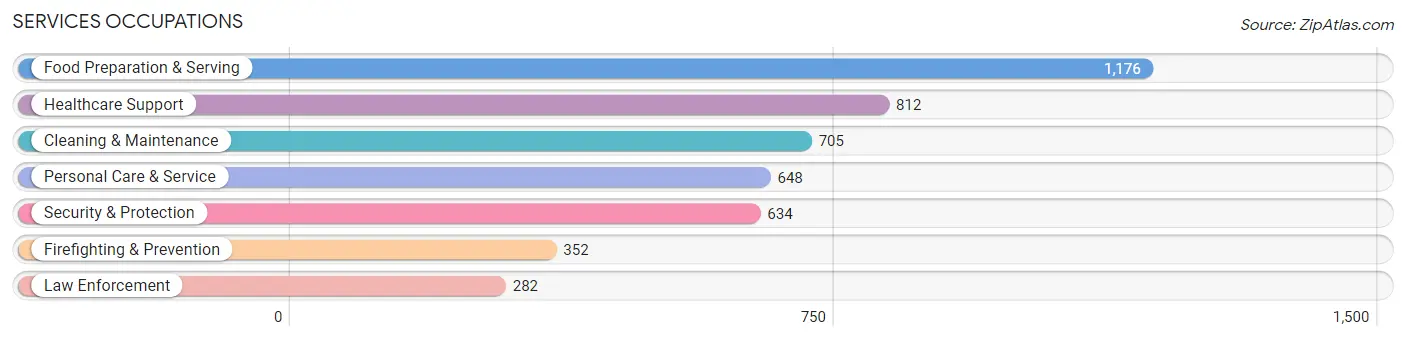
Services Occupations
The most common Services occupations in Vineyard are Food Preparation & Serving (1,176 | 6.0%), Healthcare Support (812 | 4.2%), Cleaning & Maintenance (705 | 3.6%), Personal Care & Service (648 | 3.3%), and Security & Protection (634 | 3.3%).
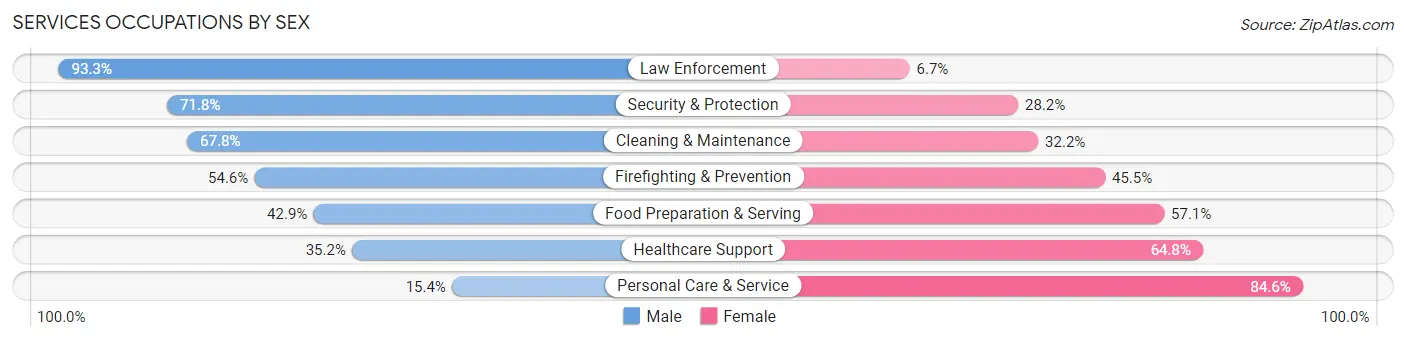
Services Occupations by Sex
Within the Services occupations in Vineyard, the most male-oriented occupations are Law Enforcement (93.3%), Security & Protection (71.8%), and Cleaning & Maintenance (67.8%), while the most female-oriented occupations are Personal Care & Service (84.6%), Healthcare Support (64.8%), and Food Preparation & Serving (57.1%).
| Occupation | Male | Female |
| Healthcare Support | 286 (35.2%) | 526 (64.8%) |
| Security & Protection | 455 (71.8%) | 179 (28.2%) |
| Firefighting & Prevention | 192 (54.5%) | 160 (45.5%) |
| Law Enforcement | 263 (93.3%) | 19 (6.7%) |
| Food Preparation & Serving | 504 (42.9%) | 672 (57.1%) |
| Cleaning & Maintenance | 478 (67.8%) | 227 (32.2%) |
| Personal Care & Service | 100 (15.4%) | 548 (84.6%) |
| Total (Category) | 1,823 (45.9%) | 2,152 (54.1%) |
| Total (Overall) | 10,230 (52.4%) | 9,295 (47.6%) |
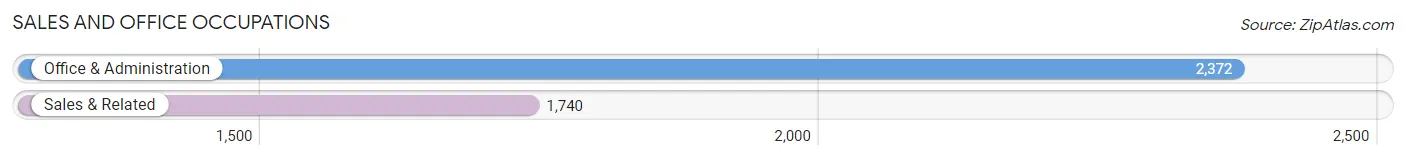
Sales and Office Occupations
The most common Sales and Office occupations in Vineyard are Office & Administration (2,372 | 12.1%), and Sales & Related (1,740 | 8.9%).
Sales and Office Occupations by Sex
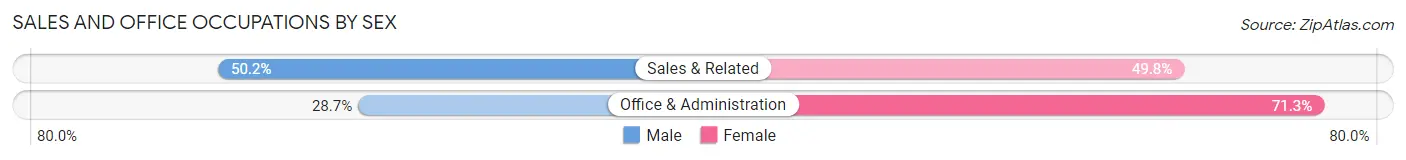
| Occupation | Male | Female |
| Sales & Related | 874 (50.2%) | 866 (49.8%) |
| Office & Administration | 681 (28.7%) | 1,691 (71.3%) |
| Total (Category) | 1,555 (37.8%) | 2,557 (62.2%) |
| Total (Overall) | 10,230 (52.4%) | 9,295 (47.6%) |
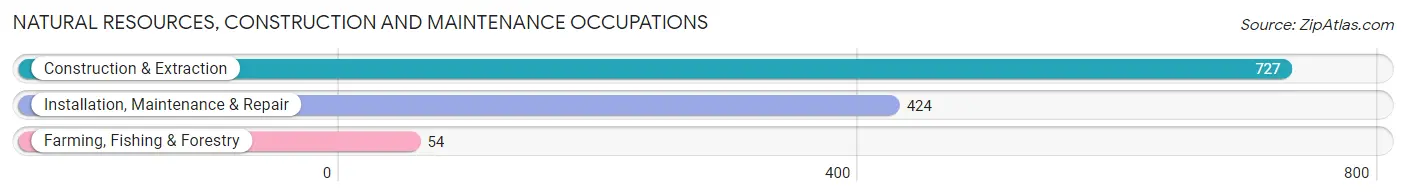
Natural Resources, Construction and Maintenance Occupations
The most common Natural Resources, Construction and Maintenance occupations in Vineyard are Construction & Extraction (727 | 3.7%), Installation, Maintenance & Repair (424 | 2.2%), and Farming, Fishing & Forestry (54 | 0.3%).
Natural Resources, Construction and Maintenance Occupations by Sex
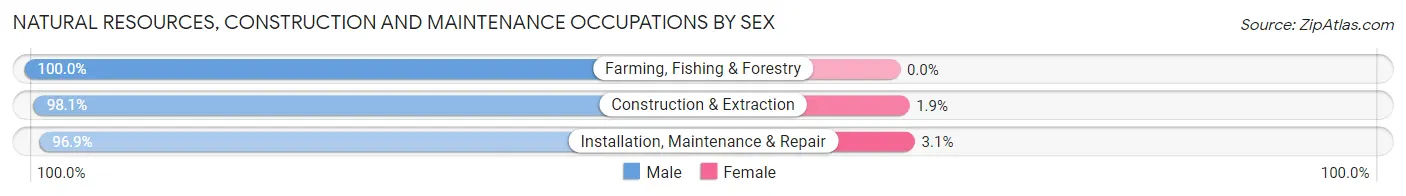
| Occupation | Male | Female |
| Farming, Fishing & Forestry | 54 (100.0%) | 0 (0.0%) |
| Construction & Extraction | 713 (98.1%) | 14 (1.9%) |
| Installation, Maintenance & Repair | 411 (96.9%) | 13 (3.1%) |
| Total (Category) | 1,178 (97.8%) | 27 (2.2%) |
| Total (Overall) | 10,230 (52.4%) | 9,295 (47.6%) |
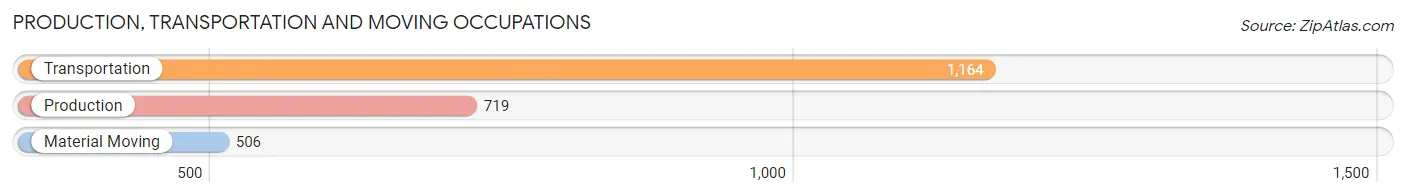
Production, Transportation and Moving Occupations
The most common Production, Transportation and Moving occupations in Vineyard are Transportation (1,164 | 6.0%), Production (719 | 3.7%), and Material Moving (506 | 2.6%).
Production, Transportation and Moving Occupations by Sex
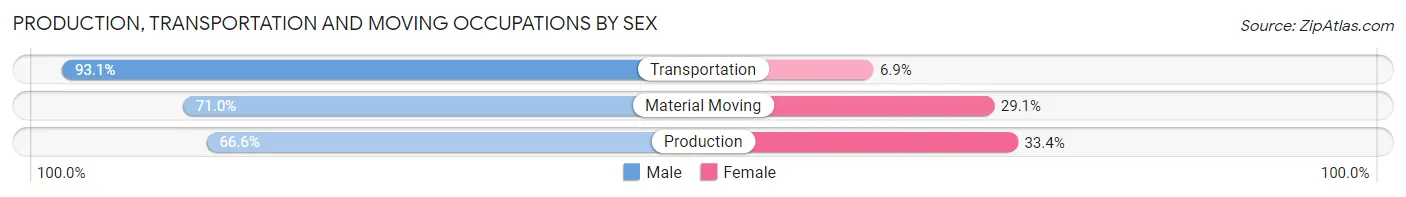
| Occupation | Male | Female |
| Production | 479 (66.6%) | 240 (33.4%) |
| Transportation | 1,084 (93.1%) | 80 (6.9%) |
| Material Moving | 359 (71.0%) | 147 (29.0%) |
| Total (Category) | 1,922 (80.4%) | 467 (19.6%) |
| Total (Overall) | 10,230 (52.4%) | 9,295 (47.6%) |
Employment Industries by Sex in Vineyard
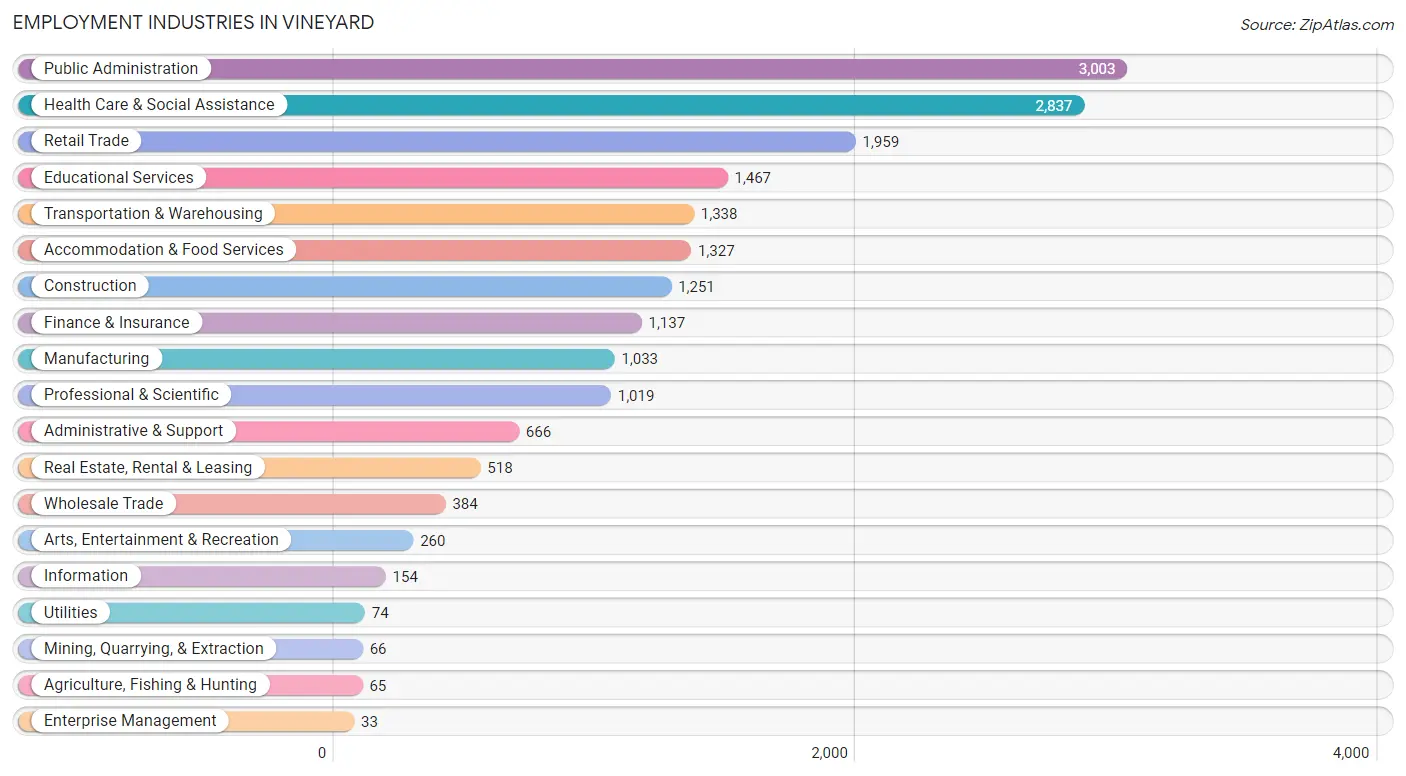
Employment Industries in Vineyard
The major employment industries in Vineyard include Public Administration (3,003 | 15.4%), Health Care & Social Assistance (2,837 | 14.5%), Retail Trade (1,959 | 10.0%), Educational Services (1,467 | 7.5%), and Transportation & Warehousing (1,338 | 6.9%).
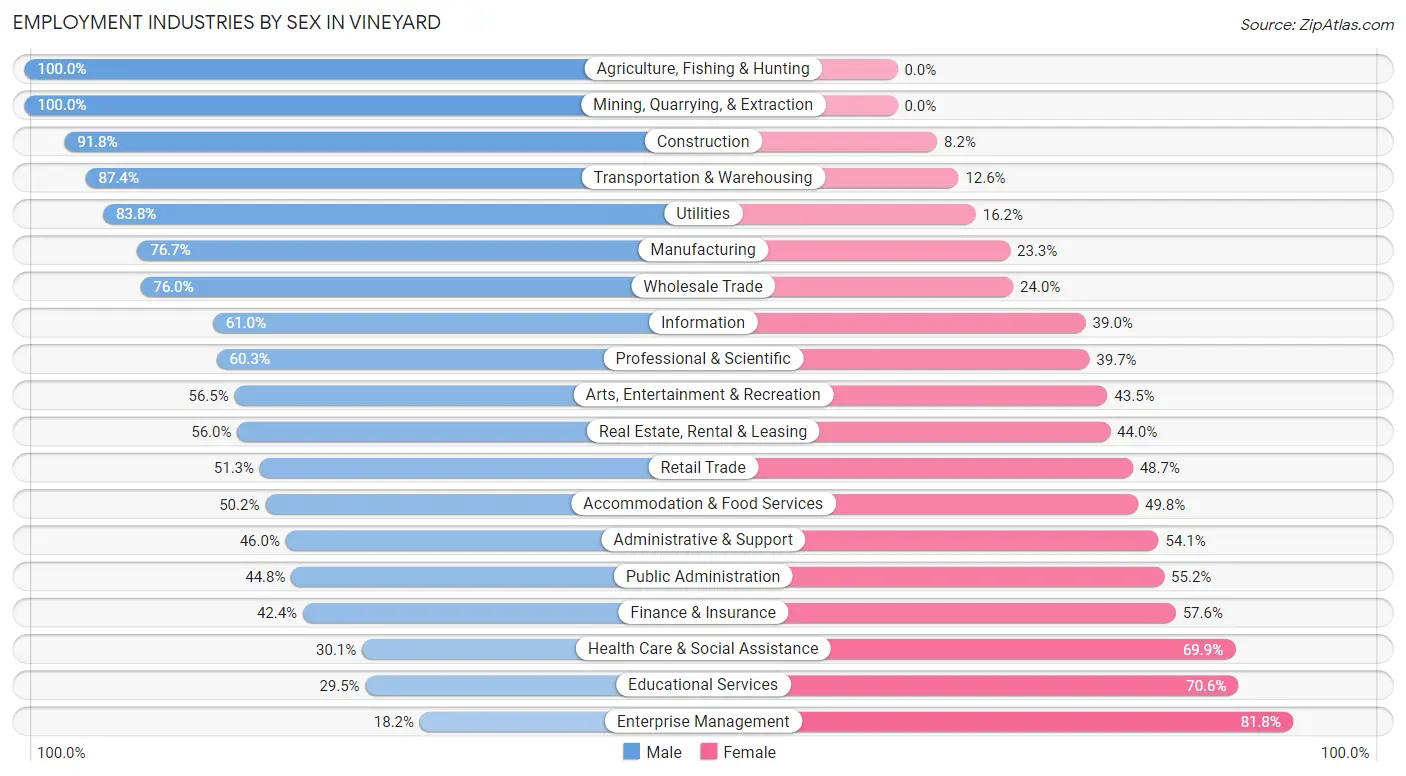
Employment Industries by Sex in Vineyard
The Vineyard industries that see more men than women are Agriculture, Fishing & Hunting (100.0%), Mining, Quarrying, & Extraction (100.0%), and Construction (91.8%), whereas the industries that tend to have a higher number of women are Enterprise Management (81.8%), Educational Services (70.6%), and Health Care & Social Assistance (69.9%).
| Industry | Male | Female |
| Agriculture, Fishing & Hunting | 65 (100.0%) | 0 (0.0%) |
| Mining, Quarrying, & Extraction | 66 (100.0%) | 0 (0.0%) |
| Construction | 1,148 (91.8%) | 103 (8.2%) |
| Manufacturing | 792 (76.7%) | 241 (23.3%) |
| Wholesale Trade | 292 (76.0%) | 92 (24.0%) |
| Retail Trade | 1,005 (51.3%) | 954 (48.7%) |
| Transportation & Warehousing | 1,169 (87.4%) | 169 (12.6%) |
| Utilities | 62 (83.8%) | 12 (16.2%) |
| Information | 94 (61.0%) | 60 (39.0%) |
| Finance & Insurance | 482 (42.4%) | 655 (57.6%) |
| Real Estate, Rental & Leasing | 290 (56.0%) | 228 (44.0%) |
| Professional & Scientific | 614 (60.3%) | 405 (39.7%) |
| Enterprise Management | 6 (18.2%) | 27 (81.8%) |
| Administrative & Support | 306 (46.0%) | 360 (54.0%) |
| Educational Services | 432 (29.4%) | 1,035 (70.6%) |
| Health Care & Social Assistance | 855 (30.1%) | 1,982 (69.9%) |
| Arts, Entertainment & Recreation | 147 (56.5%) | 113 (43.5%) |
| Accommodation & Food Services | 666 (50.2%) | 661 (49.8%) |
| Public Administration | 1,345 (44.8%) | 1,658 (55.2%) |
| Total | 10,230 (52.4%) | 9,295 (47.6%) |
Education in Vineyard
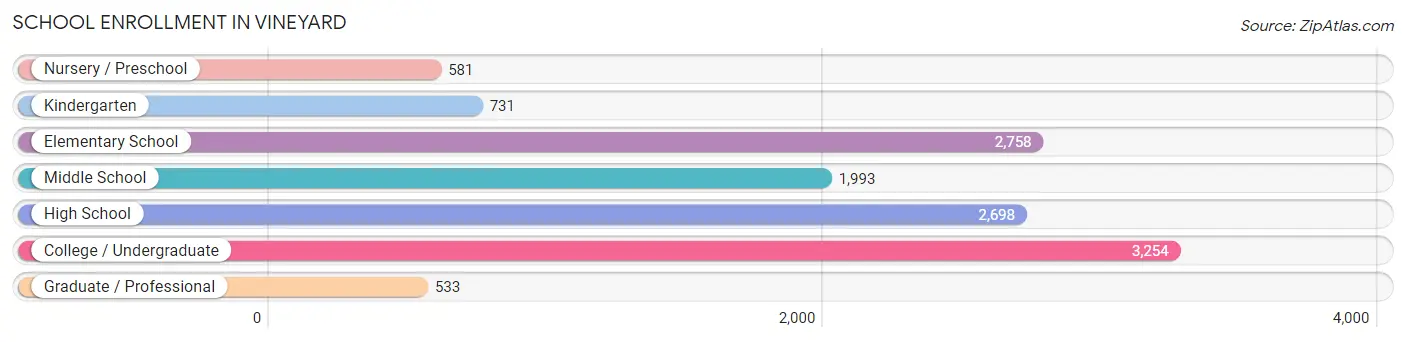
School Enrollment in Vineyard
The most common levels of schooling among the 12,548 students in Vineyard are college / undergraduate (3,254 | 25.9%), elementary school (2,758 | 22.0%), and high school (2,698 | 21.5%).
| School Level | # Students | % Students |
| Nursery / Preschool | 581 | 4.6% |
| Kindergarten | 731 | 5.8% |
| Elementary School | 2,758 | 22.0% |
| Middle School | 1,993 | 15.9% |
| High School | 2,698 | 21.5% |
| College / Undergraduate | 3,254 | 25.9% |
| Graduate / Professional | 533 | 4.3% |
| Total | 12,548 | 100.0% |
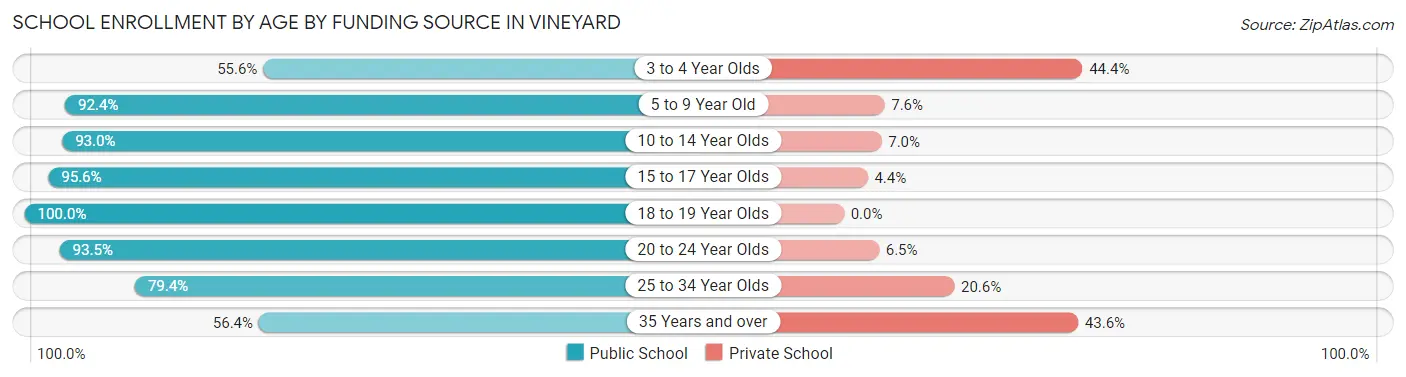
School Enrollment by Age by Funding Source in Vineyard
Out of a total of 12,548 students who are enrolled in schools in Vineyard, 1,518 (12.1%) attend a private institution, while the remaining 11,030 (87.9%) are enrolled in public schools. The age group of 3 to 4 year olds has the highest likelihood of being enrolled in private schools, with 248 (44.4% in the age bracket) enrolled. Conversely, the age group of 18 to 19 year olds has the lowest likelihood of being enrolled in a private school, with 777 (100.0% in the age bracket) attending a public institution.
| Age Bracket | Public School | Private School |
| 3 to 4 Year Olds | 310 (55.6%) | 248 (44.4%) |
| 5 to 9 Year Old | 2,848 (92.4%) | 233 (7.6%) |
| 10 to 14 Year Olds | 2,586 (93.0%) | 195 (7.0%) |
| 15 to 17 Year Olds | 1,962 (95.6%) | 91 (4.4%) |
| 18 to 19 Year Olds | 777 (100.0%) | 0 (0.0%) |
| 20 to 24 Year Olds | 1,214 (93.5%) | 85 (6.5%) |
| 25 to 34 Year Olds | 703 (79.4%) | 182 (20.6%) |
| 35 Years and over | 628 (56.4%) | 486 (43.6%) |
| Total | 11,030 (87.9%) | 1,518 (12.1%) |
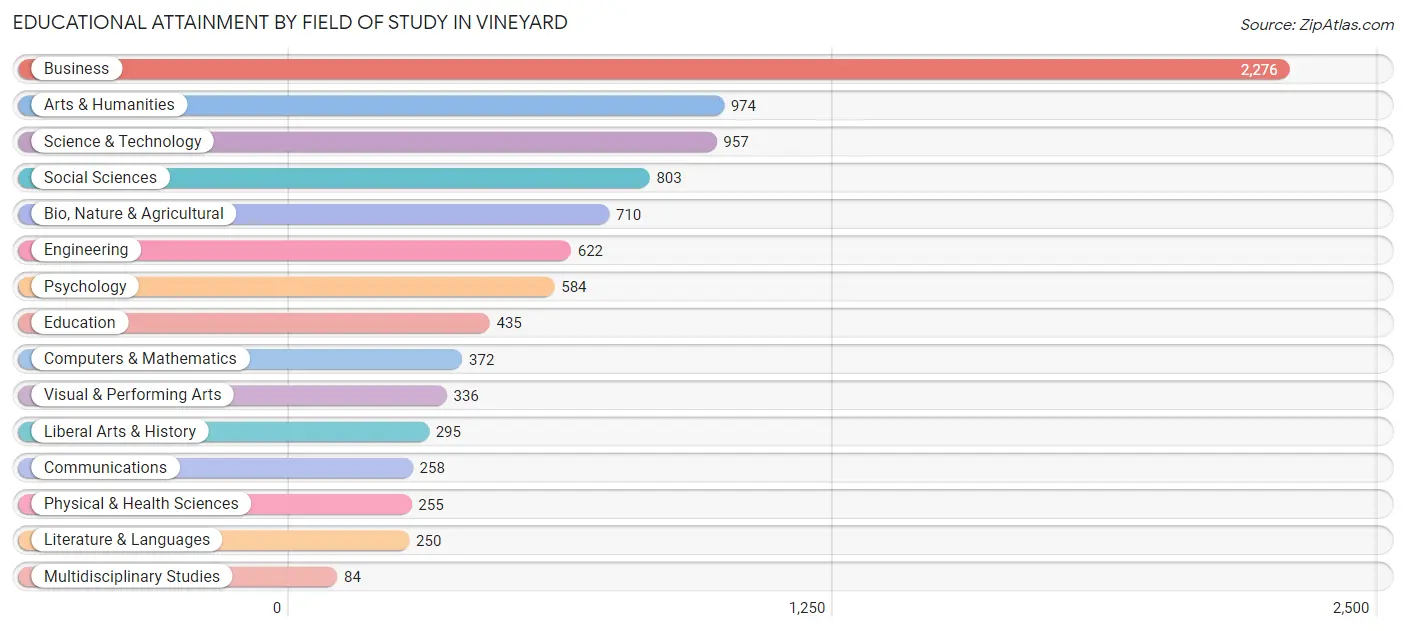
Educational Attainment by Field of Study in Vineyard
Business (2,276 | 24.7%), arts & humanities (974 | 10.6%), science & technology (957 | 10.4%), social sciences (803 | 8.7%), and bio, nature & agricultural (710 | 7.7%) are the most common fields of study among 9,211 individuals in Vineyard who have obtained a bachelor's degree or higher.
| Field of Study | # Graduates | % Graduates |
| Computers & Mathematics | 372 | 4.0% |
| Bio, Nature & Agricultural | 710 | 7.7% |
| Physical & Health Sciences | 255 | 2.8% |
| Psychology | 584 | 6.3% |
| Social Sciences | 803 | 8.7% |
| Engineering | 622 | 6.8% |
| Multidisciplinary Studies | 84 | 0.9% |
| Science & Technology | 957 | 10.4% |
| Business | 2,276 | 24.7% |
| Education | 435 | 4.7% |
| Literature & Languages | 250 | 2.7% |
| Liberal Arts & History | 295 | 3.2% |
| Visual & Performing Arts | 336 | 3.6% |
| Communications | 258 | 2.8% |
| Arts & Humanities | 974 | 10.6% |
| Total | 9,211 | 100.0% |
Transportation & Commute in Vineyard
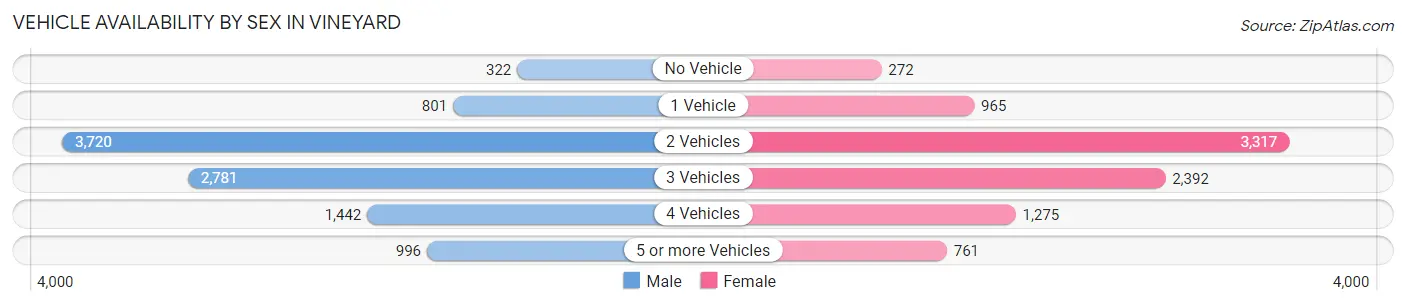
Vehicle Availability by Sex in Vineyard
The most prevalent vehicle ownership categories in Vineyard are males with 2 vehicles (3,720, accounting for 37.0%) and females with 2 vehicles (3,317, making up 41.4%).
| Vehicles Available | Male | Female |
| No Vehicle | 322 (3.2%) | 272 (3.0%) |
| 1 Vehicle | 801 (8.0%) | 965 (10.7%) |
| 2 Vehicles | 3,720 (37.0%) | 3,317 (36.9%) |
| 3 Vehicles | 2,781 (27.6%) | 2,392 (26.6%) |
| 4 Vehicles | 1,442 (14.3%) | 1,275 (14.2%) |
| 5 or more Vehicles | 996 (9.9%) | 761 (8.5%) |
| Total | 10,062 (100.0%) | 8,982 (100.0%) |
Commute Time in Vineyard
The most frequently occuring commute durations in Vineyard are 30 to 34 minutes (3,436 commuters, 20.2%), 15 to 19 minutes (2,324 commuters, 13.7%), and 20 to 24 minutes (2,192 commuters, 12.9%).
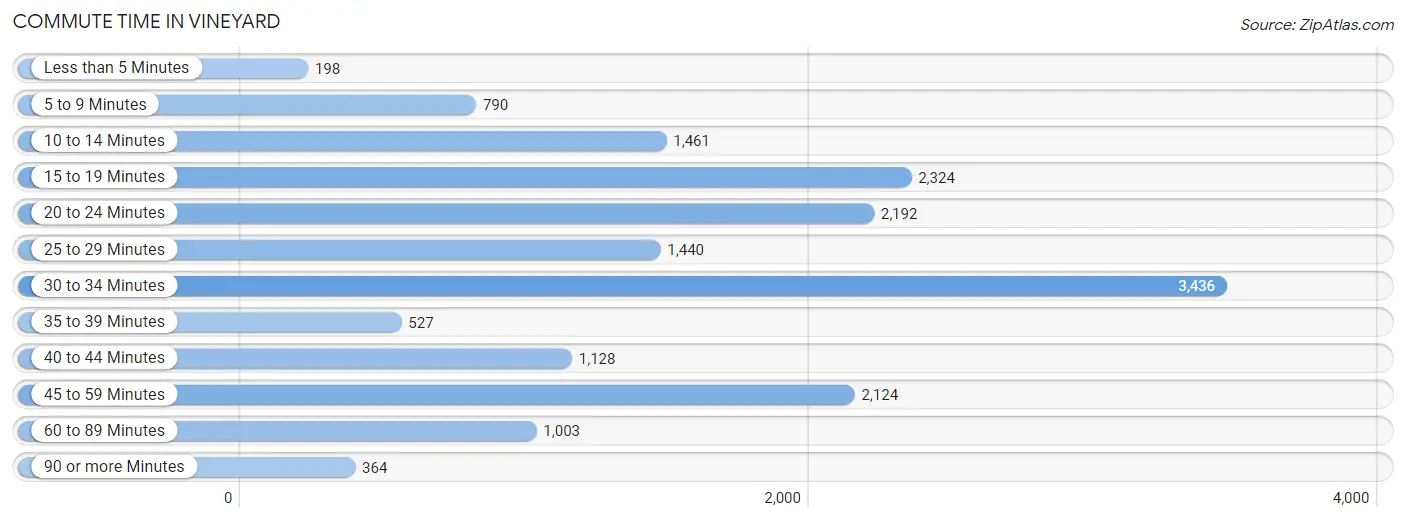
| Commute Time | # Commuters | % Commuters |
| Less than 5 Minutes | 198 | 1.2% |
| 5 to 9 Minutes | 790 | 4.6% |
| 10 to 14 Minutes | 1,461 | 8.6% |
| 15 to 19 Minutes | 2,324 | 13.7% |
| 20 to 24 Minutes | 2,192 | 12.9% |
| 25 to 29 Minutes | 1,440 | 8.5% |
| 30 to 34 Minutes | 3,436 | 20.2% |
| 35 to 39 Minutes | 527 | 3.1% |
| 40 to 44 Minutes | 1,128 | 6.6% |
| 45 to 59 Minutes | 2,124 | 12.5% |
| 60 to 89 Minutes | 1,003 | 5.9% |
| 90 or more Minutes | 364 | 2.1% |
Commute Time by Sex in Vineyard
The most common commute times in Vineyard are 30 to 34 minutes (1,869 commuters, 20.7%) for males and 30 to 34 minutes (1,567 commuters, 19.7%) for females.
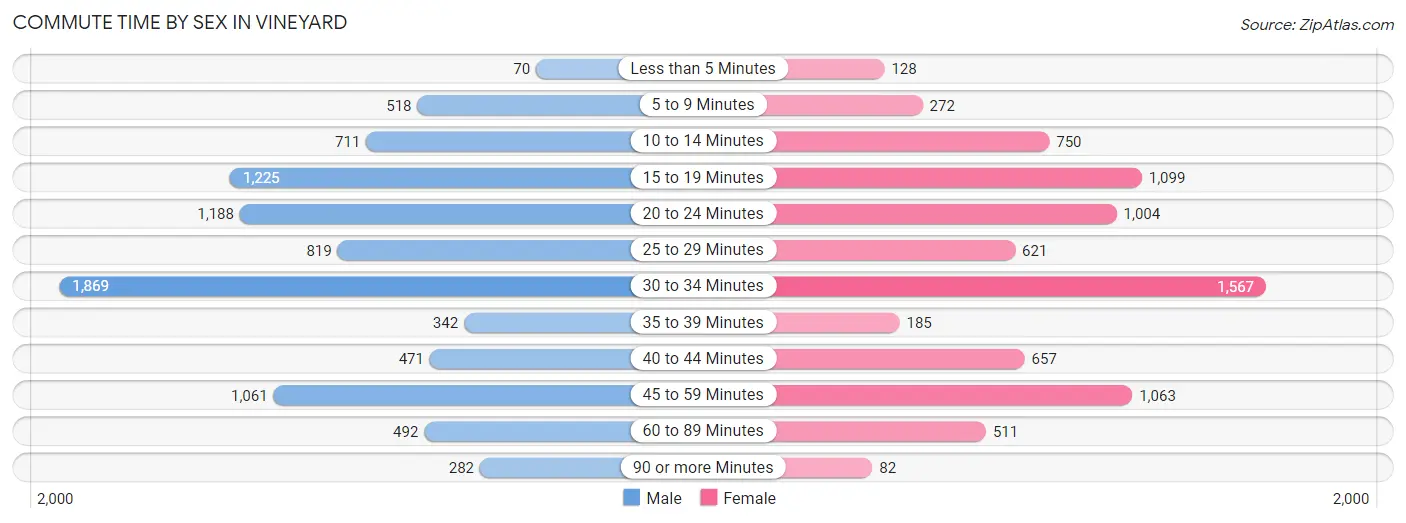
| Commute Time | Male | Female |
| Less than 5 Minutes | 70 (0.8%) | 128 (1.6%) |
| 5 to 9 Minutes | 518 (5.7%) | 272 (3.4%) |
| 10 to 14 Minutes | 711 (7.9%) | 750 (9.5%) |
| 15 to 19 Minutes | 1,225 (13.5%) | 1,099 (13.8%) |
| 20 to 24 Minutes | 1,188 (13.1%) | 1,004 (12.7%) |
| 25 to 29 Minutes | 819 (9.0%) | 621 (7.8%) |
| 30 to 34 Minutes | 1,869 (20.7%) | 1,567 (19.7%) |
| 35 to 39 Minutes | 342 (3.8%) | 185 (2.3%) |
| 40 to 44 Minutes | 471 (5.2%) | 657 (8.3%) |
| 45 to 59 Minutes | 1,061 (11.7%) | 1,063 (13.4%) |
| 60 to 89 Minutes | 492 (5.4%) | 511 (6.4%) |
| 90 or more Minutes | 282 (3.1%) | 82 (1.0%) |
Time of Departure to Work by Sex in Vineyard
The most frequent times of departure to work in Vineyard are 12:00 AM to 4:59 AM (1,096, 12.1%) for males and 7:00 AM to 7:29 AM (1,322, 16.7%) for females.
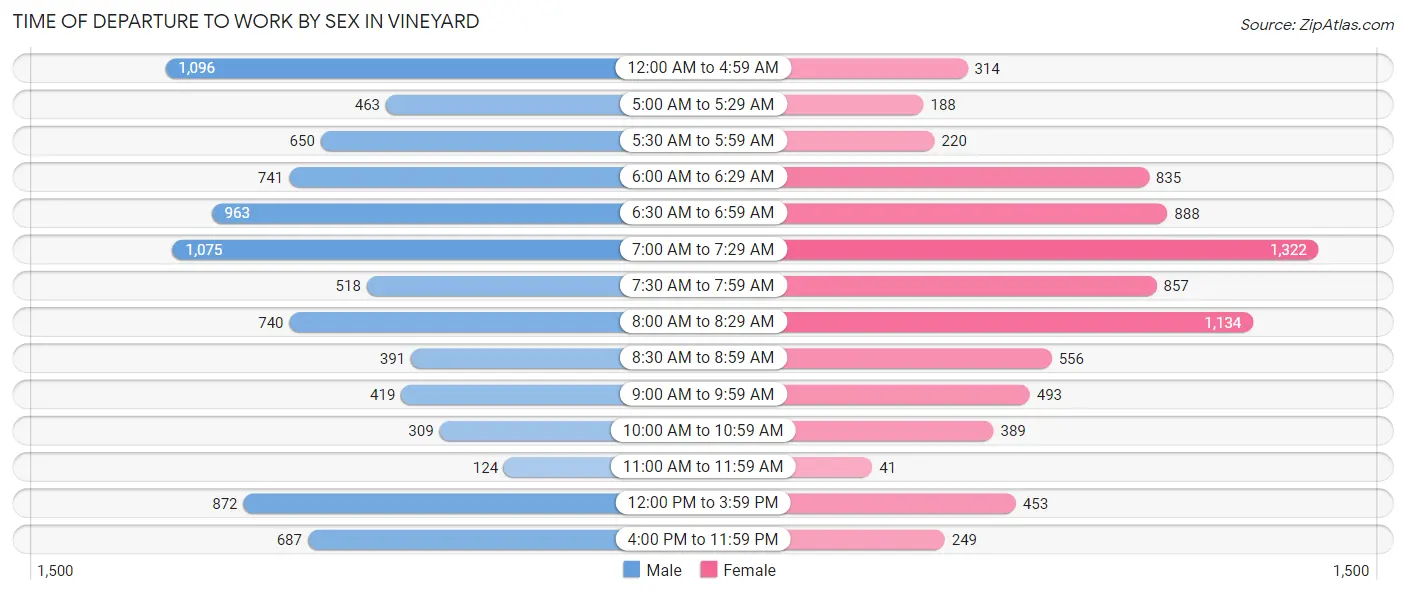
| Time of Departure | Male | Female |
| 12:00 AM to 4:59 AM | 1,096 (12.1%) | 314 (4.0%) |
| 5:00 AM to 5:29 AM | 463 (5.1%) | 188 (2.4%) |
| 5:30 AM to 5:59 AM | 650 (7.2%) | 220 (2.8%) |
| 6:00 AM to 6:29 AM | 741 (8.2%) | 835 (10.5%) |
| 6:30 AM to 6:59 AM | 963 (10.6%) | 888 (11.2%) |
| 7:00 AM to 7:29 AM | 1,075 (11.9%) | 1,322 (16.7%) |
| 7:30 AM to 7:59 AM | 518 (5.7%) | 857 (10.8%) |
| 8:00 AM to 8:29 AM | 740 (8.2%) | 1,134 (14.3%) |
| 8:30 AM to 8:59 AM | 391 (4.3%) | 556 (7.0%) |
| 9:00 AM to 9:59 AM | 419 (4.6%) | 493 (6.2%) |
| 10:00 AM to 10:59 AM | 309 (3.4%) | 389 (4.9%) |
| 11:00 AM to 11:59 AM | 124 (1.4%) | 41 (0.5%) |
| 12:00 PM to 3:59 PM | 872 (9.6%) | 453 (5.7%) |
| 4:00 PM to 11:59 PM | 687 (7.6%) | 249 (3.1%) |
| Total | 9,048 (100.0%) | 7,939 (100.0%) |
Housing Occupancy in Vineyard
Occupancy by Ownership in Vineyard
Of the total 12,484 dwellings in Vineyard, owner-occupied units account for 9,685 (77.6%), while renter-occupied units make up 2,799 (22.4%).
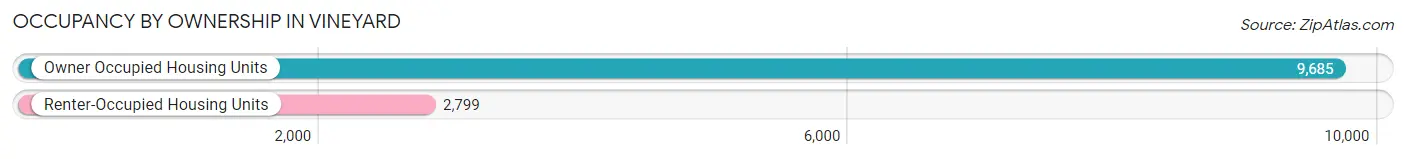
| Occupancy | # Housing Units | % Housing Units |
| Owner Occupied Housing Units | 9,685 | 77.6% |
| Renter-Occupied Housing Units | 2,799 | 22.4% |
| Total Occupied Housing Units | 12,484 | 100.0% |
Occupancy by Household Size in Vineyard
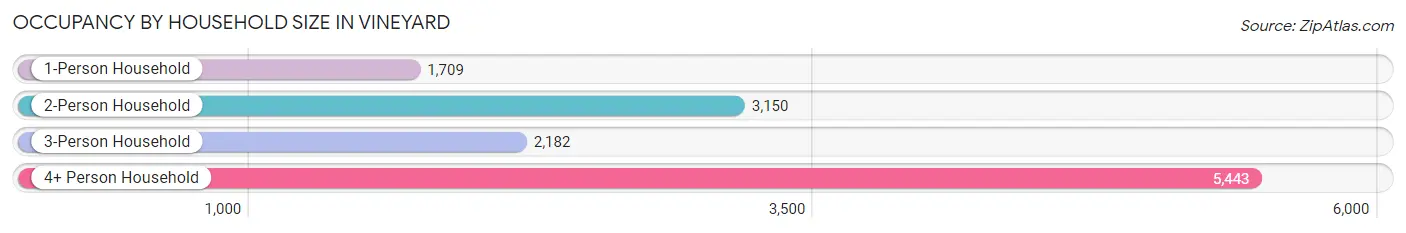
| Household Size | # Housing Units | % Housing Units |
| 1-Person Household | 1,709 | 13.7% |
| 2-Person Household | 3,150 | 25.2% |
| 3-Person Household | 2,182 | 17.5% |
| 4+ Person Household | 5,443 | 43.6% |
| Total Housing Units | 12,484 | 100.0% |
Occupancy by Ownership by Household Size in Vineyard
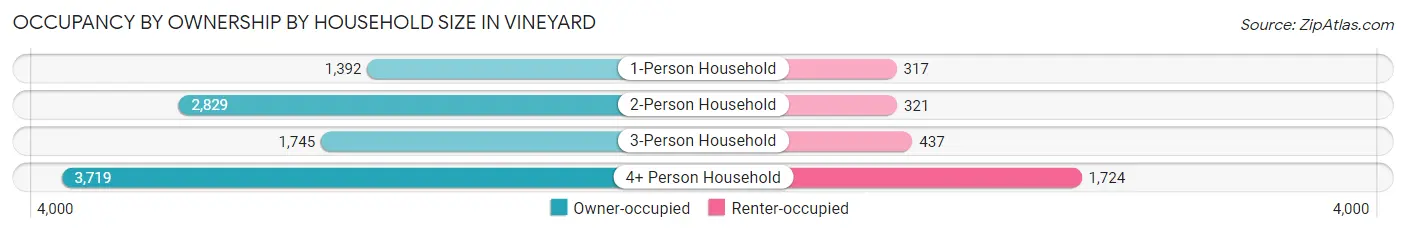
| Household Size | Owner-occupied | Renter-occupied |
| 1-Person Household | 1,392 (81.5%) | 317 (18.5%) |
| 2-Person Household | 2,829 (89.8%) | 321 (10.2%) |
| 3-Person Household | 1,745 (80.0%) | 437 (20.0%) |
| 4+ Person Household | 3,719 (68.3%) | 1,724 (31.7%) |
| Total Housing Units | 9,685 (77.6%) | 2,799 (22.4%) |
Occupancy by Educational Attainment in Vineyard
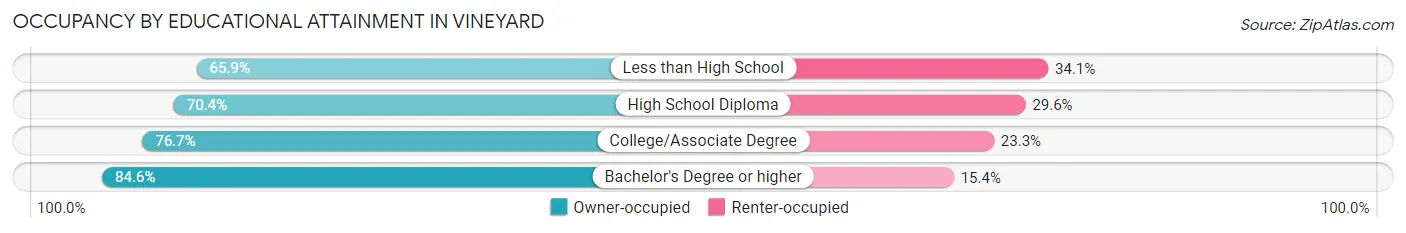
| Household Size | Owner-occupied | Renter-occupied |
| Less than High School | 700 (65.9%) | 362 (34.1%) |
| High School Diploma | 1,401 (70.4%) | 589 (29.6%) |
| College/Associate Degree | 3,826 (76.7%) | 1,165 (23.3%) |
| Bachelor's Degree or higher | 3,758 (84.6%) | 683 (15.4%) |
Occupancy by Age of Householder in Vineyard
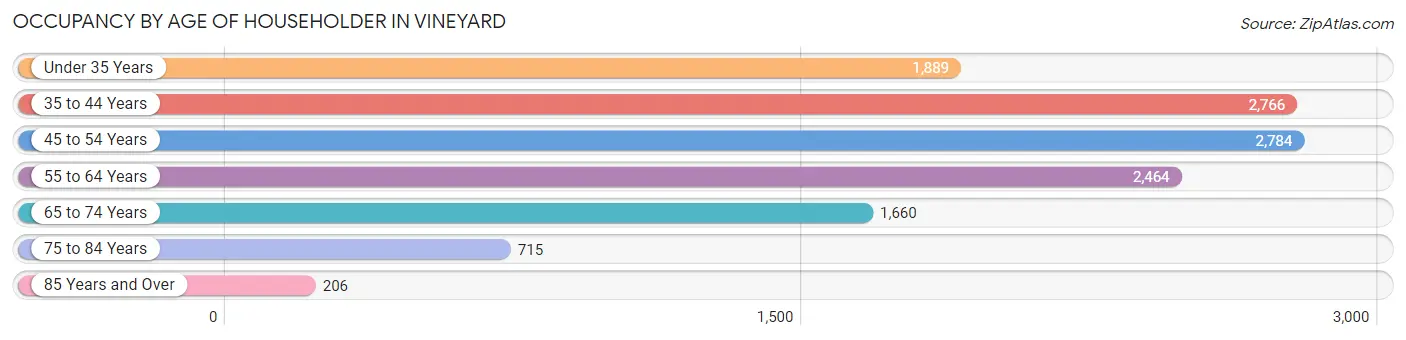
| Age Bracket | # Households | % Households |
| Under 35 Years | 1,889 | 15.1% |
| 35 to 44 Years | 2,766 | 22.2% |
| 45 to 54 Years | 2,784 | 22.3% |
| 55 to 64 Years | 2,464 | 19.7% |
| 65 to 74 Years | 1,660 | 13.3% |
| 75 to 84 Years | 715 | 5.7% |
| 85 Years and Over | 206 | 1.7% |
| Total | 12,484 | 100.0% |
Housing Finances in Vineyard
Median Income by Occupancy in Vineyard
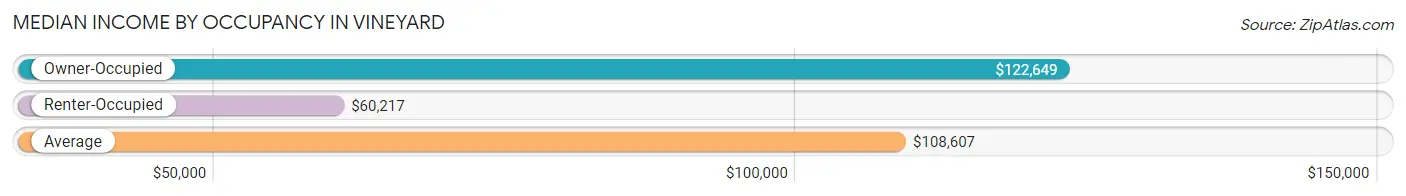
| Occupancy Type | # Households | Median Income |
| Owner-Occupied | 9,685 (77.6%) | $122,649 |
| Renter-Occupied | 2,799 (22.4%) | $60,217 |
| Average | 12,484 (100.0%) | $108,607 |
Occupancy by Householder Income Bracket in Vineyard
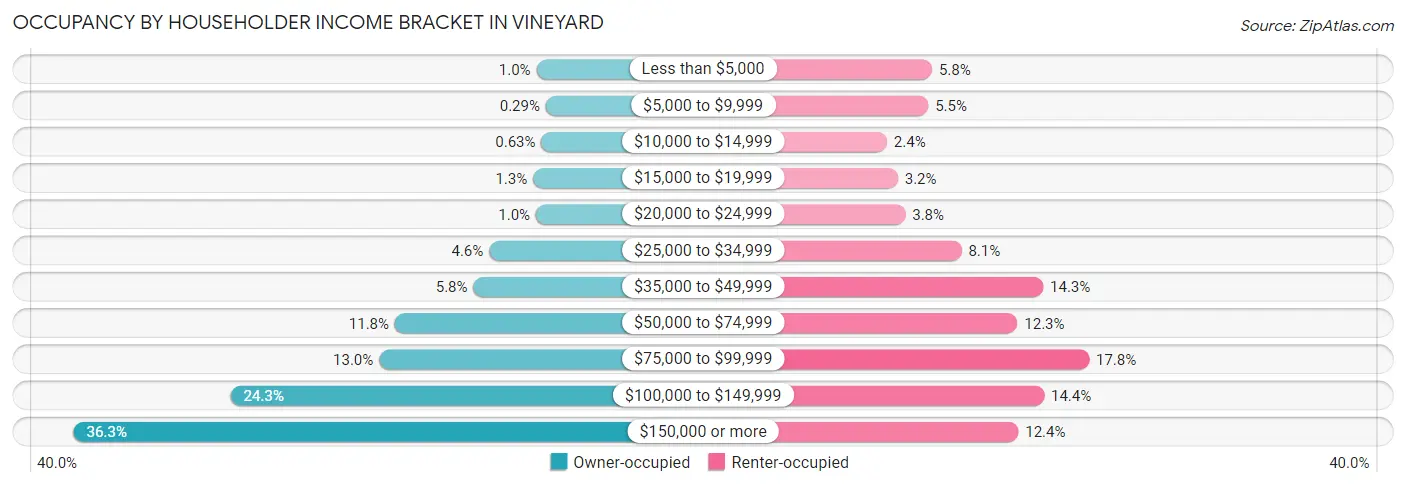
| Income Bracket | Owner-occupied | Renter-occupied |
| Less than $5,000 | 97 (1.0%) | 163 (5.8%) |
| $5,000 to $9,999 | 28 (0.3%) | 155 (5.5%) |
| $10,000 to $14,999 | 61 (0.6%) | 67 (2.4%) |
| $15,000 to $19,999 | 122 (1.3%) | 90 (3.2%) |
| $20,000 to $24,999 | 101 (1.0%) | 106 (3.8%) |
| $25,000 to $34,999 | 446 (4.6%) | 226 (8.1%) |
| $35,000 to $49,999 | 563 (5.8%) | 400 (14.3%) |
| $50,000 to $74,999 | 1,142 (11.8%) | 345 (12.3%) |
| $75,000 to $99,999 | 1,258 (13.0%) | 498 (17.8%) |
| $100,000 to $149,999 | 2,354 (24.3%) | 402 (14.4%) |
| $150,000 or more | 3,513 (36.3%) | 347 (12.4%) |
| Total | 9,685 (100.0%) | 2,799 (100.0%) |
Monthly Housing Cost Tiers in Vineyard
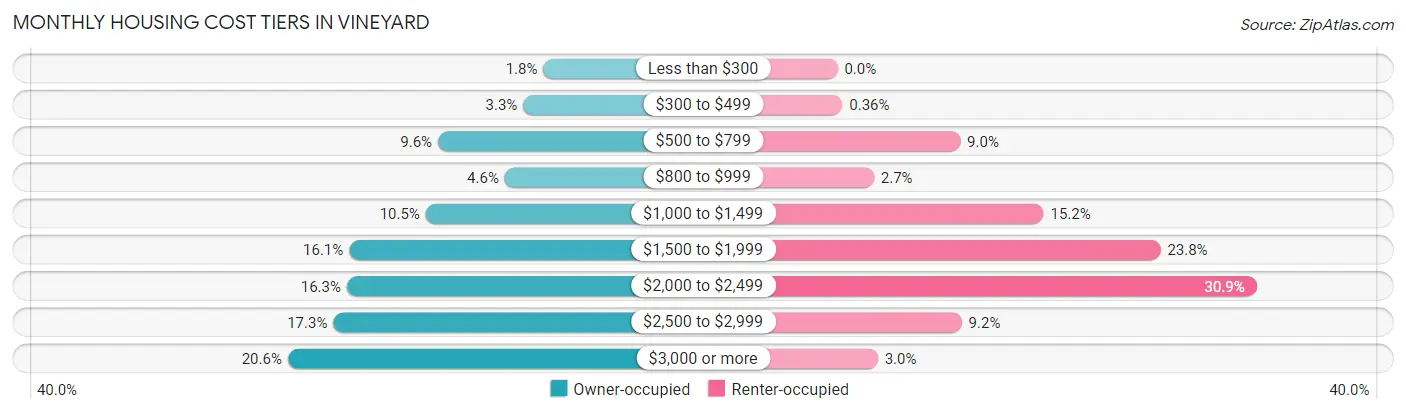
| Monthly Cost | Owner-occupied | Renter-occupied |
| Less than $300 | 174 (1.8%) | 0 (0.0%) |
| $300 to $499 | 318 (3.3%) | 10 (0.4%) |
| $500 to $799 | 926 (9.6%) | 253 (9.0%) |
| $800 to $999 | 449 (4.6%) | 75 (2.7%) |
| $1,000 to $1,499 | 1,013 (10.5%) | 425 (15.2%) |
| $1,500 to $1,999 | 1,559 (16.1%) | 666 (23.8%) |
| $2,000 to $2,499 | 1,576 (16.3%) | 864 (30.9%) |
| $2,500 to $2,999 | 1,673 (17.3%) | 256 (9.1%) |
| $3,000 or more | 1,997 (20.6%) | 83 (3.0%) |
| Total | 9,685 (100.0%) | 2,799 (100.0%) |
Physical Housing Characteristics in Vineyard
Housing Structures in Vineyard
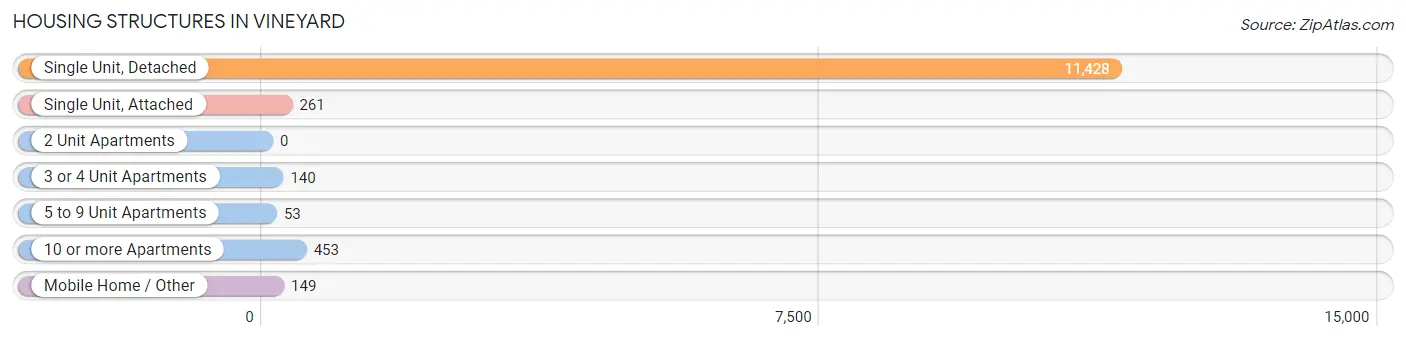
| Structure Type | # Housing Units | % Housing Units |
| Single Unit, Detached | 11,428 | 91.5% |
| Single Unit, Attached | 261 | 2.1% |
| 2 Unit Apartments | 0 | 0.0% |
| 3 or 4 Unit Apartments | 140 | 1.1% |
| 5 to 9 Unit Apartments | 53 | 0.4% |
| 10 or more Apartments | 453 | 3.6% |
| Mobile Home / Other | 149 | 1.2% |
| Total | 12,484 | 100.0% |
Housing Structures by Occupancy in Vineyard
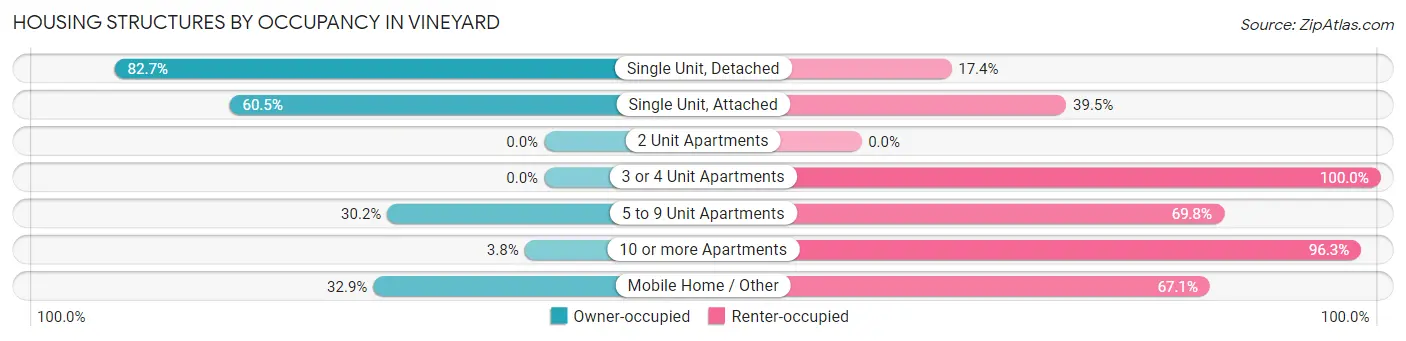
| Structure Type | Owner-occupied | Renter-occupied |
| Single Unit, Detached | 9,445 (82.7%) | 1,983 (17.3%) |
| Single Unit, Attached | 158 (60.5%) | 103 (39.5%) |
| 2 Unit Apartments | 0 (0.0%) | 0 (0.0%) |
| 3 or 4 Unit Apartments | 0 (0.0%) | 140 (100.0%) |
| 5 to 9 Unit Apartments | 16 (30.2%) | 37 (69.8%) |
| 10 or more Apartments | 17 (3.7%) | 436 (96.3%) |
| Mobile Home / Other | 49 (32.9%) | 100 (67.1%) |
| Total | 9,685 (77.6%) | 2,799 (22.4%) |
Housing Structures by Number of Rooms in Vineyard
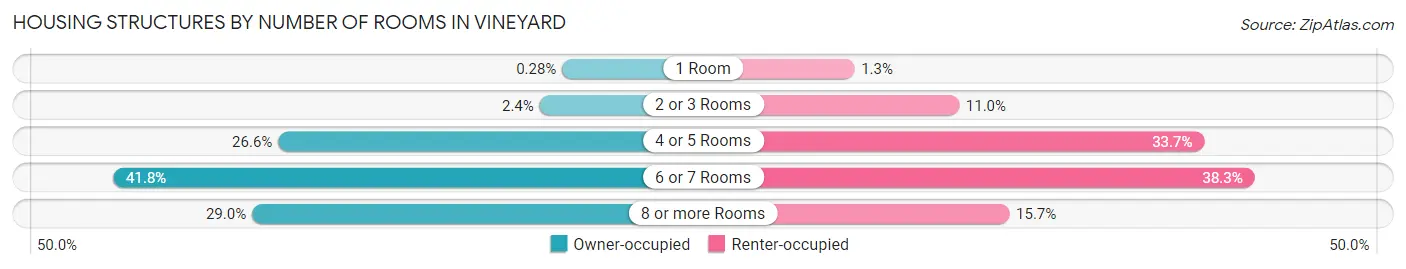
| Number of Rooms | Owner-occupied | Renter-occupied |
| 1 Room | 27 (0.3%) | 37 (1.3%) |
| 2 or 3 Rooms | 230 (2.4%) | 308 (11.0%) |
| 4 or 5 Rooms | 2,571 (26.6%) | 943 (33.7%) |
| 6 or 7 Rooms | 4,051 (41.8%) | 1,073 (38.3%) |
| 8 or more Rooms | 2,806 (29.0%) | 438 (15.7%) |
| Total | 9,685 (100.0%) | 2,799 (100.0%) |
Housing Structure by Heating Type in Vineyard
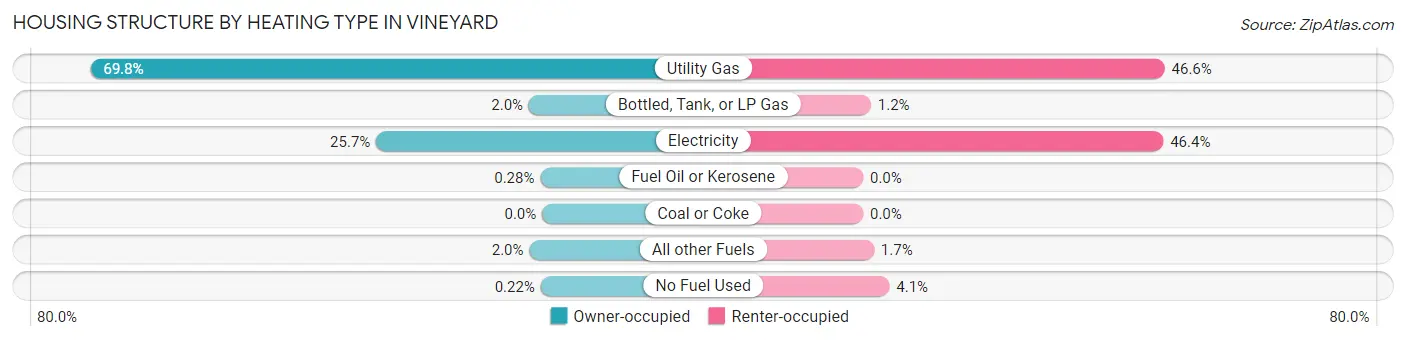
| Heating Type | Owner-occupied | Renter-occupied |
| Utility Gas | 6,764 (69.8%) | 1,305 (46.6%) |
| Bottled, Tank, or LP Gas | 198 (2.0%) | 34 (1.2%) |
| Electricity | 2,484 (25.7%) | 1,299 (46.4%) |
| Fuel Oil or Kerosene | 27 (0.3%) | 0 (0.0%) |
| Coal or Coke | 0 (0.0%) | 0 (0.0%) |
| All other Fuels | 191 (2.0%) | 47 (1.7%) |
| No Fuel Used | 21 (0.2%) | 114 (4.1%) |
| Total | 9,685 (100.0%) | 2,799 (100.0%) |
Household Vehicle Usage in Vineyard
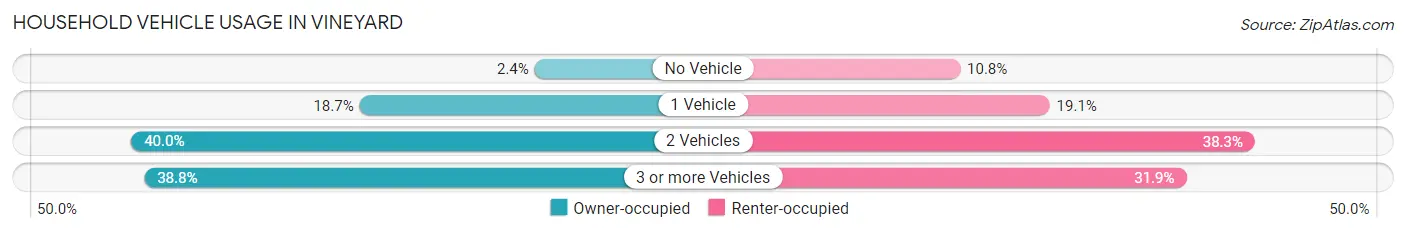
| Vehicles per Household | Owner-occupied | Renter-occupied |
| No Vehicle | 231 (2.4%) | 301 (10.7%) |
| 1 Vehicle | 1,815 (18.7%) | 535 (19.1%) |
| 2 Vehicles | 3,878 (40.0%) | 1,071 (38.3%) |
| 3 or more Vehicles | 3,761 (38.8%) | 892 (31.9%) |
| Total | 9,685 (100.0%) | 2,799 (100.0%) |
Real Estate & Mortgages in Vineyard
Real Estate and Mortgage Overview in Vineyard
| Characteristic | Without Mortgage | With Mortgage |
| Housing Units | 2,083 | 7,602 |
| Median Property Value | $488,400 | $489,600 |
| Median Household Income | $110,563 | $2,876 |
| Monthly Housing Costs | $707 | $1,997 |
| Real Estate Taxes | $3,769 | $290 |
Property Value by Mortgage Status in Vineyard
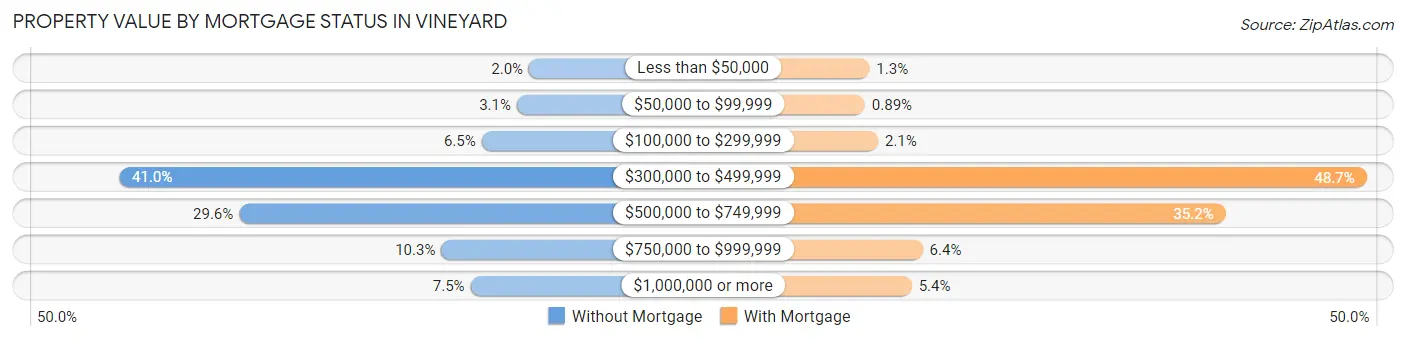
| Property Value | Without Mortgage | With Mortgage |
| Less than $50,000 | 41 (2.0%) | 100 (1.3%) |
| $50,000 to $99,999 | 65 (3.1%) | 68 (0.9%) |
| $100,000 to $299,999 | 135 (6.5%) | 163 (2.1%) |
| $300,000 to $499,999 | 854 (41.0%) | 3,700 (48.7%) |
| $500,000 to $749,999 | 616 (29.6%) | 2,678 (35.2%) |
| $750,000 to $999,999 | 215 (10.3%) | 486 (6.4%) |
| $1,000,000 or more | 157 (7.5%) | 407 (5.3%) |
| Total | 2,083 (100.0%) | 7,602 (100.0%) |
Household Income by Mortgage Status in Vineyard
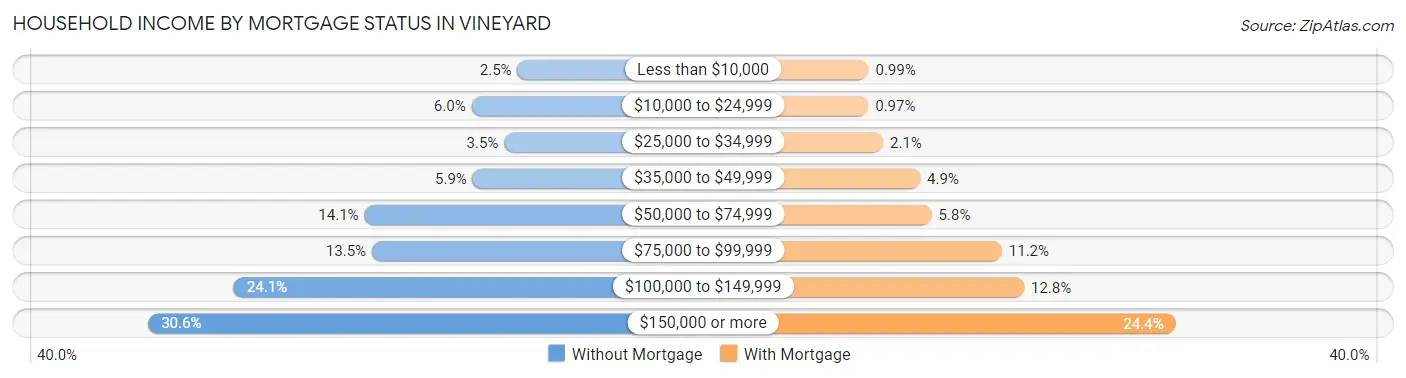
| Household Income | Without Mortgage | With Mortgage |
| Less than $10,000 | 51 (2.5%) | 75 (1.0%) |
| $10,000 to $24,999 | 124 (5.9%) | 74 (1.0%) |
| $25,000 to $34,999 | 72 (3.5%) | 160 (2.1%) |
| $35,000 to $49,999 | 122 (5.9%) | 374 (4.9%) |
| $50,000 to $74,999 | 294 (14.1%) | 441 (5.8%) |
| $75,000 to $99,999 | 282 (13.5%) | 848 (11.2%) |
| $100,000 to $149,999 | 501 (24.0%) | 976 (12.8%) |
| $150,000 or more | 637 (30.6%) | 1,853 (24.4%) |
| Total | 2,083 (100.0%) | 7,602 (100.0%) |
Property Value to Household Income Ratio in Vineyard
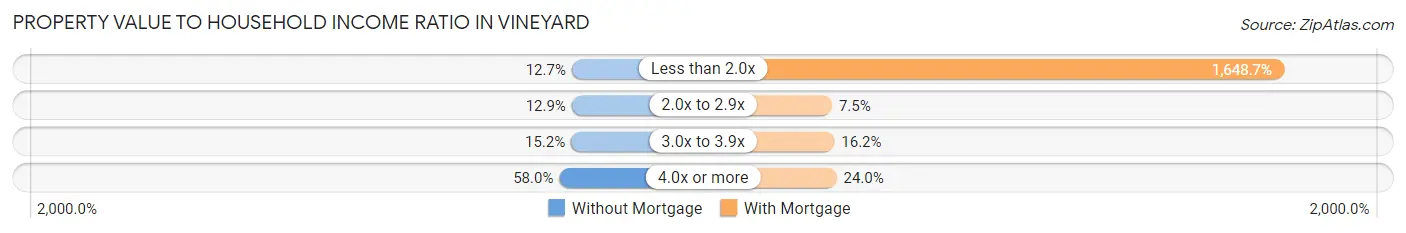
| Value-to-Income Ratio | Without Mortgage | With Mortgage |
| Less than 2.0x | 265 (12.7%) | 125,331 (1,648.7%) |
| 2.0x to 2.9x | 269 (12.9%) | 570 (7.5%) |
| 3.0x to 3.9x | 317 (15.2%) | 1,228 (16.2%) |
| 4.0x or more | 1,209 (58.0%) | 1,823 (24.0%) |
| Total | 2,083 (100.0%) | 7,602 (100.0%) |
Real Estate Taxes by Mortgage Status in Vineyard
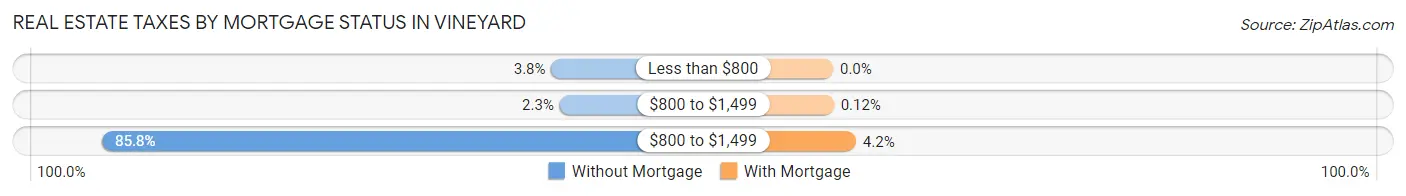
| Property Taxes | Without Mortgage | With Mortgage |
| Less than $800 | 79 (3.8%) | 0 (0.0%) |
| $800 to $1,499 | 47 (2.3%) | 9 (0.1%) |
| $800 to $1,499 | 1,788 (85.8%) | 318 (4.2%) |
| Total | 2,083 (100.0%) | 7,602 (100.0%) |
Health & Disability in Vineyard
Health Insurance Coverage by Age in Vineyard
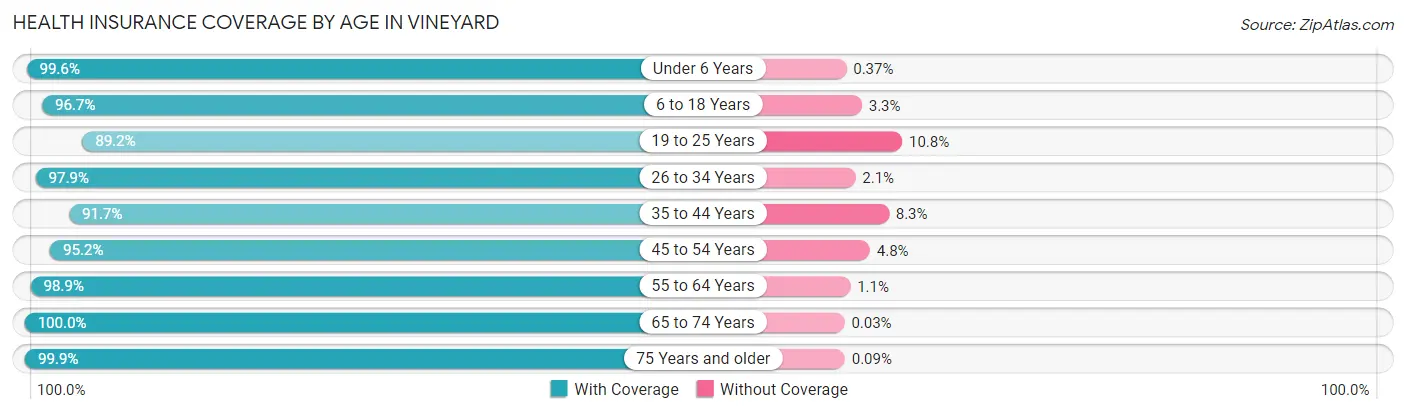
| Age Bracket | With Coverage | Without Coverage |
| Under 6 Years | 3,264 (99.6%) | 12 (0.4%) |
| 6 to 18 Years | 8,210 (96.7%) | 277 (3.3%) |
| 19 to 25 Years | 3,017 (89.2%) | 364 (10.8%) |
| 26 to 34 Years | 4,845 (97.9%) | 102 (2.1%) |
| 35 to 44 Years | 5,849 (91.7%) | 529 (8.3%) |
| 45 to 54 Years | 5,062 (95.2%) | 253 (4.8%) |
| 55 to 64 Years | 5,114 (98.9%) | 57 (1.1%) |
| 65 to 74 Years | 3,478 (100.0%) | 1 (0.0%) |
| 75 Years and older | 2,201 (99.9%) | 2 (0.1%) |
| Total | 41,040 (96.3%) | 1,597 (3.7%) |
Health Insurance Coverage by Citizenship Status in Vineyard
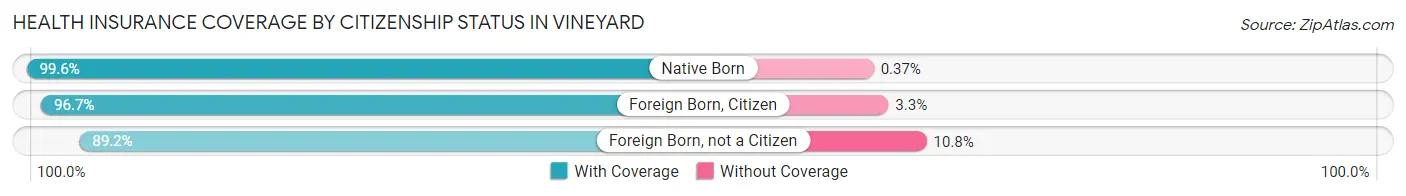
| Citizenship Status | With Coverage | Without Coverage |
| Native Born | 3,264 (99.6%) | 12 (0.4%) |
| Foreign Born, Citizen | 8,210 (96.7%) | 277 (3.3%) |
| Foreign Born, not a Citizen | 3,017 (89.2%) | 364 (10.8%) |
Health Insurance Coverage by Household Income in Vineyard
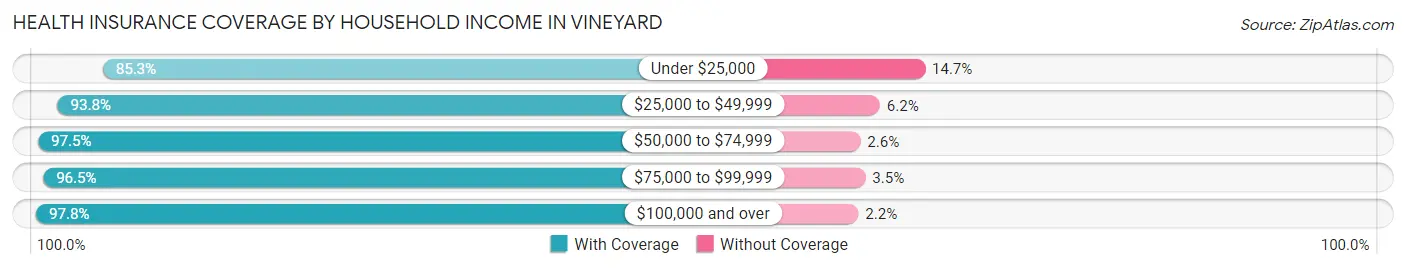
| Household Income | With Coverage | Without Coverage |
| Under $25,000 | 2,216 (85.3%) | 381 (14.7%) |
| $25,000 to $49,999 | 5,011 (93.8%) | 331 (6.2%) |
| $50,000 to $74,999 | 4,250 (97.5%) | 111 (2.5%) |
| $75,000 to $99,999 | 5,443 (96.5%) | 197 (3.5%) |
| $100,000 and over | 23,912 (97.8%) | 531 (2.2%) |
Public vs Private Health Insurance Coverage by Age in Vineyard
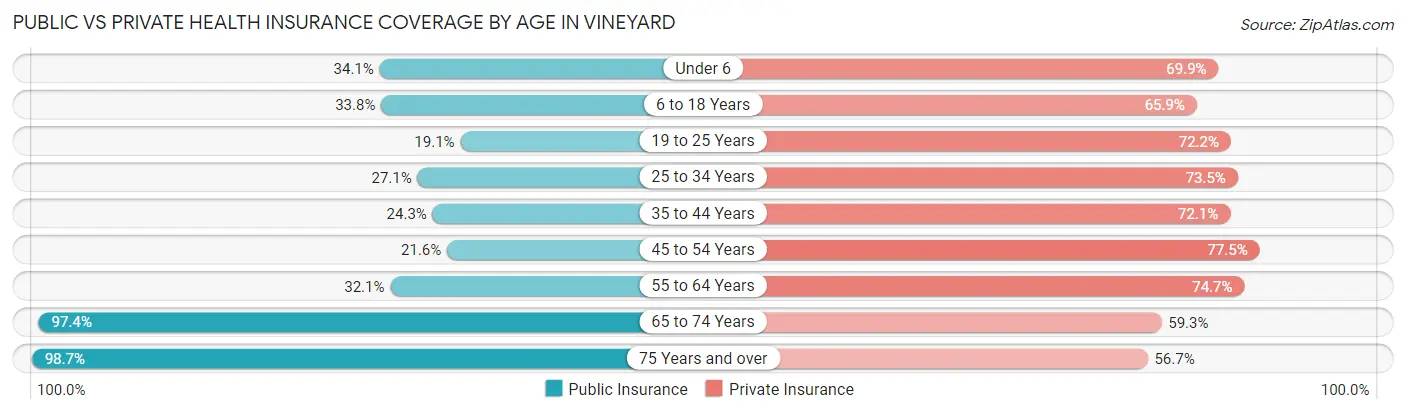
| Age Bracket | Public Insurance | Private Insurance |
| Under 6 | 1,117 (34.1%) | 2,290 (69.9%) |
| 6 to 18 Years | 2,869 (33.8%) | 5,590 (65.9%) |
| 19 to 25 Years | 646 (19.1%) | 2,441 (72.2%) |
| 25 to 34 Years | 1,339 (27.1%) | 3,635 (73.5%) |
| 35 to 44 Years | 1,547 (24.3%) | 4,596 (72.1%) |
| 45 to 54 Years | 1,147 (21.6%) | 4,121 (77.5%) |
| 55 to 64 Years | 1,661 (32.1%) | 3,864 (74.7%) |
| 65 to 74 Years | 3,389 (97.4%) | 2,063 (59.3%) |
| 75 Years and over | 2,174 (98.7%) | 1,250 (56.7%) |
| Total | 15,889 (37.3%) | 29,850 (70.0%) |
Disability Status by Sex by Age in Vineyard
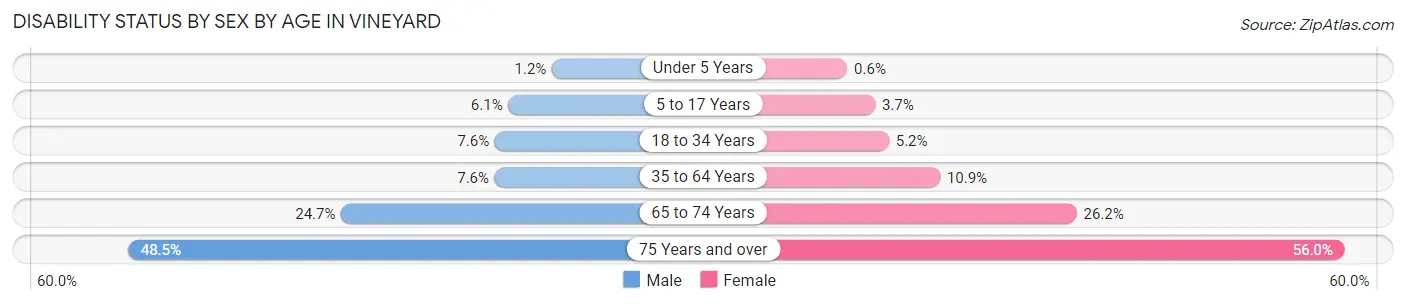
| Age Bracket | Male | Female |
| Under 5 Years | 19 (1.2%) | 8 (0.6%) |
| 5 to 17 Years | 257 (6.1%) | 149 (3.7%) |
| 18 to 34 Years | 375 (7.6%) | 212 (5.2%) |
| 35 to 64 Years | 619 (7.6%) | 957 (10.9%) |
| 65 to 74 Years | 416 (24.7%) | 470 (26.2%) |
| 75 Years and over | 517 (48.5%) | 637 (56.0%) |
Disability Class by Sex by Age in Vineyard
Disability Class: Hearing Difficulty
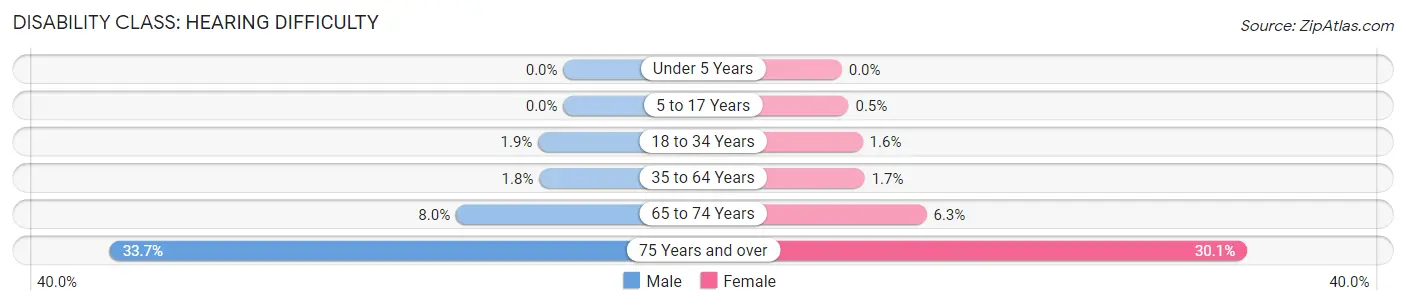
| Age Bracket | Male | Female |
| Under 5 Years | 0 (0.0%) | 0 (0.0%) |
| 5 to 17 Years | 0 (0.0%) | 20 (0.5%) |
| 18 to 34 Years | 92 (1.9%) | 63 (1.5%) |
| 35 to 64 Years | 145 (1.8%) | 149 (1.7%) |
| 65 to 74 Years | 134 (8.0%) | 113 (6.3%) |
| 75 Years and over | 359 (33.7%) | 342 (30.1%) |
Disability Class: Vision Difficulty
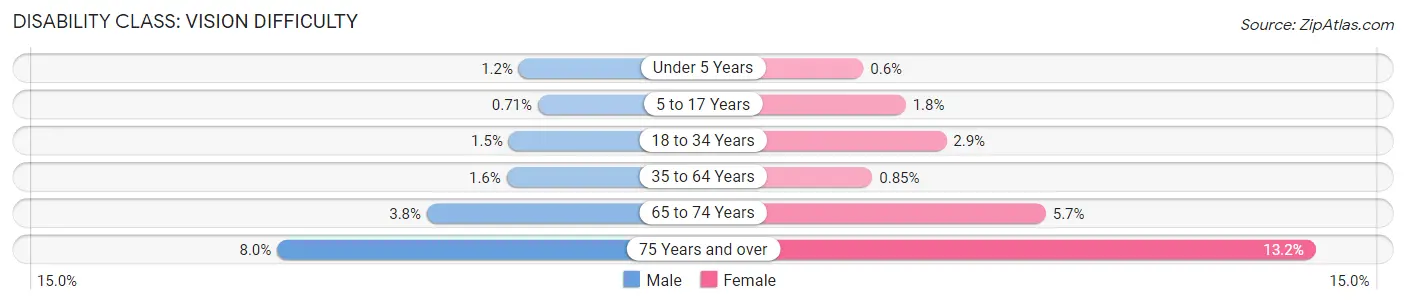
| Age Bracket | Male | Female |
| Under 5 Years | 19 (1.2%) | 8 (0.6%) |
| 5 to 17 Years | 30 (0.7%) | 72 (1.8%) |
| 18 to 34 Years | 75 (1.5%) | 118 (2.9%) |
| 35 to 64 Years | 128 (1.6%) | 74 (0.9%) |
| 65 to 74 Years | 64 (3.8%) | 102 (5.7%) |
| 75 Years and over | 85 (8.0%) | 150 (13.2%) |
Disability Class: Cognitive Difficulty
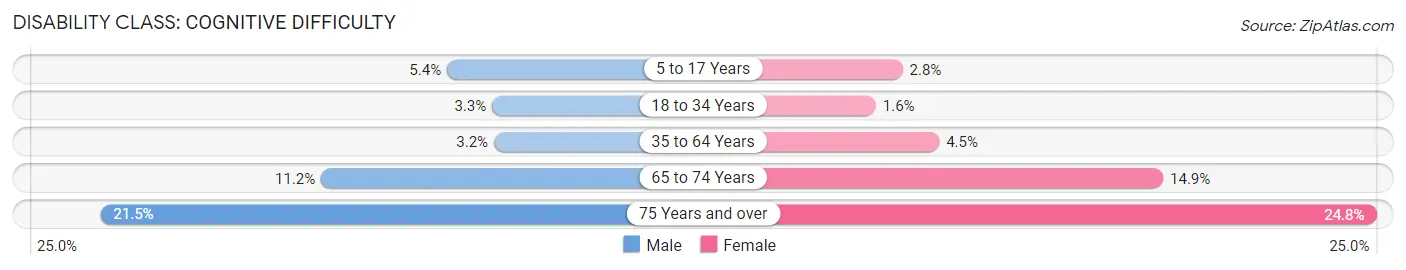
| Age Bracket | Male | Female |
| 5 to 17 Years | 227 (5.4%) | 114 (2.8%) |
| 18 to 34 Years | 163 (3.3%) | 64 (1.6%) |
| 35 to 64 Years | 261 (3.2%) | 396 (4.5%) |
| 65 to 74 Years | 189 (11.2%) | 268 (14.9%) |
| 75 Years and over | 229 (21.5%) | 282 (24.8%) |
Disability Class: Ambulatory Difficulty
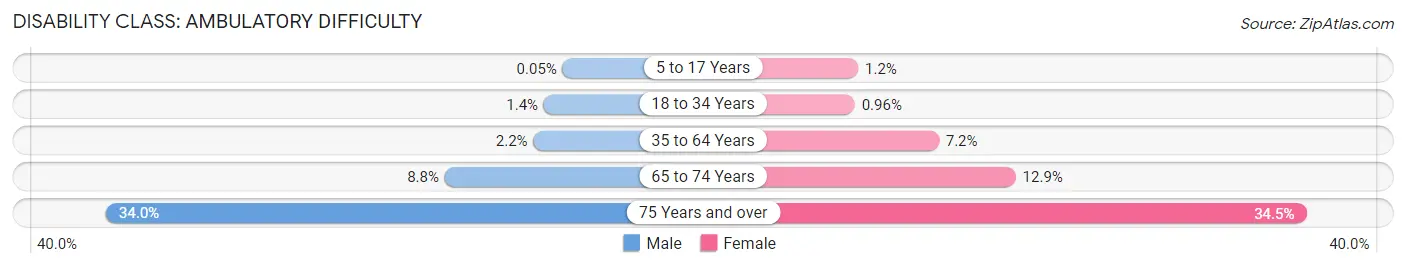
| Age Bracket | Male | Female |
| 5 to 17 Years | 2 (0.1%) | 49 (1.2%) |
| 18 to 34 Years | 71 (1.4%) | 39 (1.0%) |
| 35 to 64 Years | 180 (2.2%) | 630 (7.2%) |
| 65 to 74 Years | 148 (8.8%) | 232 (12.9%) |
| 75 Years and over | 362 (34.0%) | 392 (34.5%) |
Disability Class: Self-Care Difficulty
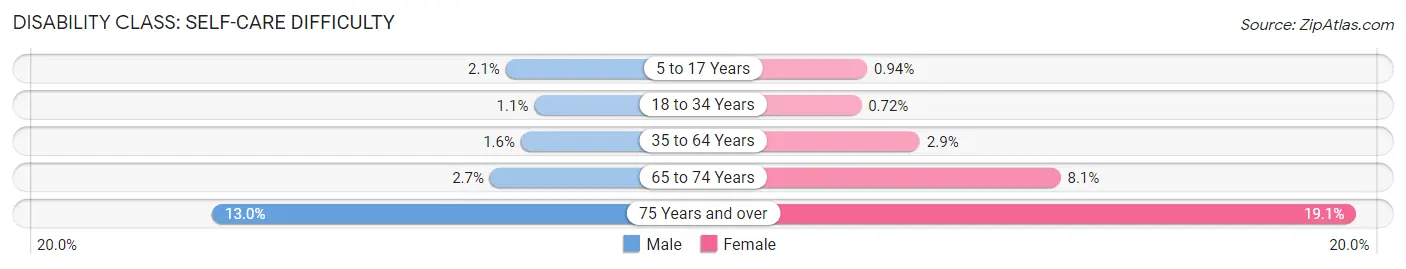
| Age Bracket | Male | Female |
| 5 to 17 Years | 90 (2.1%) | 38 (0.9%) |
| 18 to 34 Years | 53 (1.1%) | 29 (0.7%) |
| 35 to 64 Years | 128 (1.6%) | 254 (2.9%) |
| 65 to 74 Years | 46 (2.7%) | 146 (8.1%) |
| 75 Years and over | 139 (13.0%) | 217 (19.1%) |
Technology Access in Vineyard
Computing Device Access in Vineyard
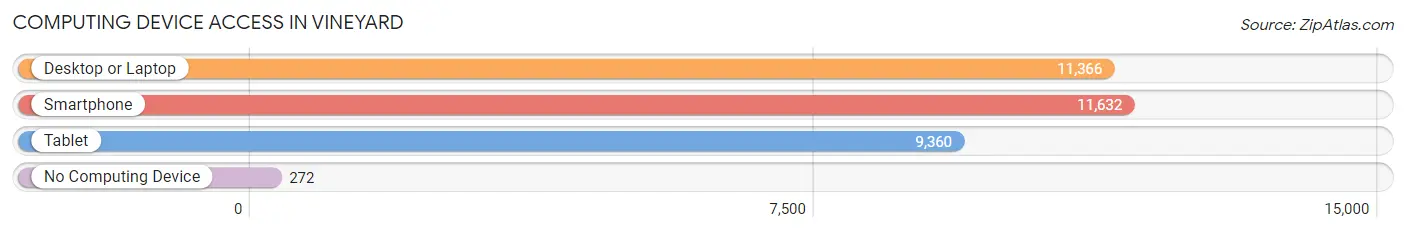
| Device Type | # Households | % Households |
| Desktop or Laptop | 11,366 | 91.0% |
| Smartphone | 11,632 | 93.2% |
| Tablet | 9,360 | 75.0% |
| No Computing Device | 272 | 2.2% |
| Total | 12,484 | 100.0% |
Internet Access in Vineyard
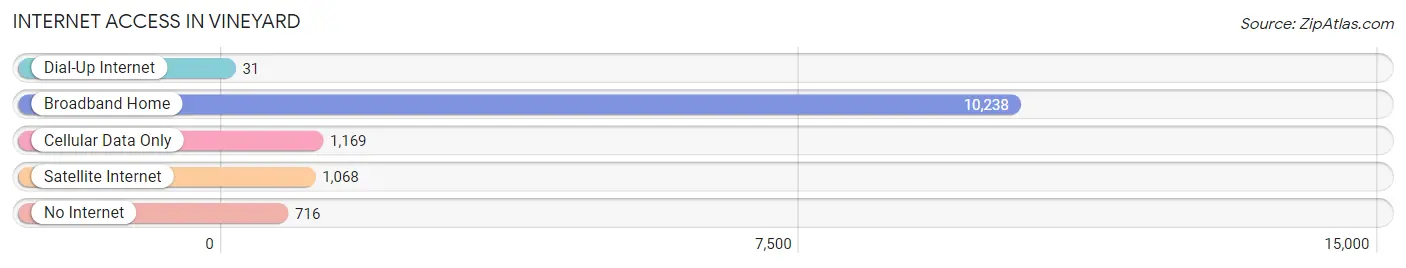
| Internet Type | # Households | % Households |
| Dial-Up Internet | 31 | 0.3% |
| Broadband Home | 10,238 | 82.0% |
| Cellular Data Only | 1,169 | 9.4% |
| Satellite Internet | 1,068 | 8.6% |
| No Internet | 716 | 5.7% |
| Total | 12,484 | 100.0% |
Vineyard Summary
Vineyard, California is a small city located in the San Joaquin Valley of California. It is situated in the northern part of the valley, about 30 miles south of Fresno. The city is home to a population of approximately 8,000 people, and is part of the Fresno-Madera-Kings County Metropolitan Statistical Area.
History
Vineyard was founded in 1872 by a group of settlers from the Midwest. The settlers were looking for a place to settle and grow grapes, and they found the perfect spot in the San Joaquin Valley. The city was originally called “Vineyardville”, but the name was changed to “Vineyard” in 1875.
The city was incorporated in 1891, and the first mayor was elected in 1892. The city grew rapidly in the early 1900s, and by 1910, the population had grown to over 1,000 people.
The city was a major agricultural center in the early 20th century, and it was home to many wineries and vineyards. The city was also home to a large number of Italian immigrants, who worked in the vineyards and wineries.
Geography
Vineyard is located in the northern part of the San Joaquin Valley, about 30 miles south of Fresno. The city is situated on the banks of the San Joaquin River, and is surrounded by rolling hills and farmland. The city is located at an elevation of about 200 feet above sea level.
The climate in Vineyard is generally mild, with hot summers and cool winters. The average annual temperature is around 70 degrees Fahrenheit. The average annual precipitation is around 10 inches.
Economy
Vineyard’s economy is largely based on agriculture. The city is home to many vineyards and wineries, and the surrounding area is known for its production of grapes, almonds, and other crops. The city is also home to a number of manufacturing and service businesses.
The city is home to a number of large employers, including the Fresno County Office of Education, the Fresno County Sheriff’s Office, and the Fresno County Fire Department.
Demographics
As of the 2010 census, the population of Vineyard was 8,000 people. The racial makeup of the city was 75.3% White, 0.7% African American, 0.3% Native American, 0.7% Asian, 0.1% Pacific Islander, and 22.1% from other races. Hispanic or Latino of any race were 44.3% of the population.
The median household income in Vineyard was $45,000, and the median family income was $50,000. The per capita income was $20,000. About 17.5% of the population was below the poverty line.
Vineyard is a small city with a rich history and a diverse population. The city is home to many vineyards and wineries, and it is a major agricultural center in the San Joaquin Valley. The city is also home to a number of large employers, and it has a strong economy. The city is a great place to live, work, and raise a family.
Common Questions
What is Per Capita Income in Vineyard?
Per Capita income in Vineyard is $36,960.
What is the Median Family Income in Vineyard?
Median Family Income in Vineyard is $116,189.
What is the Median Household income in Vineyard?
Median Household Income in Vineyard is $108,607.
What is Income or Wage Gap in Vineyard?
Income or Wage Gap in Vineyard is 11.8%.
Women in Vineyard earn 88.2 cents for every dollar earned by a man.
What is Family Income Deficit in Vineyard?
Family Income Deficit in Vineyard is $11,760.
Families that are below poverty line in Vineyard earn $11,760 less on average than the poverty threshold level.
What is Inequality or Gini Index in Vineyard?
Inequality or Gini Index in Vineyard is 0.39.
What is the Total Population of Vineyard?
Total Population of Vineyard is 42,657.
What is the Total Male Population of Vineyard?
Total Male Population of Vineyard is 21,530.
What is the Total Female Population of Vineyard?
Total Female Population of Vineyard is 21,127.
What is the Ratio of Males per 100 Females in Vineyard?
There are 101.91 Males per 100 Females in Vineyard.
What is the Ratio of Females per 100 Males in Vineyard?
There are 98.13 Females per 100 Males in Vineyard.
What is the Median Population Age in Vineyard?
Median Population Age in Vineyard is 36.8 Years.
What is the Average Family Size in Vineyard
Average Family Size in Vineyard is 3.7 People.
What is the Average Household Size in Vineyard
Average Household Size in Vineyard is 3.4 People.
How Large is the Labor Force in Vineyard?
There are 20,507 People in the Labor Forcein in Vineyard.
What is the Percentage of People in the Labor Force in Vineyard?
62.3% of People are in the Labor Force in Vineyard.
What is the Unemployment Rate in Vineyard?
Unemployment Rate in Vineyard is 4.8%.