Fountain Valley, CA Map & Demographics
Fountain Valley Map
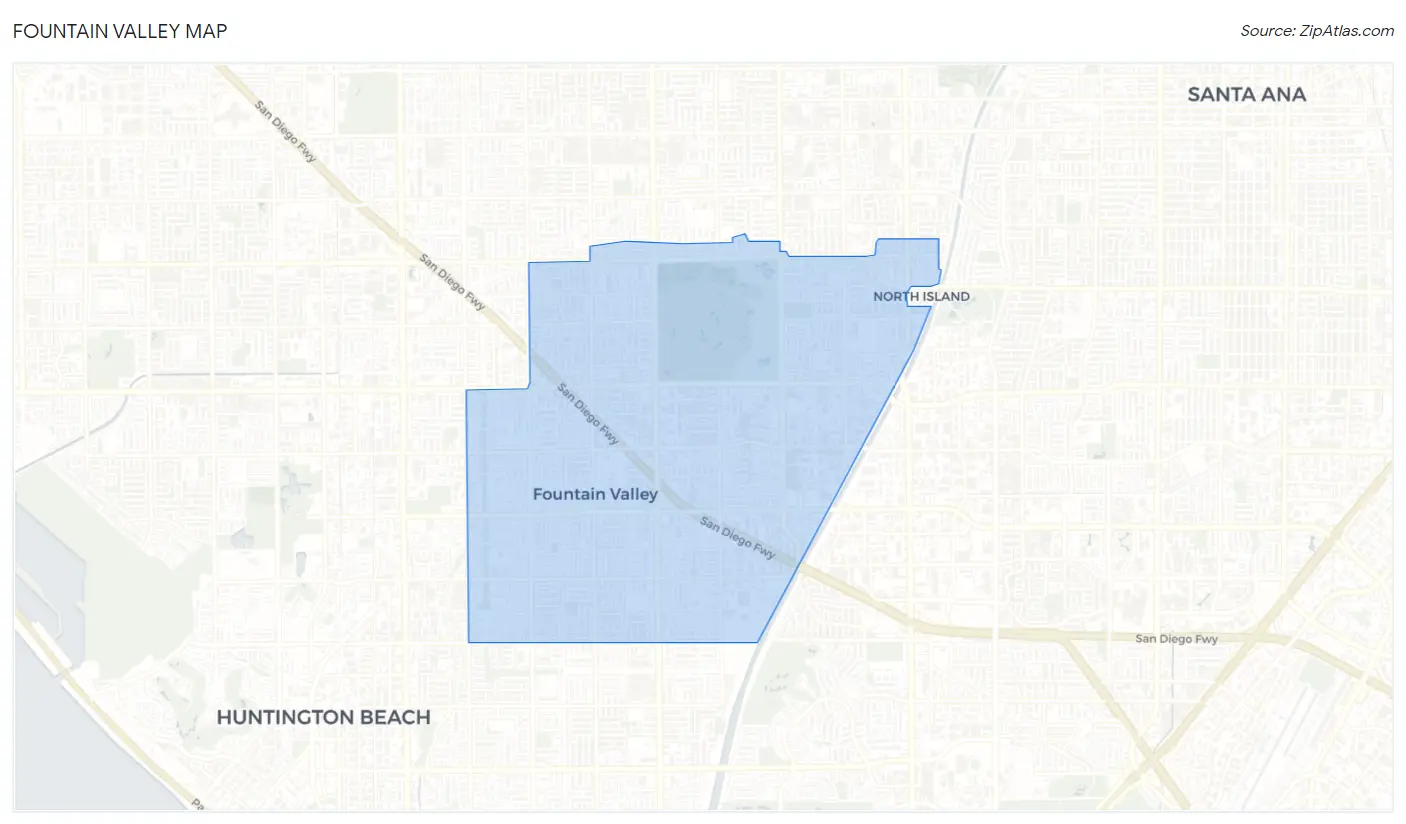
Fountain Valley Overview
$46,609
PER CAPITA INCOME
$127,973
AVG FAMILY INCOME
$108,860
AVG HOUSEHOLD INCOME
23.6%
WAGE / INCOME GAP [ % ]
76.4¢/ $1
WAGE / INCOME GAP [ $ ]
0.43
INEQUALITY / GINI INDEX
56,754
TOTAL POPULATION
28,478
MALE POPULATION
28,276
FEMALE POPULATION
100.71
MALES / 100 FEMALES
99.29
FEMALES / 100 MALES
44.3
MEDIAN AGE
3.5
AVG FAMILY SIZE
3.0
AVG HOUSEHOLD SIZE
29,337
LABOR FORCE [ PEOPLE ]
61.8%
PERCENT IN LABOR FORCE
6.0%
UNEMPLOYMENT RATE
Fountain Valley Zip Codes
Fountain Valley Area Codes
Income in Fountain Valley
Income Overview in Fountain Valley
Per Capita Income in Fountain Valley is $46,609, while median incomes of families and households are $127,973 and $108,860 respectively.
| Characteristic | Number | Measure |
| Per Capita Income | 56,754 | $46,609 |
| Median Family Income | 13,767 | $127,973 |
| Mean Family Income | 13,767 | $153,320 |
| Median Household Income | 18,906 | $108,860 |
| Mean Household Income | 18,906 | $136,402 |
| Income Deficit | 13,767 | $0 |
| Wage / Income Gap (%) | 56,754 | 23.59% |
| Wage / Income Gap ($) | 56,754 | 76.41¢ per $1 |
| Gini / Inequality Index | 56,754 | 0.43 |
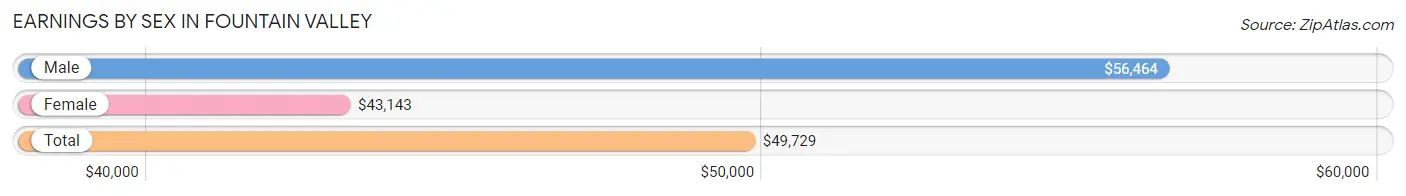
Earnings by Sex in Fountain Valley
Average Earnings in Fountain Valley are $49,729, $56,464 for men and $43,143 for women, a difference of 23.6%.
| Sex | Number | Average Earnings |
| Male | 15,711 (52.5%) | $56,464 |
| Female | 14,202 (47.5%) | $43,143 |
| Total | 29,913 (100.0%) | $49,729 |
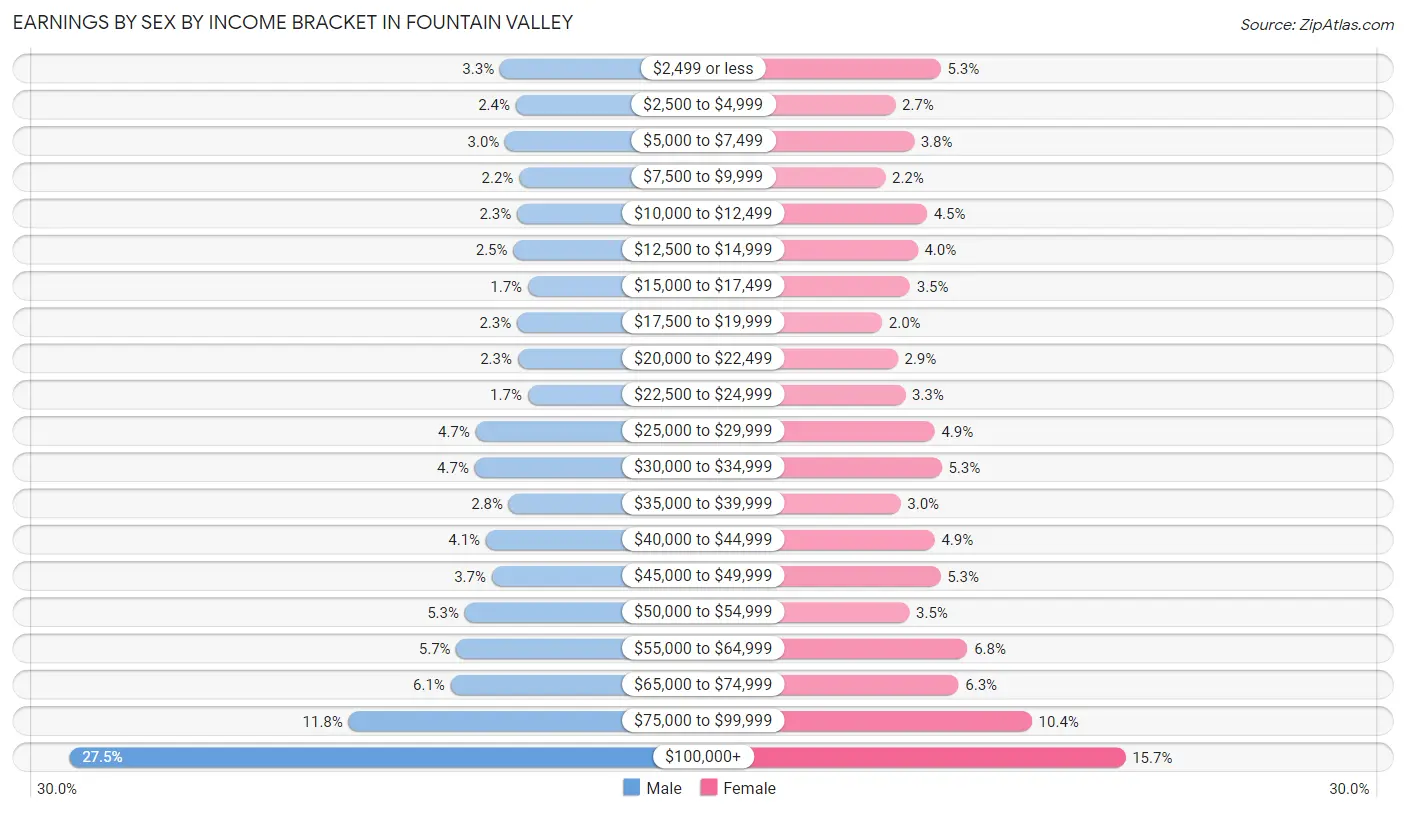
Earnings by Sex by Income Bracket in Fountain Valley
The most common earnings brackets in Fountain Valley are $100,000+ for men (4,319 | 27.5%) and $100,000+ for women (2,222 | 15.7%).
| Income | Male | Female |
| $2,499 or less | 515 (3.3%) | 748 (5.3%) |
| $2,500 to $4,999 | 375 (2.4%) | 385 (2.7%) |
| $5,000 to $7,499 | 470 (3.0%) | 534 (3.8%) |
| $7,500 to $9,999 | 345 (2.2%) | 306 (2.1%) |
| $10,000 to $12,499 | 364 (2.3%) | 638 (4.5%) |
| $12,500 to $14,999 | 398 (2.5%) | 564 (4.0%) |
| $15,000 to $17,499 | 269 (1.7%) | 503 (3.5%) |
| $17,500 to $19,999 | 364 (2.3%) | 280 (2.0%) |
| $20,000 to $22,499 | 358 (2.3%) | 405 (2.9%) |
| $22,500 to $24,999 | 270 (1.7%) | 464 (3.3%) |
| $25,000 to $29,999 | 731 (4.6%) | 700 (4.9%) |
| $30,000 to $34,999 | 738 (4.7%) | 755 (5.3%) |
| $35,000 to $39,999 | 437 (2.8%) | 428 (3.0%) |
| $40,000 to $44,999 | 639 (4.1%) | 700 (4.9%) |
| $45,000 to $49,999 | 588 (3.7%) | 746 (5.2%) |
| $50,000 to $54,999 | 827 (5.3%) | 497 (3.5%) |
| $55,000 to $64,999 | 901 (5.7%) | 961 (6.8%) |
| $65,000 to $74,999 | 951 (6.0%) | 890 (6.3%) |
| $75,000 to $99,999 | 1,852 (11.8%) | 1,476 (10.4%) |
| $100,000+ | 4,319 (27.5%) | 2,222 (15.7%) |
| Total | 15,711 (100.0%) | 14,202 (100.0%) |
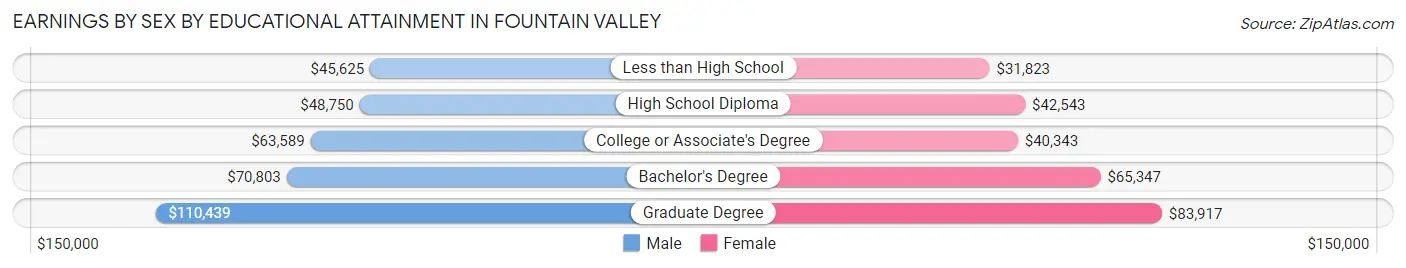
Earnings by Sex by Educational Attainment in Fountain Valley
Average earnings in Fountain Valley are $67,985 for men and $48,640 for women, a difference of 28.4%. Men with an educational attainment of graduate degree enjoy the highest average annual earnings of $110,439, while those with less than high school education earn the least with $45,625. Women with an educational attainment of graduate degree earn the most with the average annual earnings of $83,917, while those with less than high school education have the smallest earnings of $31,823.
| Educational Attainment | Male Income | Female Income |
| Less than High School | $45,625 | $31,823 |
| High School Diploma | $48,750 | $42,543 |
| College or Associate's Degree | $63,589 | $40,343 |
| Bachelor's Degree | $70,803 | $65,347 |
| Graduate Degree | $110,439 | $83,917 |
| Total | $67,985 | $48,640 |
Family Income in Fountain Valley
Family Income Brackets in Fountain Valley
According to the Fountain Valley family income data, there are 3,483 families falling into the $200,000+ income range, which is the most common income bracket and makes up 25.3% of all families. Conversely, the $10,000 to $14,999 income bracket is the least frequent group with only 83 families (0.6%) belonging to this category.
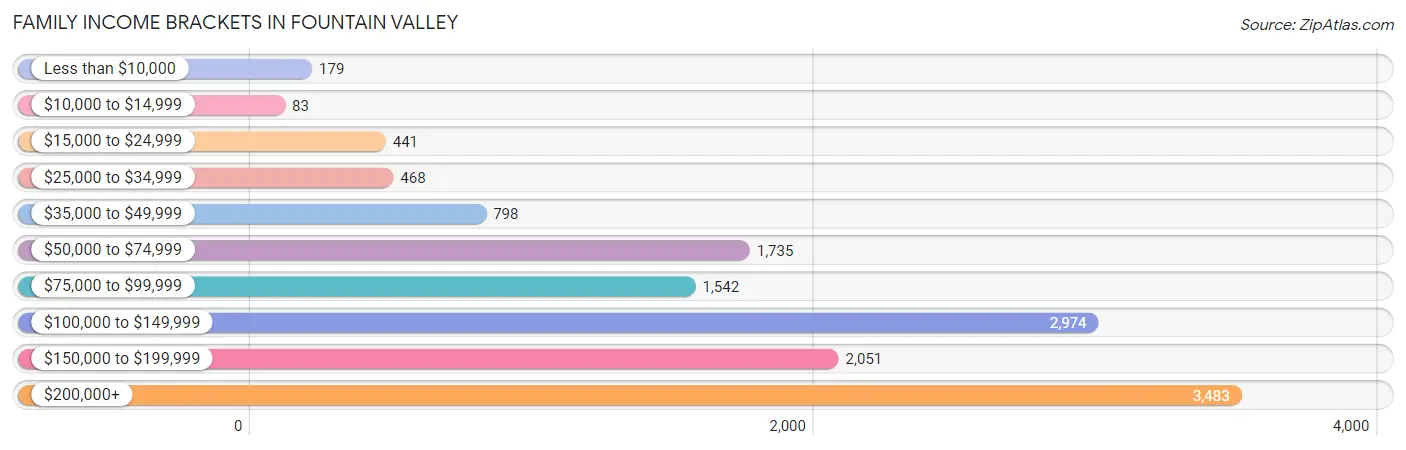
| Income Bracket | # Families | % Families |
| Less than $10,000 | 179 | 1.3% |
| $10,000 to $14,999 | 83 | 0.6% |
| $15,000 to $24,999 | 441 | 3.2% |
| $25,000 to $34,999 | 468 | 3.4% |
| $35,000 to $49,999 | 798 | 5.8% |
| $50,000 to $74,999 | 1,735 | 12.6% |
| $75,000 to $99,999 | 1,542 | 11.2% |
| $100,000 to $149,999 | 2,974 | 21.6% |
| $150,000 to $199,999 | 2,051 | 14.9% |
| $200,000+ | 3,483 | 25.3% |
Family Income by Famaliy Size in Fountain Valley
6-person families (453 | 3.3%) account for the highest median family income in Fountain Valley with $188,250 per family, while 2-person families (5,180 | 37.6%) have the highest median income of $45,272 per family member.
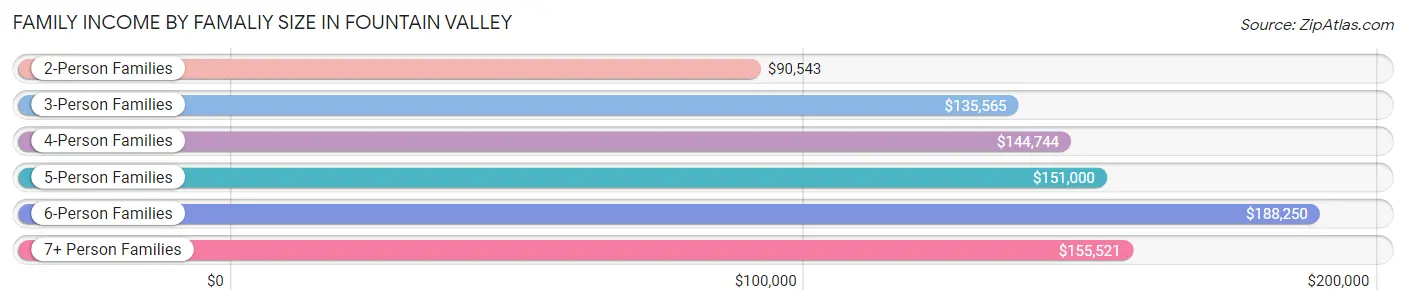
| Income Bracket | # Families | Median Income |
| 2-Person Families | 5,180 (37.6%) | $90,543 |
| 3-Person Families | 3,244 (23.6%) | $135,565 |
| 4-Person Families | 2,952 (21.4%) | $144,744 |
| 5-Person Families | 1,416 (10.3%) | $151,000 |
| 6-Person Families | 453 (3.3%) | $188,250 |
| 7+ Person Families | 522 (3.8%) | $155,521 |
| Total | 13,767 (100.0%) | $127,973 |
Family Income by Number of Earners in Fountain Valley
The median family income in Fountain Valley is $127,973, with families comprising 2 earners (5,345) having the highest median family income of $158,602, while families with no earners (2,061) have the lowest median family income of $66,607, accounting for 38.8% and 15.0% of families, respectively.
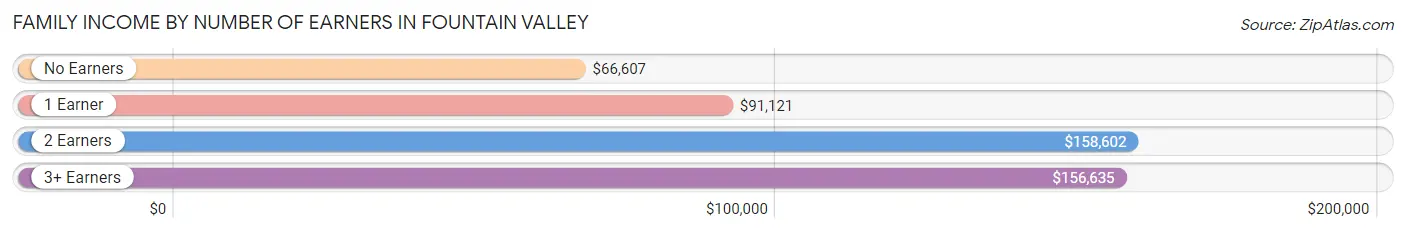
| Number of Earners | # Families | Median Income |
| No Earners | 2,061 (15.0%) | $66,607 |
| 1 Earner | 3,569 (25.9%) | $91,121 |
| 2 Earners | 5,345 (38.8%) | $158,602 |
| 3+ Earners | 2,792 (20.3%) | $156,635 |
| Total | 13,767 (100.0%) | $127,973 |
Household Income in Fountain Valley
Household Income Brackets in Fountain Valley
With 3,932 households falling in the category, the $200,000+ income range is the most frequent in Fountain Valley, accounting for 20.8% of all households. In contrast, only 397 households (2.1%) fall into the $10,000 to $14,999 income bracket, making it the least populous group.
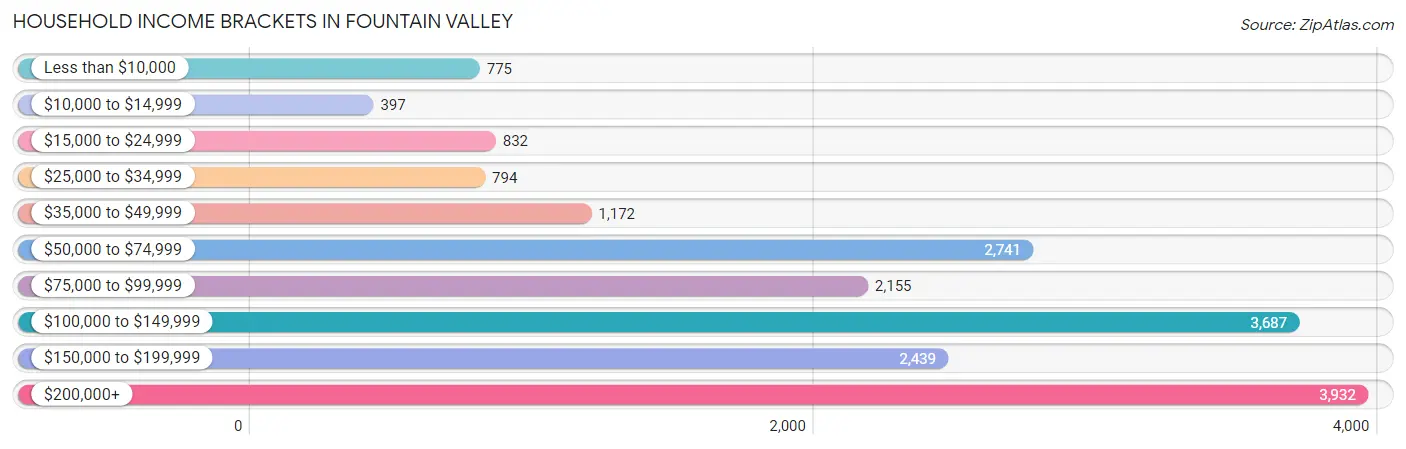
| Income Bracket | # Households | % Households |
| Less than $10,000 | 775 | 4.1% |
| $10,000 to $14,999 | 397 | 2.1% |
| $15,000 to $24,999 | 832 | 4.4% |
| $25,000 to $34,999 | 794 | 4.2% |
| $35,000 to $49,999 | 1,172 | 6.2% |
| $50,000 to $74,999 | 2,741 | 14.5% |
| $75,000 to $99,999 | 2,155 | 11.4% |
| $100,000 to $149,999 | 3,687 | 19.5% |
| $150,000 to $199,999 | 2,439 | 12.9% |
| $200,000+ | 3,932 | 20.8% |
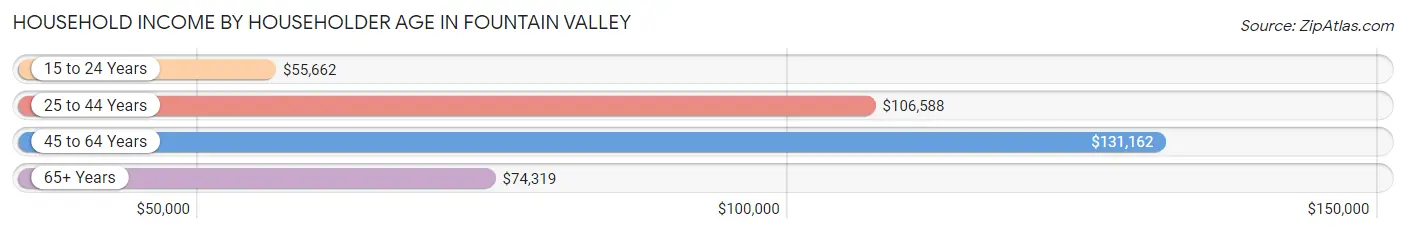
Household Income by Householder Age in Fountain Valley
The median household income in Fountain Valley is $108,860, with the highest median household income of $131,162 found in the 45 to 64 years age bracket for the primary householder. A total of 8,100 households (42.8%) fall into this category. Meanwhile, the 15 to 24 years age bracket for the primary householder has the lowest median household income of $55,662, with 295 households (1.6%) in this group.
| Income Bracket | # Households | Median Income |
| 15 to 24 Years | 295 (1.6%) | $55,662 |
| 25 to 44 Years | 4,640 (24.5%) | $106,588 |
| 45 to 64 Years | 8,100 (42.8%) | $131,162 |
| 65+ Years | 5,871 (31.0%) | $74,319 |
| Total | 18,906 (100.0%) | $108,860 |
Poverty in Fountain Valley
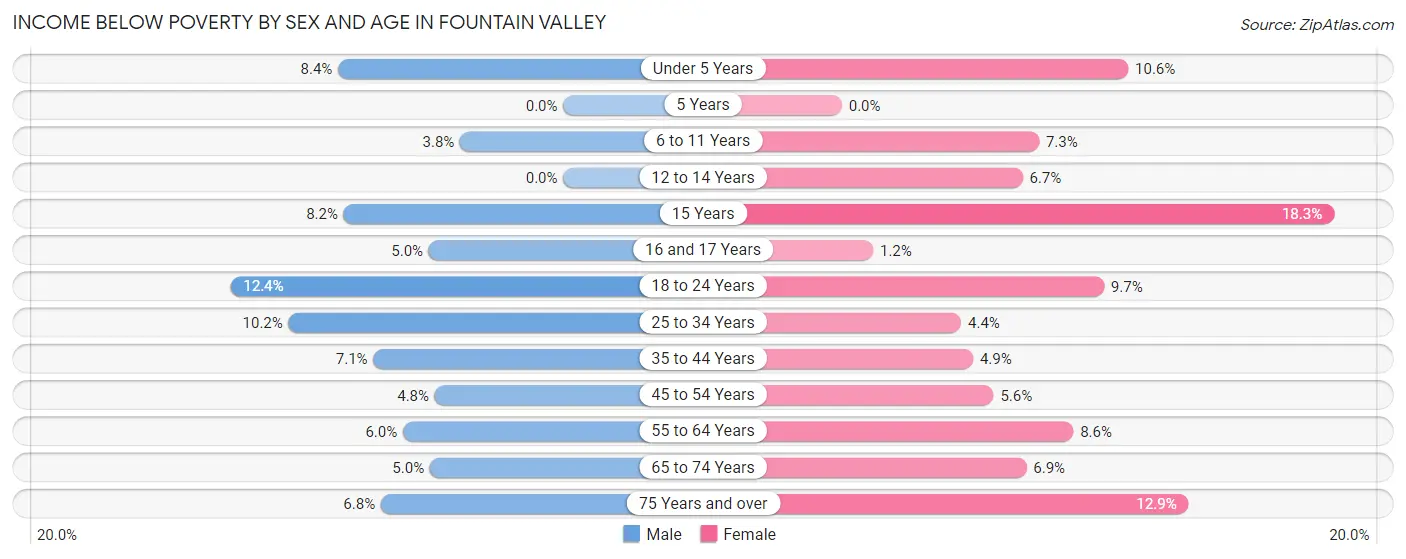
Income Below Poverty by Sex and Age in Fountain Valley
With 6.7% poverty level for males and 7.3% for females among the residents of Fountain Valley, 18 to 24 year old males and 15 year old females are the most vulnerable to poverty, with 316 males (12.4%) and 72 females (18.3%) in their respective age groups living below the poverty level.
| Age Bracket | Male | Female |
| Under 5 Years | 117 (8.4%) | 95 (10.6%) |
| 5 Years | 0 (0.0%) | 0 (0.0%) |
| 6 to 11 Years | 73 (3.8%) | 93 (7.3%) |
| 12 to 14 Years | 0 (0.0%) | 77 (6.7%) |
| 15 Years | 29 (8.2%) | 72 (18.3%) |
| 16 and 17 Years | 35 (5.0%) | 11 (1.2%) |
| 18 to 24 Years | 316 (12.4%) | 218 (9.7%) |
| 25 to 34 Years | 358 (10.2%) | 134 (4.4%) |
| 35 to 44 Years | 232 (7.0%) | 161 (4.9%) |
| 45 to 54 Years | 182 (4.8%) | 235 (5.6%) |
| 55 to 64 Years | 256 (5.9%) | 369 (8.6%) |
| 65 to 74 Years | 142 (5.0%) | 220 (6.9%) |
| 75 Years and over | 151 (6.8%) | 364 (12.9%) |
| Total | 1,891 (6.7%) | 2,049 (7.3%) |
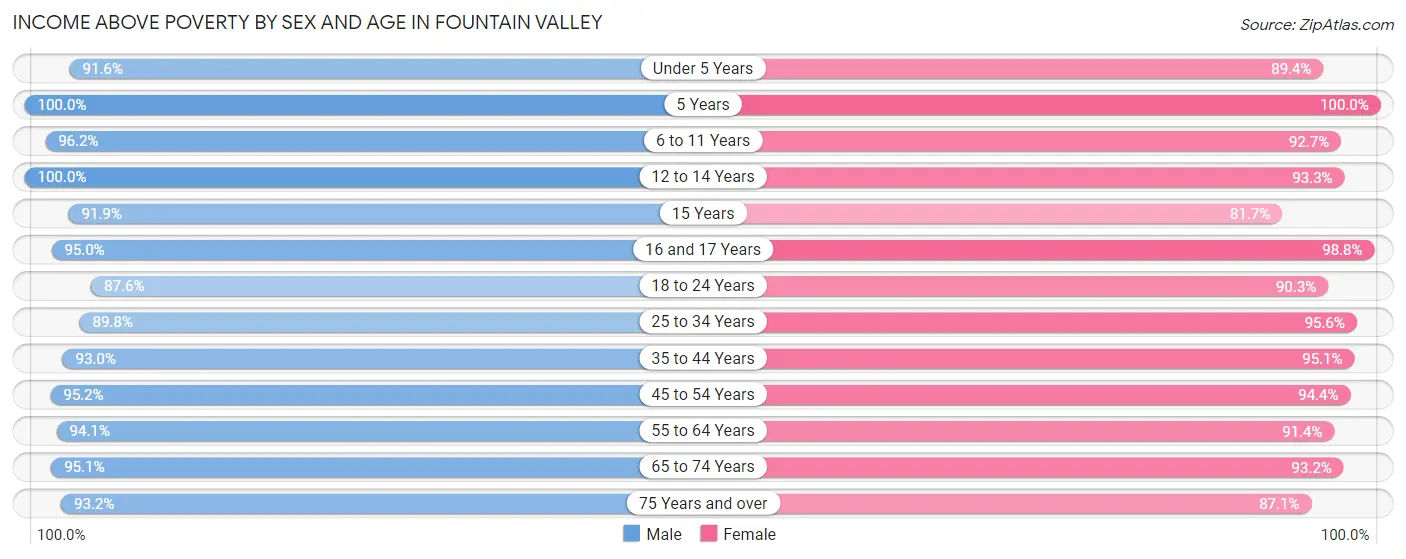
Income Above Poverty by Sex and Age in Fountain Valley
According to the poverty statistics in Fountain Valley, males aged 5 years and females aged 5 years are the age groups that are most secure financially, with 100.0% of males and 100.0% of females in these age groups living above the poverty line.
| Age Bracket | Male | Female |
| Under 5 Years | 1,283 (91.6%) | 799 (89.4%) |
| 5 Years | 251 (100.0%) | 363 (100.0%) |
| 6 to 11 Years | 1,831 (96.2%) | 1,177 (92.7%) |
| 12 to 14 Years | 1,187 (100.0%) | 1,070 (93.3%) |
| 15 Years | 327 (91.8%) | 322 (81.7%) |
| 16 and 17 Years | 667 (95.0%) | 936 (98.8%) |
| 18 to 24 Years | 2,241 (87.6%) | 2,022 (90.3%) |
| 25 to 34 Years | 3,153 (89.8%) | 2,890 (95.6%) |
| 35 to 44 Years | 3,059 (92.9%) | 3,148 (95.1%) |
| 45 to 54 Years | 3,632 (95.2%) | 3,937 (94.4%) |
| 55 to 64 Years | 4,048 (94.1%) | 3,925 (91.4%) |
| 65 to 74 Years | 2,724 (95.1%) | 2,991 (93.1%) |
| 75 Years and over | 2,080 (93.2%) | 2,464 (87.1%) |
| Total | 26,483 (93.3%) | 26,044 (92.7%) |
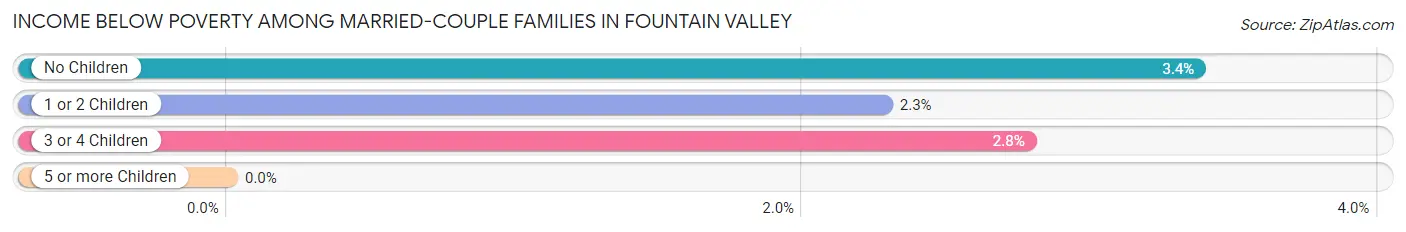
Income Below Poverty Among Married-Couple Families in Fountain Valley
The poverty statistics for married-couple families in Fountain Valley show that 2.9% or 318 of the total 10,789 families live below the poverty line. Families with no children have the highest poverty rate of 3.4%, comprising of 214 families. On the other hand, families with 5 or more children have the lowest poverty rate of 0.0%, which includes 0 families.
| Children | Above Poverty | Below Poverty |
| No Children | 6,145 (96.6%) | 214 (3.4%) |
| 1 or 2 Children | 3,647 (97.7%) | 85 (2.3%) |
| 3 or 4 Children | 665 (97.2%) | 19 (2.8%) |
| 5 or more Children | 14 (100.0%) | 0 (0.0%) |
| Total | 10,471 (97.1%) | 318 (2.9%) |
Income Below Poverty Among Single-Parent Households in Fountain Valley
According to the poverty data in Fountain Valley, 1.8% or 21 single-father households and 12.4% or 226 single-mother households are living below the poverty line. Among single-father households, those with 3 or 4 children have the highest poverty rate, with 21 households (22.1%) experiencing poverty. Likewise, among single-mother households, those with 3 or 4 children have the highest poverty rate, with 41 households (28.1%) falling below the poverty line.
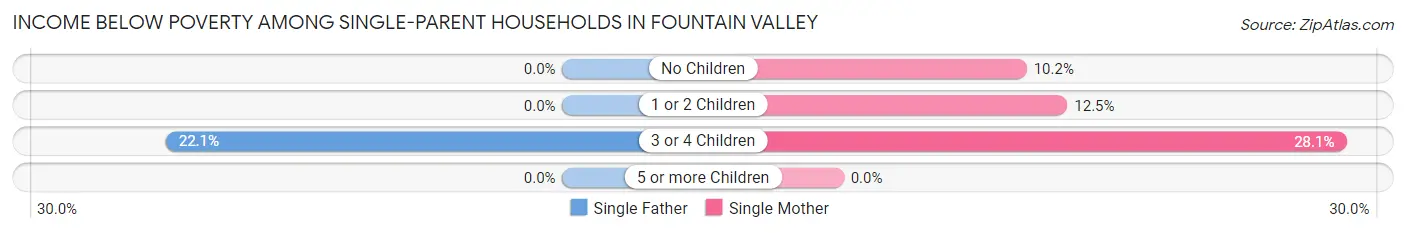
| Children | Single Father | Single Mother |
| No Children | 0 (0.0%) | 101 (10.2%) |
| 1 or 2 Children | 0 (0.0%) | 84 (12.5%) |
| 3 or 4 Children | 21 (22.1%) | 41 (28.1%) |
| 5 or more Children | 0 (0.0%) | 0 (0.0%) |
| Total | 21 (1.8%) | 226 (12.4%) |
Income Below Poverty Among Married-Couple vs Single-Parent Households in Fountain Valley
The poverty data for Fountain Valley shows that 318 of the married-couple family households (2.9%) and 247 of the single-parent households (8.3%) are living below the poverty level. Within the married-couple family households, those with no children have the highest poverty rate, with 214 households (3.4%) falling below the poverty line. Among the single-parent households, those with 3 or 4 children have the highest poverty rate, with 62 household (25.7%) living below poverty.
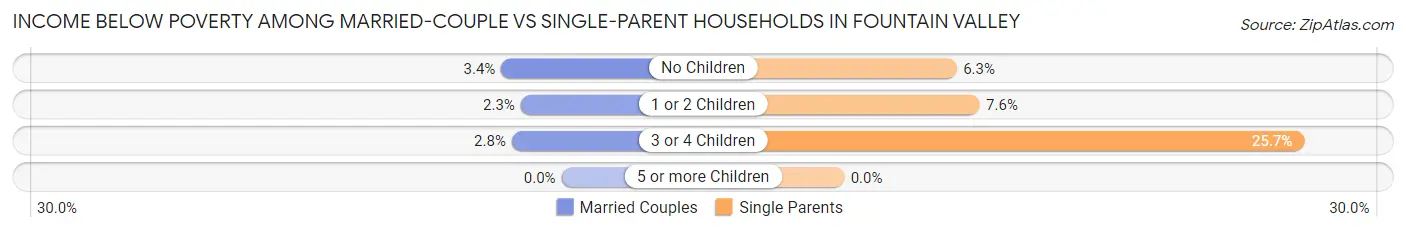
| Children | Married-Couple Families | Single-Parent Households |
| No Children | 214 (3.4%) | 101 (6.3%) |
| 1 or 2 Children | 85 (2.3%) | 84 (7.6%) |
| 3 or 4 Children | 19 (2.8%) | 62 (25.7%) |
| 5 or more Children | 0 (0.0%) | 0 (0.0%) |
| Total | 318 (2.9%) | 247 (8.3%) |
Race in Fountain Valley
The most populous races in Fountain Valley are White / Caucasian (24,944 | 44.0%), Asian (21,248 | 37.4%), and Hispanic or Latino (9,692 | 17.1%).
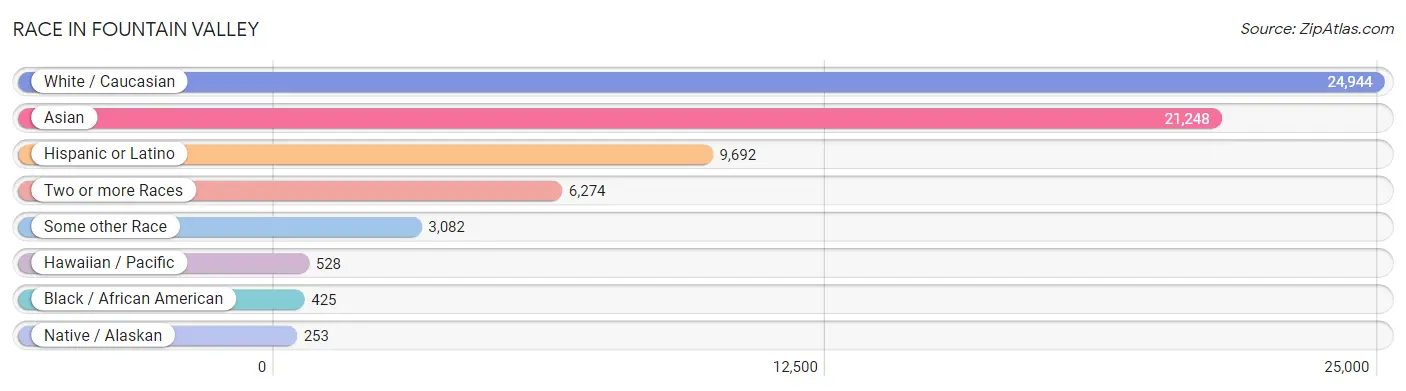
| Race | # Population | % Population |
| Asian | 21,248 | 37.4% |
| Black / African American | 425 | 0.7% |
| Hawaiian / Pacific | 528 | 0.9% |
| Hispanic or Latino | 9,692 | 17.1% |
| Native / Alaskan | 253 | 0.4% |
| White / Caucasian | 24,944 | 44.0% |
| Two or more Races | 6,274 | 11.1% |
| Some other Race | 3,082 | 5.4% |
| Total | 56,754 | 100.0% |
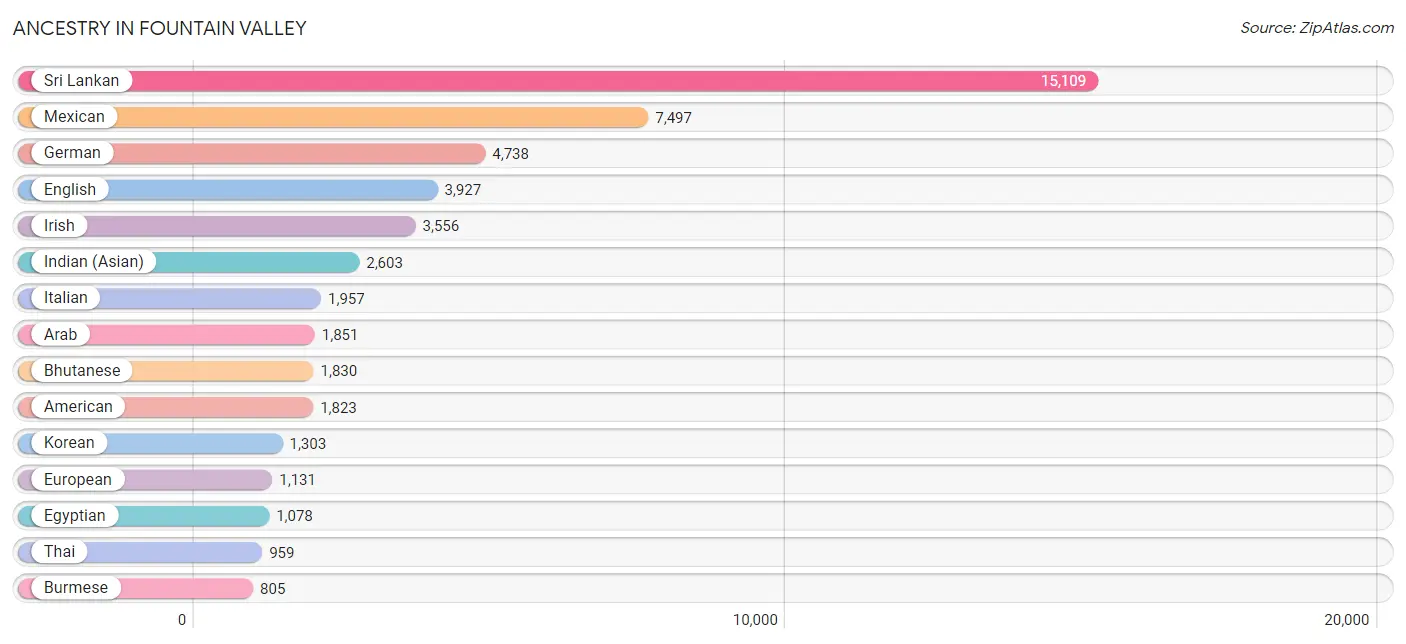
Ancestry in Fountain Valley
The most populous ancestries reported in Fountain Valley are Sri Lankan (15,109 | 26.6%), Mexican (7,497 | 13.2%), German (4,738 | 8.4%), English (3,927 | 6.9%), and Irish (3,556 | 6.3%), together accounting for 61.4% of all Fountain Valley residents.
| Ancestry | # Population | % Population |
| Afghan | 68 | 0.1% |
| African | 72 | 0.1% |
| Albanian | 30 | 0.1% |
| American | 1,823 | 3.2% |
| Apache | 105 | 0.2% |
| Arab | 1,851 | 3.3% |
| Argentinean | 95 | 0.2% |
| Armenian | 160 | 0.3% |
| Assyrian / Chaldean / Syriac | 17 | 0.0% |
| Australian | 21 | 0.0% |
| Austrian | 92 | 0.2% |
| Bangladeshi | 36 | 0.1% |
| Belgian | 103 | 0.2% |
| Bhutanese | 1,830 | 3.2% |
| Blackfeet | 28 | 0.1% |
| Bolivian | 7 | 0.0% |
| Brazilian | 47 | 0.1% |
| British | 195 | 0.3% |
| Bulgarian | 25 | 0.0% |
| Burmese | 805 | 1.4% |
| Canadian | 191 | 0.3% |
| Central American | 752 | 1.3% |
| Cherokee | 64 | 0.1% |
| Chickasaw | 105 | 0.2% |
| Chilean | 60 | 0.1% |
| Chippewa | 33 | 0.1% |
| Choctaw | 58 | 0.1% |
| Colombian | 73 | 0.1% |
| Croatian | 63 | 0.1% |
| Cuban | 119 | 0.2% |
| Czech | 111 | 0.2% |
| Czechoslovakian | 29 | 0.1% |
| Danish | 113 | 0.2% |
| Dutch | 313 | 0.5% |
| Eastern European | 79 | 0.1% |
| Ecuadorian | 34 | 0.1% |
| Egyptian | 1,078 | 1.9% |
| English | 3,927 | 6.9% |
| Estonian | 29 | 0.1% |
| European | 1,131 | 2.0% |
| Filipino | 371 | 0.6% |
| Finnish | 106 | 0.2% |
| French | 774 | 1.4% |
| French American Indian | 16 | 0.0% |
| French Canadian | 149 | 0.3% |
| German | 4,738 | 8.4% |
| Greek | 105 | 0.2% |
| Guamanian / Chamorro | 109 | 0.2% |
| Guatemalan | 10 | 0.0% |
| Honduran | 24 | 0.0% |
| Hungarian | 482 | 0.9% |
| Icelander | 42 | 0.1% |
| Indian (Asian) | 2,603 | 4.6% |
| Inupiat | 16 | 0.0% |
| Iranian | 19 | 0.0% |
| Irish | 3,556 | 6.3% |
| Israeli | 40 | 0.1% |
| Italian | 1,957 | 3.5% |
| Japanese | 108 | 0.2% |
| Jordanian | 34 | 0.1% |
| Korean | 1,303 | 2.3% |
| Laotian | 79 | 0.1% |
| Lebanese | 62 | 0.1% |
| Lithuanian | 65 | 0.1% |
| Lumbee | 6 | 0.0% |
| Macedonian | 9 | 0.0% |
| Malaysian | 38 | 0.1% |
| Mexican | 7,497 | 13.2% |
| Mexican American Indian | 67 | 0.1% |
| Moroccan | 20 | 0.0% |
| Native Hawaiian | 52 | 0.1% |
| Nicaraguan | 30 | 0.1% |
| Northern European | 40 | 0.1% |
| Norwegian | 455 | 0.8% |
| Pakistani | 296 | 0.5% |
| Palestinian | 432 | 0.8% |
| Panamanian | 38 | 0.1% |
| Peruvian | 326 | 0.6% |
| Polish | 791 | 1.4% |
| Portuguese | 365 | 0.6% |
| Puerto Rican | 304 | 0.5% |
| Romanian | 48 | 0.1% |
| Russian | 181 | 0.3% |
| Salvadoran | 650 | 1.1% |
| Samoan | 339 | 0.6% |
| Scandinavian | 133 | 0.2% |
| Scotch-Irish | 297 | 0.5% |
| Scottish | 680 | 1.2% |
| Serbian | 40 | 0.1% |
| Slavic | 12 | 0.0% |
| Slovak | 43 | 0.1% |
| South African | 10 | 0.0% |
| South American | 611 | 1.1% |
| Spaniard | 164 | 0.3% |
| Spanish | 75 | 0.1% |
| Spanish American | 48 | 0.1% |
| Sri Lankan | 15,109 | 26.6% |
| Subsaharan African | 92 | 0.2% |
| Swedish | 528 | 0.9% |
| Swiss | 120 | 0.2% |
| Syrian | 118 | 0.2% |
| Thai | 959 | 1.7% |
| Tongan | 353 | 0.6% |
| Turkish | 63 | 0.1% |
| Ukrainian | 78 | 0.1% |
| Welsh | 207 | 0.4% |
| Yaqui | 13 | 0.0% |
| Yugoslavian | 11 | 0.0% | View All 108 Rows |
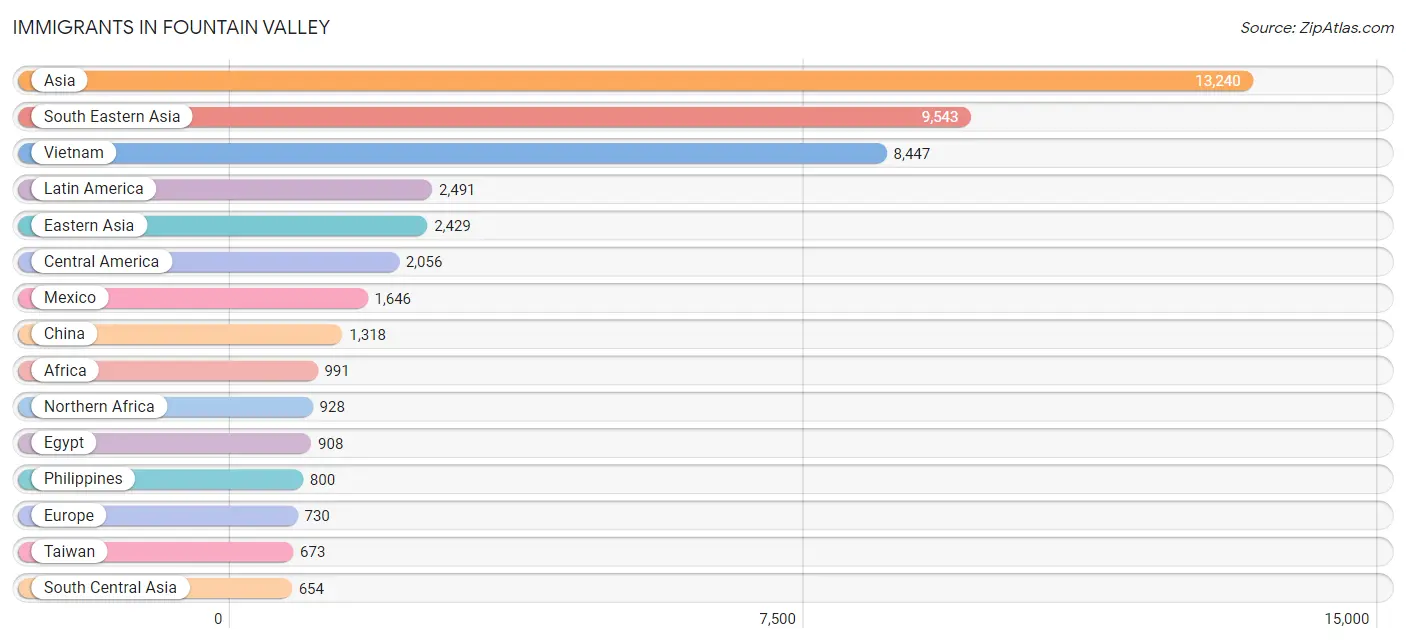
Immigrants in Fountain Valley
The most numerous immigrant groups reported in Fountain Valley came from Asia (13,240 | 23.3%), South Eastern Asia (9,543 | 16.8%), Vietnam (8,447 | 14.9%), Latin America (2,491 | 4.4%), and Eastern Asia (2,429 | 4.3%), together accounting for 63.7% of all Fountain Valley residents.
| Immigration Origin | # Population | % Population |
| Afghanistan | 43 | 0.1% |
| Africa | 991 | 1.8% |
| Argentina | 54 | 0.1% |
| Asia | 13,240 | 23.3% |
| Australia | 21 | 0.0% |
| Austria | 18 | 0.0% |
| Bangladesh | 28 | 0.1% |
| Bosnia and Herzegovina | 18 | 0.0% |
| Brazil | 155 | 0.3% |
| Cambodia | 116 | 0.2% |
| Canada | 317 | 0.6% |
| Caribbean | 79 | 0.1% |
| Central America | 2,056 | 3.6% |
| Chile | 7 | 0.0% |
| China | 1,318 | 2.3% |
| Colombia | 41 | 0.1% |
| Costa Rica | 7 | 0.0% |
| Croatia | 9 | 0.0% |
| Cuba | 69 | 0.1% |
| Czechoslovakia | 9 | 0.0% |
| Denmark | 9 | 0.0% |
| Eastern Africa | 10 | 0.0% |
| Eastern Asia | 2,429 | 4.3% |
| Eastern Europe | 285 | 0.5% |
| Ecuador | 16 | 0.0% |
| Egypt | 908 | 1.6% |
| El Salvador | 343 | 0.6% |
| England | 120 | 0.2% |
| Europe | 730 | 1.3% |
| Fiji | 26 | 0.1% |
| France | 13 | 0.0% |
| Germany | 81 | 0.1% |
| Greece | 17 | 0.0% |
| Guatemala | 1 | 0.0% |
| Honduras | 11 | 0.0% |
| Hong Kong | 186 | 0.3% |
| Hungary | 89 | 0.2% |
| India | 507 | 0.9% |
| Indonesia | 25 | 0.0% |
| Iran | 17 | 0.0% |
| Iraq | 29 | 0.1% |
| Ireland | 8 | 0.0% |
| Israel | 3 | 0.0% |
| Italy | 23 | 0.0% |
| Japan | 576 | 1.0% |
| Jordan | 79 | 0.1% |
| Korea | 535 | 0.9% |
| Kuwait | 25 | 0.0% |
| Laos | 37 | 0.1% |
| Latin America | 2,491 | 4.4% |
| Lebanon | 113 | 0.2% |
| Malaysia | 25 | 0.0% |
| Mexico | 1,646 | 2.9% |
| Morocco | 20 | 0.0% |
| Nicaragua | 21 | 0.0% |
| Northern Africa | 928 | 1.6% |
| Northern Europe | 266 | 0.5% |
| Oceania | 286 | 0.5% |
| Pakistan | 30 | 0.1% |
| Panama | 27 | 0.1% |
| Peru | 74 | 0.1% |
| Philippines | 800 | 1.4% |
| Poland | 24 | 0.0% |
| Portugal | 17 | 0.0% |
| Romania | 7 | 0.0% |
| Russia | 11 | 0.0% |
| Saudi Arabia | 28 | 0.1% |
| Scotland | 25 | 0.0% |
| South Africa | 21 | 0.0% |
| South America | 356 | 0.6% |
| South Central Asia | 654 | 1.1% |
| South Eastern Asia | 9,543 | 16.8% |
| Southern Europe | 67 | 0.1% |
| Spain | 10 | 0.0% |
| Sri Lanka | 15 | 0.0% |
| Sweden | 34 | 0.1% |
| Syria | 148 | 0.3% |
| Taiwan | 673 | 1.2% |
| Thailand | 76 | 0.1% |
| Trinidad and Tobago | 10 | 0.0% |
| Turkey | 42 | 0.1% |
| Ukraine | 19 | 0.0% |
| Uzbekistan | 14 | 0.0% |
| Venezuela | 9 | 0.0% |
| Vietnam | 8,447 | 14.9% |
| Western Asia | 467 | 0.8% |
| Western Europe | 112 | 0.2% |
| Zimbabwe | 10 | 0.0% | View All 88 Rows |
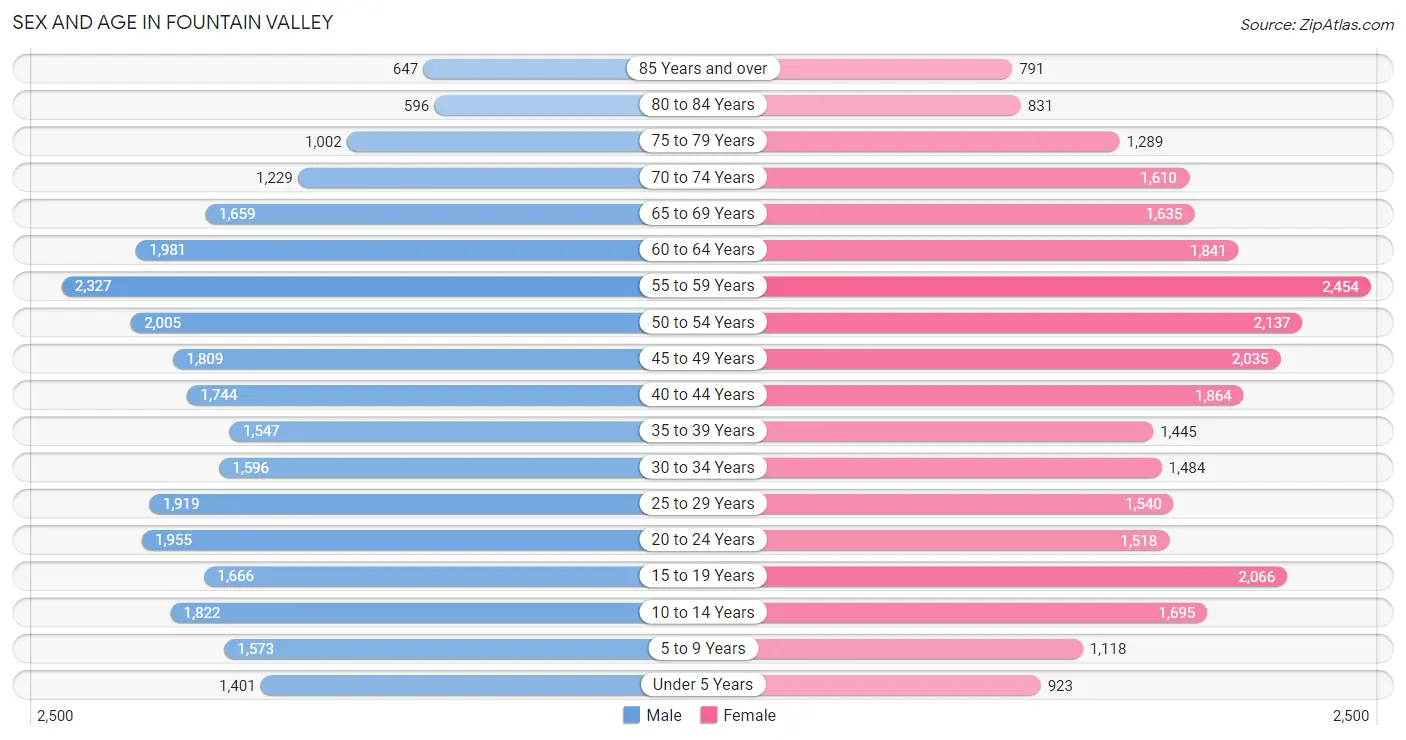
Sex and Age in Fountain Valley
Sex and Age in Fountain Valley
The most populous age groups in Fountain Valley are 55 to 59 Years (2,327 | 8.2%) for men and 55 to 59 Years (2,454 | 8.7%) for women.
| Age Bracket | Male | Female |
| Under 5 Years | 1,401 (4.9%) | 923 (3.3%) |
| 5 to 9 Years | 1,573 (5.5%) | 1,118 (4.0%) |
| 10 to 14 Years | 1,822 (6.4%) | 1,695 (6.0%) |
| 15 to 19 Years | 1,666 (5.9%) | 2,066 (7.3%) |
| 20 to 24 Years | 1,955 (6.9%) | 1,518 (5.4%) |
| 25 to 29 Years | 1,919 (6.7%) | 1,540 (5.4%) |
| 30 to 34 Years | 1,596 (5.6%) | 1,484 (5.2%) |
| 35 to 39 Years | 1,547 (5.4%) | 1,445 (5.1%) |
| 40 to 44 Years | 1,744 (6.1%) | 1,864 (6.6%) |
| 45 to 49 Years | 1,809 (6.4%) | 2,035 (7.2%) |
| 50 to 54 Years | 2,005 (7.0%) | 2,137 (7.6%) |
| 55 to 59 Years | 2,327 (8.2%) | 2,454 (8.7%) |
| 60 to 64 Years | 1,981 (7.0%) | 1,841 (6.5%) |
| 65 to 69 Years | 1,659 (5.8%) | 1,635 (5.8%) |
| 70 to 74 Years | 1,229 (4.3%) | 1,610 (5.7%) |
| 75 to 79 Years | 1,002 (3.5%) | 1,289 (4.6%) |
| 80 to 84 Years | 596 (2.1%) | 831 (2.9%) |
| 85 Years and over | 647 (2.3%) | 791 (2.8%) |
| Total | 28,478 (100.0%) | 28,276 (100.0%) |
Families and Households in Fountain Valley
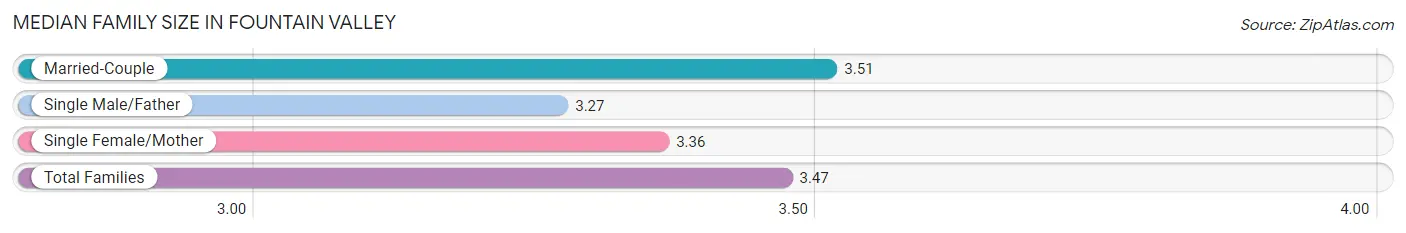
Median Family Size in Fountain Valley
The median family size in Fountain Valley is 3.47 persons per family, with married-couple families (10,789 | 78.4%) accounting for the largest median family size of 3.51 persons per family. On the other hand, single male/father families (1,152 | 8.4%) represent the smallest median family size with 3.27 persons per family.
| Family Type | # Families | Family Size |
| Married-Couple | 10,789 (78.4%) | 3.51 |
| Single Male/Father | 1,152 (8.4%) | 3.27 |
| Single Female/Mother | 1,826 (13.3%) | 3.36 |
| Total Families | 13,767 (100.0%) | 3.47 |
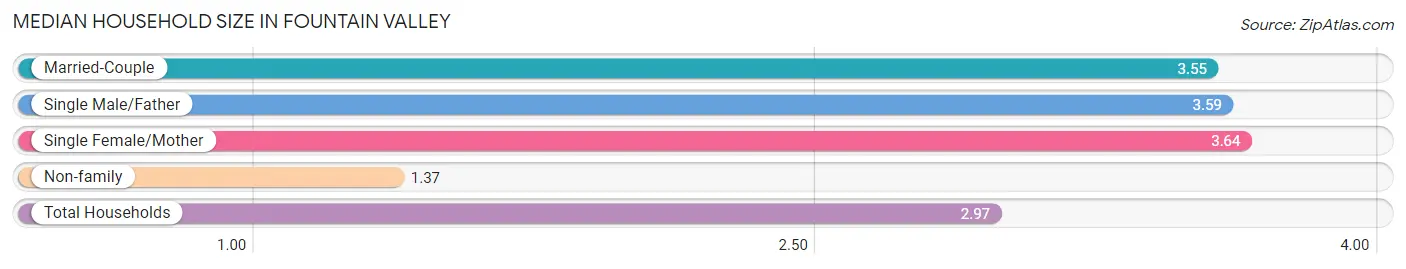
Median Household Size in Fountain Valley
The median household size in Fountain Valley is 2.97 persons per household, with single female/mother households (1,826 | 9.7%) accounting for the largest median household size of 3.64 persons per household. non-family households (5,139 | 27.2%) represent the smallest median household size with 1.37 persons per household.
| Household Type | # Households | Household Size |
| Married-Couple | 10,789 (57.1%) | 3.55 |
| Single Male/Father | 1,152 (6.1%) | 3.59 |
| Single Female/Mother | 1,826 (9.7%) | 3.64 |
| Non-family | 5,139 (27.2%) | 1.37 |
| Total Households | 18,906 (100.0%) | 2.97 |
Household Size by Marriage Status in Fountain Valley
Out of a total of 18,906 households in Fountain Valley, 13,767 (72.8%) are family households, while 5,139 (27.2%) are nonfamily households. The most numerous type of family households are 2-person households, comprising 4,710, and the most common type of nonfamily households are 1-person households, comprising 3,783.
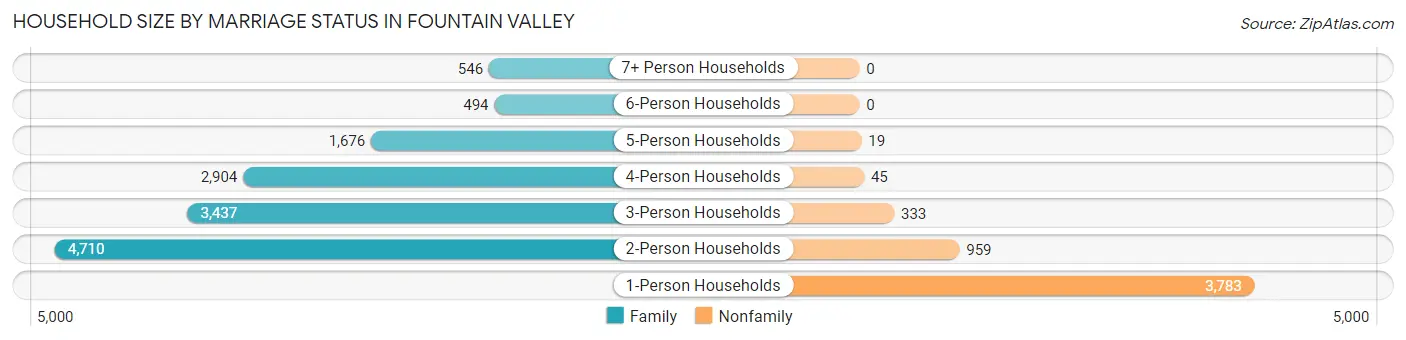
| Household Size | Family Households | Nonfamily Households |
| 1-Person Households | - | 3,783 (20.0%) |
| 2-Person Households | 4,710 (24.9%) | 959 (5.1%) |
| 3-Person Households | 3,437 (18.2%) | 333 (1.8%) |
| 4-Person Households | 2,904 (15.4%) | 45 (0.2%) |
| 5-Person Households | 1,676 (8.9%) | 19 (0.1%) |
| 6-Person Households | 494 (2.6%) | 0 (0.0%) |
| 7+ Person Households | 546 (2.9%) | 0 (0.0%) |
| Total | 13,767 (72.8%) | 5,139 (27.2%) |
Female Fertility in Fountain Valley
Fertility by Age in Fountain Valley
Average fertility rate in Fountain Valley is 23.0 births per 1,000 women. Women in the age bracket of 35 to 50 years have the highest fertility rate with 32.0 births per 1,000 women. Women in the age bracket of 35 to 50 years acount for 66.1% of all women with births.
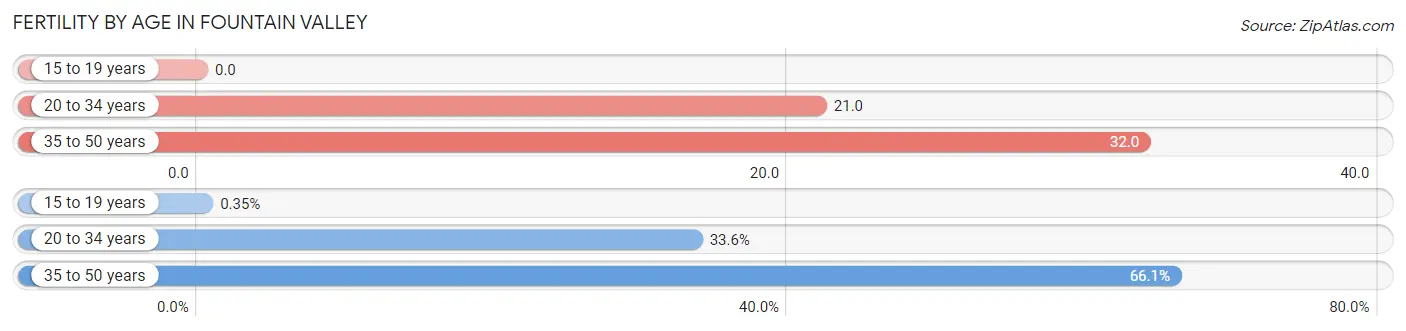
| Age Bracket | Women with Births | Births / 1,000 Women |
| 15 to 19 years | 1 (0.4%) | 0.0 |
| 20 to 34 years | 95 (33.6%) | 21.0 |
| 35 to 50 years | 187 (66.1%) | 32.0 |
| Total | 283 (100.0%) | 23.0 |
Fertility by Age by Marriage Status in Fountain Valley
92.9% of women with births (283) in Fountain Valley are married. The highest percentage of unmarried women with births falls into 15 to 19 years age bracket with 100.0% of them unmarried at the time of birth, while the lowest percentage of unmarried women with births belong to 20 to 34 years age bracket with 0.0% of them unmarried.
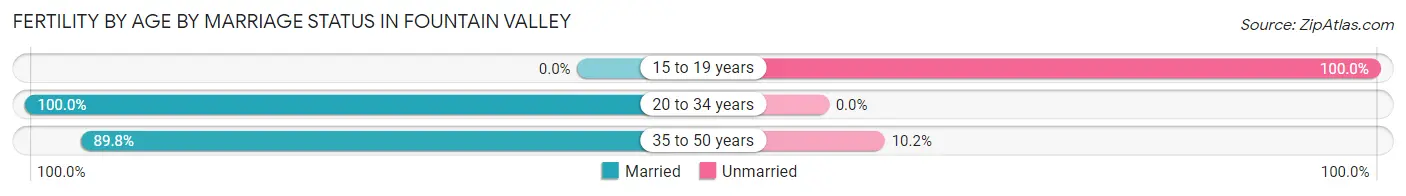
| Age Bracket | Married | Unmarried |
| 15 to 19 years | 0 (0.0%) | 1 (100.0%) |
| 20 to 34 years | 95 (100.0%) | 0 (0.0%) |
| 35 to 50 years | 168 (89.8%) | 19 (10.2%) |
| Total | 263 (92.9%) | 20 (7.1%) |
Fertility by Education in Fountain Valley
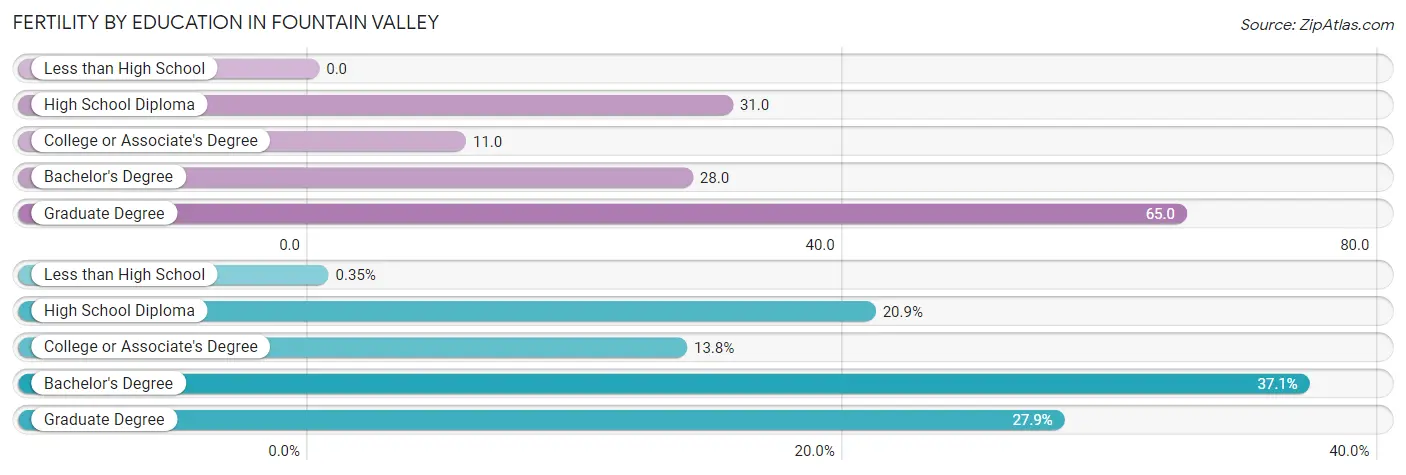
| Educational Attainment | Women with Births | Births / 1,000 Women |
| Less than High School | 1 (0.4%) | 0.0 |
| High School Diploma | 59 (20.8%) | 31.0 |
| College or Associate's Degree | 39 (13.8%) | 11.0 |
| Bachelor's Degree | 105 (37.1%) | 28.0 |
| Graduate Degree | 79 (27.9%) | 65.0 |
| Total | 283 (100.0%) | 23.0 |
Fertility by Education by Marriage Status in Fountain Valley
7.1% of women with births in Fountain Valley are unmarried. Women with the educational attainment of college or associate's degree are most likely to be married with 100.0% of them married at childbirth, while women with the educational attainment of less than high school are least likely to be married with 100.0% of them unmarried at childbirth.
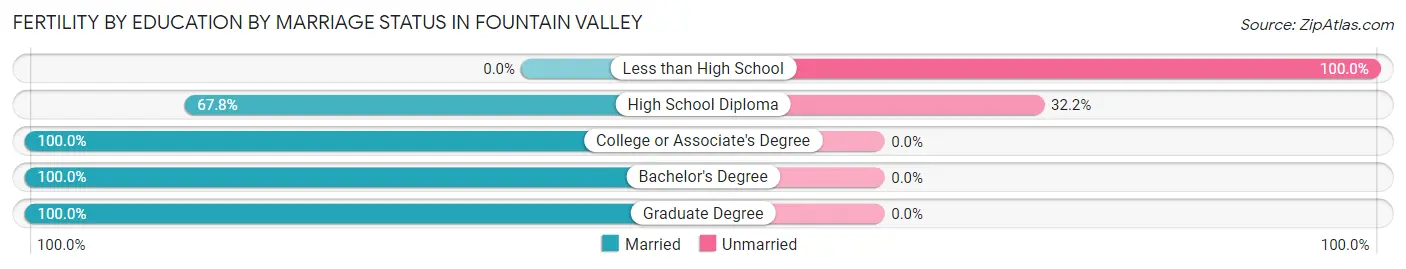
| Educational Attainment | Married | Unmarried |
| Less than High School | 0 (0.0%) | 1 (100.0%) |
| High School Diploma | 40 (67.8%) | 19 (32.2%) |
| College or Associate's Degree | 39 (100.0%) | 0 (0.0%) |
| Bachelor's Degree | 105 (100.0%) | 0 (0.0%) |
| Graduate Degree | 79 (100.0%) | 0 (0.0%) |
| Total | 263 (92.9%) | 20 (7.1%) |
Employment Characteristics in Fountain Valley
Employment by Class of Employer in Fountain Valley
Among the 26,953 employed individuals in Fountain Valley, private company employees (19,317 | 71.7%), local government employees (1,905 | 7.1%), and self-employed (not incorporated) (1,894 | 7.0%) make up the most common classes of employment.
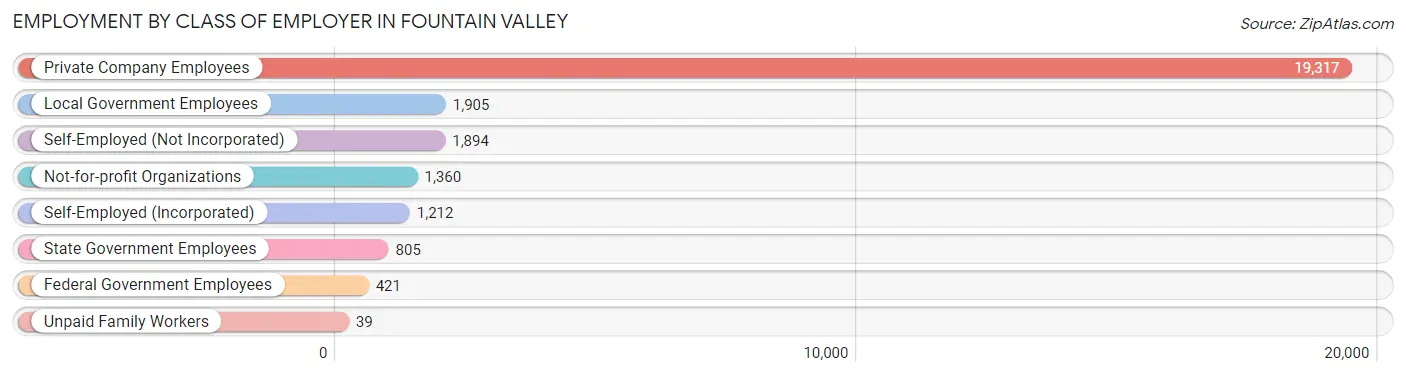
| Employer Class | # Employees | % Employees |
| Private Company Employees | 19,317 | 71.7% |
| Self-Employed (Incorporated) | 1,212 | 4.5% |
| Self-Employed (Not Incorporated) | 1,894 | 7.0% |
| Not-for-profit Organizations | 1,360 | 5.1% |
| Local Government Employees | 1,905 | 7.1% |
| State Government Employees | 805 | 3.0% |
| Federal Government Employees | 421 | 1.6% |
| Unpaid Family Workers | 39 | 0.1% |
| Total | 26,953 | 100.0% |
Employment Status by Age in Fountain Valley
According to the labor force statistics for Fountain Valley, out of the total population over 16 years of age (47,471), 61.8% or 29,337 individuals are in the labor force, with 6.0% or 1,760 of them unemployed. The age group with the highest labor force participation rate is 30 to 34 years, with 88.1% or 2,713 individuals in the labor force. Within the labor force, the 25 to 29 years age range has the highest percentage of unemployed individuals, with 12.2% or 351 of them being unemployed.
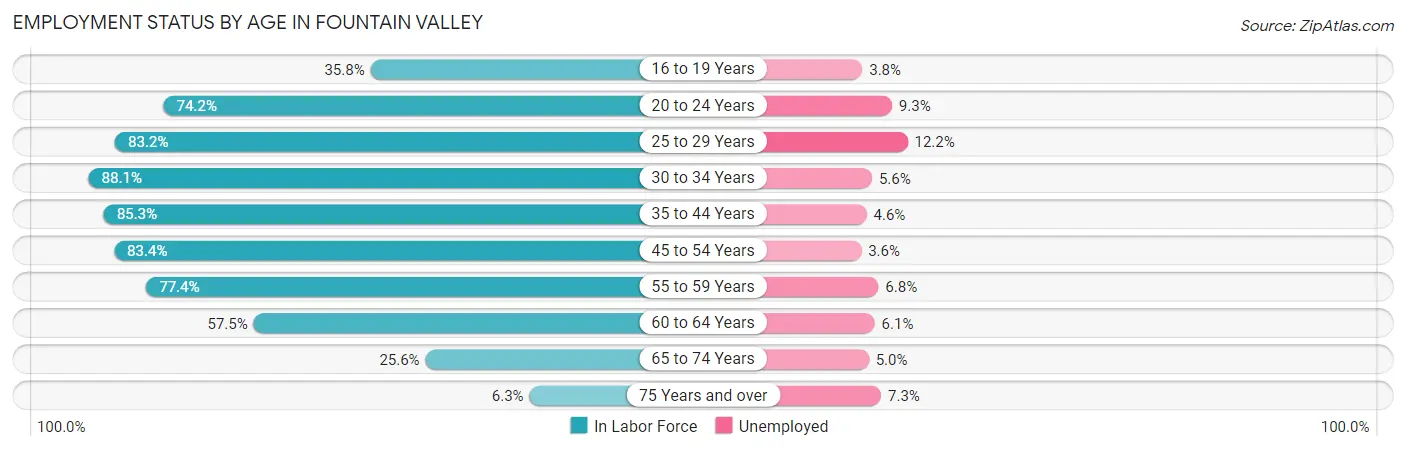
| Age Bracket | In Labor Force | Unemployed |
| 16 to 19 Years | 1,067 (35.8%) | 41 (3.8%) |
| 20 to 24 Years | 2,577 (74.2%) | 240 (9.3%) |
| 25 to 29 Years | 2,878 (83.2%) | 351 (12.2%) |
| 30 to 34 Years | 2,713 (88.1%) | 152 (5.6%) |
| 35 to 44 Years | 5,630 (85.3%) | 259 (4.6%) |
| 45 to 54 Years | 6,660 (83.4%) | 240 (3.6%) |
| 55 to 59 Years | 3,700 (77.4%) | 252 (6.8%) |
| 60 to 64 Years | 2,198 (57.5%) | 134 (6.1%) |
| 65 to 74 Years | 1,570 (25.6%) | 78 (5.0%) |
| 75 Years and over | 325 (6.3%) | 24 (7.3%) |
| Total | 29,337 (61.8%) | 1,760 (6.0%) |
Employment Status by Educational Attainment in Fountain Valley
According to labor force statistics for Fountain Valley, 80.0% of individuals (23,782) out of the total population between 25 and 64 years of age (29,728) are in the labor force, with 5.8% or 1,379 of them being unemployed. The group with the highest labor force participation rate are those with the educational attainment of bachelor's degree or higher, with 86.0% or 11,633 individuals in the labor force. Within the labor force, individuals with college / associate degree education have the highest percentage of unemployment, with 6.9% or 489 of them being unemployed.
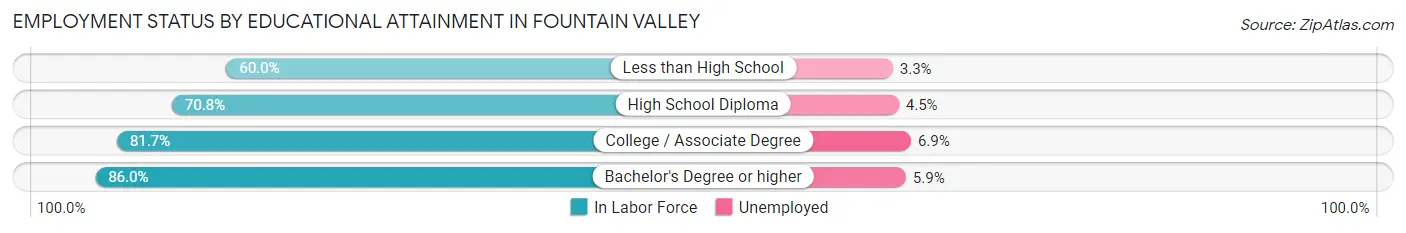
| Educational Attainment | In Labor Force | Unemployed |
| Less than High School | 1,531 (60.0%) | 84 (3.3%) |
| High School Diploma | 3,526 (70.8%) | 224 (4.5%) |
| College / Associate Degree | 7,083 (81.7%) | 598 (6.9%) |
| Bachelor's Degree or higher | 11,633 (86.0%) | 798 (5.9%) |
| Total | 23,782 (80.0%) | 1,724 (5.8%) |
Employment Occupations by Sex in Fountain Valley
Management, Business, Science and Arts Occupations
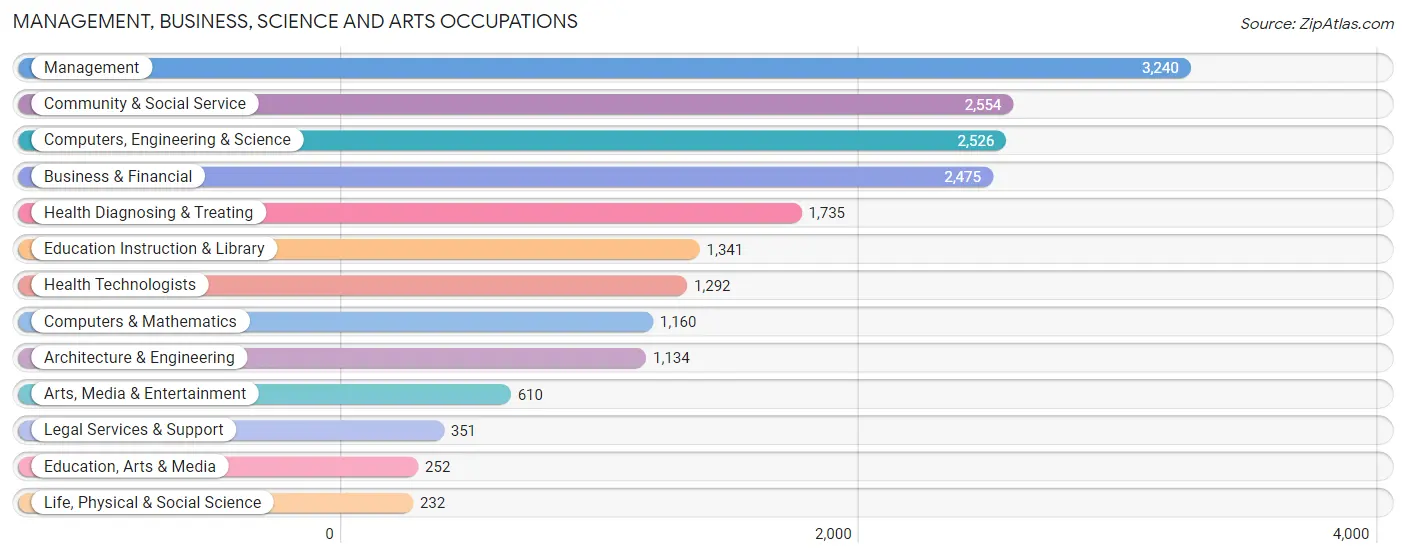
The most common Management, Business, Science and Arts occupations in Fountain Valley are Management (3,240 | 11.8%), Community & Social Service (2,554 | 9.3%), Computers, Engineering & Science (2,526 | 9.2%), Business & Financial (2,475 | 9.0%), and Health Diagnosing & Treating (1,735 | 6.3%).
Management, Business, Science and Arts Occupations by Sex
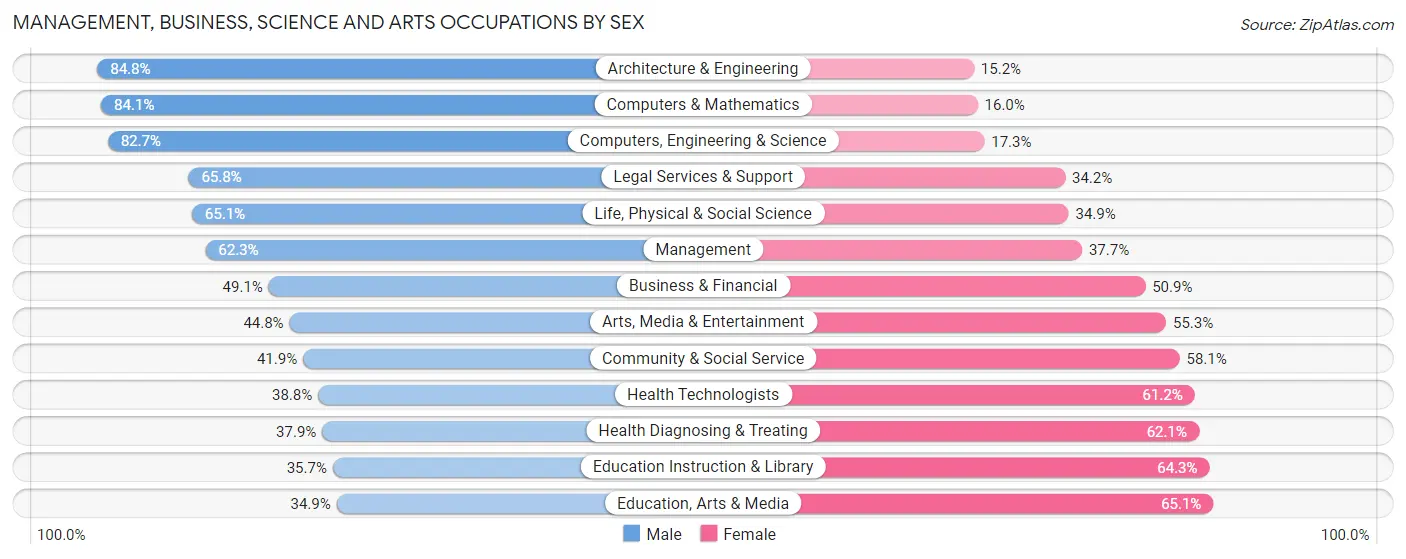
Within the Management, Business, Science and Arts occupations in Fountain Valley, the most male-oriented occupations are Architecture & Engineering (84.8%), Computers & Mathematics (84.1%), and Computers, Engineering & Science (82.7%), while the most female-oriented occupations are Education, Arts & Media (65.1%), Education Instruction & Library (64.3%), and Health Diagnosing & Treating (62.1%).
| Occupation | Male | Female |
| Management | 2,018 (62.3%) | 1,222 (37.7%) |
| Business & Financial | 1,215 (49.1%) | 1,260 (50.9%) |
| Computers, Engineering & Science | 2,088 (82.7%) | 438 (17.3%) |
| Computers & Mathematics | 975 (84.1%) | 185 (16.0%) |
| Architecture & Engineering | 962 (84.8%) | 172 (15.2%) |
| Life, Physical & Social Science | 151 (65.1%) | 81 (34.9%) |
| Community & Social Service | 1,071 (41.9%) | 1,483 (58.1%) |
| Education, Arts & Media | 88 (34.9%) | 164 (65.1%) |
| Legal Services & Support | 231 (65.8%) | 120 (34.2%) |
| Education Instruction & Library | 479 (35.7%) | 862 (64.3%) |
| Arts, Media & Entertainment | 273 (44.8%) | 337 (55.2%) |
| Health Diagnosing & Treating | 658 (37.9%) | 1,077 (62.1%) |
| Health Technologists | 501 (38.8%) | 791 (61.2%) |
| Total (Category) | 7,050 (56.3%) | 5,480 (43.7%) |
| Total (Overall) | 14,486 (52.6%) | 13,057 (47.4%) |
Services Occupations
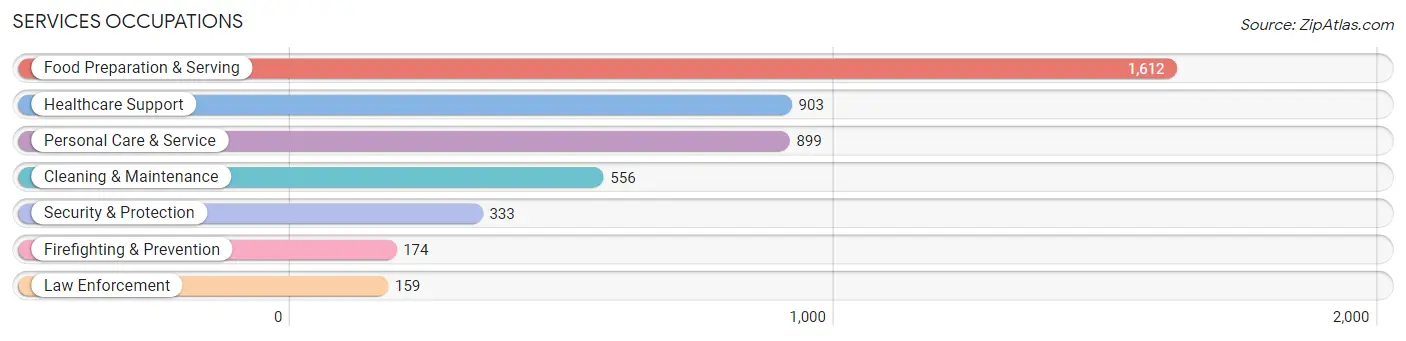
The most common Services occupations in Fountain Valley are Food Preparation & Serving (1,612 | 5.9%), Healthcare Support (903 | 3.3%), Personal Care & Service (899 | 3.3%), Cleaning & Maintenance (556 | 2.0%), and Security & Protection (333 | 1.2%).
Services Occupations by Sex
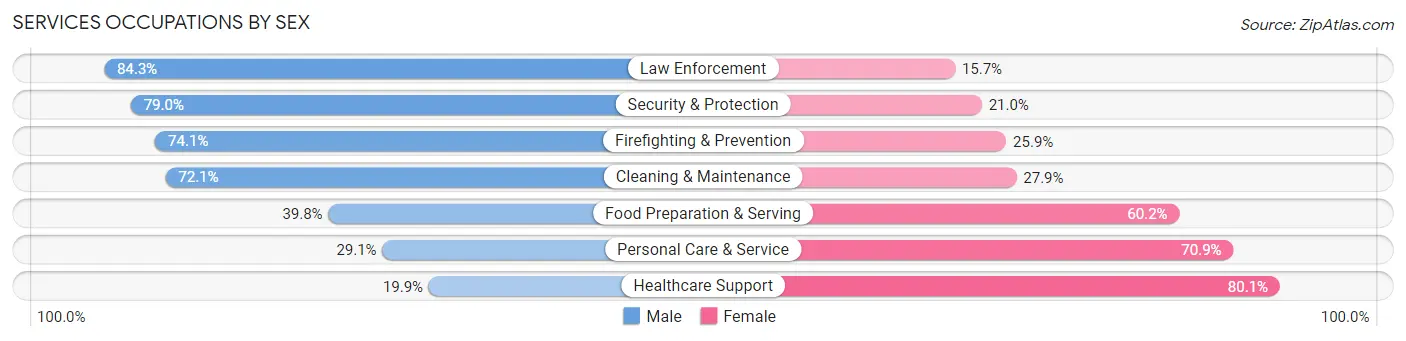
Within the Services occupations in Fountain Valley, the most male-oriented occupations are Law Enforcement (84.3%), Security & Protection (79.0%), and Firefighting & Prevention (74.1%), while the most female-oriented occupations are Healthcare Support (80.1%), Personal Care & Service (70.9%), and Food Preparation & Serving (60.2%).
| Occupation | Male | Female |
| Healthcare Support | 180 (19.9%) | 723 (80.1%) |
| Security & Protection | 263 (79.0%) | 70 (21.0%) |
| Firefighting & Prevention | 129 (74.1%) | 45 (25.9%) |
| Law Enforcement | 134 (84.3%) | 25 (15.7%) |
| Food Preparation & Serving | 642 (39.8%) | 970 (60.2%) |
| Cleaning & Maintenance | 401 (72.1%) | 155 (27.9%) |
| Personal Care & Service | 262 (29.1%) | 637 (70.9%) |
| Total (Category) | 1,748 (40.6%) | 2,555 (59.4%) |
| Total (Overall) | 14,486 (52.6%) | 13,057 (47.4%) |
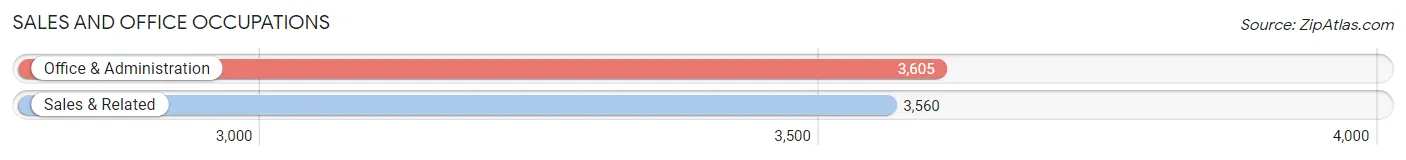
Sales and Office Occupations
The most common Sales and Office occupations in Fountain Valley are Office & Administration (3,605 | 13.1%), and Sales & Related (3,560 | 12.9%).
Sales and Office Occupations by Sex
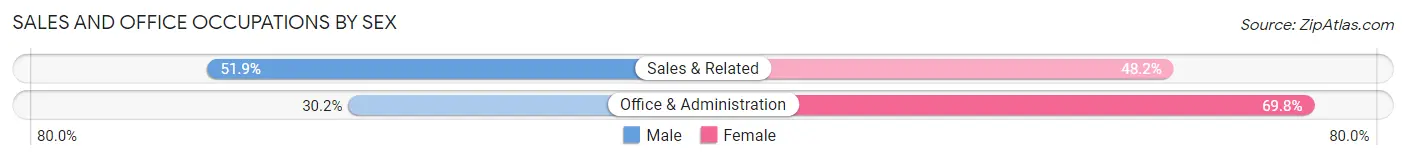
| Occupation | Male | Female |
| Sales & Related | 1,846 (51.8%) | 1,714 (48.1%) |
| Office & Administration | 1,089 (30.2%) | 2,516 (69.8%) |
| Total (Category) | 2,935 (41.0%) | 4,230 (59.0%) |
| Total (Overall) | 14,486 (52.6%) | 13,057 (47.4%) |
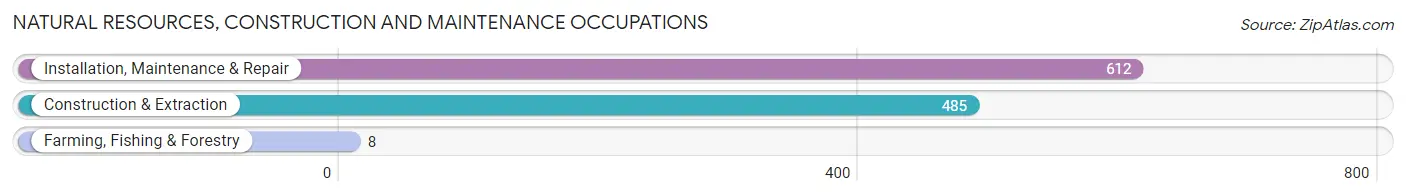
Natural Resources, Construction and Maintenance Occupations
The most common Natural Resources, Construction and Maintenance occupations in Fountain Valley are Installation, Maintenance & Repair (612 | 2.2%), Construction & Extraction (485 | 1.8%), and Farming, Fishing & Forestry (8 | 0.0%).
Natural Resources, Construction and Maintenance Occupations by Sex
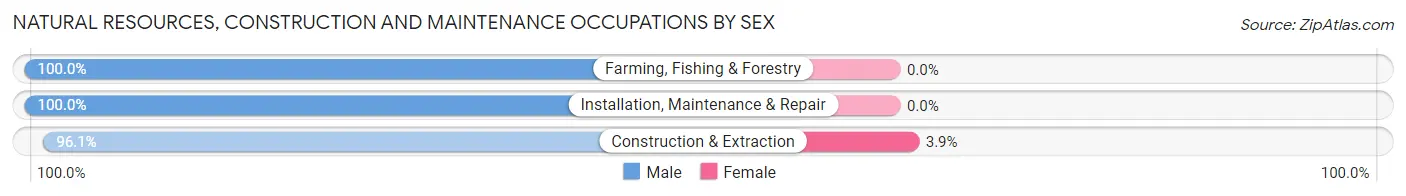
| Occupation | Male | Female |
| Farming, Fishing & Forestry | 8 (100.0%) | 0 (0.0%) |
| Construction & Extraction | 466 (96.1%) | 19 (3.9%) |
| Installation, Maintenance & Repair | 612 (100.0%) | 0 (0.0%) |
| Total (Category) | 1,086 (98.3%) | 19 (1.7%) |
| Total (Overall) | 14,486 (52.6%) | 13,057 (47.4%) |
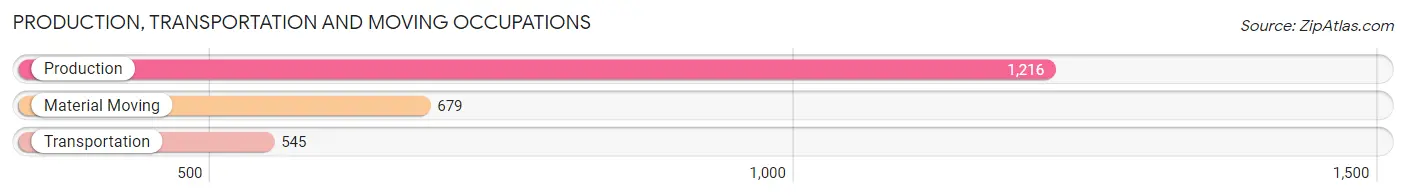
Production, Transportation and Moving Occupations
The most common Production, Transportation and Moving occupations in Fountain Valley are Production (1,216 | 4.4%), Material Moving (679 | 2.5%), and Transportation (545 | 2.0%).
Production, Transportation and Moving Occupations by Sex
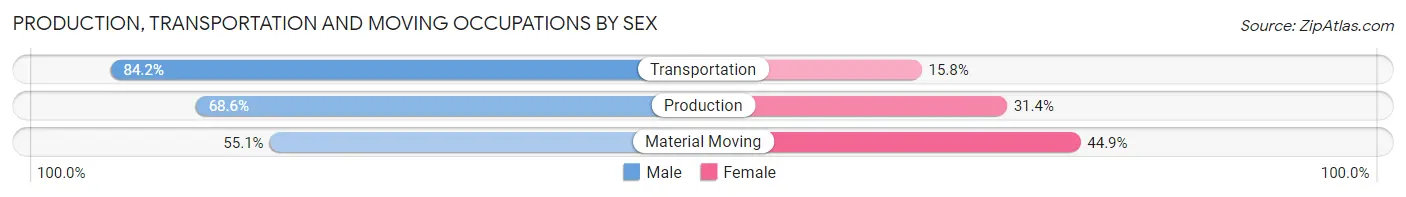
| Occupation | Male | Female |
| Production | 834 (68.6%) | 382 (31.4%) |
| Transportation | 459 (84.2%) | 86 (15.8%) |
| Material Moving | 374 (55.1%) | 305 (44.9%) |
| Total (Category) | 1,667 (68.3%) | 773 (31.7%) |
| Total (Overall) | 14,486 (52.6%) | 13,057 (47.4%) |
Employment Industries by Sex in Fountain Valley
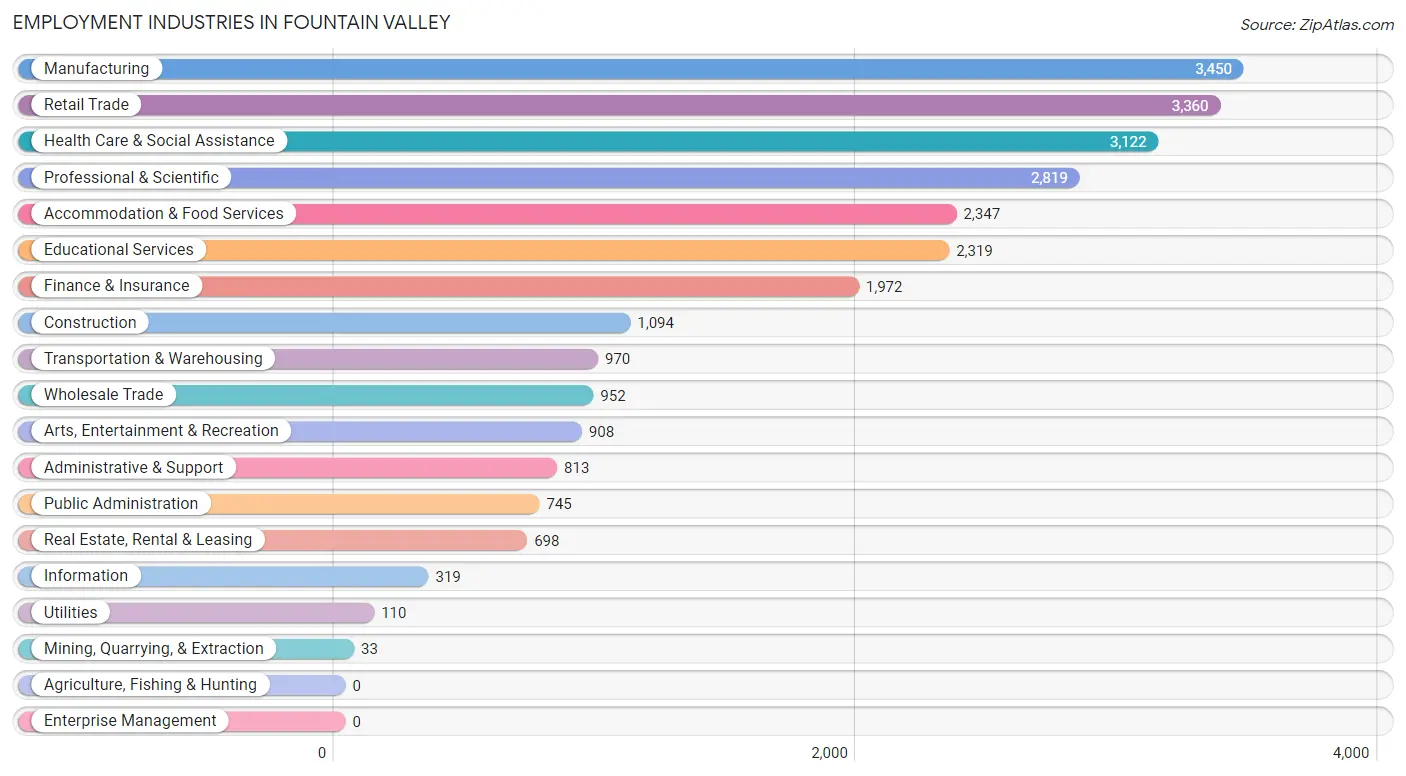
Employment Industries in Fountain Valley
The major employment industries in Fountain Valley include Manufacturing (3,450 | 12.5%), Retail Trade (3,360 | 12.2%), Health Care & Social Assistance (3,122 | 11.3%), Professional & Scientific (2,819 | 10.2%), and Accommodation & Food Services (2,347 | 8.5%).
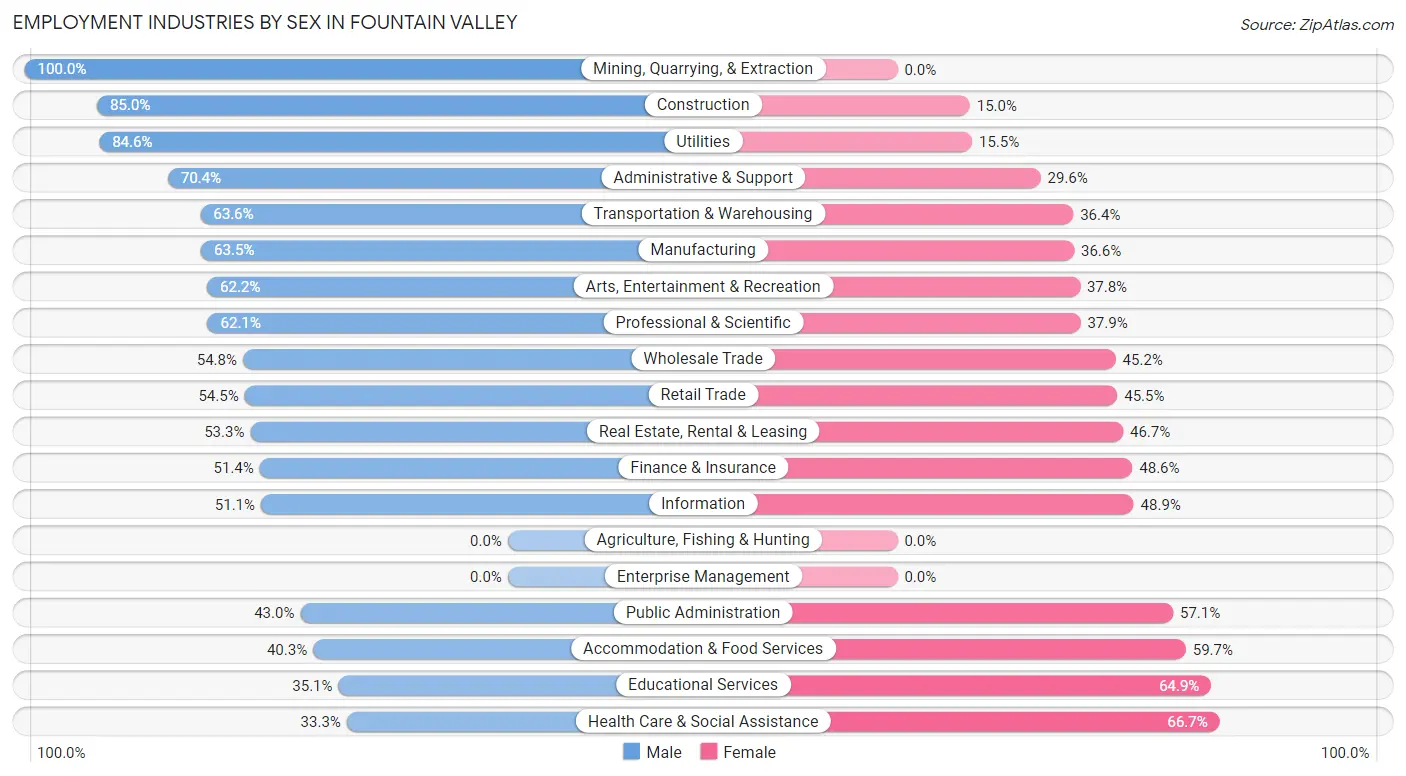
Employment Industries by Sex in Fountain Valley
The Fountain Valley industries that see more men than women are Mining, Quarrying, & Extraction (100.0%), Construction (85.0%), and Utilities (84.6%), whereas the industries that tend to have a higher number of women are Health Care & Social Assistance (66.7%), Educational Services (64.9%), and Accommodation & Food Services (59.7%).
| Industry | Male | Female |
| Agriculture, Fishing & Hunting | 0 (0.0%) | 0 (0.0%) |
| Mining, Quarrying, & Extraction | 33 (100.0%) | 0 (0.0%) |
| Construction | 930 (85.0%) | 164 (15.0%) |
| Manufacturing | 2,189 (63.4%) | 1,261 (36.5%) |
| Wholesale Trade | 522 (54.8%) | 430 (45.2%) |
| Retail Trade | 1,831 (54.5%) | 1,529 (45.5%) |
| Transportation & Warehousing | 617 (63.6%) | 353 (36.4%) |
| Utilities | 93 (84.6%) | 17 (15.4%) |
| Information | 163 (51.1%) | 156 (48.9%) |
| Finance & Insurance | 1,013 (51.4%) | 959 (48.6%) |
| Real Estate, Rental & Leasing | 372 (53.3%) | 326 (46.7%) |
| Professional & Scientific | 1,751 (62.1%) | 1,068 (37.9%) |
| Enterprise Management | 0 (0.0%) | 0 (0.0%) |
| Administrative & Support | 572 (70.4%) | 241 (29.6%) |
| Educational Services | 813 (35.1%) | 1,506 (64.9%) |
| Health Care & Social Assistance | 1,041 (33.3%) | 2,081 (66.7%) |
| Arts, Entertainment & Recreation | 565 (62.2%) | 343 (37.8%) |
| Accommodation & Food Services | 946 (40.3%) | 1,401 (59.7%) |
| Public Administration | 320 (42.9%) | 425 (57.1%) |
| Total | 14,486 (52.6%) | 13,057 (47.4%) |
Education in Fountain Valley
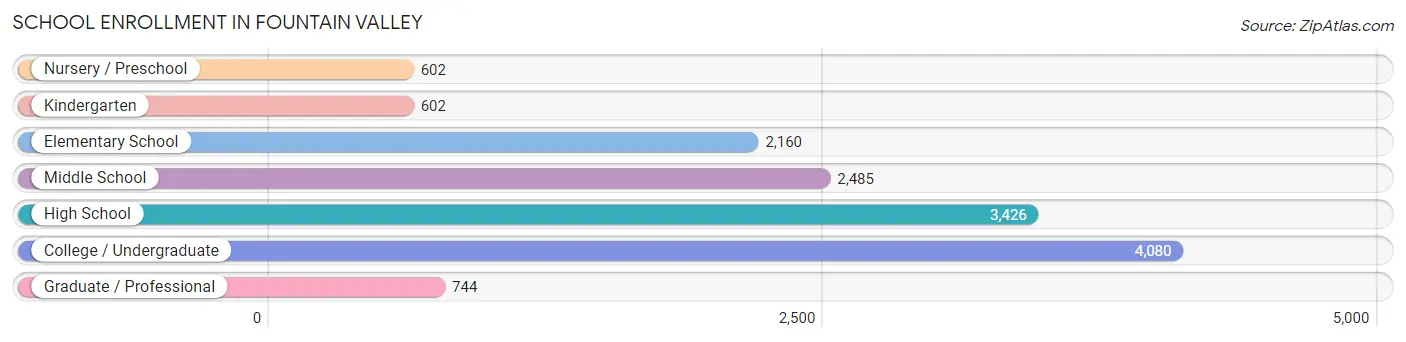
School Enrollment in Fountain Valley
The most common levels of schooling among the 14,099 students in Fountain Valley are college / undergraduate (4,080 | 28.9%), high school (3,426 | 24.3%), and middle school (2,485 | 17.6%).
| School Level | # Students | % Students |
| Nursery / Preschool | 602 | 4.3% |
| Kindergarten | 602 | 4.3% |
| Elementary School | 2,160 | 15.3% |
| Middle School | 2,485 | 17.6% |
| High School | 3,426 | 24.3% |
| College / Undergraduate | 4,080 | 28.9% |
| Graduate / Professional | 744 | 5.3% |
| Total | 14,099 | 100.0% |
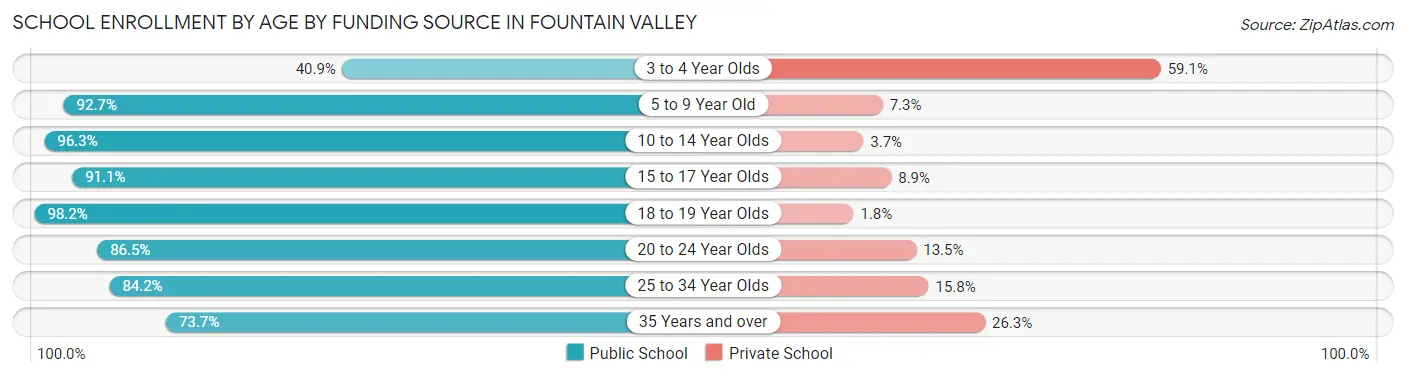
School Enrollment by Age by Funding Source in Fountain Valley
Out of a total of 14,099 students who are enrolled in schools in Fountain Valley, 1,537 (10.9%) attend a private institution, while the remaining 12,562 (89.1%) are enrolled in public schools. The age group of 3 to 4 year olds has the highest likelihood of being enrolled in private schools, with 277 (59.1% in the age bracket) enrolled. Conversely, the age group of 18 to 19 year olds has the lowest likelihood of being enrolled in a private school, with 1,118 (98.2% in the age bracket) attending a public institution.
| Age Bracket | Public School | Private School |
| 3 to 4 Year Olds | 192 (40.9%) | 277 (59.1%) |
| 5 to 9 Year Old | 2,398 (92.7%) | 188 (7.3%) |
| 10 to 14 Year Olds | 3,253 (96.3%) | 124 (3.7%) |
| 15 to 17 Year Olds | 2,168 (91.1%) | 211 (8.9%) |
| 18 to 19 Year Olds | 1,118 (98.2%) | 21 (1.8%) |
| 20 to 24 Year Olds | 1,815 (86.5%) | 284 (13.5%) |
| 25 to 34 Year Olds | 831 (84.2%) | 156 (15.8%) |
| 35 Years and over | 783 (73.7%) | 280 (26.3%) |
| Total | 12,562 (89.1%) | 1,537 (10.9%) |
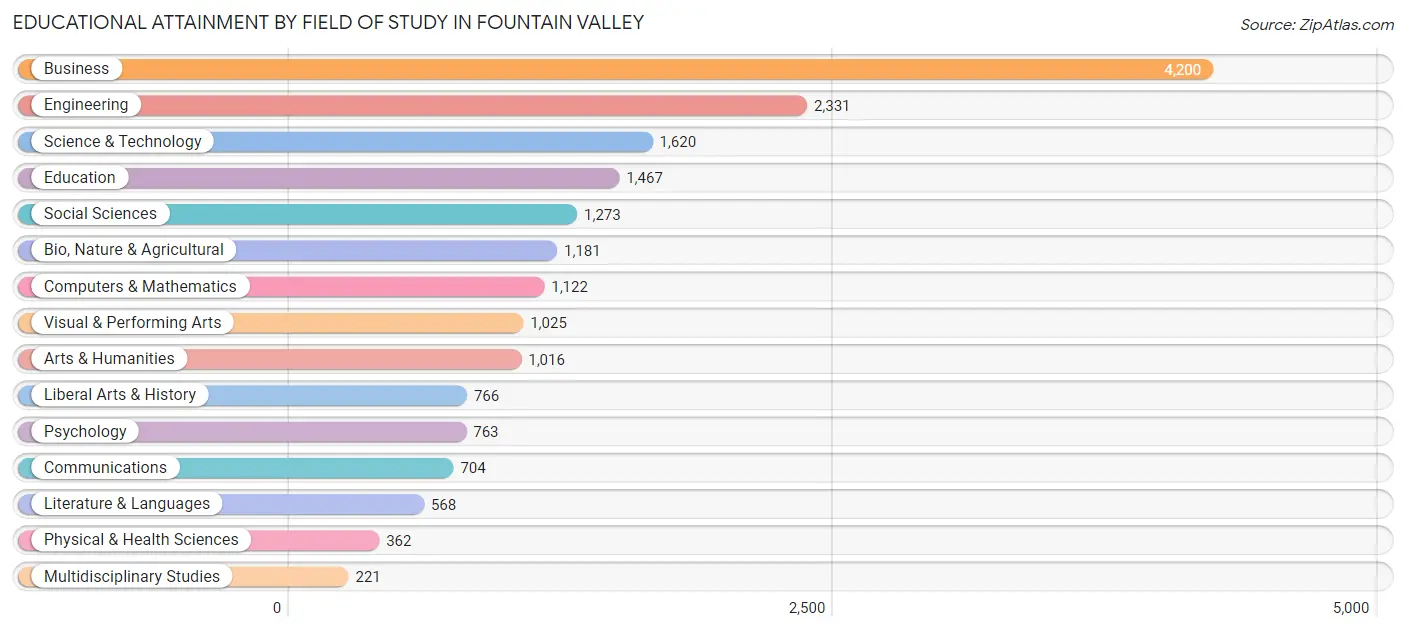
Educational Attainment by Field of Study in Fountain Valley
Business (4,200 | 22.6%), engineering (2,331 | 12.5%), science & technology (1,620 | 8.7%), education (1,467 | 7.9%), and social sciences (1,273 | 6.8%) are the most common fields of study among 18,619 individuals in Fountain Valley who have obtained a bachelor's degree or higher.
| Field of Study | # Graduates | % Graduates |
| Computers & Mathematics | 1,122 | 6.0% |
| Bio, Nature & Agricultural | 1,181 | 6.3% |
| Physical & Health Sciences | 362 | 1.9% |
| Psychology | 763 | 4.1% |
| Social Sciences | 1,273 | 6.8% |
| Engineering | 2,331 | 12.5% |
| Multidisciplinary Studies | 221 | 1.2% |
| Science & Technology | 1,620 | 8.7% |
| Business | 4,200 | 22.6% |
| Education | 1,467 | 7.9% |
| Literature & Languages | 568 | 3.0% |
| Liberal Arts & History | 766 | 4.1% |
| Visual & Performing Arts | 1,025 | 5.5% |
| Communications | 704 | 3.8% |
| Arts & Humanities | 1,016 | 5.5% |
| Total | 18,619 | 100.0% |
Transportation & Commute in Fountain Valley
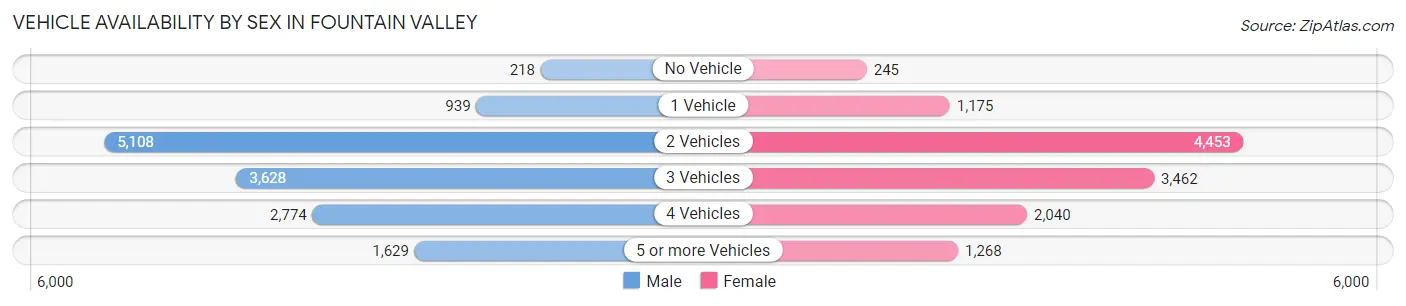
Vehicle Availability by Sex in Fountain Valley
The most prevalent vehicle ownership categories in Fountain Valley are males with 2 vehicles (5,108, accounting for 35.7%) and females with 2 vehicles (4,453, making up 40.4%).
| Vehicles Available | Male | Female |
| No Vehicle | 218 (1.5%) | 245 (1.9%) |
| 1 Vehicle | 939 (6.6%) | 1,175 (9.3%) |
| 2 Vehicles | 5,108 (35.7%) | 4,453 (35.2%) |
| 3 Vehicles | 3,628 (25.4%) | 3,462 (27.4%) |
| 4 Vehicles | 2,774 (19.4%) | 2,040 (16.1%) |
| 5 or more Vehicles | 1,629 (11.4%) | 1,268 (10.0%) |
| Total | 14,296 (100.0%) | 12,643 (100.0%) |
Commute Time in Fountain Valley
The most frequently occuring commute durations in Fountain Valley are 15 to 19 minutes (4,742 commuters, 19.9%), 30 to 34 minutes (4,219 commuters, 17.7%), and 20 to 24 minutes (3,984 commuters, 16.7%).
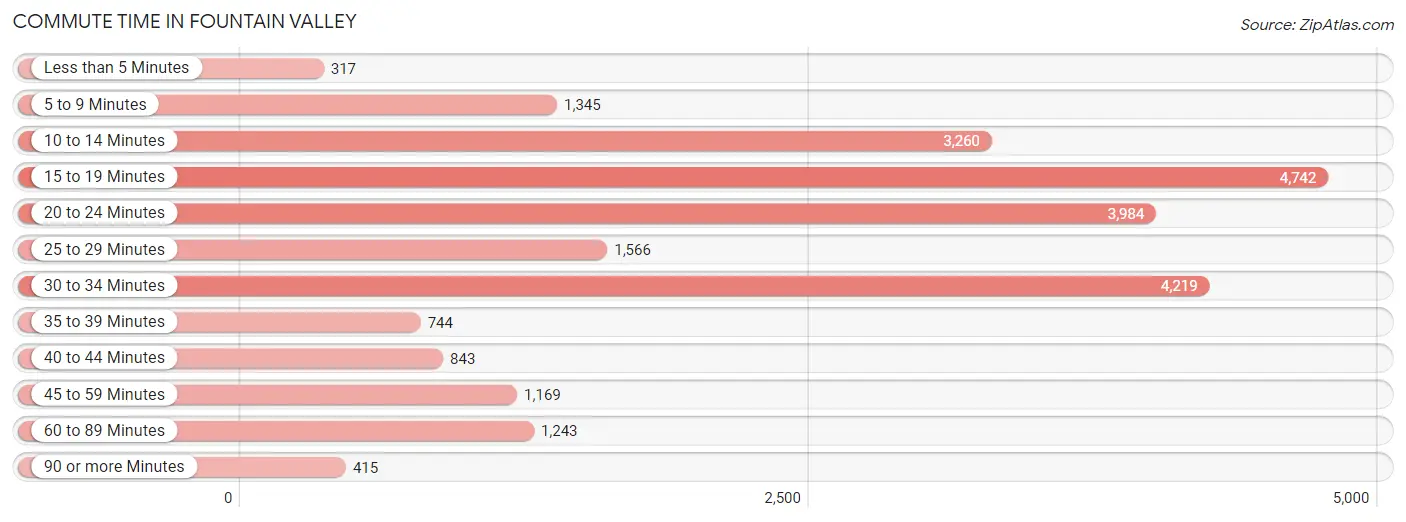
| Commute Time | # Commuters | % Commuters |
| Less than 5 Minutes | 317 | 1.3% |
| 5 to 9 Minutes | 1,345 | 5.6% |
| 10 to 14 Minutes | 3,260 | 13.7% |
| 15 to 19 Minutes | 4,742 | 19.9% |
| 20 to 24 Minutes | 3,984 | 16.7% |
| 25 to 29 Minutes | 1,566 | 6.6% |
| 30 to 34 Minutes | 4,219 | 17.7% |
| 35 to 39 Minutes | 744 | 3.1% |
| 40 to 44 Minutes | 843 | 3.5% |
| 45 to 59 Minutes | 1,169 | 4.9% |
| 60 to 89 Minutes | 1,243 | 5.2% |
| 90 or more Minutes | 415 | 1.7% |
Commute Time by Sex in Fountain Valley
The most common commute times in Fountain Valley are 30 to 34 minutes (2,524 commuters, 20.0%) for males and 15 to 19 minutes (2,304 commuters, 20.5%) for females.
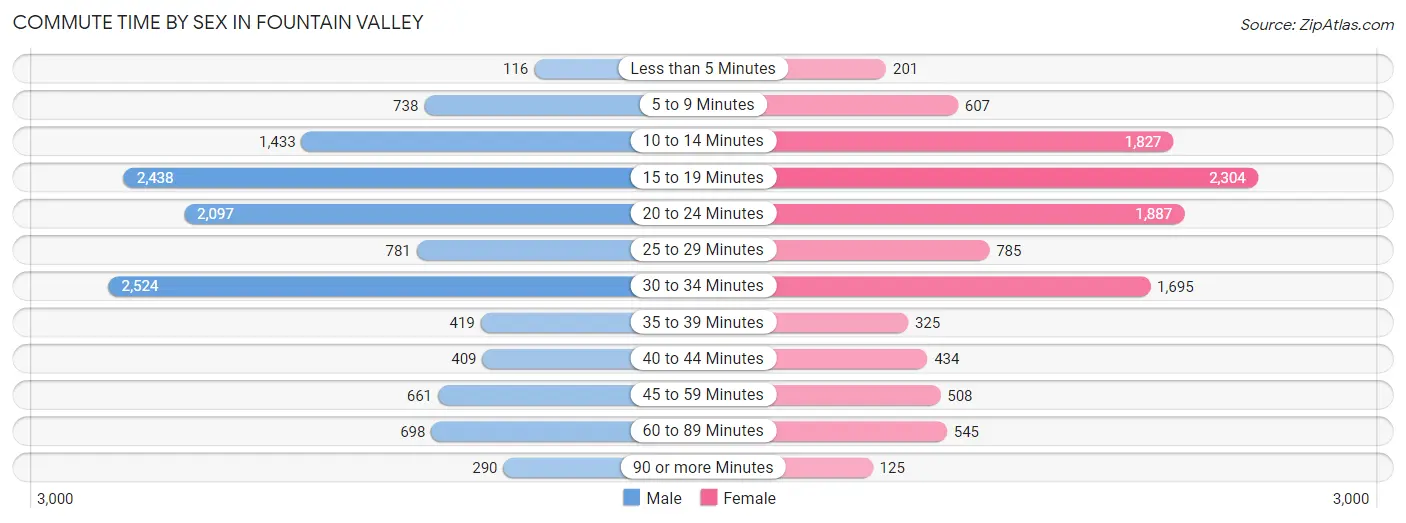
| Commute Time | Male | Female |
| Less than 5 Minutes | 116 (0.9%) | 201 (1.8%) |
| 5 to 9 Minutes | 738 (5.9%) | 607 (5.4%) |
| 10 to 14 Minutes | 1,433 (11.4%) | 1,827 (16.3%) |
| 15 to 19 Minutes | 2,438 (19.3%) | 2,304 (20.5%) |
| 20 to 24 Minutes | 2,097 (16.6%) | 1,887 (16.8%) |
| 25 to 29 Minutes | 781 (6.2%) | 785 (7.0%) |
| 30 to 34 Minutes | 2,524 (20.0%) | 1,695 (15.1%) |
| 35 to 39 Minutes | 419 (3.3%) | 325 (2.9%) |
| 40 to 44 Minutes | 409 (3.3%) | 434 (3.9%) |
| 45 to 59 Minutes | 661 (5.2%) | 508 (4.5%) |
| 60 to 89 Minutes | 698 (5.5%) | 545 (4.9%) |
| 90 or more Minutes | 290 (2.3%) | 125 (1.1%) |
Time of Departure to Work by Sex in Fountain Valley
The most frequent times of departure to work in Fountain Valley are 7:00 AM to 7:29 AM (1,854, 14.7%) for males and 7:00 AM to 7:29 AM (1,692, 15.0%) for females.
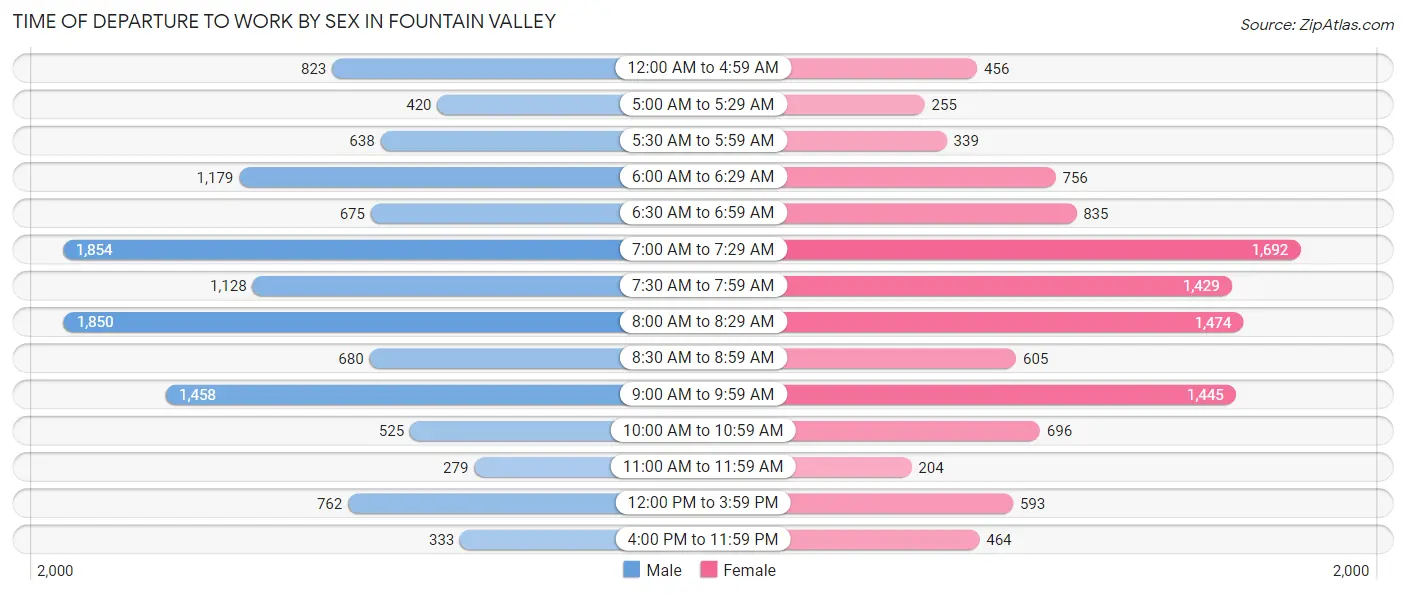
| Time of Departure | Male | Female |
| 12:00 AM to 4:59 AM | 823 (6.5%) | 456 (4.1%) |
| 5:00 AM to 5:29 AM | 420 (3.3%) | 255 (2.3%) |
| 5:30 AM to 5:59 AM | 638 (5.1%) | 339 (3.0%) |
| 6:00 AM to 6:29 AM | 1,179 (9.3%) | 756 (6.7%) |
| 6:30 AM to 6:59 AM | 675 (5.4%) | 835 (7.4%) |
| 7:00 AM to 7:29 AM | 1,854 (14.7%) | 1,692 (15.0%) |
| 7:30 AM to 7:59 AM | 1,128 (8.9%) | 1,429 (12.7%) |
| 8:00 AM to 8:29 AM | 1,850 (14.7%) | 1,474 (13.1%) |
| 8:30 AM to 8:59 AM | 680 (5.4%) | 605 (5.4%) |
| 9:00 AM to 9:59 AM | 1,458 (11.6%) | 1,445 (12.9%) |
| 10:00 AM to 10:59 AM | 525 (4.2%) | 696 (6.2%) |
| 11:00 AM to 11:59 AM | 279 (2.2%) | 204 (1.8%) |
| 12:00 PM to 3:59 PM | 762 (6.0%) | 593 (5.3%) |
| 4:00 PM to 11:59 PM | 333 (2.6%) | 464 (4.1%) |
| Total | 12,604 (100.0%) | 11,243 (100.0%) |
Housing Occupancy in Fountain Valley
Occupancy by Ownership in Fountain Valley
Of the total 18,906 dwellings in Fountain Valley, owner-occupied units account for 12,455 (65.9%), while renter-occupied units make up 6,451 (34.1%).
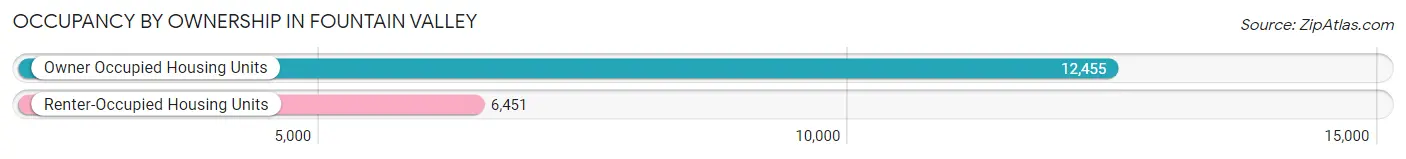
| Occupancy | # Housing Units | % Housing Units |
| Owner Occupied Housing Units | 12,455 | 65.9% |
| Renter-Occupied Housing Units | 6,451 | 34.1% |
| Total Occupied Housing Units | 18,906 | 100.0% |
Occupancy by Household Size in Fountain Valley
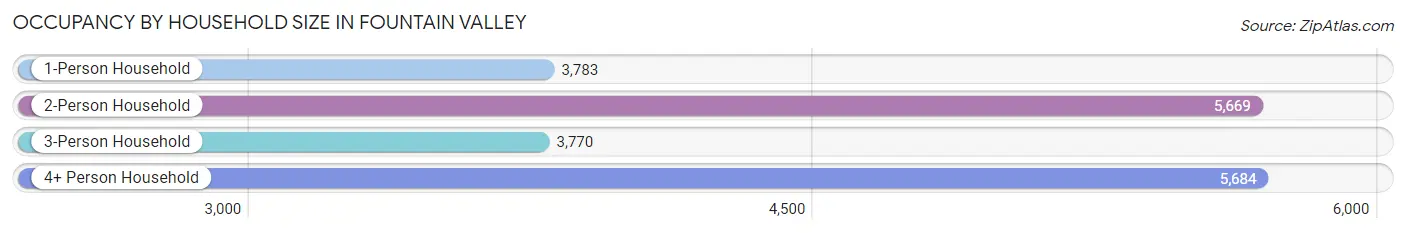
| Household Size | # Housing Units | % Housing Units |
| 1-Person Household | 3,783 | 20.0% |
| 2-Person Household | 5,669 | 30.0% |
| 3-Person Household | 3,770 | 19.9% |
| 4+ Person Household | 5,684 | 30.1% |
| Total Housing Units | 18,906 | 100.0% |
Occupancy by Ownership by Household Size in Fountain Valley
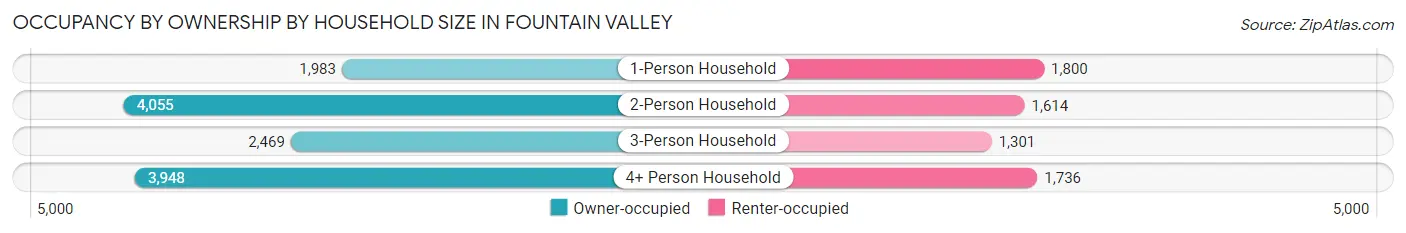
| Household Size | Owner-occupied | Renter-occupied |
| 1-Person Household | 1,983 (52.4%) | 1,800 (47.6%) |
| 2-Person Household | 4,055 (71.5%) | 1,614 (28.5%) |
| 3-Person Household | 2,469 (65.5%) | 1,301 (34.5%) |
| 4+ Person Household | 3,948 (69.5%) | 1,736 (30.5%) |
| Total Housing Units | 12,455 (65.9%) | 6,451 (34.1%) |
Occupancy by Educational Attainment in Fountain Valley
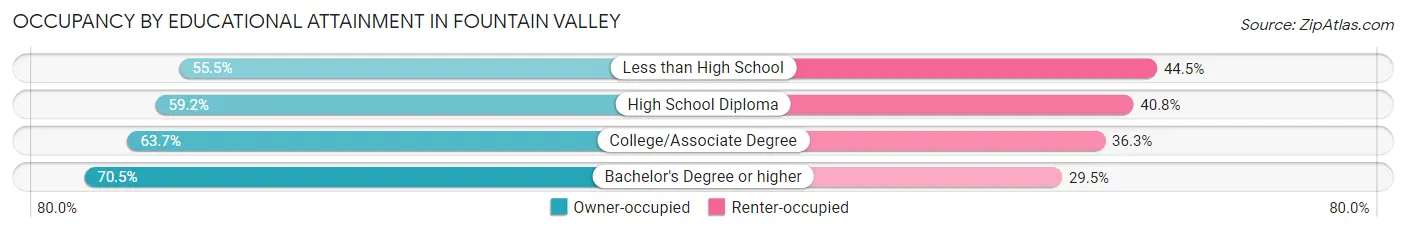
| Household Size | Owner-occupied | Renter-occupied |
| Less than High School | 630 (55.5%) | 506 (44.5%) |
| High School Diploma | 1,649 (59.2%) | 1,136 (40.8%) |
| College/Associate Degree | 3,651 (63.7%) | 2,082 (36.3%) |
| Bachelor's Degree or higher | 6,525 (70.5%) | 2,727 (29.5%) |
Occupancy by Age of Householder in Fountain Valley
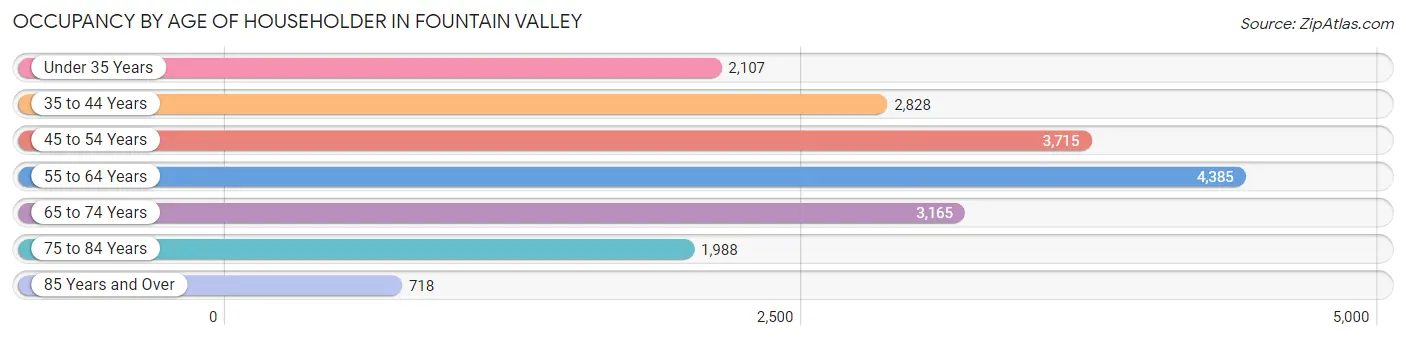
| Age Bracket | # Households | % Households |
| Under 35 Years | 2,107 | 11.1% |
| 35 to 44 Years | 2,828 | 15.0% |
| 45 to 54 Years | 3,715 | 19.7% |
| 55 to 64 Years | 4,385 | 23.2% |
| 65 to 74 Years | 3,165 | 16.7% |
| 75 to 84 Years | 1,988 | 10.5% |
| 85 Years and Over | 718 | 3.8% |
| Total | 18,906 | 100.0% |
Housing Finances in Fountain Valley
Median Income by Occupancy in Fountain Valley
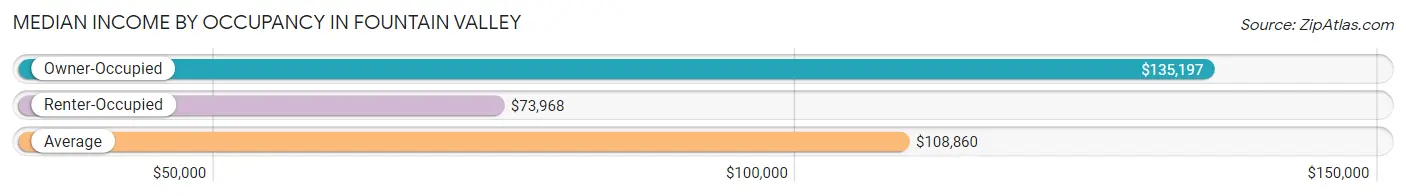
| Occupancy Type | # Households | Median Income |
| Owner-Occupied | 12,455 (65.9%) | $135,197 |
| Renter-Occupied | 6,451 (34.1%) | $73,968 |
| Average | 18,906 (100.0%) | $108,860 |
Occupancy by Householder Income Bracket in Fountain Valley
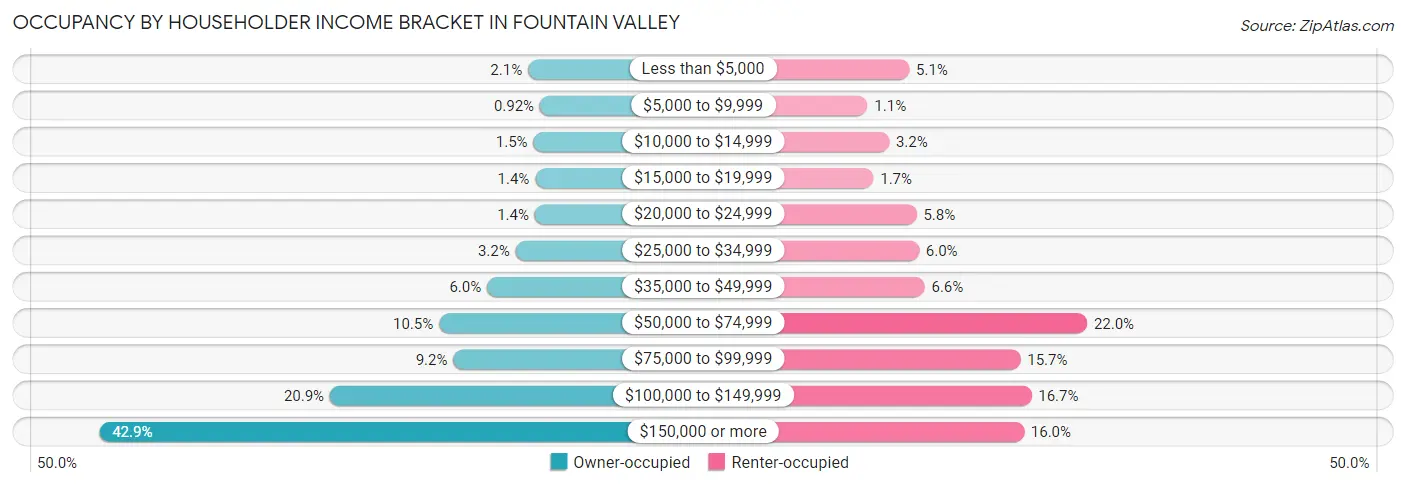
| Income Bracket | Owner-occupied | Renter-occupied |
| Less than $5,000 | 256 (2.1%) | 329 (5.1%) |
| $5,000 to $9,999 | 115 (0.9%) | 73 (1.1%) |
| $10,000 to $14,999 | 192 (1.5%) | 205 (3.2%) |
| $15,000 to $19,999 | 171 (1.4%) | 109 (1.7%) |
| $20,000 to $24,999 | 175 (1.4%) | 374 (5.8%) |
| $25,000 to $34,999 | 403 (3.2%) | 389 (6.0%) |
| $35,000 to $49,999 | 742 (6.0%) | 424 (6.6%) |
| $50,000 to $74,999 | 1,312 (10.5%) | 1,422 (22.0%) |
| $75,000 to $99,999 | 1,142 (9.2%) | 1,012 (15.7%) |
| $100,000 to $149,999 | 2,605 (20.9%) | 1,080 (16.7%) |
| $150,000 or more | 5,342 (42.9%) | 1,034 (16.0%) |
| Total | 12,455 (100.0%) | 6,451 (100.0%) |
Monthly Housing Cost Tiers in Fountain Valley
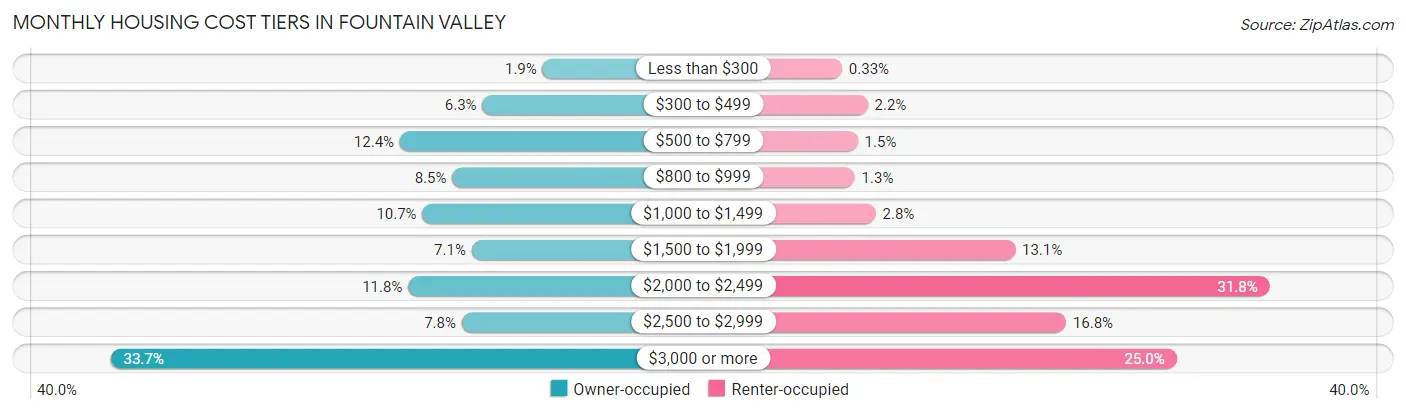
| Monthly Cost | Owner-occupied | Renter-occupied |
| Less than $300 | 231 (1.8%) | 21 (0.3%) |
| $300 to $499 | 782 (6.3%) | 143 (2.2%) |
| $500 to $799 | 1,540 (12.4%) | 96 (1.5%) |
| $800 to $999 | 1,059 (8.5%) | 82 (1.3%) |
| $1,000 to $1,499 | 1,333 (10.7%) | 181 (2.8%) |
| $1,500 to $1,999 | 881 (7.1%) | 844 (13.1%) |
| $2,000 to $2,499 | 1,464 (11.7%) | 2,053 (31.8%) |
| $2,500 to $2,999 | 972 (7.8%) | 1,086 (16.8%) |
| $3,000 or more | 4,193 (33.7%) | 1,611 (25.0%) |
| Total | 12,455 (100.0%) | 6,451 (100.0%) |
Physical Housing Characteristics in Fountain Valley
Housing Structures in Fountain Valley
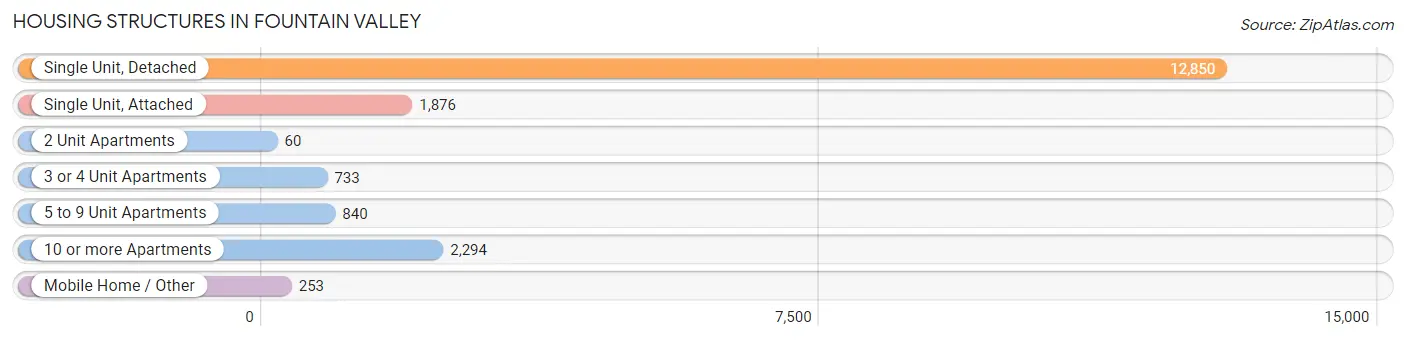
| Structure Type | # Housing Units | % Housing Units |
| Single Unit, Detached | 12,850 | 68.0% |
| Single Unit, Attached | 1,876 | 9.9% |
| 2 Unit Apartments | 60 | 0.3% |
| 3 or 4 Unit Apartments | 733 | 3.9% |
| 5 to 9 Unit Apartments | 840 | 4.4% |
| 10 or more Apartments | 2,294 | 12.1% |
| Mobile Home / Other | 253 | 1.3% |
| Total | 18,906 | 100.0% |
Housing Structures by Occupancy in Fountain Valley
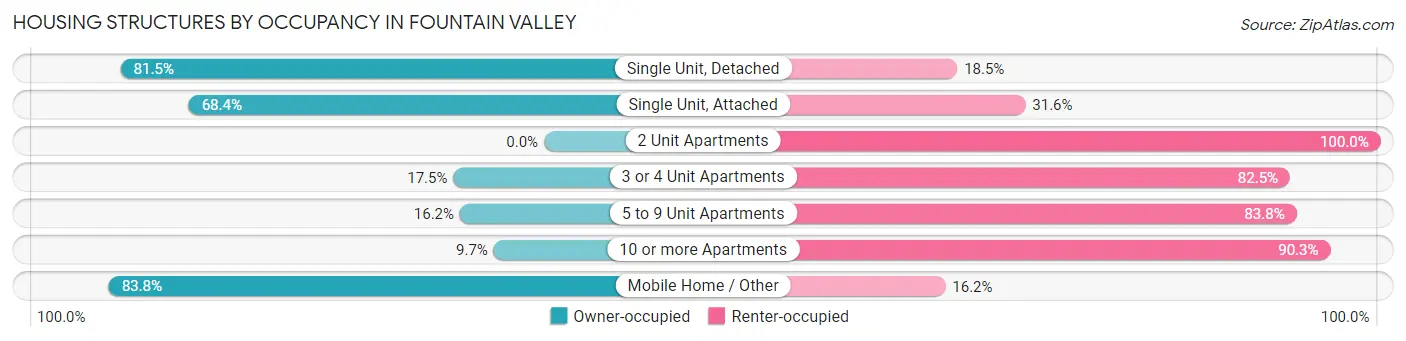
| Structure Type | Owner-occupied | Renter-occupied |
| Single Unit, Detached | 10,474 (81.5%) | 2,376 (18.5%) |
| Single Unit, Attached | 1,283 (68.4%) | 593 (31.6%) |
| 2 Unit Apartments | 0 (0.0%) | 60 (100.0%) |
| 3 or 4 Unit Apartments | 128 (17.5%) | 605 (82.5%) |
| 5 to 9 Unit Apartments | 136 (16.2%) | 704 (83.8%) |
| 10 or more Apartments | 222 (9.7%) | 2,072 (90.3%) |
| Mobile Home / Other | 212 (83.8%) | 41 (16.2%) |
| Total | 12,455 (65.9%) | 6,451 (34.1%) |
Housing Structures by Number of Rooms in Fountain Valley
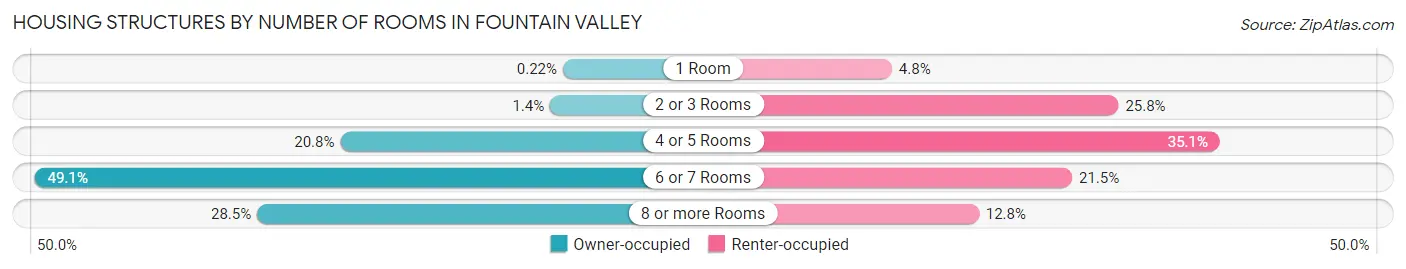
| Number of Rooms | Owner-occupied | Renter-occupied |
| 1 Room | 27 (0.2%) | 310 (4.8%) |
| 2 or 3 Rooms | 174 (1.4%) | 1,662 (25.8%) |
| 4 or 5 Rooms | 2,591 (20.8%) | 2,266 (35.1%) |
| 6 or 7 Rooms | 6,113 (49.1%) | 1,385 (21.5%) |
| 8 or more Rooms | 3,550 (28.5%) | 828 (12.8%) |
| Total | 12,455 (100.0%) | 6,451 (100.0%) |
Housing Structure by Heating Type in Fountain Valley
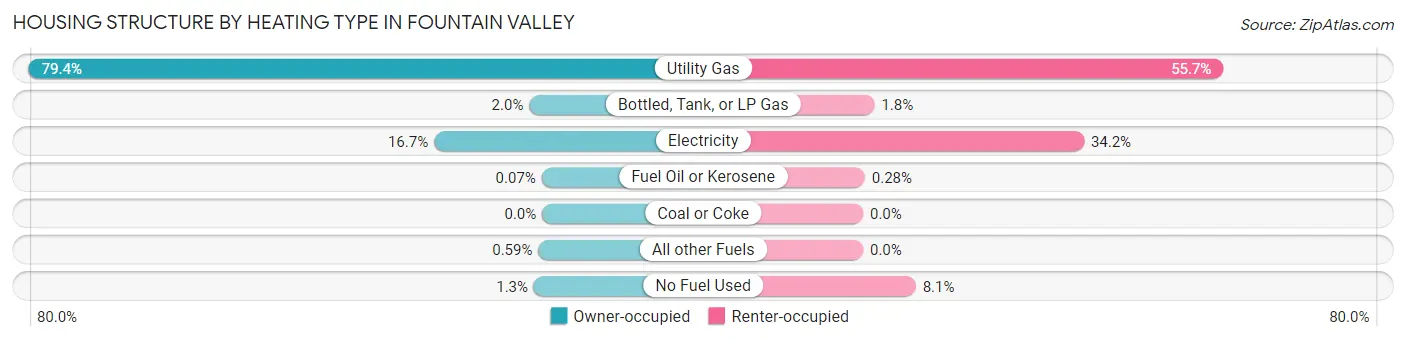
| Heating Type | Owner-occupied | Renter-occupied |
| Utility Gas | 9,886 (79.4%) | 3,591 (55.7%) |
| Bottled, Tank, or LP Gas | 248 (2.0%) | 114 (1.8%) |
| Electricity | 2,081 (16.7%) | 2,203 (34.2%) |
| Fuel Oil or Kerosene | 9 (0.1%) | 18 (0.3%) |
| Coal or Coke | 0 (0.0%) | 0 (0.0%) |
| All other Fuels | 73 (0.6%) | 0 (0.0%) |
| No Fuel Used | 158 (1.3%) | 525 (8.1%) |
| Total | 12,455 (100.0%) | 6,451 (100.0%) |
Household Vehicle Usage in Fountain Valley
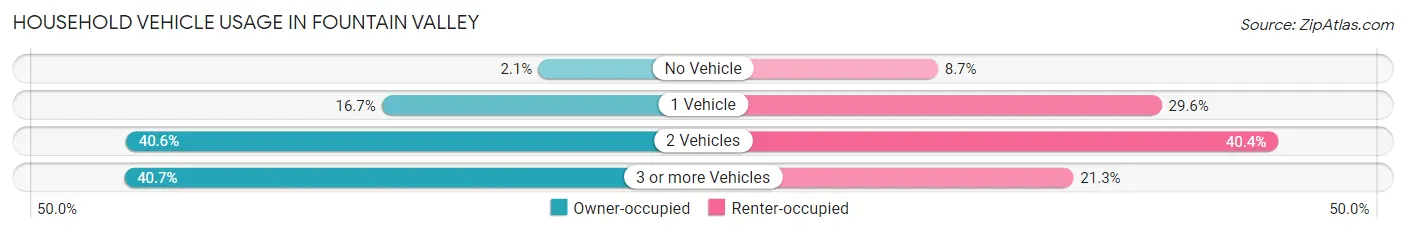
| Vehicles per Household | Owner-occupied | Renter-occupied |
| No Vehicle | 257 (2.1%) | 559 (8.7%) |
| 1 Vehicle | 2,078 (16.7%) | 1,907 (29.6%) |
| 2 Vehicles | 5,051 (40.6%) | 2,609 (40.4%) |
| 3 or more Vehicles | 5,069 (40.7%) | 1,376 (21.3%) |
| Total | 12,455 (100.0%) | 6,451 (100.0%) |
Real Estate & Mortgages in Fountain Valley
Real Estate and Mortgage Overview in Fountain Valley
| Characteristic | Without Mortgage | With Mortgage |
| Housing Units | 4,720 | 7,735 |
| Median Property Value | $932,200 | $933,200 |
| Median Household Income | $99,692 | $3,934 |
| Monthly Housing Costs | $774 | $4,173 |
| Real Estate Taxes | $4,414 | $83 |
Property Value by Mortgage Status in Fountain Valley
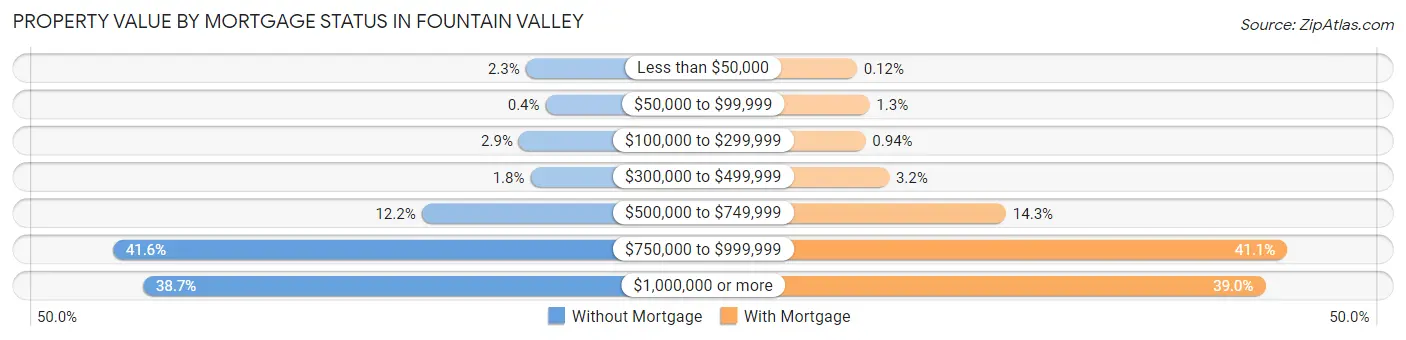
| Property Value | Without Mortgage | With Mortgage |
| Less than $50,000 | 108 (2.3%) | 9 (0.1%) |
| $50,000 to $99,999 | 19 (0.4%) | 102 (1.3%) |
| $100,000 to $299,999 | 139 (2.9%) | 73 (0.9%) |
| $300,000 to $499,999 | 87 (1.8%) | 246 (3.2%) |
| $500,000 to $749,999 | 576 (12.2%) | 1,108 (14.3%) |
| $750,000 to $999,999 | 1,963 (41.6%) | 3,179 (41.1%) |
| $1,000,000 or more | 1,828 (38.7%) | 3,018 (39.0%) |
| Total | 4,720 (100.0%) | 7,735 (100.0%) |
Household Income by Mortgage Status in Fountain Valley
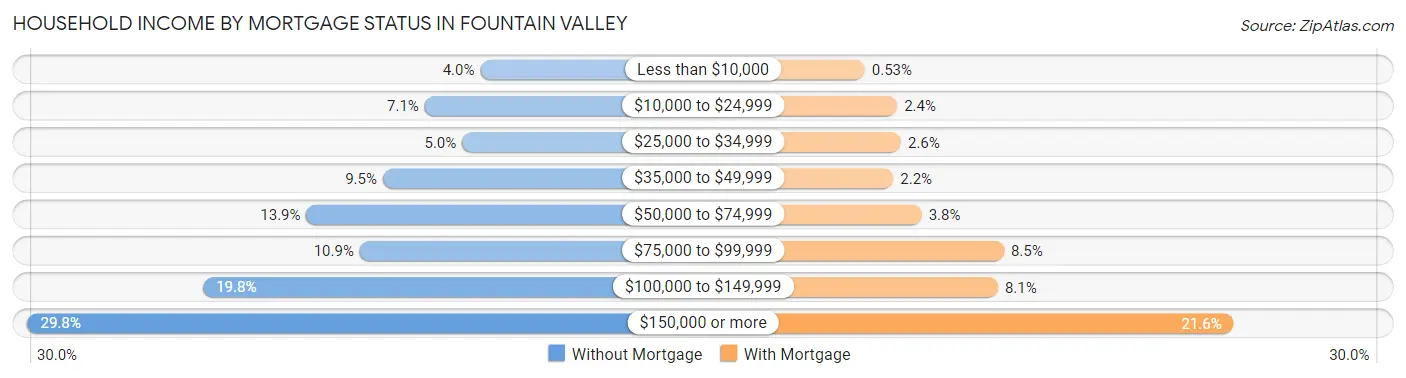
| Household Income | Without Mortgage | With Mortgage |
| Less than $10,000 | 187 (4.0%) | 41 (0.5%) |
| $10,000 to $24,999 | 337 (7.1%) | 184 (2.4%) |
| $25,000 to $34,999 | 236 (5.0%) | 201 (2.6%) |
| $35,000 to $49,999 | 450 (9.5%) | 167 (2.2%) |
| $50,000 to $74,999 | 656 (13.9%) | 292 (3.8%) |
| $75,000 to $99,999 | 512 (10.8%) | 656 (8.5%) |
| $100,000 to $149,999 | 934 (19.8%) | 630 (8.1%) |
| $150,000 or more | 1,408 (29.8%) | 1,671 (21.6%) |
| Total | 4,720 (100.0%) | 7,735 (100.0%) |
Property Value to Household Income Ratio in Fountain Valley
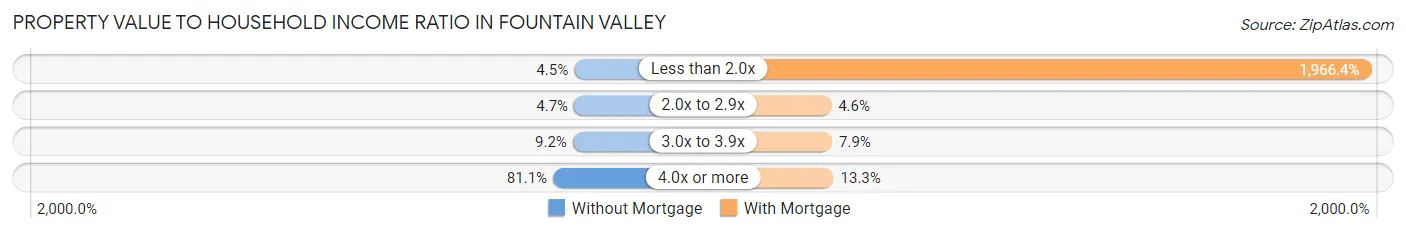
| Value-to-Income Ratio | Without Mortgage | With Mortgage |
| Less than 2.0x | 213 (4.5%) | 152,104 (1,966.4%) |
| 2.0x to 2.9x | 220 (4.7%) | 358 (4.6%) |
| 3.0x to 3.9x | 432 (9.1%) | 612 (7.9%) |
| 4.0x or more | 3,828 (81.1%) | 1,032 (13.3%) |
| Total | 4,720 (100.0%) | 7,735 (100.0%) |
Real Estate Taxes by Mortgage Status in Fountain Valley
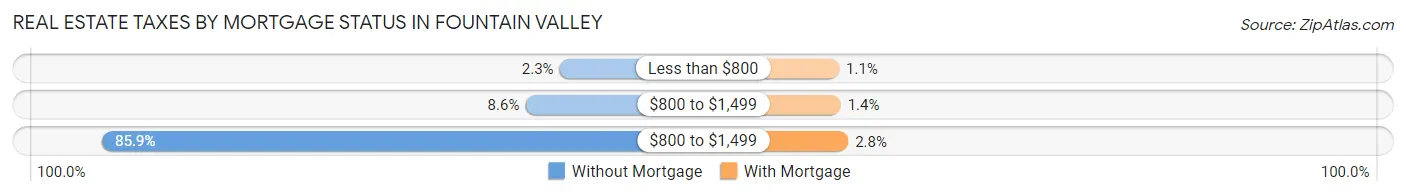
| Property Taxes | Without Mortgage | With Mortgage |
| Less than $800 | 109 (2.3%) | 85 (1.1%) |
| $800 to $1,499 | 404 (8.6%) | 108 (1.4%) |
| $800 to $1,499 | 4,052 (85.9%) | 214 (2.8%) |
| Total | 4,720 (100.0%) | 7,735 (100.0%) |
Health & Disability in Fountain Valley
Health Insurance Coverage by Age in Fountain Valley
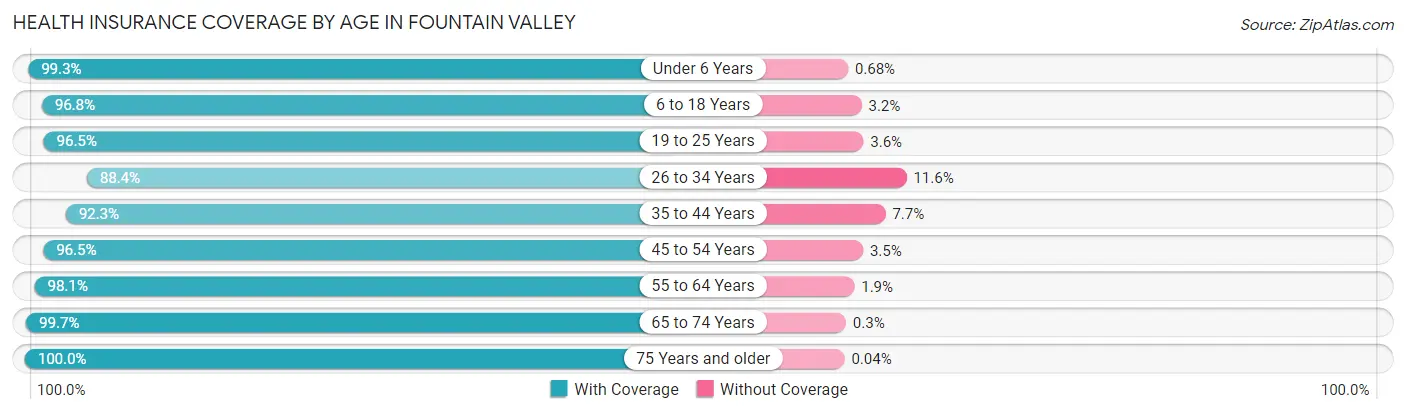
| Age Bracket | With Coverage | Without Coverage |
| Under 6 Years | 2,917 (99.3%) | 20 (0.7%) |
| 6 to 18 Years | 8,391 (96.8%) | 278 (3.2%) |
| 19 to 25 Years | 4,642 (96.5%) | 171 (3.5%) |
| 26 to 34 Years | 5,165 (88.4%) | 678 (11.6%) |
| 35 to 44 Years | 6,093 (92.3%) | 507 (7.7%) |
| 45 to 54 Years | 7,708 (96.5%) | 278 (3.5%) |
| 55 to 64 Years | 8,438 (98.1%) | 160 (1.9%) |
| 65 to 74 Years | 6,059 (99.7%) | 18 (0.3%) |
| 75 Years and older | 5,057 (100.0%) | 2 (0.0%) |
| Total | 54,470 (96.3%) | 2,112 (3.7%) |
Health Insurance Coverage by Citizenship Status in Fountain Valley
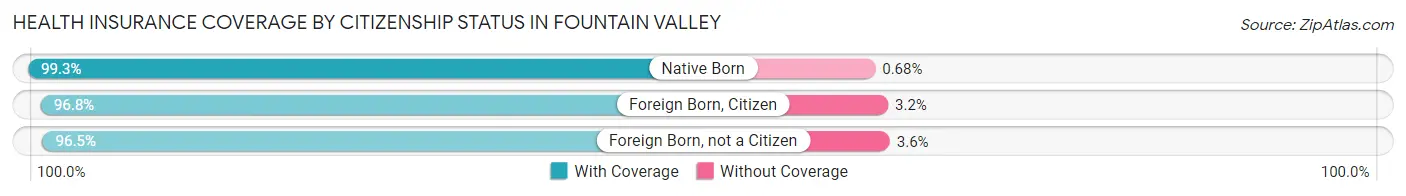
| Citizenship Status | With Coverage | Without Coverage |
| Native Born | 2,917 (99.3%) | 20 (0.7%) |
| Foreign Born, Citizen | 8,391 (96.8%) | 278 (3.2%) |
| Foreign Born, not a Citizen | 4,642 (96.5%) | 171 (3.5%) |
Health Insurance Coverage by Household Income in Fountain Valley
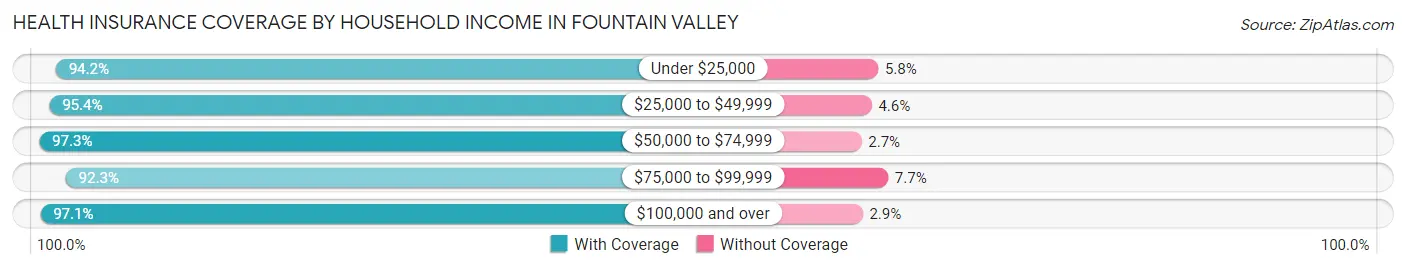
| Household Income | With Coverage | Without Coverage |
| Under $25,000 | 3,050 (94.2%) | 189 (5.8%) |
| $25,000 to $49,999 | 4,069 (95.4%) | 197 (4.6%) |
| $50,000 to $74,999 | 6,331 (97.3%) | 177 (2.7%) |
| $75,000 to $99,999 | 5,608 (92.3%) | 468 (7.7%) |
| $100,000 and over | 34,993 (97.1%) | 1,056 (2.9%) |
Public vs Private Health Insurance Coverage by Age in Fountain Valley
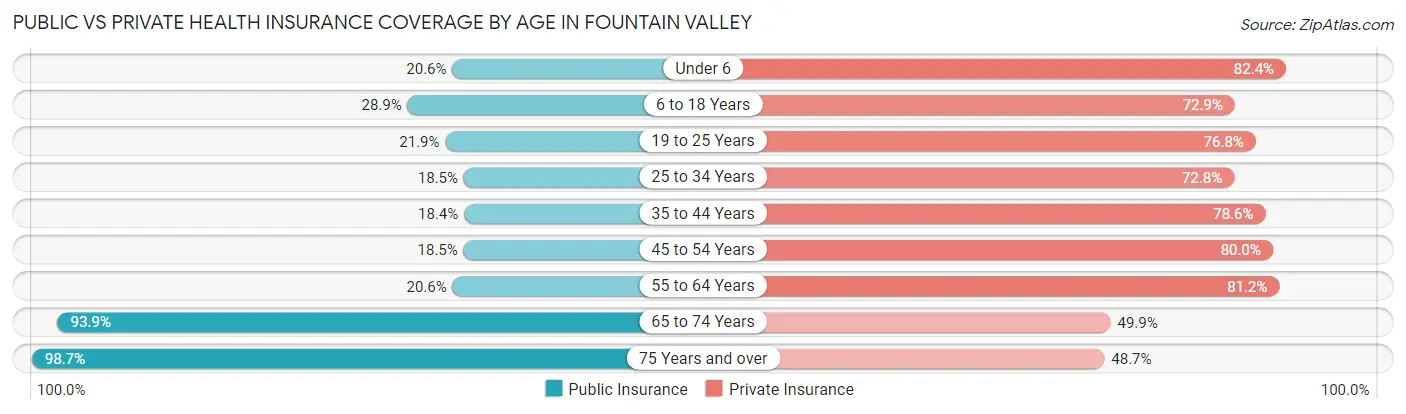
| Age Bracket | Public Insurance | Private Insurance |
| Under 6 | 605 (20.6%) | 2,421 (82.4%) |
| 6 to 18 Years | 2,507 (28.9%) | 6,322 (72.9%) |
| 19 to 25 Years | 1,054 (21.9%) | 3,697 (76.8%) |
| 25 to 34 Years | 1,079 (18.5%) | 4,253 (72.8%) |
| 35 to 44 Years | 1,216 (18.4%) | 5,188 (78.6%) |
| 45 to 54 Years | 1,478 (18.5%) | 6,387 (80.0%) |
| 55 to 64 Years | 1,768 (20.6%) | 6,982 (81.2%) |
| 65 to 74 Years | 5,705 (93.9%) | 3,032 (49.9%) |
| 75 Years and over | 4,991 (98.7%) | 2,466 (48.7%) |
| Total | 20,403 (36.1%) | 40,748 (72.0%) |
Disability Status by Sex by Age in Fountain Valley
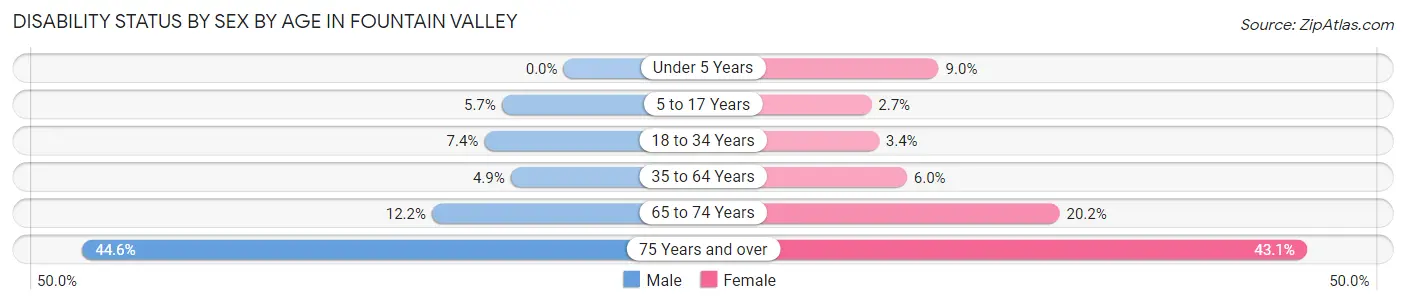
| Age Bracket | Male | Female |
| Under 5 Years | 0 (0.0%) | 83 (9.0%) |
| 5 to 17 Years | 255 (5.7%) | 114 (2.7%) |
| 18 to 34 Years | 446 (7.3%) | 181 (3.4%) |
| 35 to 64 Years | 559 (4.9%) | 711 (6.0%) |
| 65 to 74 Years | 350 (12.2%) | 649 (20.2%) |
| 75 Years and over | 996 (44.6%) | 1,220 (43.1%) |
Disability Class by Sex by Age in Fountain Valley
Disability Class: Hearing Difficulty
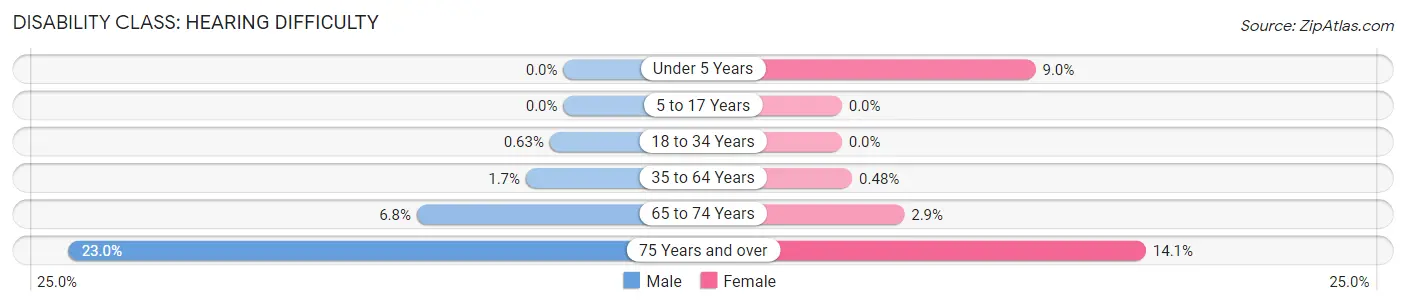
| Age Bracket | Male | Female |
| Under 5 Years | 0 (0.0%) | 83 (9.0%) |
| 5 to 17 Years | 0 (0.0%) | 0 (0.0%) |
| 18 to 34 Years | 38 (0.6%) | 0 (0.0%) |
| 35 to 64 Years | 199 (1.7%) | 56 (0.5%) |
| 65 to 74 Years | 195 (6.8%) | 93 (2.9%) |
| 75 Years and over | 512 (23.0%) | 399 (14.1%) |
Disability Class: Vision Difficulty
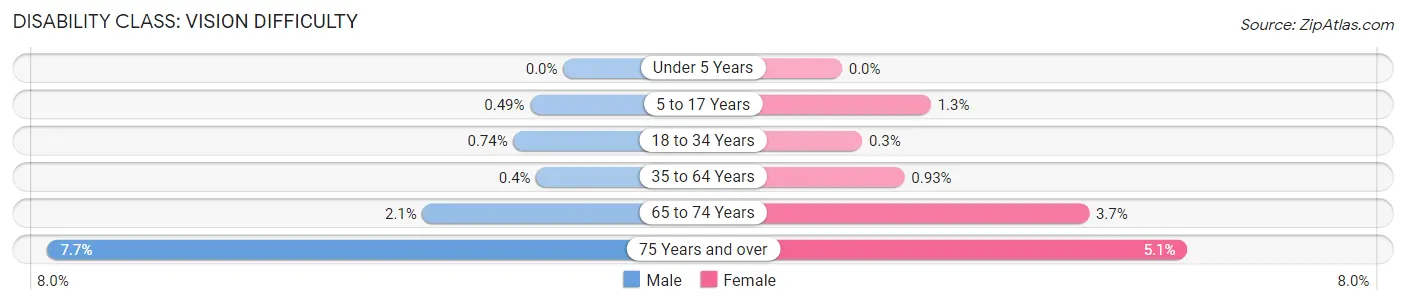
| Age Bracket | Male | Female |
| Under 5 Years | 0 (0.0%) | 0 (0.0%) |
| 5 to 17 Years | 22 (0.5%) | 55 (1.3%) |
| 18 to 34 Years | 45 (0.7%) | 16 (0.3%) |
| 35 to 64 Years | 46 (0.4%) | 109 (0.9%) |
| 65 to 74 Years | 60 (2.1%) | 118 (3.7%) |
| 75 Years and over | 171 (7.7%) | 145 (5.1%) |
Disability Class: Cognitive Difficulty
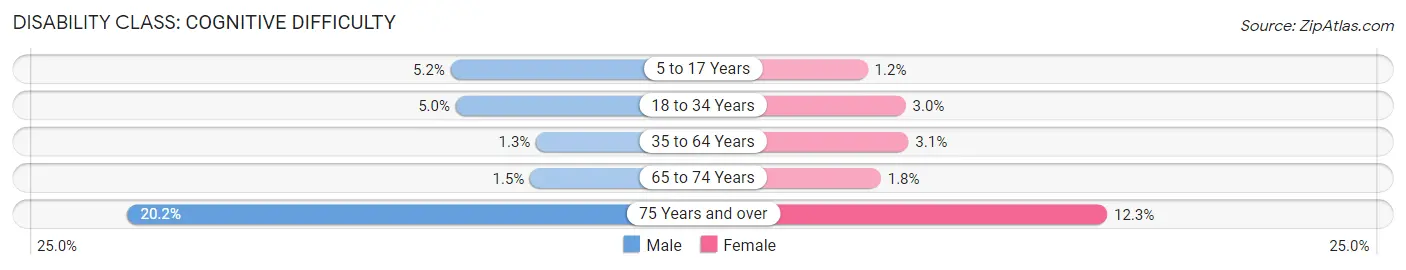
| Age Bracket | Male | Female |
| 5 to 17 Years | 233 (5.2%) | 50 (1.2%) |
| 18 to 34 Years | 303 (5.0%) | 156 (3.0%) |
| 35 to 64 Years | 144 (1.3%) | 364 (3.1%) |
| 65 to 74 Years | 44 (1.5%) | 58 (1.8%) |
| 75 Years and over | 451 (20.2%) | 348 (12.3%) |
Disability Class: Ambulatory Difficulty
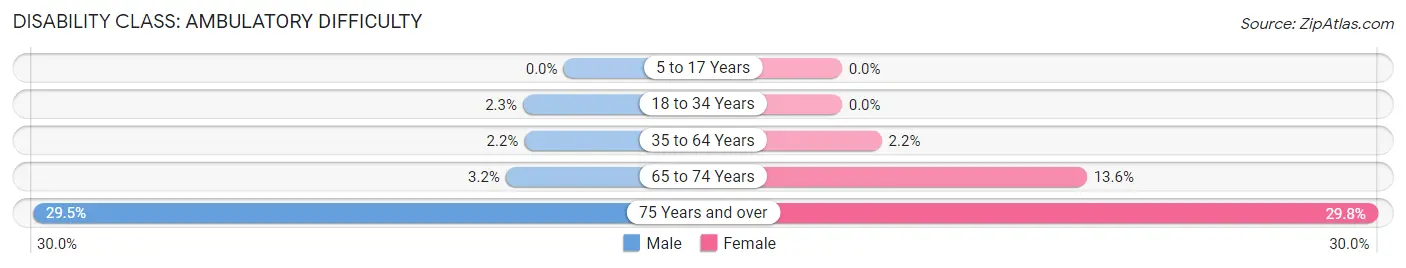
| Age Bracket | Male | Female |
| 5 to 17 Years | 0 (0.0%) | 0 (0.0%) |
| 18 to 34 Years | 137 (2.3%) | 0 (0.0%) |
| 35 to 64 Years | 249 (2.2%) | 261 (2.2%) |
| 65 to 74 Years | 92 (3.2%) | 438 (13.6%) |
| 75 Years and over | 659 (29.5%) | 844 (29.8%) |
Disability Class: Self-Care Difficulty
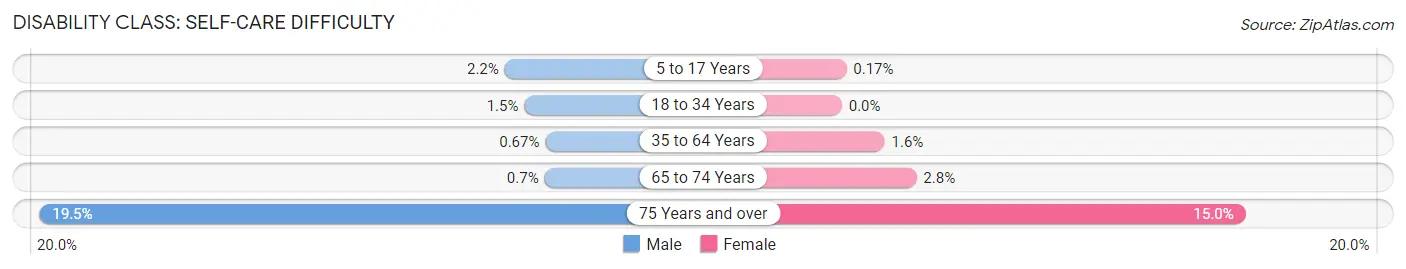
| Age Bracket | Male | Female |
| 5 to 17 Years | 97 (2.2%) | 7 (0.2%) |
| 18 to 34 Years | 88 (1.5%) | 0 (0.0%) |
| 35 to 64 Years | 76 (0.7%) | 187 (1.6%) |
| 65 to 74 Years | 20 (0.7%) | 89 (2.8%) |
| 75 Years and over | 434 (19.5%) | 424 (15.0%) |
Technology Access in Fountain Valley
Computing Device Access in Fountain Valley
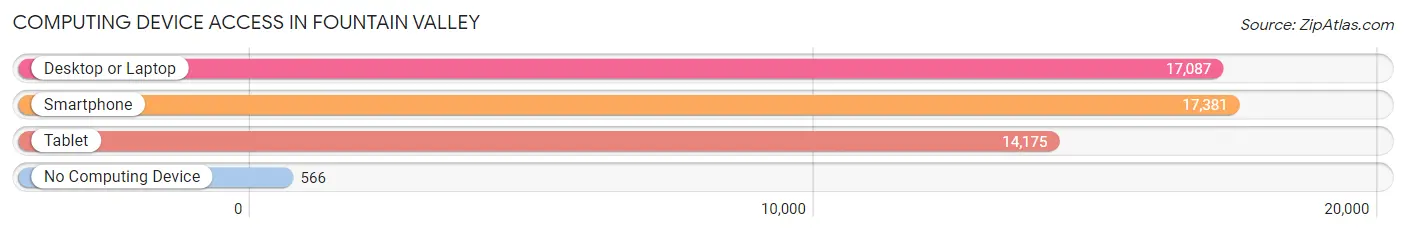
| Device Type | # Households | % Households |
| Desktop or Laptop | 17,087 | 90.4% |
| Smartphone | 17,381 | 91.9% |
| Tablet | 14,175 | 75.0% |
| No Computing Device | 566 | 3.0% |
| Total | 18,906 | 100.0% |
Internet Access in Fountain Valley
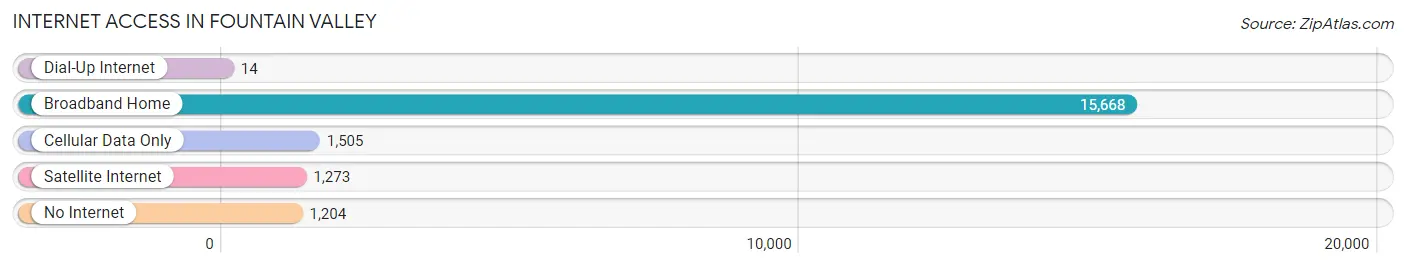
| Internet Type | # Households | % Households |
| Dial-Up Internet | 14 | 0.1% |
| Broadband Home | 15,668 | 82.9% |
| Cellular Data Only | 1,505 | 8.0% |
| Satellite Internet | 1,273 | 6.7% |
| No Internet | 1,204 | 6.4% |
| Total | 18,906 | 100.0% |
Fountain Valley Summary
Fountain Valley is a city located in Orange County, California, United States. It is situated in the center of the county, between Huntington Beach and Santa Ana. The city was incorporated in 1957 and has a population of 55,313 as of the 2010 census.
History
The area now known as Fountain Valley was originally inhabited by the Tongva people, who were later displaced by the Spanish. The area was part of Rancho Los Alamitos, which was granted to the Machado and Talamantes families in 1810. In the late 19th century, the area was known as Talbert, after the Talamantes family.
In 1957, the city of Fountain Valley was incorporated. The city was named after the many artesian wells found in the area, which were used to irrigate the surrounding agricultural fields.
Geography
Fountain Valley is located at 33°43'N 117°56'W. It is bordered by Huntington Beach to the west, Westminster to the north, Santa Ana to the east, and Costa Mesa to the south. The city covers an area of 9.5 square miles and has a population density of 5,837 people per square mile.
The city is located in the Santa Ana River watershed and is home to several creeks, including Talbert Creek, which runs through the city. The city is also home to several parks, including Mile Square Regional Park, which is the largest park in the city.
Economy
Fountain Valley is home to several major employers, including Hyundai Motor America, which is the city's largest employer. Other major employers include the Fountain Valley School District, the Fountain Valley Regional Hospital, and the Fountain Valley Regional Medical Center.
The city is also home to several shopping centers, including the Fountain Valley Town Center, which is the city's largest shopping center. The city is also home to several restaurants, including the popular In-N-Out Burger.
Demographics
As of the 2010 census, the population of Fountain Valley was 55,313. The racial makeup of the city was 57.2% White, 1.3% African American, 0.5% Native American, 24.2% Asian, 0.2% Pacific Islander, 11.7% from other races, and 5.1% from two or more races. Hispanic or Latino of any race were 24.7% of the population.
The median income for a household in the city was $76,845, and the median income for a family was $86,845. The per capita income for the city was $31,945. About 5.2% of families and 7.2% of the population were below the poverty line, including 8.2% of those under age 18 and 5.2% of those age 65 or over.
Fountain Valley is served by the Fountain Valley School District, which includes seven elementary schools, two middle schools, and one high school. The city is also home to several private schools, including St. John's Lutheran School and St. John's Lutheran High School.
Common Questions
What is Per Capita Income in Fountain Valley?
Per Capita income in Fountain Valley is $46,609.
What is the Median Family Income in Fountain Valley?
Median Family Income in Fountain Valley is $127,973.
What is the Median Household income in Fountain Valley?
Median Household Income in Fountain Valley is $108,860.
What is Income or Wage Gap in Fountain Valley?
Income or Wage Gap in Fountain Valley is 23.6%.
Women in Fountain Valley earn 76.4 cents for every dollar earned by a man.
What is Inequality or Gini Index in Fountain Valley?
Inequality or Gini Index in Fountain Valley is 0.43.
What is the Total Population of Fountain Valley?
Total Population of Fountain Valley is 56,754.
What is the Total Male Population of Fountain Valley?
Total Male Population of Fountain Valley is 28,478.
What is the Total Female Population of Fountain Valley?
Total Female Population of Fountain Valley is 28,276.
What is the Ratio of Males per 100 Females in Fountain Valley?
There are 100.71 Males per 100 Females in Fountain Valley.
What is the Ratio of Females per 100 Males in Fountain Valley?
There are 99.29 Females per 100 Males in Fountain Valley.
What is the Median Population Age in Fountain Valley?
Median Population Age in Fountain Valley is 44.3 Years.
What is the Average Family Size in Fountain Valley
Average Family Size in Fountain Valley is 3.5 People.
What is the Average Household Size in Fountain Valley
Average Household Size in Fountain Valley is 3.0 People.
How Large is the Labor Force in Fountain Valley?
There are 29,337 People in the Labor Forcein in Fountain Valley.
What is the Percentage of People in the Labor Force in Fountain Valley?
61.8% of People are in the Labor Force in Fountain Valley.
What is the Unemployment Rate in Fountain Valley?
Unemployment Rate in Fountain Valley is 6.0%.