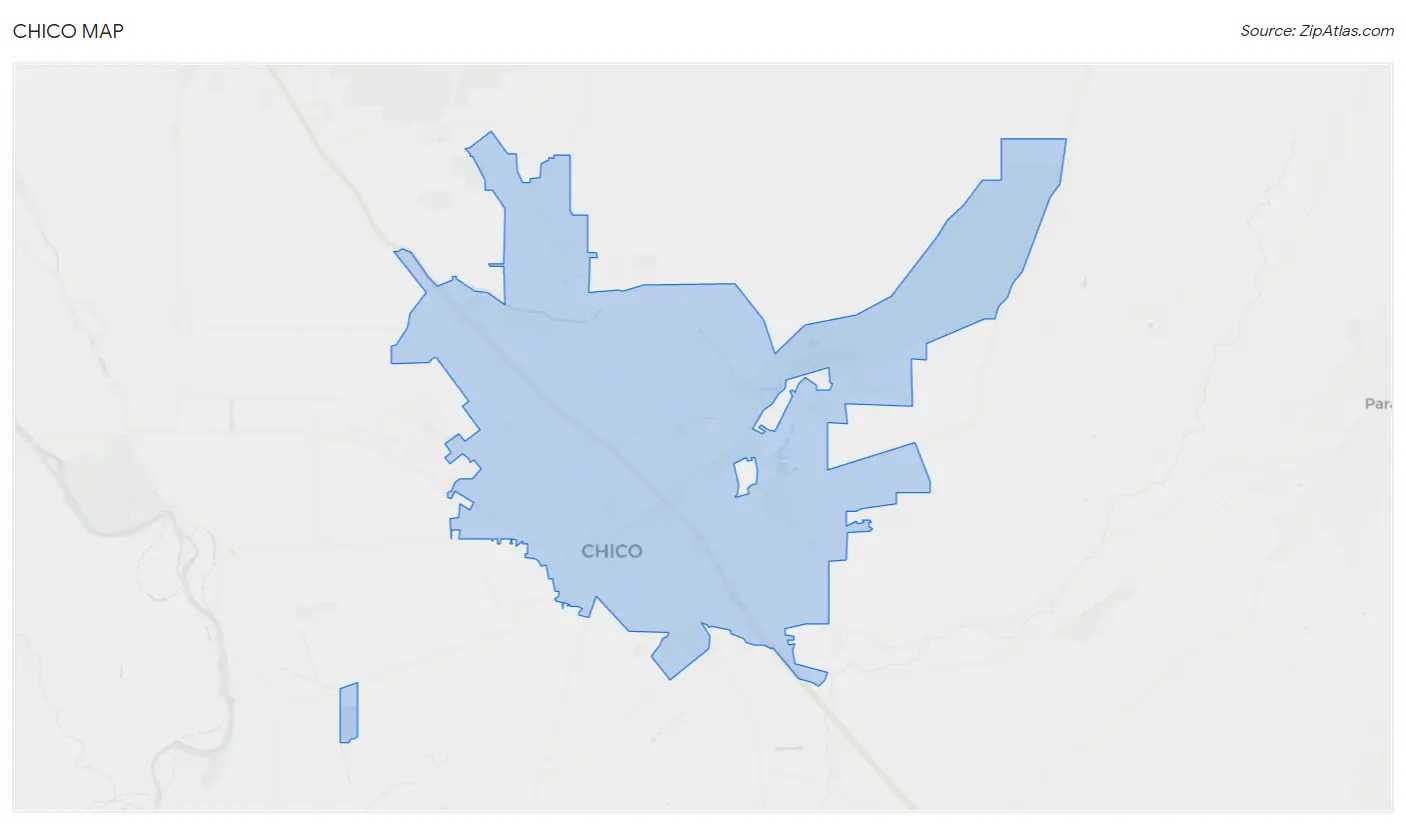
Chico, CA Map & Demographics
Chico Map
Chico Overview
$36,491
PER CAPITA INCOME
$88,270
AVG FAMILY INCOME
$65,932
AVG HOUSEHOLD INCOME
17.3%
WAGE / INCOME GAP [ % ]
82.7¢/ $1
WAGE / INCOME GAP [ $ ]
$10,216
FAMILY INCOME DEFICIT
0.48
INEQUALITY / GINI INDEX
102,790
TOTAL POPULATION
50,461
MALE POPULATION
52,329
FEMALE POPULATION
96.43
MALES / 100 FEMALES
103.70
FEMALES / 100 MALES
30.4
MEDIAN AGE
3.0
AVG FAMILY SIZE
2.4
AVG HOUSEHOLD SIZE
56,593
LABOR FORCE [ PEOPLE ]
66.1%
PERCENT IN LABOR FORCE
6.9%
UNEMPLOYMENT RATE
Income in Chico
Income Overview in Chico
Per Capita Income in Chico is $36,491, while median incomes of families and households are $88,270 and $65,932 respectively.
| Characteristic | Number | Measure |
| Per Capita Income | 102,790 | $36,491 |
| Median Family Income | 20,866 | $88,270 |
| Mean Family Income | 20,866 | $113,721 |
| Median Household Income | 41,454 | $65,932 |
| Mean Household Income | 41,454 | $89,522 |
| Income Deficit | 20,866 | $10,216 |
| Wage / Income Gap (%) | 102,790 | 17.31% |
| Wage / Income Gap ($) | 102,790 | 82.69¢ per $1 |
| Gini / Inequality Index | 102,790 | 0.48 |
Earnings by Sex in Chico
Average Earnings in Chico are $31,927, $34,755 for men and $28,738 for women, a difference of 17.3%.
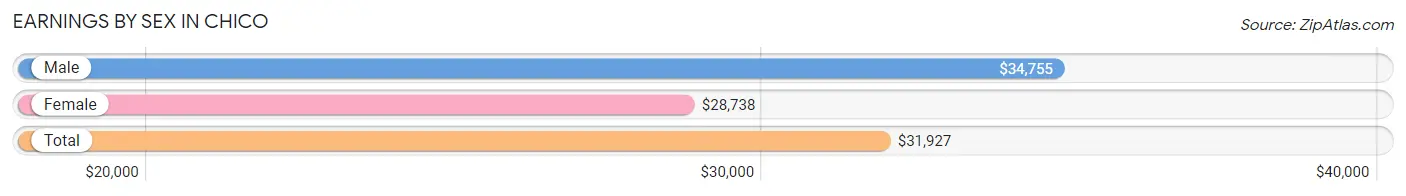
| Sex | Number | Average Earnings |
| Male | 30,805 (51.1%) | $34,755 |
| Female | 29,414 (48.8%) | $28,738 |
| Total | 60,219 (100.0%) | $31,927 |
Earnings by Sex by Income Bracket in Chico
The most common earnings brackets in Chico are $100,000+ for men (4,366 | 14.2%) and $100,000+ for women (2,620 | 8.9%).
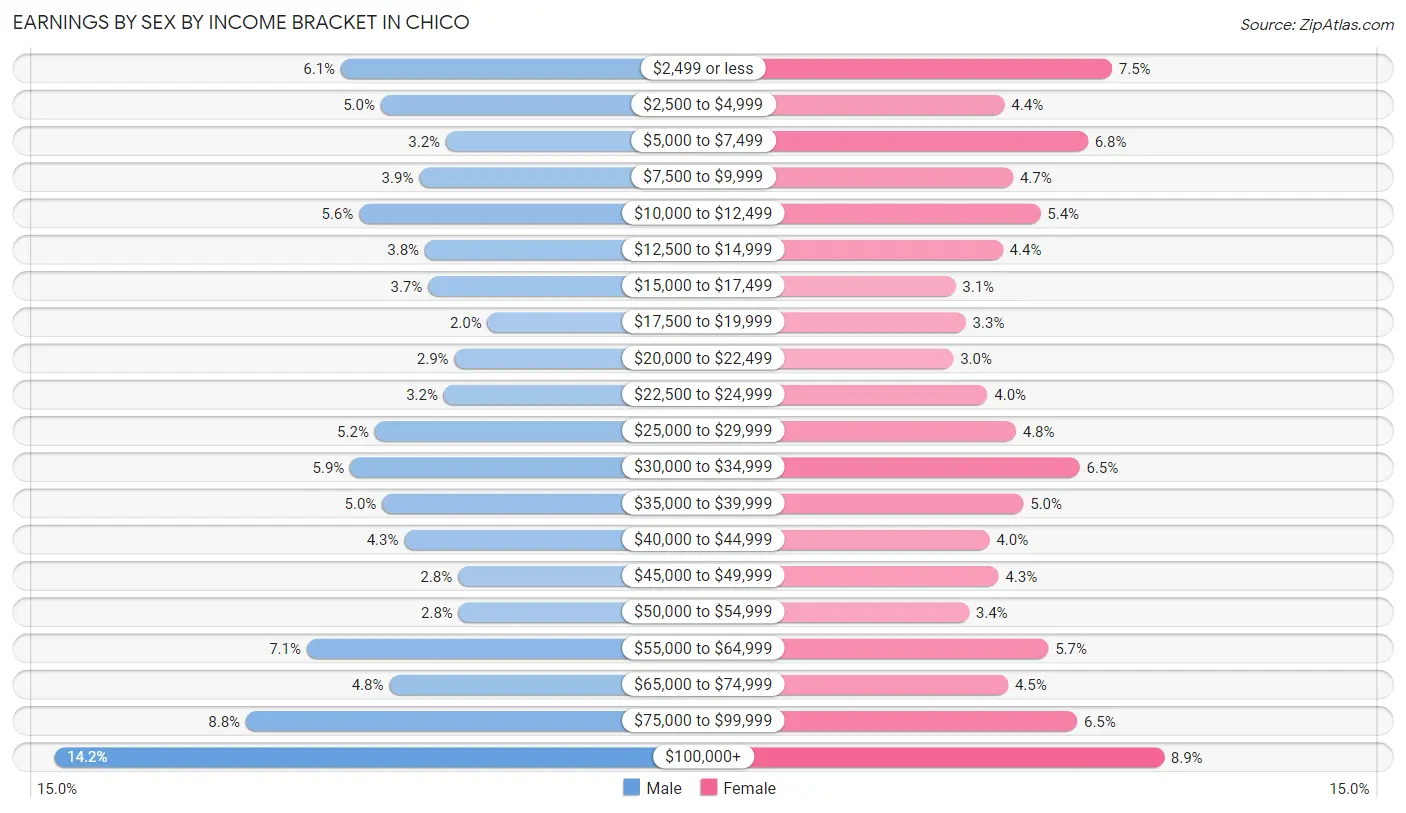
| Income | Male | Female |
| $2,499 or less | 1,883 (6.1%) | 2,190 (7.4%) |
| $2,500 to $4,999 | 1,538 (5.0%) | 1,304 (4.4%) |
| $5,000 to $7,499 | 974 (3.2%) | 1,991 (6.8%) |
| $7,500 to $9,999 | 1,204 (3.9%) | 1,373 (4.7%) |
| $10,000 to $12,499 | 1,726 (5.6%) | 1,601 (5.4%) |
| $12,500 to $14,999 | 1,156 (3.7%) | 1,288 (4.4%) |
| $15,000 to $17,499 | 1,128 (3.7%) | 898 (3.0%) |
| $17,500 to $19,999 | 613 (2.0%) | 983 (3.3%) |
| $20,000 to $22,499 | 898 (2.9%) | 879 (3.0%) |
| $22,500 to $24,999 | 991 (3.2%) | 1,163 (4.0%) |
| $25,000 to $29,999 | 1,591 (5.2%) | 1,397 (4.8%) |
| $30,000 to $34,999 | 1,801 (5.9%) | 1,924 (6.5%) |
| $35,000 to $39,999 | 1,524 (5.0%) | 1,460 (5.0%) |
| $40,000 to $44,999 | 1,335 (4.3%) | 1,180 (4.0%) |
| $45,000 to $49,999 | 870 (2.8%) | 1,253 (4.3%) |
| $50,000 to $54,999 | 861 (2.8%) | 1,009 (3.4%) |
| $55,000 to $64,999 | 2,177 (7.1%) | 1,665 (5.7%) |
| $65,000 to $74,999 | 1,463 (4.8%) | 1,333 (4.5%) |
| $75,000 to $99,999 | 2,706 (8.8%) | 1,903 (6.5%) |
| $100,000+ | 4,366 (14.2%) | 2,620 (8.9%) |
| Total | 30,805 (100.0%) | 29,414 (100.0%) |
Earnings by Sex by Educational Attainment in Chico
Average earnings in Chico are $48,564 for men and $40,646 for women, a difference of 16.3%. Men with an educational attainment of graduate degree enjoy the highest average annual earnings of $93,154, while those with less than high school education earn the least with $31,264. Women with an educational attainment of graduate degree earn the most with the average annual earnings of $69,608, while those with less than high school education have the smallest earnings of $24,820.
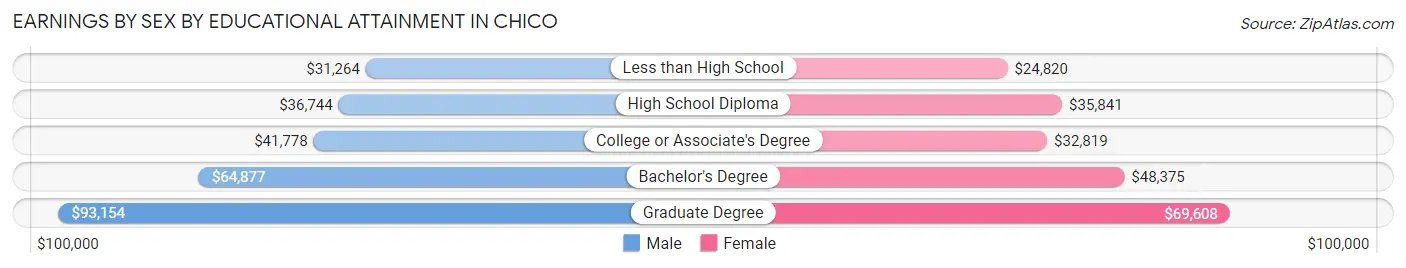
| Educational Attainment | Male Income | Female Income |
| Less than High School | $31,264 | $24,820 |
| High School Diploma | $36,744 | $35,841 |
| College or Associate's Degree | $41,778 | $32,819 |
| Bachelor's Degree | $64,877 | $48,375 |
| Graduate Degree | $93,154 | $69,608 |
| Total | $48,564 | $40,646 |
Family Income in Chico
Family Income Brackets in Chico
According to the Chico family income data, there are 4,215 families falling into the $100,000 to $149,999 income range, which is the most common income bracket and makes up 20.2% of all families. Conversely, the less than $10,000 income bracket is the least frequent group with only 793 families (3.8%) belonging to this category.
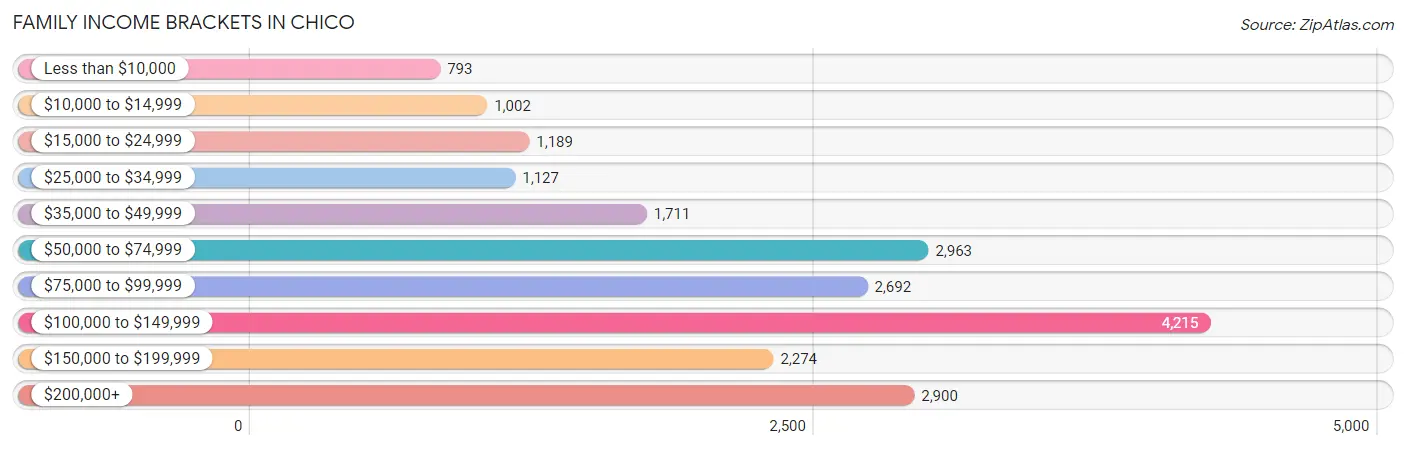
| Income Bracket | # Families | % Families |
| Less than $10,000 | 793 | 3.8% |
| $10,000 to $14,999 | 1,002 | 4.8% |
| $15,000 to $24,999 | 1,189 | 5.7% |
| $25,000 to $34,999 | 1,127 | 5.4% |
| $35,000 to $49,999 | 1,711 | 8.2% |
| $50,000 to $74,999 | 2,963 | 14.2% |
| $75,000 to $99,999 | 2,692 | 12.9% |
| $100,000 to $149,999 | 4,215 | 20.2% |
| $150,000 to $199,999 | 2,274 | 10.9% |
| $200,000+ | 2,900 | 13.9% |
Family Income by Famaliy Size in Chico
4-person families (3,943 | 18.9%) account for the highest median family income in Chico with $117,052 per family, while 2-person families (10,648 | 51.0%) have the highest median income of $38,814 per family member.
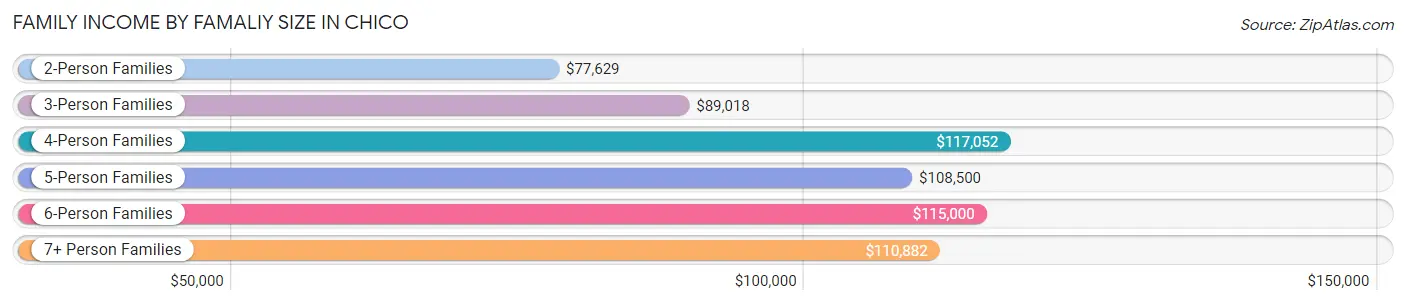
| Income Bracket | # Families | Median Income |
| 2-Person Families | 10,648 (51.0%) | $77,629 |
| 3-Person Families | 4,421 (21.2%) | $89,018 |
| 4-Person Families | 3,943 (18.9%) | $117,052 |
| 5-Person Families | 1,298 (6.2%) | $108,500 |
| 6-Person Families | 336 (1.6%) | $115,000 |
| 7+ Person Families | 220 (1.1%) | $110,882 |
| Total | 20,866 (100.0%) | $88,270 |
Family Income by Number of Earners in Chico
The median family income in Chico is $88,270, with families comprising 3+ earners (1,819) having the highest median family income of $146,138, while families with 1 earner (7,554) have the lowest median family income of $57,016, accounting for 8.7% and 36.2% of families, respectively.
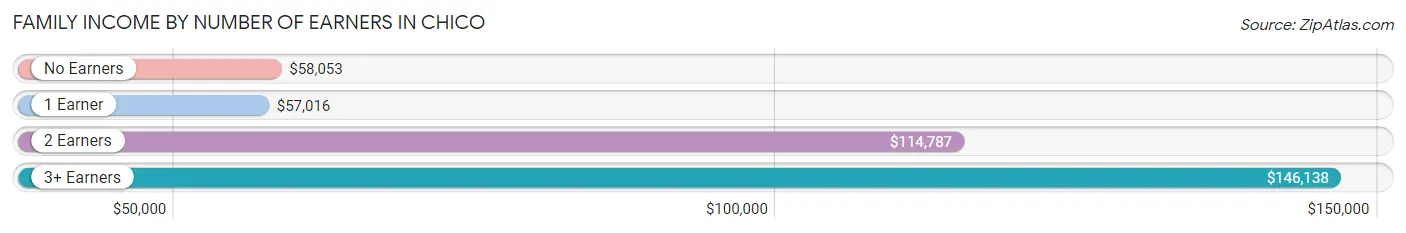
| Number of Earners | # Families | Median Income |
| No Earners | 2,929 (14.0%) | $58,053 |
| 1 Earner | 7,554 (36.2%) | $57,016 |
| 2 Earners | 8,564 (41.0%) | $114,787 |
| 3+ Earners | 1,819 (8.7%) | $146,138 |
| Total | 20,866 (100.0%) | $88,270 |
Household Income in Chico
Household Income Brackets in Chico
With 6,633 households falling in the category, the $100,000 to $149,999 income range is the most frequent in Chico, accounting for 16.0% of all households. In contrast, only 2,197 households (5.3%) fall into the $10,000 to $14,999 income bracket, making it the least populous group.
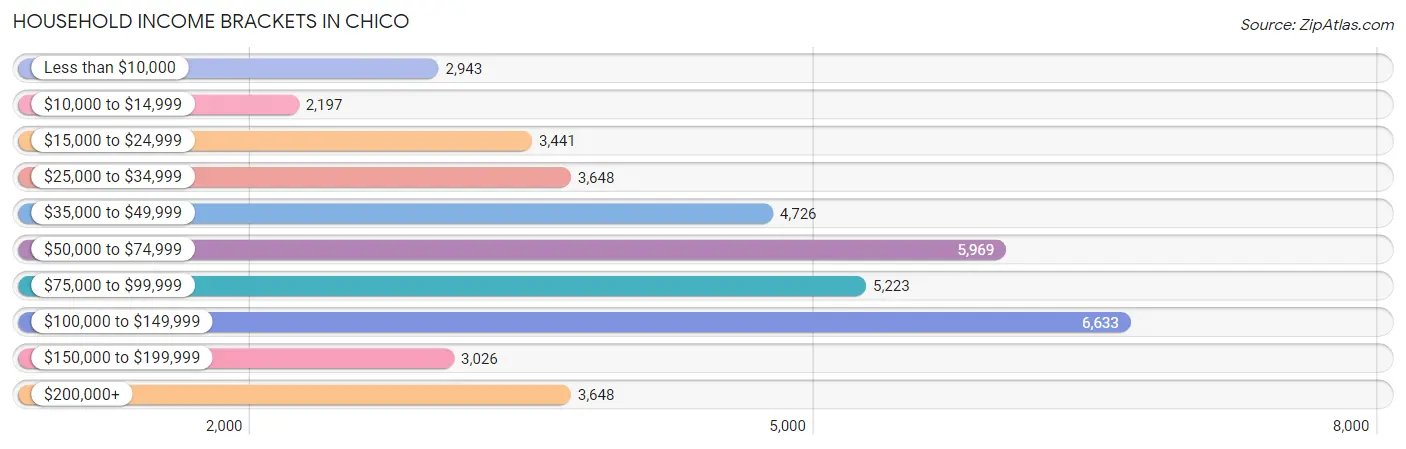
| Income Bracket | # Households | % Households |
| Less than $10,000 | 2,943 | 7.1% |
| $10,000 to $14,999 | 2,197 | 5.3% |
| $15,000 to $24,999 | 3,441 | 8.3% |
| $25,000 to $34,999 | 3,648 | 8.8% |
| $35,000 to $49,999 | 4,726 | 11.4% |
| $50,000 to $74,999 | 5,969 | 14.4% |
| $75,000 to $99,999 | 5,223 | 12.6% |
| $100,000 to $149,999 | 6,633 | 16.0% |
| $150,000 to $199,999 | 3,026 | 7.3% |
| $200,000+ | 3,648 | 8.8% |
Household Income by Householder Age in Chico
The median household income in Chico is $65,932, with the highest median household income of $86,093 found in the 45 to 64 years age bracket for the primary householder. A total of 11,600 households (28.0%) fall into this category. Meanwhile, the 15 to 24 years age bracket for the primary householder has the lowest median household income of $31,284, with 6,895 households (16.6%) in this group.
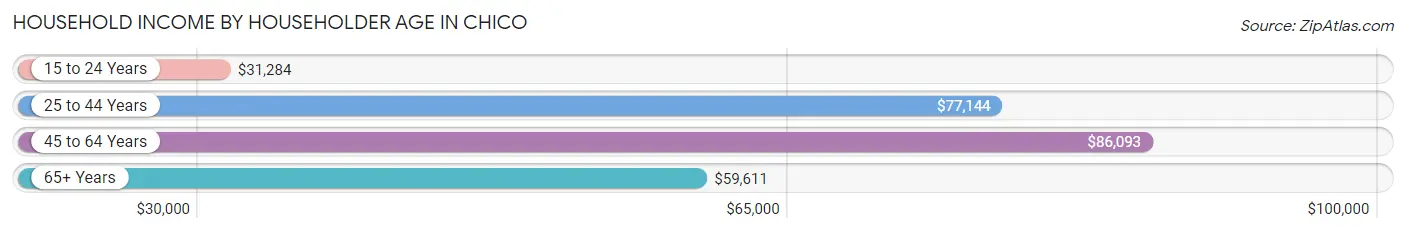
| Income Bracket | # Households | Median Income |
| 15 to 24 Years | 6,895 (16.6%) | $31,284 |
| 25 to 44 Years | 13,875 (33.5%) | $77,144 |
| 45 to 64 Years | 11,600 (28.0%) | $86,093 |
| 65+ Years | 9,084 (21.9%) | $59,611 |
| Total | 41,454 (100.0%) | $65,932 |
Poverty in Chico
Income Below Poverty by Sex and Age in Chico
With 20.8% poverty level for males and 23.6% for females among the residents of Chico, 18 to 24 year old males and 18 to 24 year old females are the most vulnerable to poverty, with 4,814 males (47.0%) and 5,092 females (49.6%) in their respective age groups living below the poverty level.
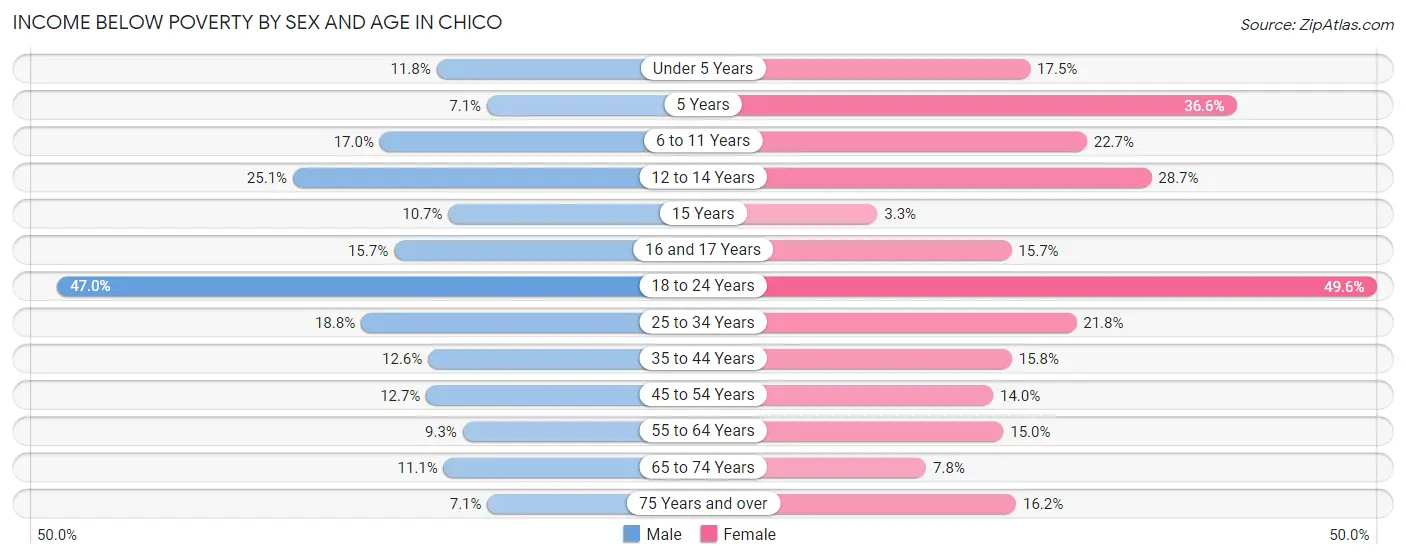
| Age Bracket | Male | Female |
| Under 5 Years | 289 (11.8%) | 406 (17.5%) |
| 5 Years | 35 (7.1%) | 164 (36.6%) |
| 6 to 11 Years | 670 (17.0%) | 757 (22.7%) |
| 12 to 14 Years | 369 (25.1%) | 441 (28.7%) |
| 15 Years | 43 (10.7%) | 18 (3.3%) |
| 16 and 17 Years | 175 (15.7%) | 139 (15.7%) |
| 18 to 24 Years | 4,814 (47.0%) | 5,092 (49.6%) |
| 25 to 34 Years | 1,460 (18.8%) | 1,667 (21.8%) |
| 35 to 44 Years | 813 (12.6%) | 917 (15.8%) |
| 45 to 54 Years | 605 (12.7%) | 694 (14.0%) |
| 55 to 64 Years | 395 (9.3%) | 764 (15.0%) |
| 65 to 74 Years | 398 (11.1%) | 348 (7.8%) |
| 75 Years and over | 147 (7.0%) | 531 (16.2%) |
| Total | 10,213 (20.8%) | 11,938 (23.6%) |
Income Above Poverty by Sex and Age in Chico
According to the poverty statistics in Chico, males aged 75 years and over and females aged 15 years are the age groups that are most secure financially, with 92.9% of males and 96.7% of females in these age groups living above the poverty line.
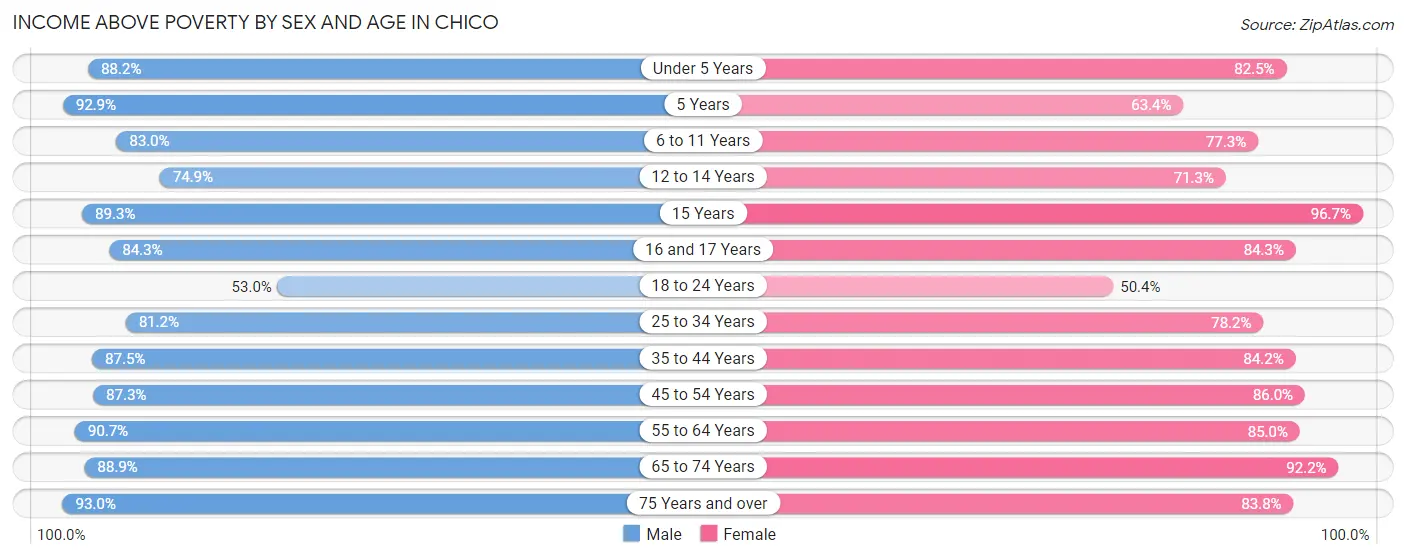
| Age Bracket | Male | Female |
| Under 5 Years | 2,166 (88.2%) | 1,917 (82.5%) |
| 5 Years | 459 (92.9%) | 284 (63.4%) |
| 6 to 11 Years | 3,261 (83.0%) | 2,572 (77.3%) |
| 12 to 14 Years | 1,101 (74.9%) | 1,094 (71.3%) |
| 15 Years | 360 (89.3%) | 528 (96.7%) |
| 16 and 17 Years | 938 (84.3%) | 744 (84.3%) |
| 18 to 24 Years | 5,435 (53.0%) | 5,175 (50.4%) |
| 25 to 34 Years | 6,316 (81.2%) | 5,995 (78.2%) |
| 35 to 44 Years | 5,665 (87.5%) | 4,894 (84.2%) |
| 45 to 54 Years | 4,146 (87.3%) | 4,248 (86.0%) |
| 55 to 64 Years | 3,834 (90.7%) | 4,334 (85.0%) |
| 65 to 74 Years | 3,185 (88.9%) | 4,099 (92.2%) |
| 75 Years and over | 1,938 (92.9%) | 2,752 (83.8%) |
| Total | 38,804 (79.2%) | 38,636 (76.4%) |
Income Below Poverty Among Married-Couple Families in Chico
The poverty statistics for married-couple families in Chico show that 4.8% or 653 of the total 13,619 families live below the poverty line. Families with 5 or more children have the highest poverty rate of 24.4%, comprising of 30 families. On the other hand, families with no children have the lowest poverty rate of 3.4%, which includes 269 families.
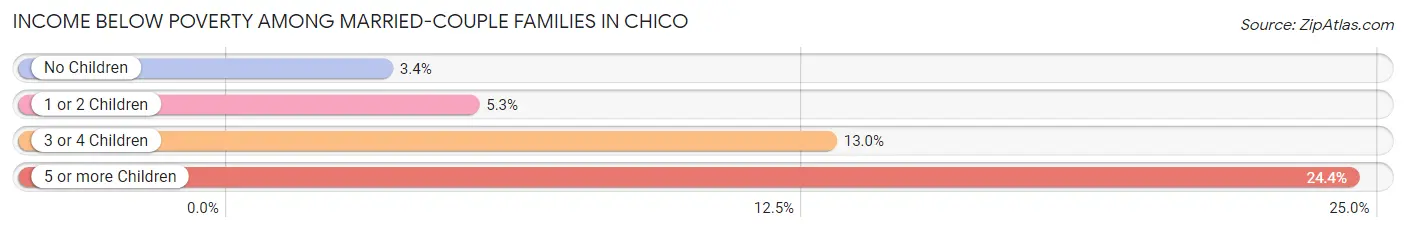
| Children | Above Poverty | Below Poverty |
| No Children | 7,703 (96.6%) | 269 (3.4%) |
| 1 or 2 Children | 4,456 (94.8%) | 247 (5.2%) |
| 3 or 4 Children | 714 (87.0%) | 107 (13.0%) |
| 5 or more Children | 93 (75.6%) | 30 (24.4%) |
| Total | 12,966 (95.2%) | 653 (4.8%) |
Income Below Poverty Among Single-Parent Households in Chico
According to the poverty data in Chico, 25.3% or 666 single-father households and 29.9% or 1,380 single-mother households are living below the poverty line. Among single-father households, those with 3 or 4 children have the highest poverty rate, with 125 households (47.0%) experiencing poverty. Likewise, among single-mother households, those with 5 or more children have the highest poverty rate, with 2 households (100.0%) falling below the poverty line.
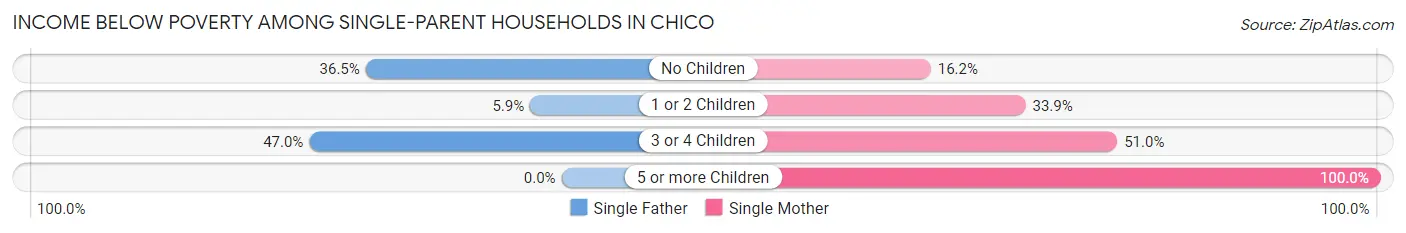
| Children | Single Father | Single Mother |
| No Children | 479 (36.5%) | 234 (16.2%) |
| 1 or 2 Children | 62 (5.9%) | 929 (33.9%) |
| 3 or 4 Children | 125 (47.0%) | 215 (50.9%) |
| 5 or more Children | 0 (0.0%) | 2 (100.0%) |
| Total | 666 (25.3%) | 1,380 (29.9%) |
Income Below Poverty Among Married-Couple vs Single-Parent Households in Chico
The poverty data for Chico shows that 653 of the married-couple family households (4.8%) and 2,046 of the single-parent households (28.2%) are living below the poverty level. Within the married-couple family households, those with 5 or more children have the highest poverty rate, with 30 households (24.4%) falling below the poverty line. Among the single-parent households, those with 5 or more children have the highest poverty rate, with 2 household (100.0%) living below poverty.
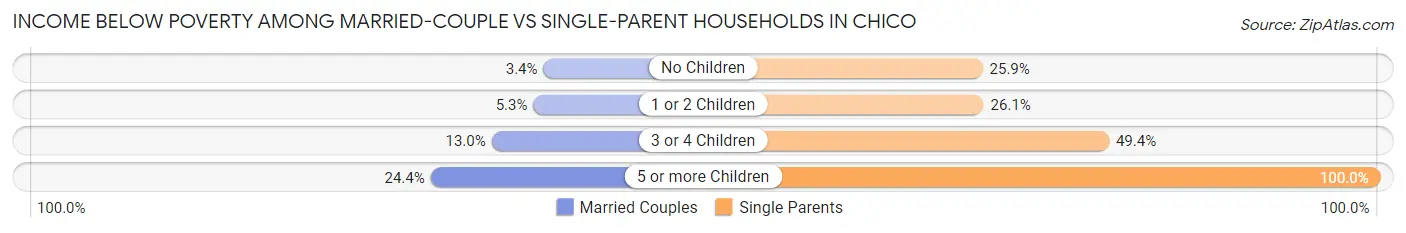
| Children | Married-Couple Families | Single-Parent Households |
| No Children | 269 (3.4%) | 713 (25.9%) |
| 1 or 2 Children | 247 (5.2%) | 991 (26.1%) |
| 3 or 4 Children | 107 (13.0%) | 340 (49.4%) |
| 5 or more Children | 30 (24.4%) | 2 (100.0%) |
| Total | 653 (4.8%) | 2,046 (28.2%) |
Race in Chico
The most populous races in Chico are White / Caucasian (77,172 | 75.1%), Hispanic or Latino (19,754 | 19.2%), and Two or more Races (10,355 | 10.1%).
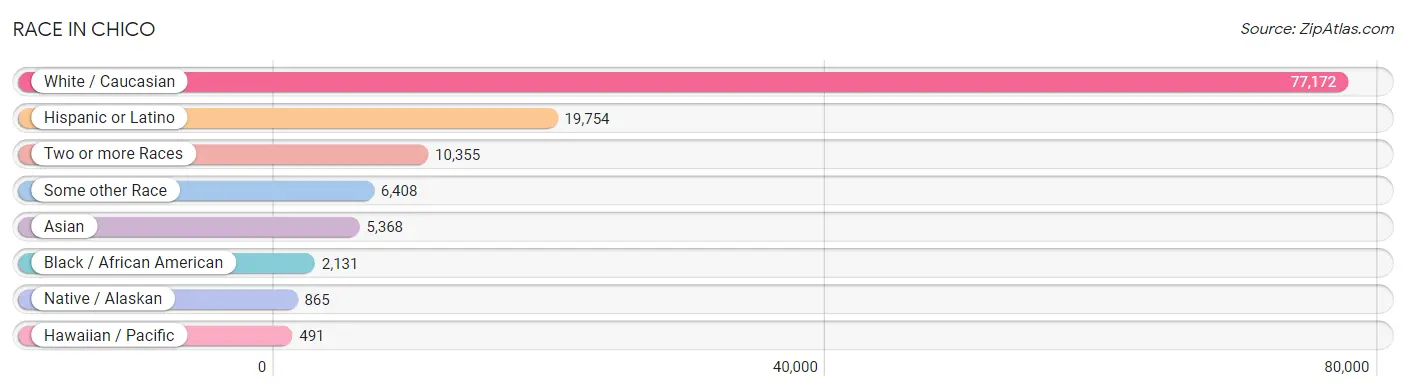
| Race | # Population | % Population |
| Asian | 5,368 | 5.2% |
| Black / African American | 2,131 | 2.1% |
| Hawaiian / Pacific | 491 | 0.5% |
| Hispanic or Latino | 19,754 | 19.2% |
| Native / Alaskan | 865 | 0.8% |
| White / Caucasian | 77,172 | 75.1% |
| Two or more Races | 10,355 | 10.1% |
| Some other Race | 6,408 | 6.2% |
| Total | 102,790 | 100.0% |
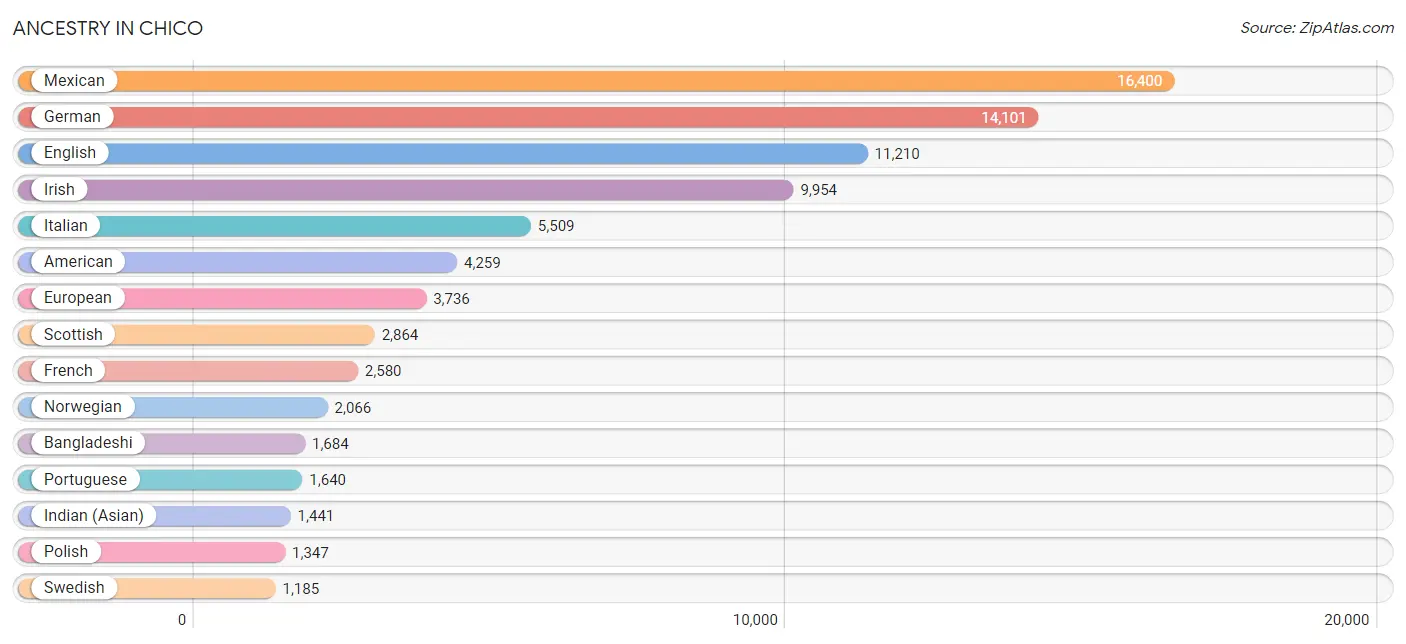
Ancestry in Chico
The most populous ancestries reported in Chico are Mexican (16,400 | 16.0%), German (14,101 | 13.7%), English (11,210 | 10.9%), Irish (9,954 | 9.7%), and Italian (5,509 | 5.4%), together accounting for 55.6% of all Chico residents.
| Ancestry | # Population | % Population |
| African | 194 | 0.2% |
| Alsatian | 16 | 0.0% |
| American | 4,259 | 4.1% |
| Apache | 54 | 0.1% |
| Arab | 312 | 0.3% |
| Argentinean | 21 | 0.0% |
| Armenian | 155 | 0.2% |
| Australian | 122 | 0.1% |
| Austrian | 169 | 0.2% |
| Bangladeshi | 1,684 | 1.6% |
| Basque | 162 | 0.2% |
| Belgian | 27 | 0.0% |
| Bhutanese | 866 | 0.8% |
| Blackfeet | 217 | 0.2% |
| Brazilian | 21 | 0.0% |
| British | 796 | 0.8% |
| Bulgarian | 13 | 0.0% |
| Burmese | 535 | 0.5% |
| Cajun | 63 | 0.1% |
| Canadian | 493 | 0.5% |
| Celtic | 39 | 0.0% |
| Central American | 812 | 0.8% |
| Cherokee | 429 | 0.4% |
| Chickasaw | 28 | 0.0% |
| Chilean | 77 | 0.1% |
| Chinese | 4 | 0.0% |
| Chippewa | 6 | 0.0% |
| Choctaw | 94 | 0.1% |
| Colombian | 96 | 0.1% |
| Comanche | 9 | 0.0% |
| Costa Rican | 22 | 0.0% |
| Creek | 21 | 0.0% |
| Croatian | 399 | 0.4% |
| Cuban | 125 | 0.1% |
| Czech | 391 | 0.4% |
| Czechoslovakian | 210 | 0.2% |
| Danish | 681 | 0.7% |
| Dominican | 64 | 0.1% |
| Dutch | 1,029 | 1.0% |
| Eastern European | 173 | 0.2% |
| Ecuadorian | 32 | 0.0% |
| Egyptian | 19 | 0.0% |
| English | 11,210 | 10.9% |
| Ethiopian | 12 | 0.0% |
| European | 3,736 | 3.6% |
| Filipino | 172 | 0.2% |
| Finnish | 223 | 0.2% |
| French | 2,580 | 2.5% |
| French Canadian | 299 | 0.3% |
| German | 14,101 | 13.7% |
| Greek | 197 | 0.2% |
| Guamanian / Chamorro | 68 | 0.1% |
| Guatemalan | 171 | 0.2% |
| Honduran | 29 | 0.0% |
| Hungarian | 233 | 0.2% |
| Icelander | 52 | 0.1% |
| Indian (Asian) | 1,441 | 1.4% |
| Indonesian | 7 | 0.0% |
| Iranian | 128 | 0.1% |
| Irish | 9,954 | 9.7% |
| Iroquois | 4 | 0.0% |
| Israeli | 68 | 0.1% |
| Italian | 5,509 | 5.4% |
| Jamaican | 38 | 0.0% |
| Japanese | 87 | 0.1% |
| Korean | 1,035 | 1.0% |
| Laotian | 208 | 0.2% |
| Latvian | 84 | 0.1% |
| Lebanese | 144 | 0.1% |
| Lithuanian | 42 | 0.0% |
| Malaysian | 284 | 0.3% |
| Maltese | 146 | 0.1% |
| Mexican | 16,400 | 16.0% |
| Mexican American Indian | 296 | 0.3% |
| Native Hawaiian | 201 | 0.2% |
| Navajo | 7 | 0.0% |
| Nepalese | 61 | 0.1% |
| New Zealander | 15 | 0.0% |
| Nicaraguan | 66 | 0.1% |
| Nigerian | 33 | 0.0% |
| Northern European | 400 | 0.4% |
| Norwegian | 2,066 | 2.0% |
| Osage | 23 | 0.0% |
| Paiute | 2 | 0.0% |
| Pakistani | 75 | 0.1% |
| Palestinian | 47 | 0.1% |
| Peruvian | 257 | 0.3% |
| Polish | 1,347 | 1.3% |
| Portuguese | 1,640 | 1.6% |
| Puerto Rican | 455 | 0.4% |
| Puget Sound Salish | 37 | 0.0% |
| Romanian | 222 | 0.2% |
| Russian | 877 | 0.9% |
| Salvadoran | 524 | 0.5% |
| Samoan | 152 | 0.2% |
| Scandinavian | 450 | 0.4% |
| Scotch-Irish | 1,000 | 1.0% |
| Scottish | 2,864 | 2.8% |
| Senegalese | 31 | 0.0% |
| Serbian | 111 | 0.1% |
| Shoshone | 26 | 0.0% |
| Sioux | 97 | 0.1% |
| Slavic | 28 | 0.0% |
| Slovak | 51 | 0.1% |
| Slovene | 29 | 0.0% |
| South African | 44 | 0.0% |
| South American | 495 | 0.5% |
| South American Indian | 36 | 0.0% |
| Spaniard | 340 | 0.3% |
| Spanish | 371 | 0.4% |
| Spanish American | 29 | 0.0% |
| Sri Lankan | 727 | 0.7% |
| Subsaharan African | 314 | 0.3% |
| Swedish | 1,185 | 1.1% |
| Swiss | 450 | 0.4% |
| Syrian | 55 | 0.1% |
| Thai | 510 | 0.5% |
| Tohono O'Odham | 9 | 0.0% |
| Tongan | 175 | 0.2% |
| Turkish | 2 | 0.0% |
| Ukrainian | 332 | 0.3% |
| Venezuelan | 12 | 0.0% |
| Welsh | 716 | 0.7% |
| West Indian | 7 | 0.0% |
| Yaqui | 52 | 0.1% |
| Yugoslavian | 38 | 0.0% |
| Yup'ik | 3 | 0.0% | View All 127 Rows |
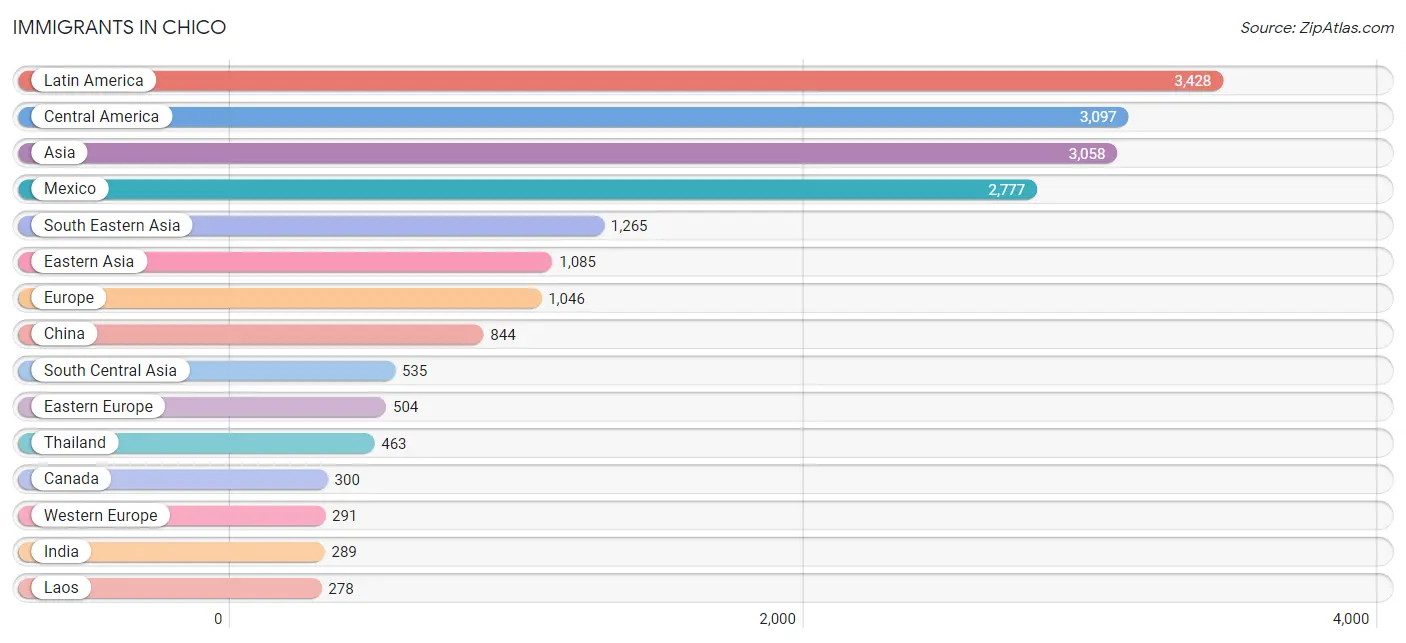
Immigrants in Chico
The most numerous immigrant groups reported in Chico came from Latin America (3,428 | 3.3%), Central America (3,097 | 3.0%), Asia (3,058 | 3.0%), Mexico (2,777 | 2.7%), and South Eastern Asia (1,265 | 1.2%), together accounting for 13.2% of all Chico residents.
| Immigration Origin | # Population | % Population |
| Afghanistan | 11 | 0.0% |
| Africa | 121 | 0.1% |
| Argentina | 40 | 0.0% |
| Asia | 3,058 | 3.0% |
| Australia | 41 | 0.0% |
| Belarus | 19 | 0.0% |
| Belgium | 47 | 0.1% |
| Bosnia and Herzegovina | 81 | 0.1% |
| Brazil | 27 | 0.0% |
| Cambodia | 35 | 0.0% |
| Canada | 300 | 0.3% |
| Caribbean | 115 | 0.1% |
| Central America | 3,097 | 3.0% |
| Chile | 20 | 0.0% |
| China | 844 | 0.8% |
| Colombia | 28 | 0.0% |
| Cuba | 80 | 0.1% |
| Czechoslovakia | 10 | 0.0% |
| Eastern Africa | 79 | 0.1% |
| Eastern Asia | 1,085 | 1.1% |
| Eastern Europe | 504 | 0.5% |
| El Salvador | 239 | 0.2% |
| England | 65 | 0.1% |
| Ethiopia | 6 | 0.0% |
| Europe | 1,046 | 1.0% |
| Fiji | 42 | 0.0% |
| France | 31 | 0.0% |
| Germany | 164 | 0.2% |
| Guatemala | 77 | 0.1% |
| Haiti | 13 | 0.0% |
| Hong Kong | 65 | 0.1% |
| India | 289 | 0.3% |
| Indonesia | 59 | 0.1% |
| Iran | 149 | 0.1% |
| Israel | 12 | 0.0% |
| Italy | 47 | 0.1% |
| Japan | 72 | 0.1% |
| Korea | 169 | 0.2% |
| Kuwait | 109 | 0.1% |
| Laos | 278 | 0.3% |
| Latin America | 3,428 | 3.3% |
| Latvia | 11 | 0.0% |
| Lebanon | 22 | 0.0% |
| Mexico | 2,777 | 2.7% |
| Micronesia | 19 | 0.0% |
| Moldova | 11 | 0.0% |
| Netherlands | 49 | 0.1% |
| Nicaragua | 4 | 0.0% |
| Nigeria | 21 | 0.0% |
| Northern Europe | 171 | 0.2% |
| Oceania | 102 | 0.1% |
| Pakistan | 86 | 0.1% |
| Peru | 73 | 0.1% |
| Philippines | 218 | 0.2% |
| Poland | 21 | 0.0% |
| Romania | 76 | 0.1% |
| Russia | 213 | 0.2% |
| Saudi Arabia | 2 | 0.0% |
| Scotland | 10 | 0.0% |
| South Africa | 21 | 0.0% |
| South America | 216 | 0.2% |
| South Central Asia | 535 | 0.5% |
| South Eastern Asia | 1,265 | 1.2% |
| Southern Europe | 80 | 0.1% |
| Spain | 33 | 0.0% |
| Sweden | 11 | 0.0% |
| Syria | 11 | 0.0% |
| Taiwan | 134 | 0.1% |
| Thailand | 463 | 0.4% |
| Turkey | 2 | 0.0% |
| Ukraine | 62 | 0.1% |
| Venezuela | 28 | 0.0% |
| Vietnam | 212 | 0.2% |
| West Indies | 22 | 0.0% |
| Western Africa | 21 | 0.0% |
| Western Asia | 165 | 0.2% |
| Western Europe | 291 | 0.3% |
| Zimbabwe | 73 | 0.1% | View All 78 Rows |
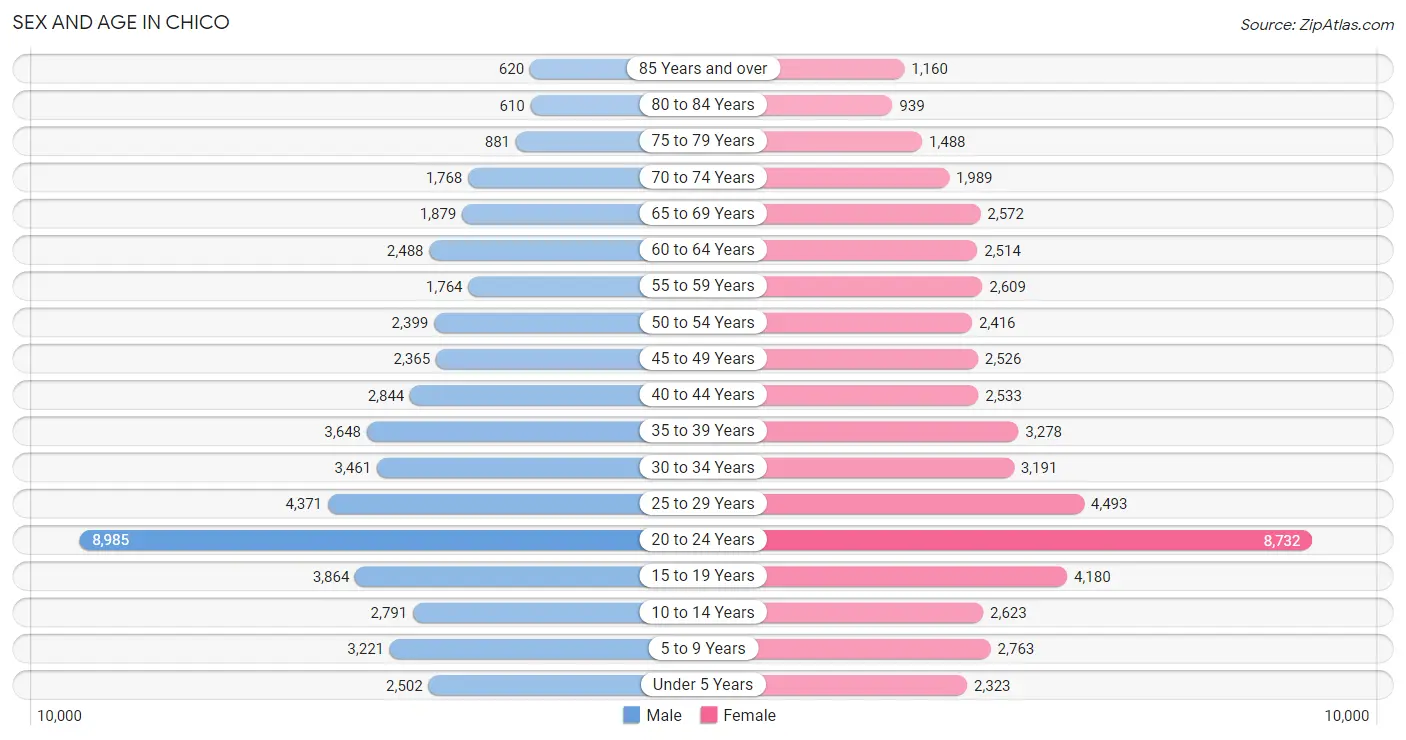
Sex and Age in Chico
Sex and Age in Chico
The most populous age groups in Chico are 20 to 24 Years (8,985 | 17.8%) for men and 20 to 24 Years (8,732 | 16.7%) for women.
| Age Bracket | Male | Female |
| Under 5 Years | 2,502 (5.0%) | 2,323 (4.4%) |
| 5 to 9 Years | 3,221 (6.4%) | 2,763 (5.3%) |
| 10 to 14 Years | 2,791 (5.5%) | 2,623 (5.0%) |
| 15 to 19 Years | 3,864 (7.7%) | 4,180 (8.0%) |
| 20 to 24 Years | 8,985 (17.8%) | 8,732 (16.7%) |
| 25 to 29 Years | 4,371 (8.7%) | 4,493 (8.6%) |
| 30 to 34 Years | 3,461 (6.9%) | 3,191 (6.1%) |
| 35 to 39 Years | 3,648 (7.2%) | 3,278 (6.3%) |
| 40 to 44 Years | 2,844 (5.6%) | 2,533 (4.8%) |
| 45 to 49 Years | 2,365 (4.7%) | 2,526 (4.8%) |
| 50 to 54 Years | 2,399 (4.8%) | 2,416 (4.6%) |
| 55 to 59 Years | 1,764 (3.5%) | 2,609 (5.0%) |
| 60 to 64 Years | 2,488 (4.9%) | 2,514 (4.8%) |
| 65 to 69 Years | 1,879 (3.7%) | 2,572 (4.9%) |
| 70 to 74 Years | 1,768 (3.5%) | 1,989 (3.8%) |
| 75 to 79 Years | 881 (1.8%) | 1,488 (2.8%) |
| 80 to 84 Years | 610 (1.2%) | 939 (1.8%) |
| 85 Years and over | 620 (1.2%) | 1,160 (2.2%) |
| Total | 50,461 (100.0%) | 52,329 (100.0%) |
Families and Households in Chico
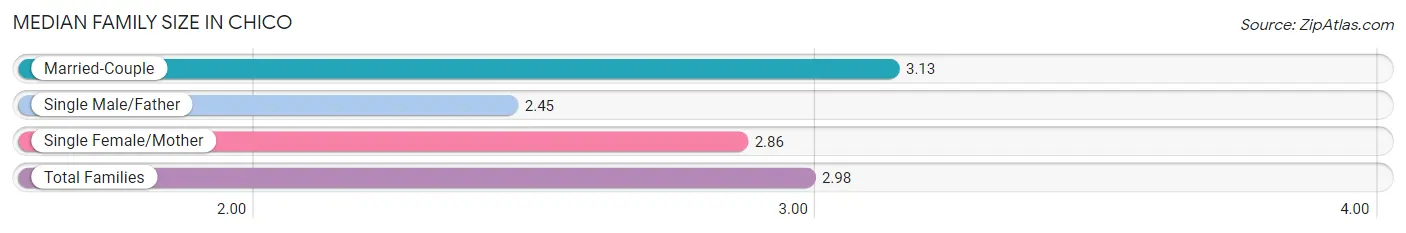
Median Family Size in Chico
The median family size in Chico is 2.98 persons per family, with married-couple families (13,619 | 65.3%) accounting for the largest median family size of 3.13 persons per family. On the other hand, single male/father families (2,638 | 12.6%) represent the smallest median family size with 2.45 persons per family.
| Family Type | # Families | Family Size |
| Married-Couple | 13,619 (65.3%) | 3.13 |
| Single Male/Father | 2,638 (12.6%) | 2.45 |
| Single Female/Mother | 4,609 (22.1%) | 2.86 |
| Total Families | 20,866 (100.0%) | 2.98 |
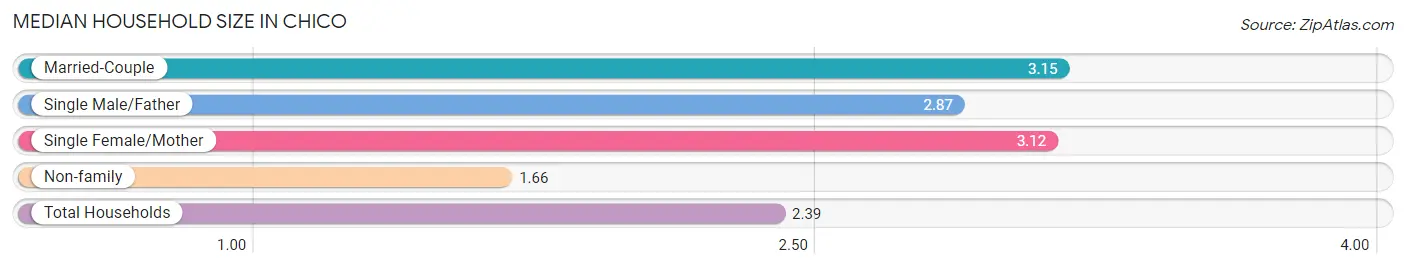
Median Household Size in Chico
The median household size in Chico is 2.39 persons per household, with married-couple households (13,619 | 32.9%) accounting for the largest median household size of 3.15 persons per household. non-family households (20,588 | 49.7%) represent the smallest median household size with 1.66 persons per household.
| Household Type | # Households | Household Size |
| Married-Couple | 13,619 (32.9%) | 3.15 |
| Single Male/Father | 2,638 (6.4%) | 2.87 |
| Single Female/Mother | 4,609 (11.1%) | 3.12 |
| Non-family | 20,588 (49.7%) | 1.66 |
| Total Households | 41,454 (100.0%) | 2.39 |
Household Size by Marriage Status in Chico
Out of a total of 41,454 households in Chico, 20,866 (50.3%) are family households, while 20,588 (49.7%) are nonfamily households. The most numerous type of family households are 2-person households, comprising 9,511, and the most common type of nonfamily households are 1-person households, comprising 12,049.
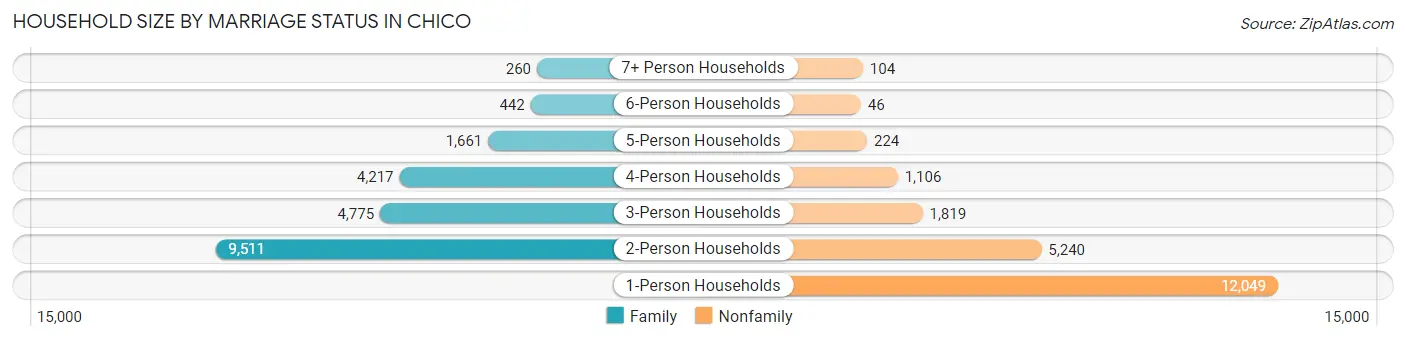
| Household Size | Family Households | Nonfamily Households |
| 1-Person Households | - | 12,049 (29.1%) |
| 2-Person Households | 9,511 (22.9%) | 5,240 (12.6%) |
| 3-Person Households | 4,775 (11.5%) | 1,819 (4.4%) |
| 4-Person Households | 4,217 (10.2%) | 1,106 (2.7%) |
| 5-Person Households | 1,661 (4.0%) | 224 (0.5%) |
| 6-Person Households | 442 (1.1%) | 46 (0.1%) |
| 7+ Person Households | 260 (0.6%) | 104 (0.3%) |
| Total | 20,866 (50.3%) | 20,588 (49.7%) |
Female Fertility in Chico
Fertility by Age in Chico
Average fertility rate in Chico is 39.0 births per 1,000 women. Women in the age bracket of 20 to 34 years have the highest fertility rate with 49.0 births per 1,000 women. Women in the age bracket of 20 to 34 years acount for 70.9% of all women with births.
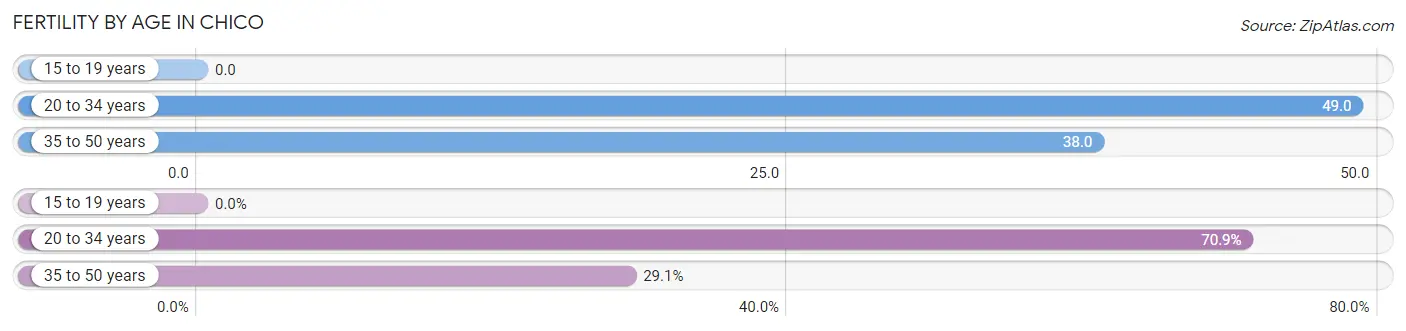
| Age Bracket | Women with Births | Births / 1,000 Women |
| 15 to 19 years | 0 (0.0%) | 0.0 |
| 20 to 34 years | 808 (70.9%) | 49.0 |
| 35 to 50 years | 331 (29.1%) | 38.0 |
| Total | 1,139 (100.0%) | 39.0 |
Fertility by Age by Marriage Status in Chico
57.0% of women with births (1,139) in Chico are married. The highest percentage of unmarried women with births falls into 20 to 34 years age bracket with 58.7% of them unmarried at the time of birth, while the lowest percentage of unmarried women with births belong to 35 to 50 years age bracket with 4.8% of them unmarried.
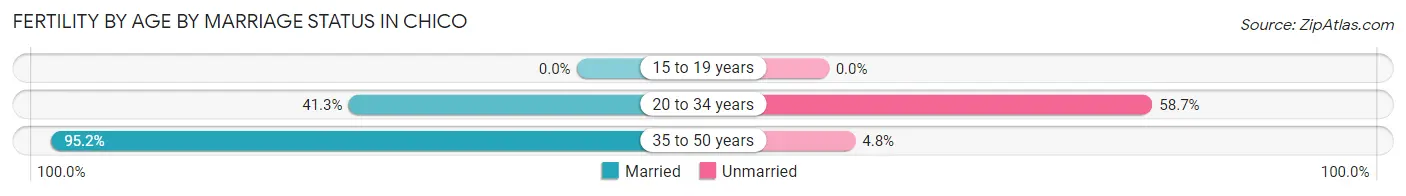
| Age Bracket | Married | Unmarried |
| 15 to 19 years | 0 (0.0%) | 0 (0.0%) |
| 20 to 34 years | 334 (41.3%) | 474 (58.7%) |
| 35 to 50 years | 315 (95.2%) | 16 (4.8%) |
| Total | 649 (57.0%) | 490 (43.0%) |
Fertility by Education in Chico
Average fertility rate in Chico is 39.0 births per 1,000 women. Women with the education attainment of less than high school have the highest fertility rate of 56.0 births per 1,000 women, while women with the education attainment of college or associate's degree have the lowest fertility at 29.0 births per 1,000 women. Women with the education attainment of bachelor's degree represent 33.2% of all women with births.
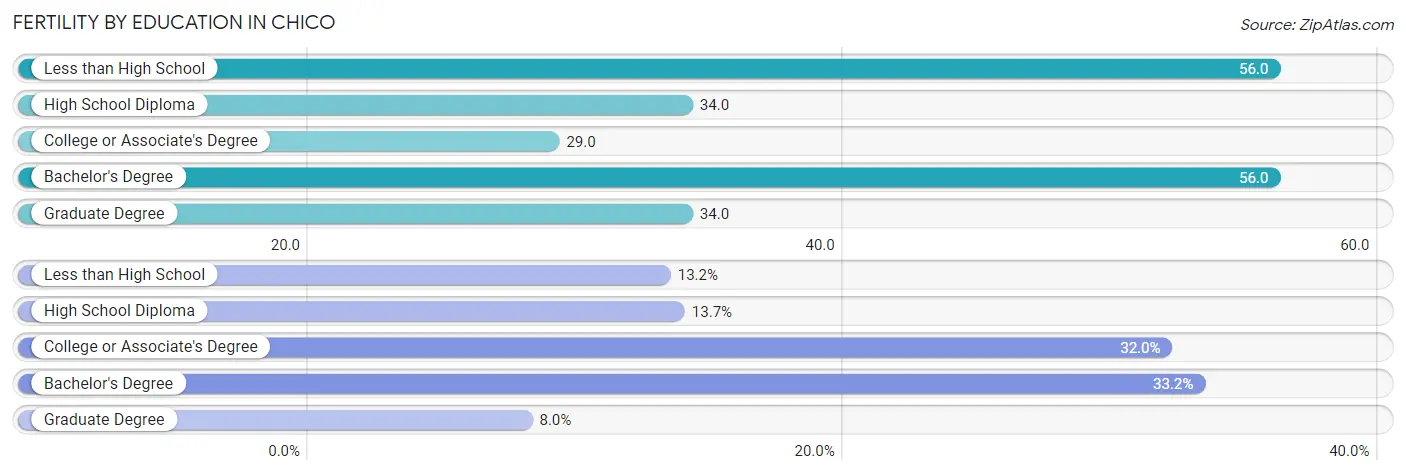
| Educational Attainment | Women with Births | Births / 1,000 Women |
| Less than High School | 150 (13.2%) | 56.0 |
| High School Diploma | 156 (13.7%) | 34.0 |
| College or Associate's Degree | 364 (32.0%) | 29.0 |
| Bachelor's Degree | 378 (33.2%) | 56.0 |
| Graduate Degree | 91 (8.0%) | 34.0 |
| Total | 1,139 (100.0%) | 39.0 |
Fertility by Education by Marriage Status in Chico
43.0% of women with births in Chico are unmarried. Women with the educational attainment of graduate degree are most likely to be married with 100.0% of them married at childbirth, while women with the educational attainment of college or associate's degree are least likely to be married with 56.0% of them unmarried at childbirth.
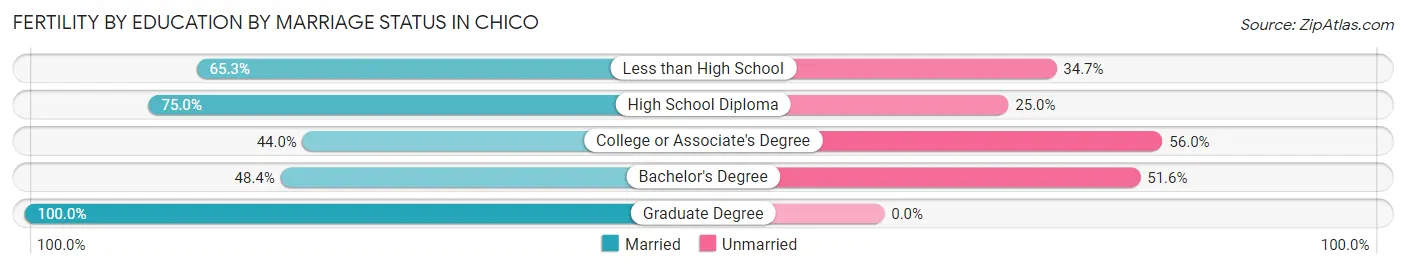
| Educational Attainment | Married | Unmarried |
| Less than High School | 98 (65.3%) | 52 (34.7%) |
| High School Diploma | 117 (75.0%) | 39 (25.0%) |
| College or Associate's Degree | 160 (44.0%) | 204 (56.0%) |
| Bachelor's Degree | 183 (48.4%) | 195 (51.6%) |
| Graduate Degree | 91 (100.0%) | 0 (0.0%) |
| Total | 649 (57.0%) | 490 (43.0%) |
Employment Characteristics in Chico
Employment by Class of Employer in Chico
Among the 50,936 employed individuals in Chico, private company employees (31,178 | 61.2%), not-for-profit organizations (4,918 | 9.7%), and local government employees (4,762 | 9.3%) make up the most common classes of employment.
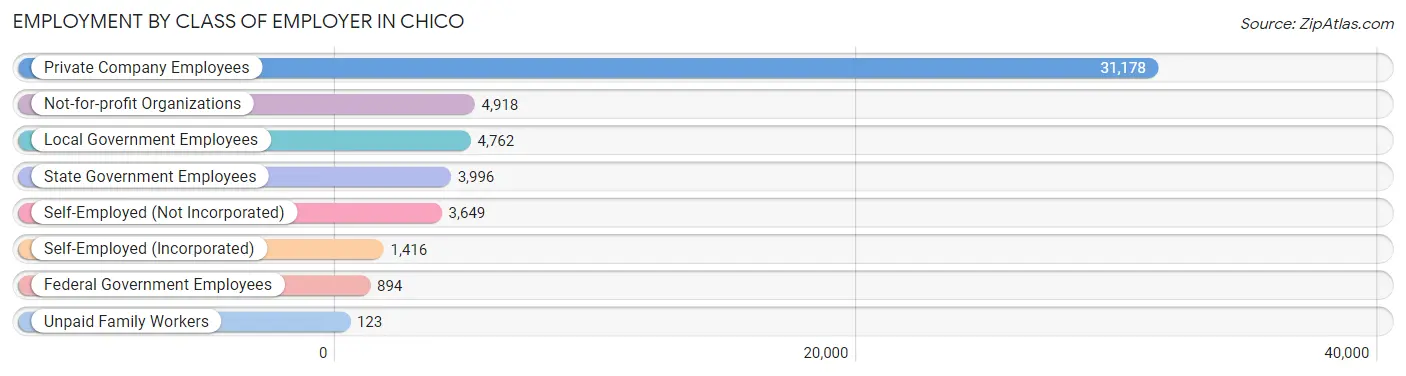
| Employer Class | # Employees | % Employees |
| Private Company Employees | 31,178 | 61.2% |
| Self-Employed (Incorporated) | 1,416 | 2.8% |
| Self-Employed (Not Incorporated) | 3,649 | 7.2% |
| Not-for-profit Organizations | 4,918 | 9.7% |
| Local Government Employees | 4,762 | 9.3% |
| State Government Employees | 3,996 | 7.9% |
| Federal Government Employees | 894 | 1.8% |
| Unpaid Family Workers | 123 | 0.2% |
| Total | 50,936 | 100.0% |
Employment Status by Age in Chico
According to the labor force statistics for Chico, out of the total population over 16 years of age (85,618), 66.1% or 56,593 individuals are in the labor force, with 6.9% or 3,905 of them unemployed. The age group with the highest labor force participation rate is 25 to 29 years, with 88.4% or 7,836 individuals in the labor force. Within the labor force, the 16 to 19 years age range has the highest percentage of unemployed individuals, with 13.7% or 366 of them being unemployed.
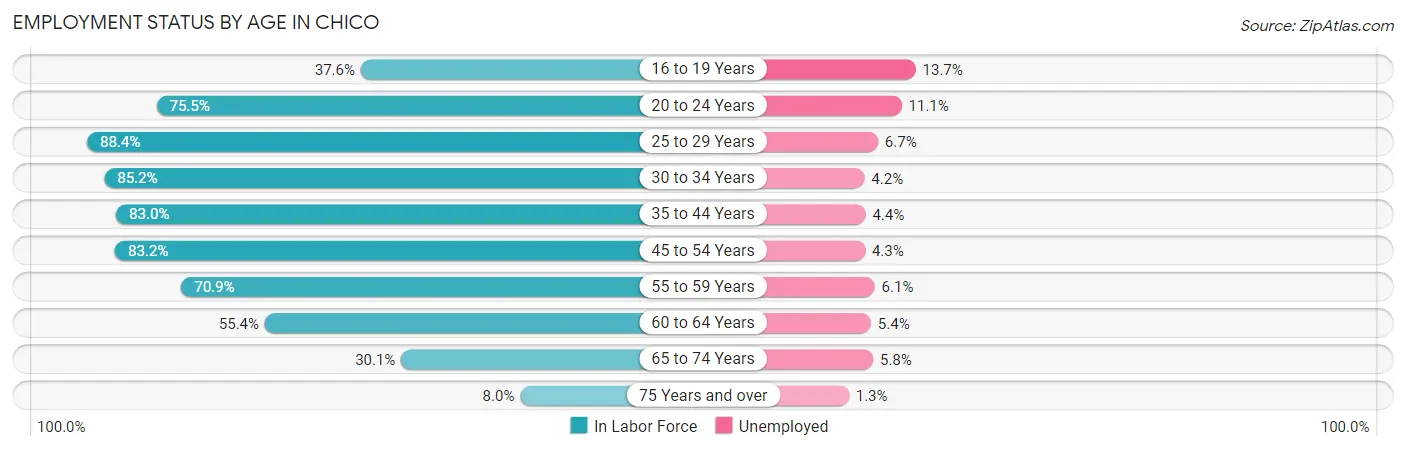
| Age Bracket | In Labor Force | Unemployed |
| 16 to 19 Years | 2,668 (37.6%) | 366 (13.7%) |
| 20 to 24 Years | 13,376 (75.5%) | 1,485 (11.1%) |
| 25 to 29 Years | 7,836 (88.4%) | 525 (6.7%) |
| 30 to 34 Years | 5,668 (85.2%) | 238 (4.2%) |
| 35 to 44 Years | 10,211 (83.0%) | 449 (4.4%) |
| 45 to 54 Years | 8,075 (83.2%) | 347 (4.3%) |
| 55 to 59 Years | 3,100 (70.9%) | 189 (6.1%) |
| 60 to 64 Years | 2,771 (55.4%) | 150 (5.4%) |
| 65 to 74 Years | 2,471 (30.1%) | 143 (5.8%) |
| 75 Years and over | 456 (8.0%) | 6 (1.3%) |
| Total | 56,593 (66.1%) | 3,905 (6.9%) |
Employment Status by Educational Attainment in Chico
According to labor force statistics for Chico, 80.3% of individuals (37,661) out of the total population between 25 and 64 years of age (46,900) are in the labor force, with 5.0% or 1,883 of them being unemployed. The group with the highest labor force participation rate are those with the educational attainment of bachelor's degree or higher, with 88.3% or 16,871 individuals in the labor force. Within the labor force, individuals with high school diploma education have the highest percentage of unemployment, with 7.3% or 407 of them being unemployed.
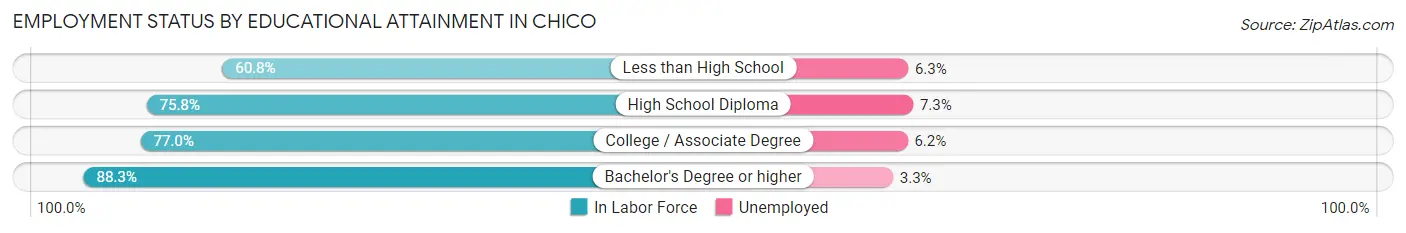
| Educational Attainment | In Labor Force | Unemployed |
| Less than High School | 1,990 (60.8%) | 206 (6.3%) |
| High School Diploma | 5,578 (75.8%) | 537 (7.3%) |
| College / Associate Degree | 13,215 (77.0%) | 1,064 (6.2%) |
| Bachelor's Degree or higher | 16,871 (88.3%) | 630 (3.3%) |
| Total | 37,661 (80.3%) | 2,345 (5.0%) |
Employment Occupations by Sex in Chico
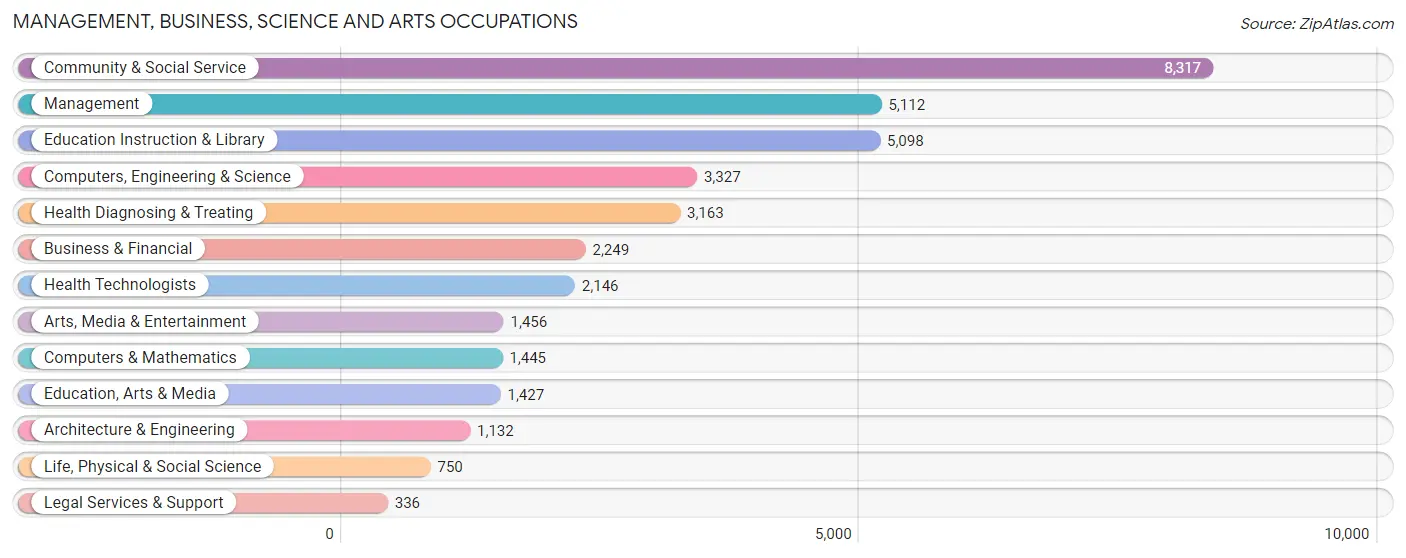
Management, Business, Science and Arts Occupations
The most common Management, Business, Science and Arts occupations in Chico are Community & Social Service (8,317 | 15.8%), Management (5,112 | 9.7%), Education Instruction & Library (5,098 | 9.7%), Computers, Engineering & Science (3,327 | 6.3%), and Health Diagnosing & Treating (3,163 | 6.0%).
Management, Business, Science and Arts Occupations by Sex
Within the Management, Business, Science and Arts occupations in Chico, the most male-oriented occupations are Computers & Mathematics (82.4%), Architecture & Engineering (81.0%), and Computers, Engineering & Science (80.3%), while the most female-oriented occupations are Health Diagnosing & Treating (70.2%), Health Technologists (69.8%), and Education, Arts & Media (66.3%).
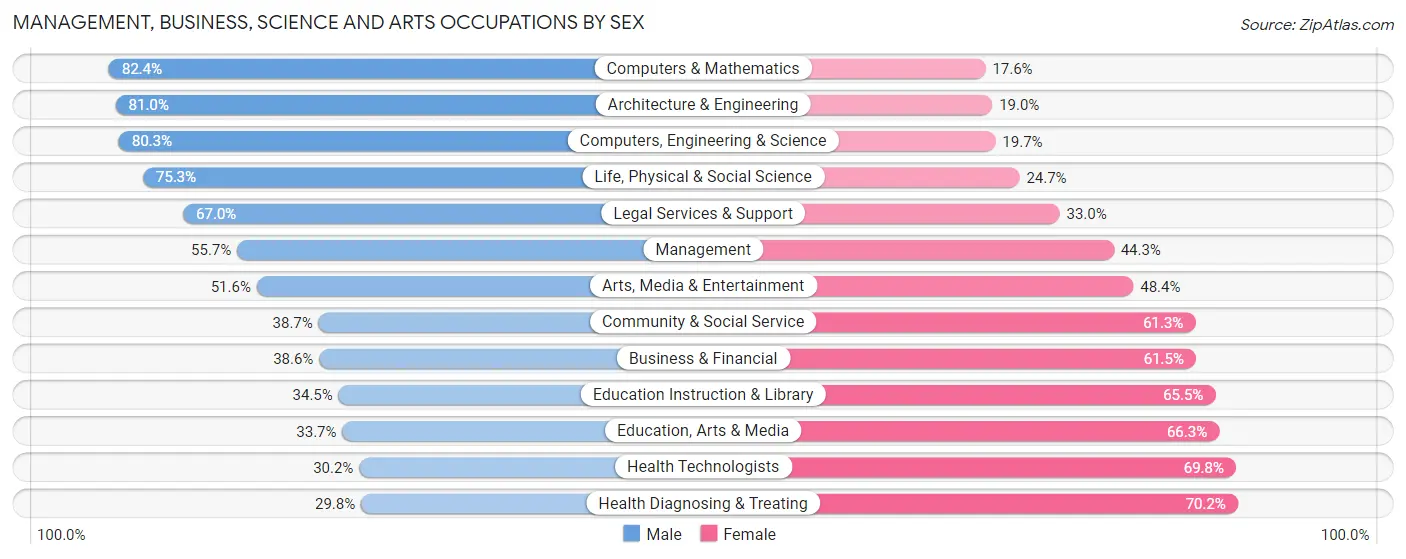
| Occupation | Male | Female |
| Management | 2,846 (55.7%) | 2,266 (44.3%) |
| Business & Financial | 867 (38.6%) | 1,382 (61.5%) |
| Computers, Engineering & Science | 2,673 (80.3%) | 654 (19.7%) |
| Computers & Mathematics | 1,191 (82.4%) | 254 (17.6%) |
| Architecture & Engineering | 917 (81.0%) | 215 (19.0%) |
| Life, Physical & Social Science | 565 (75.3%) | 185 (24.7%) |
| Community & Social Service | 3,216 (38.7%) | 5,101 (61.3%) |
| Education, Arts & Media | 481 (33.7%) | 946 (66.3%) |
| Legal Services & Support | 225 (67.0%) | 111 (33.0%) |
| Education Instruction & Library | 1,759 (34.5%) | 3,339 (65.5%) |
| Arts, Media & Entertainment | 751 (51.6%) | 705 (48.4%) |
| Health Diagnosing & Treating | 943 (29.8%) | 2,220 (70.2%) |
| Health Technologists | 648 (30.2%) | 1,498 (69.8%) |
| Total (Category) | 10,545 (47.6%) | 11,623 (52.4%) |
| Total (Overall) | 26,522 (50.4%) | 26,116 (49.6%) |
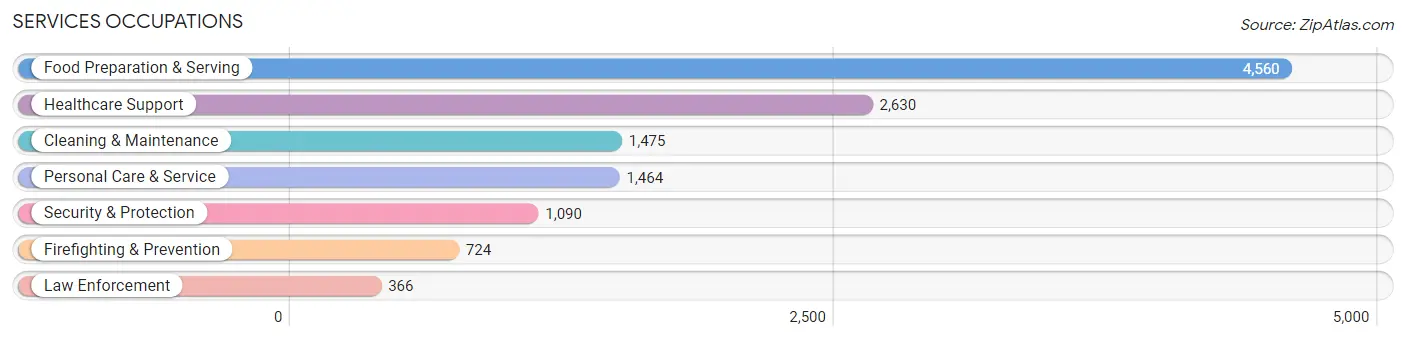
Services Occupations
The most common Services occupations in Chico are Food Preparation & Serving (4,560 | 8.7%), Healthcare Support (2,630 | 5.0%), Cleaning & Maintenance (1,475 | 2.8%), Personal Care & Service (1,464 | 2.8%), and Security & Protection (1,090 | 2.1%).
Services Occupations by Sex
Within the Services occupations in Chico, the most male-oriented occupations are Firefighting & Prevention (85.6%), Security & Protection (84.4%), and Law Enforcement (82.0%), while the most female-oriented occupations are Healthcare Support (70.5%), Personal Care & Service (67.0%), and Food Preparation & Serving (52.3%).
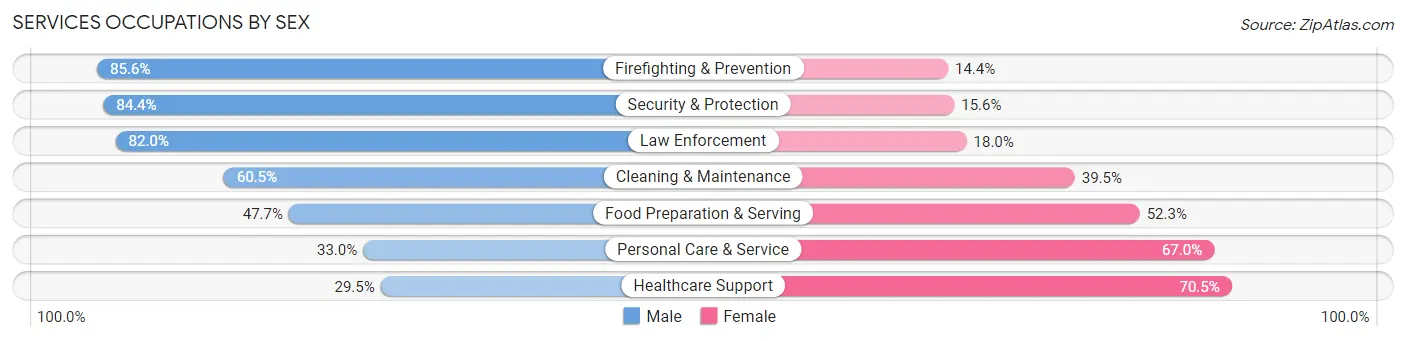
| Occupation | Male | Female |
| Healthcare Support | 776 (29.5%) | 1,854 (70.5%) |
| Security & Protection | 920 (84.4%) | 170 (15.6%) |
| Firefighting & Prevention | 620 (85.6%) | 104 (14.4%) |
| Law Enforcement | 300 (82.0%) | 66 (18.0%) |
| Food Preparation & Serving | 2,174 (47.7%) | 2,386 (52.3%) |
| Cleaning & Maintenance | 893 (60.5%) | 582 (39.5%) |
| Personal Care & Service | 483 (33.0%) | 981 (67.0%) |
| Total (Category) | 5,246 (46.8%) | 5,973 (53.2%) |
| Total (Overall) | 26,522 (50.4%) | 26,116 (49.6%) |
Sales and Office Occupations
The most common Sales and Office occupations in Chico are Office & Administration (6,415 | 12.2%), and Sales & Related (5,753 | 10.9%).

Sales and Office Occupations by Sex
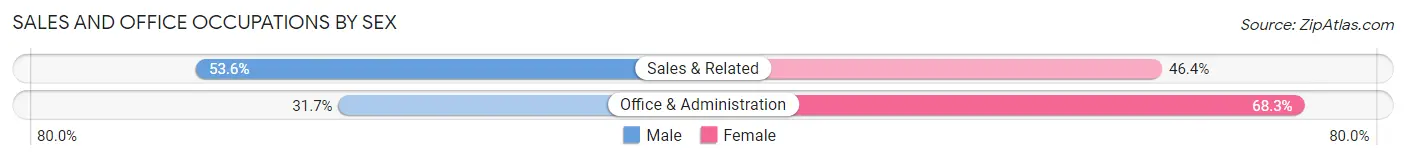
| Occupation | Male | Female |
| Sales & Related | 3,085 (53.6%) | 2,668 (46.4%) |
| Office & Administration | 2,035 (31.7%) | 4,380 (68.3%) |
| Total (Category) | 5,120 (42.1%) | 7,048 (57.9%) |
| Total (Overall) | 26,522 (50.4%) | 26,116 (49.6%) |
Natural Resources, Construction and Maintenance Occupations
The most common Natural Resources, Construction and Maintenance occupations in Chico are Construction & Extraction (1,510 | 2.9%), Installation, Maintenance & Repair (857 | 1.6%), and Farming, Fishing & Forestry (409 | 0.8%).

Natural Resources, Construction and Maintenance Occupations by Sex
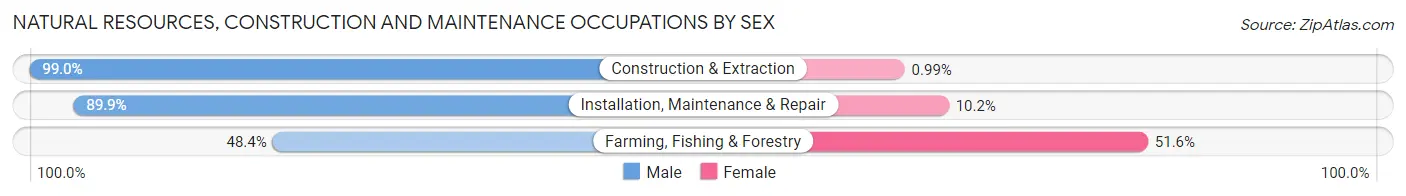
| Occupation | Male | Female |
| Farming, Fishing & Forestry | 198 (48.4%) | 211 (51.6%) |
| Construction & Extraction | 1,495 (99.0%) | 15 (1.0%) |
| Installation, Maintenance & Repair | 770 (89.8%) | 87 (10.2%) |
| Total (Category) | 2,463 (88.7%) | 313 (11.3%) |
| Total (Overall) | 26,522 (50.4%) | 26,116 (49.6%) |
Production, Transportation and Moving Occupations
The most common Production, Transportation and Moving occupations in Chico are Material Moving (1,517 | 2.9%), Production (1,470 | 2.8%), and Transportation (1,320 | 2.5%).
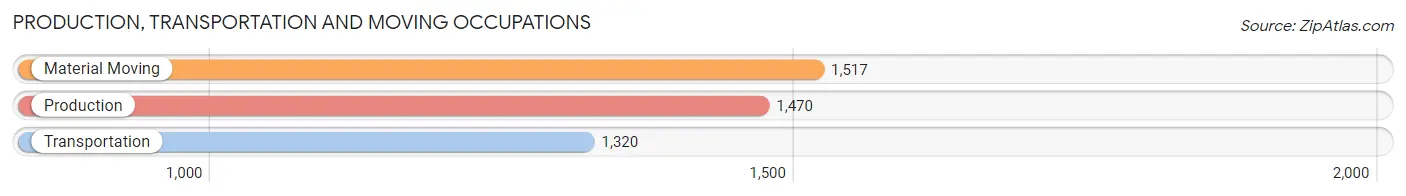
Production, Transportation and Moving Occupations by Sex
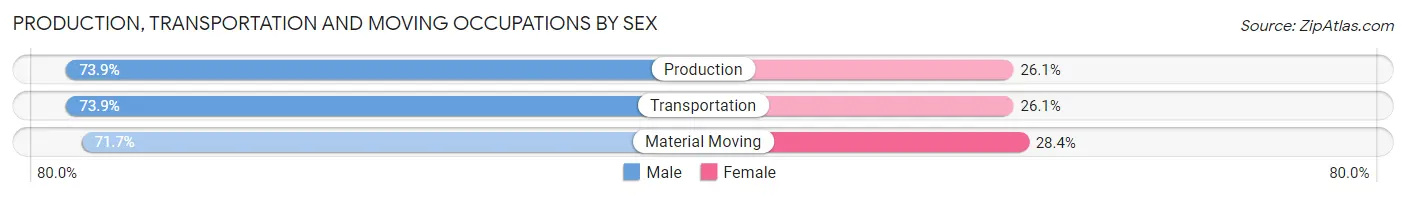
| Occupation | Male | Female |
| Production | 1,086 (73.9%) | 384 (26.1%) |
| Transportation | 975 (73.9%) | 345 (26.1%) |
| Material Moving | 1,087 (71.7%) | 430 (28.3%) |
| Total (Category) | 3,148 (73.1%) | 1,159 (26.9%) |
| Total (Overall) | 26,522 (50.4%) | 26,116 (49.6%) |
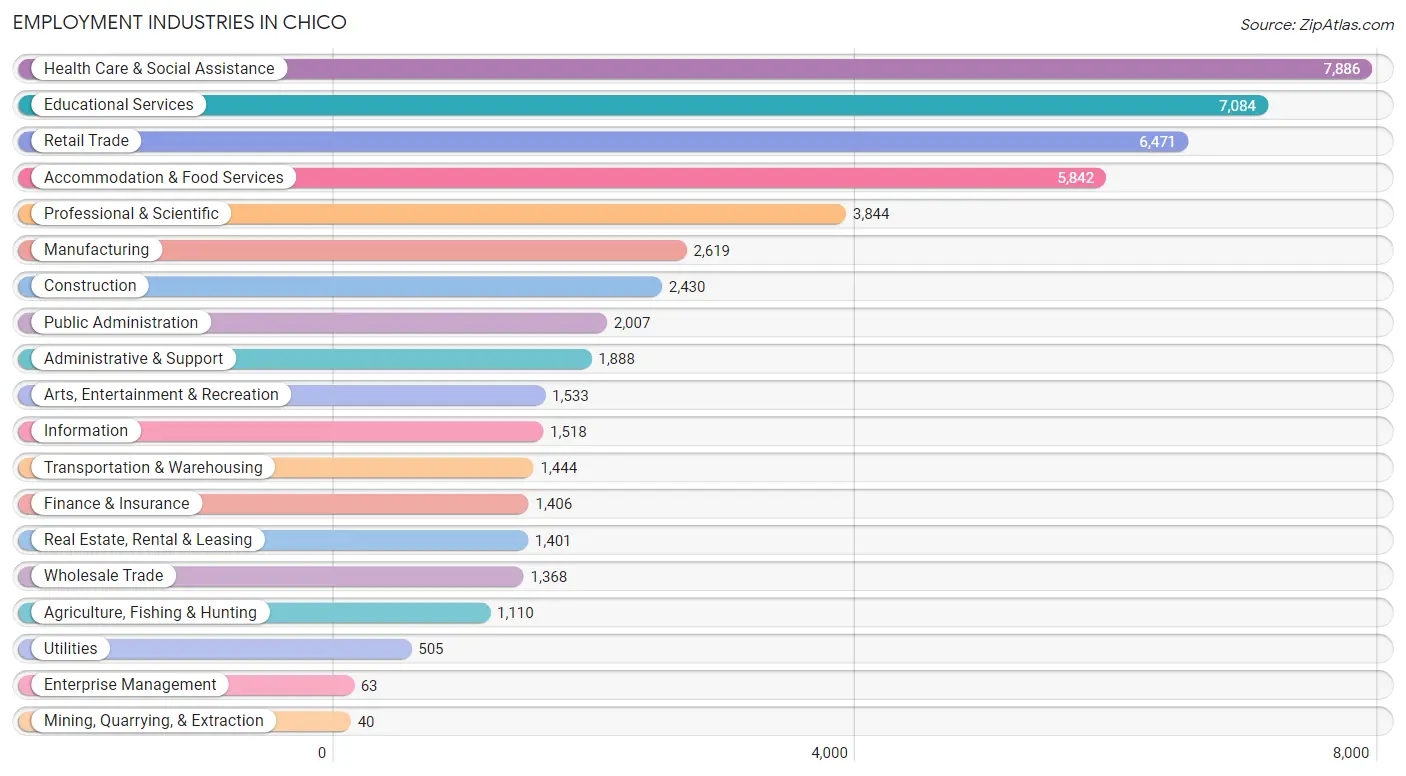
Employment Industries by Sex in Chico
Employment Industries in Chico
The major employment industries in Chico include Health Care & Social Assistance (7,886 | 15.0%), Educational Services (7,084 | 13.5%), Retail Trade (6,471 | 12.3%), Accommodation & Food Services (5,842 | 11.1%), and Professional & Scientific (3,844 | 7.3%).
Employment Industries by Sex in Chico
The Chico industries that see more men than women are Mining, Quarrying, & Extraction (100.0%), Construction (90.7%), and Utilities (76.8%), whereas the industries that tend to have a higher number of women are Enterprise Management (100.0%), Health Care & Social Assistance (70.3%), and Real Estate, Rental & Leasing (66.5%).
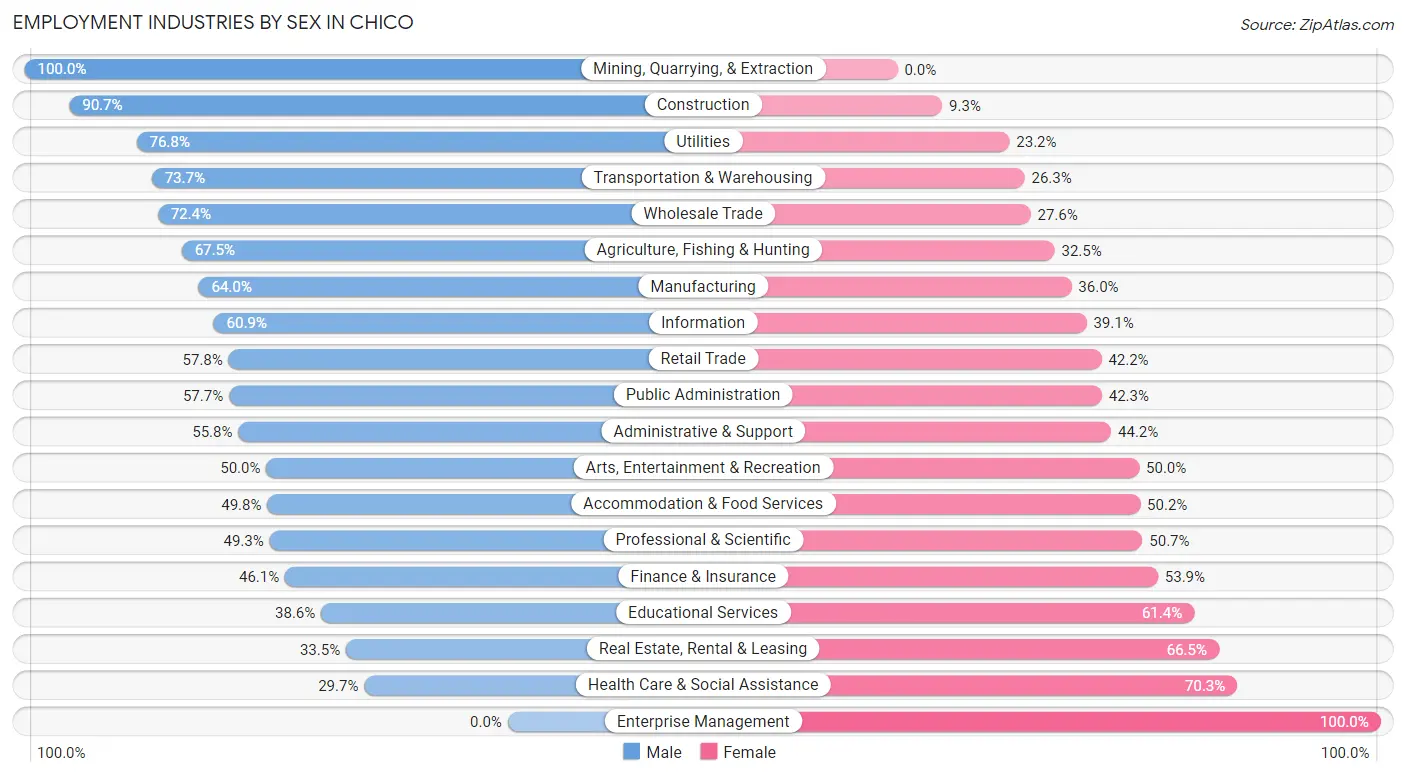
| Industry | Male | Female |
| Agriculture, Fishing & Hunting | 749 (67.5%) | 361 (32.5%) |
| Mining, Quarrying, & Extraction | 40 (100.0%) | 0 (0.0%) |
| Construction | 2,205 (90.7%) | 225 (9.3%) |
| Manufacturing | 1,676 (64.0%) | 943 (36.0%) |
| Wholesale Trade | 991 (72.4%) | 377 (27.6%) |
| Retail Trade | 3,738 (57.8%) | 2,733 (42.2%) |
| Transportation & Warehousing | 1,064 (73.7%) | 380 (26.3%) |
| Utilities | 388 (76.8%) | 117 (23.2%) |
| Information | 924 (60.9%) | 594 (39.1%) |
| Finance & Insurance | 648 (46.1%) | 758 (53.9%) |
| Real Estate, Rental & Leasing | 469 (33.5%) | 932 (66.5%) |
| Professional & Scientific | 1,895 (49.3%) | 1,949 (50.7%) |
| Enterprise Management | 0 (0.0%) | 63 (100.0%) |
| Administrative & Support | 1,053 (55.8%) | 835 (44.2%) |
| Educational Services | 2,736 (38.6%) | 4,348 (61.4%) |
| Health Care & Social Assistance | 2,342 (29.7%) | 5,544 (70.3%) |
| Arts, Entertainment & Recreation | 766 (50.0%) | 767 (50.0%) |
| Accommodation & Food Services | 2,907 (49.8%) | 2,935 (50.2%) |
| Public Administration | 1,158 (57.7%) | 849 (42.3%) |
| Total | 26,522 (50.4%) | 26,116 (49.6%) |
Education in Chico
School Enrollment in Chico
The most common levels of schooling among the 34,398 students in Chico are college / undergraduate (17,108 | 49.7%), high school (4,532 | 13.2%), and elementary school (4,479 | 13.0%).
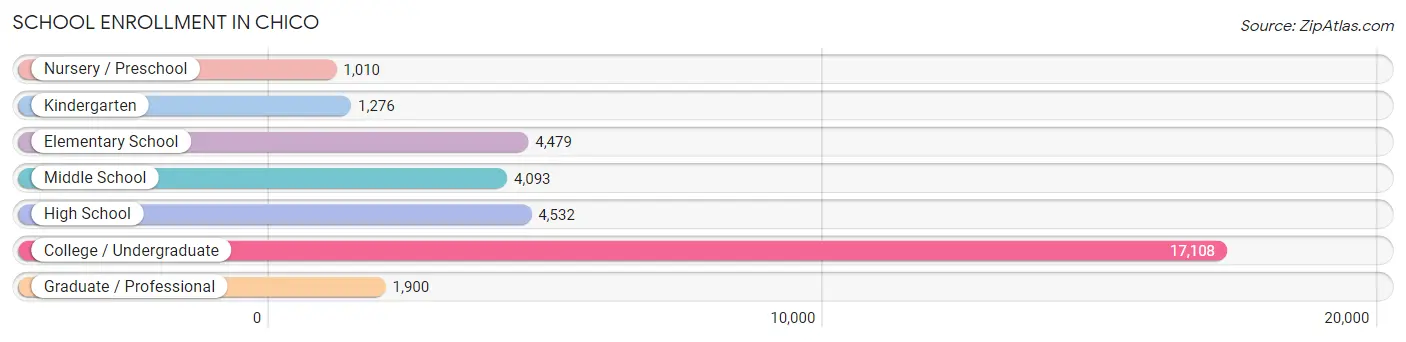
| School Level | # Students | % Students |
| Nursery / Preschool | 1,010 | 2.9% |
| Kindergarten | 1,276 | 3.7% |
| Elementary School | 4,479 | 13.0% |
| Middle School | 4,093 | 11.9% |
| High School | 4,532 | 13.2% |
| College / Undergraduate | 17,108 | 49.7% |
| Graduate / Professional | 1,900 | 5.5% |
| Total | 34,398 | 100.0% |
School Enrollment by Age by Funding Source in Chico
Out of a total of 34,398 students who are enrolled in schools in Chico, 2,786 (8.1%) attend a private institution, while the remaining 31,612 (91.9%) are enrolled in public schools. The age group of 3 to 4 year olds has the highest likelihood of being enrolled in private schools, with 418 (57.2% in the age bracket) enrolled. Conversely, the age group of 15 to 17 year olds has the lowest likelihood of being enrolled in a private school, with 2,882 (97.4% in the age bracket) attending a public institution.
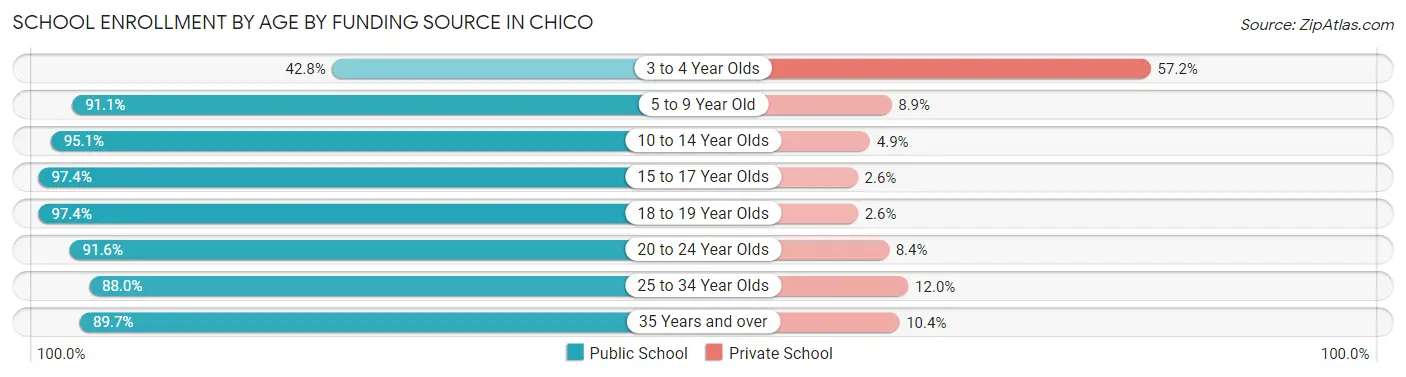
| Age Bracket | Public School | Private School |
| 3 to 4 Year Olds | 313 (42.8%) | 418 (57.2%) |
| 5 to 9 Year Old | 5,189 (91.1%) | 505 (8.9%) |
| 10 to 14 Year Olds | 5,021 (95.1%) | 257 (4.9%) |
| 15 to 17 Year Olds | 2,882 (97.4%) | 77 (2.6%) |
| 18 to 19 Year Olds | 4,220 (97.4%) | 113 (2.6%) |
| 20 to 24 Year Olds | 10,434 (91.6%) | 956 (8.4%) |
| 25 to 34 Year Olds | 2,426 (88.0%) | 331 (12.0%) |
| 35 Years and over | 1,126 (89.6%) | 130 (10.3%) |
| Total | 31,612 (91.9%) | 2,786 (8.1%) |
Educational Attainment by Field of Study in Chico
Business (3,369 | 12.4%), social sciences (2,785 | 10.3%), arts & humanities (2,684 | 9.9%), science & technology (2,646 | 9.8%), and liberal arts & history (2,251 | 8.3%) are the most common fields of study among 27,108 individuals in Chico who have obtained a bachelor's degree or higher.
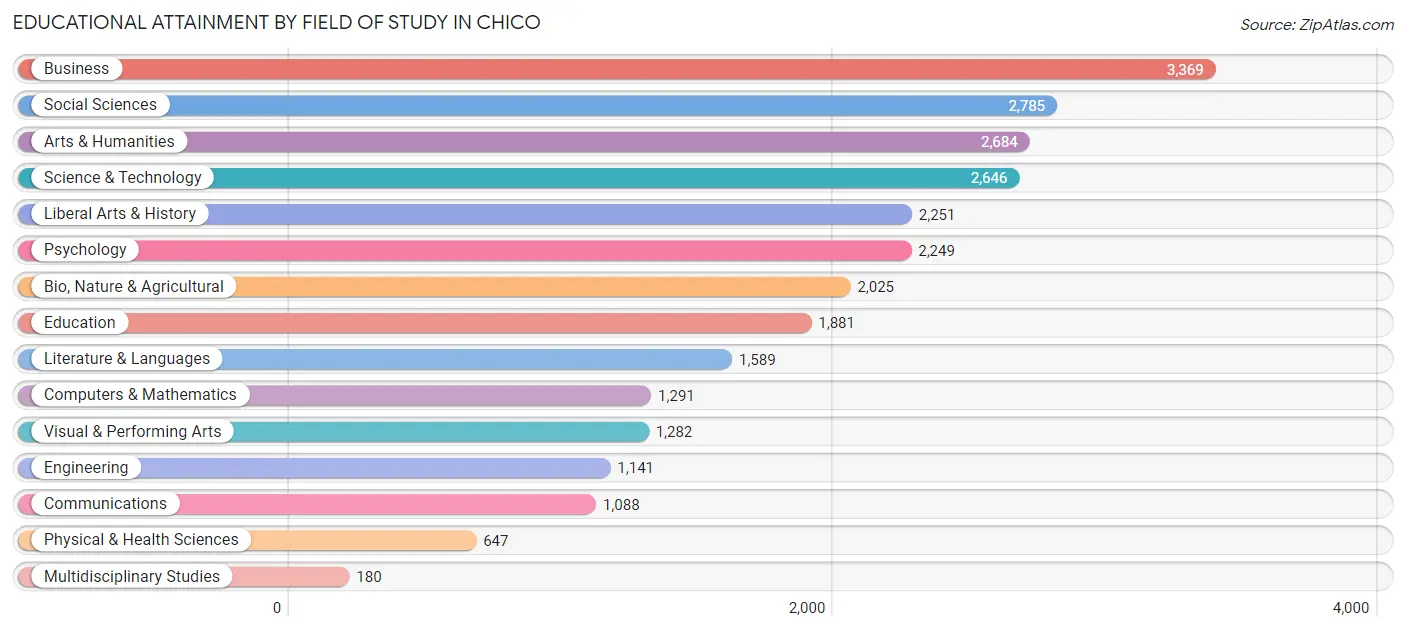
| Field of Study | # Graduates | % Graduates |
| Computers & Mathematics | 1,291 | 4.8% |
| Bio, Nature & Agricultural | 2,025 | 7.5% |
| Physical & Health Sciences | 647 | 2.4% |
| Psychology | 2,249 | 8.3% |
| Social Sciences | 2,785 | 10.3% |
| Engineering | 1,141 | 4.2% |
| Multidisciplinary Studies | 180 | 0.7% |
| Science & Technology | 2,646 | 9.8% |
| Business | 3,369 | 12.4% |
| Education | 1,881 | 6.9% |
| Literature & Languages | 1,589 | 5.9% |
| Liberal Arts & History | 2,251 | 8.3% |
| Visual & Performing Arts | 1,282 | 4.7% |
| Communications | 1,088 | 4.0% |
| Arts & Humanities | 2,684 | 9.9% |
| Total | 27,108 | 100.0% |
Transportation & Commute in Chico
Vehicle Availability by Sex in Chico
The most prevalent vehicle ownership categories in Chico are males with 2 vehicles (11,286, accounting for 44.5%) and females with 2 vehicles (10,402, making up 45.6%).
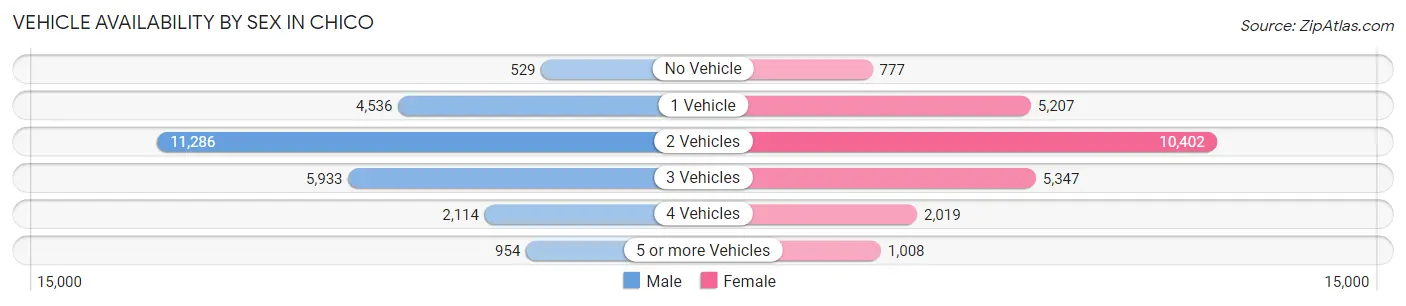
| Vehicles Available | Male | Female |
| No Vehicle | 529 (2.1%) | 777 (3.1%) |
| 1 Vehicle | 4,536 (17.9%) | 5,207 (21.0%) |
| 2 Vehicles | 11,286 (44.5%) | 10,402 (42.0%) |
| 3 Vehicles | 5,933 (23.4%) | 5,347 (21.6%) |
| 4 Vehicles | 2,114 (8.3%) | 2,019 (8.2%) |
| 5 or more Vehicles | 954 (3.8%) | 1,008 (4.1%) |
| Total | 25,352 (100.0%) | 24,760 (100.0%) |
Commute Time in Chico
The most frequently occuring commute durations in Chico are 10 to 14 minutes (12,602 commuters, 28.0%), 5 to 9 minutes (9,877 commuters, 21.9%), and 15 to 19 minutes (8,467 commuters, 18.8%).
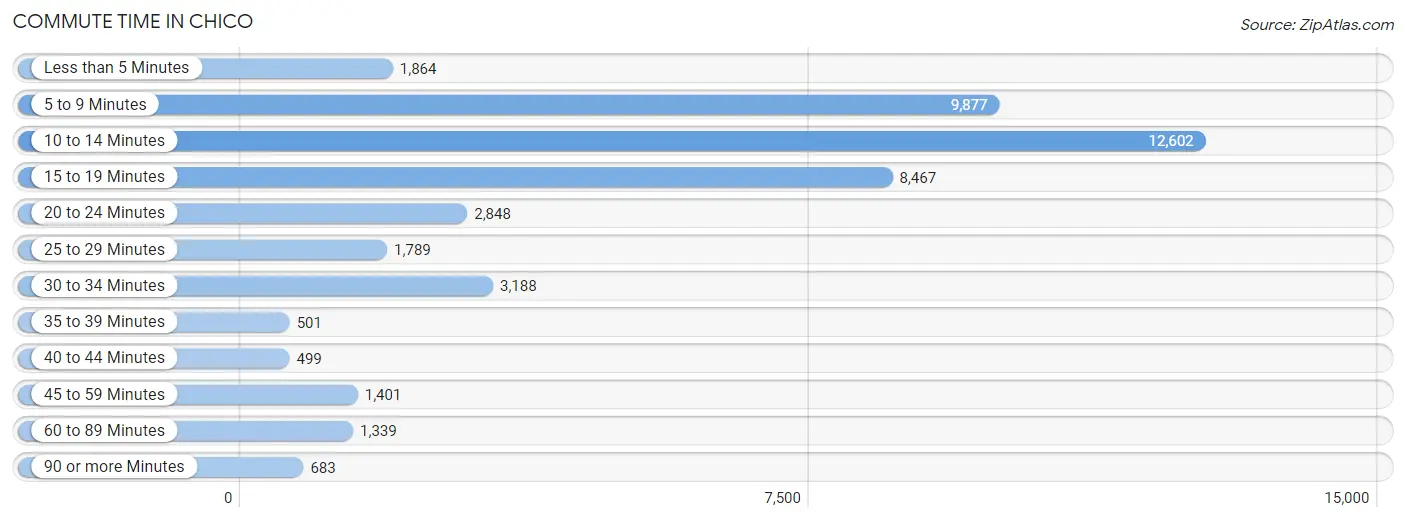
| Commute Time | # Commuters | % Commuters |
| Less than 5 Minutes | 1,864 | 4.1% |
| 5 to 9 Minutes | 9,877 | 21.9% |
| 10 to 14 Minutes | 12,602 | 28.0% |
| 15 to 19 Minutes | 8,467 | 18.8% |
| 20 to 24 Minutes | 2,848 | 6.3% |
| 25 to 29 Minutes | 1,789 | 4.0% |
| 30 to 34 Minutes | 3,188 | 7.1% |
| 35 to 39 Minutes | 501 | 1.1% |
| 40 to 44 Minutes | 499 | 1.1% |
| 45 to 59 Minutes | 1,401 | 3.1% |
| 60 to 89 Minutes | 1,339 | 3.0% |
| 90 or more Minutes | 683 | 1.5% |
Commute Time by Sex in Chico
The most common commute times in Chico are 10 to 14 minutes (6,143 commuters, 26.6%) for males and 10 to 14 minutes (6,459 commuters, 29.4%) for females.
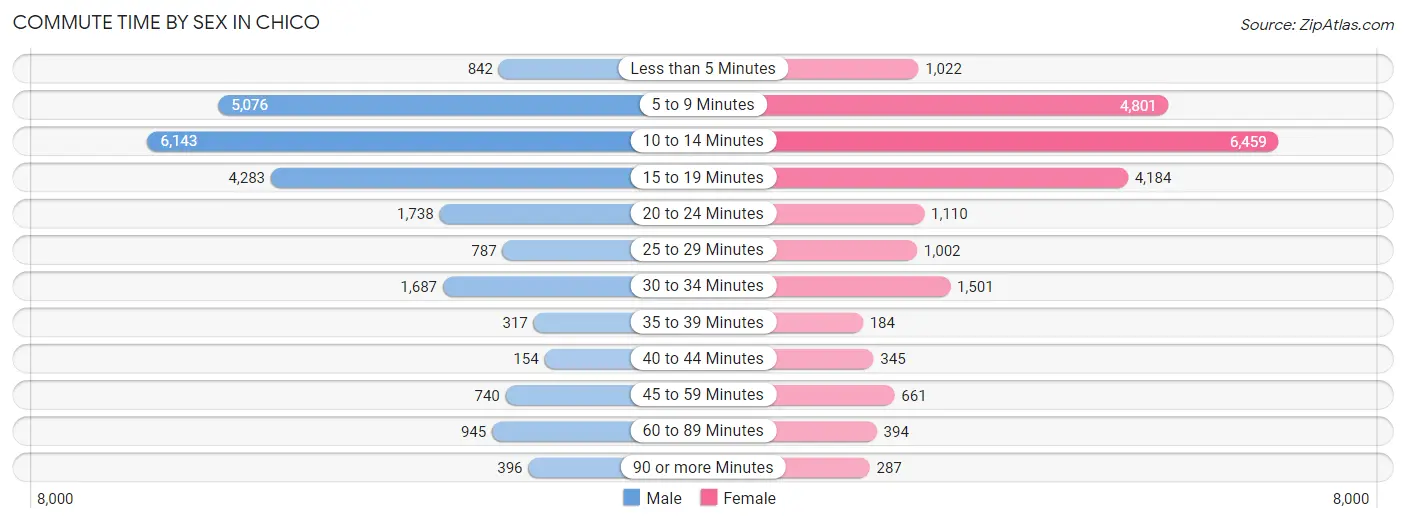
| Commute Time | Male | Female |
| Less than 5 Minutes | 842 (3.6%) | 1,022 (4.7%) |
| 5 to 9 Minutes | 5,076 (22.0%) | 4,801 (21.9%) |
| 10 to 14 Minutes | 6,143 (26.6%) | 6,459 (29.4%) |
| 15 to 19 Minutes | 4,283 (18.5%) | 4,184 (19.1%) |
| 20 to 24 Minutes | 1,738 (7.5%) | 1,110 (5.1%) |
| 25 to 29 Minutes | 787 (3.4%) | 1,002 (4.6%) |
| 30 to 34 Minutes | 1,687 (7.3%) | 1,501 (6.8%) |
| 35 to 39 Minutes | 317 (1.4%) | 184 (0.8%) |
| 40 to 44 Minutes | 154 (0.7%) | 345 (1.6%) |
| 45 to 59 Minutes | 740 (3.2%) | 661 (3.0%) |
| 60 to 89 Minutes | 945 (4.1%) | 394 (1.8%) |
| 90 or more Minutes | 396 (1.7%) | 287 (1.3%) |
Time of Departure to Work by Sex in Chico
The most frequent times of departure to work in Chico are 7:30 AM to 7:59 AM (3,167, 13.7%) for males and 7:30 AM to 7:59 AM (4,050, 18.4%) for females.
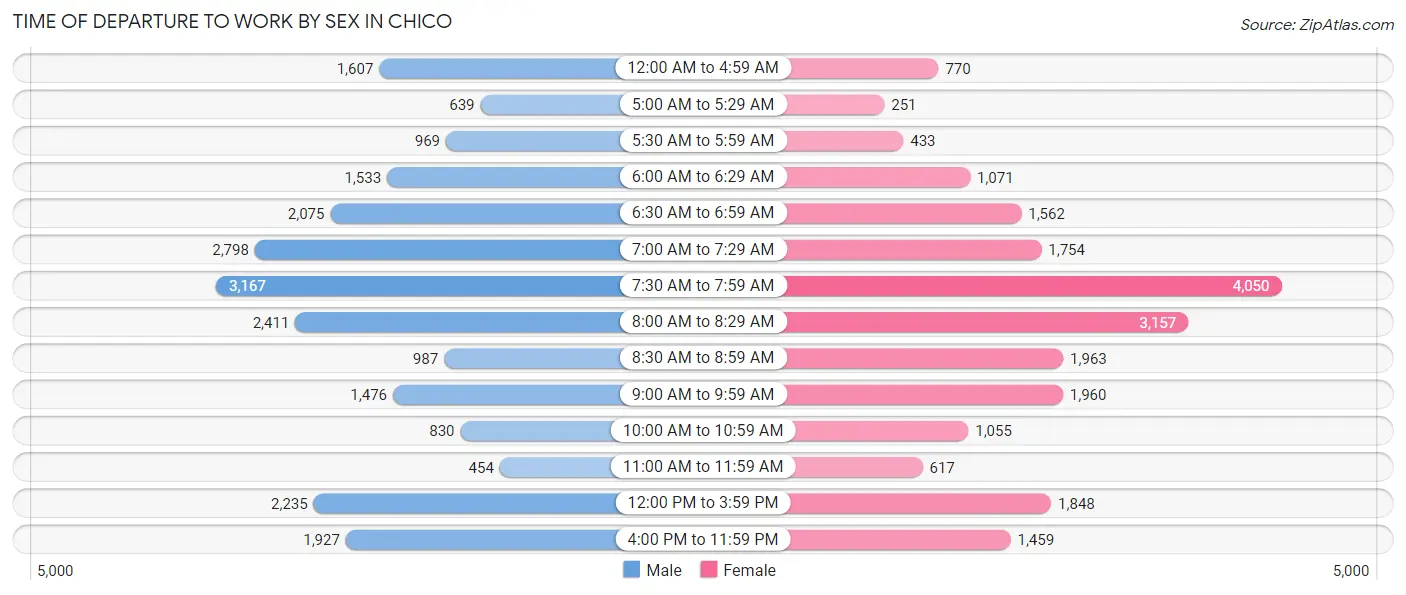
| Time of Departure | Male | Female |
| 12:00 AM to 4:59 AM | 1,607 (7.0%) | 770 (3.5%) |
| 5:00 AM to 5:29 AM | 639 (2.8%) | 251 (1.1%) |
| 5:30 AM to 5:59 AM | 969 (4.2%) | 433 (2.0%) |
| 6:00 AM to 6:29 AM | 1,533 (6.6%) | 1,071 (4.9%) |
| 6:30 AM to 6:59 AM | 2,075 (9.0%) | 1,562 (7.1%) |
| 7:00 AM to 7:29 AM | 2,798 (12.1%) | 1,754 (8.0%) |
| 7:30 AM to 7:59 AM | 3,167 (13.7%) | 4,050 (18.4%) |
| 8:00 AM to 8:29 AM | 2,411 (10.4%) | 3,157 (14.4%) |
| 8:30 AM to 8:59 AM | 987 (4.3%) | 1,963 (8.9%) |
| 9:00 AM to 9:59 AM | 1,476 (6.4%) | 1,960 (8.9%) |
| 10:00 AM to 10:59 AM | 830 (3.6%) | 1,055 (4.8%) |
| 11:00 AM to 11:59 AM | 454 (2.0%) | 617 (2.8%) |
| 12:00 PM to 3:59 PM | 2,235 (9.7%) | 1,848 (8.4%) |
| 4:00 PM to 11:59 PM | 1,927 (8.3%) | 1,459 (6.7%) |
| Total | 23,108 (100.0%) | 21,950 (100.0%) |
Housing Occupancy in Chico
Occupancy by Ownership in Chico
Of the total 41,454 dwellings in Chico, owner-occupied units account for 18,298 (44.1%), while renter-occupied units make up 23,156 (55.9%).
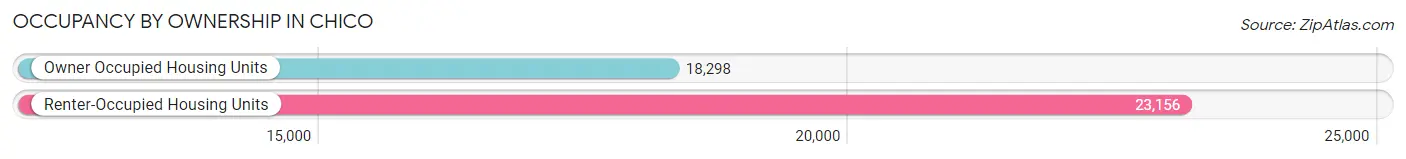
| Occupancy | # Housing Units | % Housing Units |
| Owner Occupied Housing Units | 18,298 | 44.1% |
| Renter-Occupied Housing Units | 23,156 | 55.9% |
| Total Occupied Housing Units | 41,454 | 100.0% |
Occupancy by Household Size in Chico
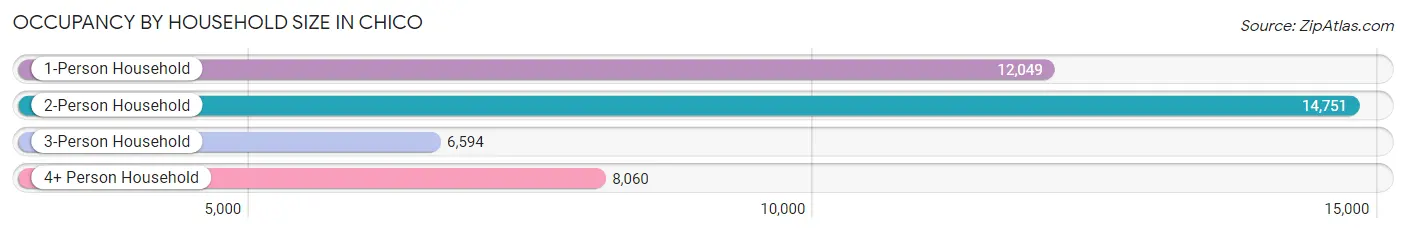
| Household Size | # Housing Units | % Housing Units |
| 1-Person Household | 12,049 | 29.1% |
| 2-Person Household | 14,751 | 35.6% |
| 3-Person Household | 6,594 | 15.9% |
| 4+ Person Household | 8,060 | 19.4% |
| Total Housing Units | 41,454 | 100.0% |
Occupancy by Ownership by Household Size in Chico
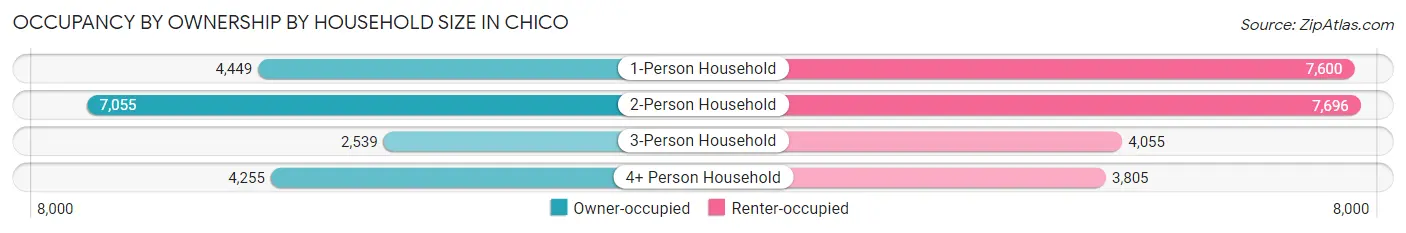
| Household Size | Owner-occupied | Renter-occupied |
| 1-Person Household | 4,449 (36.9%) | 7,600 (63.1%) |
| 2-Person Household | 7,055 (47.8%) | 7,696 (52.2%) |
| 3-Person Household | 2,539 (38.5%) | 4,055 (61.5%) |
| 4+ Person Household | 4,255 (52.8%) | 3,805 (47.2%) |
| Total Housing Units | 18,298 (44.1%) | 23,156 (55.9%) |
Occupancy by Educational Attainment in Chico
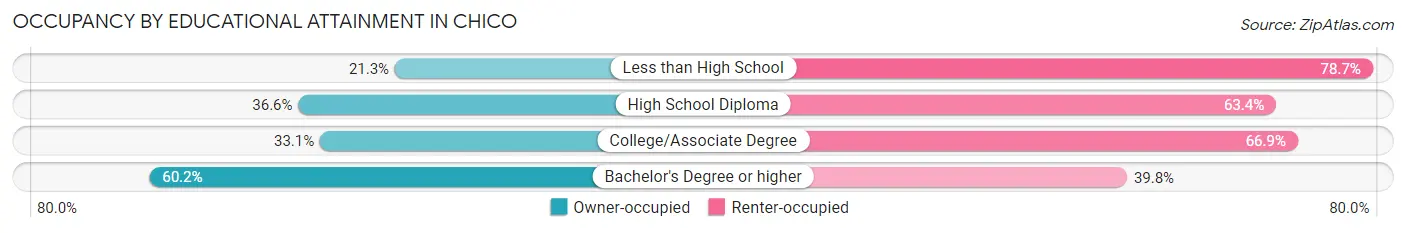
| Household Size | Owner-occupied | Renter-occupied |
| Less than High School | 389 (21.3%) | 1,441 (78.7%) |
| High School Diploma | 2,008 (36.6%) | 3,481 (63.4%) |
| College/Associate Degree | 5,696 (33.1%) | 11,494 (66.9%) |
| Bachelor's Degree or higher | 10,205 (60.2%) | 6,740 (39.8%) |
Occupancy by Age of Householder in Chico
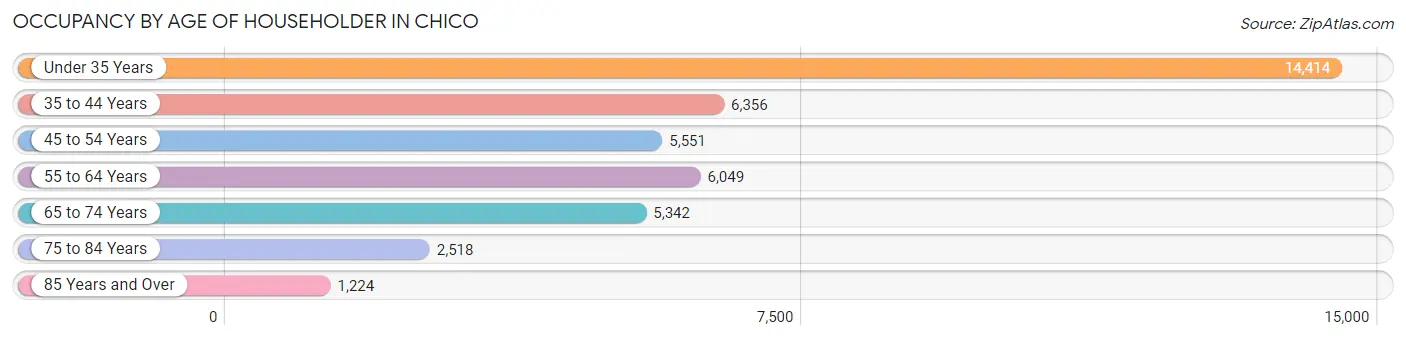
| Age Bracket | # Households | % Households |
| Under 35 Years | 14,414 | 34.8% |
| 35 to 44 Years | 6,356 | 15.3% |
| 45 to 54 Years | 5,551 | 13.4% |
| 55 to 64 Years | 6,049 | 14.6% |
| 65 to 74 Years | 5,342 | 12.9% |
| 75 to 84 Years | 2,518 | 6.1% |
| 85 Years and Over | 1,224 | 2.9% |
| Total | 41,454 | 100.0% |
Housing Finances in Chico
Median Income by Occupancy in Chico
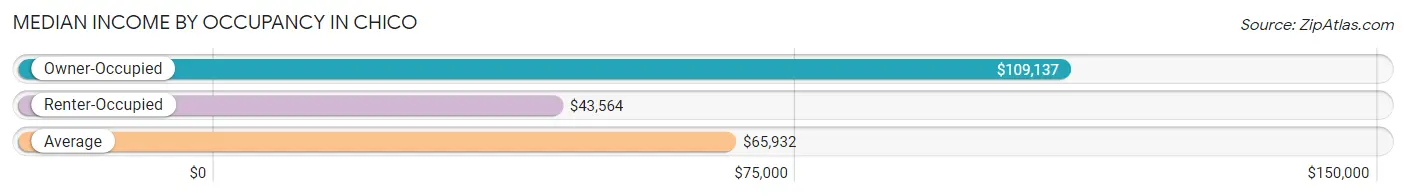
| Occupancy Type | # Households | Median Income |
| Owner-Occupied | 18,298 (44.1%) | $109,137 |
| Renter-Occupied | 23,156 (55.9%) | $43,564 |
| Average | 41,454 (100.0%) | $65,932 |
Occupancy by Householder Income Bracket in Chico
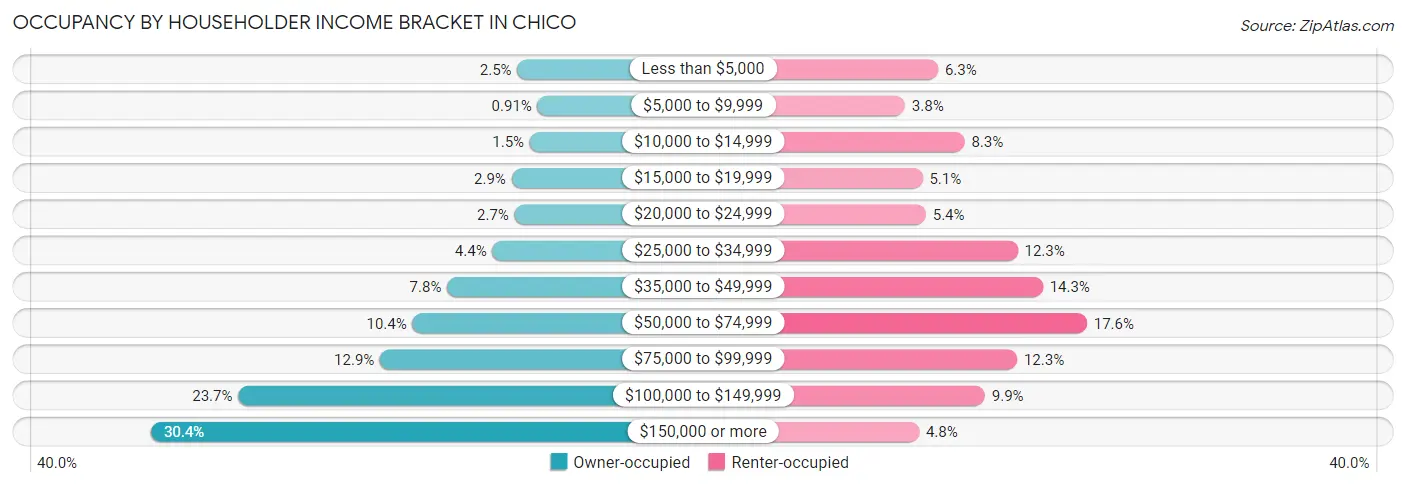
| Income Bracket | Owner-occupied | Renter-occupied |
| Less than $5,000 | 448 (2.5%) | 1,455 (6.3%) |
| $5,000 to $9,999 | 166 (0.9%) | 871 (3.8%) |
| $10,000 to $14,999 | 275 (1.5%) | 1,922 (8.3%) |
| $15,000 to $19,999 | 529 (2.9%) | 1,181 (5.1%) |
| $20,000 to $24,999 | 487 (2.7%) | 1,240 (5.3%) |
| $25,000 to $34,999 | 796 (4.3%) | 2,858 (12.3%) |
| $35,000 to $49,999 | 1,427 (7.8%) | 3,301 (14.3%) |
| $50,000 to $74,999 | 1,911 (10.4%) | 4,079 (17.6%) |
| $75,000 to $99,999 | 2,362 (12.9%) | 2,848 (12.3%) |
| $100,000 to $149,999 | 4,340 (23.7%) | 2,282 (9.9%) |
| $150,000 or more | 5,557 (30.4%) | 1,119 (4.8%) |
| Total | 18,298 (100.0%) | 23,156 (100.0%) |
Monthly Housing Cost Tiers in Chico
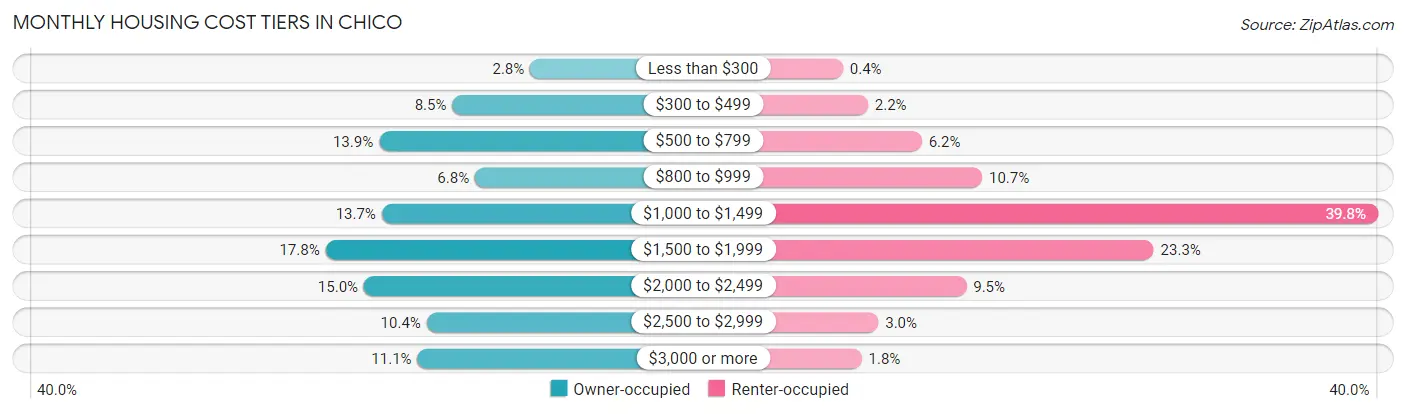
| Monthly Cost | Owner-occupied | Renter-occupied |
| Less than $300 | 506 (2.8%) | 92 (0.4%) |
| $300 to $499 | 1,556 (8.5%) | 518 (2.2%) |
| $500 to $799 | 2,543 (13.9%) | 1,438 (6.2%) |
| $800 to $999 | 1,249 (6.8%) | 2,467 (10.6%) |
| $1,000 to $1,499 | 2,506 (13.7%) | 9,213 (39.8%) |
| $1,500 to $1,999 | 3,265 (17.8%) | 5,393 (23.3%) |
| $2,000 to $2,499 | 2,746 (15.0%) | 2,197 (9.5%) |
| $2,500 to $2,999 | 1,902 (10.4%) | 696 (3.0%) |
| $3,000 or more | 2,025 (11.1%) | 412 (1.8%) |
| Total | 18,298 (100.0%) | 23,156 (100.0%) |
Physical Housing Characteristics in Chico
Housing Structures in Chico
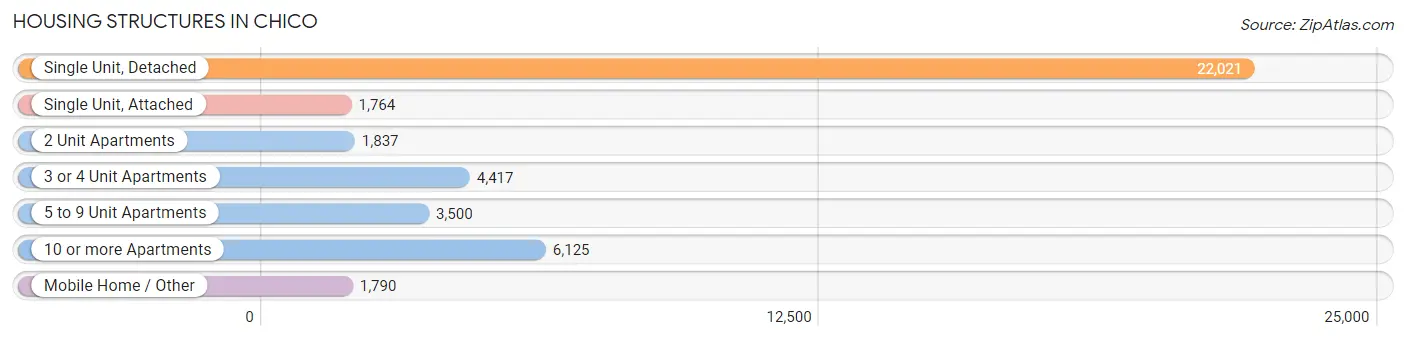
| Structure Type | # Housing Units | % Housing Units |
| Single Unit, Detached | 22,021 | 53.1% |
| Single Unit, Attached | 1,764 | 4.3% |
| 2 Unit Apartments | 1,837 | 4.4% |
| 3 or 4 Unit Apartments | 4,417 | 10.7% |
| 5 to 9 Unit Apartments | 3,500 | 8.4% |
| 10 or more Apartments | 6,125 | 14.8% |
| Mobile Home / Other | 1,790 | 4.3% |
| Total | 41,454 | 100.0% |
Housing Structures by Occupancy in Chico
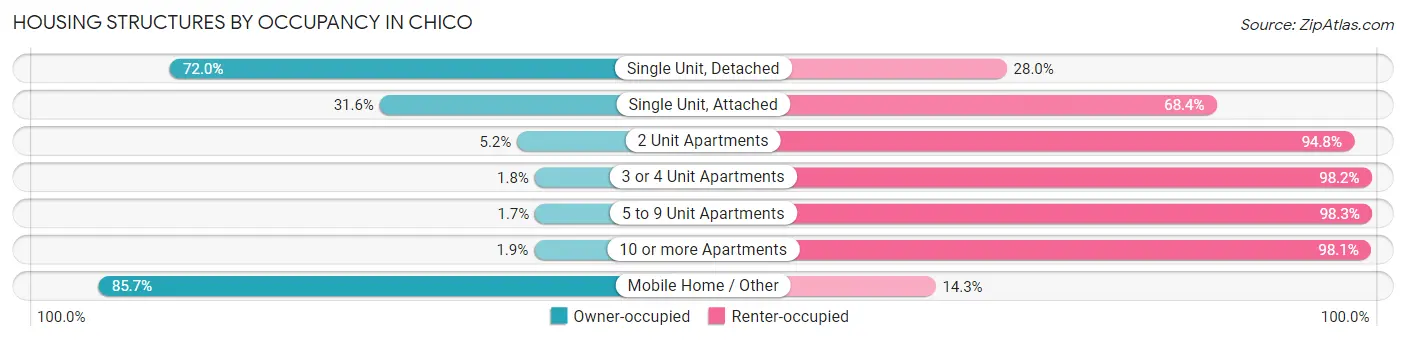
| Structure Type | Owner-occupied | Renter-occupied |
| Single Unit, Detached | 15,855 (72.0%) | 6,166 (28.0%) |
| Single Unit, Attached | 558 (31.6%) | 1,206 (68.4%) |
| 2 Unit Apartments | 95 (5.2%) | 1,742 (94.8%) |
| 3 or 4 Unit Apartments | 79 (1.8%) | 4,338 (98.2%) |
| 5 to 9 Unit Apartments | 60 (1.7%) | 3,440 (98.3%) |
| 10 or more Apartments | 117 (1.9%) | 6,008 (98.1%) |
| Mobile Home / Other | 1,534 (85.7%) | 256 (14.3%) |
| Total | 18,298 (44.1%) | 23,156 (55.9%) |
Housing Structures by Number of Rooms in Chico
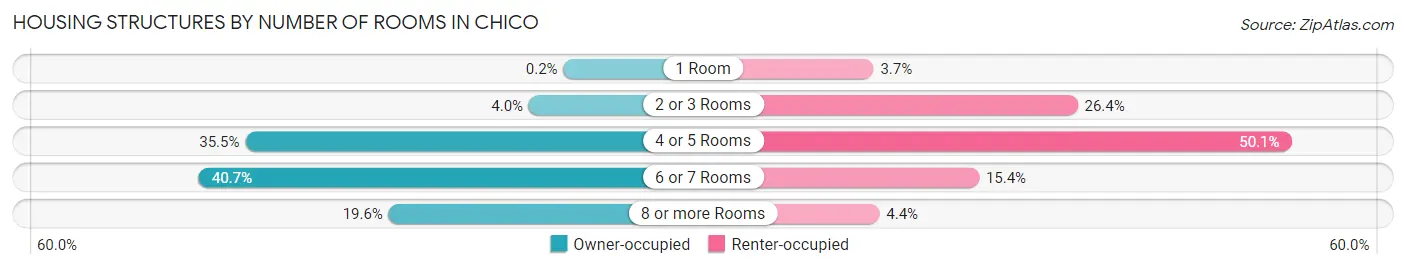
| Number of Rooms | Owner-occupied | Renter-occupied |
| 1 Room | 37 (0.2%) | 861 (3.7%) |
| 2 or 3 Rooms | 738 (4.0%) | 6,106 (26.4%) |
| 4 or 5 Rooms | 6,498 (35.5%) | 11,602 (50.1%) |
| 6 or 7 Rooms | 7,440 (40.7%) | 3,572 (15.4%) |
| 8 or more Rooms | 3,585 (19.6%) | 1,015 (4.4%) |
| Total | 18,298 (100.0%) | 23,156 (100.0%) |
Housing Structure by Heating Type in Chico
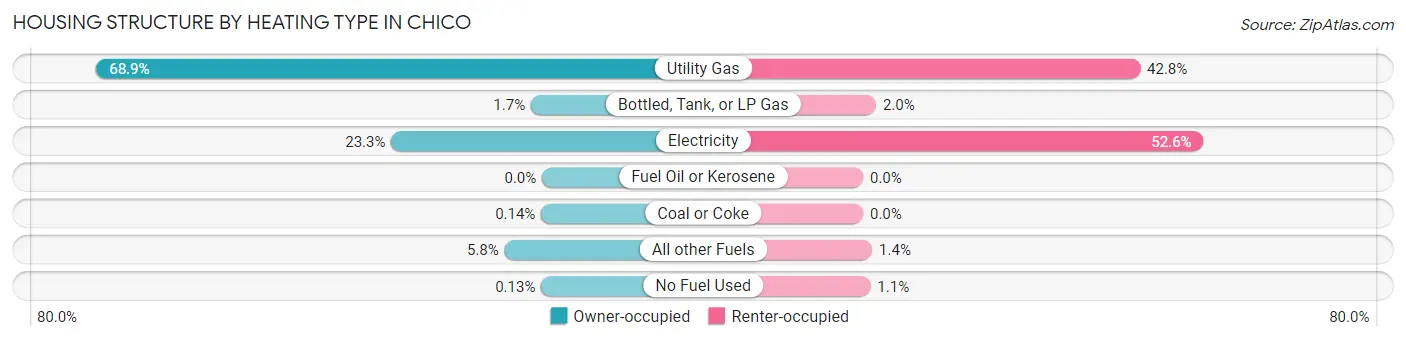
| Heating Type | Owner-occupied | Renter-occupied |
| Utility Gas | 12,609 (68.9%) | 9,918 (42.8%) |
| Bottled, Tank, or LP Gas | 314 (1.7%) | 466 (2.0%) |
| Electricity | 4,265 (23.3%) | 12,182 (52.6%) |
| Fuel Oil or Kerosene | 0 (0.0%) | 0 (0.0%) |
| Coal or Coke | 25 (0.1%) | 0 (0.0%) |
| All other Fuels | 1,061 (5.8%) | 327 (1.4%) |
| No Fuel Used | 24 (0.1%) | 263 (1.1%) |
| Total | 18,298 (100.0%) | 23,156 (100.0%) |
Household Vehicle Usage in Chico
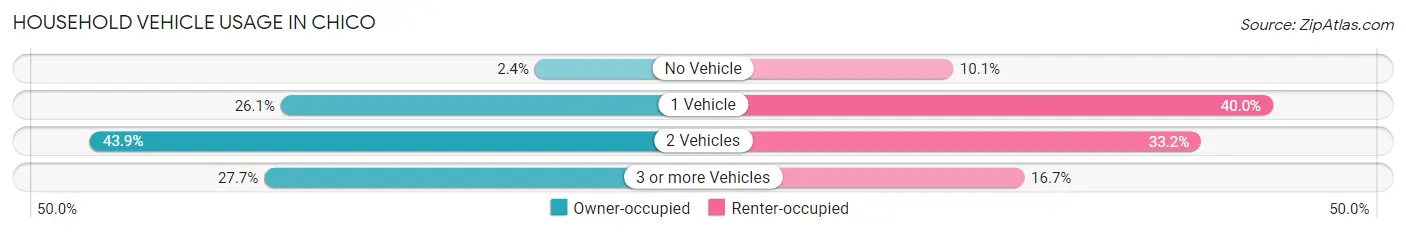
| Vehicles per Household | Owner-occupied | Renter-occupied |
| No Vehicle | 433 (2.4%) | 2,333 (10.1%) |
| 1 Vehicle | 4,774 (26.1%) | 9,251 (40.0%) |
| 2 Vehicles | 8,031 (43.9%) | 7,697 (33.2%) |
| 3 or more Vehicles | 5,060 (27.7%) | 3,875 (16.7%) |
| Total | 18,298 (100.0%) | 23,156 (100.0%) |
Real Estate & Mortgages in Chico
Real Estate and Mortgage Overview in Chico
| Characteristic | Without Mortgage | With Mortgage |
| Housing Units | 6,203 | 12,095 |
| Median Property Value | $372,100 | $444,700 |
| Median Household Income | $75,313 | $4,361 |
| Monthly Housing Costs | $620 | $2,025 |
| Real Estate Taxes | $2,253 | $240 |
Property Value by Mortgage Status in Chico
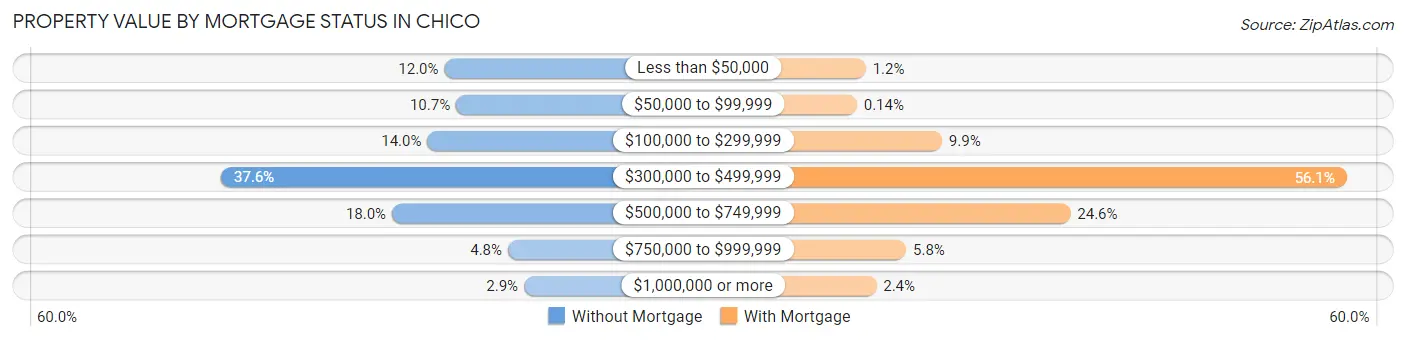
| Property Value | Without Mortgage | With Mortgage |
| Less than $50,000 | 746 (12.0%) | 140 (1.2%) |
| $50,000 to $99,999 | 664 (10.7%) | 17 (0.1%) |
| $100,000 to $299,999 | 867 (14.0%) | 1,194 (9.9%) |
| $300,000 to $499,999 | 2,330 (37.6%) | 6,789 (56.1%) |
| $500,000 to $749,999 | 1,118 (18.0%) | 2,969 (24.5%) |
| $750,000 to $999,999 | 296 (4.8%) | 699 (5.8%) |
| $1,000,000 or more | 182 (2.9%) | 287 (2.4%) |
| Total | 6,203 (100.0%) | 12,095 (100.0%) |
Household Income by Mortgage Status in Chico
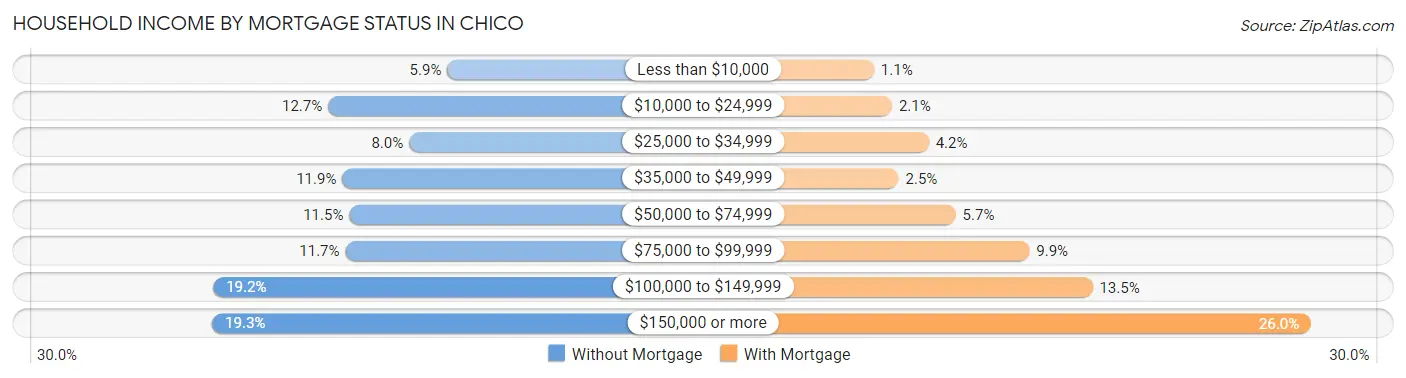
| Household Income | Without Mortgage | With Mortgage |
| Less than $10,000 | 363 (5.9%) | 127 (1.1%) |
| $10,000 to $24,999 | 785 (12.7%) | 251 (2.1%) |
| $25,000 to $34,999 | 498 (8.0%) | 506 (4.2%) |
| $35,000 to $49,999 | 735 (11.8%) | 298 (2.5%) |
| $50,000 to $74,999 | 710 (11.5%) | 692 (5.7%) |
| $75,000 to $99,999 | 724 (11.7%) | 1,201 (9.9%) |
| $100,000 to $149,999 | 1,192 (19.2%) | 1,638 (13.5%) |
| $150,000 or more | 1,196 (19.3%) | 3,148 (26.0%) |
| Total | 6,203 (100.0%) | 12,095 (100.0%) |
Property Value to Household Income Ratio in Chico
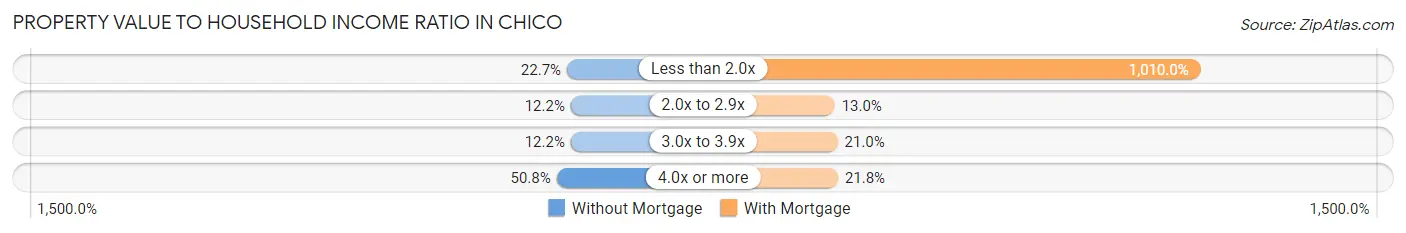
| Value-to-Income Ratio | Without Mortgage | With Mortgage |
| Less than 2.0x | 1,407 (22.7%) | 122,158 (1,010.0%) |
| 2.0x to 2.9x | 757 (12.2%) | 1,573 (13.0%) |
| 3.0x to 3.9x | 757 (12.2%) | 2,538 (21.0%) |
| 4.0x or more | 3,152 (50.8%) | 2,640 (21.8%) |
| Total | 6,203 (100.0%) | 12,095 (100.0%) |
Real Estate Taxes by Mortgage Status in Chico
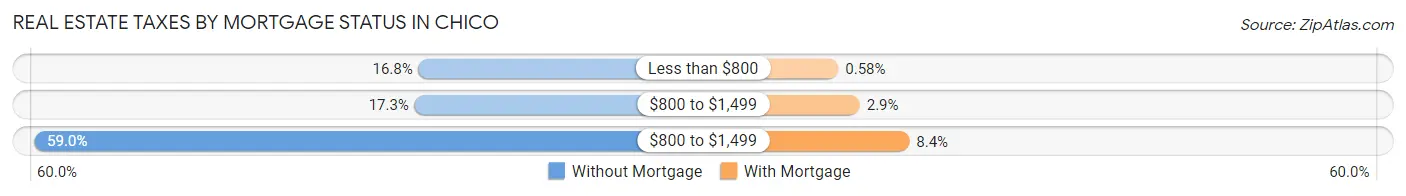
| Property Taxes | Without Mortgage | With Mortgage |
| Less than $800 | 1,044 (16.8%) | 70 (0.6%) |
| $800 to $1,499 | 1,070 (17.2%) | 354 (2.9%) |
| $800 to $1,499 | 3,657 (59.0%) | 1,011 (8.4%) |
| Total | 6,203 (100.0%) | 12,095 (100.0%) |
Health & Disability in Chico
Health Insurance Coverage by Age in Chico
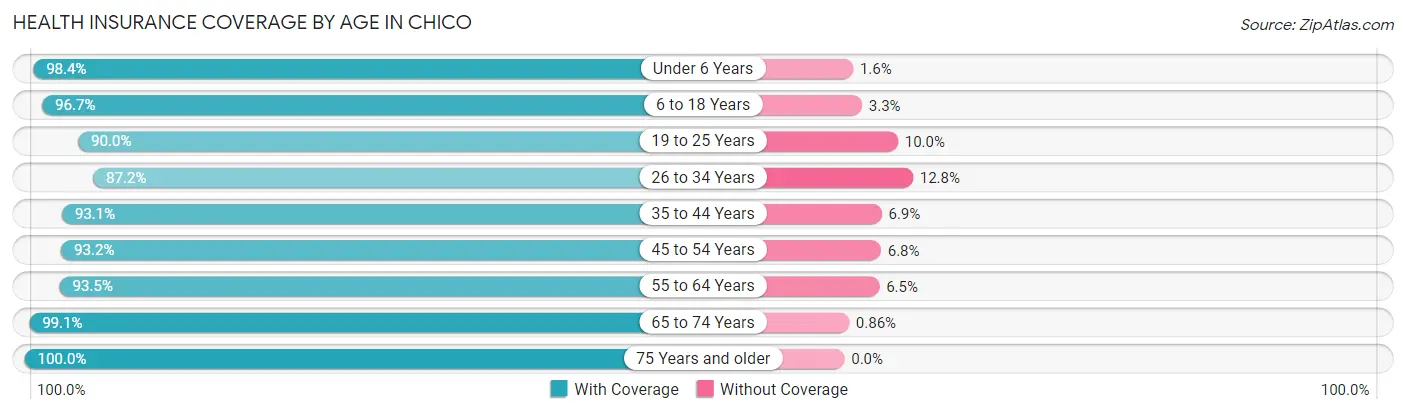
| Age Bracket | With Coverage | Without Coverage |
| Under 6 Years | 5,674 (98.4%) | 93 (1.6%) |
| 6 to 18 Years | 15,394 (96.7%) | 522 (3.3%) |
| 19 to 25 Years | 19,654 (90.0%) | 2,176 (10.0%) |
| 26 to 34 Years | 12,067 (87.2%) | 1,767 (12.8%) |
| 35 to 44 Years | 11,436 (93.1%) | 853 (6.9%) |
| 45 to 54 Years | 9,033 (93.2%) | 660 (6.8%) |
| 55 to 64 Years | 8,720 (93.5%) | 607 (6.5%) |
| 65 to 74 Years | 7,961 (99.1%) | 69 (0.9%) |
| 75 Years and older | 5,368 (100.0%) | 0 (0.0%) |
| Total | 95,307 (93.4%) | 6,747 (6.6%) |
Health Insurance Coverage by Citizenship Status in Chico

| Citizenship Status | With Coverage | Without Coverage |
| Native Born | 5,674 (98.4%) | 93 (1.6%) |
| Foreign Born, Citizen | 15,394 (96.7%) | 522 (3.3%) |
| Foreign Born, not a Citizen | 19,654 (90.0%) | 2,176 (10.0%) |
Health Insurance Coverage by Household Income in Chico
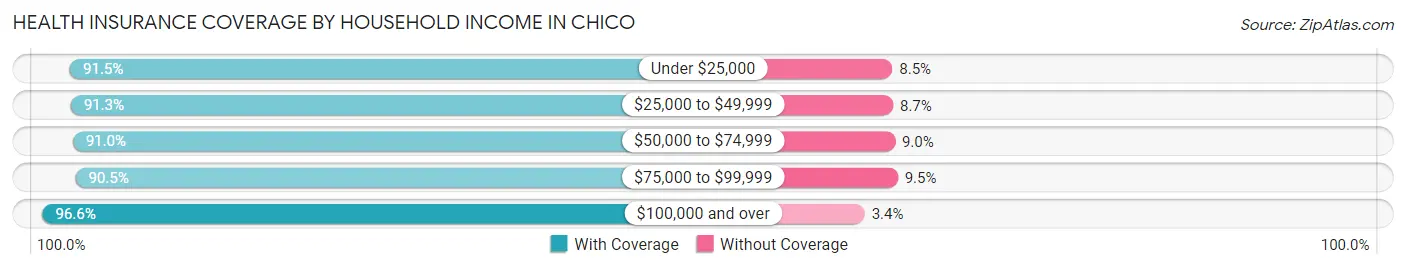
| Household Income | With Coverage | Without Coverage |
| Under $25,000 | 13,772 (91.5%) | 1,285 (8.5%) |
| $25,000 to $49,999 | 15,432 (91.3%) | 1,463 (8.7%) |
| $50,000 to $74,999 | 12,797 (91.0%) | 1,269 (9.0%) |
| $75,000 to $99,999 | 12,182 (90.5%) | 1,284 (9.5%) |
| $100,000 and over | 38,096 (96.6%) | 1,323 (3.4%) |
Public vs Private Health Insurance Coverage by Age in Chico
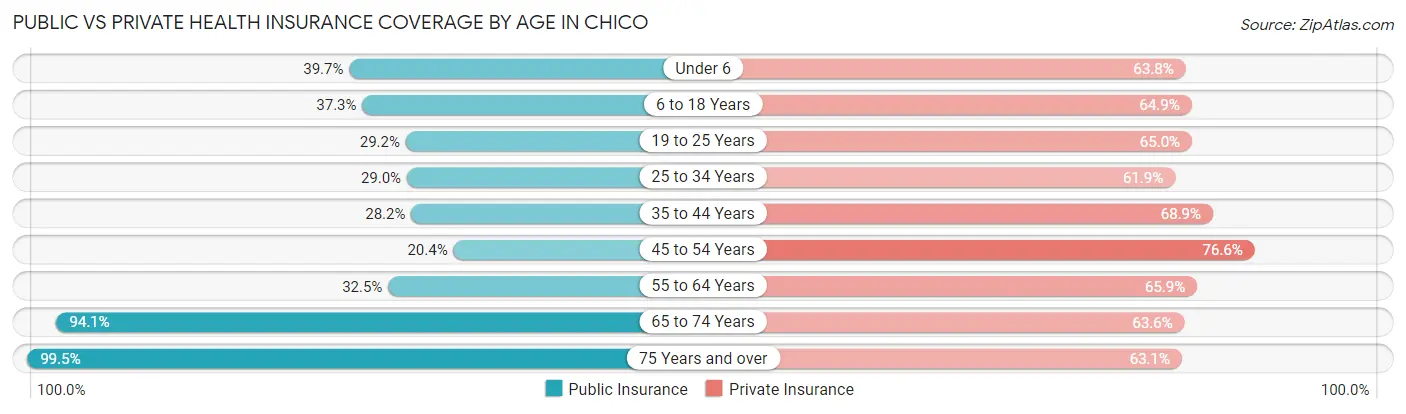
| Age Bracket | Public Insurance | Private Insurance |
| Under 6 | 2,291 (39.7%) | 3,680 (63.8%) |
| 6 to 18 Years | 5,938 (37.3%) | 10,331 (64.9%) |
| 19 to 25 Years | 6,384 (29.2%) | 14,186 (65.0%) |
| 25 to 34 Years | 4,016 (29.0%) | 8,556 (61.9%) |
| 35 to 44 Years | 3,469 (28.2%) | 8,464 (68.9%) |
| 45 to 54 Years | 1,976 (20.4%) | 7,428 (76.6%) |
| 55 to 64 Years | 3,032 (32.5%) | 6,150 (65.9%) |
| 65 to 74 Years | 7,556 (94.1%) | 5,108 (63.6%) |
| 75 Years and over | 5,341 (99.5%) | 3,387 (63.1%) |
| Total | 40,003 (39.2%) | 67,290 (65.9%) |
Disability Status by Sex by Age in Chico
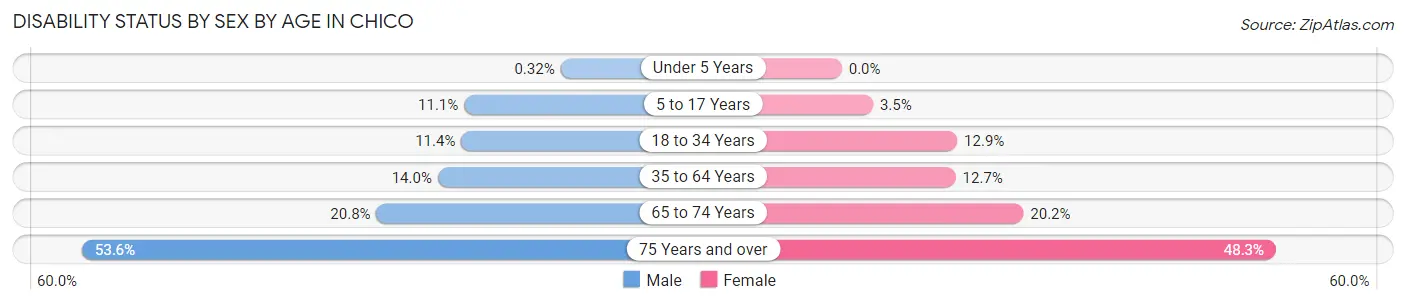
| Age Bracket | Male | Female |
| Under 5 Years | 8 (0.3%) | 0 (0.0%) |
| 5 to 17 Years | 832 (11.1%) | 237 (3.5%) |
| 18 to 34 Years | 2,165 (11.4%) | 2,457 (12.9%) |
| 35 to 64 Years | 2,163 (14.0%) | 2,010 (12.7%) |
| 65 to 74 Years | 746 (20.8%) | 899 (20.2%) |
| 75 Years and over | 1,118 (53.6%) | 1,587 (48.3%) |
Disability Class by Sex by Age in Chico
Disability Class: Hearing Difficulty
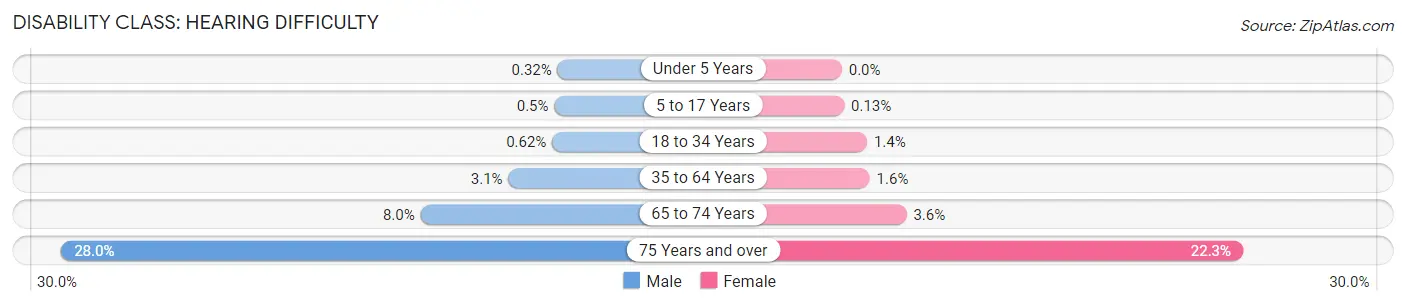
| Age Bracket | Male | Female |
| Under 5 Years | 8 (0.3%) | 0 (0.0%) |
| 5 to 17 Years | 38 (0.5%) | 9 (0.1%) |
| 18 to 34 Years | 119 (0.6%) | 267 (1.4%) |
| 35 to 64 Years | 473 (3.1%) | 245 (1.5%) |
| 65 to 74 Years | 285 (8.0%) | 160 (3.6%) |
| 75 Years and over | 583 (28.0%) | 733 (22.3%) |
Disability Class: Vision Difficulty
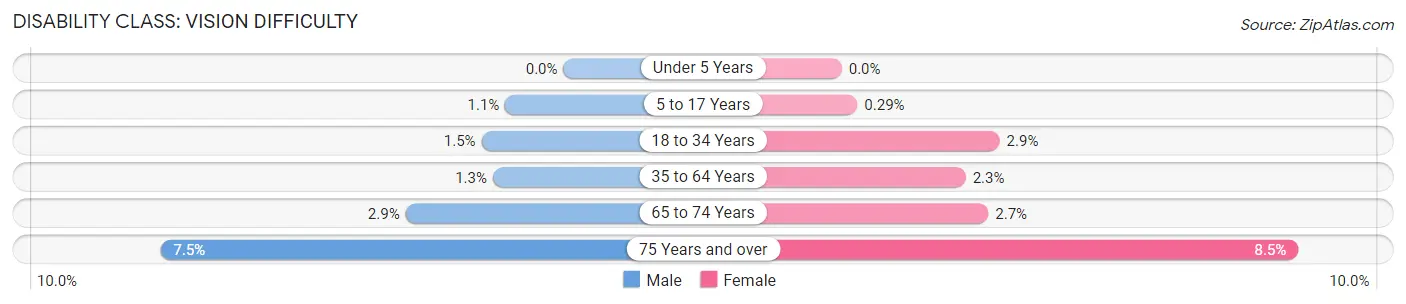
| Age Bracket | Male | Female |
| Under 5 Years | 0 (0.0%) | 0 (0.0%) |
| 5 to 17 Years | 81 (1.1%) | 20 (0.3%) |
| 18 to 34 Years | 289 (1.5%) | 560 (2.9%) |
| 35 to 64 Years | 202 (1.3%) | 365 (2.3%) |
| 65 to 74 Years | 105 (2.9%) | 121 (2.7%) |
| 75 Years and over | 156 (7.5%) | 278 (8.5%) |
Disability Class: Cognitive Difficulty
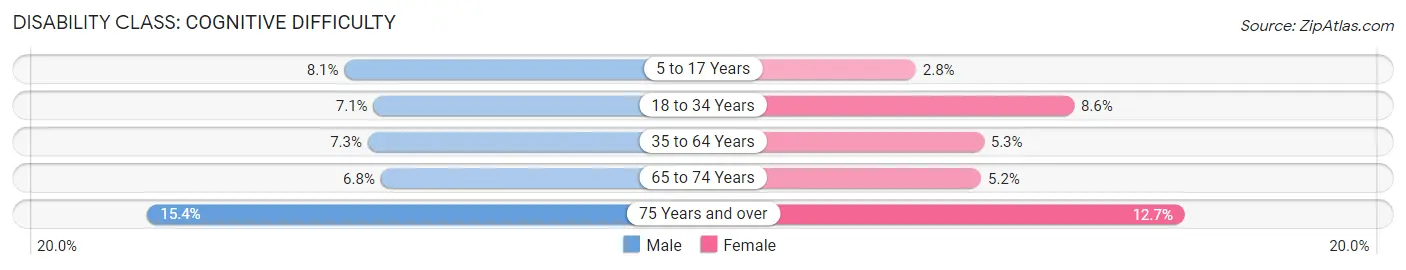
| Age Bracket | Male | Female |
| 5 to 17 Years | 612 (8.1%) | 188 (2.8%) |
| 18 to 34 Years | 1,343 (7.0%) | 1,648 (8.6%) |
| 35 to 64 Years | 1,122 (7.3%) | 835 (5.3%) |
| 65 to 74 Years | 243 (6.8%) | 230 (5.2%) |
| 75 Years and over | 322 (15.4%) | 418 (12.7%) |
Disability Class: Ambulatory Difficulty
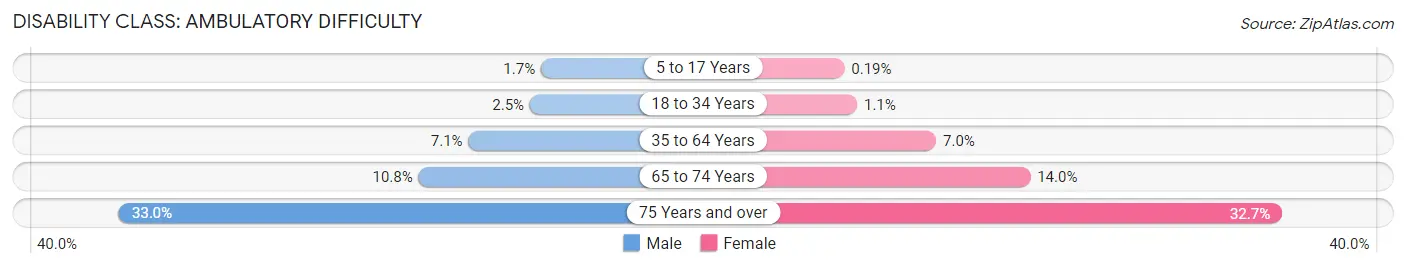
| Age Bracket | Male | Female |
| 5 to 17 Years | 125 (1.7%) | 13 (0.2%) |
| 18 to 34 Years | 473 (2.5%) | 216 (1.1%) |
| 35 to 64 Years | 1,090 (7.0%) | 1,109 (7.0%) |
| 65 to 74 Years | 385 (10.7%) | 622 (14.0%) |
| 75 Years and over | 688 (33.0%) | 1,073 (32.7%) |
Disability Class: Self-Care Difficulty
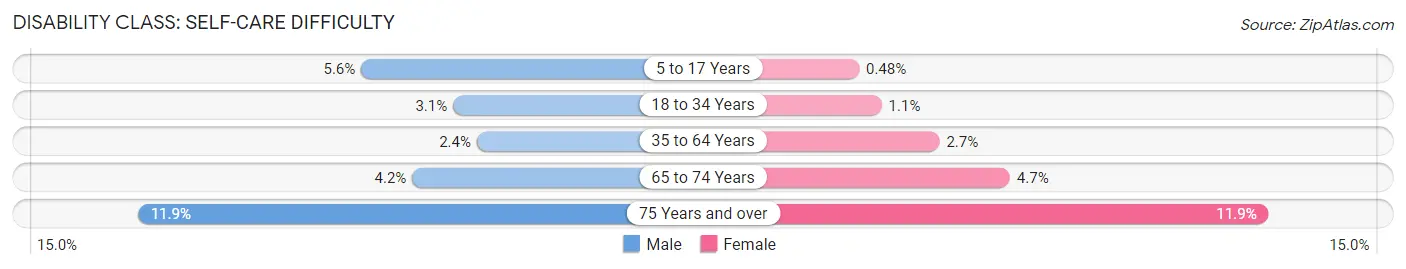
| Age Bracket | Male | Female |
| 5 to 17 Years | 424 (5.6%) | 33 (0.5%) |
| 18 to 34 Years | 585 (3.1%) | 213 (1.1%) |
| 35 to 64 Years | 372 (2.4%) | 431 (2.7%) |
| 65 to 74 Years | 151 (4.2%) | 208 (4.7%) |
| 75 Years and over | 247 (11.8%) | 390 (11.9%) |
Technology Access in Chico
Computing Device Access in Chico
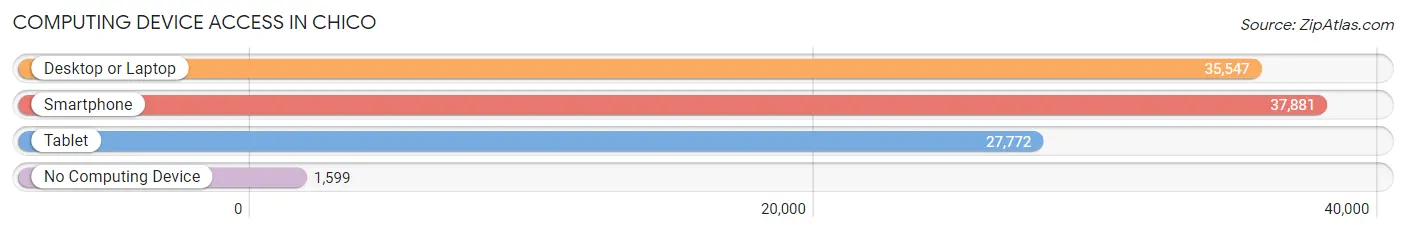
| Device Type | # Households | % Households |
| Desktop or Laptop | 35,547 | 85.8% |
| Smartphone | 37,881 | 91.4% |
| Tablet | 27,772 | 67.0% |
| No Computing Device | 1,599 | 3.9% |
| Total | 41,454 | 100.0% |
Internet Access in Chico
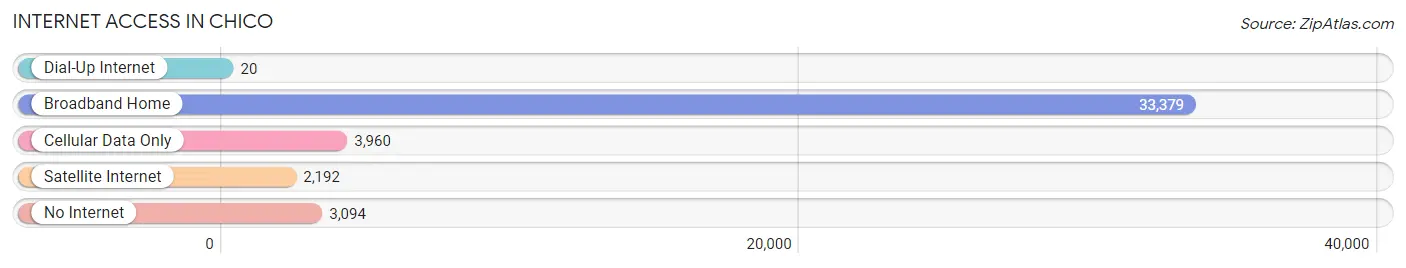
| Internet Type | # Households | % Households |
| Dial-Up Internet | 20 | 0.1% |
| Broadband Home | 33,379 | 80.5% |
| Cellular Data Only | 3,960 | 9.6% |
| Satellite Internet | 2,192 | 5.3% |
| No Internet | 3,094 | 7.5% |
| Total | 41,454 | 100.0% |
Chico Summary
Chico, California is a city located in Butte County, California, United States. It is situated in the northern part of the state, about 90 miles north of Sacramento. The city has a population of approximately 93,000 people, making it the 14th largest city in California.
Geography
Chico is located in the Sacramento Valley, at the foothills of the Sierra Nevada mountain range. The city is situated on the banks of the Sacramento River, and is surrounded by rolling hills and agricultural land. The city is located at an elevation of about 200 feet above sea level. The climate in Chico is generally mild, with hot summers and cool winters.
History
Chico was founded in 1860 by John Bidwell, a pioneer and settler from the east coast. The city was originally named Chico after the Chico tribe of Native Americans who lived in the area. The city grew rapidly in the late 19th century, and by the early 20th century it had become a major agricultural center. The city was also home to a large number of Chinese immigrants, who worked in the local canneries and other industries.
In the late 20th century, Chico experienced a period of rapid growth and development. The city was home to a number of new businesses, and the population increased significantly. In the early 21st century, Chico has become a popular tourist destination, with a vibrant downtown area and a number of cultural attractions.
Economy
Chico’s economy is largely based on agriculture, manufacturing, and services. The city is home to a number of large agricultural companies, including S&W Seed Company, Chico Nut Company, and Chico Foods. The city is also home to a number of manufacturing companies, including Sierra Nevada Brewing Company and Chico Paper Company. The city is also home to a number of service-based businesses, including healthcare, education, and retail.
Demographics
As of the 2010 census, Chico had a population of 93,000 people. The racial makeup of the city was 75.3% White, 2.2% African American, 1.2% Native American, 5.2% Asian, 0.3% Pacific Islander, and 15.8% from other races. The median household income in Chico was $41,000, and the median age was 33.
Conclusion
Chico, California is a vibrant city located in the northern part of the state. The city has a rich history, and has experienced a period of rapid growth and development in the late 20th and early 21st centuries. The city’s economy is largely based on agriculture, manufacturing, and services, and the population is diverse. Chico is a popular tourist destination, and is home to a number of cultural attractions.
Common Questions
What is Per Capita Income in Chico?
Per Capita income in Chico is $36,491.
What is the Median Family Income in Chico?
Median Family Income in Chico is $88,270.
What is the Median Household income in Chico?
Median Household Income in Chico is $65,932.
What is Income or Wage Gap in Chico?
Income or Wage Gap in Chico is 17.3%.
Women in Chico earn 82.7 cents for every dollar earned by a man.
What is Family Income Deficit in Chico?
Family Income Deficit in Chico is $10,216.
Families that are below poverty line in Chico earn $10,216 less on average than the poverty threshold level.
What is Inequality or Gini Index in Chico?
Inequality or Gini Index in Chico is 0.48.
What is the Total Population of Chico?
Total Population of Chico is 102,790.
What is the Total Male Population of Chico?
Total Male Population of Chico is 50,461.
What is the Total Female Population of Chico?
Total Female Population of Chico is 52,329.
What is the Ratio of Males per 100 Females in Chico?
There are 96.43 Males per 100 Females in Chico.
What is the Ratio of Females per 100 Males in Chico?
There are 103.70 Females per 100 Males in Chico.
What is the Median Population Age in Chico?
Median Population Age in Chico is 30.4 Years.
What is the Average Family Size in Chico
Average Family Size in Chico is 3.0 People.
What is the Average Household Size in Chico
Average Household Size in Chico is 2.4 People.
How Large is the Labor Force in Chico?
There are 56,593 People in the Labor Forcein in Chico.
What is the Percentage of People in the Labor Force in Chico?
66.1% of People are in the Labor Force in Chico.
What is the Unemployment Rate in Chico?
Unemployment Rate in Chico is 6.9%.