Claremont, CA Map & Demographics
Claremont Map
Claremont Overview
$53,395
PER CAPITA INCOME
$148,492
AVG FAMILY INCOME
$115,091
AVG HOUSEHOLD INCOME
37.7%
WAGE / INCOME GAP [ % ]
62.3¢/ $1
WAGE / INCOME GAP [ $ ]
$10,806
FAMILY INCOME DEFICIT
0.45
INEQUALITY / GINI INDEX
36,891
TOTAL POPULATION
17,174
MALE POPULATION
19,717
FEMALE POPULATION
87.10
MALES / 100 FEMALES
114.81
FEMALES / 100 MALES
41.5
MEDIAN AGE
3.1
AVG FAMILY SIZE
2.6
AVG HOUSEHOLD SIZE
18,389
LABOR FORCE [ PEOPLE ]
58.3%
PERCENT IN LABOR FORCE
5.6%
UNEMPLOYMENT RATE
Claremont Zip Codes
Claremont Area Codes
Income in Claremont
Income Overview in Claremont
Per Capita Income in Claremont is $53,395, while median incomes of families and households are $148,492 and $115,091 respectively.
| Characteristic | Number | Measure |
| Per Capita Income | 36,891 | $53,395 |
| Median Family Income | 8,951 | $148,492 |
| Mean Family Income | 8,951 | $178,746 |
| Median Household Income | 12,603 | $115,091 |
| Mean Household Income | 12,603 | $152,720 |
| Income Deficit | 8,951 | $10,806 |
| Wage / Income Gap (%) | 36,891 | 37.68% |
| Wage / Income Gap ($) | 36,891 | 62.32¢ per $1 |
| Gini / Inequality Index | 36,891 | 0.45 |
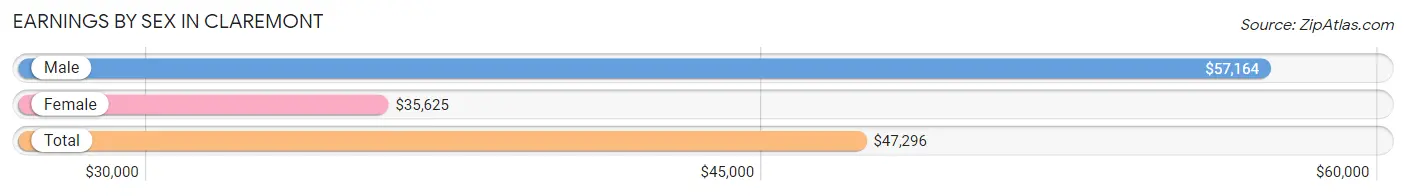
Earnings by Sex in Claremont
Average Earnings in Claremont are $47,296, $57,164 for men and $35,625 for women, a difference of 37.7%.
| Sex | Number | Average Earnings |
| Male | 10,225 (50.8%) | $57,164 |
| Female | 9,891 (49.2%) | $35,625 |
| Total | 20,116 (100.0%) | $47,296 |
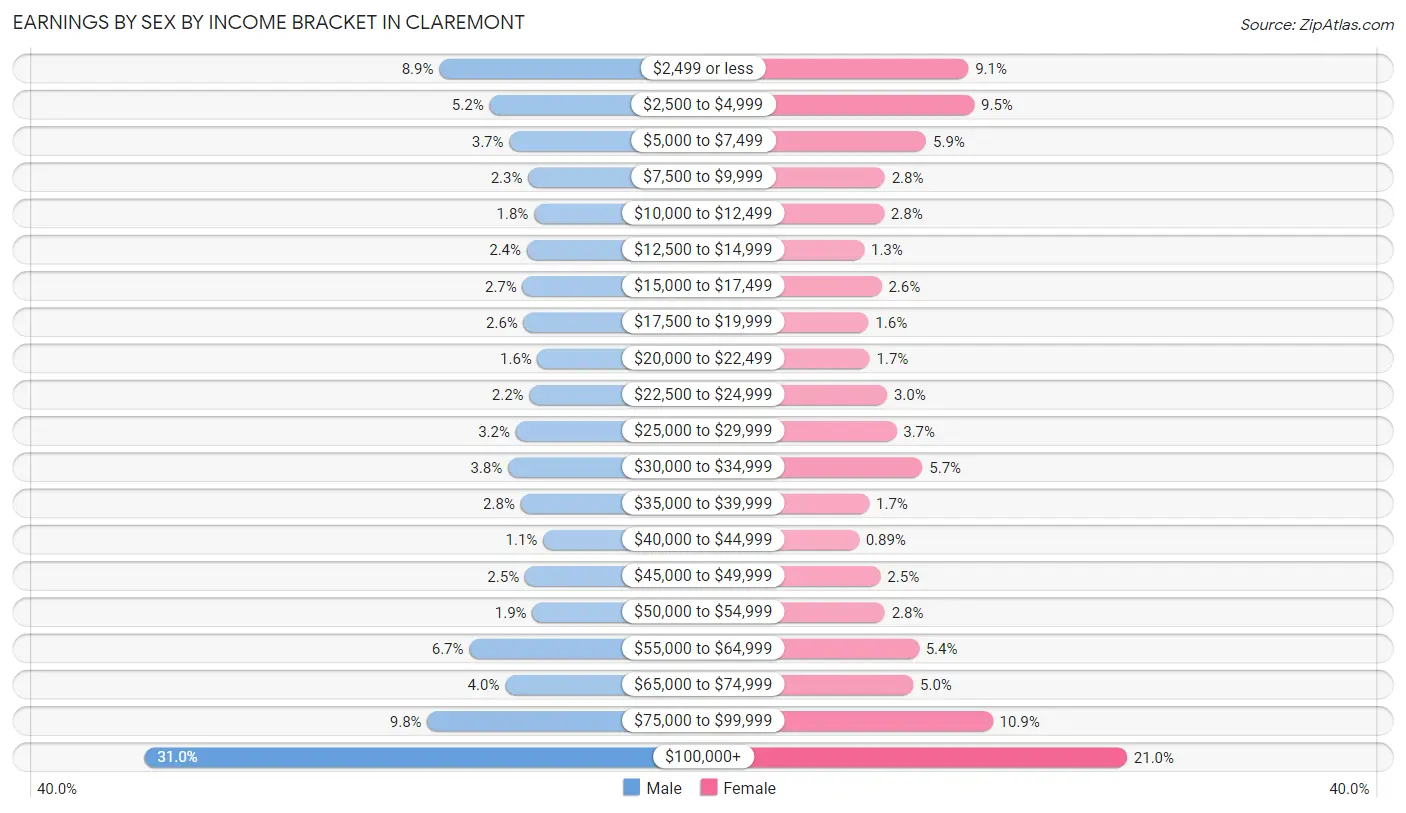
Earnings by Sex by Income Bracket in Claremont
The most common earnings brackets in Claremont are $100,000+ for men (3,172 | 31.0%) and $100,000+ for women (2,076 | 21.0%).
| Income | Male | Female |
| $2,499 or less | 912 (8.9%) | 900 (9.1%) |
| $2,500 to $4,999 | 528 (5.2%) | 944 (9.5%) |
| $5,000 to $7,499 | 375 (3.7%) | 588 (5.9%) |
| $7,500 to $9,999 | 230 (2.2%) | 281 (2.8%) |
| $10,000 to $12,499 | 185 (1.8%) | 275 (2.8%) |
| $12,500 to $14,999 | 241 (2.4%) | 128 (1.3%) |
| $15,000 to $17,499 | 274 (2.7%) | 257 (2.6%) |
| $17,500 to $19,999 | 266 (2.6%) | 160 (1.6%) |
| $20,000 to $22,499 | 158 (1.5%) | 169 (1.7%) |
| $22,500 to $24,999 | 222 (2.2%) | 298 (3.0%) |
| $25,000 to $29,999 | 326 (3.2%) | 367 (3.7%) |
| $30,000 to $34,999 | 385 (3.8%) | 560 (5.7%) |
| $35,000 to $39,999 | 288 (2.8%) | 165 (1.7%) |
| $40,000 to $44,999 | 117 (1.1%) | 88 (0.9%) |
| $45,000 to $49,999 | 256 (2.5%) | 249 (2.5%) |
| $50,000 to $54,999 | 198 (1.9%) | 281 (2.8%) |
| $55,000 to $64,999 | 682 (6.7%) | 533 (5.4%) |
| $65,000 to $74,999 | 407 (4.0%) | 492 (5.0%) |
| $75,000 to $99,999 | 1,003 (9.8%) | 1,080 (10.9%) |
| $100,000+ | 3,172 (31.0%) | 2,076 (21.0%) |
| Total | 10,225 (100.0%) | 9,891 (100.0%) |
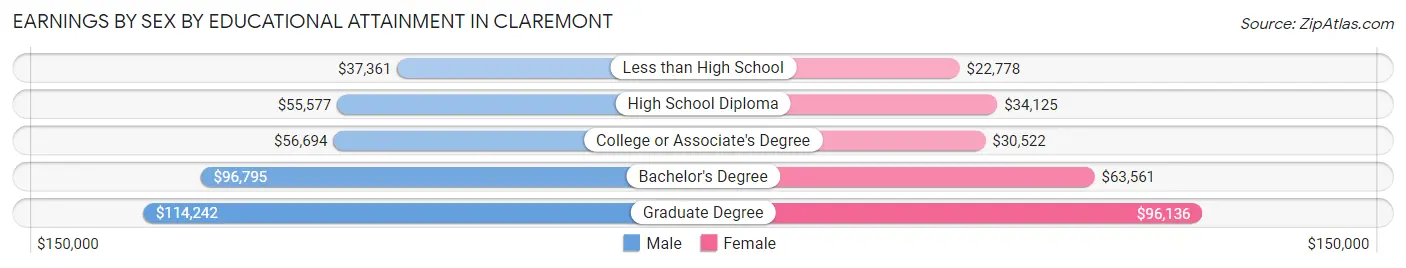
Earnings by Sex by Educational Attainment in Claremont
Average earnings in Claremont are $76,863 for men and $61,712 for women, a difference of 19.7%. Men with an educational attainment of graduate degree enjoy the highest average annual earnings of $114,242, while those with less than high school education earn the least with $37,361. Women with an educational attainment of graduate degree earn the most with the average annual earnings of $96,136, while those with less than high school education have the smallest earnings of $22,778.
| Educational Attainment | Male Income | Female Income |
| Less than High School | $37,361 | $22,778 |
| High School Diploma | $55,577 | $34,125 |
| College or Associate's Degree | $56,694 | $30,522 |
| Bachelor's Degree | $96,795 | $63,561 |
| Graduate Degree | $114,242 | $96,136 |
| Total | $76,863 | $61,712 |
Family Income in Claremont
Family Income Brackets in Claremont
According to the Claremont family income data, there are 2,891 families falling into the $200,000+ income range, which is the most common income bracket and makes up 32.3% of all families. Conversely, the less than $10,000 income bracket is the least frequent group with only 107 families (1.2%) belonging to this category.
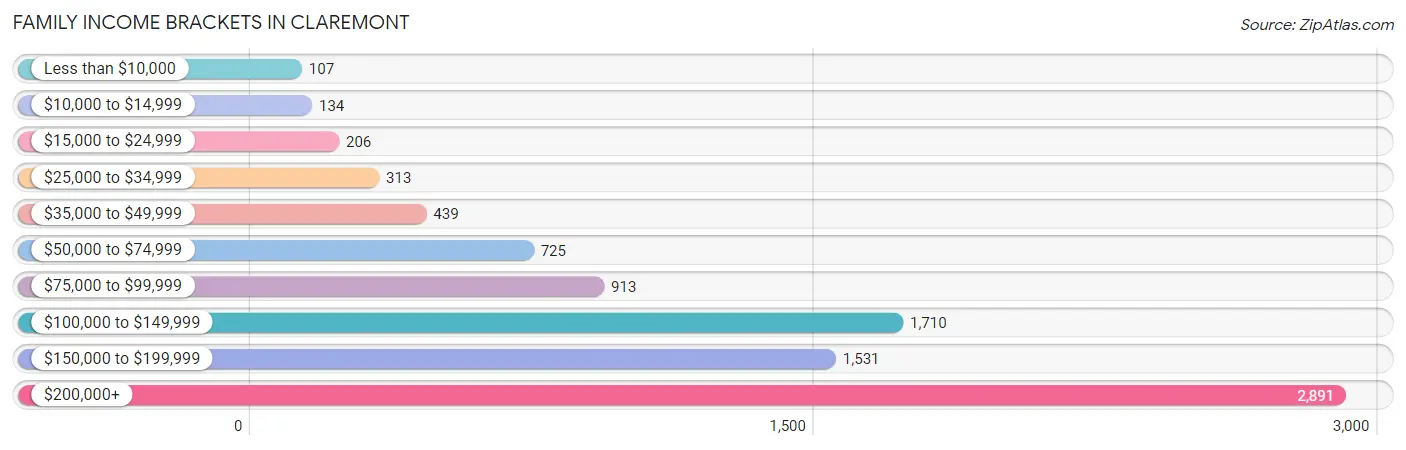
| Income Bracket | # Families | % Families |
| Less than $10,000 | 107 | 1.2% |
| $10,000 to $14,999 | 134 | 1.5% |
| $15,000 to $24,999 | 206 | 2.3% |
| $25,000 to $34,999 | 313 | 3.5% |
| $35,000 to $49,999 | 439 | 4.9% |
| $50,000 to $74,999 | 725 | 8.1% |
| $75,000 to $99,999 | 913 | 10.2% |
| $100,000 to $149,999 | 1,710 | 19.1% |
| $150,000 to $199,999 | 1,531 | 17.1% |
| $200,000+ | 2,891 | 32.3% |
Family Income by Famaliy Size in Claremont
4-person families (1,630 | 18.2%) account for the highest median family income in Claremont with $206,675 per family, while 2-person families (4,216 | 47.1%) have the highest median income of $66,162 per family member.
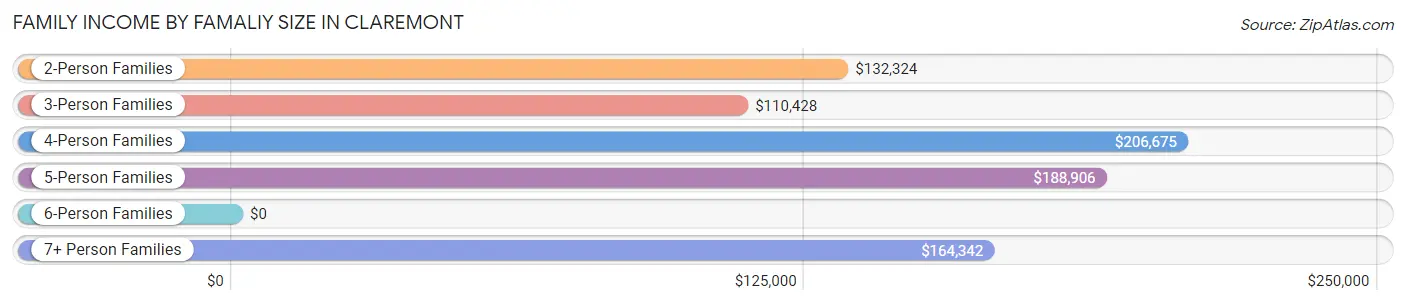
| Income Bracket | # Families | Median Income |
| 2-Person Families | 4,216 (47.1%) | $132,324 |
| 3-Person Families | 2,239 (25.0%) | $110,428 |
| 4-Person Families | 1,630 (18.2%) | $206,675 |
| 5-Person Families | 665 (7.4%) | $188,906 |
| 6-Person Families | 141 (1.6%) | $0 |
| 7+ Person Families | 60 (0.7%) | $164,342 |
| Total | 8,951 (100.0%) | $148,492 |
Family Income by Number of Earners in Claremont
The median family income in Claremont is $148,492, with families comprising 3+ earners (1,150) having the highest median family income of $183,269, while families with no earners (1,491) have the lowest median family income of $95,430, accounting for 12.9% and 16.7% of families, respectively.
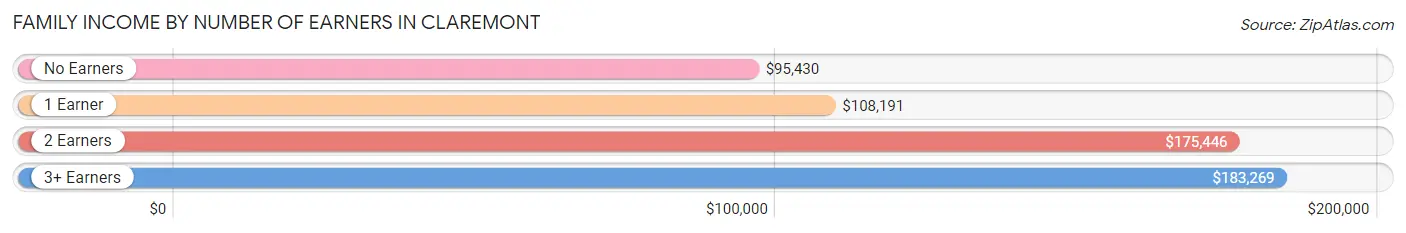
| Number of Earners | # Families | Median Income |
| No Earners | 1,491 (16.7%) | $95,430 |
| 1 Earner | 2,459 (27.5%) | $108,191 |
| 2 Earners | 3,851 (43.0%) | $175,446 |
| 3+ Earners | 1,150 (12.9%) | $183,269 |
| Total | 8,951 (100.0%) | $148,492 |
Household Income in Claremont
Household Income Brackets in Claremont
With 3,302 households falling in the category, the $200,000+ income range is the most frequent in Claremont, accounting for 26.2% of all households. In contrast, only 214 households (1.7%) fall into the $10,000 to $14,999 income bracket, making it the least populous group.
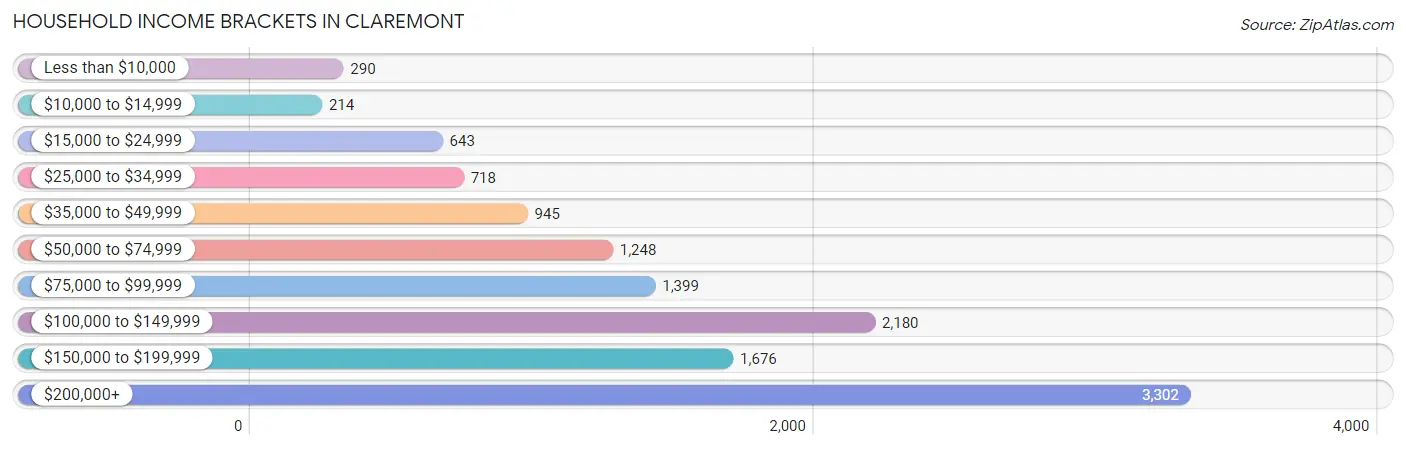
| Income Bracket | # Households | % Households |
| Less than $10,000 | 290 | 2.3% |
| $10,000 to $14,999 | 214 | 1.7% |
| $15,000 to $24,999 | 643 | 5.1% |
| $25,000 to $34,999 | 718 | 5.7% |
| $35,000 to $49,999 | 945 | 7.5% |
| $50,000 to $74,999 | 1,248 | 9.9% |
| $75,000 to $99,999 | 1,399 | 11.1% |
| $100,000 to $149,999 | 2,180 | 17.3% |
| $150,000 to $199,999 | 1,676 | 13.3% |
| $200,000+ | 3,302 | 26.2% |
Household Income by Householder Age in Claremont
The median household income in Claremont is $115,091, with the highest median household income of $149,398 found in the 45 to 64 years age bracket for the primary householder. A total of 5,091 households (40.4%) fall into this category. Meanwhile, the 15 to 24 years age bracket for the primary householder has the lowest median household income of $61,510, with 159 households (1.3%) in this group.
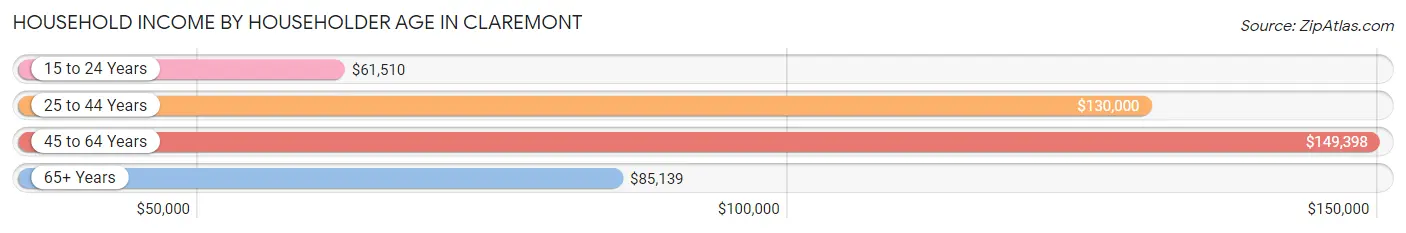
| Income Bracket | # Households | Median Income |
| 15 to 24 Years | 159 (1.3%) | $61,510 |
| 25 to 44 Years | 2,792 (22.2%) | $130,000 |
| 45 to 64 Years | 5,091 (40.4%) | $149,398 |
| 65+ Years | 4,561 (36.2%) | $85,139 |
| Total | 12,603 (100.0%) | $115,091 |
Poverty in Claremont
Income Below Poverty by Sex and Age in Claremont
With 4.2% poverty level for males and 7.4% for females among the residents of Claremont, 12 to 14 year old males and 15 year old females are the most vulnerable to poverty, with 73 males (12.3%) and 78 females (32.5%) in their respective age groups living below the poverty level.
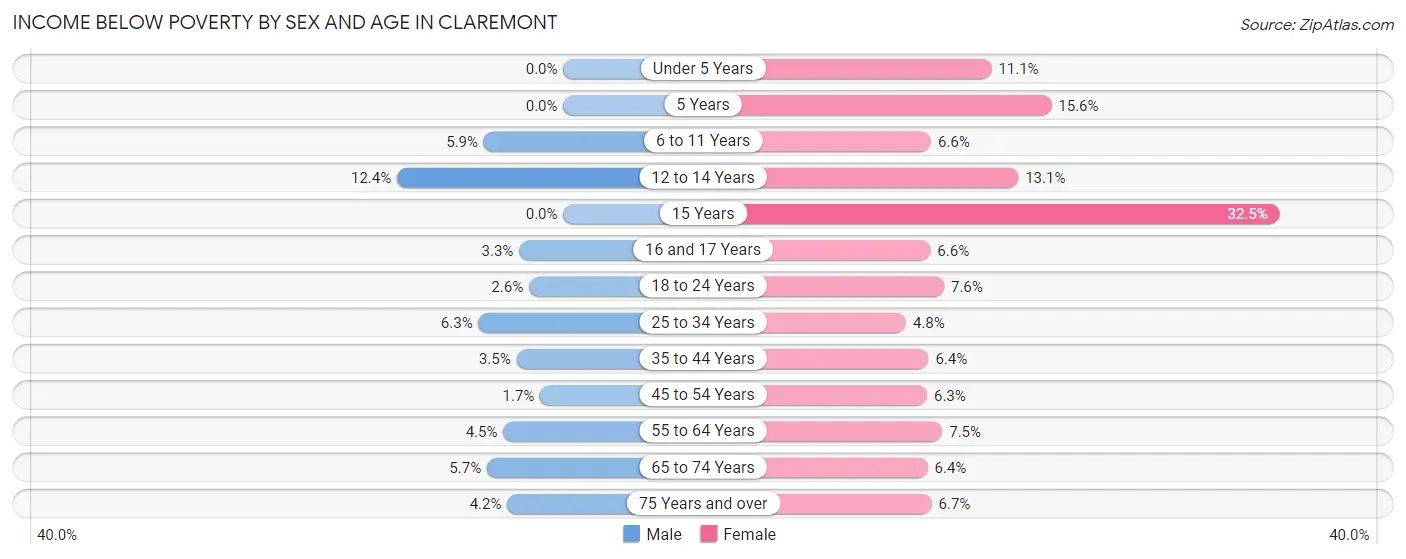
| Age Bracket | Male | Female |
| Under 5 Years | 0 (0.0%) | 58 (11.1%) |
| 5 Years | 0 (0.0%) | 21 (15.6%) |
| 6 to 11 Years | 56 (5.9%) | 81 (6.6%) |
| 12 to 14 Years | 73 (12.3%) | 82 (13.1%) |
| 15 Years | 0 (0.0%) | 78 (32.5%) |
| 16 and 17 Years | 12 (3.3%) | 21 (6.6%) |
| 18 to 24 Years | 35 (2.5%) | 88 (7.6%) |
| 25 to 34 Years | 131 (6.3%) | 68 (4.8%) |
| 35 to 44 Years | 62 (3.5%) | 128 (6.4%) |
| 45 to 54 Years | 39 (1.7%) | 164 (6.3%) |
| 55 to 64 Years | 98 (4.5%) | 173 (7.5%) |
| 65 to 74 Years | 97 (5.7%) | 131 (6.4%) |
| 75 Years and over | 49 (4.2%) | 162 (6.7%) |
| Total | 652 (4.2%) | 1,255 (7.4%) |
Income Above Poverty by Sex and Age in Claremont
According to the poverty statistics in Claremont, males aged under 5 years and females aged 25 to 34 years are the age groups that are most secure financially, with 100.0% of males and 95.2% of females in these age groups living above the poverty line.
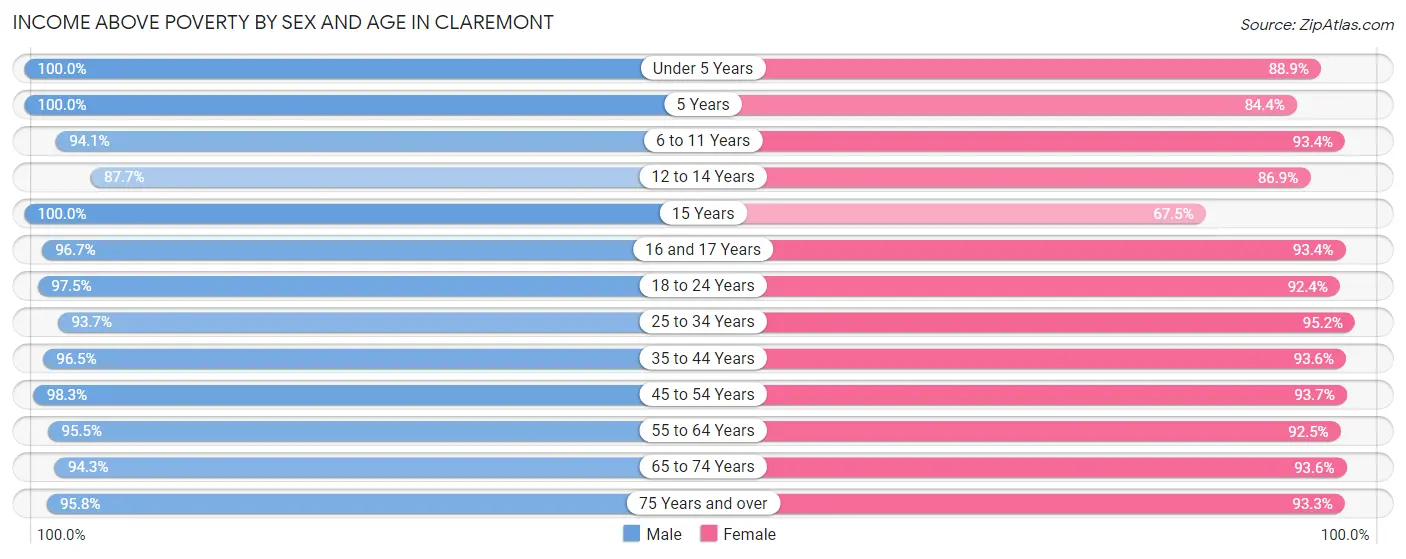
| Age Bracket | Male | Female |
| Under 5 Years | 693 (100.0%) | 464 (88.9%) |
| 5 Years | 91 (100.0%) | 114 (84.4%) |
| 6 to 11 Years | 893 (94.1%) | 1,142 (93.4%) |
| 12 to 14 Years | 518 (87.6%) | 544 (86.9%) |
| 15 Years | 265 (100.0%) | 162 (67.5%) |
| 16 and 17 Years | 354 (96.7%) | 298 (93.4%) |
| 18 to 24 Years | 1,335 (97.5%) | 1,072 (92.4%) |
| 25 to 34 Years | 1,948 (93.7%) | 1,357 (95.2%) |
| 35 to 44 Years | 1,721 (96.5%) | 1,860 (93.6%) |
| 45 to 54 Years | 2,235 (98.3%) | 2,426 (93.7%) |
| 55 to 64 Years | 2,098 (95.5%) | 2,146 (92.5%) |
| 65 to 74 Years | 1,614 (94.3%) | 1,926 (93.6%) |
| 75 Years and over | 1,128 (95.8%) | 2,267 (93.3%) |
| Total | 14,893 (95.8%) | 15,778 (92.6%) |
Income Below Poverty Among Married-Couple Families in Claremont
The poverty statistics for married-couple families in Claremont show that 1.8% or 130 of the total 7,163 families live below the poverty line. Families with 3 or 4 children have the highest poverty rate of 7.6%, comprising of 28 families. On the other hand, families with no children have the lowest poverty rate of 1.3%, which includes 60 families.
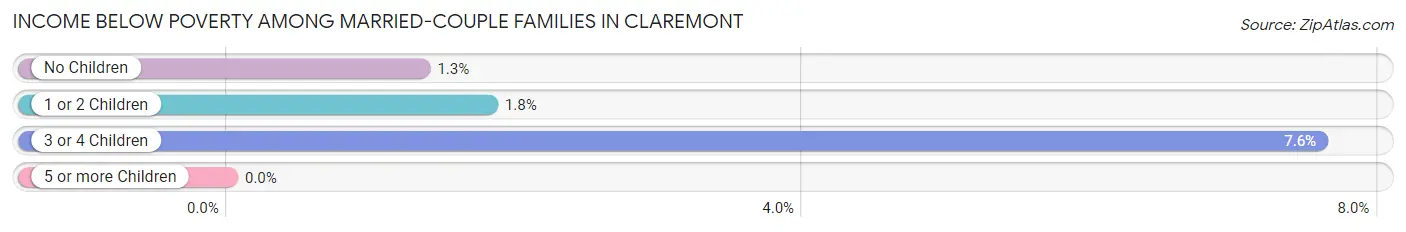
| Children | Above Poverty | Below Poverty |
| No Children | 4,418 (98.7%) | 60 (1.3%) |
| 1 or 2 Children | 2,274 (98.2%) | 42 (1.8%) |
| 3 or 4 Children | 341 (92.4%) | 28 (7.6%) |
| 5 or more Children | 0 (0.0%) | 0 (0.0%) |
| Total | 7,033 (98.2%) | 130 (1.8%) |
Income Below Poverty Among Single-Parent Households in Claremont
According to the poverty data in Claremont, 10.4% or 40 single-father households and 13.3% or 187 single-mother households are living below the poverty line. Among single-father households, those with 1 or 2 children have the highest poverty rate, with 40 households (34.5%) experiencing poverty. Likewise, among single-mother households, those with 1 or 2 children have the highest poverty rate, with 122 households (22.1%) falling below the poverty line.
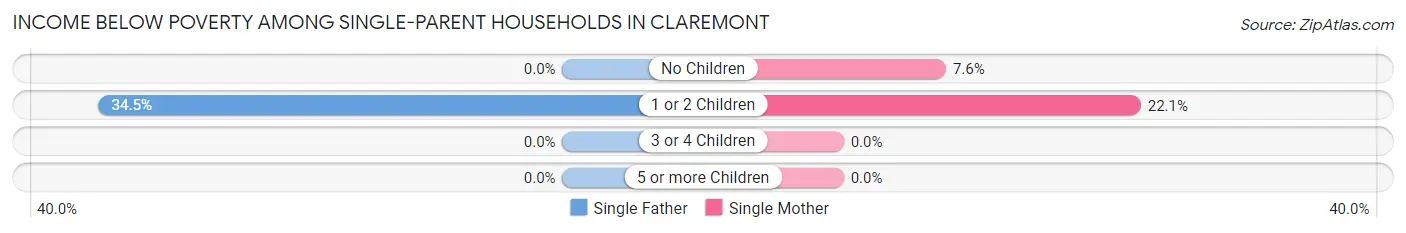
| Children | Single Father | Single Mother |
| No Children | 0 (0.0%) | 65 (7.6%) |
| 1 or 2 Children | 40 (34.5%) | 122 (22.1%) |
| 3 or 4 Children | 0 (0.0%) | 0 (0.0%) |
| 5 or more Children | 0 (0.0%) | 0 (0.0%) |
| Total | 40 (10.4%) | 187 (13.3%) |
Income Below Poverty Among Married-Couple vs Single-Parent Households in Claremont
The poverty data for Claremont shows that 130 of the married-couple family households (1.8%) and 227 of the single-parent households (12.7%) are living below the poverty level. Within the married-couple family households, those with 3 or 4 children have the highest poverty rate, with 28 households (7.6%) falling below the poverty line. Among the single-parent households, those with 1 or 2 children have the highest poverty rate, with 162 household (24.3%) living below poverty.
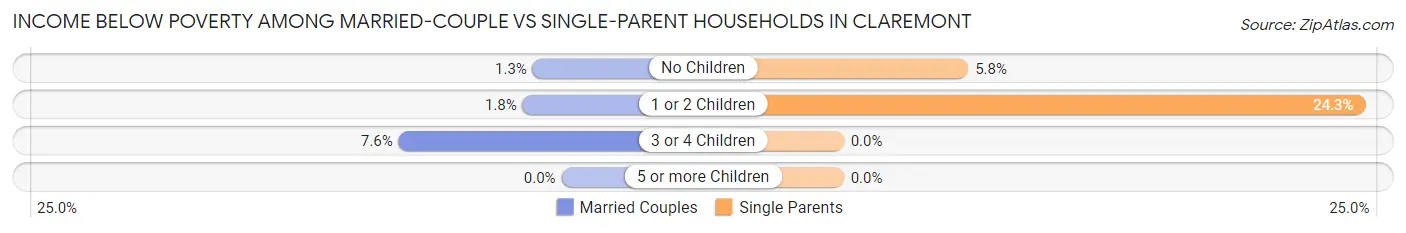
| Children | Married-Couple Families | Single-Parent Households |
| No Children | 60 (1.3%) | 65 (5.8%) |
| 1 or 2 Children | 42 (1.8%) | 162 (24.3%) |
| 3 or 4 Children | 28 (7.6%) | 0 (0.0%) |
| 5 or more Children | 0 (0.0%) | 0 (0.0%) |
| Total | 130 (1.8%) | 227 (12.7%) |
Race in Claremont
The most populous races in Claremont are White / Caucasian (20,750 | 56.2%), Hispanic or Latino (8,983 | 24.3%), and Two or more Races (5,745 | 15.6%).
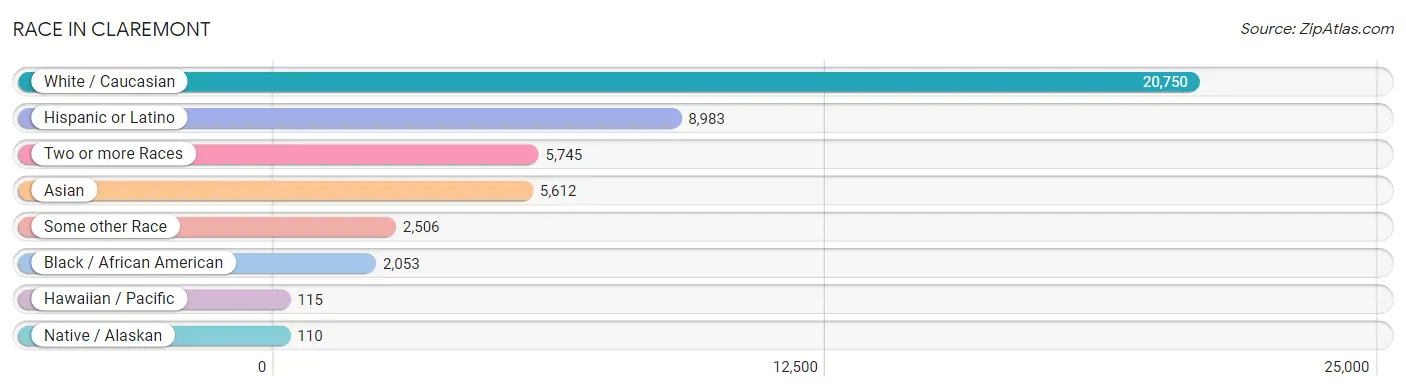
| Race | # Population | % Population |
| Asian | 5,612 | 15.2% |
| Black / African American | 2,053 | 5.6% |
| Hawaiian / Pacific | 115 | 0.3% |
| Hispanic or Latino | 8,983 | 24.3% |
| Native / Alaskan | 110 | 0.3% |
| White / Caucasian | 20,750 | 56.2% |
| Two or more Races | 5,745 | 15.6% |
| Some other Race | 2,506 | 6.8% |
| Total | 36,891 | 100.0% |
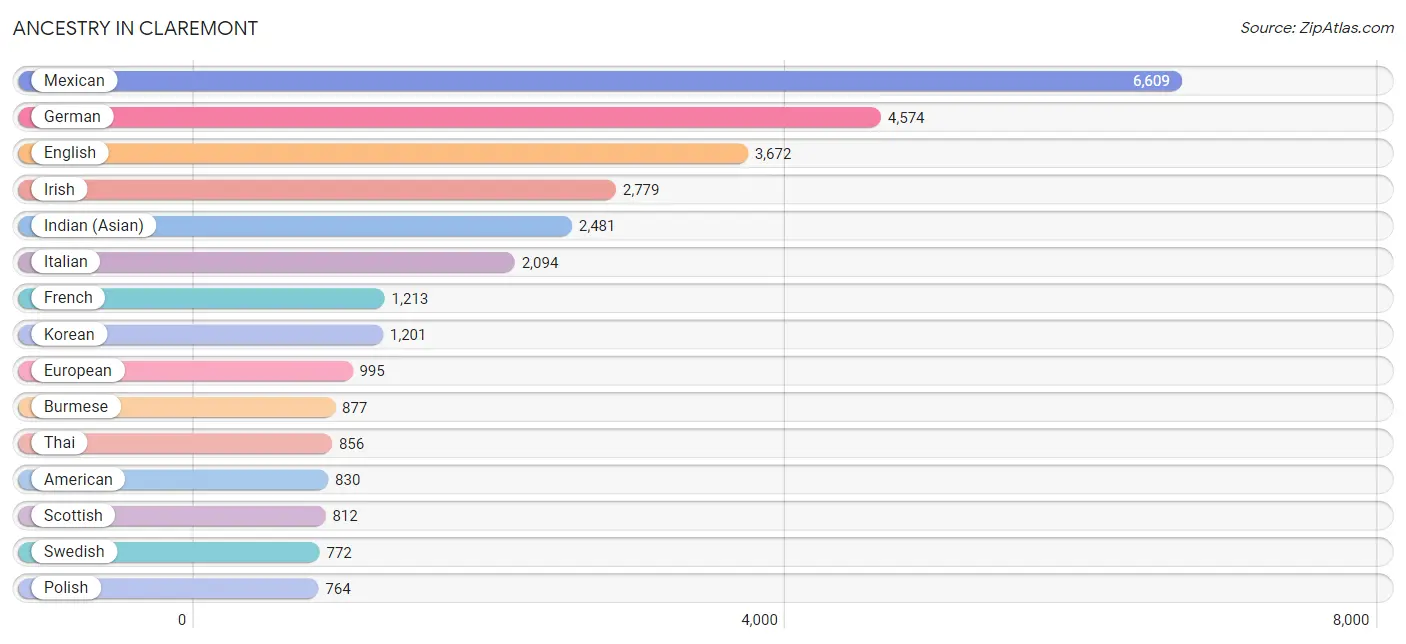
Ancestry in Claremont
The most populous ancestries reported in Claremont are Mexican (6,609 | 17.9%), German (4,574 | 12.4%), English (3,672 | 10.0%), Irish (2,779 | 7.5%), and Indian (Asian) (2,481 | 6.7%), together accounting for 54.5% of all Claremont residents.
| Ancestry | # Population | % Population |
| African | 159 | 0.4% |
| Albanian | 28 | 0.1% |
| Alsatian | 5 | 0.0% |
| American | 830 | 2.2% |
| Apache | 35 | 0.1% |
| Arab | 376 | 1.0% |
| Argentinean | 92 | 0.3% |
| Armenian | 467 | 1.3% |
| Austrian | 169 | 0.5% |
| Basque | 45 | 0.1% |
| Belgian | 66 | 0.2% |
| Bhutanese | 439 | 1.2% |
| Blackfeet | 20 | 0.1% |
| Brazilian | 162 | 0.4% |
| British | 334 | 0.9% |
| British West Indian | 2 | 0.0% |
| Bulgarian | 2 | 0.0% |
| Burmese | 877 | 2.4% |
| Cajun | 21 | 0.1% |
| Cambodian | 6 | 0.0% |
| Canadian | 198 | 0.5% |
| Cape Verdean | 2 | 0.0% |
| Central American | 702 | 1.9% |
| Central American Indian | 70 | 0.2% |
| Cherokee | 198 | 0.5% |
| Chickasaw | 3 | 0.0% |
| Chilean | 8 | 0.0% |
| Choctaw | 3 | 0.0% |
| Colombian | 74 | 0.2% |
| Costa Rican | 9 | 0.0% |
| Creek | 22 | 0.1% |
| Croatian | 313 | 0.9% |
| Cuban | 81 | 0.2% |
| Czech | 20 | 0.1% |
| Czechoslovakian | 5 | 0.0% |
| Danish | 165 | 0.4% |
| Dominican | 5 | 0.0% |
| Dutch | 659 | 1.8% |
| Eastern European | 163 | 0.4% |
| Ecuadorian | 54 | 0.2% |
| Egyptian | 65 | 0.2% |
| English | 3,672 | 10.0% |
| Estonian | 9 | 0.0% |
| Ethiopian | 49 | 0.1% |
| European | 995 | 2.7% |
| Filipino | 182 | 0.5% |
| Finnish | 131 | 0.4% |
| French | 1,213 | 3.3% |
| French Canadian | 32 | 0.1% |
| German | 4,574 | 12.4% |
| Ghanaian | 22 | 0.1% |
| Greek | 212 | 0.6% |
| Guamanian / Chamorro | 13 | 0.0% |
| Guatemalan | 287 | 0.8% |
| Guyanese | 10 | 0.0% |
| Honduran | 9 | 0.0% |
| Hungarian | 123 | 0.3% |
| Indian (Asian) | 2,481 | 6.7% |
| Iranian | 451 | 1.2% |
| Irish | 2,779 | 7.5% |
| Iroquois | 10 | 0.0% |
| Israeli | 13 | 0.0% |
| Italian | 2,094 | 5.7% |
| Jamaican | 35 | 0.1% |
| Japanese | 62 | 0.2% |
| Jordanian | 79 | 0.2% |
| Korean | 1,201 | 3.3% |
| Laotian | 12 | 0.0% |
| Lebanese | 81 | 0.2% |
| Lithuanian | 52 | 0.1% |
| Lumbee | 153 | 0.4% |
| Mexican | 6,609 | 17.9% |
| Mexican American Indian | 138 | 0.4% |
| Native Hawaiian | 114 | 0.3% |
| Navajo | 24 | 0.1% |
| Nicaraguan | 82 | 0.2% |
| Nigerian | 64 | 0.2% |
| Northern European | 114 | 0.3% |
| Norwegian | 451 | 1.2% |
| Okinawan | 2 | 0.0% |
| Pakistani | 15 | 0.0% |
| Palestinian | 12 | 0.0% |
| Pennsylvania German | 4 | 0.0% |
| Peruvian | 177 | 0.5% |
| Polish | 764 | 2.1% |
| Portuguese | 51 | 0.1% |
| Puerto Rican | 123 | 0.3% |
| Romanian | 55 | 0.2% |
| Russian | 578 | 1.6% |
| Salvadoran | 307 | 0.8% |
| Samoan | 59 | 0.2% |
| Scandinavian | 177 | 0.5% |
| Scotch-Irish | 289 | 0.8% |
| Scottish | 812 | 2.2% |
| Serbian | 15 | 0.0% |
| Sioux | 175 | 0.5% |
| Slovak | 105 | 0.3% |
| South American | 452 | 1.2% |
| Spaniard | 229 | 0.6% |
| Spanish | 534 | 1.5% |
| Spanish American Indian | 6 | 0.0% |
| Sri Lankan | 480 | 1.3% |
| Subsaharan African | 481 | 1.3% |
| Swedish | 772 | 2.1% |
| Swiss | 116 | 0.3% |
| Syrian | 2 | 0.0% |
| Thai | 856 | 2.3% |
| Tongan | 2 | 0.0% |
| Turkish | 31 | 0.1% |
| Ukrainian | 97 | 0.3% |
| Uruguayan | 9 | 0.0% |
| Venezuelan | 38 | 0.1% |
| Welsh | 217 | 0.6% |
| West Indian | 13 | 0.0% |
| Yugoslavian | 4 | 0.0% |
| Zimbabwean | 92 | 0.3% | View All 116 Rows |
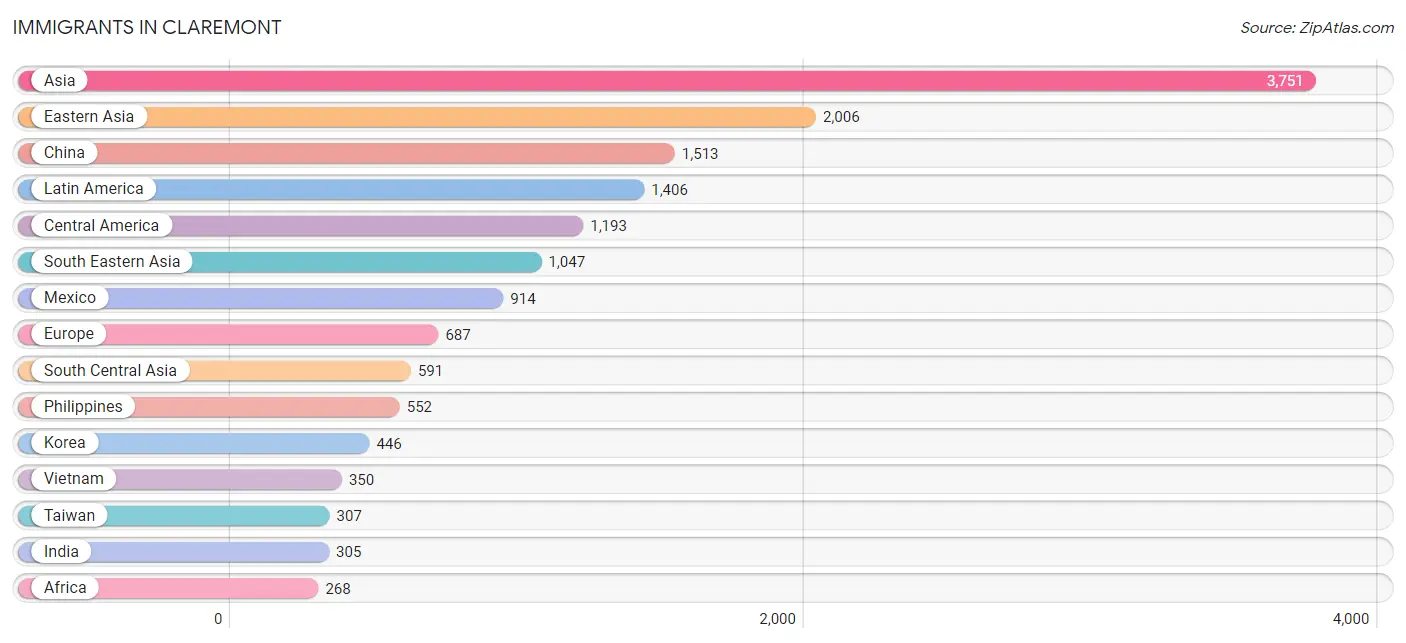
Immigrants in Claremont
The most numerous immigrant groups reported in Claremont came from Asia (3,751 | 10.2%), Eastern Asia (2,006 | 5.4%), China (1,513 | 4.1%), Latin America (1,406 | 3.8%), and Central America (1,193 | 3.2%), together accounting for 26.8% of all Claremont residents.
| Immigration Origin | # Population | % Population |
| Africa | 268 | 0.7% |
| Albania | 28 | 0.1% |
| Argentina | 24 | 0.1% |
| Asia | 3,751 | 10.2% |
| Australia | 26 | 0.1% |
| Austria | 50 | 0.1% |
| Belarus | 6 | 0.0% |
| Belgium | 17 | 0.1% |
| Bosnia and Herzegovina | 4 | 0.0% |
| Bulgaria | 2 | 0.0% |
| Cambodia | 32 | 0.1% |
| Canada | 184 | 0.5% |
| Caribbean | 66 | 0.2% |
| Central America | 1,193 | 3.2% |
| China | 1,513 | 4.1% |
| Colombia | 22 | 0.1% |
| Costa Rica | 8 | 0.0% |
| Cuba | 32 | 0.1% |
| Denmark | 18 | 0.1% |
| Eastern Africa | 145 | 0.4% |
| Eastern Asia | 2,006 | 5.4% |
| Eastern Europe | 166 | 0.4% |
| Ecuador | 48 | 0.1% |
| Egypt | 48 | 0.1% |
| El Salvador | 155 | 0.4% |
| England | 61 | 0.2% |
| Ethiopia | 42 | 0.1% |
| Europe | 687 | 1.9% |
| Fiji | 37 | 0.1% |
| France | 40 | 0.1% |
| Germany | 15 | 0.0% |
| Guatemala | 88 | 0.2% |
| Guyana | 7 | 0.0% |
| Honduras | 5 | 0.0% |
| Hong Kong | 85 | 0.2% |
| Hungary | 13 | 0.0% |
| India | 305 | 0.8% |
| Indonesia | 24 | 0.1% |
| Iran | 210 | 0.6% |
| Ireland | 13 | 0.0% |
| Israel | 33 | 0.1% |
| Italy | 62 | 0.2% |
| Jamaica | 30 | 0.1% |
| Japan | 47 | 0.1% |
| Jordan | 19 | 0.1% |
| Kenya | 8 | 0.0% |
| Korea | 446 | 1.2% |
| Latin America | 1,406 | 3.8% |
| Lebanon | 36 | 0.1% |
| Malaysia | 46 | 0.1% |
| Mexico | 914 | 2.5% |
| Middle Africa | 15 | 0.0% |
| Moldova | 22 | 0.1% |
| Netherlands | 55 | 0.2% |
| Nicaragua | 19 | 0.1% |
| Nigeria | 11 | 0.0% |
| Northern Africa | 48 | 0.1% |
| Northern Europe | 268 | 0.7% |
| Norway | 12 | 0.0% |
| Oceania | 63 | 0.2% |
| Pakistan | 42 | 0.1% |
| Panama | 4 | 0.0% |
| Peru | 37 | 0.1% |
| Philippines | 552 | 1.5% |
| Poland | 9 | 0.0% |
| Romania | 24 | 0.1% |
| Russia | 44 | 0.1% |
| Scotland | 21 | 0.1% |
| Singapore | 7 | 0.0% |
| South Africa | 18 | 0.1% |
| South America | 147 | 0.4% |
| South Central Asia | 591 | 1.6% |
| South Eastern Asia | 1,047 | 2.8% |
| Southern Europe | 76 | 0.2% |
| Spain | 14 | 0.0% |
| Sri Lanka | 34 | 0.1% |
| Sweden | 35 | 0.1% |
| Taiwan | 307 | 0.8% |
| Thailand | 21 | 0.1% |
| Trinidad and Tobago | 4 | 0.0% |
| Ukraine | 14 | 0.0% |
| Uruguay | 9 | 0.0% |
| Vietnam | 350 | 0.9% |
| Western Africa | 42 | 0.1% |
| Western Asia | 107 | 0.3% |
| Western Europe | 177 | 0.5% |
| Zimbabwe | 62 | 0.2% | View All 87 Rows |
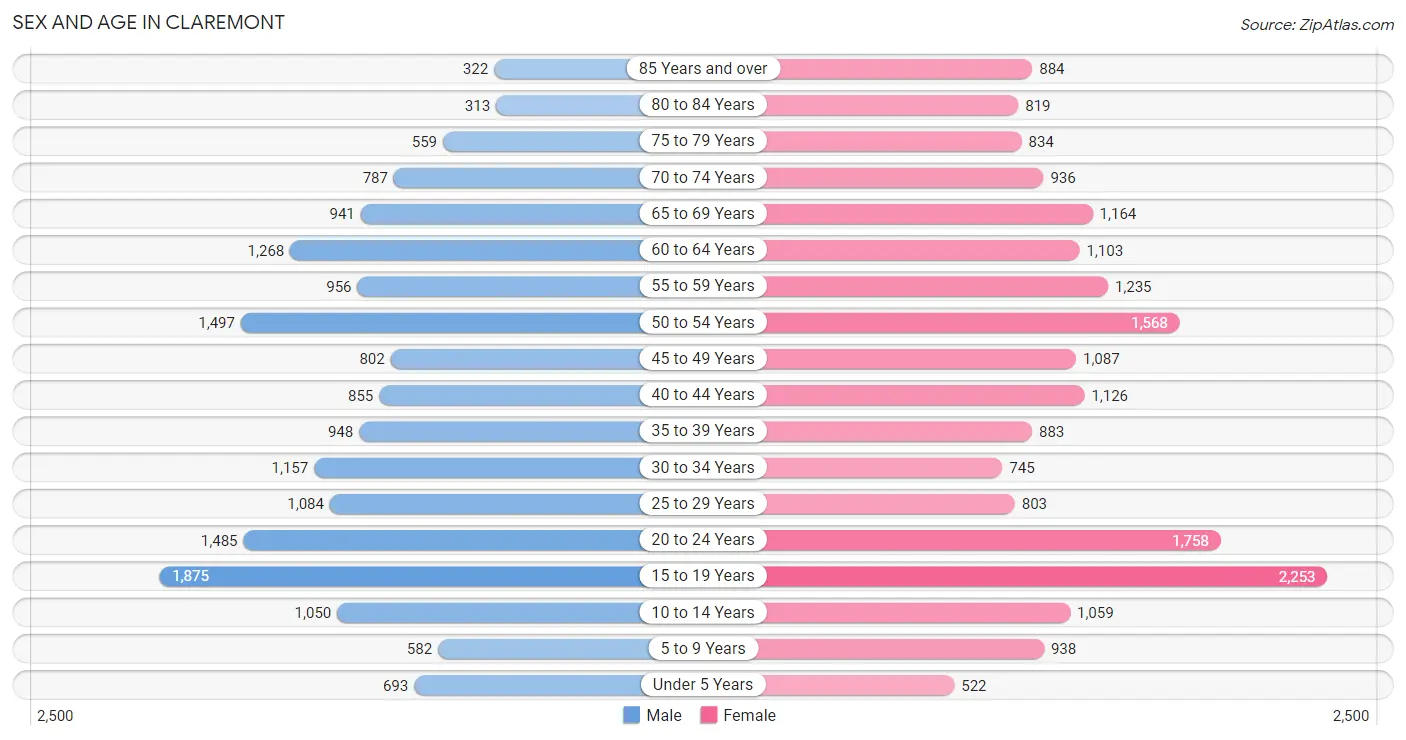
Sex and Age in Claremont
Sex and Age in Claremont
The most populous age groups in Claremont are 15 to 19 Years (1,875 | 10.9%) for men and 15 to 19 Years (2,253 | 11.4%) for women.
| Age Bracket | Male | Female |
| Under 5 Years | 693 (4.0%) | 522 (2.6%) |
| 5 to 9 Years | 582 (3.4%) | 938 (4.8%) |
| 10 to 14 Years | 1,050 (6.1%) | 1,059 (5.4%) |
| 15 to 19 Years | 1,875 (10.9%) | 2,253 (11.4%) |
| 20 to 24 Years | 1,485 (8.6%) | 1,758 (8.9%) |
| 25 to 29 Years | 1,084 (6.3%) | 803 (4.1%) |
| 30 to 34 Years | 1,157 (6.7%) | 745 (3.8%) |
| 35 to 39 Years | 948 (5.5%) | 883 (4.5%) |
| 40 to 44 Years | 855 (5.0%) | 1,126 (5.7%) |
| 45 to 49 Years | 802 (4.7%) | 1,087 (5.5%) |
| 50 to 54 Years | 1,497 (8.7%) | 1,568 (8.0%) |
| 55 to 59 Years | 956 (5.6%) | 1,235 (6.3%) |
| 60 to 64 Years | 1,268 (7.4%) | 1,103 (5.6%) |
| 65 to 69 Years | 941 (5.5%) | 1,164 (5.9%) |
| 70 to 74 Years | 787 (4.6%) | 936 (4.8%) |
| 75 to 79 Years | 559 (3.3%) | 834 (4.2%) |
| 80 to 84 Years | 313 (1.8%) | 819 (4.2%) |
| 85 Years and over | 322 (1.9%) | 884 (4.5%) |
| Total | 17,174 (100.0%) | 19,717 (100.0%) |
Families and Households in Claremont
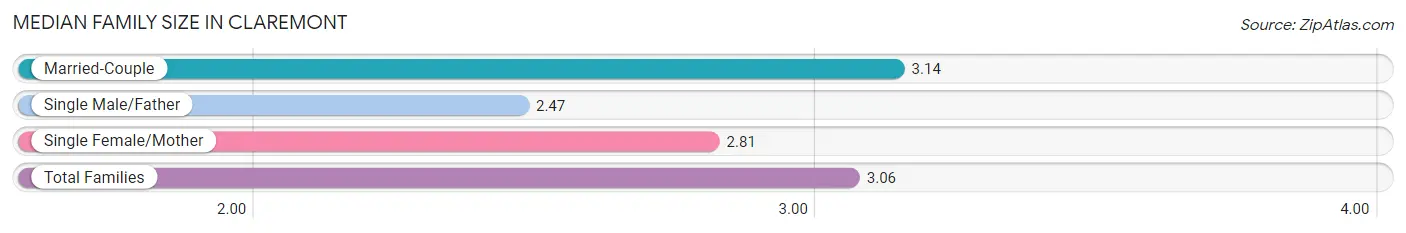
Median Family Size in Claremont
The median family size in Claremont is 3.06 persons per family, with married-couple families (7,163 | 80.0%) accounting for the largest median family size of 3.14 persons per family. On the other hand, single male/father families (384 | 4.3%) represent the smallest median family size with 2.47 persons per family.
| Family Type | # Families | Family Size |
| Married-Couple | 7,163 (80.0%) | 3.14 |
| Single Male/Father | 384 (4.3%) | 2.47 |
| Single Female/Mother | 1,404 (15.7%) | 2.81 |
| Total Families | 8,951 (100.0%) | 3.06 |
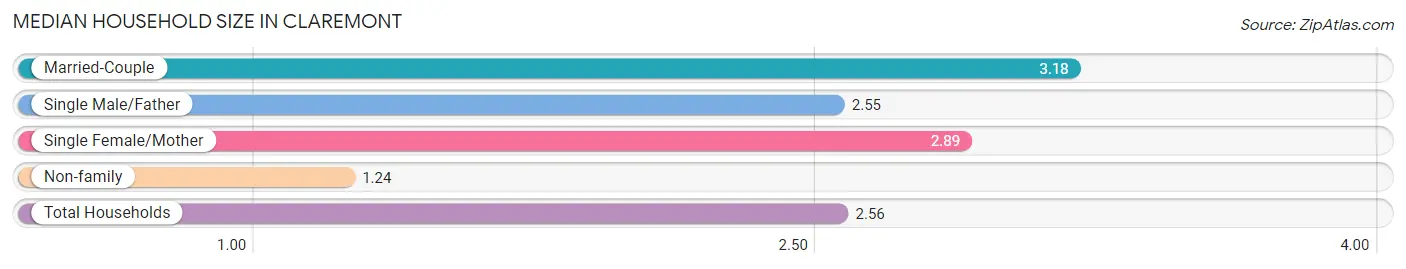
Median Household Size in Claremont
The median household size in Claremont is 2.56 persons per household, with married-couple households (7,163 | 56.8%) accounting for the largest median household size of 3.18 persons per household. non-family households (3,652 | 29.0%) represent the smallest median household size with 1.24 persons per household.
| Household Type | # Households | Household Size |
| Married-Couple | 7,163 (56.8%) | 3.18 |
| Single Male/Father | 384 (3.0%) | 2.55 |
| Single Female/Mother | 1,404 (11.1%) | 2.89 |
| Non-family | 3,652 (29.0%) | 1.24 |
| Total Households | 12,603 (100.0%) | 2.56 |
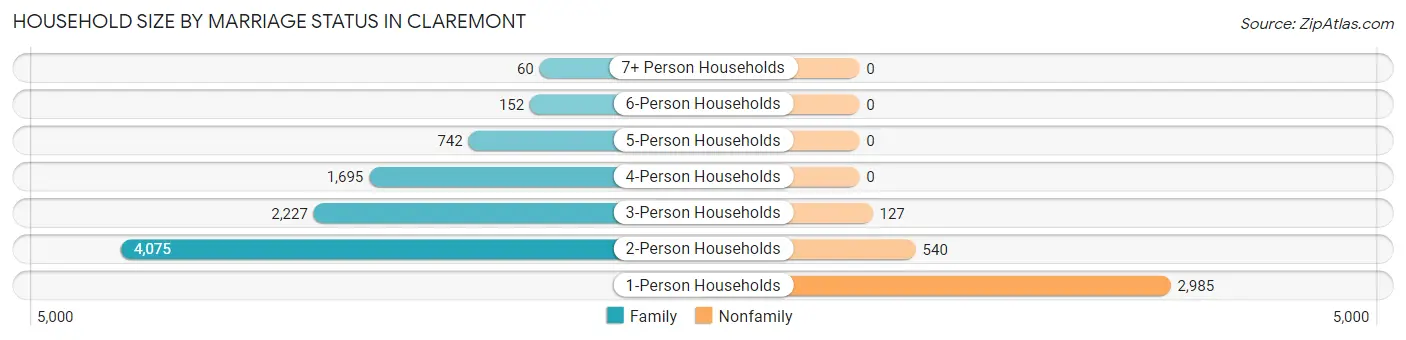
Household Size by Marriage Status in Claremont
Out of a total of 12,603 households in Claremont, 8,951 (71.0%) are family households, while 3,652 (29.0%) are nonfamily households. The most numerous type of family households are 2-person households, comprising 4,075, and the most common type of nonfamily households are 1-person households, comprising 2,985.
| Household Size | Family Households | Nonfamily Households |
| 1-Person Households | - | 2,985 (23.7%) |
| 2-Person Households | 4,075 (32.3%) | 540 (4.3%) |
| 3-Person Households | 2,227 (17.7%) | 127 (1.0%) |
| 4-Person Households | 1,695 (13.5%) | 0 (0.0%) |
| 5-Person Households | 742 (5.9%) | 0 (0.0%) |
| 6-Person Households | 152 (1.2%) | 0 (0.0%) |
| 7+ Person Households | 60 (0.5%) | 0 (0.0%) |
| Total | 8,951 (71.0%) | 3,652 (29.0%) |
Female Fertility in Claremont
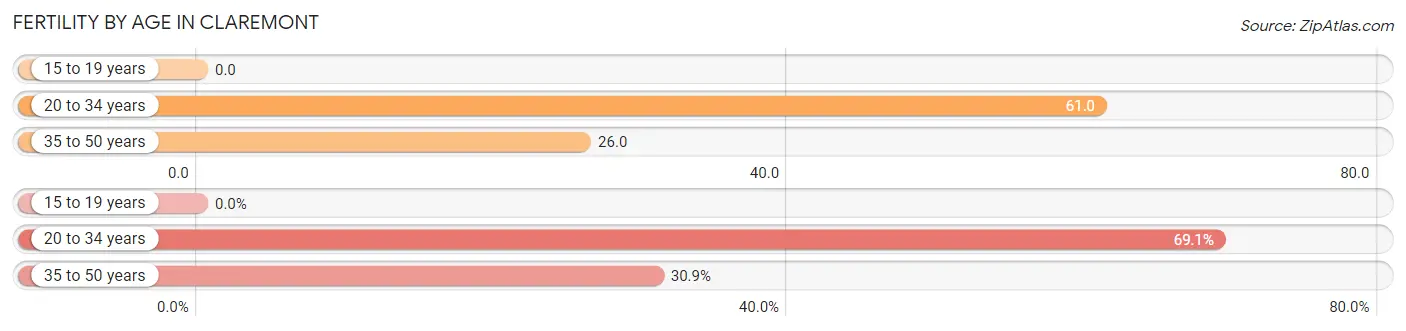
Fertility by Age in Claremont
Average fertility rate in Claremont is 32.0 births per 1,000 women. Women in the age bracket of 20 to 34 years have the highest fertility rate with 61.0 births per 1,000 women. Women in the age bracket of 20 to 34 years acount for 69.1% of all women with births.
| Age Bracket | Women with Births | Births / 1,000 Women |
| 15 to 19 years | 0 (0.0%) | 0.0 |
| 20 to 34 years | 201 (69.1%) | 61.0 |
| 35 to 50 years | 90 (30.9%) | 26.0 |
| Total | 291 (100.0%) | 32.0 |
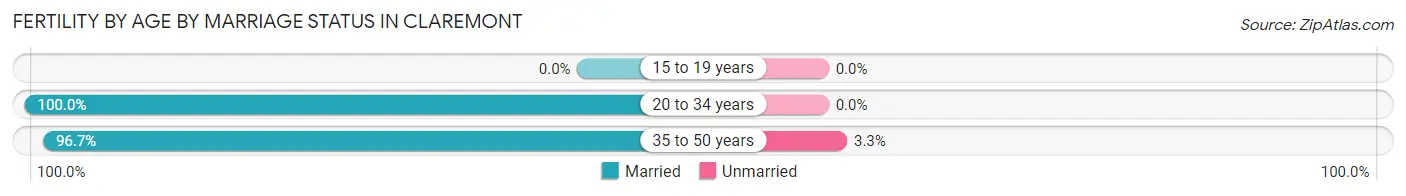
Fertility by Age by Marriage Status in Claremont
99.0% of women with births (291) in Claremont are married. The highest percentage of unmarried women with births falls into 35 to 50 years age bracket with 3.3% of them unmarried at the time of birth, while the lowest percentage of unmarried women with births belong to 20 to 34 years age bracket with 0.0% of them unmarried.
| Age Bracket | Married | Unmarried |
| 15 to 19 years | 0 (0.0%) | 0 (0.0%) |
| 20 to 34 years | 201 (100.0%) | 0 (0.0%) |
| 35 to 50 years | 87 (96.7%) | 3 (3.3%) |
| Total | 288 (99.0%) | 3 (1.0%) |
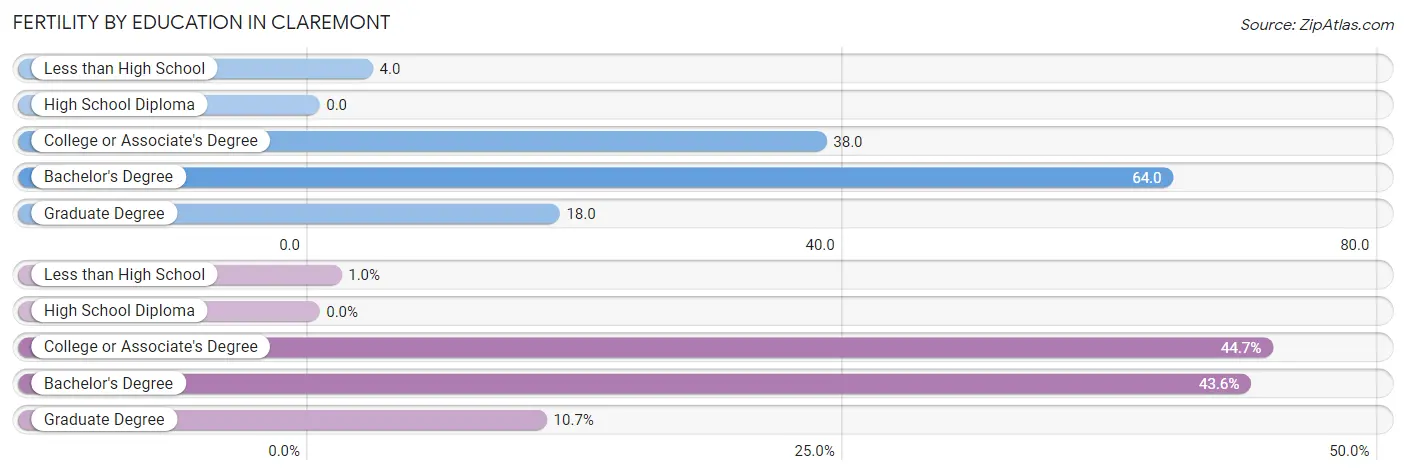
Fertility by Education in Claremont
| Educational Attainment | Women with Births | Births / 1,000 Women |
| Less than High School | 3 (1.0%) | 4.0 |
| High School Diploma | 0 (0.0%) | 0.0 |
| College or Associate's Degree | 130 (44.7%) | 38.0 |
| Bachelor's Degree | 127 (43.6%) | 64.0 |
| Graduate Degree | 31 (10.6%) | 18.0 |
| Total | 291 (100.0%) | 32.0 |
Fertility by Education by Marriage Status in Claremont
1.0% of women with births in Claremont are unmarried. Women with the educational attainment of college or associate's degree are most likely to be married with 100.0% of them married at childbirth, while women with the educational attainment of less than high school are least likely to be married with 100.0% of them unmarried at childbirth.
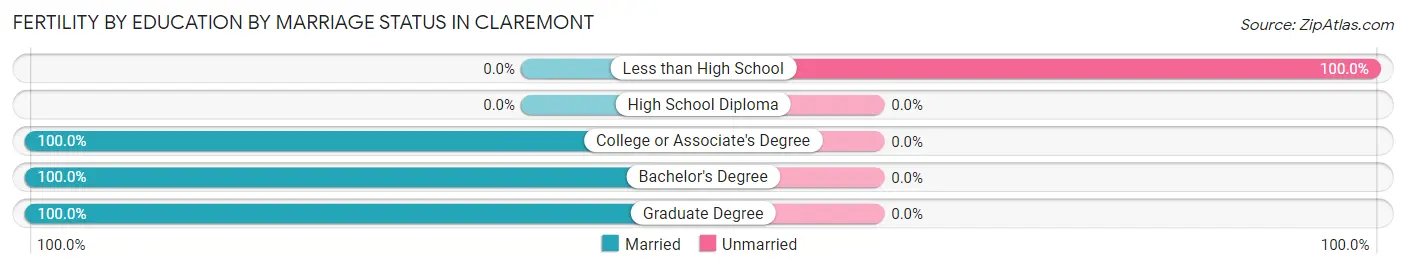
| Educational Attainment | Married | Unmarried |
| Less than High School | 0 (0.0%) | 3 (100.0%) |
| High School Diploma | 0 (0.0%) | 0 (0.0%) |
| College or Associate's Degree | 130 (100.0%) | 0 (0.0%) |
| Bachelor's Degree | 127 (100.0%) | 0 (0.0%) |
| Graduate Degree | 31 (100.0%) | 0 (0.0%) |
| Total | 288 (99.0%) | 3 (1.0%) |
Employment Characteristics in Claremont
Employment by Class of Employer in Claremont
Among the 16,987 employed individuals in Claremont, private company employees (8,852 | 52.1%), not-for-profit organizations (2,619 | 15.4%), and local government employees (1,839 | 10.8%) make up the most common classes of employment.
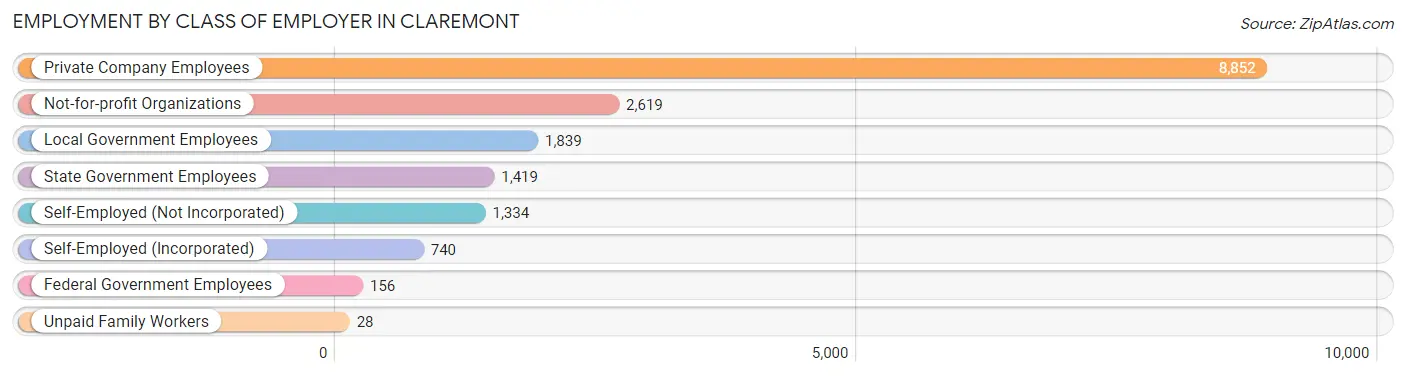
| Employer Class | # Employees | % Employees |
| Private Company Employees | 8,852 | 52.1% |
| Self-Employed (Incorporated) | 740 | 4.4% |
| Self-Employed (Not Incorporated) | 1,334 | 7.9% |
| Not-for-profit Organizations | 2,619 | 15.4% |
| Local Government Employees | 1,839 | 10.8% |
| State Government Employees | 1,419 | 8.4% |
| Federal Government Employees | 156 | 0.9% |
| Unpaid Family Workers | 28 | 0.2% |
| Total | 16,987 | 100.0% |
Employment Status by Age in Claremont
According to the labor force statistics for Claremont, out of the total population over 16 years of age (31,542), 58.3% or 18,389 individuals are in the labor force, with 5.6% or 1,030 of them unemployed. The age group with the highest labor force participation rate is 35 to 44 years, with 90.1% or 3,435 individuals in the labor force. Within the labor force, the 16 to 19 years age range has the highest percentage of unemployed individuals, with 19.2% or 218 of them being unemployed.
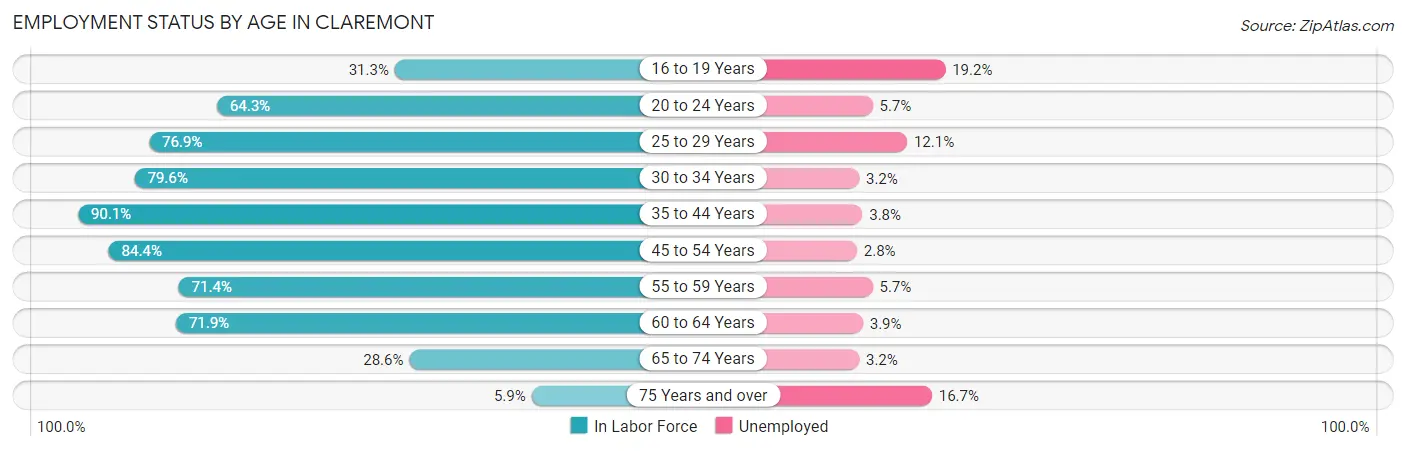
| Age Bracket | In Labor Force | Unemployed |
| 16 to 19 Years | 1,134 (31.3%) | 218 (19.2%) |
| 20 to 24 Years | 2,085 (64.3%) | 119 (5.7%) |
| 25 to 29 Years | 1,451 (76.9%) | 176 (12.1%) |
| 30 to 34 Years | 1,514 (79.6%) | 48 (3.2%) |
| 35 to 44 Years | 3,435 (90.1%) | 131 (3.8%) |
| 45 to 54 Years | 4,181 (84.4%) | 117 (2.8%) |
| 55 to 59 Years | 1,564 (71.4%) | 89 (5.7%) |
| 60 to 64 Years | 1,705 (71.9%) | 66 (3.9%) |
| 65 to 74 Years | 1,095 (28.6%) | 35 (3.2%) |
| 75 Years and over | 220 (5.9%) | 37 (16.7%) |
| Total | 18,389 (58.3%) | 1,030 (5.6%) |
Employment Status by Educational Attainment in Claremont
According to labor force statistics for Claremont, 80.9% of individuals (13,848) out of the total population between 25 and 64 years of age (17,117) are in the labor force, with 4.5% or 623 of them being unemployed. The group with the highest labor force participation rate are those with the educational attainment of bachelor's degree or higher, with 83.5% or 8,236 individuals in the labor force. Within the labor force, individuals with high school diploma education have the highest percentage of unemployment, with 9.3% or 130 of them being unemployed.
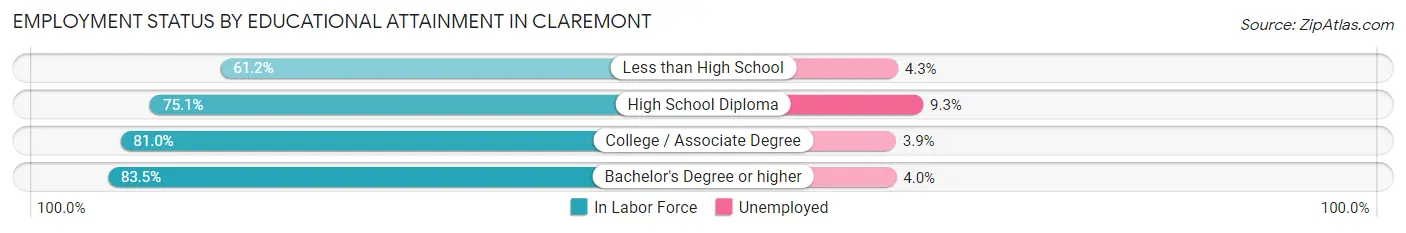
| Educational Attainment | In Labor Force | Unemployed |
| Less than High School | 442 (61.2%) | 31 (4.3%) |
| High School Diploma | 1,403 (75.1%) | 174 (9.3%) |
| College / Associate Degree | 3,778 (81.0%) | 182 (3.9%) |
| Bachelor's Degree or higher | 8,236 (83.5%) | 395 (4.0%) |
| Total | 13,848 (80.9%) | 770 (4.5%) |
Employment Occupations by Sex in Claremont
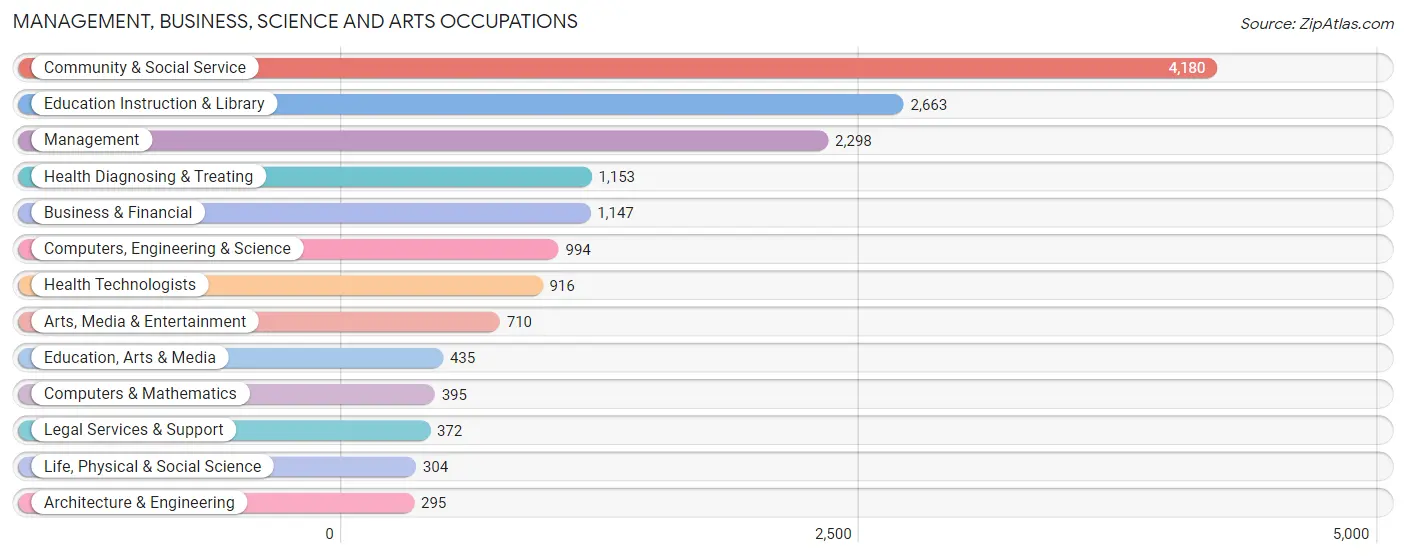
Management, Business, Science and Arts Occupations
The most common Management, Business, Science and Arts occupations in Claremont are Community & Social Service (4,180 | 24.1%), Education Instruction & Library (2,663 | 15.4%), Management (2,298 | 13.3%), Health Diagnosing & Treating (1,153 | 6.7%), and Business & Financial (1,147 | 6.6%).
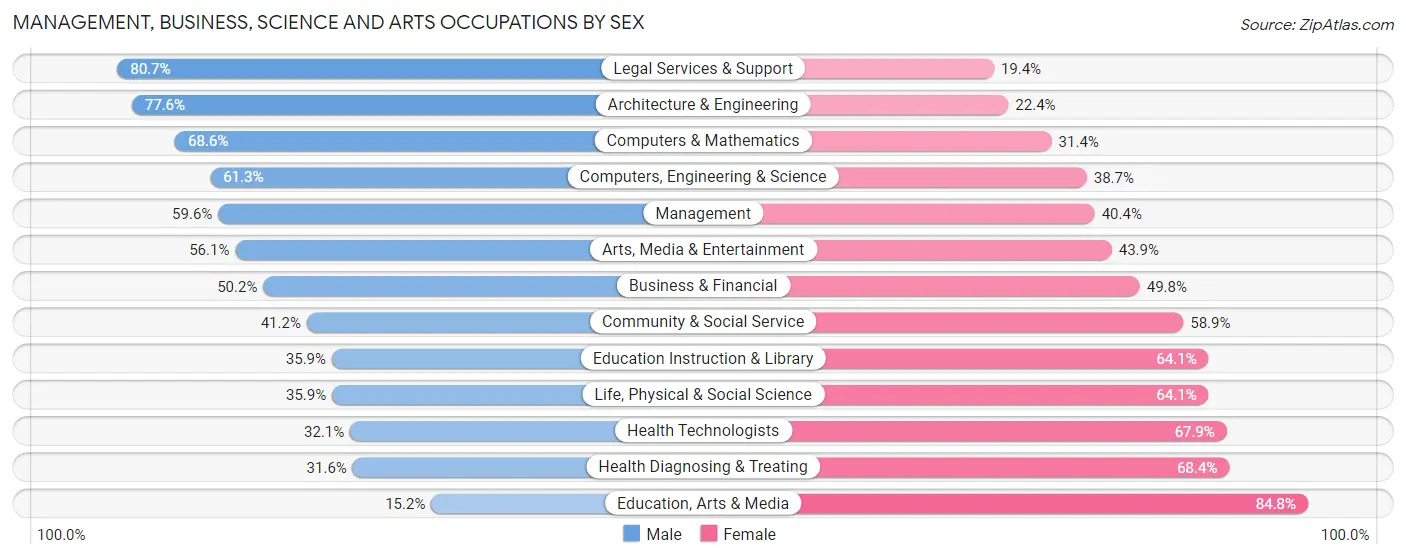
Management, Business, Science and Arts Occupations by Sex
Within the Management, Business, Science and Arts occupations in Claremont, the most male-oriented occupations are Legal Services & Support (80.6%), Architecture & Engineering (77.6%), and Computers & Mathematics (68.6%), while the most female-oriented occupations are Education, Arts & Media (84.8%), Health Diagnosing & Treating (68.4%), and Health Technologists (67.9%).
| Occupation | Male | Female |
| Management | 1,370 (59.6%) | 928 (40.4%) |
| Business & Financial | 576 (50.2%) | 571 (49.8%) |
| Computers, Engineering & Science | 609 (61.3%) | 385 (38.7%) |
| Computers & Mathematics | 271 (68.6%) | 124 (31.4%) |
| Architecture & Engineering | 229 (77.6%) | 66 (22.4%) |
| Life, Physical & Social Science | 109 (35.9%) | 195 (64.1%) |
| Community & Social Service | 1,720 (41.1%) | 2,460 (58.9%) |
| Education, Arts & Media | 66 (15.2%) | 369 (84.8%) |
| Legal Services & Support | 300 (80.6%) | 72 (19.4%) |
| Education Instruction & Library | 956 (35.9%) | 1,707 (64.1%) |
| Arts, Media & Entertainment | 398 (56.1%) | 312 (43.9%) |
| Health Diagnosing & Treating | 364 (31.6%) | 789 (68.4%) |
| Health Technologists | 294 (32.1%) | 622 (67.9%) |
| Total (Category) | 4,639 (47.5%) | 5,133 (52.5%) |
| Total (Overall) | 8,873 (51.2%) | 8,451 (48.8%) |
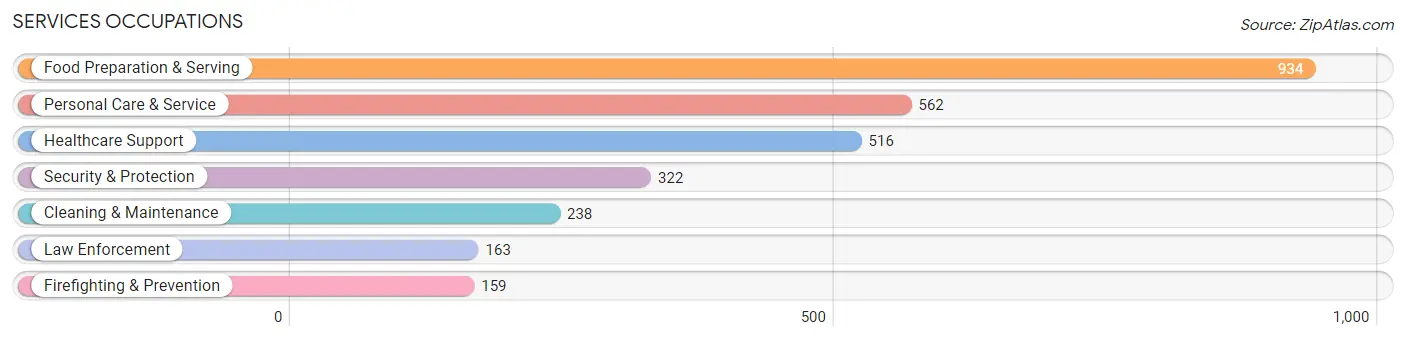
Services Occupations
The most common Services occupations in Claremont are Food Preparation & Serving (934 | 5.4%), Personal Care & Service (562 | 3.2%), Healthcare Support (516 | 3.0%), Security & Protection (322 | 1.9%), and Cleaning & Maintenance (238 | 1.4%).
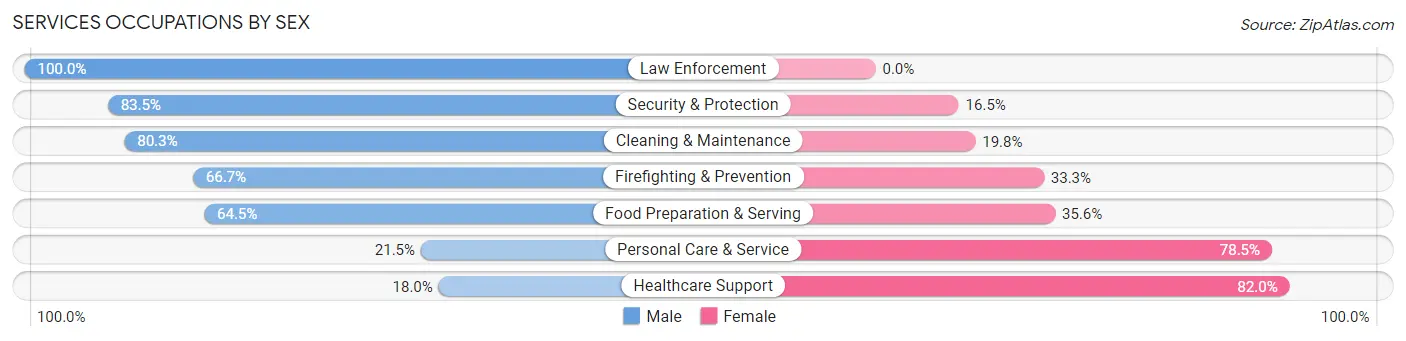
Services Occupations by Sex
Within the Services occupations in Claremont, the most male-oriented occupations are Law Enforcement (100.0%), Security & Protection (83.5%), and Cleaning & Maintenance (80.2%), while the most female-oriented occupations are Healthcare Support (82.0%), Personal Care & Service (78.5%), and Food Preparation & Serving (35.5%).
| Occupation | Male | Female |
| Healthcare Support | 93 (18.0%) | 423 (82.0%) |
| Security & Protection | 269 (83.5%) | 53 (16.5%) |
| Firefighting & Prevention | 106 (66.7%) | 53 (33.3%) |
| Law Enforcement | 163 (100.0%) | 0 (0.0%) |
| Food Preparation & Serving | 602 (64.4%) | 332 (35.5%) |
| Cleaning & Maintenance | 191 (80.2%) | 47 (19.8%) |
| Personal Care & Service | 121 (21.5%) | 441 (78.5%) |
| Total (Category) | 1,276 (49.6%) | 1,296 (50.4%) |
| Total (Overall) | 8,873 (51.2%) | 8,451 (48.8%) |
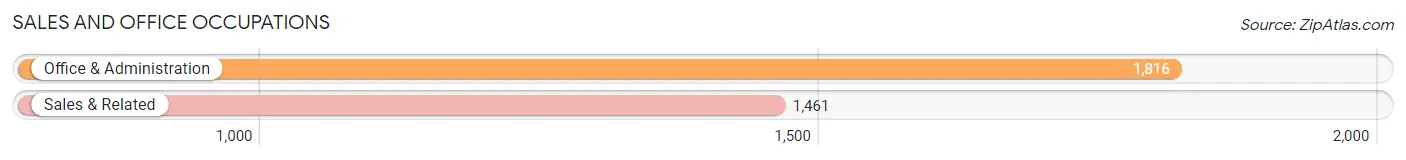
Sales and Office Occupations
The most common Sales and Office occupations in Claremont are Office & Administration (1,816 | 10.5%), and Sales & Related (1,461 | 8.4%).
Sales and Office Occupations by Sex
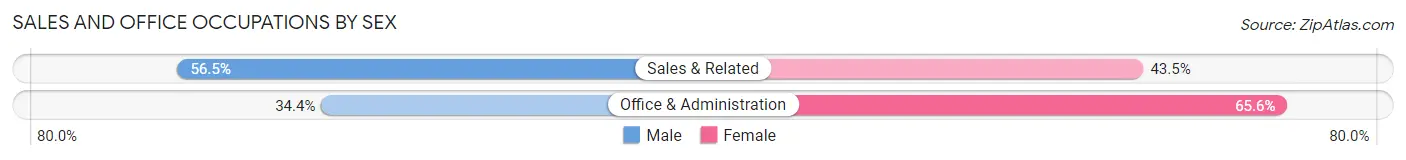
| Occupation | Male | Female |
| Sales & Related | 825 (56.5%) | 636 (43.5%) |
| Office & Administration | 624 (34.4%) | 1,192 (65.6%) |
| Total (Category) | 1,449 (44.2%) | 1,828 (55.8%) |
| Total (Overall) | 8,873 (51.2%) | 8,451 (48.8%) |
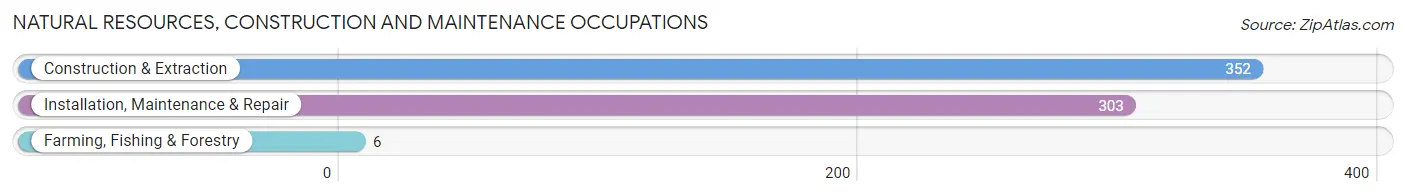
Natural Resources, Construction and Maintenance Occupations
The most common Natural Resources, Construction and Maintenance occupations in Claremont are Construction & Extraction (352 | 2.0%), Installation, Maintenance & Repair (303 | 1.8%), and Farming, Fishing & Forestry (6 | 0.0%).
Natural Resources, Construction and Maintenance Occupations by Sex
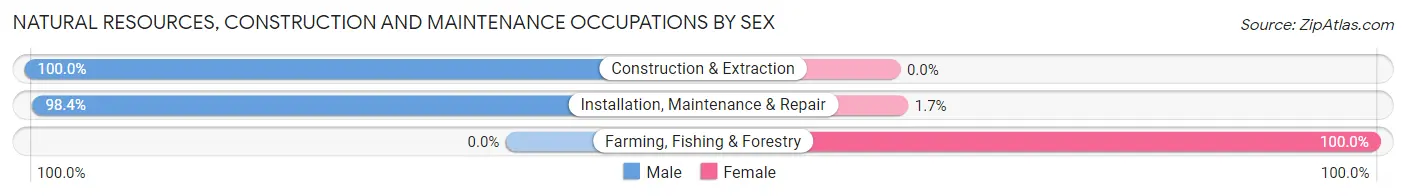
| Occupation | Male | Female |
| Farming, Fishing & Forestry | 0 (0.0%) | 6 (100.0%) |
| Construction & Extraction | 352 (100.0%) | 0 (0.0%) |
| Installation, Maintenance & Repair | 298 (98.4%) | 5 (1.7%) |
| Total (Category) | 650 (98.3%) | 11 (1.7%) |
| Total (Overall) | 8,873 (51.2%) | 8,451 (48.8%) |
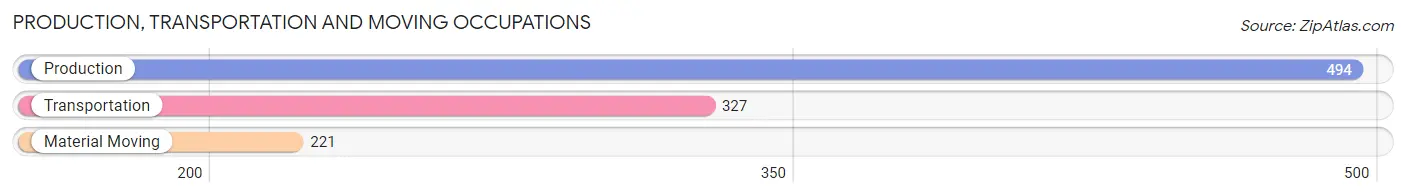
Production, Transportation and Moving Occupations
The most common Production, Transportation and Moving occupations in Claremont are Production (494 | 2.9%), Transportation (327 | 1.9%), and Material Moving (221 | 1.3%).
Production, Transportation and Moving Occupations by Sex
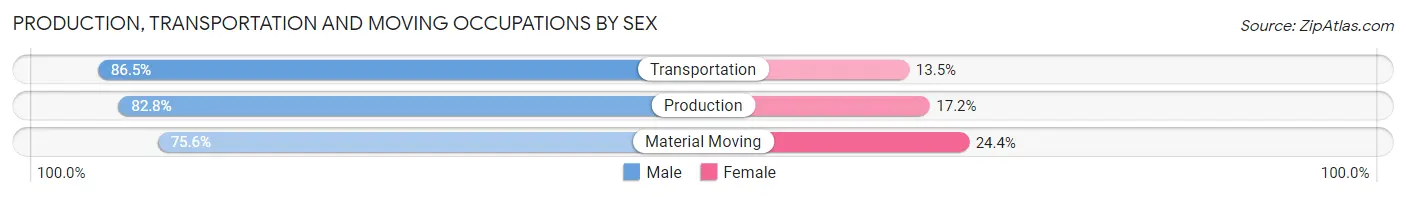
| Occupation | Male | Female |
| Production | 409 (82.8%) | 85 (17.2%) |
| Transportation | 283 (86.5%) | 44 (13.5%) |
| Material Moving | 167 (75.6%) | 54 (24.4%) |
| Total (Category) | 859 (82.4%) | 183 (17.6%) |
| Total (Overall) | 8,873 (51.2%) | 8,451 (48.8%) |
Employment Industries by Sex in Claremont
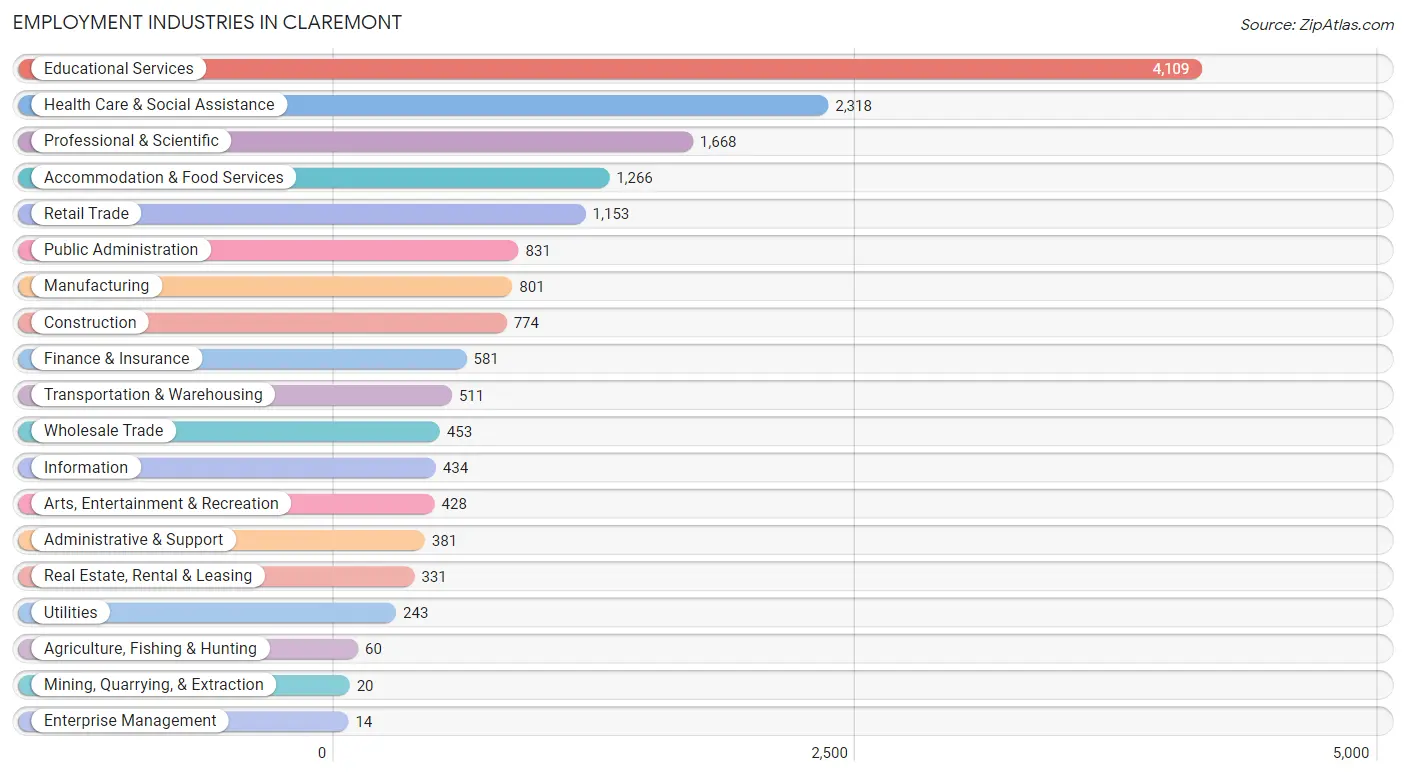
Employment Industries in Claremont
The major employment industries in Claremont include Educational Services (4,109 | 23.7%), Health Care & Social Assistance (2,318 | 13.4%), Professional & Scientific (1,668 | 9.6%), Accommodation & Food Services (1,266 | 7.3%), and Retail Trade (1,153 | 6.7%).
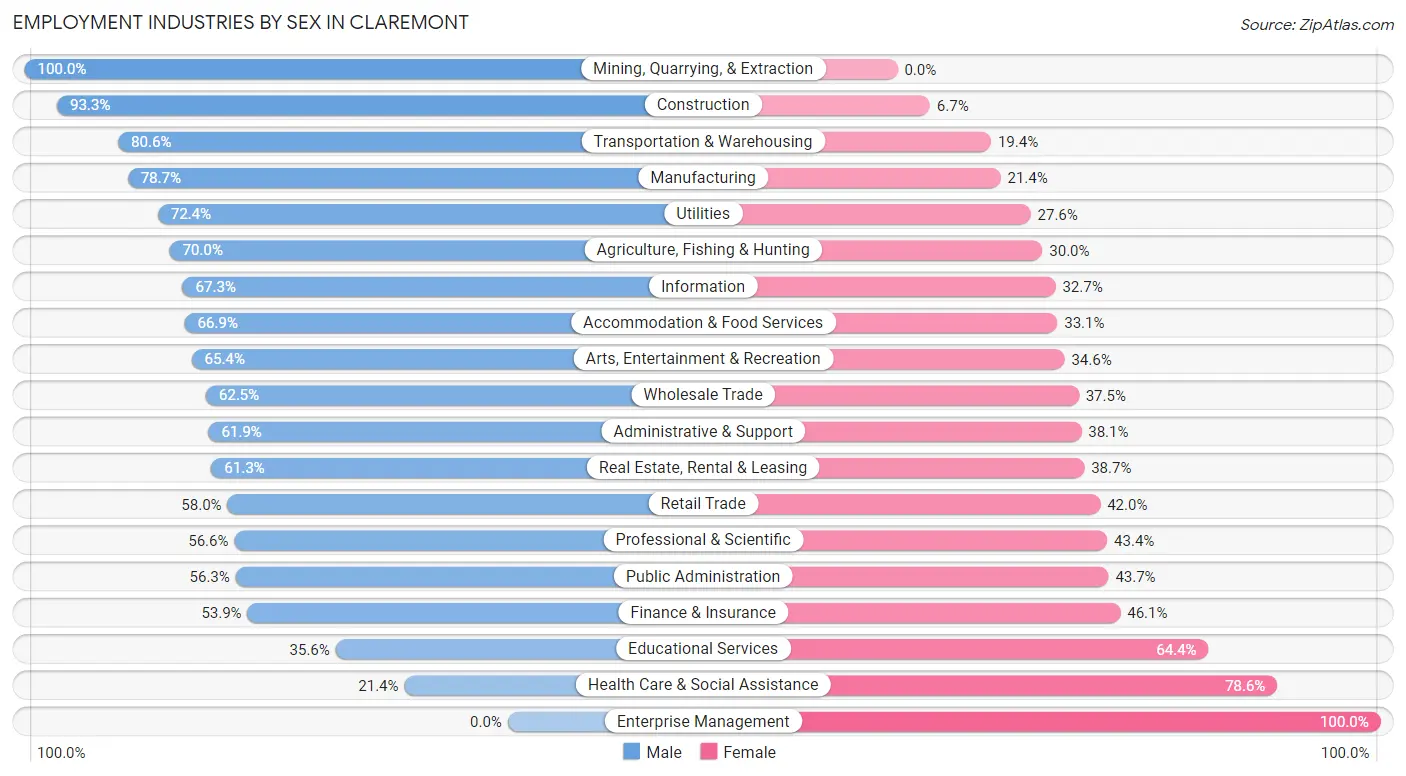
Employment Industries by Sex in Claremont
The Claremont industries that see more men than women are Mining, Quarrying, & Extraction (100.0%), Construction (93.3%), and Transportation & Warehousing (80.6%), whereas the industries that tend to have a higher number of women are Enterprise Management (100.0%), Health Care & Social Assistance (78.6%), and Educational Services (64.4%).
| Industry | Male | Female |
| Agriculture, Fishing & Hunting | 42 (70.0%) | 18 (30.0%) |
| Mining, Quarrying, & Extraction | 20 (100.0%) | 0 (0.0%) |
| Construction | 722 (93.3%) | 52 (6.7%) |
| Manufacturing | 630 (78.6%) | 171 (21.3%) |
| Wholesale Trade | 283 (62.5%) | 170 (37.5%) |
| Retail Trade | 669 (58.0%) | 484 (42.0%) |
| Transportation & Warehousing | 412 (80.6%) | 99 (19.4%) |
| Utilities | 176 (72.4%) | 67 (27.6%) |
| Information | 292 (67.3%) | 142 (32.7%) |
| Finance & Insurance | 313 (53.9%) | 268 (46.1%) |
| Real Estate, Rental & Leasing | 203 (61.3%) | 128 (38.7%) |
| Professional & Scientific | 944 (56.6%) | 724 (43.4%) |
| Enterprise Management | 0 (0.0%) | 14 (100.0%) |
| Administrative & Support | 236 (61.9%) | 145 (38.1%) |
| Educational Services | 1,464 (35.6%) | 2,645 (64.4%) |
| Health Care & Social Assistance | 496 (21.4%) | 1,822 (78.6%) |
| Arts, Entertainment & Recreation | 280 (65.4%) | 148 (34.6%) |
| Accommodation & Food Services | 847 (66.9%) | 419 (33.1%) |
| Public Administration | 468 (56.3%) | 363 (43.7%) |
| Total | 8,873 (51.2%) | 8,451 (48.8%) |
Education in Claremont
School Enrollment in Claremont
The most common levels of schooling among the 12,434 students in Claremont are college / undergraduate (5,681 | 45.7%), middle school (1,748 | 14.1%), and high school (1,513 | 12.2%).
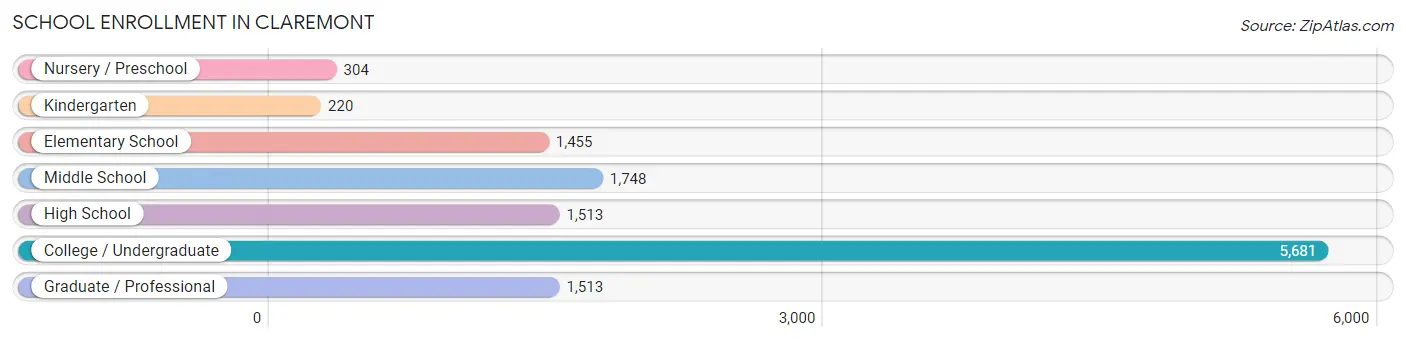
| School Level | # Students | % Students |
| Nursery / Preschool | 304 | 2.4% |
| Kindergarten | 220 | 1.8% |
| Elementary School | 1,455 | 11.7% |
| Middle School | 1,748 | 14.1% |
| High School | 1,513 | 12.2% |
| College / Undergraduate | 5,681 | 45.7% |
| Graduate / Professional | 1,513 | 12.2% |
| Total | 12,434 | 100.0% |
School Enrollment by Age by Funding Source in Claremont
Out of a total of 12,434 students who are enrolled in schools in Claremont, 5,011 (40.3%) attend a private institution, while the remaining 7,423 (59.7%) are enrolled in public schools. The age group of 3 to 4 year olds has the highest likelihood of being enrolled in private schools, with 186 (80.5% in the age bracket) enrolled. Conversely, the age group of 15 to 17 year olds has the lowest likelihood of being enrolled in a private school, with 1,053 (86.0% in the age bracket) attending a public institution.
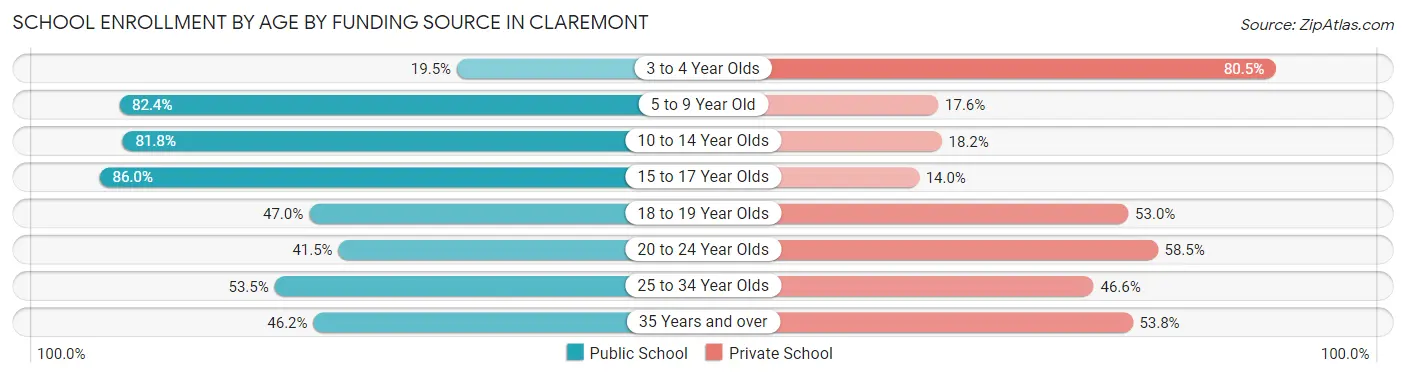
| Age Bracket | Public School | Private School |
| 3 to 4 Year Olds | 45 (19.5%) | 186 (80.5%) |
| 5 to 9 Year Old | 1,232 (82.4%) | 263 (17.6%) |
| 10 to 14 Year Olds | 1,717 (81.8%) | 383 (18.2%) |
| 15 to 17 Year Olds | 1,053 (86.0%) | 171 (14.0%) |
| 18 to 19 Year Olds | 1,314 (47.0%) | 1,481 (53.0%) |
| 20 to 24 Year Olds | 1,082 (41.5%) | 1,523 (58.5%) |
| 25 to 34 Year Olds | 511 (53.4%) | 445 (46.6%) |
| 35 Years and over | 475 (46.2%) | 553 (53.8%) |
| Total | 7,423 (59.7%) | 5,011 (40.3%) |
Educational Attainment by Field of Study in Claremont
Business (2,632 | 16.8%), social sciences (1,884 | 12.0%), literature & languages (1,341 | 8.5%), bio, nature & agricultural (1,214 | 7.7%), and psychology (1,185 | 7.5%) are the most common fields of study among 15,706 individuals in Claremont who have obtained a bachelor's degree or higher.
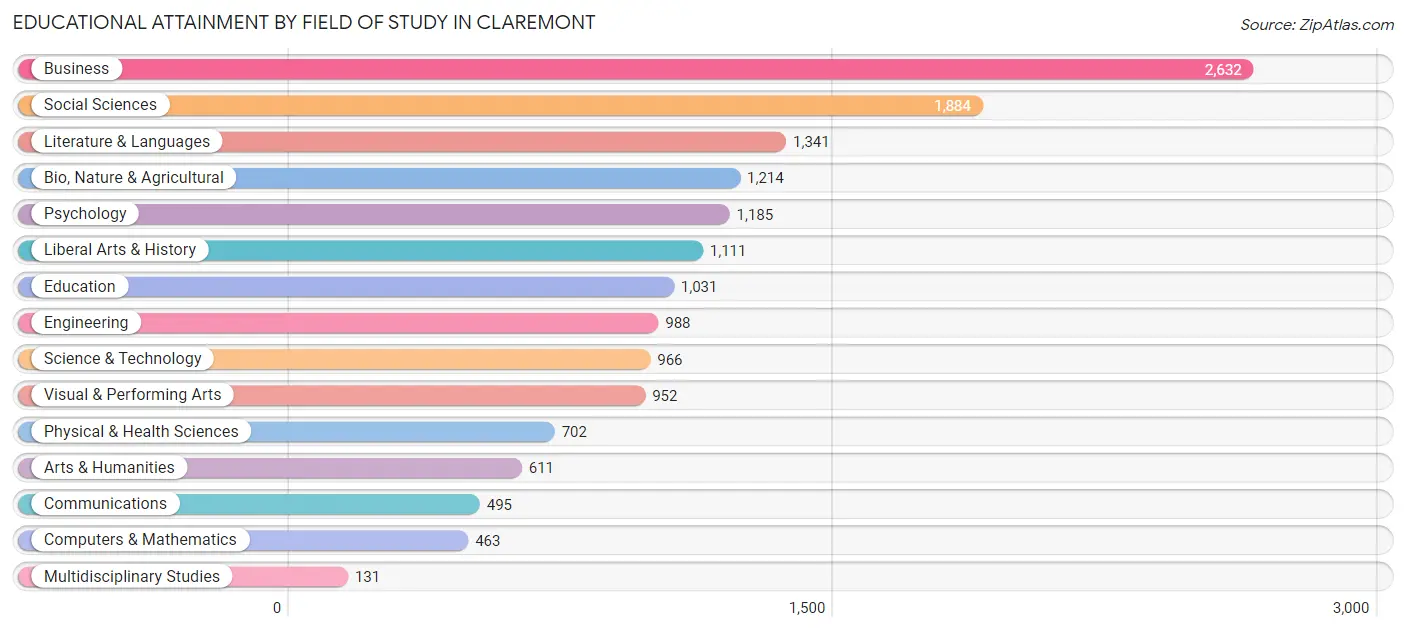
| Field of Study | # Graduates | % Graduates |
| Computers & Mathematics | 463 | 2.9% |
| Bio, Nature & Agricultural | 1,214 | 7.7% |
| Physical & Health Sciences | 702 | 4.5% |
| Psychology | 1,185 | 7.5% |
| Social Sciences | 1,884 | 12.0% |
| Engineering | 988 | 6.3% |
| Multidisciplinary Studies | 131 | 0.8% |
| Science & Technology | 966 | 6.1% |
| Business | 2,632 | 16.8% |
| Education | 1,031 | 6.6% |
| Literature & Languages | 1,341 | 8.5% |
| Liberal Arts & History | 1,111 | 7.1% |
| Visual & Performing Arts | 952 | 6.1% |
| Communications | 495 | 3.2% |
| Arts & Humanities | 611 | 3.9% |
| Total | 15,706 | 100.0% |
Transportation & Commute in Claremont
Vehicle Availability by Sex in Claremont
The most prevalent vehicle ownership categories in Claremont are males with 2 vehicles (3,510, accounting for 42.6%) and females with 2 vehicles (2,871, making up 48.8%).
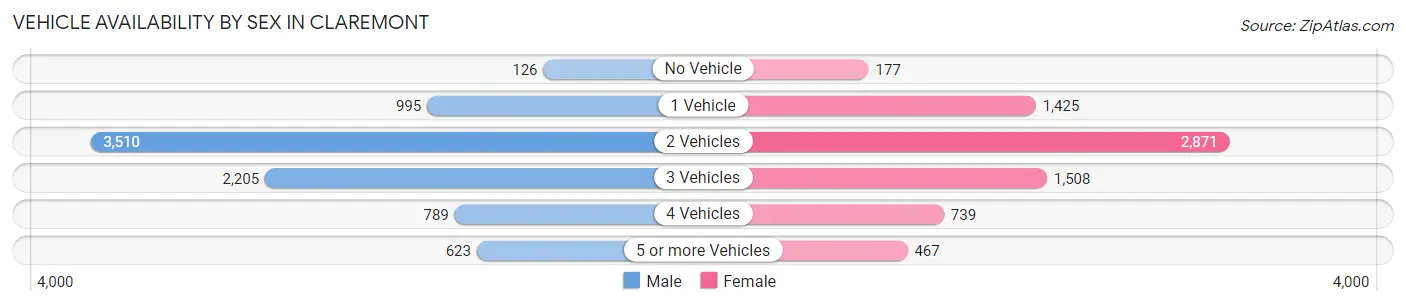
| Vehicles Available | Male | Female |
| No Vehicle | 126 (1.5%) | 177 (2.5%) |
| 1 Vehicle | 995 (12.1%) | 1,425 (19.8%) |
| 2 Vehicles | 3,510 (42.6%) | 2,871 (40.0%) |
| 3 Vehicles | 2,205 (26.7%) | 1,508 (21.0%) |
| 4 Vehicles | 789 (9.6%) | 739 (10.3%) |
| 5 or more Vehicles | 623 (7.5%) | 467 (6.5%) |
| Total | 8,248 (100.0%) | 7,187 (100.0%) |
Commute Time in Claremont
The most frequently occuring commute durations in Claremont are 15 to 19 minutes (1,971 commuters, 14.8%), 30 to 34 minutes (1,888 commuters, 14.1%), and 5 to 9 minutes (1,839 commuters, 13.8%).
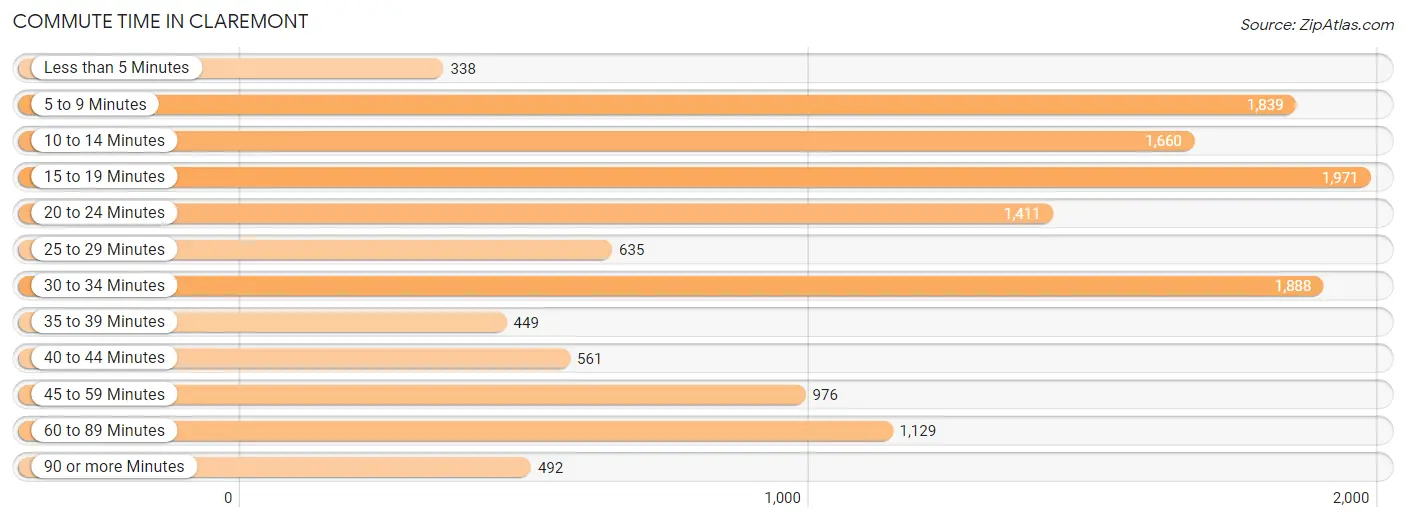
| Commute Time | # Commuters | % Commuters |
| Less than 5 Minutes | 338 | 2.5% |
| 5 to 9 Minutes | 1,839 | 13.8% |
| 10 to 14 Minutes | 1,660 | 12.4% |
| 15 to 19 Minutes | 1,971 | 14.8% |
| 20 to 24 Minutes | 1,411 | 10.6% |
| 25 to 29 Minutes | 635 | 4.8% |
| 30 to 34 Minutes | 1,888 | 14.1% |
| 35 to 39 Minutes | 449 | 3.4% |
| 40 to 44 Minutes | 561 | 4.2% |
| 45 to 59 Minutes | 976 | 7.3% |
| 60 to 89 Minutes | 1,129 | 8.5% |
| 90 or more Minutes | 492 | 3.7% |
Commute Time by Sex in Claremont
The most common commute times in Claremont are 15 to 19 minutes (1,136 commuters, 16.4%) for males and 30 to 34 minutes (1,000 commuters, 15.5%) for females.
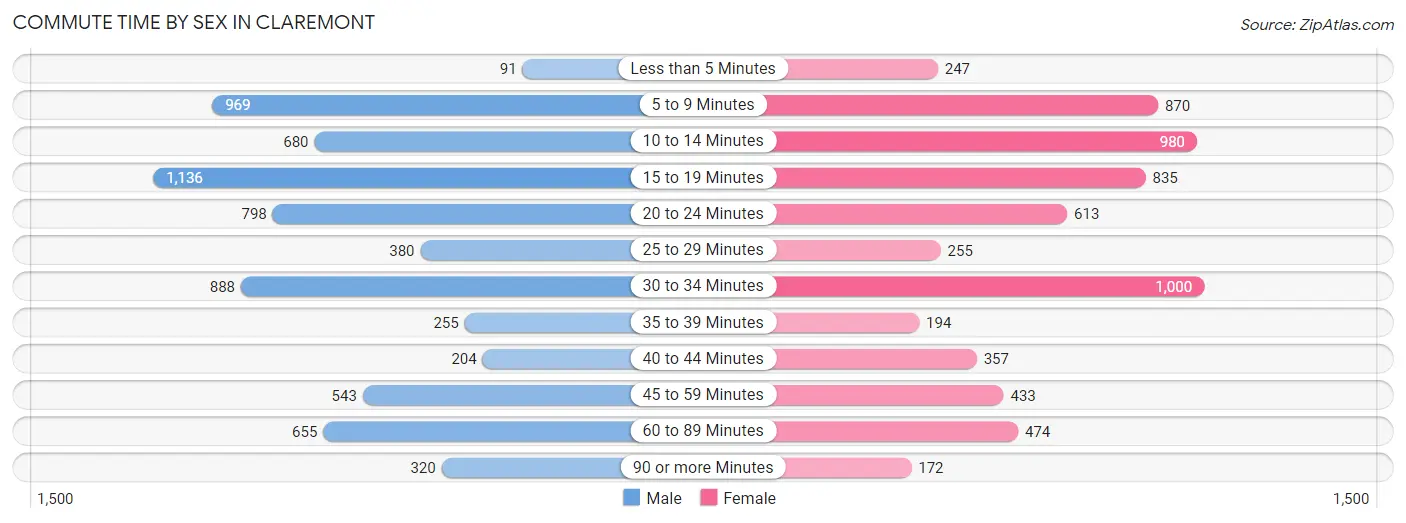
| Commute Time | Male | Female |
| Less than 5 Minutes | 91 (1.3%) | 247 (3.8%) |
| 5 to 9 Minutes | 969 (14.0%) | 870 (13.5%) |
| 10 to 14 Minutes | 680 (9.8%) | 980 (15.2%) |
| 15 to 19 Minutes | 1,136 (16.4%) | 835 (13.0%) |
| 20 to 24 Minutes | 798 (11.5%) | 613 (9.5%) |
| 25 to 29 Minutes | 380 (5.5%) | 255 (4.0%) |
| 30 to 34 Minutes | 888 (12.8%) | 1,000 (15.5%) |
| 35 to 39 Minutes | 255 (3.7%) | 194 (3.0%) |
| 40 to 44 Minutes | 204 (2.9%) | 357 (5.6%) |
| 45 to 59 Minutes | 543 (7.9%) | 433 (6.7%) |
| 60 to 89 Minutes | 655 (9.5%) | 474 (7.4%) |
| 90 or more Minutes | 320 (4.6%) | 172 (2.7%) |
Time of Departure to Work by Sex in Claremont
The most frequent times of departure to work in Claremont are 8:00 AM to 8:29 AM (793, 11.5%) for males and 7:00 AM to 7:29 AM (848, 13.2%) for females.
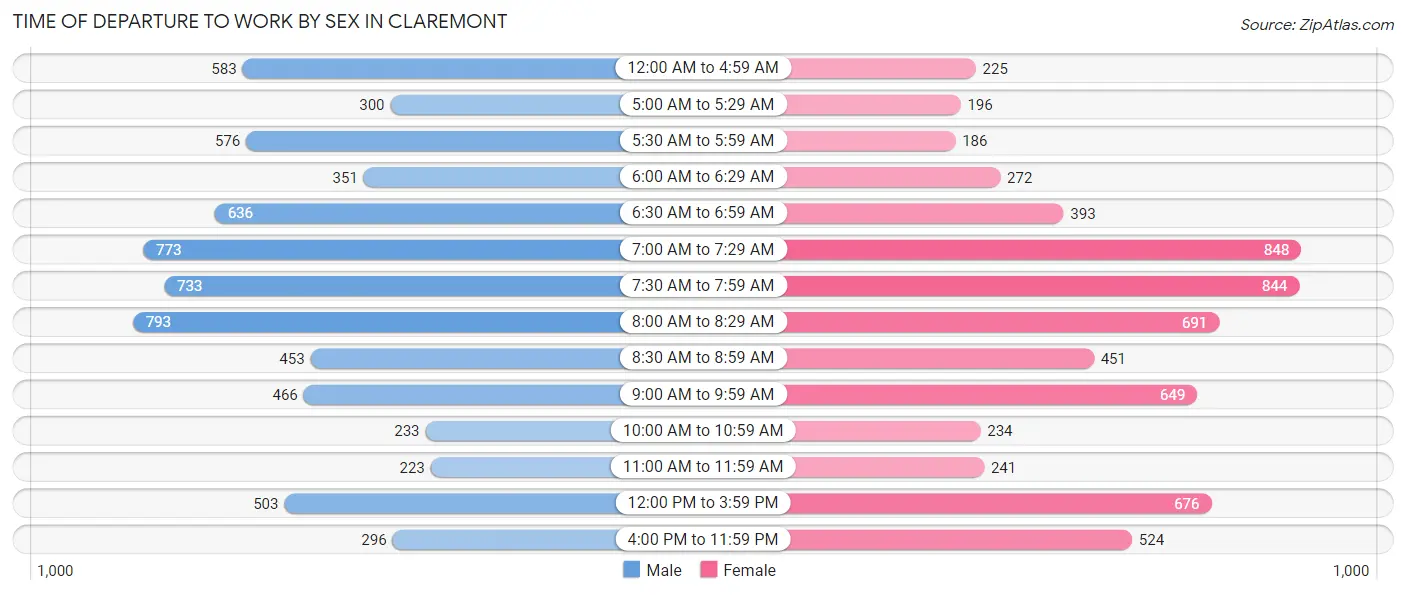
| Time of Departure | Male | Female |
| 12:00 AM to 4:59 AM | 583 (8.4%) | 225 (3.5%) |
| 5:00 AM to 5:29 AM | 300 (4.3%) | 196 (3.0%) |
| 5:30 AM to 5:59 AM | 576 (8.3%) | 186 (2.9%) |
| 6:00 AM to 6:29 AM | 351 (5.1%) | 272 (4.2%) |
| 6:30 AM to 6:59 AM | 636 (9.2%) | 393 (6.1%) |
| 7:00 AM to 7:29 AM | 773 (11.2%) | 848 (13.2%) |
| 7:30 AM to 7:59 AM | 733 (10.6%) | 844 (13.1%) |
| 8:00 AM to 8:29 AM | 793 (11.5%) | 691 (10.7%) |
| 8:30 AM to 8:59 AM | 453 (6.6%) | 451 (7.0%) |
| 9:00 AM to 9:59 AM | 466 (6.7%) | 649 (10.1%) |
| 10:00 AM to 10:59 AM | 233 (3.4%) | 234 (3.6%) |
| 11:00 AM to 11:59 AM | 223 (3.2%) | 241 (3.7%) |
| 12:00 PM to 3:59 PM | 503 (7.3%) | 676 (10.5%) |
| 4:00 PM to 11:59 PM | 296 (4.3%) | 524 (8.2%) |
| Total | 6,919 (100.0%) | 6,430 (100.0%) |
Housing Occupancy in Claremont
Occupancy by Ownership in Claremont
Of the total 12,603 dwellings in Claremont, owner-occupied units account for 8,206 (65.1%), while renter-occupied units make up 4,397 (34.9%).
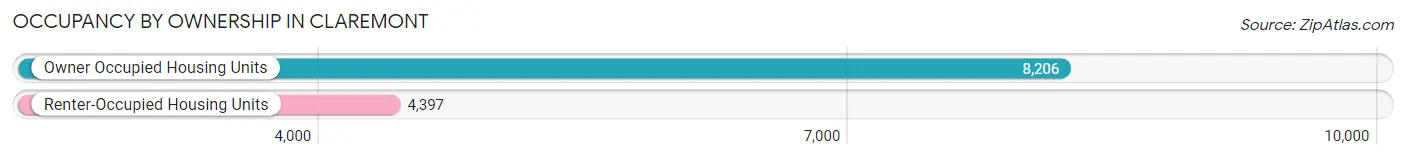
| Occupancy | # Housing Units | % Housing Units |
| Owner Occupied Housing Units | 8,206 | 65.1% |
| Renter-Occupied Housing Units | 4,397 | 34.9% |
| Total Occupied Housing Units | 12,603 | 100.0% |
Occupancy by Household Size in Claremont
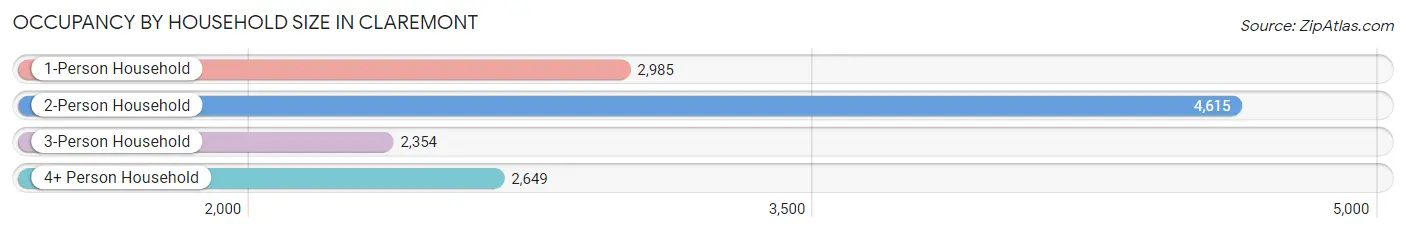
| Household Size | # Housing Units | % Housing Units |
| 1-Person Household | 2,985 | 23.7% |
| 2-Person Household | 4,615 | 36.6% |
| 3-Person Household | 2,354 | 18.7% |
| 4+ Person Household | 2,649 | 21.0% |
| Total Housing Units | 12,603 | 100.0% |
Occupancy by Ownership by Household Size in Claremont
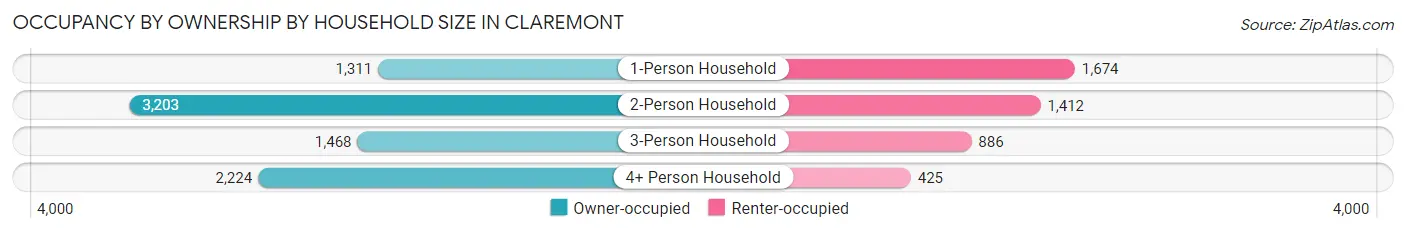
| Household Size | Owner-occupied | Renter-occupied |
| 1-Person Household | 1,311 (43.9%) | 1,674 (56.1%) |
| 2-Person Household | 3,203 (69.4%) | 1,412 (30.6%) |
| 3-Person Household | 1,468 (62.4%) | 886 (37.6%) |
| 4+ Person Household | 2,224 (84.0%) | 425 (16.0%) |
| Total Housing Units | 8,206 (65.1%) | 4,397 (34.9%) |
Occupancy by Educational Attainment in Claremont
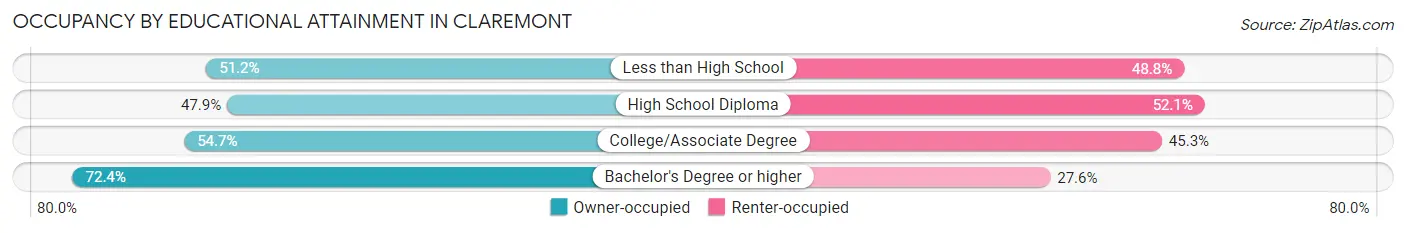
| Household Size | Owner-occupied | Renter-occupied |
| Less than High School | 173 (51.2%) | 165 (48.8%) |
| High School Diploma | 613 (47.9%) | 667 (52.1%) |
| College/Associate Degree | 1,641 (54.7%) | 1,360 (45.3%) |
| Bachelor's Degree or higher | 5,779 (72.4%) | 2,205 (27.6%) |
Occupancy by Age of Householder in Claremont
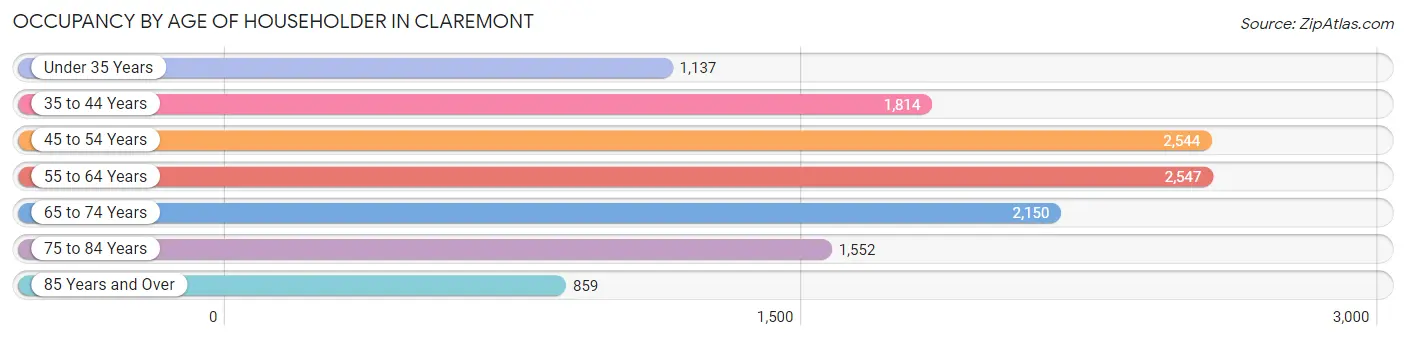
| Age Bracket | # Households | % Households |
| Under 35 Years | 1,137 | 9.0% |
| 35 to 44 Years | 1,814 | 14.4% |
| 45 to 54 Years | 2,544 | 20.2% |
| 55 to 64 Years | 2,547 | 20.2% |
| 65 to 74 Years | 2,150 | 17.1% |
| 75 to 84 Years | 1,552 | 12.3% |
| 85 Years and Over | 859 | 6.8% |
| Total | 12,603 | 100.0% |
Housing Finances in Claremont
Median Income by Occupancy in Claremont
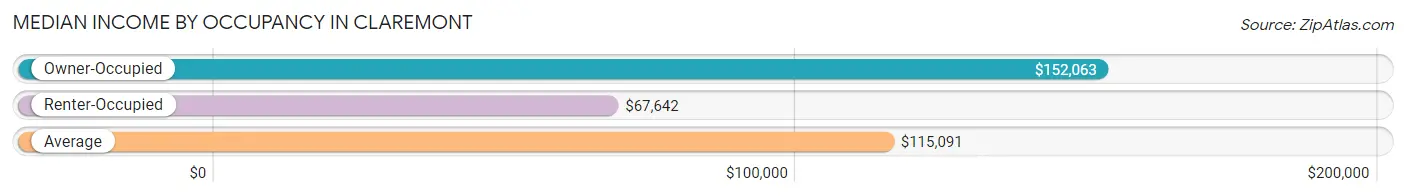
| Occupancy Type | # Households | Median Income |
| Owner-Occupied | 8,206 (65.1%) | $152,063 |
| Renter-Occupied | 4,397 (34.9%) | $67,642 |
| Average | 12,603 (100.0%) | $115,091 |
Occupancy by Householder Income Bracket in Claremont
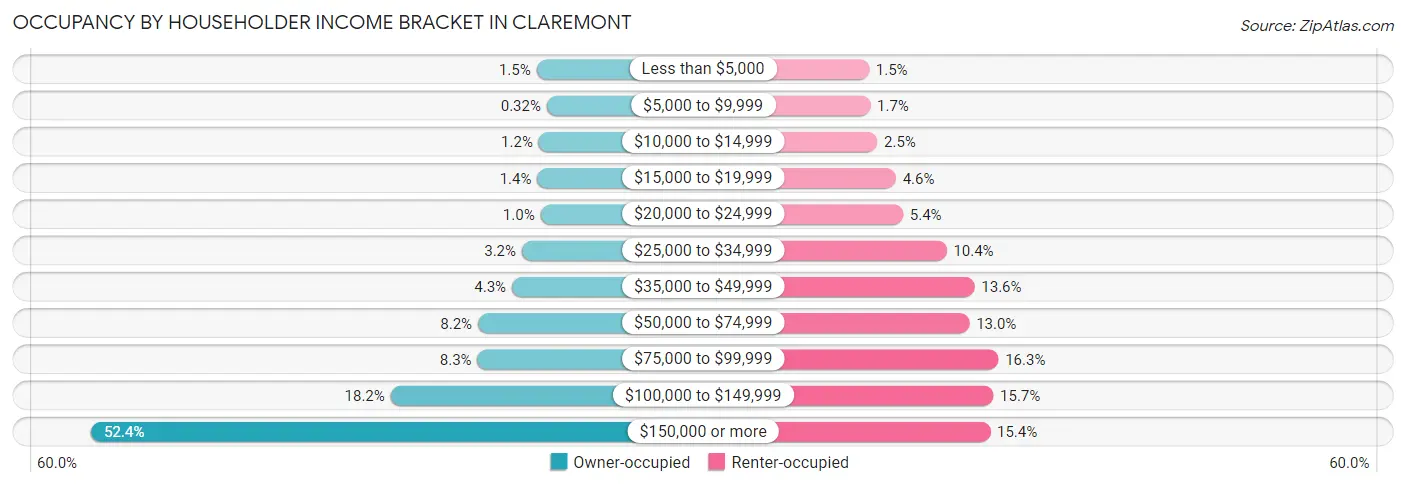
| Income Bracket | Owner-occupied | Renter-occupied |
| Less than $5,000 | 122 (1.5%) | 67 (1.5%) |
| $5,000 to $9,999 | 26 (0.3%) | 73 (1.7%) |
| $10,000 to $14,999 | 102 (1.2%) | 108 (2.5%) |
| $15,000 to $19,999 | 116 (1.4%) | 202 (4.6%) |
| $20,000 to $24,999 | 85 (1.0%) | 238 (5.4%) |
| $25,000 to $34,999 | 260 (3.2%) | 457 (10.4%) |
| $35,000 to $49,999 | 354 (4.3%) | 597 (13.6%) |
| $50,000 to $74,999 | 672 (8.2%) | 571 (13.0%) |
| $75,000 to $99,999 | 677 (8.3%) | 717 (16.3%) |
| $100,000 to $149,999 | 1,491 (18.2%) | 691 (15.7%) |
| $150,000 or more | 4,301 (52.4%) | 676 (15.4%) |
| Total | 8,206 (100.0%) | 4,397 (100.0%) |
Monthly Housing Cost Tiers in Claremont
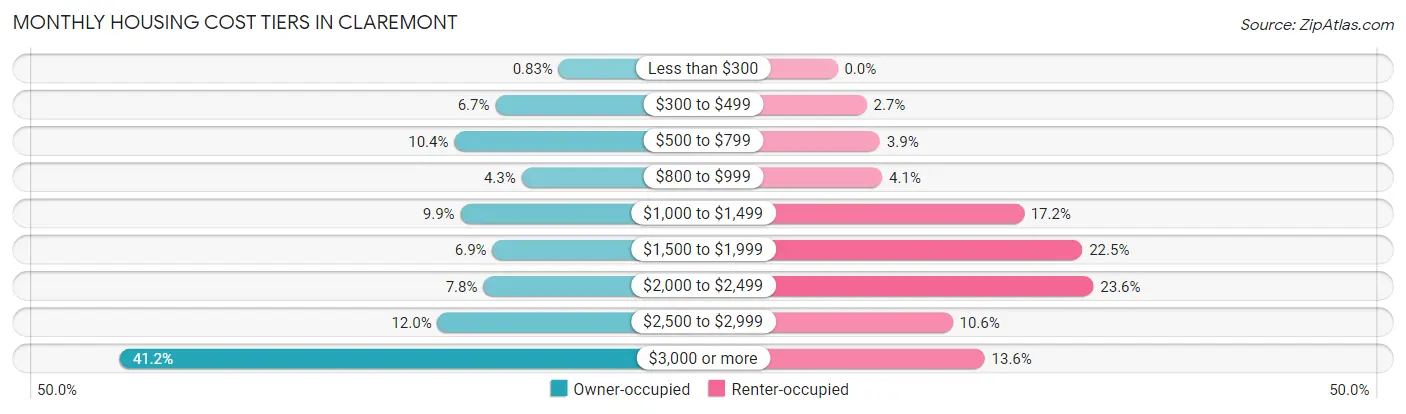
| Monthly Cost | Owner-occupied | Renter-occupied |
| Less than $300 | 68 (0.8%) | 0 (0.0%) |
| $300 to $499 | 547 (6.7%) | 118 (2.7%) |
| $500 to $799 | 857 (10.4%) | 172 (3.9%) |
| $800 to $999 | 349 (4.3%) | 181 (4.1%) |
| $1,000 to $1,499 | 811 (9.9%) | 754 (17.2%) |
| $1,500 to $1,999 | 569 (6.9%) | 991 (22.5%) |
| $2,000 to $2,499 | 638 (7.8%) | 1,036 (23.6%) |
| $2,500 to $2,999 | 984 (12.0%) | 466 (10.6%) |
| $3,000 or more | 3,383 (41.2%) | 596 (13.6%) |
| Total | 8,206 (100.0%) | 4,397 (100.0%) |
Physical Housing Characteristics in Claremont
Housing Structures in Claremont
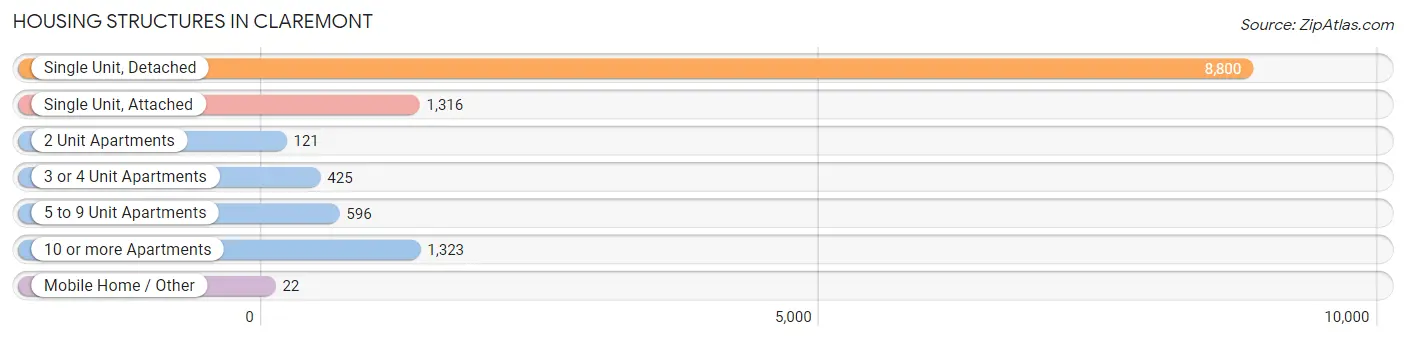
| Structure Type | # Housing Units | % Housing Units |
| Single Unit, Detached | 8,800 | 69.8% |
| Single Unit, Attached | 1,316 | 10.4% |
| 2 Unit Apartments | 121 | 1.0% |
| 3 or 4 Unit Apartments | 425 | 3.4% |
| 5 to 9 Unit Apartments | 596 | 4.7% |
| 10 or more Apartments | 1,323 | 10.5% |
| Mobile Home / Other | 22 | 0.2% |
| Total | 12,603 | 100.0% |
Housing Structures by Occupancy in Claremont
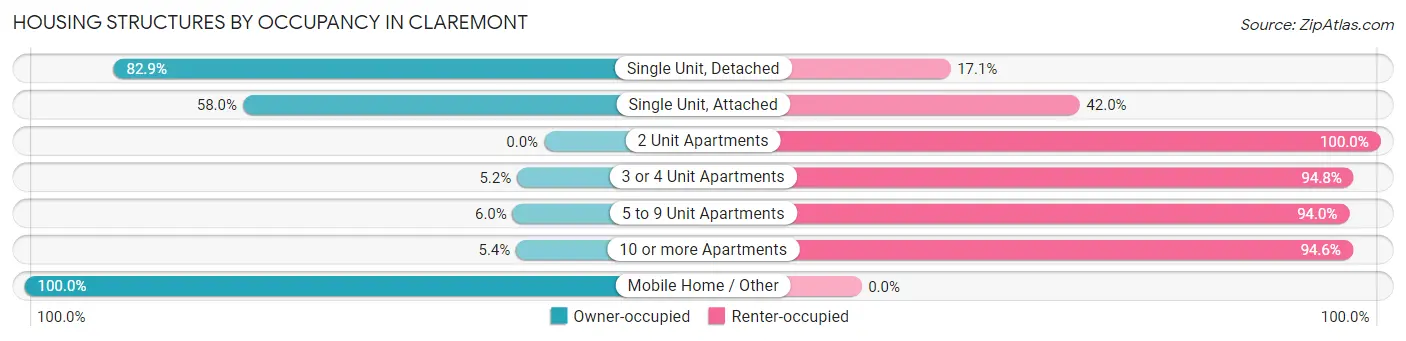
| Structure Type | Owner-occupied | Renter-occupied |
| Single Unit, Detached | 7,292 (82.9%) | 1,508 (17.1%) |
| Single Unit, Attached | 763 (58.0%) | 553 (42.0%) |
| 2 Unit Apartments | 0 (0.0%) | 121 (100.0%) |
| 3 or 4 Unit Apartments | 22 (5.2%) | 403 (94.8%) |
| 5 to 9 Unit Apartments | 36 (6.0%) | 560 (94.0%) |
| 10 or more Apartments | 71 (5.4%) | 1,252 (94.6%) |
| Mobile Home / Other | 22 (100.0%) | 0 (0.0%) |
| Total | 8,206 (65.1%) | 4,397 (34.9%) |
Housing Structures by Number of Rooms in Claremont
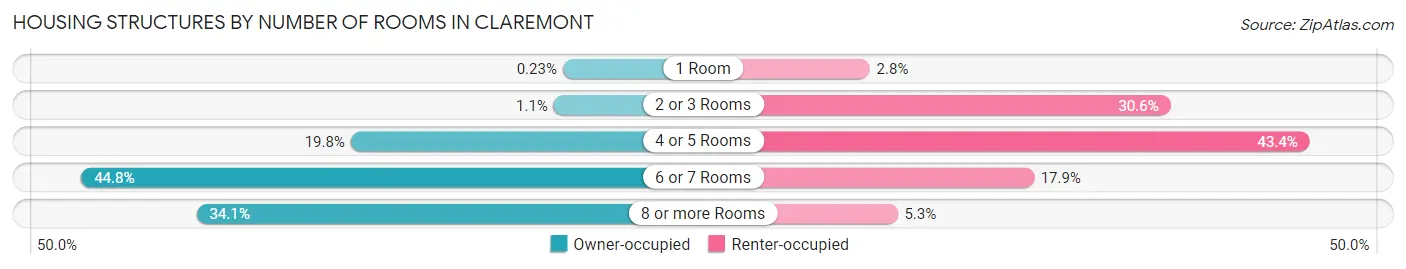
| Number of Rooms | Owner-occupied | Renter-occupied |
| 1 Room | 19 (0.2%) | 121 (2.8%) |
| 2 or 3 Rooms | 88 (1.1%) | 1,344 (30.6%) |
| 4 or 5 Rooms | 1,628 (19.8%) | 1,910 (43.4%) |
| 6 or 7 Rooms | 3,673 (44.8%) | 788 (17.9%) |
| 8 or more Rooms | 2,798 (34.1%) | 234 (5.3%) |
| Total | 8,206 (100.0%) | 4,397 (100.0%) |
Housing Structure by Heating Type in Claremont
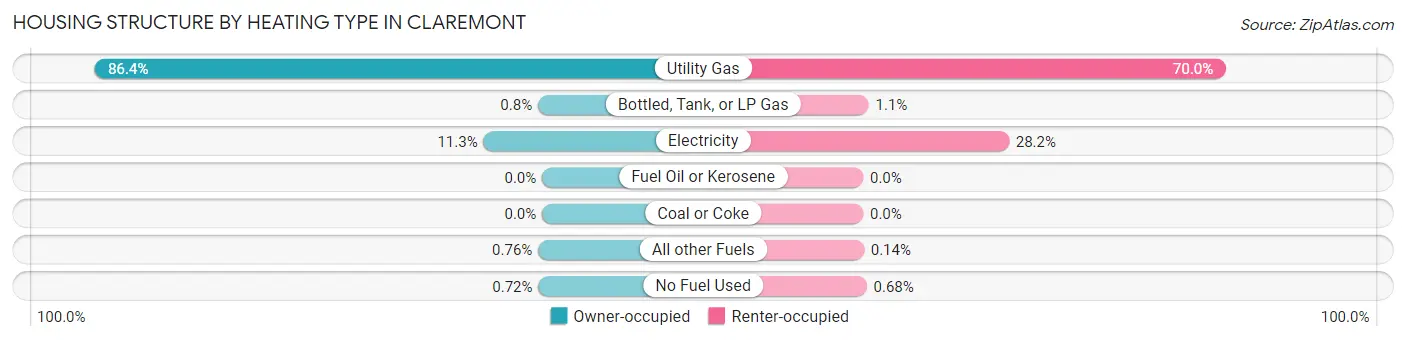
| Heating Type | Owner-occupied | Renter-occupied |
| Utility Gas | 7,089 (86.4%) | 3,076 (70.0%) |
| Bottled, Tank, or LP Gas | 66 (0.8%) | 47 (1.1%) |
| Electricity | 930 (11.3%) | 1,238 (28.2%) |
| Fuel Oil or Kerosene | 0 (0.0%) | 0 (0.0%) |
| Coal or Coke | 0 (0.0%) | 0 (0.0%) |
| All other Fuels | 62 (0.8%) | 6 (0.1%) |
| No Fuel Used | 59 (0.7%) | 30 (0.7%) |
| Total | 8,206 (100.0%) | 4,397 (100.0%) |
Household Vehicle Usage in Claremont
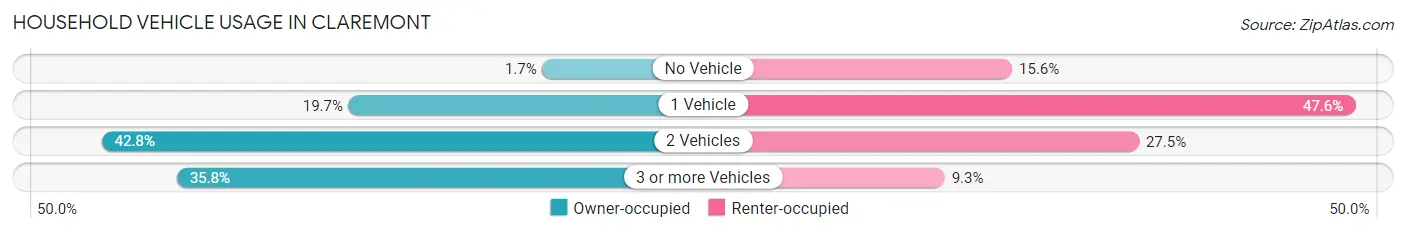
| Vehicles per Household | Owner-occupied | Renter-occupied |
| No Vehicle | 135 (1.7%) | 686 (15.6%) |
| 1 Vehicle | 1,620 (19.7%) | 2,094 (47.6%) |
| 2 Vehicles | 3,513 (42.8%) | 1,207 (27.5%) |
| 3 or more Vehicles | 2,938 (35.8%) | 410 (9.3%) |
| Total | 8,206 (100.0%) | 4,397 (100.0%) |
Real Estate & Mortgages in Claremont
Real Estate and Mortgage Overview in Claremont
| Characteristic | Without Mortgage | With Mortgage |
| Housing Units | 2,463 | 5,743 |
| Median Property Value | $837,500 | $834,800 |
| Median Household Income | $116,995 | $3,271 |
| Monthly Housing Costs | $751 | $3,362 |
| Real Estate Taxes | $3,782 | $41 |
Property Value by Mortgage Status in Claremont
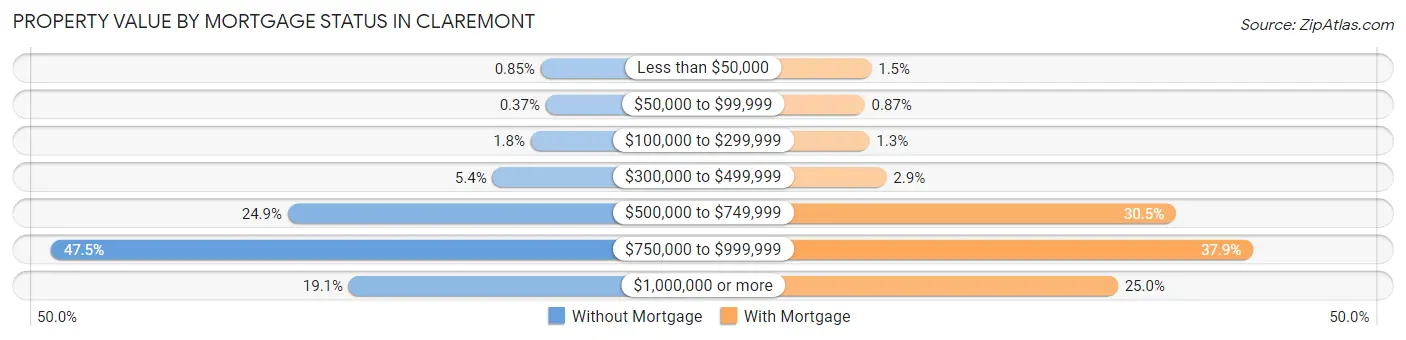
| Property Value | Without Mortgage | With Mortgage |
| Less than $50,000 | 21 (0.9%) | 86 (1.5%) |
| $50,000 to $99,999 | 9 (0.4%) | 50 (0.9%) |
| $100,000 to $299,999 | 44 (1.8%) | 76 (1.3%) |
| $300,000 to $499,999 | 134 (5.4%) | 169 (2.9%) |
| $500,000 to $749,999 | 614 (24.9%) | 1,753 (30.5%) |
| $750,000 to $999,999 | 1,170 (47.5%) | 2,175 (37.9%) |
| $1,000,000 or more | 471 (19.1%) | 1,434 (25.0%) |
| Total | 2,463 (100.0%) | 5,743 (100.0%) |
Household Income by Mortgage Status in Claremont
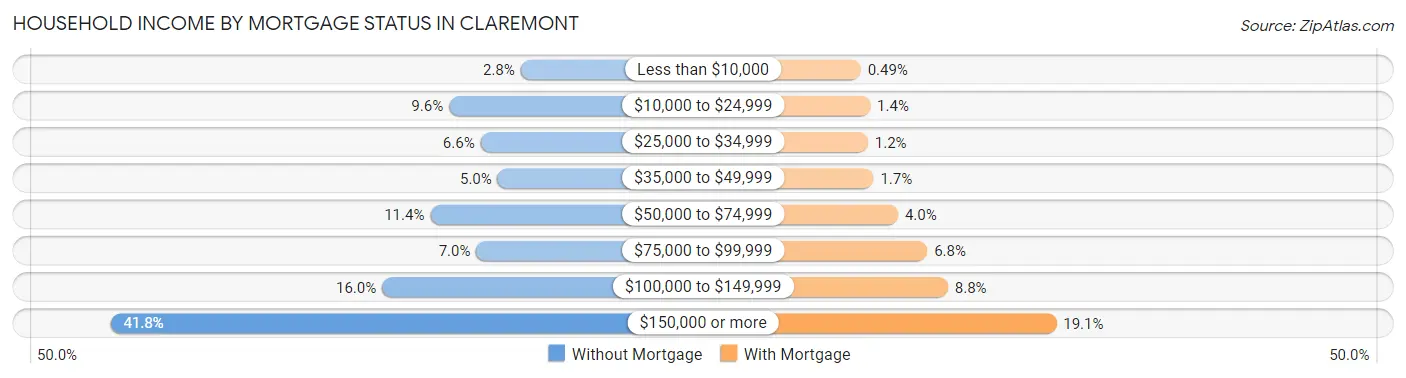
| Household Income | Without Mortgage | With Mortgage |
| Less than $10,000 | 68 (2.8%) | 28 (0.5%) |
| $10,000 to $24,999 | 236 (9.6%) | 80 (1.4%) |
| $25,000 to $34,999 | 162 (6.6%) | 67 (1.2%) |
| $35,000 to $49,999 | 122 (5.0%) | 98 (1.7%) |
| $50,000 to $74,999 | 280 (11.4%) | 232 (4.0%) |
| $75,000 to $99,999 | 172 (7.0%) | 392 (6.8%) |
| $100,000 to $149,999 | 393 (16.0%) | 505 (8.8%) |
| $150,000 or more | 1,030 (41.8%) | 1,098 (19.1%) |
| Total | 2,463 (100.0%) | 5,743 (100.0%) |
Property Value to Household Income Ratio in Claremont
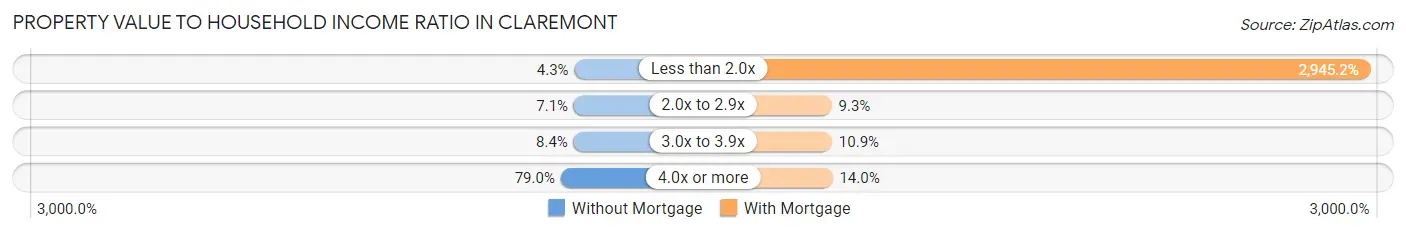
| Value-to-Income Ratio | Without Mortgage | With Mortgage |
| Less than 2.0x | 105 (4.3%) | 169,141 (2,945.2%) |
| 2.0x to 2.9x | 175 (7.1%) | 535 (9.3%) |
| 3.0x to 3.9x | 207 (8.4%) | 623 (10.8%) |
| 4.0x or more | 1,945 (79.0%) | 802 (14.0%) |
| Total | 2,463 (100.0%) | 5,743 (100.0%) |
Real Estate Taxes by Mortgage Status in Claremont
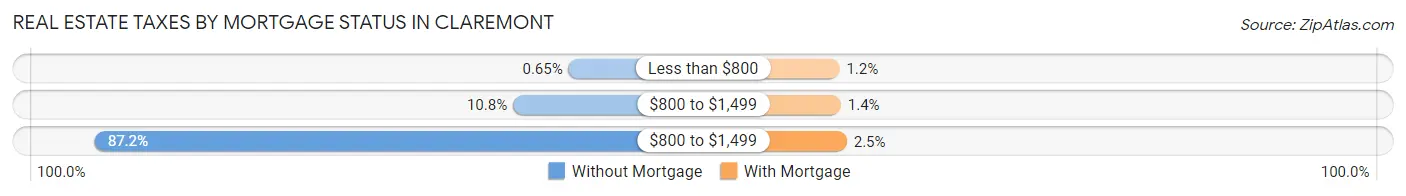
| Property Taxes | Without Mortgage | With Mortgage |
| Less than $800 | 16 (0.6%) | 67 (1.2%) |
| $800 to $1,499 | 266 (10.8%) | 82 (1.4%) |
| $800 to $1,499 | 2,147 (87.2%) | 144 (2.5%) |
| Total | 2,463 (100.0%) | 5,743 (100.0%) |
Health & Disability in Claremont
Health Insurance Coverage by Age in Claremont
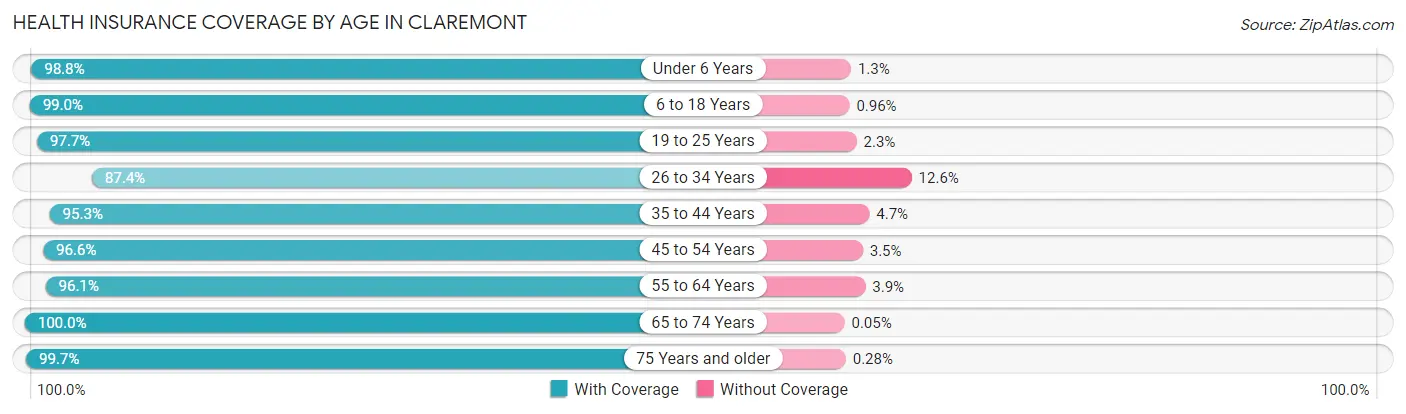
| Age Bracket | With Coverage | Without Coverage |
| Under 6 Years | 1,423 (98.8%) | 18 (1.3%) |
| 6 to 18 Years | 6,266 (99.0%) | 61 (1.0%) |
| 19 to 25 Years | 4,931 (97.7%) | 116 (2.3%) |
| 26 to 34 Years | 2,756 (87.4%) | 396 (12.6%) |
| 35 to 44 Years | 3,608 (95.3%) | 177 (4.7%) |
| 45 to 54 Years | 4,757 (96.6%) | 170 (3.5%) |
| 55 to 64 Years | 4,341 (96.1%) | 177 (3.9%) |
| 65 to 74 Years | 3,766 (100.0%) | 2 (0.1%) |
| 75 Years and older | 3,596 (99.7%) | 10 (0.3%) |
| Total | 35,444 (96.9%) | 1,127 (3.1%) |
Health Insurance Coverage by Citizenship Status in Claremont
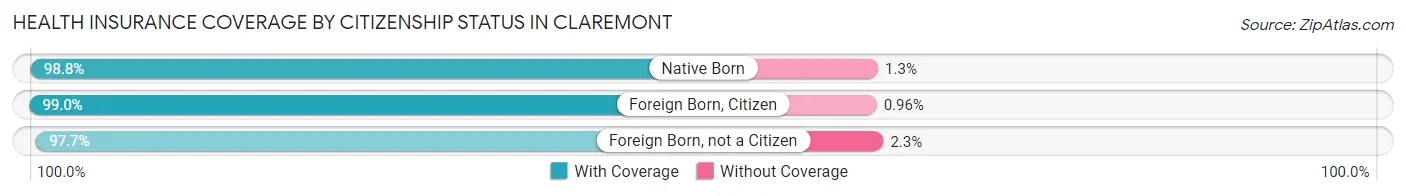
| Citizenship Status | With Coverage | Without Coverage |
| Native Born | 1,423 (98.8%) | 18 (1.3%) |
| Foreign Born, Citizen | 6,266 (99.0%) | 61 (1.0%) |
| Foreign Born, not a Citizen | 4,931 (97.7%) | 116 (2.3%) |
Health Insurance Coverage by Household Income in Claremont
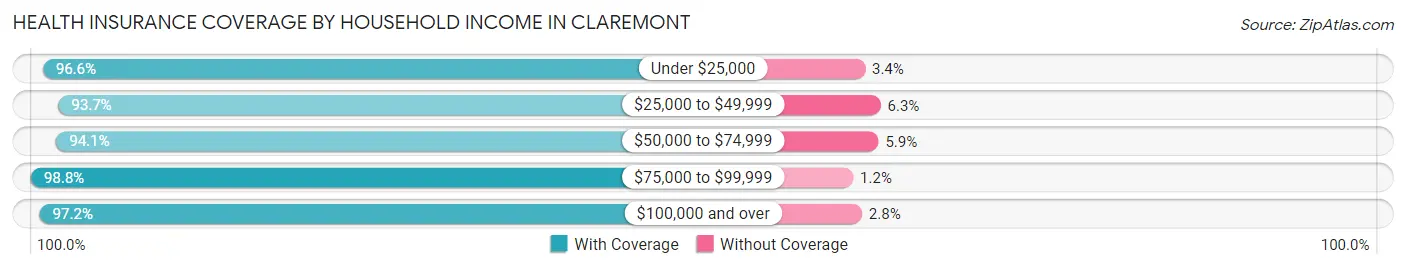
| Household Income | With Coverage | Without Coverage |
| Under $25,000 | 1,894 (96.6%) | 67 (3.4%) |
| $25,000 to $49,999 | 3,044 (93.7%) | 206 (6.3%) |
| $50,000 to $74,999 | 2,501 (94.1%) | 158 (5.9%) |
| $75,000 to $99,999 | 3,079 (98.8%) | 37 (1.2%) |
| $100,000 and over | 20,705 (97.2%) | 603 (2.8%) |
Public vs Private Health Insurance Coverage by Age in Claremont
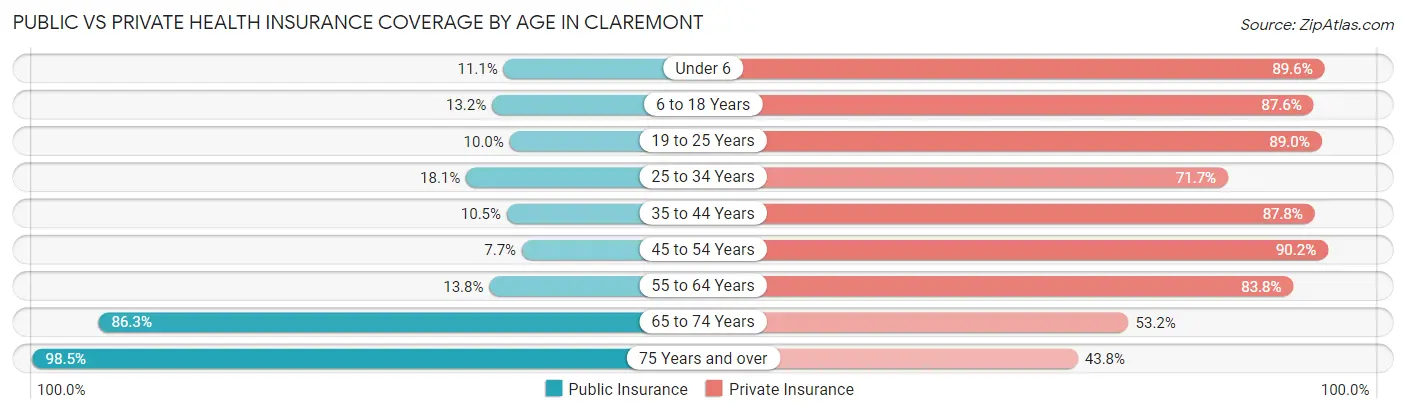
| Age Bracket | Public Insurance | Private Insurance |
| Under 6 | 160 (11.1%) | 1,291 (89.6%) |
| 6 to 18 Years | 837 (13.2%) | 5,541 (87.6%) |
| 19 to 25 Years | 503 (10.0%) | 4,494 (89.0%) |
| 25 to 34 Years | 569 (18.0%) | 2,259 (71.7%) |
| 35 to 44 Years | 397 (10.5%) | 3,322 (87.8%) |
| 45 to 54 Years | 379 (7.7%) | 4,446 (90.2%) |
| 55 to 64 Years | 621 (13.8%) | 3,786 (83.8%) |
| 65 to 74 Years | 3,251 (86.3%) | 2,006 (53.2%) |
| 75 Years and over | 3,552 (98.5%) | 1,580 (43.8%) |
| Total | 10,269 (28.1%) | 28,725 (78.5%) |
Disability Status by Sex by Age in Claremont
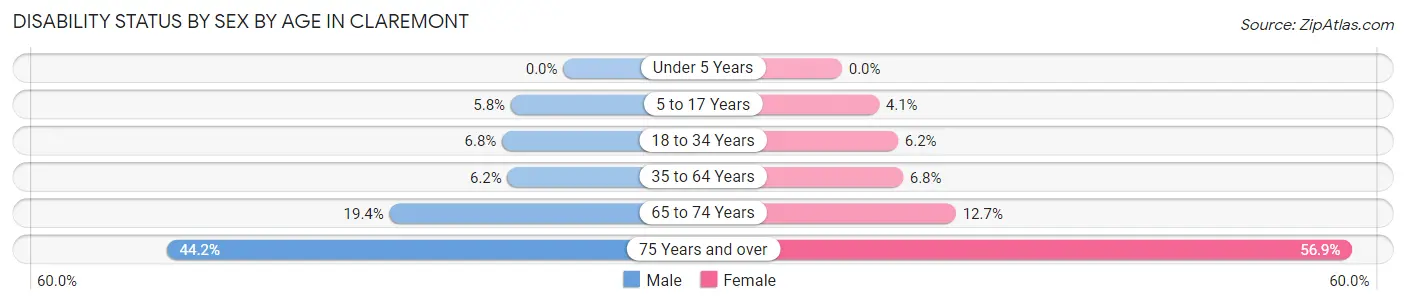
| Age Bracket | Male | Female |
| Under 5 Years | 0 (0.0%) | 0 (0.0%) |
| 5 to 17 Years | 132 (5.8%) | 107 (4.1%) |
| 18 to 34 Years | 337 (6.8%) | 309 (6.2%) |
| 35 to 64 Years | 389 (6.2%) | 473 (6.8%) |
| 65 to 74 Years | 331 (19.4%) | 261 (12.7%) |
| 75 Years and over | 520 (44.2%) | 1,381 (56.9%) |
Disability Class by Sex by Age in Claremont
Disability Class: Hearing Difficulty
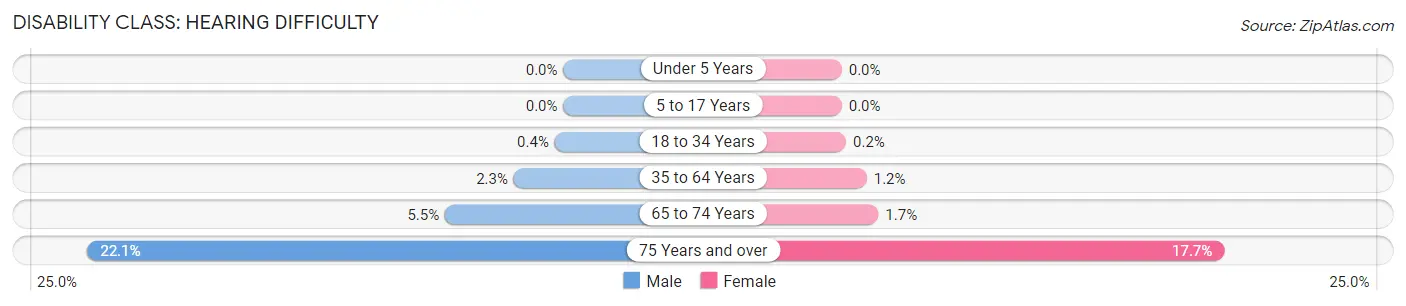
| Age Bracket | Male | Female |
| Under 5 Years | 0 (0.0%) | 0 (0.0%) |
| 5 to 17 Years | 0 (0.0%) | 0 (0.0%) |
| 18 to 34 Years | 20 (0.4%) | 10 (0.2%) |
| 35 to 64 Years | 144 (2.3%) | 81 (1.2%) |
| 65 to 74 Years | 94 (5.5%) | 35 (1.7%) |
| 75 Years and over | 260 (22.1%) | 431 (17.7%) |
Disability Class: Vision Difficulty
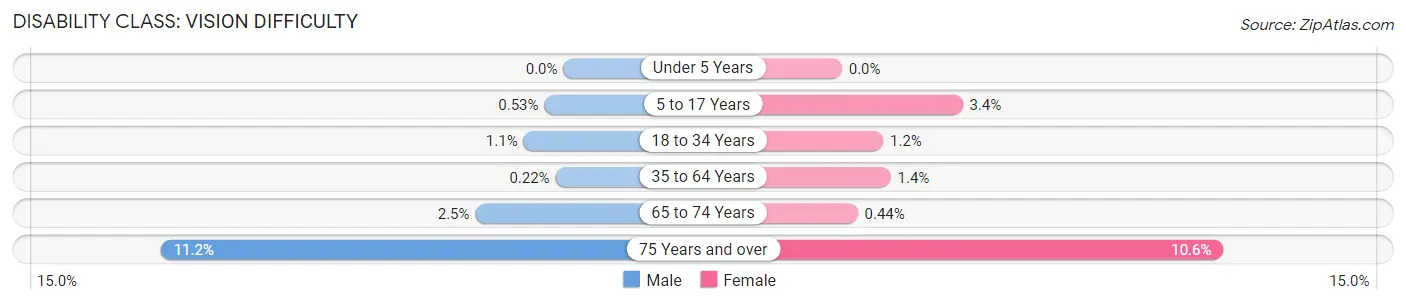
| Age Bracket | Male | Female |
| Under 5 Years | 0 (0.0%) | 0 (0.0%) |
| 5 to 17 Years | 12 (0.5%) | 87 (3.4%) |
| 18 to 34 Years | 55 (1.1%) | 57 (1.1%) |
| 35 to 64 Years | 14 (0.2%) | 95 (1.4%) |
| 65 to 74 Years | 42 (2.5%) | 9 (0.4%) |
| 75 Years and over | 132 (11.2%) | 258 (10.6%) |
Disability Class: Cognitive Difficulty
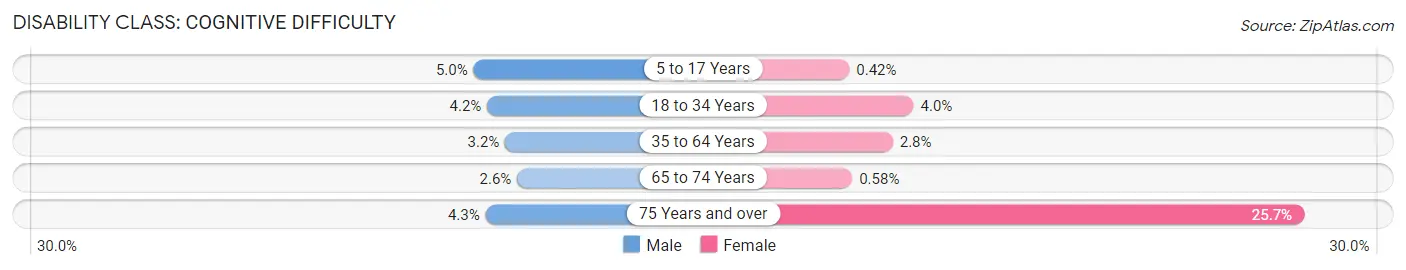
| Age Bracket | Male | Female |
| 5 to 17 Years | 113 (5.0%) | 11 (0.4%) |
| 18 to 34 Years | 210 (4.2%) | 198 (4.0%) |
| 35 to 64 Years | 203 (3.2%) | 198 (2.8%) |
| 65 to 74 Years | 44 (2.6%) | 12 (0.6%) |
| 75 Years and over | 51 (4.3%) | 625 (25.7%) |
Disability Class: Ambulatory Difficulty
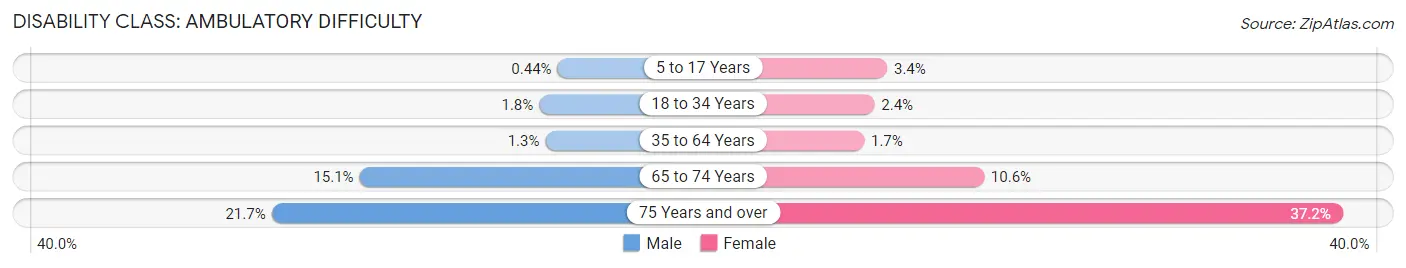
| Age Bracket | Male | Female |
| 5 to 17 Years | 10 (0.4%) | 87 (3.4%) |
| 18 to 34 Years | 89 (1.8%) | 120 (2.4%) |
| 35 to 64 Years | 84 (1.3%) | 115 (1.7%) |
| 65 to 74 Years | 259 (15.1%) | 217 (10.5%) |
| 75 Years and over | 255 (21.7%) | 903 (37.2%) |
Disability Class: Self-Care Difficulty
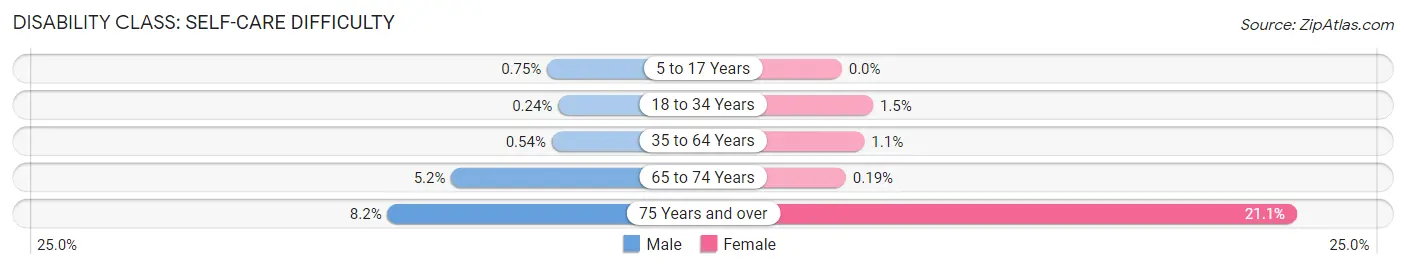
| Age Bracket | Male | Female |
| 5 to 17 Years | 17 (0.7%) | 0 (0.0%) |
| 18 to 34 Years | 12 (0.2%) | 72 (1.5%) |
| 35 to 64 Years | 34 (0.5%) | 73 (1.1%) |
| 65 to 74 Years | 89 (5.2%) | 4 (0.2%) |
| 75 Years and over | 96 (8.2%) | 513 (21.1%) |
Technology Access in Claremont
Computing Device Access in Claremont
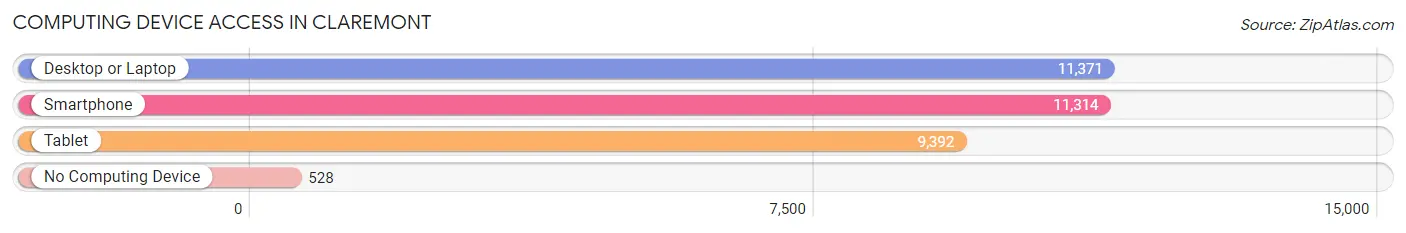
| Device Type | # Households | % Households |
| Desktop or Laptop | 11,371 | 90.2% |
| Smartphone | 11,314 | 89.8% |
| Tablet | 9,392 | 74.5% |
| No Computing Device | 528 | 4.2% |
| Total | 12,603 | 100.0% |
Internet Access in Claremont
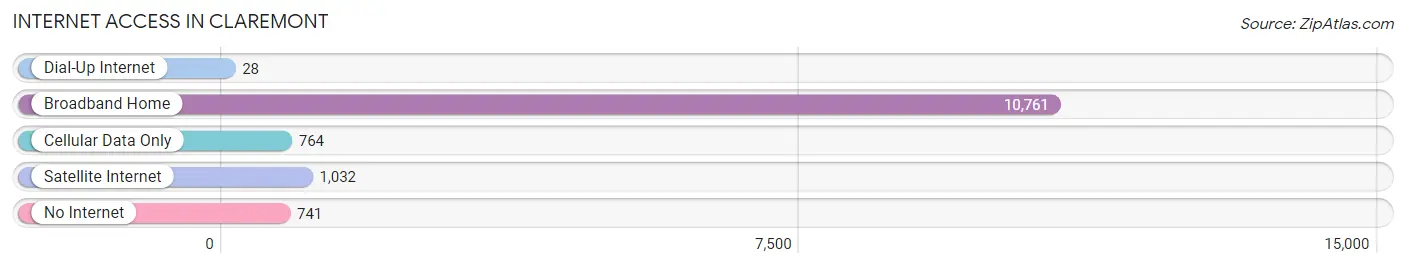
| Internet Type | # Households | % Households |
| Dial-Up Internet | 28 | 0.2% |
| Broadband Home | 10,761 | 85.4% |
| Cellular Data Only | 764 | 6.1% |
| Satellite Internet | 1,032 | 8.2% |
| No Internet | 741 | 5.9% |
| Total | 12,603 | 100.0% |
Claremont Summary
Claremont is a city located in the eastern part of Los Angeles County, California. It is situated at the foothills of the San Gabriel Mountains, approximately 30 miles east of downtown Los Angeles. The city is known for its tree-lined streets, historic buildings, and small-town charm. As of the 2010 census, the city had a population of 34,926.
Geography
Claremont is located at the base of the San Gabriel Mountains, in the Pomona Valley. It is bordered by the cities of Upland to the north, Montclair to the northeast, Chino to the east, La Verne to the southeast, San Dimas to the south, and Pomona to the west. The city covers an area of 13.7 square miles, with a population density of 2,541 people per square mile.
The city is divided into seven distinct neighborhoods: Claremont Village, College Heights, Indian Hill, Padua Hills, San Jose, South Claremont, and Thompson Creek. The city is home to several parks, including Padua Park, Memorial Park, and Blaisdell Park.
Climate
Claremont has a Mediterranean climate, with hot, dry summers and mild, wet winters. The average high temperature in the summer is around 90°F, while the average low temperature in the winter is around 40°F. The city receives an average of 15 inches of rain per year.
Demographics
As of the 2010 census, there were 34,926 people, 11,822 households, and 8,068 families residing in the city. The population density was 2,541 people per square mile. The racial makeup of the city was 68.2% White, 11.3% Asian, 8.4% Hispanic or Latino, 6.2% African American, 0.3% Native American, 0.1% Pacific Islander, and 5.6% from other races.
The median income for a household in the city was $76,811, and the median income for a family was $90,921. The per capita income for the city was $37,945. About 5.2% of families and 7.3% of the population were below the poverty line, including 8.7% of those under age 18 and 4.1% of those age 65 or over.
Economy
Claremont is home to several major employers, including the Claremont Unified School District, the Claremont Colleges, and the City of Claremont. The city is also home to several small businesses, including restaurants, retail stores, and professional services.
The city is home to the Claremont Colleges, a consortium of seven independent institutions of higher education. The colleges include Claremont McKenna College, Harvey Mudd College, Pitzer College, Pomona College, Scripps College, and the Keck Graduate Institute of Applied Life Sciences.
The city is also home to the Claremont Village, a historic shopping district with a variety of restaurants, shops, and galleries. The city is also home to the Claremont Museum of Art, which features a variety of contemporary and historical art.
Conclusion
Claremont is a city located in the eastern part of Los Angeles County, California. It is situated at the foothills of the San Gabriel Mountains, approximately 30 miles east of downtown Los Angeles. The city is known for its tree-lined streets, historic buildings, and small-town charm. As of the 2010 census, the city had a population of 34,926. The city is divided into seven distinct neighborhoods and is home to several parks, as well as the Claremont Colleges and the Claremont Village. The city has a Mediterranean climate, with hot, dry summers and mild, wet winters. The city is home to several major employers, including the Claremont Unified School District, the Claremont Colleges, and the City of Claremont. The median income for a household in the city was $76,811, and the median income for a family was $90,921. The city is also home to several small businesses, including restaurants, retail stores, and professional services.
Common Questions
What is Per Capita Income in Claremont?
Per Capita income in Claremont is $53,395.
What is the Median Family Income in Claremont?
Median Family Income in Claremont is $148,492.
What is the Median Household income in Claremont?
Median Household Income in Claremont is $115,091.
What is Income or Wage Gap in Claremont?
Income or Wage Gap in Claremont is 37.7%.
Women in Claremont earn 62.3 cents for every dollar earned by a man.
What is Family Income Deficit in Claremont?
Family Income Deficit in Claremont is $10,806.
Families that are below poverty line in Claremont earn $10,806 less on average than the poverty threshold level.
What is Inequality or Gini Index in Claremont?
Inequality or Gini Index in Claremont is 0.45.
What is the Total Population of Claremont?
Total Population of Claremont is 36,891.
What is the Total Male Population of Claremont?
Total Male Population of Claremont is 17,174.
What is the Total Female Population of Claremont?
Total Female Population of Claremont is 19,717.
What is the Ratio of Males per 100 Females in Claremont?
There are 87.10 Males per 100 Females in Claremont.
What is the Ratio of Females per 100 Males in Claremont?
There are 114.81 Females per 100 Males in Claremont.
What is the Median Population Age in Claremont?
Median Population Age in Claremont is 41.5 Years.
What is the Average Family Size in Claremont
Average Family Size in Claremont is 3.1 People.
What is the Average Household Size in Claremont
Average Household Size in Claremont is 2.6 People.
How Large is the Labor Force in Claremont?
There are 18,389 People in the Labor Forcein in Claremont.
What is the Percentage of People in the Labor Force in Claremont?
58.3% of People are in the Labor Force in Claremont.
What is the Unemployment Rate in Claremont?
Unemployment Rate in Claremont is 5.6%.