Indio, CA Map & Demographics
Indio Map
Indio Overview
$33,852
PER CAPITA INCOME
$84,146
AVG FAMILY INCOME
$68,436
AVG HOUSEHOLD INCOME
20.5%
WAGE / INCOME GAP [ % ]
79.5¢/ $1
WAGE / INCOME GAP [ $ ]
$8,286
FAMILY INCOME DEFICIT
0.44
INEQUALITY / GINI INDEX
89,616
TOTAL POPULATION
44,785
MALE POPULATION
44,831
FEMALE POPULATION
99.90
MALES / 100 FEMALES
100.10
FEMALES / 100 MALES
39.2
MEDIAN AGE
3.5
AVG FAMILY SIZE
2.7
AVG HOUSEHOLD SIZE
43,120
LABOR FORCE [ PEOPLE ]
59.9%
PERCENT IN LABOR FORCE
7.3%
UNEMPLOYMENT RATE
Income in Indio
Income Overview in Indio
Per Capita Income in Indio is $33,852, while median incomes of families and households are $84,146 and $68,436 respectively.
| Characteristic | Number | Measure |
| Per Capita Income | 89,616 | $33,852 |
| Median Family Income | 21,324 | $84,146 |
| Mean Family Income | 21,324 | $104,148 |
| Median Household Income | 32,579 | $68,436 |
| Mean Household Income | 32,579 | $90,108 |
| Income Deficit | 21,324 | $8,286 |
| Wage / Income Gap (%) | 89,616 | 20.47% |
| Wage / Income Gap ($) | 89,616 | 79.53¢ per $1 |
| Gini / Inequality Index | 89,616 | 0.44 |
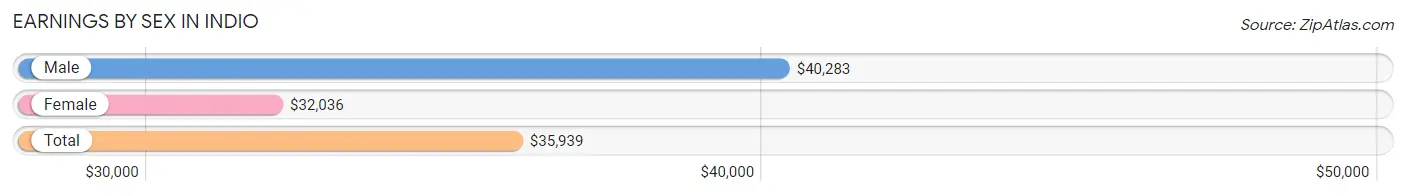
Earnings by Sex in Indio
Average Earnings in Indio are $35,939, $40,283 for men and $32,036 for women, a difference of 20.5%.
| Sex | Number | Average Earnings |
| Male | 23,531 (54.2%) | $40,283 |
| Female | 19,844 (45.8%) | $32,036 |
| Total | 43,375 (100.0%) | $35,939 |
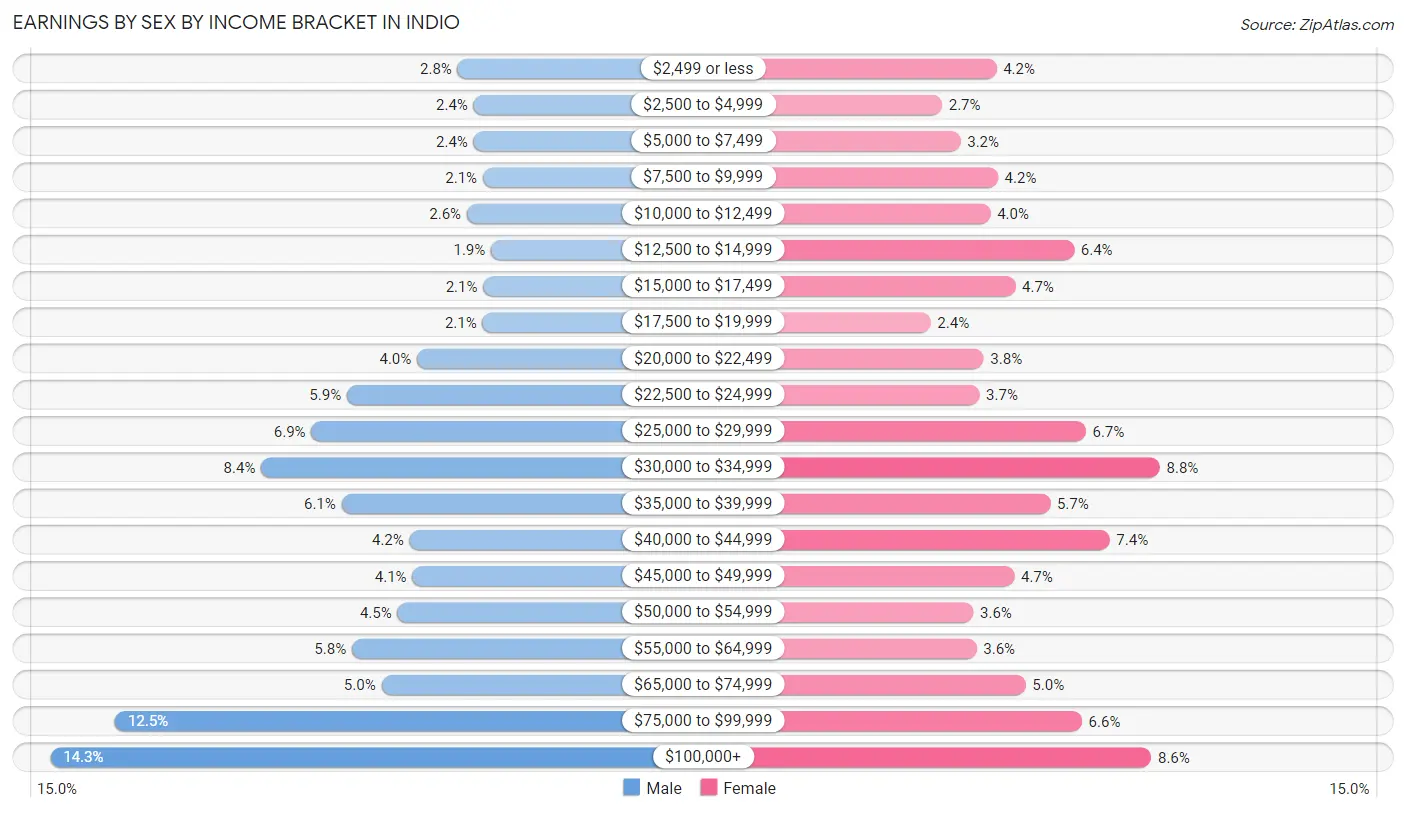
Earnings by Sex by Income Bracket in Indio
The most common earnings brackets in Indio are $100,000+ for men (3,360 | 14.3%) and $30,000 to $34,999 for women (1,745 | 8.8%).
| Income | Male | Female |
| $2,499 or less | 666 (2.8%) | 834 (4.2%) |
| $2,500 to $4,999 | 559 (2.4%) | 529 (2.7%) |
| $5,000 to $7,499 | 560 (2.4%) | 633 (3.2%) |
| $7,500 to $9,999 | 498 (2.1%) | 841 (4.2%) |
| $10,000 to $12,499 | 605 (2.6%) | 800 (4.0%) |
| $12,500 to $14,999 | 444 (1.9%) | 1,266 (6.4%) |
| $15,000 to $17,499 | 497 (2.1%) | 939 (4.7%) |
| $17,500 to $19,999 | 502 (2.1%) | 467 (2.4%) |
| $20,000 to $22,499 | 934 (4.0%) | 762 (3.8%) |
| $22,500 to $24,999 | 1,397 (5.9%) | 738 (3.7%) |
| $25,000 to $29,999 | 1,632 (6.9%) | 1,331 (6.7%) |
| $30,000 to $34,999 | 1,966 (8.4%) | 1,745 (8.8%) |
| $35,000 to $39,999 | 1,433 (6.1%) | 1,133 (5.7%) |
| $40,000 to $44,999 | 983 (4.2%) | 1,465 (7.4%) |
| $45,000 to $49,999 | 965 (4.1%) | 933 (4.7%) |
| $50,000 to $54,999 | 1,063 (4.5%) | 704 (3.5%) |
| $55,000 to $64,999 | 1,364 (5.8%) | 722 (3.6%) |
| $65,000 to $74,999 | 1,170 (5.0%) | 996 (5.0%) |
| $75,000 to $99,999 | 2,933 (12.5%) | 1,310 (6.6%) |
| $100,000+ | 3,360 (14.3%) | 1,696 (8.6%) |
| Total | 23,531 (100.0%) | 19,844 (100.0%) |
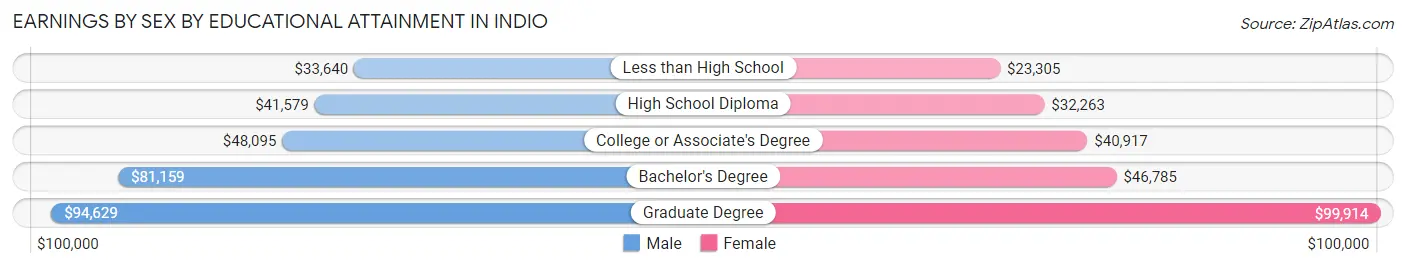
Earnings by Sex by Educational Attainment in Indio
Average earnings in Indio are $45,611 for men and $35,947 for women, a difference of 21.2%. Men with an educational attainment of graduate degree enjoy the highest average annual earnings of $94,629, while those with less than high school education earn the least with $33,640. Women with an educational attainment of graduate degree earn the most with the average annual earnings of $99,914, while those with less than high school education have the smallest earnings of $23,305.
| Educational Attainment | Male Income | Female Income |
| Less than High School | $33,640 | $23,305 |
| High School Diploma | $41,579 | $32,263 |
| College or Associate's Degree | $48,095 | $40,917 |
| Bachelor's Degree | $81,159 | $46,785 |
| Graduate Degree | $94,629 | $99,914 |
| Total | $45,611 | $35,947 |
Family Income in Indio
Family Income Brackets in Indio
According to the Indio family income data, there are 4,137 families falling into the $100,000 to $149,999 income range, which is the most common income bracket and makes up 19.4% of all families. Conversely, the $10,000 to $14,999 income bracket is the least frequent group with only 235 families (1.1%) belonging to this category.
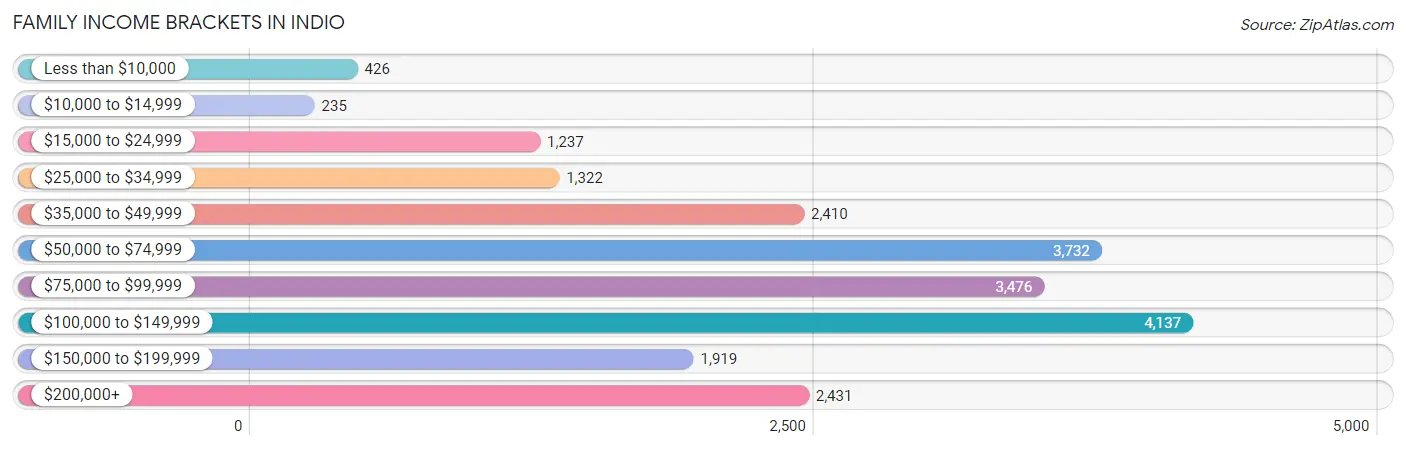
| Income Bracket | # Families | % Families |
| Less than $10,000 | 426 | 2.0% |
| $10,000 to $14,999 | 235 | 1.1% |
| $15,000 to $24,999 | 1,237 | 5.8% |
| $25,000 to $34,999 | 1,322 | 6.2% |
| $35,000 to $49,999 | 2,410 | 11.3% |
| $50,000 to $74,999 | 3,732 | 17.5% |
| $75,000 to $99,999 | 3,476 | 16.3% |
| $100,000 to $149,999 | 4,137 | 19.4% |
| $150,000 to $199,999 | 1,919 | 9.0% |
| $200,000+ | 2,431 | 11.4% |
Family Income by Famaliy Size in Indio
6-person families (1,273 | 6.0%) account for the highest median family income in Indio with $101,544 per family, while 2-person families (9,159 | 42.9%) have the highest median income of $37,650 per family member.
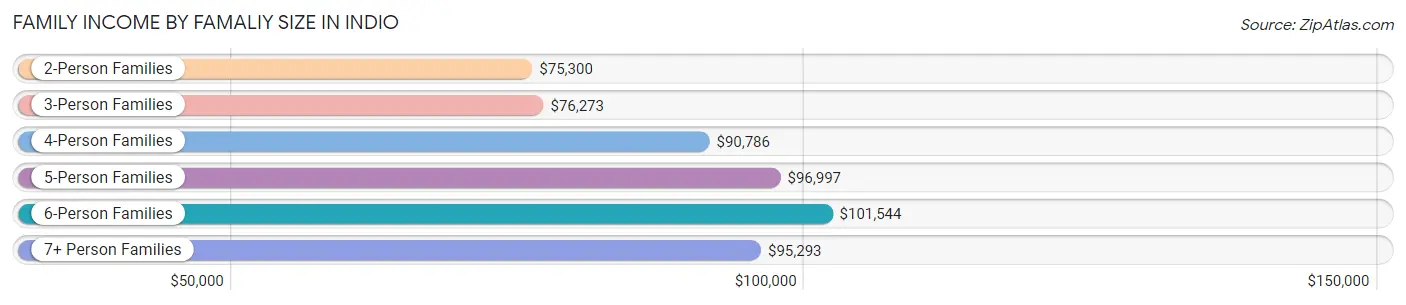
| Income Bracket | # Families | Median Income |
| 2-Person Families | 9,159 (42.9%) | $75,300 |
| 3-Person Families | 3,866 (18.1%) | $76,273 |
| 4-Person Families | 3,770 (17.7%) | $90,786 |
| 5-Person Families | 2,595 (12.2%) | $96,997 |
| 6-Person Families | 1,273 (6.0%) | $101,544 |
| 7+ Person Families | 661 (3.1%) | $95,293 |
| Total | 21,324 (100.0%) | $84,146 |
Family Income by Number of Earners in Indio
The median family income in Indio is $84,146, with families comprising 3+ earners (3,514) having the highest median family income of $122,584, while families with 1 earner (6,520) have the lowest median family income of $61,274, accounting for 16.5% and 30.6% of families, respectively.
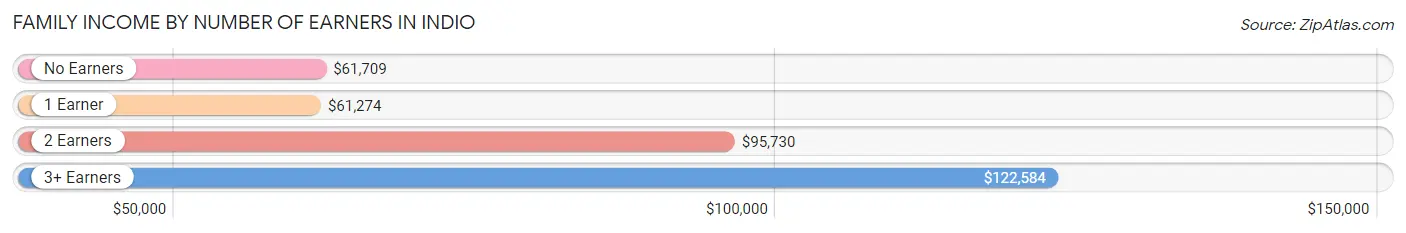
| Number of Earners | # Families | Median Income |
| No Earners | 3,952 (18.5%) | $61,709 |
| 1 Earner | 6,520 (30.6%) | $61,274 |
| 2 Earners | 7,338 (34.4%) | $95,730 |
| 3+ Earners | 3,514 (16.5%) | $122,584 |
| Total | 21,324 (100.0%) | $84,146 |
Household Income in Indio
Household Income Brackets in Indio
With 5,571 households falling in the category, the $50,000 to $74,999 income range is the most frequent in Indio, accounting for 17.1% of all households. In contrast, only 1,205 households (3.7%) fall into the less than $10,000 income bracket, making it the least populous group.
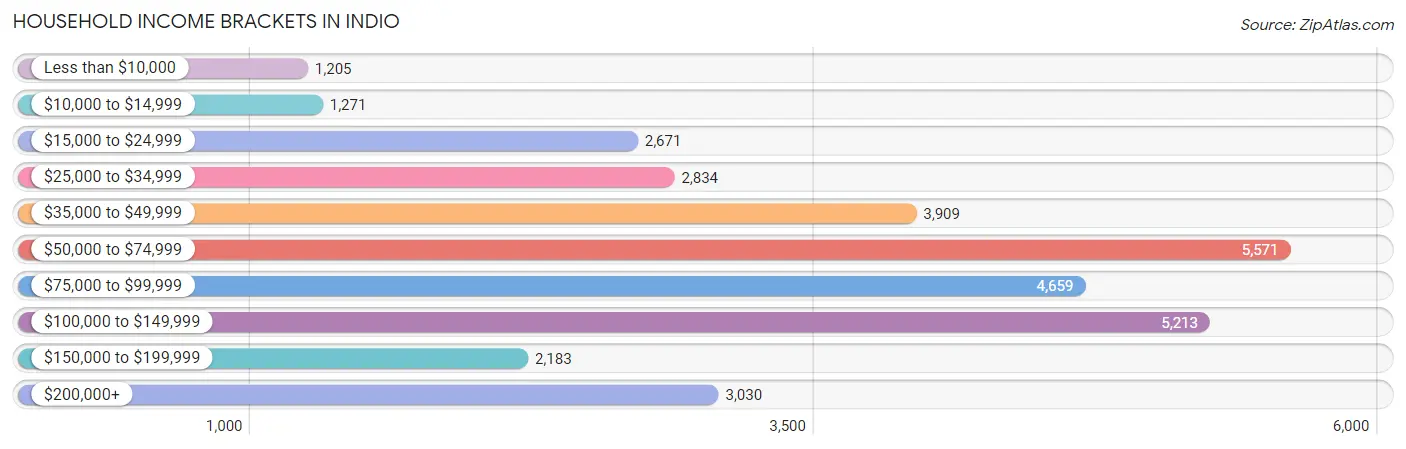
| Income Bracket | # Households | % Households |
| Less than $10,000 | 1,205 | 3.7% |
| $10,000 to $14,999 | 1,271 | 3.9% |
| $15,000 to $24,999 | 2,671 | 8.2% |
| $25,000 to $34,999 | 2,834 | 8.7% |
| $35,000 to $49,999 | 3,909 | 12.0% |
| $50,000 to $74,999 | 5,571 | 17.1% |
| $75,000 to $99,999 | 4,659 | 14.3% |
| $100,000 to $149,999 | 5,213 | 16.0% |
| $150,000 to $199,999 | 2,183 | 6.7% |
| $200,000+ | 3,030 | 9.3% |
Household Income by Householder Age in Indio
The median household income in Indio is $68,436, with the highest median household income of $78,732 found in the 45 to 64 years age bracket for the primary householder. A total of 11,229 households (34.5%) fall into this category. Meanwhile, the 15 to 24 years age bracket for the primary householder has the lowest median household income of $26,806, with 692 households (2.1%) in this group.
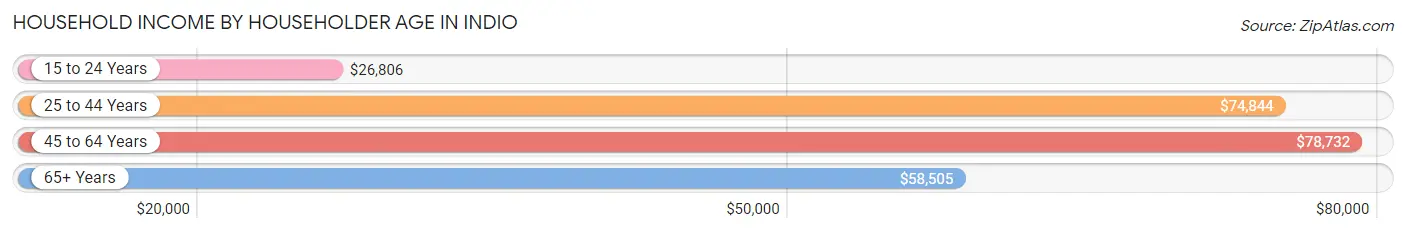
| Income Bracket | # Households | Median Income |
| 15 to 24 Years | 692 (2.1%) | $26,806 |
| 25 to 44 Years | 9,876 (30.3%) | $74,844 |
| 45 to 64 Years | 11,229 (34.5%) | $78,732 |
| 65+ Years | 10,782 (33.1%) | $58,505 |
| Total | 32,579 (100.0%) | $68,436 |
Poverty in Indio
Income Below Poverty by Sex and Age in Indio
With 12.0% poverty level for males and 14.3% for females among the residents of Indio, 15 year old males and 15 year old females are the most vulnerable to poverty, with 278 males (31.1%) and 277 females (32.1%) in their respective age groups living below the poverty level.
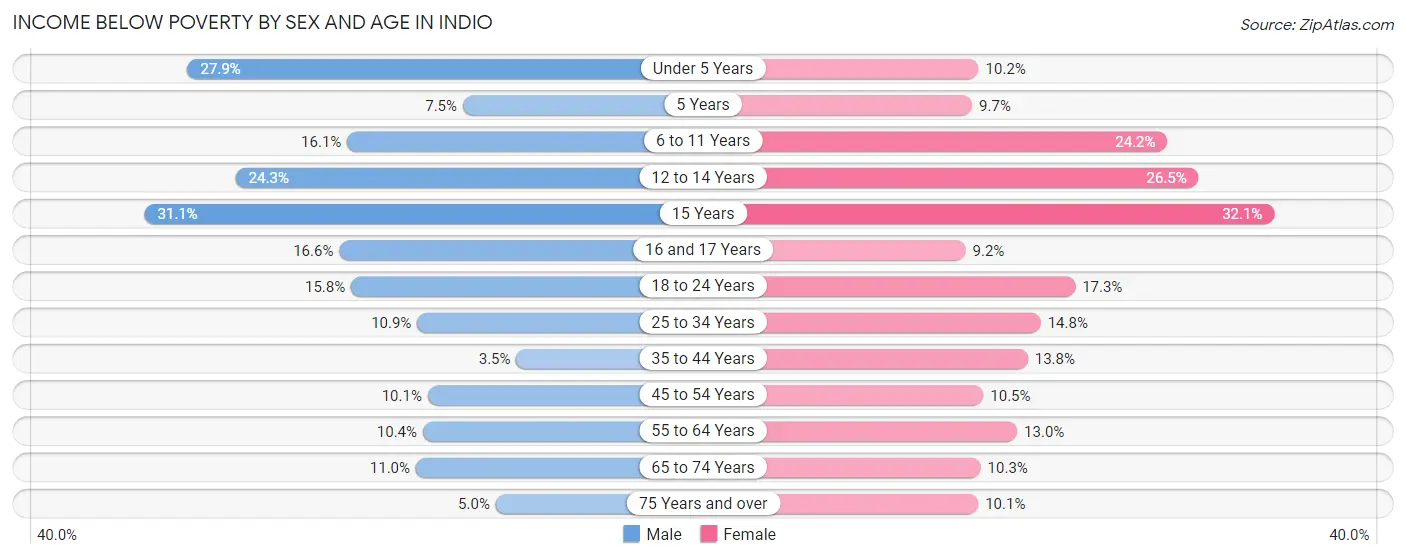
| Age Bracket | Male | Female |
| Under 5 Years | 677 (27.9%) | 211 (10.2%) |
| 5 Years | 34 (7.5%) | 43 (9.7%) |
| 6 to 11 Years | 567 (16.1%) | 812 (24.2%) |
| 12 to 14 Years | 370 (24.3%) | 486 (26.5%) |
| 15 Years | 278 (31.1%) | 277 (32.1%) |
| 16 and 17 Years | 227 (16.6%) | 130 (9.2%) |
| 18 to 24 Years | 573 (15.8%) | 614 (17.3%) |
| 25 to 34 Years | 634 (10.8%) | 864 (14.8%) |
| 35 to 44 Years | 216 (3.5%) | 801 (13.8%) |
| 45 to 54 Years | 575 (10.1%) | 525 (10.5%) |
| 55 to 64 Years | 476 (10.4%) | 703 (13.0%) |
| 65 to 74 Years | 494 (11.0%) | 551 (10.3%) |
| 75 Years and over | 178 (5.0%) | 375 (10.1%) |
| Total | 5,299 (12.0%) | 6,392 (14.3%) |
Income Above Poverty by Sex and Age in Indio
According to the poverty statistics in Indio, males aged 35 to 44 years and females aged 16 and 17 years are the age groups that are most secure financially, with 96.5% of males and 90.8% of females in these age groups living above the poverty line.
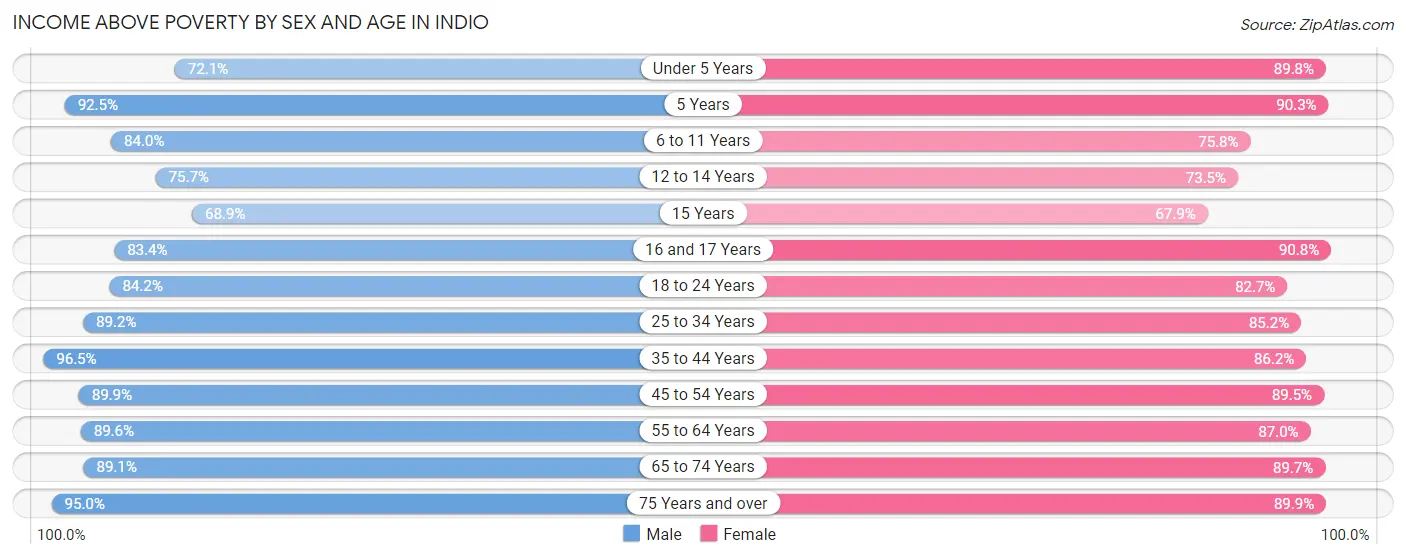
| Age Bracket | Male | Female |
| Under 5 Years | 1,749 (72.1%) | 1,865 (89.8%) |
| 5 Years | 422 (92.5%) | 401 (90.3%) |
| 6 to 11 Years | 2,965 (84.0%) | 2,547 (75.8%) |
| 12 to 14 Years | 1,151 (75.7%) | 1,349 (73.5%) |
| 15 Years | 616 (68.9%) | 586 (67.9%) |
| 16 and 17 Years | 1,137 (83.4%) | 1,284 (90.8%) |
| 18 to 24 Years | 3,063 (84.2%) | 2,929 (82.7%) |
| 25 to 34 Years | 5,212 (89.1%) | 4,986 (85.2%) |
| 35 to 44 Years | 5,977 (96.5%) | 4,999 (86.2%) |
| 45 to 54 Years | 5,134 (89.9%) | 4,471 (89.5%) |
| 55 to 64 Years | 4,086 (89.6%) | 4,697 (87.0%) |
| 65 to 74 Years | 4,017 (89.0%) | 4,793 (89.7%) |
| 75 Years and over | 3,370 (95.0%) | 3,328 (89.9%) |
| Total | 38,899 (88.0%) | 38,235 (85.7%) |
Income Below Poverty Among Married-Couple Families in Indio
The poverty statistics for married-couple families in Indio show that 6.7% or 1,098 of the total 16,428 families live below the poverty line. Families with 3 or 4 children have the highest poverty rate of 18.1%, comprising of 330 families. On the other hand, families with no children have the lowest poverty rate of 3.4%, which includes 325 families.
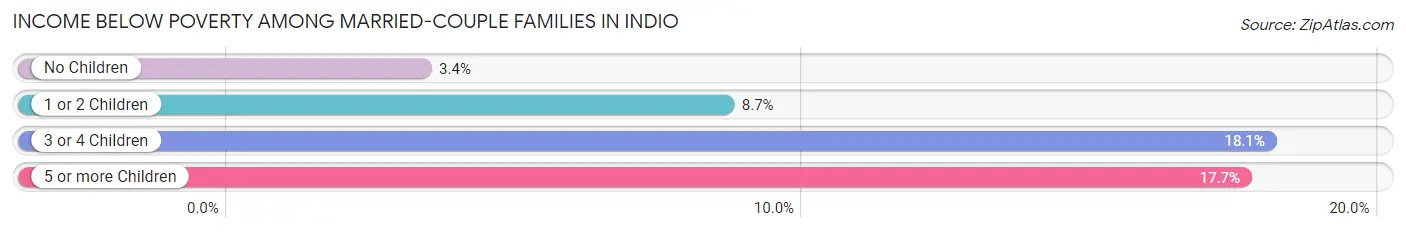
| Children | Above Poverty | Below Poverty |
| No Children | 9,282 (96.6%) | 325 (3.4%) |
| 1 or 2 Children | 4,455 (91.3%) | 422 (8.6%) |
| 3 or 4 Children | 1,495 (81.9%) | 330 (18.1%) |
| 5 or more Children | 98 (82.4%) | 21 (17.6%) |
| Total | 15,330 (93.3%) | 1,098 (6.7%) |
Income Below Poverty Among Single-Parent Households in Indio
According to the poverty data in Indio, 14.7% or 212 single-father households and 22.4% or 772 single-mother households are living below the poverty line. Among single-father households, those with 3 or 4 children have the highest poverty rate, with 65 households (34.9%) experiencing poverty. Likewise, among single-mother households, those with 3 or 4 children have the highest poverty rate, with 283 households (72.4%) falling below the poverty line.
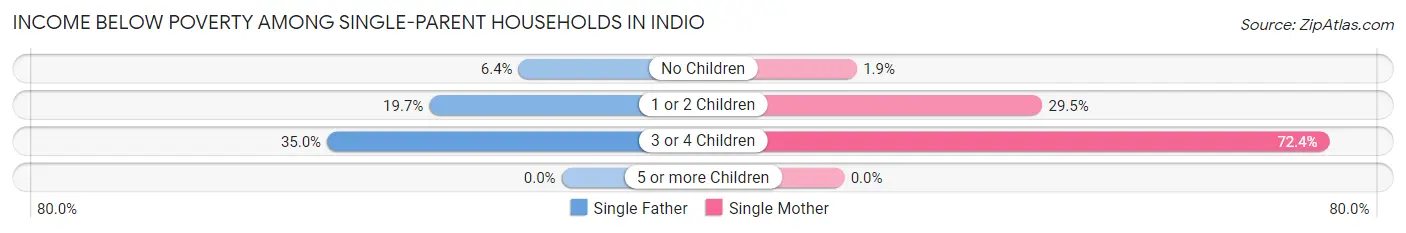
| Children | Single Father | Single Mother |
| No Children | 49 (6.4%) | 28 (1.9%) |
| 1 or 2 Children | 98 (19.7%) | 461 (29.5%) |
| 3 or 4 Children | 65 (34.9%) | 283 (72.4%) |
| 5 or more Children | 0 (0.0%) | 0 (0.0%) |
| Total | 212 (14.7%) | 772 (22.4%) |
Income Below Poverty Among Married-Couple vs Single-Parent Households in Indio
The poverty data for Indio shows that 1,098 of the married-couple family households (6.7%) and 984 of the single-parent households (20.1%) are living below the poverty level. Within the married-couple family households, those with 3 or 4 children have the highest poverty rate, with 330 households (18.1%) falling below the poverty line. Among the single-parent households, those with 3 or 4 children have the highest poverty rate, with 348 household (60.3%) living below poverty.
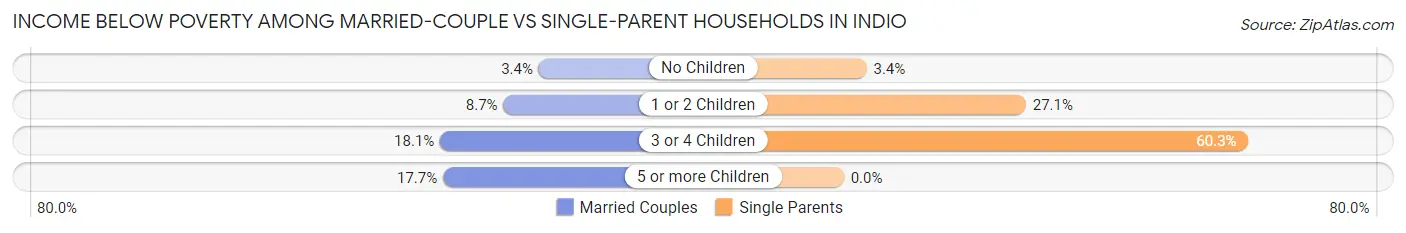
| Children | Married-Couple Families | Single-Parent Households |
| No Children | 325 (3.4%) | 77 (3.4%) |
| 1 or 2 Children | 422 (8.6%) | 559 (27.1%) |
| 3 or 4 Children | 330 (18.1%) | 348 (60.3%) |
| 5 or more Children | 21 (17.6%) | 0 (0.0%) |
| Total | 1,098 (6.7%) | 984 (20.1%) |
Race in Indio
The most populous races in Indio are Hispanic or Latino (61,098 | 68.2%), White / Caucasian (36,429 | 40.6%), and Two or more Races (25,641 | 28.6%).
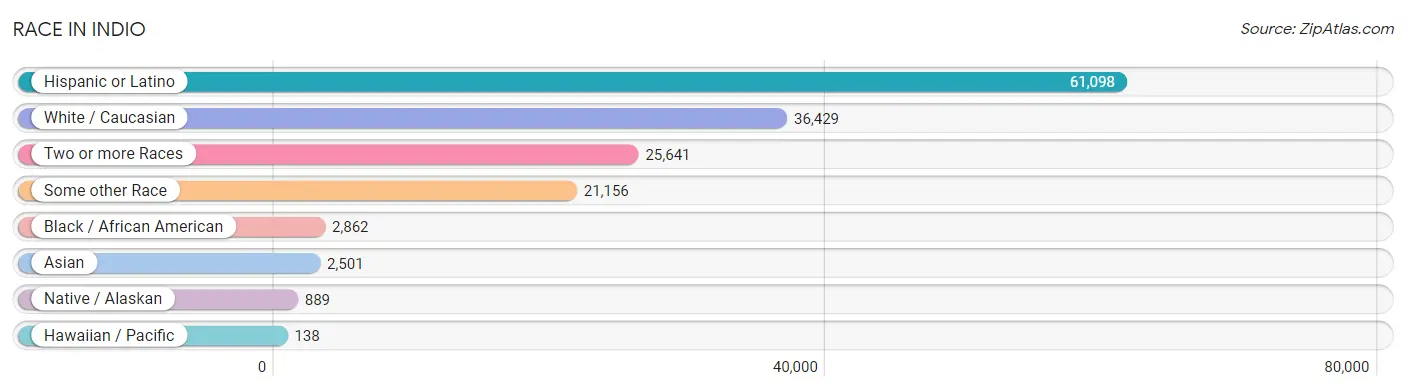
| Race | # Population | % Population |
| Asian | 2,501 | 2.8% |
| Black / African American | 2,862 | 3.2% |
| Hawaiian / Pacific | 138 | 0.2% |
| Hispanic or Latino | 61,098 | 68.2% |
| Native / Alaskan | 889 | 1.0% |
| White / Caucasian | 36,429 | 40.6% |
| Two or more Races | 25,641 | 28.6% |
| Some other Race | 21,156 | 23.6% |
| Total | 89,616 | 100.0% |
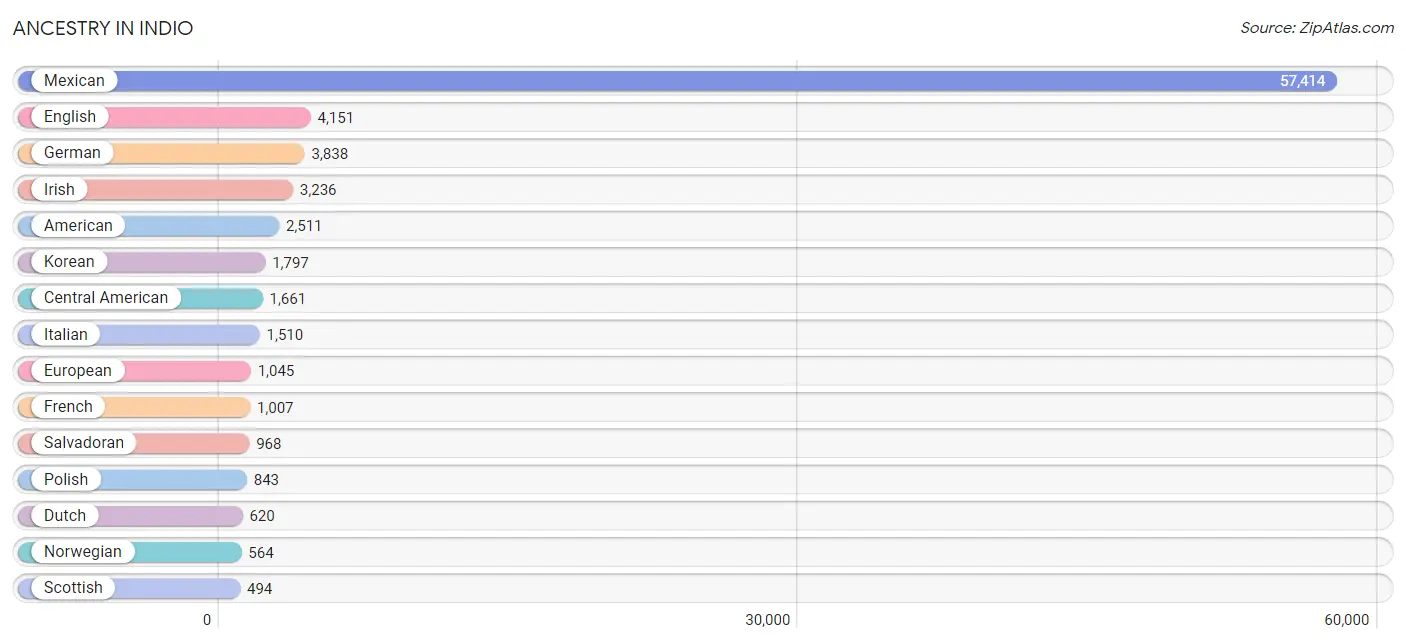
Ancestry in Indio
The most populous ancestries reported in Indio are Mexican (57,414 | 64.1%), English (4,151 | 4.6%), German (3,838 | 4.3%), Irish (3,236 | 3.6%), and American (2,511 | 2.8%), together accounting for 79.4% of all Indio residents.
| Ancestry | # Population | % Population |
| African | 32 | 0.0% |
| Albanian | 106 | 0.1% |
| American | 2,511 | 2.8% |
| Apache | 45 | 0.1% |
| Arab | 82 | 0.1% |
| Argentinean | 151 | 0.2% |
| Armenian | 43 | 0.1% |
| Australian | 61 | 0.1% |
| Austrian | 66 | 0.1% |
| Barbadian | 40 | 0.0% |
| Basque | 9 | 0.0% |
| Belgian | 14 | 0.0% |
| Belizean | 8 | 0.0% |
| Bhutanese | 358 | 0.4% |
| Blackfeet | 53 | 0.1% |
| Brazilian | 11 | 0.0% |
| British | 183 | 0.2% |
| Burmese | 128 | 0.1% |
| Cambodian | 4 | 0.0% |
| Canadian | 164 | 0.2% |
| Central American | 1,661 | 1.8% |
| Cherokee | 81 | 0.1% |
| Chickasaw | 46 | 0.1% |
| Chilean | 13 | 0.0% |
| Choctaw | 11 | 0.0% |
| Colombian | 53 | 0.1% |
| Comanche | 10 | 0.0% |
| Croatian | 62 | 0.1% |
| Cuban | 40 | 0.0% |
| Czech | 130 | 0.2% |
| Czechoslovakian | 43 | 0.1% |
| Danish | 122 | 0.1% |
| Dutch | 620 | 0.7% |
| Eastern European | 151 | 0.2% |
| Ecuadorian | 19 | 0.0% |
| English | 4,151 | 4.6% |
| European | 1,045 | 1.2% |
| Finnish | 20 | 0.0% |
| French | 1,007 | 1.1% |
| French Canadian | 142 | 0.2% |
| German | 3,838 | 4.3% |
| Greek | 257 | 0.3% |
| Guamanian / Chamorro | 6 | 0.0% |
| Guatemalan | 400 | 0.4% |
| Honduran | 226 | 0.3% |
| Hungarian | 223 | 0.3% |
| Icelander | 26 | 0.0% |
| Indian (Asian) | 409 | 0.5% |
| Inupiat | 33 | 0.0% |
| Iranian | 85 | 0.1% |
| Irish | 3,236 | 3.6% |
| Israeli | 39 | 0.0% |
| Italian | 1,510 | 1.7% |
| Jamaican | 86 | 0.1% |
| Japanese | 25 | 0.0% |
| Korean | 1,797 | 2.0% |
| Latvian | 8 | 0.0% |
| Lebanese | 26 | 0.0% |
| Lithuanian | 111 | 0.1% |
| Mexican | 57,414 | 64.1% |
| Mexican American Indian | 299 | 0.3% |
| Native Hawaiian | 173 | 0.2% |
| Navajo | 23 | 0.0% |
| Nicaraguan | 67 | 0.1% |
| Northern European | 76 | 0.1% |
| Norwegian | 564 | 0.6% |
| Osage | 19 | 0.0% |
| Pakistani | 143 | 0.2% |
| Palestinian | 13 | 0.0% |
| Peruvian | 36 | 0.0% |
| Polish | 843 | 0.9% |
| Portuguese | 127 | 0.1% |
| Pueblo | 16 | 0.0% |
| Puerto Rican | 154 | 0.2% |
| Romanian | 67 | 0.1% |
| Russian | 197 | 0.2% |
| Salvadoran | 968 | 1.1% |
| Samoan | 111 | 0.1% |
| Scandinavian | 117 | 0.1% |
| Scotch-Irish | 194 | 0.2% |
| Scottish | 494 | 0.5% |
| Slovak | 25 | 0.0% |
| Slovene | 9 | 0.0% |
| South African | 22 | 0.0% |
| South American | 272 | 0.3% |
| Spaniard | 267 | 0.3% |
| Spanish | 250 | 0.3% |
| Sri Lankan | 431 | 0.5% |
| Subsaharan African | 54 | 0.1% |
| Swedish | 303 | 0.3% |
| Swiss | 111 | 0.1% |
| Thai | 118 | 0.1% |
| Tongan | 101 | 0.1% |
| Turkish | 4 | 0.0% |
| Ukrainian | 158 | 0.2% |
| Welsh | 195 | 0.2% |
| Yaqui | 314 | 0.4% |
| Yugoslavian | 30 | 0.0% | View All 98 Rows |
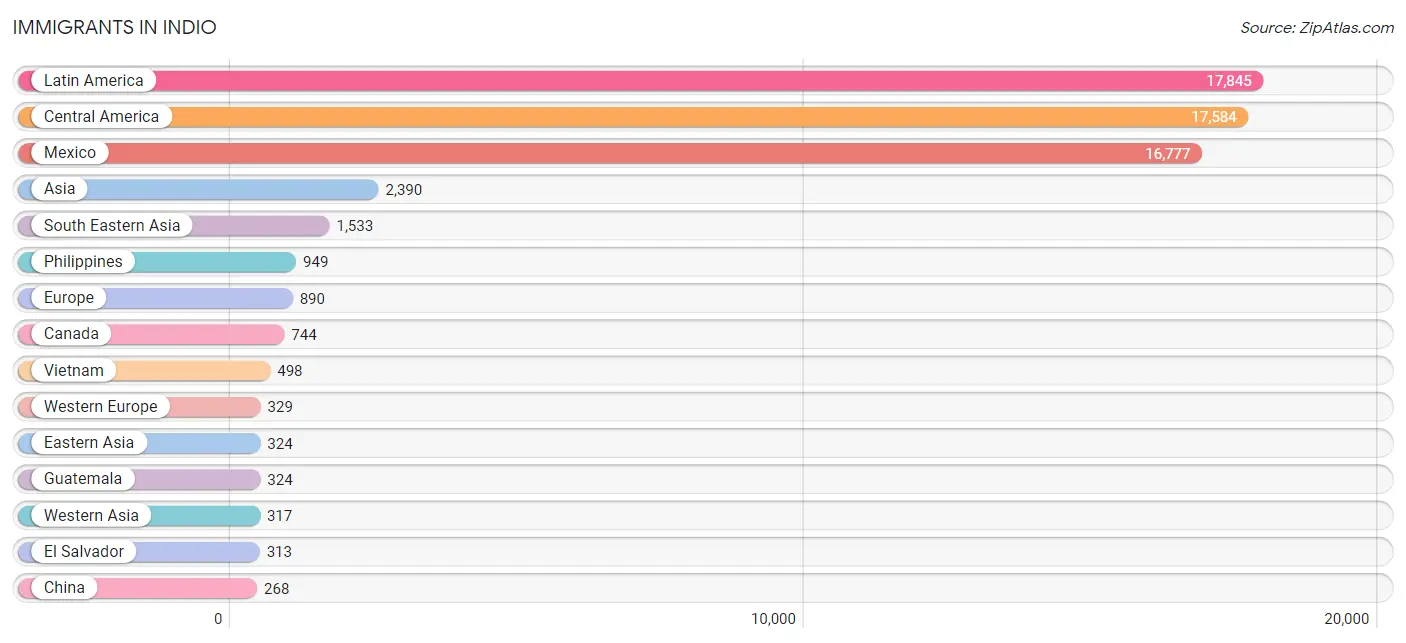
Immigrants in Indio
The most numerous immigrant groups reported in Indio came from Latin America (17,845 | 19.9%), Central America (17,584 | 19.6%), Mexico (16,777 | 18.7%), Asia (2,390 | 2.7%), and South Eastern Asia (1,533 | 1.7%), together accounting for 62.6% of all Indio residents.
| Immigration Origin | # Population | % Population |
| Africa | 51 | 0.1% |
| Albania | 69 | 0.1% |
| Argentina | 41 | 0.1% |
| Asia | 2,390 | 2.7% |
| Australia | 78 | 0.1% |
| Austria | 22 | 0.0% |
| Barbados | 9 | 0.0% |
| Brazil | 14 | 0.0% |
| Cambodia | 4 | 0.0% |
| Canada | 744 | 0.8% |
| Caribbean | 101 | 0.1% |
| Central America | 17,584 | 19.6% |
| Chile | 19 | 0.0% |
| China | 268 | 0.3% |
| Colombia | 53 | 0.1% |
| Cuba | 21 | 0.0% |
| Czechoslovakia | 11 | 0.0% |
| Denmark | 33 | 0.0% |
| Eastern Africa | 6 | 0.0% |
| Eastern Asia | 324 | 0.4% |
| Eastern Europe | 229 | 0.3% |
| Ecuador | 10 | 0.0% |
| El Salvador | 313 | 0.4% |
| England | 85 | 0.1% |
| Europe | 890 | 1.0% |
| Fiji | 28 | 0.0% |
| France | 75 | 0.1% |
| Germany | 187 | 0.2% |
| Greece | 29 | 0.0% |
| Guatemala | 324 | 0.4% |
| Honduras | 140 | 0.2% |
| Hong Kong | 65 | 0.1% |
| Hungary | 67 | 0.1% |
| India | 60 | 0.1% |
| Iran | 156 | 0.2% |
| Iraq | 174 | 0.2% |
| Israel | 44 | 0.1% |
| Italy | 105 | 0.1% |
| Jamaica | 63 | 0.1% |
| Japan | 15 | 0.0% |
| Jordan | 27 | 0.0% |
| Korea | 41 | 0.1% |
| Latin America | 17,845 | 19.9% |
| Mexico | 16,777 | 18.7% |
| Netherlands | 29 | 0.0% |
| Nicaragua | 30 | 0.0% |
| Northern Europe | 188 | 0.2% |
| Oceania | 163 | 0.2% |
| Peru | 23 | 0.0% |
| Philippines | 949 | 1.1% |
| Poland | 14 | 0.0% |
| Romania | 52 | 0.1% |
| Russia | 16 | 0.0% |
| Scotland | 23 | 0.0% |
| South Africa | 45 | 0.1% |
| South America | 160 | 0.2% |
| South Central Asia | 216 | 0.2% |
| South Eastern Asia | 1,533 | 1.7% |
| Southern Europe | 144 | 0.2% |
| Spain | 10 | 0.0% |
| Sweden | 11 | 0.0% |
| Switzerland | 16 | 0.0% |
| Syria | 17 | 0.0% |
| Taiwan | 20 | 0.0% |
| Thailand | 82 | 0.1% |
| Trinidad and Tobago | 8 | 0.0% |
| Turkey | 47 | 0.1% |
| Vietnam | 498 | 0.6% |
| Western Asia | 317 | 0.4% |
| Western Europe | 329 | 0.4% | View All 70 Rows |
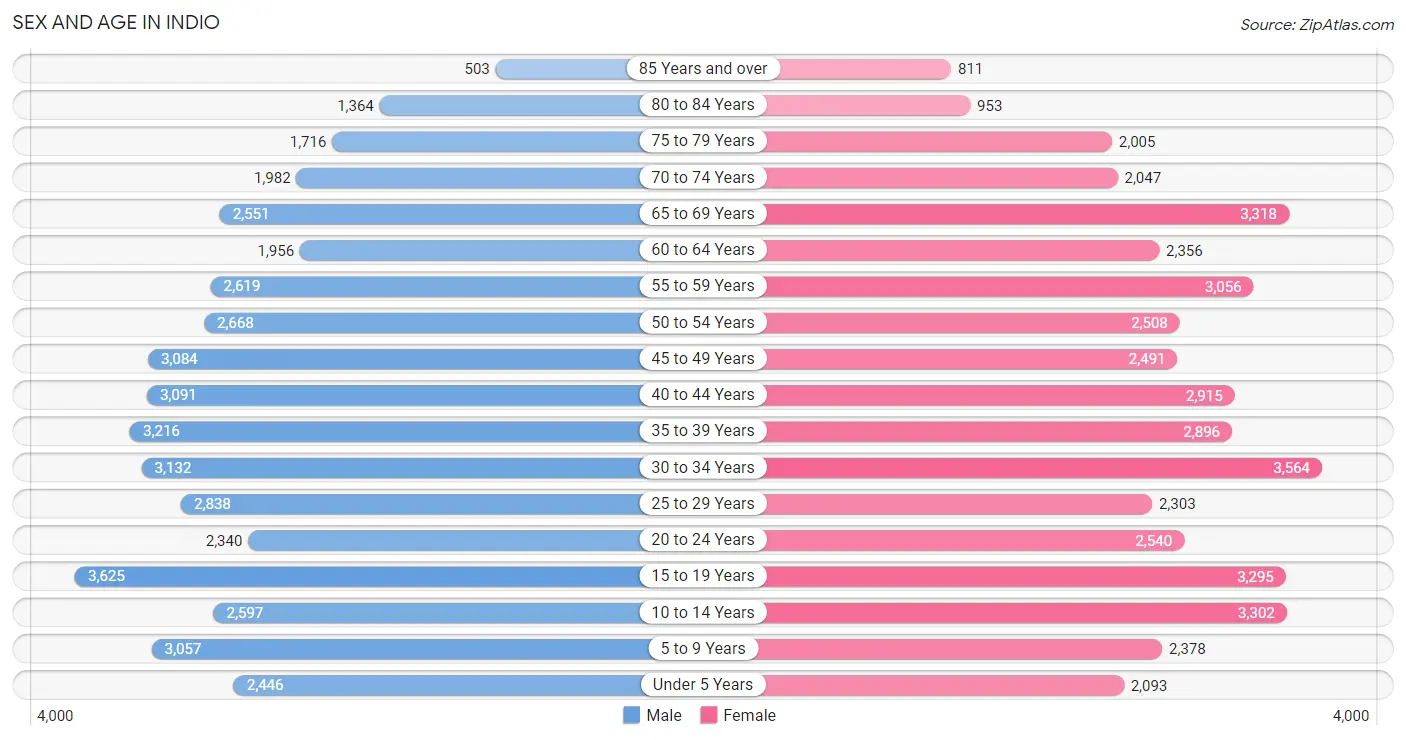
Sex and Age in Indio
Sex and Age in Indio
The most populous age groups in Indio are 15 to 19 Years (3,625 | 8.1%) for men and 30 to 34 Years (3,564 | 8.0%) for women.
| Age Bracket | Male | Female |
| Under 5 Years | 2,446 (5.5%) | 2,093 (4.7%) |
| 5 to 9 Years | 3,057 (6.8%) | 2,378 (5.3%) |
| 10 to 14 Years | 2,597 (5.8%) | 3,302 (7.4%) |
| 15 to 19 Years | 3,625 (8.1%) | 3,295 (7.3%) |
| 20 to 24 Years | 2,340 (5.2%) | 2,540 (5.7%) |
| 25 to 29 Years | 2,838 (6.3%) | 2,303 (5.1%) |
| 30 to 34 Years | 3,132 (7.0%) | 3,564 (8.0%) |
| 35 to 39 Years | 3,216 (7.2%) | 2,896 (6.5%) |
| 40 to 44 Years | 3,091 (6.9%) | 2,915 (6.5%) |
| 45 to 49 Years | 3,084 (6.9%) | 2,491 (5.6%) |
| 50 to 54 Years | 2,668 (6.0%) | 2,508 (5.6%) |
| 55 to 59 Years | 2,619 (5.9%) | 3,056 (6.8%) |
| 60 to 64 Years | 1,956 (4.4%) | 2,356 (5.3%) |
| 65 to 69 Years | 2,551 (5.7%) | 3,318 (7.4%) |
| 70 to 74 Years | 1,982 (4.4%) | 2,047 (4.6%) |
| 75 to 79 Years | 1,716 (3.8%) | 2,005 (4.5%) |
| 80 to 84 Years | 1,364 (3.0%) | 953 (2.1%) |
| 85 Years and over | 503 (1.1%) | 811 (1.8%) |
| Total | 44,785 (100.0%) | 44,831 (100.0%) |
Families and Households in Indio
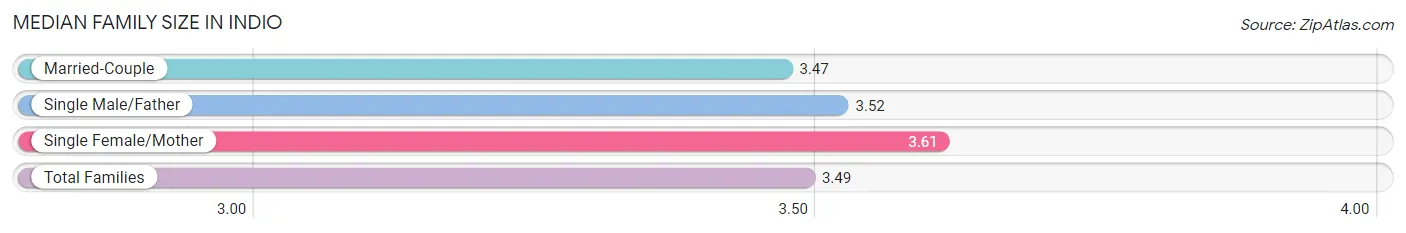
Median Family Size in Indio
The median family size in Indio is 3.49 persons per family, with single female/mother families (3,450 | 16.2%) accounting for the largest median family size of 3.61 persons per family. On the other hand, married-couple families (16,428 | 77.0%) represent the smallest median family size with 3.47 persons per family.
| Family Type | # Families | Family Size |
| Married-Couple | 16,428 (77.0%) | 3.47 |
| Single Male/Father | 1,446 (6.8%) | 3.52 |
| Single Female/Mother | 3,450 (16.2%) | 3.61 |
| Total Families | 21,324 (100.0%) | 3.49 |
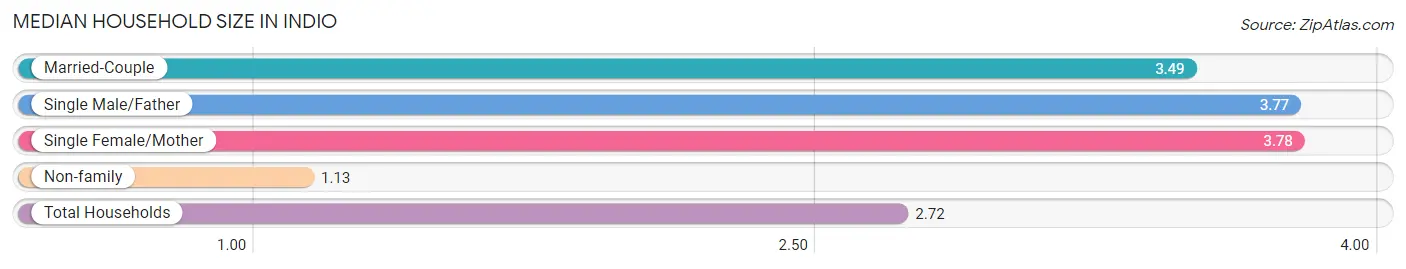
Median Household Size in Indio
The median household size in Indio is 2.72 persons per household, with single female/mother households (3,450 | 10.6%) accounting for the largest median household size of 3.78 persons per household. non-family households (11,255 | 34.5%) represent the smallest median household size with 1.13 persons per household.
| Household Type | # Households | Household Size |
| Married-Couple | 16,428 (50.4%) | 3.49 |
| Single Male/Father | 1,446 (4.4%) | 3.77 |
| Single Female/Mother | 3,450 (10.6%) | 3.78 |
| Non-family | 11,255 (34.5%) | 1.13 |
| Total Households | 32,579 (100.0%) | 2.72 |
Household Size by Marriage Status in Indio
Out of a total of 32,579 households in Indio, 21,324 (65.4%) are family households, while 11,255 (34.5%) are nonfamily households. The most numerous type of family households are 2-person households, comprising 8,884, and the most common type of nonfamily households are 1-person households, comprising 10,109.
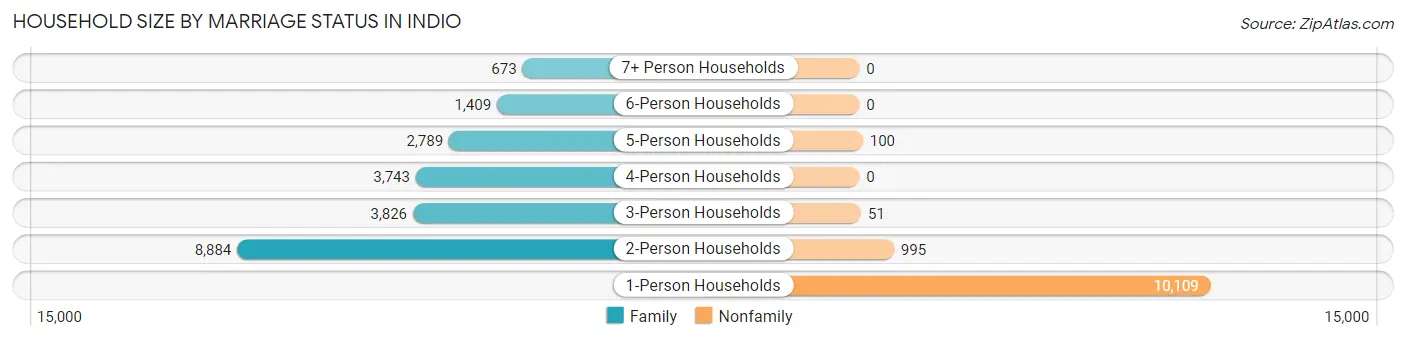
| Household Size | Family Households | Nonfamily Households |
| 1-Person Households | - | 10,109 (31.0%) |
| 2-Person Households | 8,884 (27.3%) | 995 (3.0%) |
| 3-Person Households | 3,826 (11.7%) | 51 (0.2%) |
| 4-Person Households | 3,743 (11.5%) | 0 (0.0%) |
| 5-Person Households | 2,789 (8.6%) | 100 (0.3%) |
| 6-Person Households | 1,409 (4.3%) | 0 (0.0%) |
| 7+ Person Households | 673 (2.1%) | 0 (0.0%) |
| Total | 21,324 (65.4%) | 11,255 (34.5%) |
Female Fertility in Indio
Fertility by Age in Indio
Average fertility rate in Indio is 38.0 births per 1,000 women. Women in the age bracket of 20 to 34 years have the highest fertility rate with 76.0 births per 1,000 women. Women in the age bracket of 20 to 34 years acount for 82.6% of all women with births.
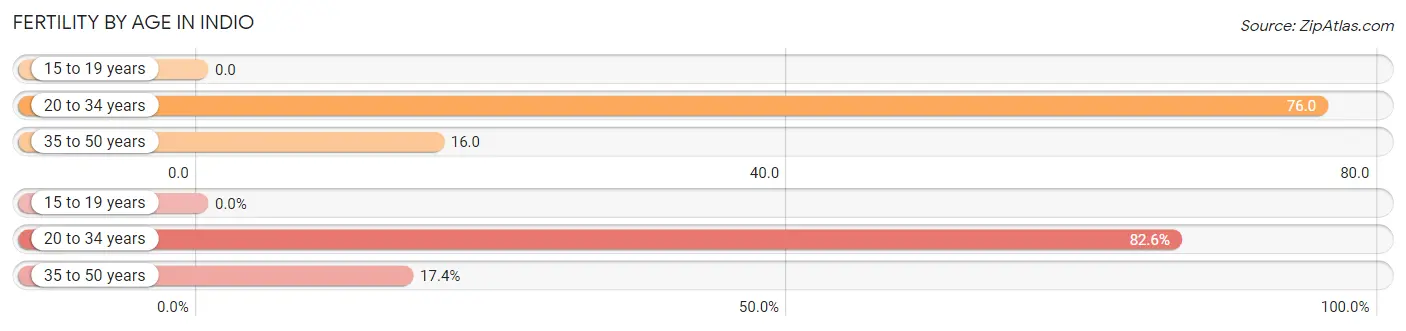
| Age Bracket | Women with Births | Births / 1,000 Women |
| 15 to 19 years | 0 (0.0%) | 0.0 |
| 20 to 34 years | 641 (82.6%) | 76.0 |
| 35 to 50 years | 135 (17.4%) | 16.0 |
| Total | 776 (100.0%) | 38.0 |
Fertility by Age by Marriage Status in Indio
74.6% of women with births (776) in Indio are married. The highest percentage of unmarried women with births falls into 20 to 34 years age bracket with 29.3% of them unmarried at the time of birth, while the lowest percentage of unmarried women with births belong to 35 to 50 years age bracket with 6.7% of them unmarried.
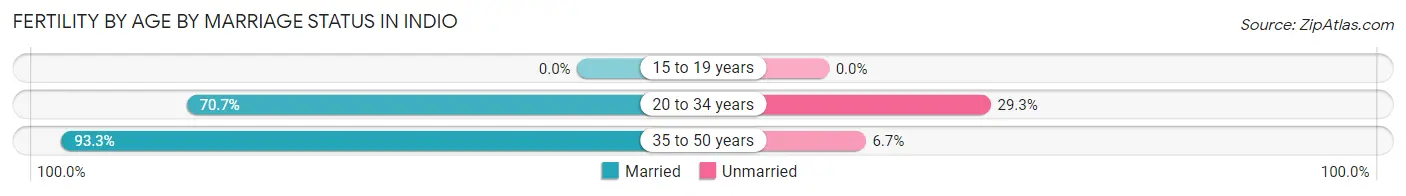
| Age Bracket | Married | Unmarried |
| 15 to 19 years | 0 (0.0%) | 0 (0.0%) |
| 20 to 34 years | 453 (70.7%) | 188 (29.3%) |
| 35 to 50 years | 126 (93.3%) | 9 (6.7%) |
| Total | 579 (74.6%) | 197 (25.4%) |
Fertility by Education in Indio
Average fertility rate in Indio is 38.0 births per 1,000 women. Women with the education attainment of graduate degree have the highest fertility rate of 86.0 births per 1,000 women, while women with the education attainment of less than high school have the lowest fertility at 6.0 births per 1,000 women. Women with the education attainment of college or associate's degree represent 41.9% of all women with births.
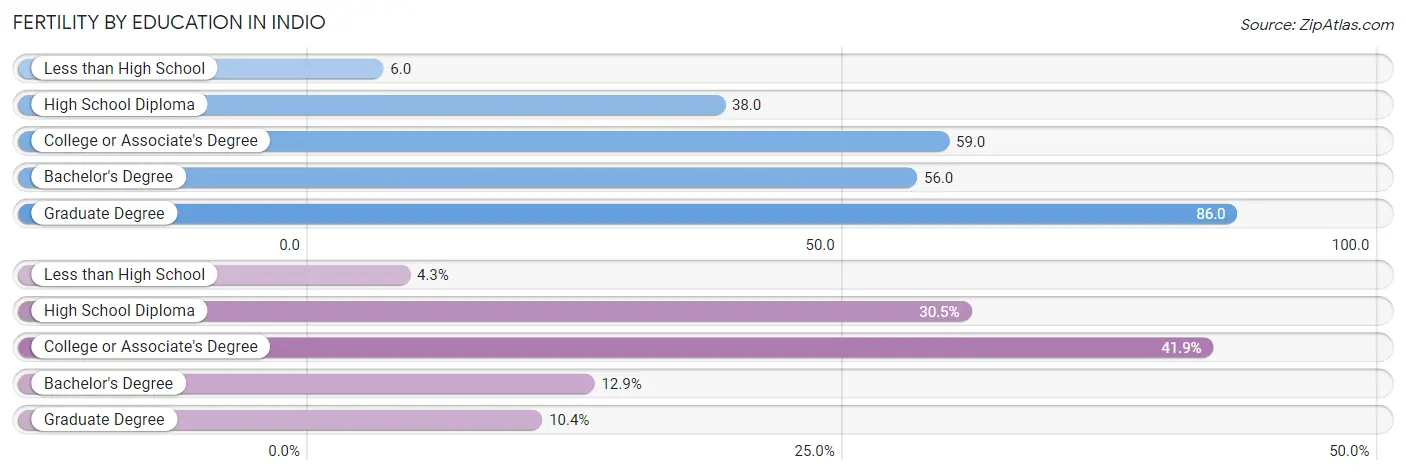
| Educational Attainment | Women with Births | Births / 1,000 Women |
| Less than High School | 33 (4.3%) | 6.0 |
| High School Diploma | 237 (30.5%) | 38.0 |
| College or Associate's Degree | 325 (41.9%) | 59.0 |
| Bachelor's Degree | 100 (12.9%) | 56.0 |
| Graduate Degree | 81 (10.4%) | 86.0 |
| Total | 776 (100.0%) | 38.0 |
Fertility by Education by Marriage Status in Indio
25.4% of women with births in Indio are unmarried. Women with the educational attainment of bachelor's degree are most likely to be married with 100.0% of them married at childbirth, while women with the educational attainment of high school diploma are least likely to be married with 53.2% of them unmarried at childbirth.
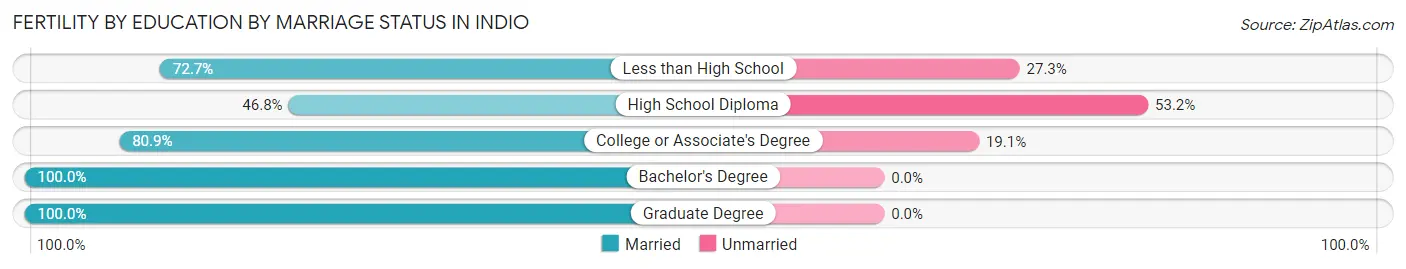
| Educational Attainment | Married | Unmarried |
| Less than High School | 24 (72.7%) | 9 (27.3%) |
| High School Diploma | 111 (46.8%) | 126 (53.2%) |
| College or Associate's Degree | 263 (80.9%) | 62 (19.1%) |
| Bachelor's Degree | 100 (100.0%) | 0 (0.0%) |
| Graduate Degree | 81 (100.0%) | 0 (0.0%) |
| Total | 579 (74.6%) | 197 (25.4%) |
Employment Characteristics in Indio
Employment by Class of Employer in Indio
Among the 39,011 employed individuals in Indio, private company employees (27,846 | 71.4%), local government employees (3,083 | 7.9%), and self-employed (not incorporated) (2,564 | 6.6%) make up the most common classes of employment.
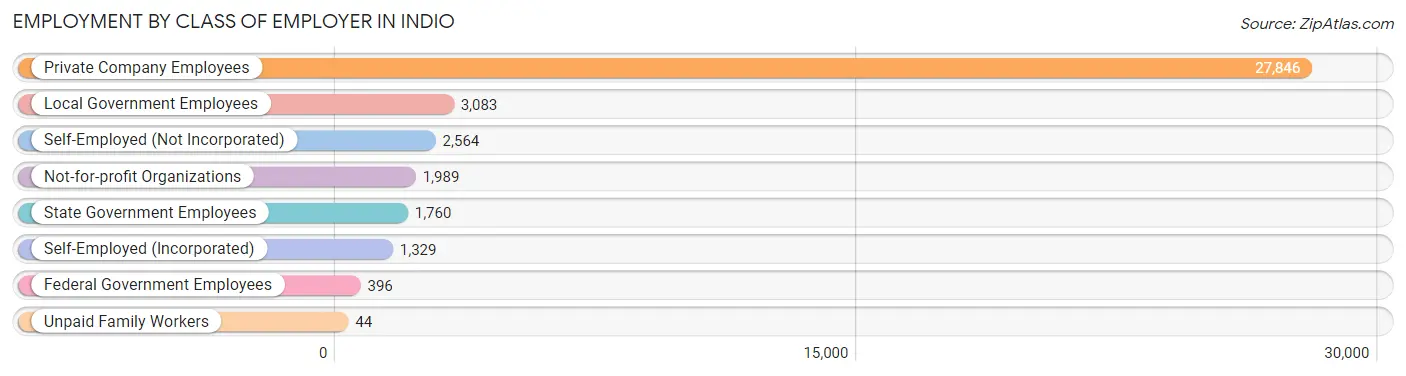
| Employer Class | # Employees | % Employees |
| Private Company Employees | 27,846 | 71.4% |
| Self-Employed (Incorporated) | 1,329 | 3.4% |
| Self-Employed (Not Incorporated) | 2,564 | 6.6% |
| Not-for-profit Organizations | 1,989 | 5.1% |
| Local Government Employees | 3,083 | 7.9% |
| State Government Employees | 1,760 | 4.5% |
| Federal Government Employees | 396 | 1.0% |
| Unpaid Family Workers | 44 | 0.1% |
| Total | 39,011 | 100.0% |
Employment Status by Age in Indio
According to the labor force statistics for Indio, out of the total population over 16 years of age (71,986), 59.9% or 43,120 individuals are in the labor force, with 7.3% or 3,148 of them unemployed. The age group with the highest labor force participation rate is 35 to 44 years, with 87.7% or 10,627 individuals in the labor force. Within the labor force, the 20 to 24 years age range has the highest percentage of unemployed individuals, with 16.7% or 580 of them being unemployed.
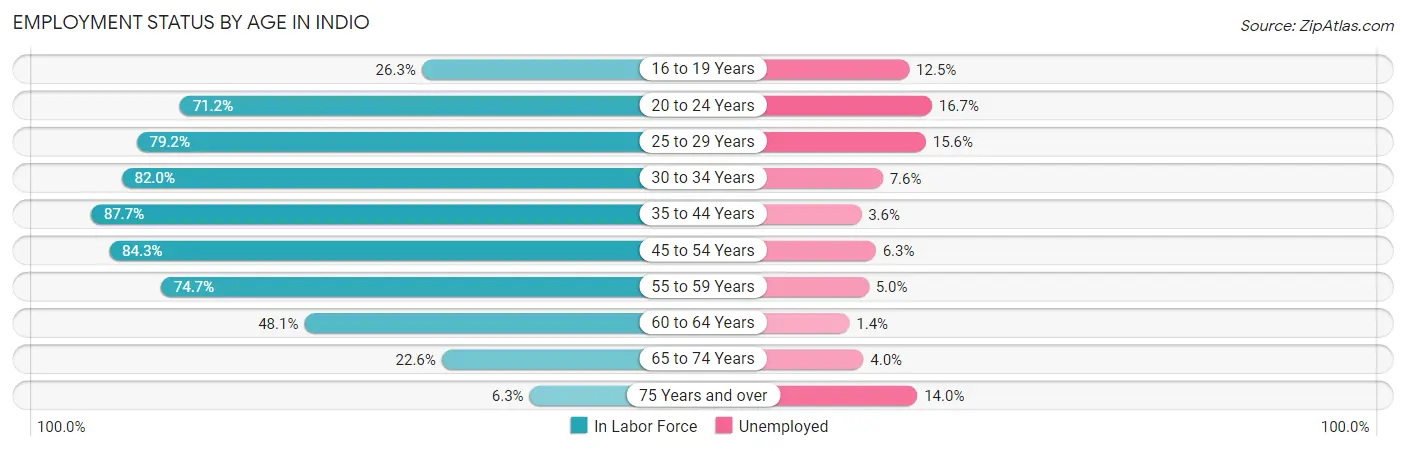
| Age Bracket | In Labor Force | Unemployed |
| 16 to 19 Years | 1,358 (26.3%) | 170 (12.5%) |
| 20 to 24 Years | 3,475 (71.2%) | 580 (16.7%) |
| 25 to 29 Years | 4,072 (79.2%) | 635 (15.6%) |
| 30 to 34 Years | 5,491 (82.0%) | 417 (7.6%) |
| 35 to 44 Years | 10,627 (87.7%) | 383 (3.6%) |
| 45 to 54 Years | 9,063 (84.3%) | 571 (6.3%) |
| 55 to 59 Years | 4,239 (74.7%) | 212 (5.0%) |
| 60 to 64 Years | 2,074 (48.1%) | 29 (1.4%) |
| 65 to 74 Years | 2,237 (22.6%) | 89 (4.0%) |
| 75 Years and over | 463 (6.3%) | 65 (14.0%) |
| Total | 43,120 (59.9%) | 3,148 (7.3%) |
Employment Status by Educational Attainment in Indio
According to labor force statistics for Indio, 79.6% of individuals (35,576) out of the total population between 25 and 64 years of age (44,693) are in the labor force, with 6.3% or 2,241 of them being unemployed. The group with the highest labor force participation rate are those with the educational attainment of bachelor's degree or higher, with 83.8% or 6,215 individuals in the labor force. Within the labor force, individuals with less than high school education have the highest percentage of unemployment, with 8.3% or 631 of them being unemployed.
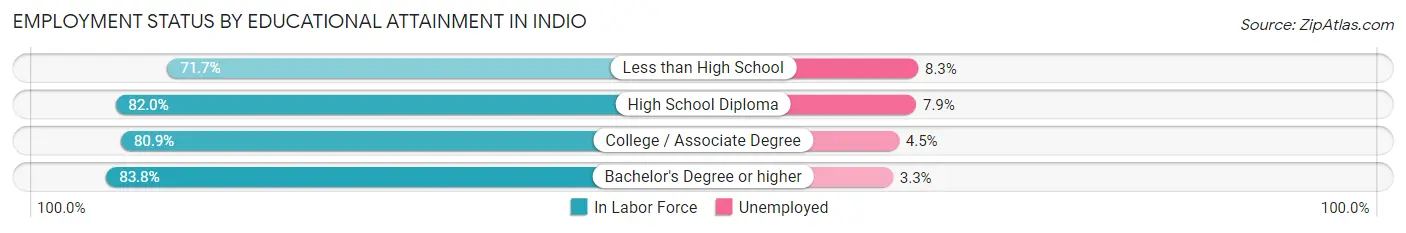
| Educational Attainment | In Labor Force | Unemployed |
| Less than High School | 7,605 (71.7%) | 880 (8.3%) |
| High School Diploma | 12,585 (82.0%) | 1,212 (7.9%) |
| College / Associate Degree | 9,159 (80.9%) | 509 (4.5%) |
| Bachelor's Degree or higher | 6,215 (83.8%) | 245 (3.3%) |
| Total | 35,576 (79.6%) | 2,816 (6.3%) |
Employment Occupations by Sex in Indio
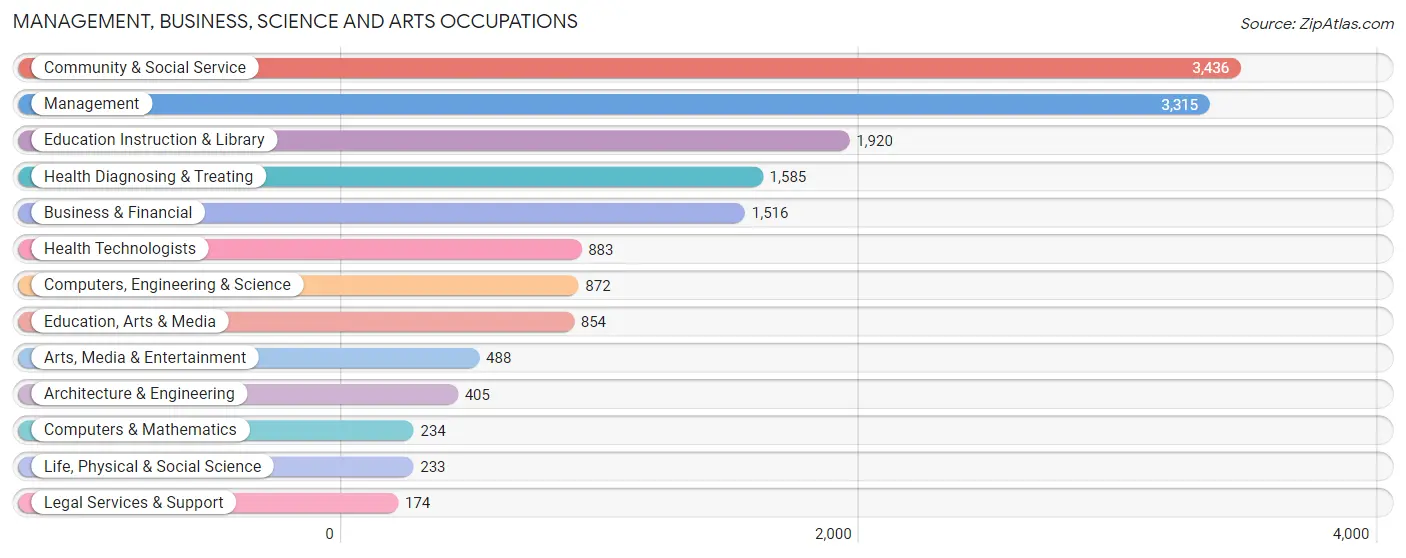
Management, Business, Science and Arts Occupations
The most common Management, Business, Science and Arts occupations in Indio are Community & Social Service (3,436 | 8.6%), Management (3,315 | 8.3%), Education Instruction & Library (1,920 | 4.8%), Health Diagnosing & Treating (1,585 | 4.0%), and Business & Financial (1,516 | 3.8%).
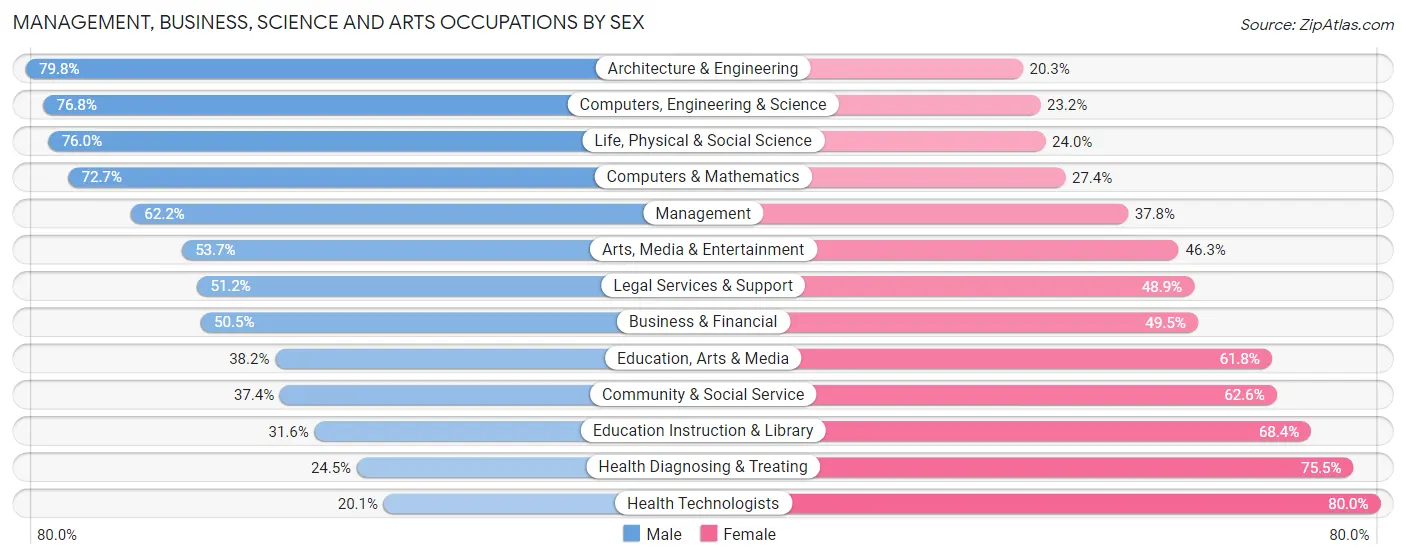
Management, Business, Science and Arts Occupations by Sex
Within the Management, Business, Science and Arts occupations in Indio, the most male-oriented occupations are Architecture & Engineering (79.7%), Computers, Engineering & Science (76.8%), and Life, Physical & Social Science (76.0%), while the most female-oriented occupations are Health Technologists (79.9%), Health Diagnosing & Treating (75.5%), and Education Instruction & Library (68.4%).
| Occupation | Male | Female |
| Management | 2,061 (62.2%) | 1,254 (37.8%) |
| Business & Financial | 766 (50.5%) | 750 (49.5%) |
| Computers, Engineering & Science | 670 (76.8%) | 202 (23.2%) |
| Computers & Mathematics | 170 (72.7%) | 64 (27.4%) |
| Architecture & Engineering | 323 (79.7%) | 82 (20.3%) |
| Life, Physical & Social Science | 177 (76.0%) | 56 (24.0%) |
| Community & Social Service | 1,284 (37.4%) | 2,152 (62.6%) |
| Education, Arts & Media | 326 (38.2%) | 528 (61.8%) |
| Legal Services & Support | 89 (51.1%) | 85 (48.8%) |
| Education Instruction & Library | 607 (31.6%) | 1,313 (68.4%) |
| Arts, Media & Entertainment | 262 (53.7%) | 226 (46.3%) |
| Health Diagnosing & Treating | 389 (24.5%) | 1,196 (75.5%) |
| Health Technologists | 177 (20.1%) | 706 (79.9%) |
| Total (Category) | 5,170 (48.2%) | 5,554 (51.8%) |
| Total (Overall) | 21,881 (54.8%) | 18,035 (45.2%) |
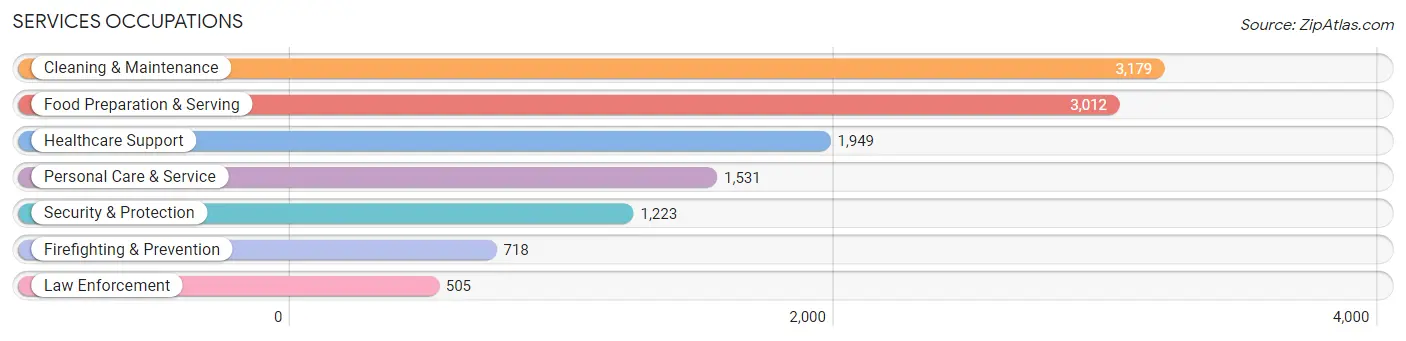
Services Occupations
The most common Services occupations in Indio are Cleaning & Maintenance (3,179 | 8.0%), Food Preparation & Serving (3,012 | 7.5%), Healthcare Support (1,949 | 4.9%), Personal Care & Service (1,531 | 3.8%), and Security & Protection (1,223 | 3.1%).
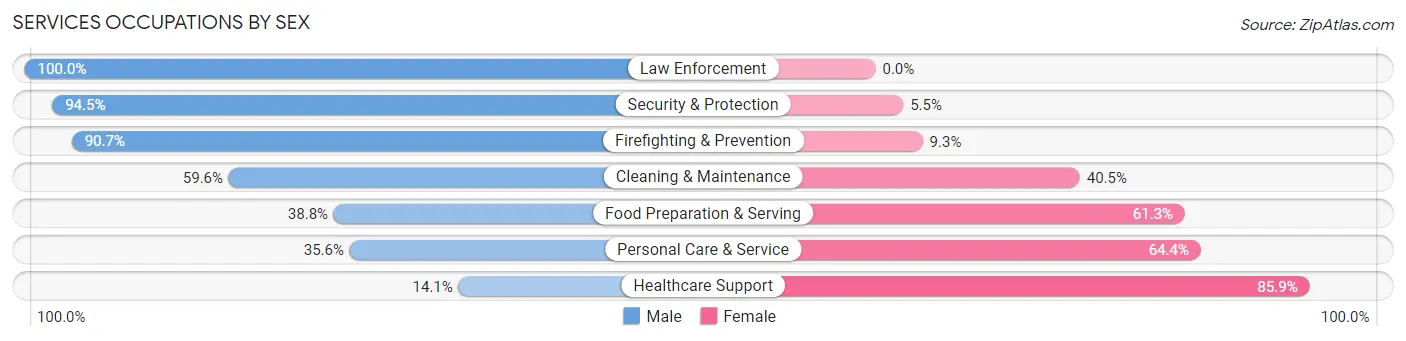
Services Occupations by Sex
Within the Services occupations in Indio, the most male-oriented occupations are Law Enforcement (100.0%), Security & Protection (94.5%), and Firefighting & Prevention (90.7%), while the most female-oriented occupations are Healthcare Support (85.9%), Personal Care & Service (64.4%), and Food Preparation & Serving (61.3%).
| Occupation | Male | Female |
| Healthcare Support | 274 (14.1%) | 1,675 (85.9%) |
| Security & Protection | 1,156 (94.5%) | 67 (5.5%) |
| Firefighting & Prevention | 651 (90.7%) | 67 (9.3%) |
| Law Enforcement | 505 (100.0%) | 0 (0.0%) |
| Food Preparation & Serving | 1,167 (38.8%) | 1,845 (61.3%) |
| Cleaning & Maintenance | 1,893 (59.6%) | 1,286 (40.5%) |
| Personal Care & Service | 545 (35.6%) | 986 (64.4%) |
| Total (Category) | 5,035 (46.2%) | 5,859 (53.8%) |
| Total (Overall) | 21,881 (54.8%) | 18,035 (45.2%) |
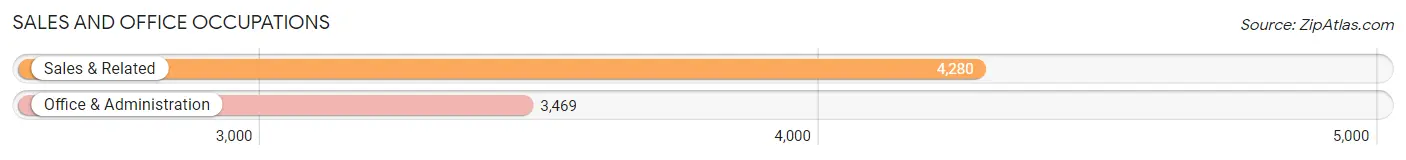
Sales and Office Occupations
The most common Sales and Office occupations in Indio are Sales & Related (4,280 | 10.7%), and Office & Administration (3,469 | 8.7%).
Sales and Office Occupations by Sex
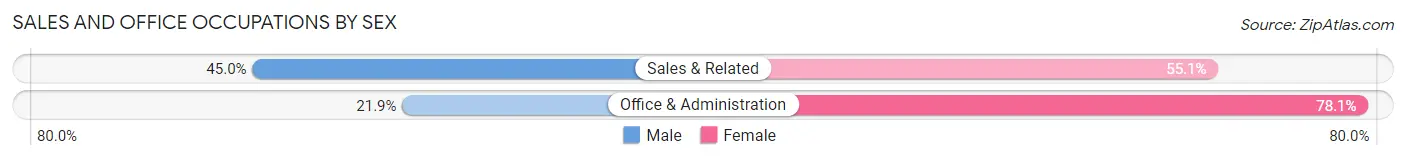
| Occupation | Male | Female |
| Sales & Related | 1,924 (45.0%) | 2,356 (55.0%) |
| Office & Administration | 759 (21.9%) | 2,710 (78.1%) |
| Total (Category) | 2,683 (34.6%) | 5,066 (65.4%) |
| Total (Overall) | 21,881 (54.8%) | 18,035 (45.2%) |
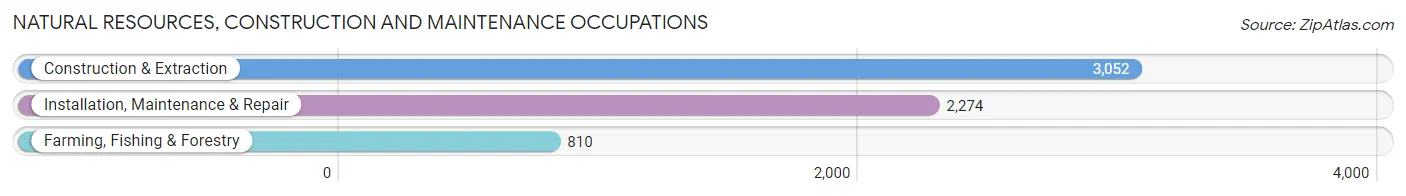
Natural Resources, Construction and Maintenance Occupations
The most common Natural Resources, Construction and Maintenance occupations in Indio are Construction & Extraction (3,052 | 7.6%), Installation, Maintenance & Repair (2,274 | 5.7%), and Farming, Fishing & Forestry (810 | 2.0%).
Natural Resources, Construction and Maintenance Occupations by Sex
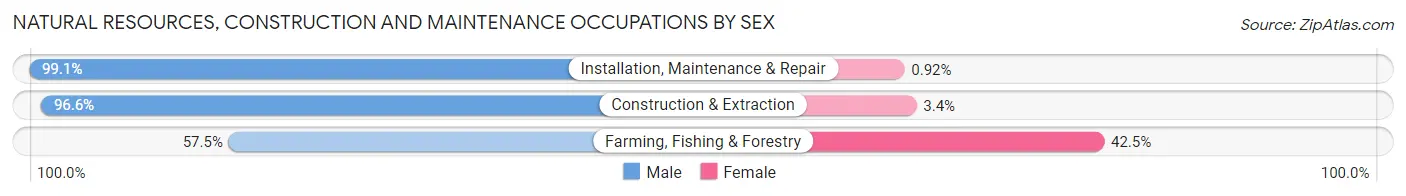
| Occupation | Male | Female |
| Farming, Fishing & Forestry | 466 (57.5%) | 344 (42.5%) |
| Construction & Extraction | 2,948 (96.6%) | 104 (3.4%) |
| Installation, Maintenance & Repair | 2,253 (99.1%) | 21 (0.9%) |
| Total (Category) | 5,667 (92.4%) | 469 (7.6%) |
| Total (Overall) | 21,881 (54.8%) | 18,035 (45.2%) |
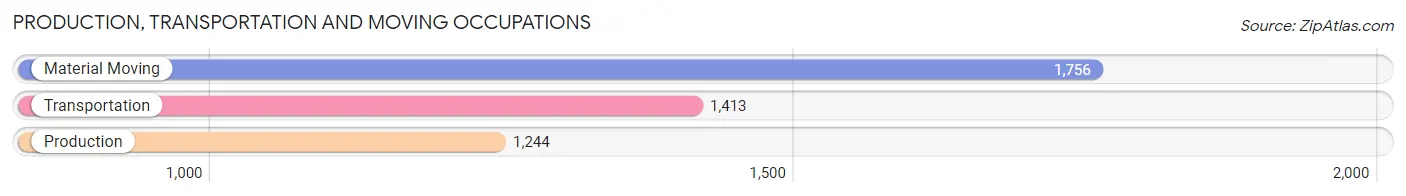
Production, Transportation and Moving Occupations
The most common Production, Transportation and Moving occupations in Indio are Material Moving (1,756 | 4.4%), Transportation (1,413 | 3.5%), and Production (1,244 | 3.1%).
Production, Transportation and Moving Occupations by Sex
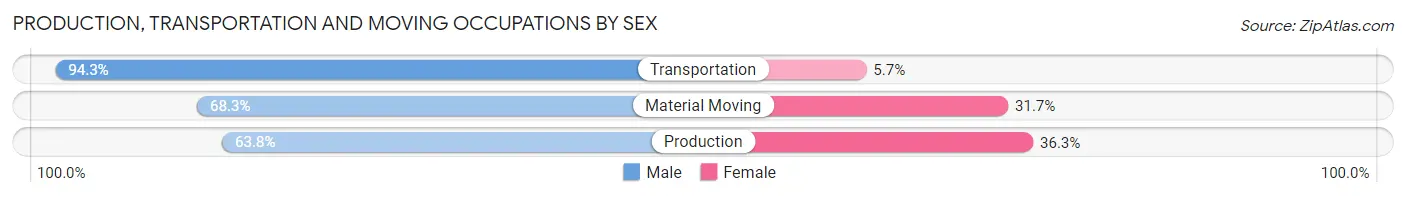
| Occupation | Male | Female |
| Production | 793 (63.7%) | 451 (36.2%) |
| Transportation | 1,333 (94.3%) | 80 (5.7%) |
| Material Moving | 1,200 (68.3%) | 556 (31.7%) |
| Total (Category) | 3,326 (75.4%) | 1,087 (24.6%) |
| Total (Overall) | 21,881 (54.8%) | 18,035 (45.2%) |
Employment Industries by Sex in Indio
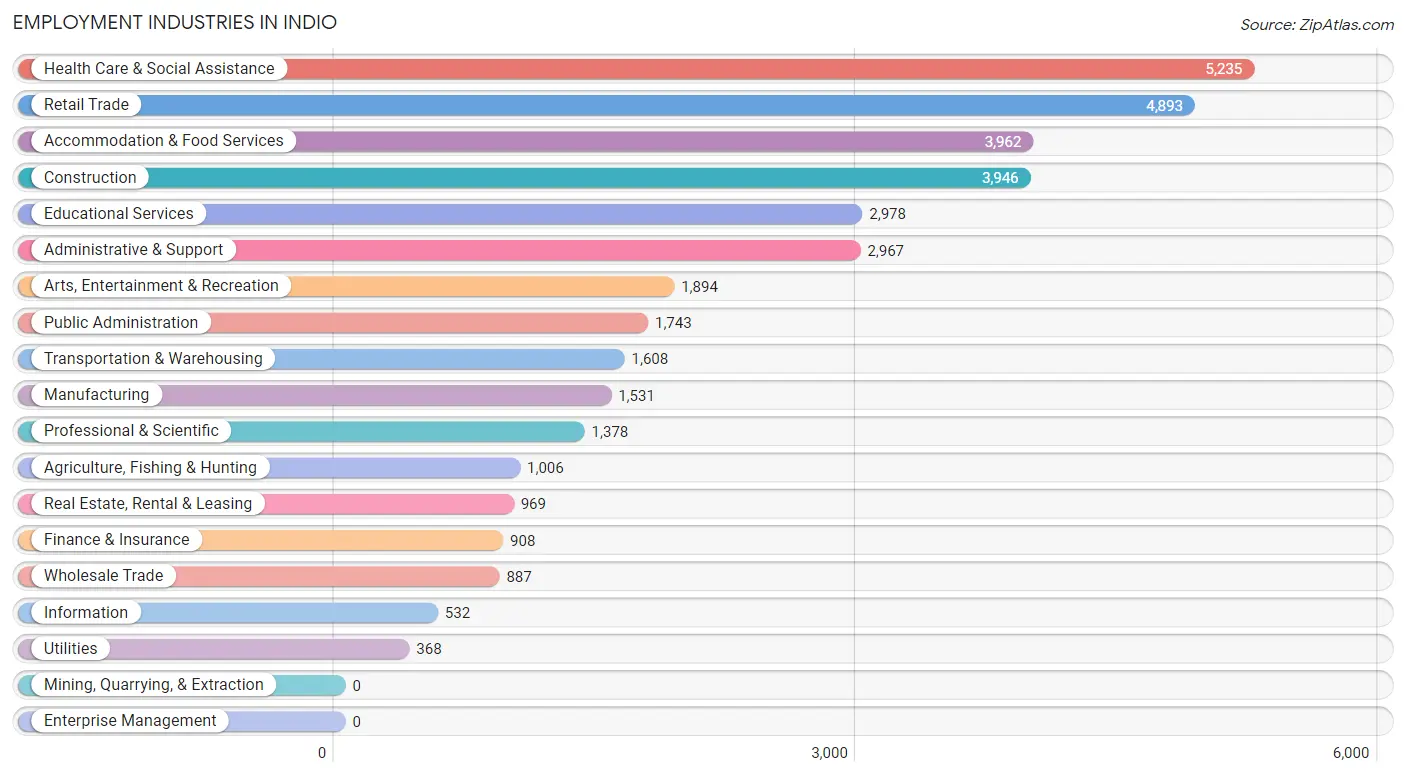
Employment Industries in Indio
The major employment industries in Indio include Health Care & Social Assistance (5,235 | 13.1%), Retail Trade (4,893 | 12.3%), Accommodation & Food Services (3,962 | 9.9%), Construction (3,946 | 9.9%), and Educational Services (2,978 | 7.5%).
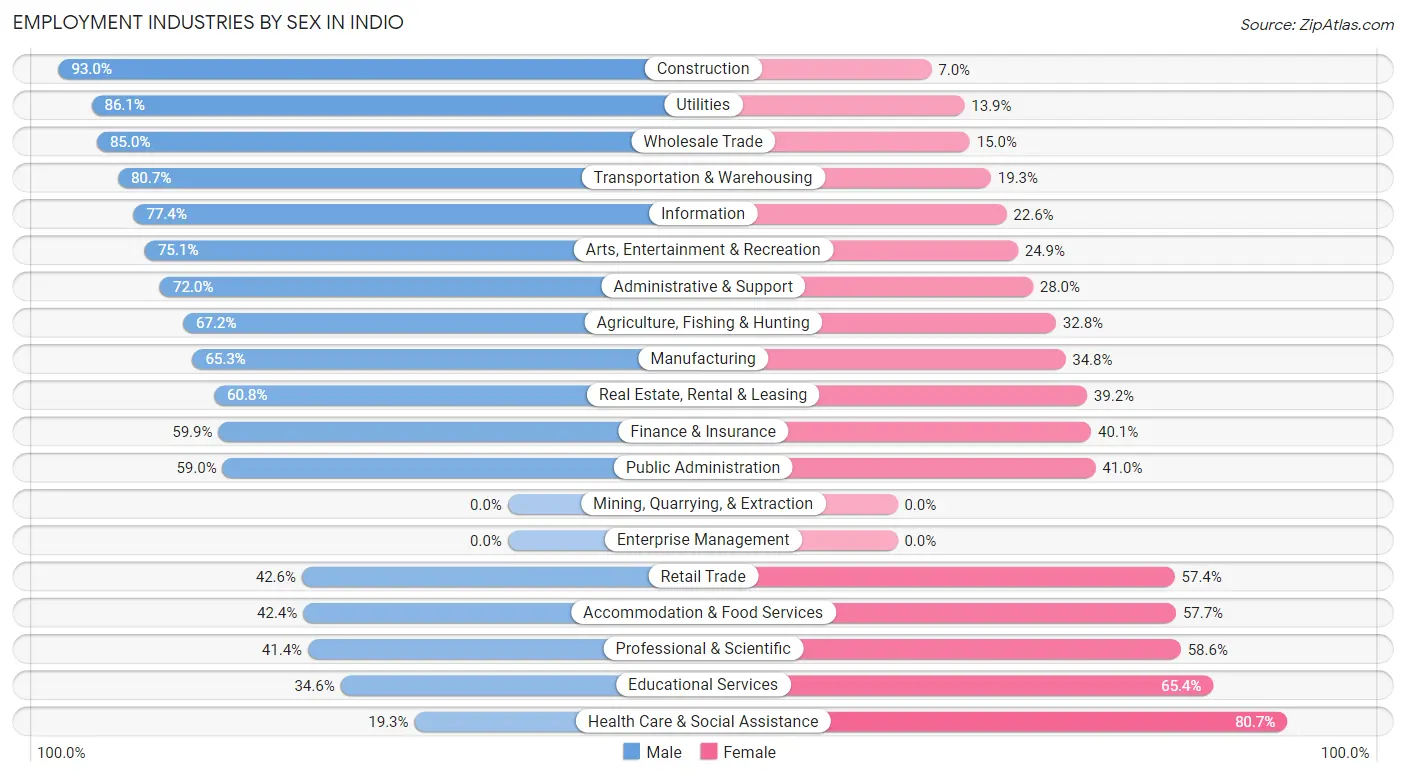
Employment Industries by Sex in Indio
The Indio industries that see more men than women are Construction (93.0%), Utilities (86.1%), and Wholesale Trade (85.0%), whereas the industries that tend to have a higher number of women are Health Care & Social Assistance (80.7%), Educational Services (65.4%), and Professional & Scientific (58.6%).
| Industry | Male | Female |
| Agriculture, Fishing & Hunting | 676 (67.2%) | 330 (32.8%) |
| Mining, Quarrying, & Extraction | 0 (0.0%) | 0 (0.0%) |
| Construction | 3,669 (93.0%) | 277 (7.0%) |
| Manufacturing | 999 (65.2%) | 532 (34.7%) |
| Wholesale Trade | 754 (85.0%) | 133 (15.0%) |
| Retail Trade | 2,086 (42.6%) | 2,807 (57.4%) |
| Transportation & Warehousing | 1,297 (80.7%) | 311 (19.3%) |
| Utilities | 317 (86.1%) | 51 (13.9%) |
| Information | 412 (77.4%) | 120 (22.6%) |
| Finance & Insurance | 544 (59.9%) | 364 (40.1%) |
| Real Estate, Rental & Leasing | 589 (60.8%) | 380 (39.2%) |
| Professional & Scientific | 570 (41.4%) | 808 (58.6%) |
| Enterprise Management | 0 (0.0%) | 0 (0.0%) |
| Administrative & Support | 2,135 (72.0%) | 832 (28.0%) |
| Educational Services | 1,031 (34.6%) | 1,947 (65.4%) |
| Health Care & Social Assistance | 1,012 (19.3%) | 4,223 (80.7%) |
| Arts, Entertainment & Recreation | 1,422 (75.1%) | 472 (24.9%) |
| Accommodation & Food Services | 1,678 (42.3%) | 2,284 (57.7%) |
| Public Administration | 1,029 (59.0%) | 714 (41.0%) |
| Total | 21,881 (54.8%) | 18,035 (45.2%) |
Education in Indio
School Enrollment in Indio
The most common levels of schooling among the 20,265 students in Indio are high school (5,781 | 28.5%), elementary school (4,450 | 22.0%), and middle school (4,244 | 20.9%).
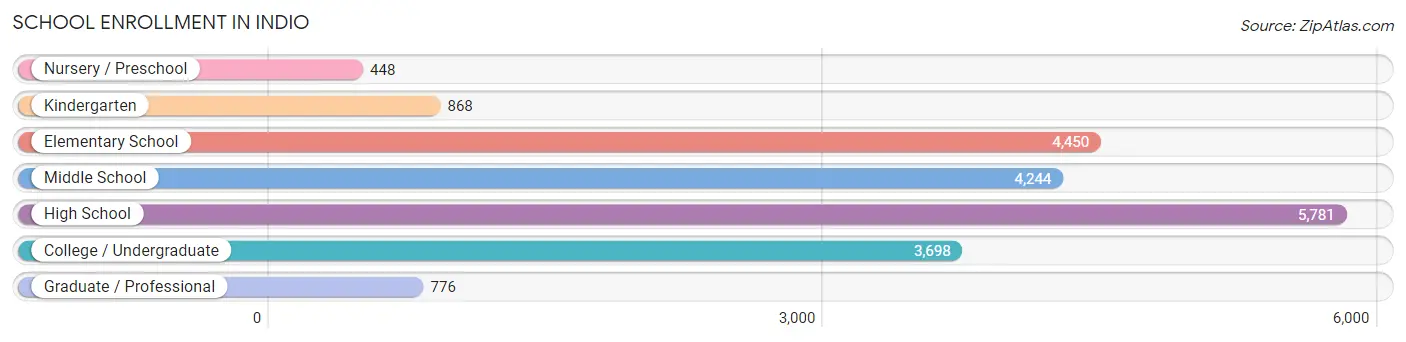
| School Level | # Students | % Students |
| Nursery / Preschool | 448 | 2.2% |
| Kindergarten | 868 | 4.3% |
| Elementary School | 4,450 | 22.0% |
| Middle School | 4,244 | 20.9% |
| High School | 5,781 | 28.5% |
| College / Undergraduate | 3,698 | 18.2% |
| Graduate / Professional | 776 | 3.8% |
| Total | 20,265 | 100.0% |
School Enrollment by Age by Funding Source in Indio
Out of a total of 20,265 students who are enrolled in schools in Indio, 1,662 (8.2%) attend a private institution, while the remaining 18,603 (91.8%) are enrolled in public schools. The age group of 3 to 4 year olds has the highest likelihood of being enrolled in private schools, with 195 (46.5% in the age bracket) enrolled. Conversely, the age group of 20 to 24 year olds has the lowest likelihood of being enrolled in a private school, with 1,602 (98.4% in the age bracket) attending a public institution.
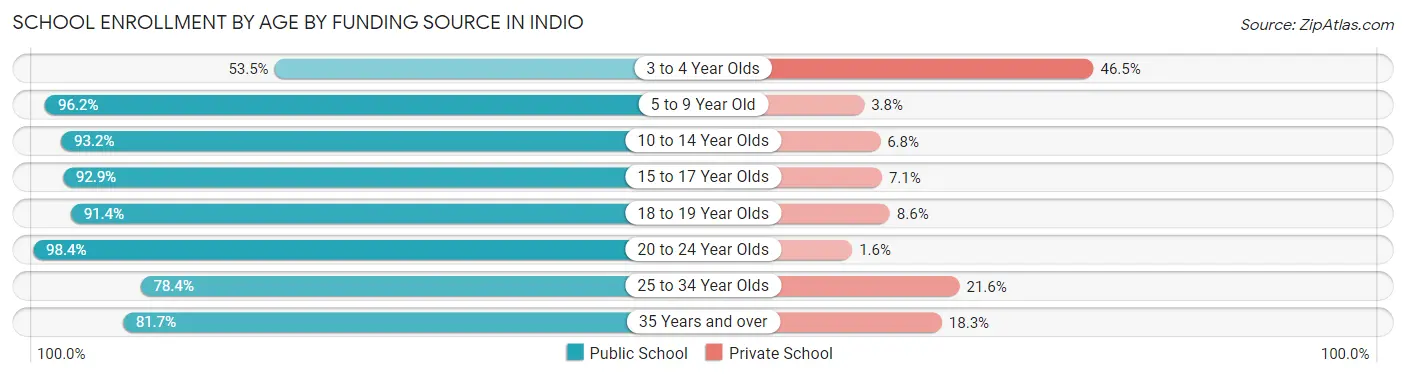
| Age Bracket | Public School | Private School |
| 3 to 4 Year Olds | 224 (53.5%) | 195 (46.5%) |
| 5 to 9 Year Old | 4,496 (96.2%) | 179 (3.8%) |
| 10 to 14 Year Olds | 5,185 (93.2%) | 379 (6.8%) |
| 15 to 17 Year Olds | 4,057 (92.9%) | 312 (7.1%) |
| 18 to 19 Year Olds | 1,285 (91.4%) | 121 (8.6%) |
| 20 to 24 Year Olds | 1,602 (98.4%) | 26 (1.6%) |
| 25 to 34 Year Olds | 944 (78.4%) | 260 (21.6%) |
| 35 Years and over | 817 (81.7%) | 183 (18.3%) |
| Total | 18,603 (91.8%) | 1,662 (8.2%) |
Educational Attainment by Field of Study in Indio
Business (2,956 | 23.2%), education (2,018 | 15.8%), social sciences (1,290 | 10.1%), science & technology (1,217 | 9.5%), and arts & humanities (839 | 6.6%) are the most common fields of study among 12,767 individuals in Indio who have obtained a bachelor's degree or higher.
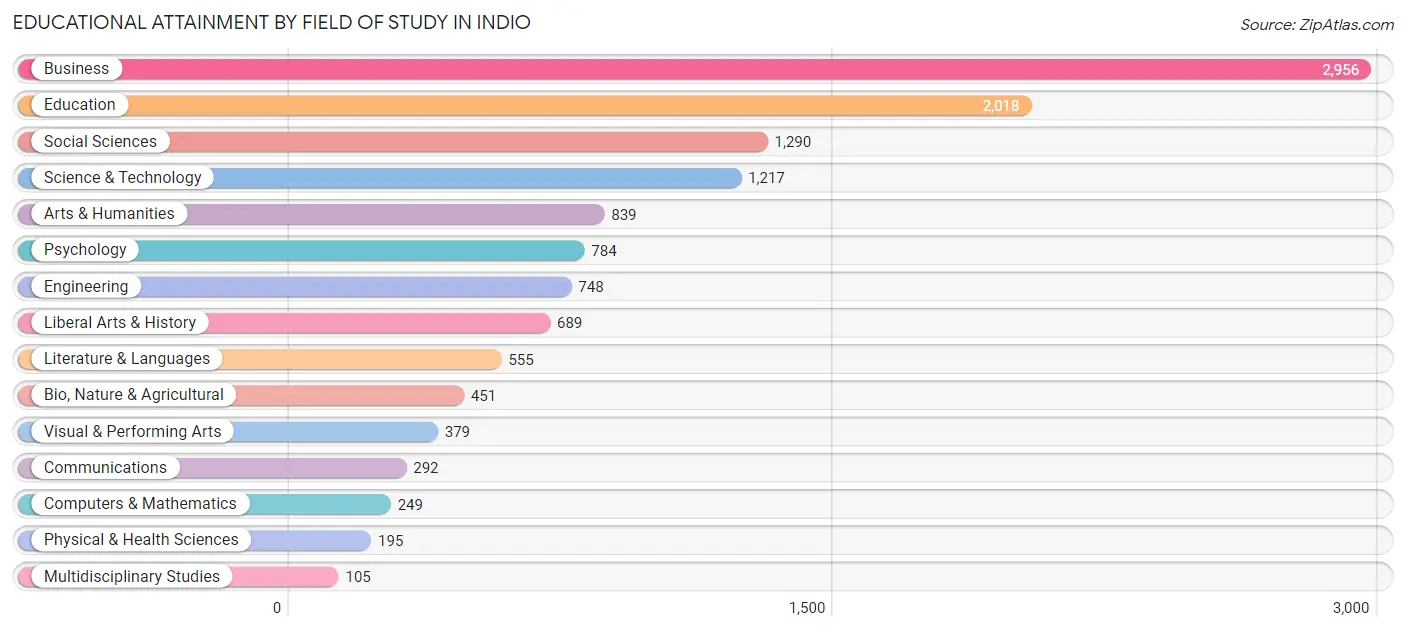
| Field of Study | # Graduates | % Graduates |
| Computers & Mathematics | 249 | 1.9% |
| Bio, Nature & Agricultural | 451 | 3.5% |
| Physical & Health Sciences | 195 | 1.5% |
| Psychology | 784 | 6.1% |
| Social Sciences | 1,290 | 10.1% |
| Engineering | 748 | 5.9% |
| Multidisciplinary Studies | 105 | 0.8% |
| Science & Technology | 1,217 | 9.5% |
| Business | 2,956 | 23.2% |
| Education | 2,018 | 15.8% |
| Literature & Languages | 555 | 4.3% |
| Liberal Arts & History | 689 | 5.4% |
| Visual & Performing Arts | 379 | 3.0% |
| Communications | 292 | 2.3% |
| Arts & Humanities | 839 | 6.6% |
| Total | 12,767 | 100.0% |
Transportation & Commute in Indio
Vehicle Availability by Sex in Indio
The most prevalent vehicle ownership categories in Indio are males with 2 vehicles (8,367, accounting for 38.9%) and females with 2 vehicles (6,843, making up 47.9%).
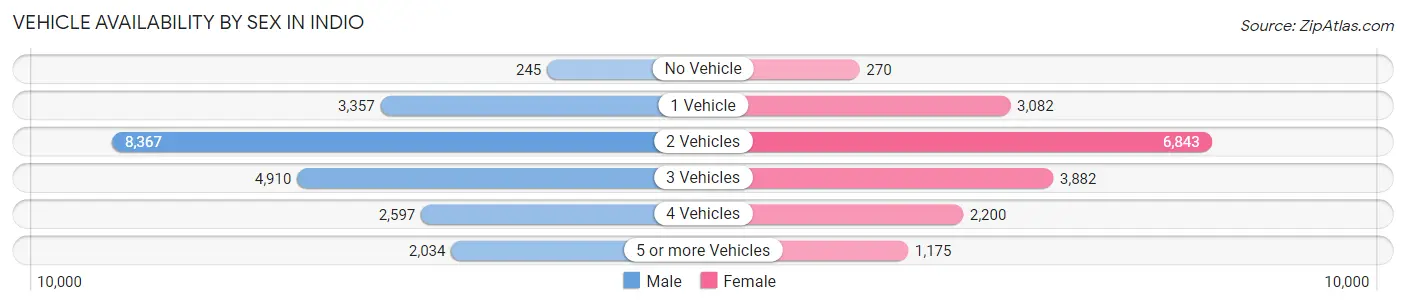
| Vehicles Available | Male | Female |
| No Vehicle | 245 (1.1%) | 270 (1.5%) |
| 1 Vehicle | 3,357 (15.6%) | 3,082 (17.7%) |
| 2 Vehicles | 8,367 (38.9%) | 6,843 (39.2%) |
| 3 Vehicles | 4,910 (22.8%) | 3,882 (22.2%) |
| 4 Vehicles | 2,597 (12.1%) | 2,200 (12.6%) |
| 5 or more Vehicles | 2,034 (9.5%) | 1,175 (6.7%) |
| Total | 21,510 (100.0%) | 17,452 (100.0%) |
Commute Time in Indio
The most frequently occuring commute durations in Indio are 15 to 19 minutes (7,107 commuters, 19.1%), 20 to 24 minutes (6,769 commuters, 18.2%), and 10 to 14 minutes (6,486 commuters, 17.4%).
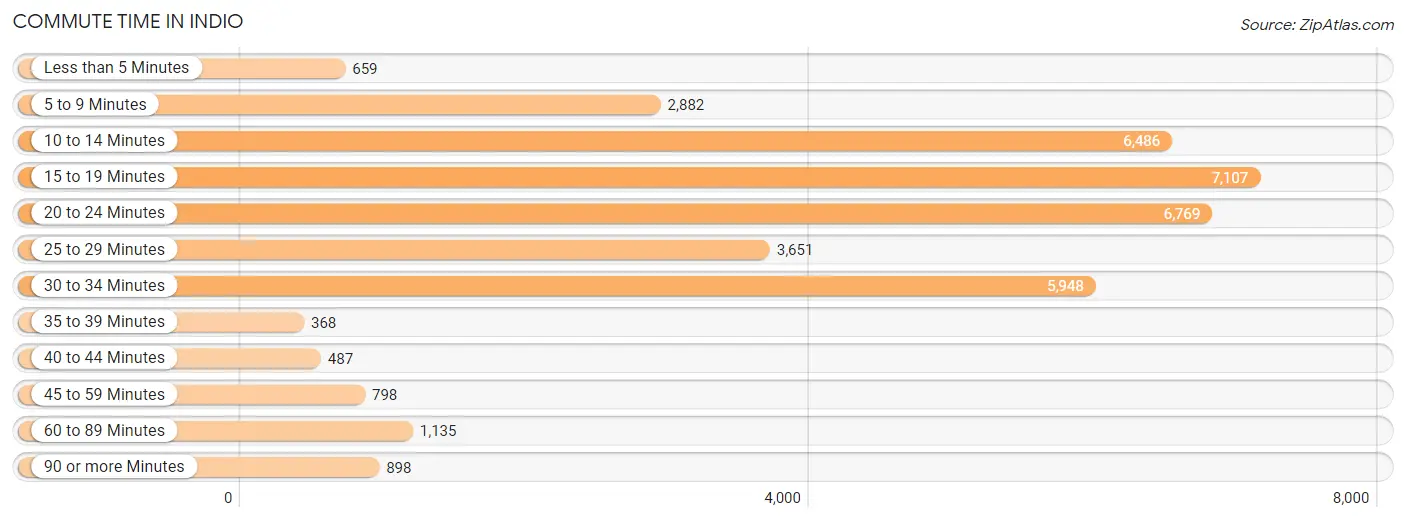
| Commute Time | # Commuters | % Commuters |
| Less than 5 Minutes | 659 | 1.8% |
| 5 to 9 Minutes | 2,882 | 7.7% |
| 10 to 14 Minutes | 6,486 | 17.4% |
| 15 to 19 Minutes | 7,107 | 19.1% |
| 20 to 24 Minutes | 6,769 | 18.2% |
| 25 to 29 Minutes | 3,651 | 9.8% |
| 30 to 34 Minutes | 5,948 | 16.0% |
| 35 to 39 Minutes | 368 | 1.0% |
| 40 to 44 Minutes | 487 | 1.3% |
| 45 to 59 Minutes | 798 | 2.1% |
| 60 to 89 Minutes | 1,135 | 3.0% |
| 90 or more Minutes | 898 | 2.4% |
Commute Time by Sex in Indio
The most common commute times in Indio are 30 to 34 minutes (4,143 commuters, 20.2%) for males and 15 to 19 minutes (4,020 commuters, 24.2%) for females.
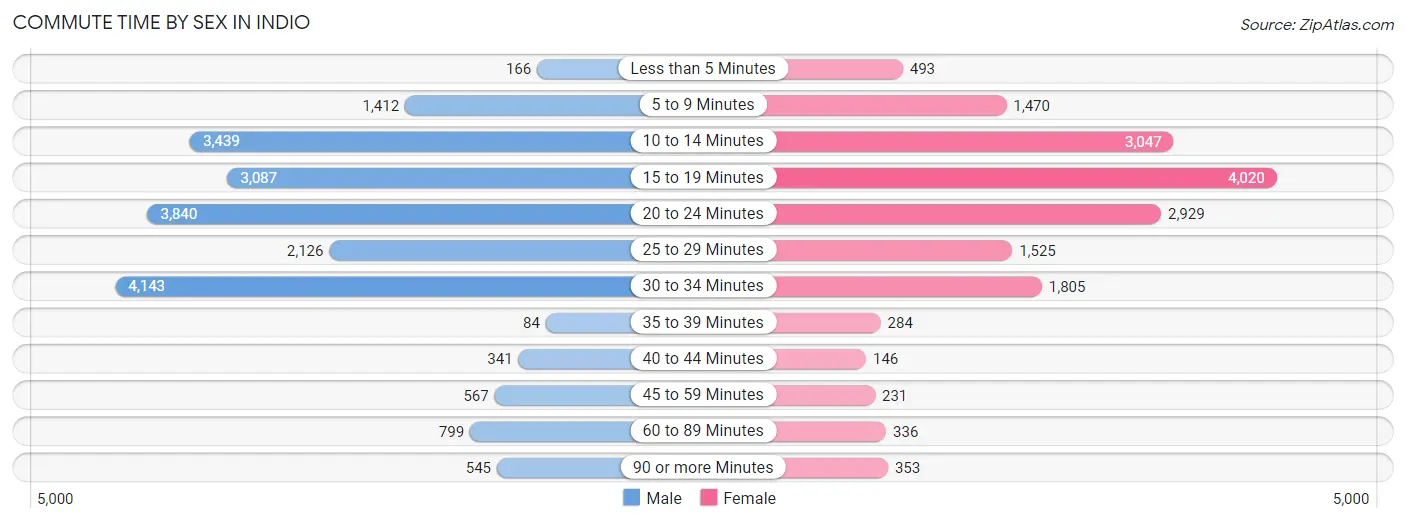
| Commute Time | Male | Female |
| Less than 5 Minutes | 166 (0.8%) | 493 (3.0%) |
| 5 to 9 Minutes | 1,412 (6.9%) | 1,470 (8.8%) |
| 10 to 14 Minutes | 3,439 (16.7%) | 3,047 (18.3%) |
| 15 to 19 Minutes | 3,087 (15.0%) | 4,020 (24.2%) |
| 20 to 24 Minutes | 3,840 (18.7%) | 2,929 (17.6%) |
| 25 to 29 Minutes | 2,126 (10.3%) | 1,525 (9.2%) |
| 30 to 34 Minutes | 4,143 (20.2%) | 1,805 (10.8%) |
| 35 to 39 Minutes | 84 (0.4%) | 284 (1.7%) |
| 40 to 44 Minutes | 341 (1.7%) | 146 (0.9%) |
| 45 to 59 Minutes | 567 (2.8%) | 231 (1.4%) |
| 60 to 89 Minutes | 799 (3.9%) | 336 (2.0%) |
| 90 or more Minutes | 545 (2.6%) | 353 (2.1%) |
Time of Departure to Work by Sex in Indio
The most frequent times of departure to work in Indio are 7:00 AM to 7:29 AM (2,731, 13.3%) for males and 7:00 AM to 7:29 AM (3,001, 18.0%) for females.
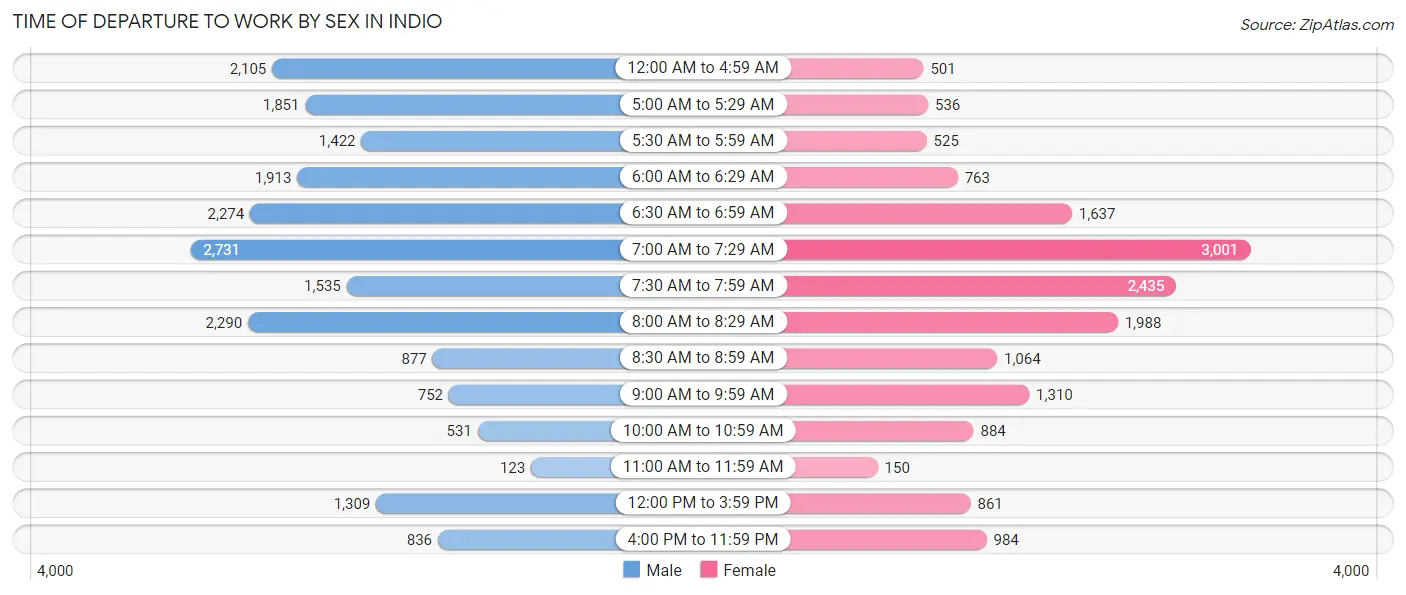
| Time of Departure | Male | Female |
| 12:00 AM to 4:59 AM | 2,105 (10.2%) | 501 (3.0%) |
| 5:00 AM to 5:29 AM | 1,851 (9.0%) | 536 (3.2%) |
| 5:30 AM to 5:59 AM | 1,422 (6.9%) | 525 (3.2%) |
| 6:00 AM to 6:29 AM | 1,913 (9.3%) | 763 (4.6%) |
| 6:30 AM to 6:59 AM | 2,274 (11.1%) | 1,637 (9.8%) |
| 7:00 AM to 7:29 AM | 2,731 (13.3%) | 3,001 (18.0%) |
| 7:30 AM to 7:59 AM | 1,535 (7.5%) | 2,435 (14.6%) |
| 8:00 AM to 8:29 AM | 2,290 (11.1%) | 1,988 (11.9%) |
| 8:30 AM to 8:59 AM | 877 (4.3%) | 1,064 (6.4%) |
| 9:00 AM to 9:59 AM | 752 (3.7%) | 1,310 (7.9%) |
| 10:00 AM to 10:59 AM | 531 (2.6%) | 884 (5.3%) |
| 11:00 AM to 11:59 AM | 123 (0.6%) | 150 (0.9%) |
| 12:00 PM to 3:59 PM | 1,309 (6.4%) | 861 (5.2%) |
| 4:00 PM to 11:59 PM | 836 (4.1%) | 984 (5.9%) |
| Total | 20,549 (100.0%) | 16,639 (100.0%) |
Housing Occupancy in Indio
Occupancy by Ownership in Indio
Of the total 32,579 dwellings in Indio, owner-occupied units account for 22,587 (69.3%), while renter-occupied units make up 9,992 (30.7%).
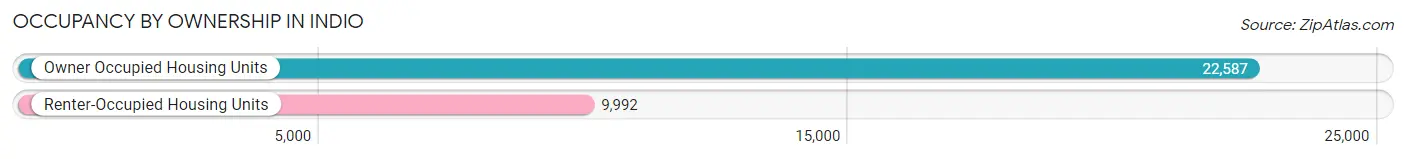
| Occupancy | # Housing Units | % Housing Units |
| Owner Occupied Housing Units | 22,587 | 69.3% |
| Renter-Occupied Housing Units | 9,992 | 30.7% |
| Total Occupied Housing Units | 32,579 | 100.0% |
Occupancy by Household Size in Indio
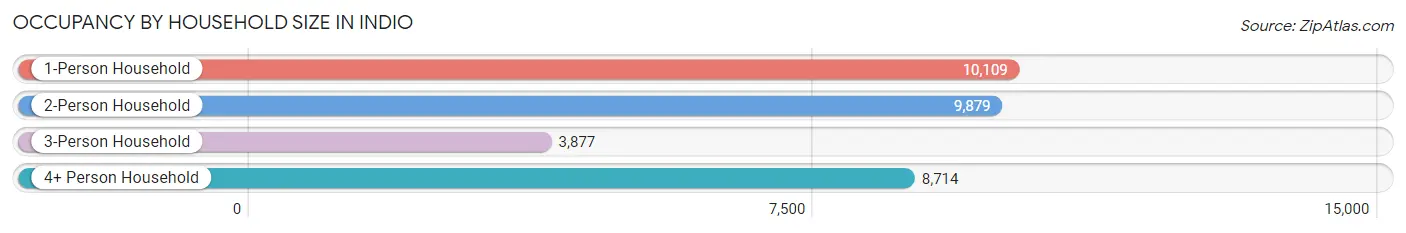
| Household Size | # Housing Units | % Housing Units |
| 1-Person Household | 10,109 | 31.0% |
| 2-Person Household | 9,879 | 30.3% |
| 3-Person Household | 3,877 | 11.9% |
| 4+ Person Household | 8,714 | 26.8% |
| Total Housing Units | 32,579 | 100.0% |
Occupancy by Ownership by Household Size in Indio
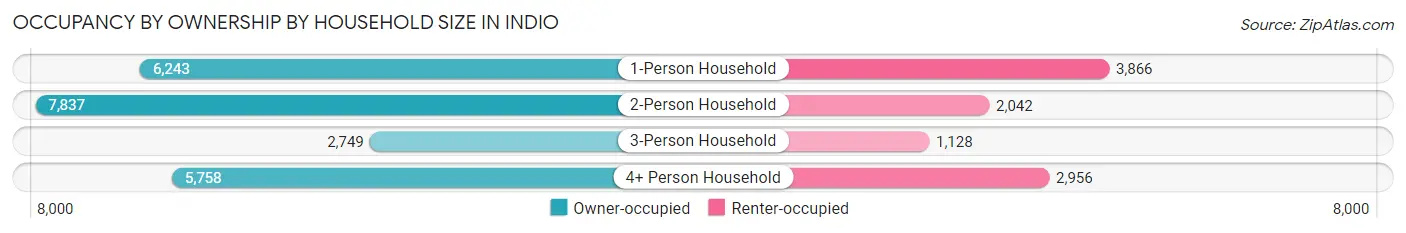
| Household Size | Owner-occupied | Renter-occupied |
| 1-Person Household | 6,243 (61.8%) | 3,866 (38.2%) |
| 2-Person Household | 7,837 (79.3%) | 2,042 (20.7%) |
| 3-Person Household | 2,749 (70.9%) | 1,128 (29.1%) |
| 4+ Person Household | 5,758 (66.1%) | 2,956 (33.9%) |
| Total Housing Units | 22,587 (69.3%) | 9,992 (30.7%) |
Occupancy by Educational Attainment in Indio
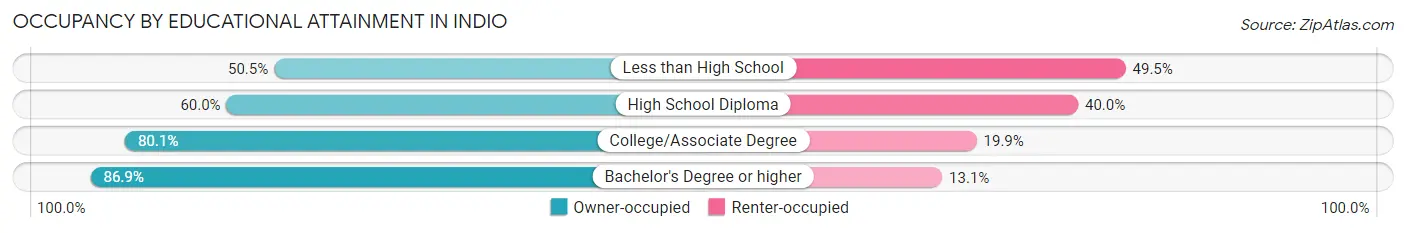
| Household Size | Owner-occupied | Renter-occupied |
| Less than High School | 3,447 (50.5%) | 3,374 (49.5%) |
| High School Diploma | 5,919 (60.0%) | 3,949 (40.0%) |
| College/Associate Degree | 6,926 (80.1%) | 1,722 (19.9%) |
| Bachelor's Degree or higher | 6,295 (86.9%) | 947 (13.1%) |
Occupancy by Age of Householder in Indio
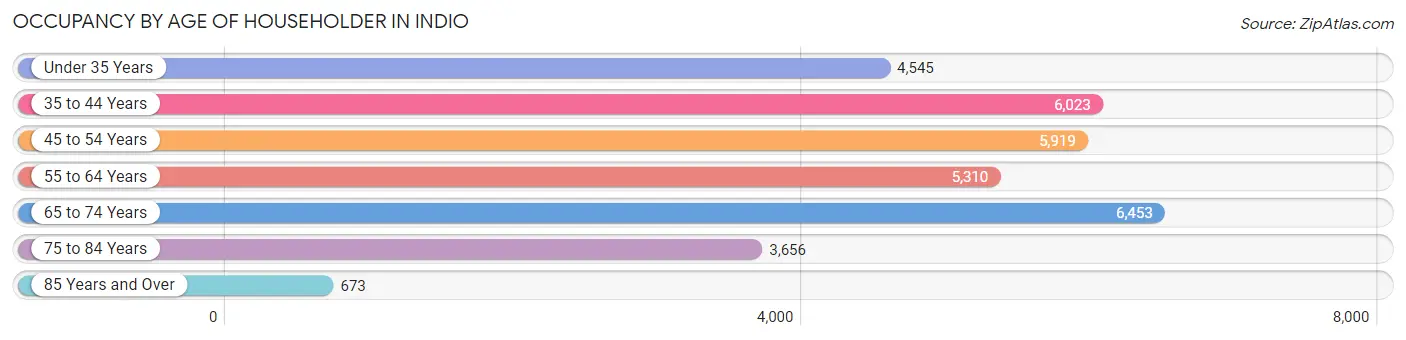
| Age Bracket | # Households | % Households |
| Under 35 Years | 4,545 | 14.0% |
| 35 to 44 Years | 6,023 | 18.5% |
| 45 to 54 Years | 5,919 | 18.2% |
| 55 to 64 Years | 5,310 | 16.3% |
| 65 to 74 Years | 6,453 | 19.8% |
| 75 to 84 Years | 3,656 | 11.2% |
| 85 Years and Over | 673 | 2.1% |
| Total | 32,579 | 100.0% |
Housing Finances in Indio
Median Income by Occupancy in Indio
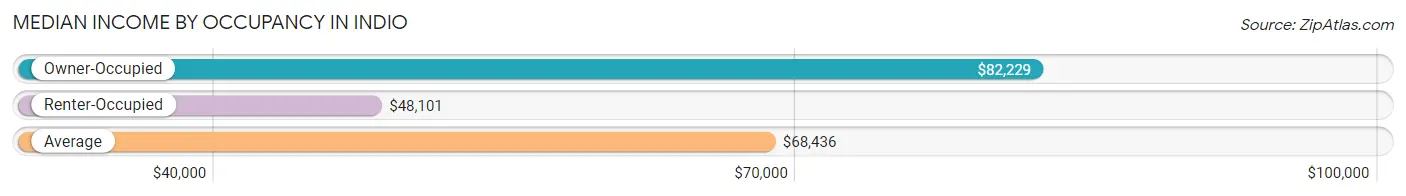
| Occupancy Type | # Households | Median Income |
| Owner-Occupied | 22,587 (69.3%) | $82,229 |
| Renter-Occupied | 9,992 (30.7%) | $48,101 |
| Average | 32,579 (100.0%) | $68,436 |
Occupancy by Householder Income Bracket in Indio
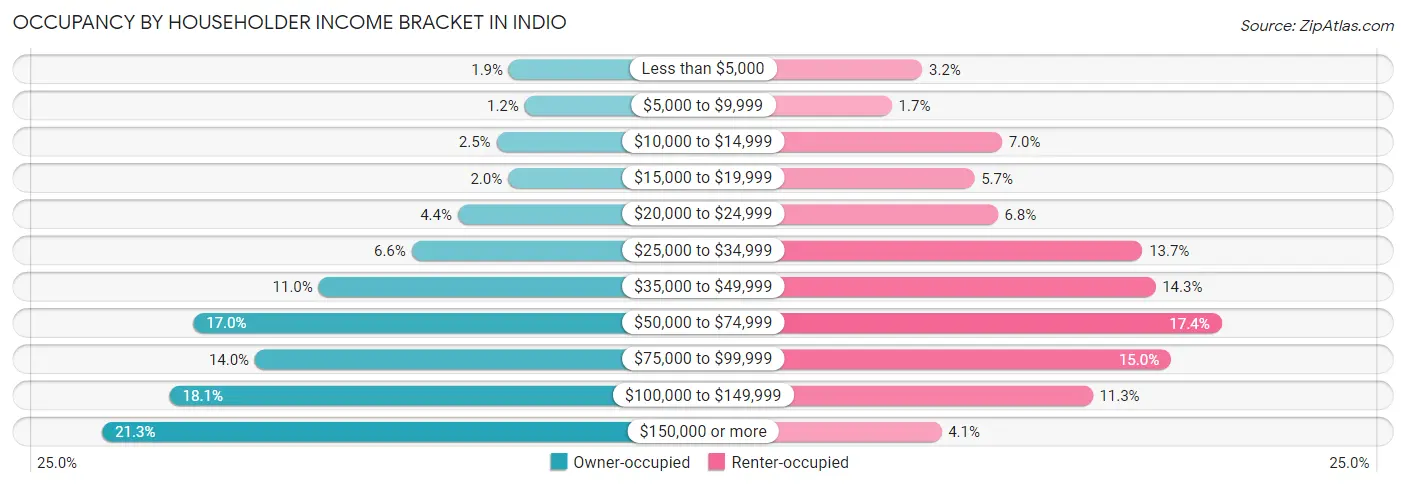
| Income Bracket | Owner-occupied | Renter-occupied |
| Less than $5,000 | 439 (1.9%) | 317 (3.2%) |
| $5,000 to $9,999 | 269 (1.2%) | 172 (1.7%) |
| $10,000 to $14,999 | 571 (2.5%) | 695 (7.0%) |
| $15,000 to $19,999 | 448 (2.0%) | 565 (5.7%) |
| $20,000 to $24,999 | 988 (4.4%) | 675 (6.8%) |
| $25,000 to $34,999 | 1,485 (6.6%) | 1,364 (13.7%) |
| $35,000 to $49,999 | 2,485 (11.0%) | 1,426 (14.3%) |
| $50,000 to $74,999 | 3,832 (17.0%) | 1,742 (17.4%) |
| $75,000 to $99,999 | 3,170 (14.0%) | 1,501 (15.0%) |
| $100,000 to $149,999 | 4,086 (18.1%) | 1,127 (11.3%) |
| $150,000 or more | 4,814 (21.3%) | 408 (4.1%) |
| Total | 22,587 (100.0%) | 9,992 (100.0%) |
Monthly Housing Cost Tiers in Indio
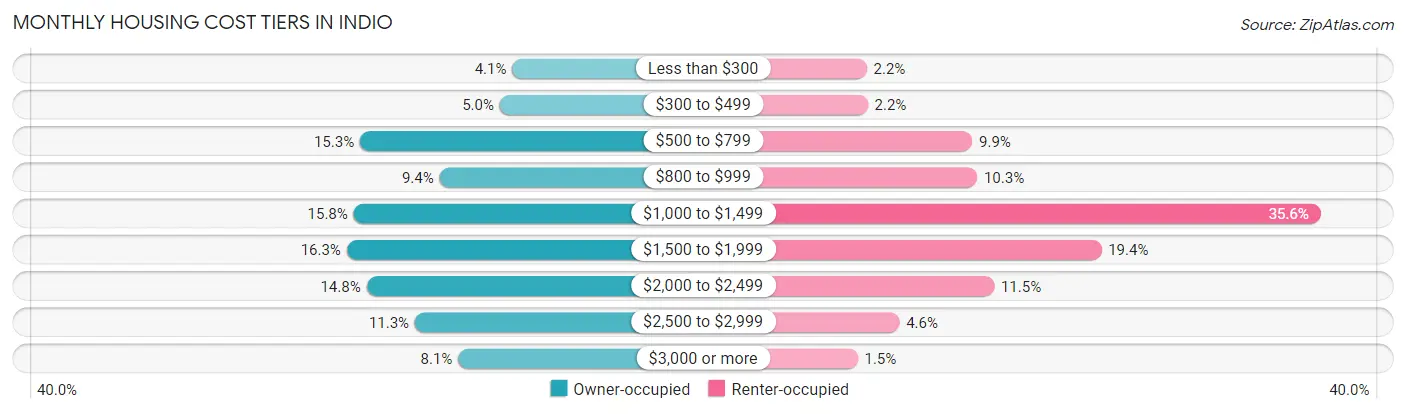
| Monthly Cost | Owner-occupied | Renter-occupied |
| Less than $300 | 921 (4.1%) | 215 (2.1%) |
| $300 to $499 | 1,129 (5.0%) | 222 (2.2%) |
| $500 to $799 | 3,456 (15.3%) | 991 (9.9%) |
| $800 to $999 | 2,132 (9.4%) | 1,027 (10.3%) |
| $1,000 to $1,499 | 3,561 (15.8%) | 3,556 (35.6%) |
| $1,500 to $1,999 | 3,677 (16.3%) | 1,941 (19.4%) |
| $2,000 to $2,499 | 3,347 (14.8%) | 1,152 (11.5%) |
| $2,500 to $2,999 | 2,541 (11.3%) | 455 (4.5%) |
| $3,000 or more | 1,823 (8.1%) | 148 (1.5%) |
| Total | 22,587 (100.0%) | 9,992 (100.0%) |
Physical Housing Characteristics in Indio
Housing Structures in Indio
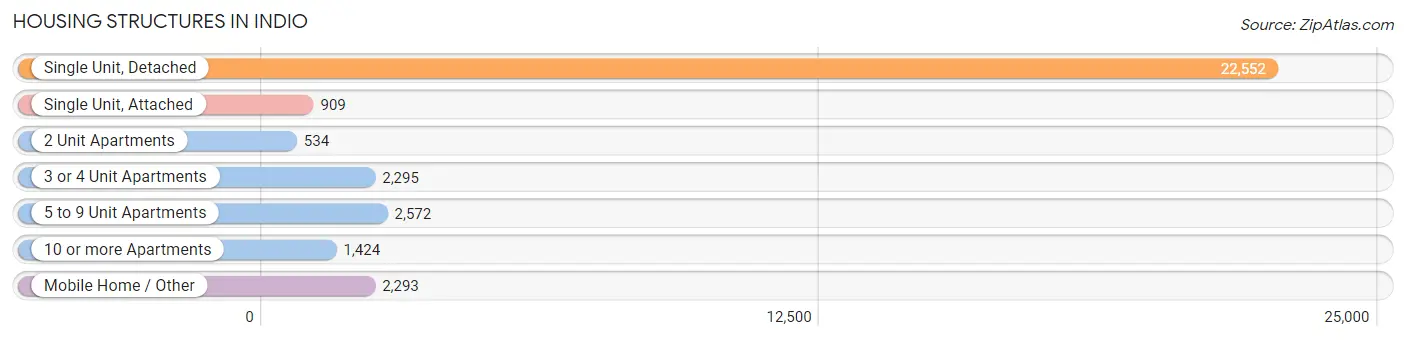
| Structure Type | # Housing Units | % Housing Units |
| Single Unit, Detached | 22,552 | 69.2% |
| Single Unit, Attached | 909 | 2.8% |
| 2 Unit Apartments | 534 | 1.6% |
| 3 or 4 Unit Apartments | 2,295 | 7.0% |
| 5 to 9 Unit Apartments | 2,572 | 7.9% |
| 10 or more Apartments | 1,424 | 4.4% |
| Mobile Home / Other | 2,293 | 7.0% |
| Total | 32,579 | 100.0% |
Housing Structures by Occupancy in Indio
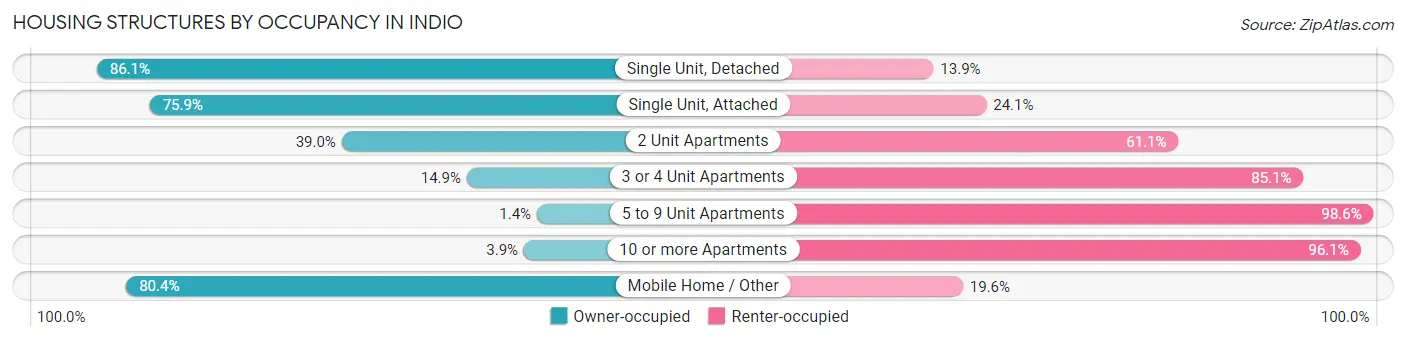
| Structure Type | Owner-occupied | Renter-occupied |
| Single Unit, Detached | 19,414 (86.1%) | 3,138 (13.9%) |
| Single Unit, Attached | 690 (75.9%) | 219 (24.1%) |
| 2 Unit Apartments | 208 (39.0%) | 326 (61.1%) |
| 3 or 4 Unit Apartments | 341 (14.9%) | 1,954 (85.1%) |
| 5 to 9 Unit Apartments | 35 (1.4%) | 2,537 (98.6%) |
| 10 or more Apartments | 55 (3.9%) | 1,369 (96.1%) |
| Mobile Home / Other | 1,844 (80.4%) | 449 (19.6%) |
| Total | 22,587 (69.3%) | 9,992 (30.7%) |
Housing Structures by Number of Rooms in Indio
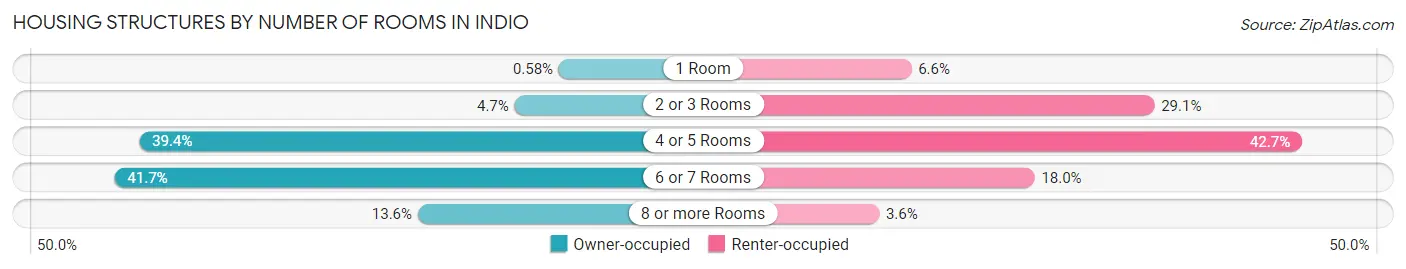
| Number of Rooms | Owner-occupied | Renter-occupied |
| 1 Room | 132 (0.6%) | 658 (6.6%) |
| 2 or 3 Rooms | 1,058 (4.7%) | 2,905 (29.1%) |
| 4 or 5 Rooms | 8,902 (39.4%) | 4,270 (42.7%) |
| 6 or 7 Rooms | 9,417 (41.7%) | 1,798 (18.0%) |
| 8 or more Rooms | 3,078 (13.6%) | 361 (3.6%) |
| Total | 22,587 (100.0%) | 9,992 (100.0%) |
Housing Structure by Heating Type in Indio
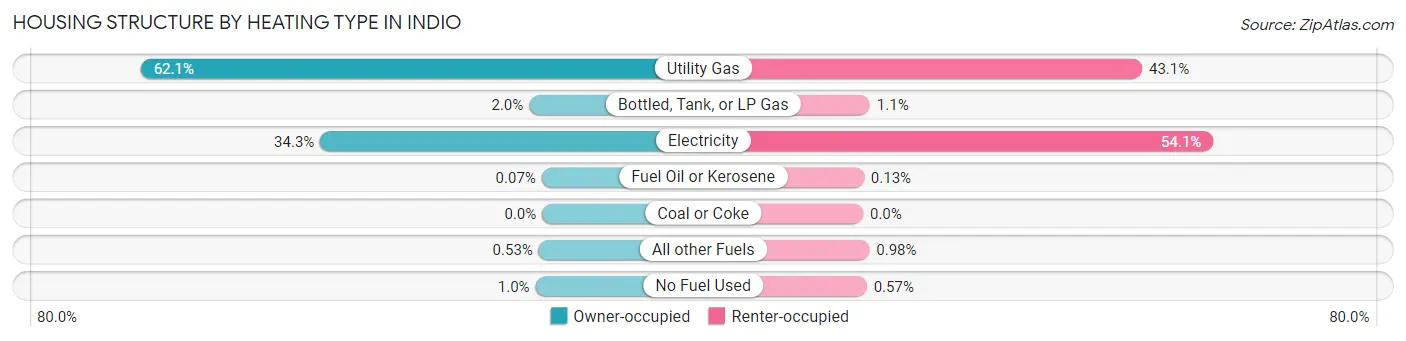
| Heating Type | Owner-occupied | Renter-occupied |
| Utility Gas | 14,016 (62.1%) | 4,310 (43.1%) |
| Bottled, Tank, or LP Gas | 454 (2.0%) | 106 (1.1%) |
| Electricity | 7,750 (34.3%) | 5,408 (54.1%) |
| Fuel Oil or Kerosene | 16 (0.1%) | 13 (0.1%) |
| Coal or Coke | 0 (0.0%) | 0 (0.0%) |
| All other Fuels | 119 (0.5%) | 98 (1.0%) |
| No Fuel Used | 232 (1.0%) | 57 (0.6%) |
| Total | 22,587 (100.0%) | 9,992 (100.0%) |
Household Vehicle Usage in Indio
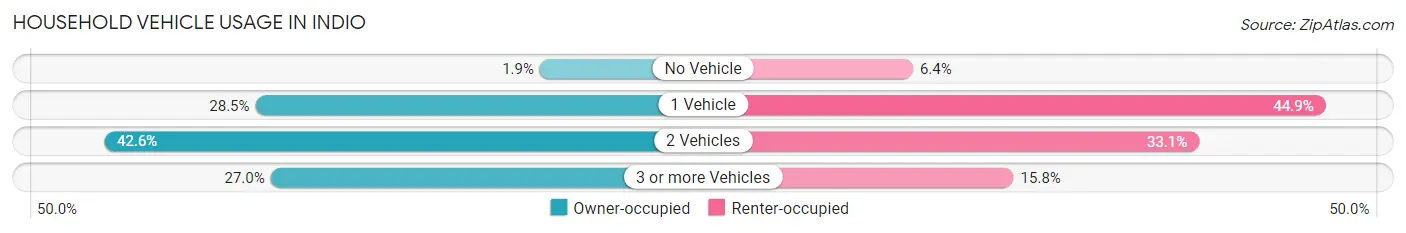
| Vehicles per Household | Owner-occupied | Renter-occupied |
| No Vehicle | 431 (1.9%) | 634 (6.4%) |
| 1 Vehicle | 6,429 (28.5%) | 4,482 (44.9%) |
| 2 Vehicles | 9,620 (42.6%) | 3,302 (33.1%) |
| 3 or more Vehicles | 6,107 (27.0%) | 1,574 (15.8%) |
| Total | 22,587 (100.0%) | 9,992 (100.0%) |
Real Estate & Mortgages in Indio
Real Estate and Mortgage Overview in Indio
| Characteristic | Without Mortgage | With Mortgage |
| Housing Units | 8,678 | 13,909 |
| Median Property Value | $320,800 | $396,100 |
| Median Household Income | $59,544 | $3,464 |
| Monthly Housing Costs | $705 | $1,801 |
| Real Estate Taxes | $3,235 | $411 |
Property Value by Mortgage Status in Indio
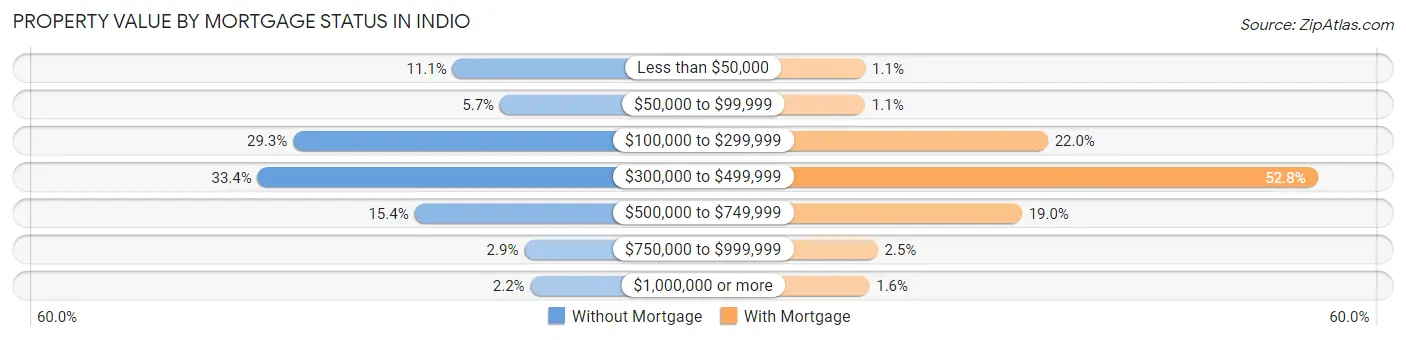
| Property Value | Without Mortgage | With Mortgage |
| Less than $50,000 | 962 (11.1%) | 153 (1.1%) |
| $50,000 to $99,999 | 493 (5.7%) | 149 (1.1%) |
| $100,000 to $299,999 | 2,544 (29.3%) | 3,054 (22.0%) |
| $300,000 to $499,999 | 2,897 (33.4%) | 7,342 (52.8%) |
| $500,000 to $749,999 | 1,340 (15.4%) | 2,641 (19.0%) |
| $750,000 to $999,999 | 252 (2.9%) | 351 (2.5%) |
| $1,000,000 or more | 190 (2.2%) | 219 (1.6%) |
| Total | 8,678 (100.0%) | 13,909 (100.0%) |
Household Income by Mortgage Status in Indio
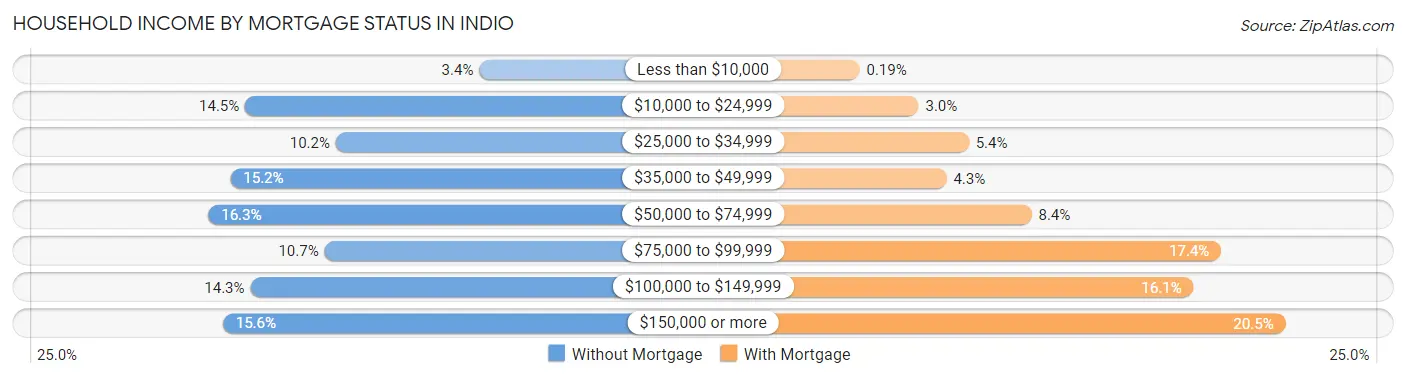
| Household Income | Without Mortgage | With Mortgage |
| Less than $10,000 | 291 (3.4%) | 27 (0.2%) |
| $10,000 to $24,999 | 1,258 (14.5%) | 417 (3.0%) |
| $25,000 to $34,999 | 883 (10.2%) | 749 (5.4%) |
| $35,000 to $49,999 | 1,319 (15.2%) | 602 (4.3%) |
| $50,000 to $74,999 | 1,410 (16.3%) | 1,166 (8.4%) |
| $75,000 to $99,999 | 930 (10.7%) | 2,422 (17.4%) |
| $100,000 to $149,999 | 1,237 (14.2%) | 2,240 (16.1%) |
| $150,000 or more | 1,350 (15.6%) | 2,849 (20.5%) |
| Total | 8,678 (100.0%) | 13,909 (100.0%) |
Property Value to Household Income Ratio in Indio
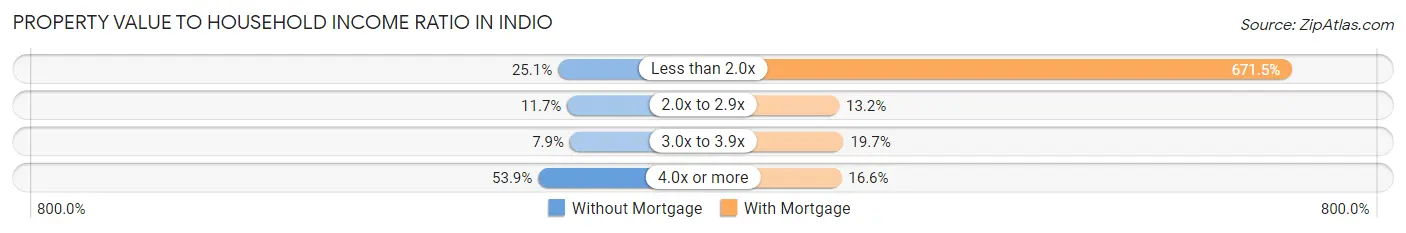
| Value-to-Income Ratio | Without Mortgage | With Mortgage |
| Less than 2.0x | 2,175 (25.1%) | 93,397 (671.5%) |
| 2.0x to 2.9x | 1,019 (11.7%) | 1,841 (13.2%) |
| 3.0x to 3.9x | 685 (7.9%) | 2,740 (19.7%) |
| 4.0x or more | 4,681 (53.9%) | 2,308 (16.6%) |
| Total | 8,678 (100.0%) | 13,909 (100.0%) |
Real Estate Taxes by Mortgage Status in Indio
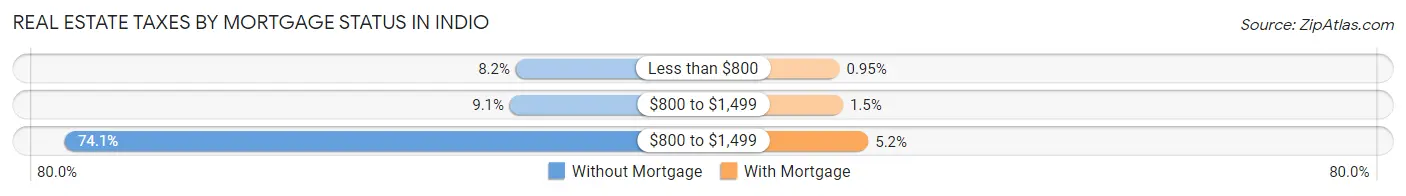
| Property Taxes | Without Mortgage | With Mortgage |
| Less than $800 | 714 (8.2%) | 132 (0.9%) |
| $800 to $1,499 | 789 (9.1%) | 201 (1.5%) |
| $800 to $1,499 | 6,430 (74.1%) | 717 (5.1%) |
| Total | 8,678 (100.0%) | 13,909 (100.0%) |
Health & Disability in Indio
Health Insurance Coverage by Age in Indio
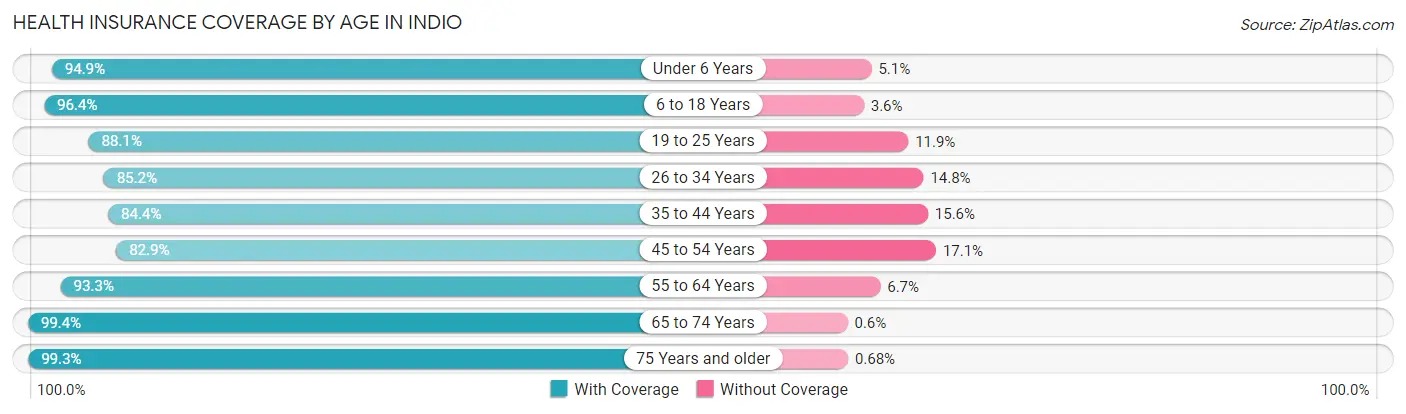
| Age Bracket | With Coverage | Without Coverage |
| Under 6 Years | 5,163 (94.9%) | 276 (5.1%) |
| 6 to 18 Years | 15,519 (96.4%) | 585 (3.6%) |
| 19 to 25 Years | 6,433 (88.1%) | 871 (11.9%) |
| 26 to 34 Years | 8,848 (85.2%) | 1,532 (14.8%) |
| 35 to 44 Years | 10,125 (84.4%) | 1,868 (15.6%) |
| 45 to 54 Years | 8,875 (82.9%) | 1,830 (17.1%) |
| 55 to 64 Years | 9,294 (93.3%) | 668 (6.7%) |
| 65 to 74 Years | 9,796 (99.4%) | 59 (0.6%) |
| 75 Years and older | 7,202 (99.3%) | 49 (0.7%) |
| Total | 81,255 (91.3%) | 7,738 (8.7%) |
Health Insurance Coverage by Citizenship Status in Indio
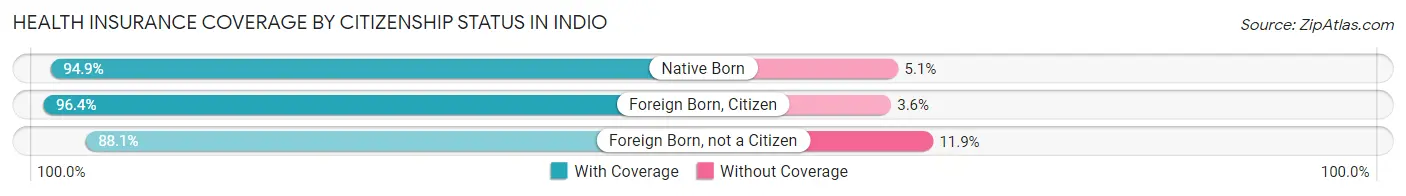
| Citizenship Status | With Coverage | Without Coverage |
| Native Born | 5,163 (94.9%) | 276 (5.1%) |
| Foreign Born, Citizen | 15,519 (96.4%) | 585 (3.6%) |
| Foreign Born, not a Citizen | 6,433 (88.1%) | 871 (11.9%) |
Health Insurance Coverage by Household Income in Indio
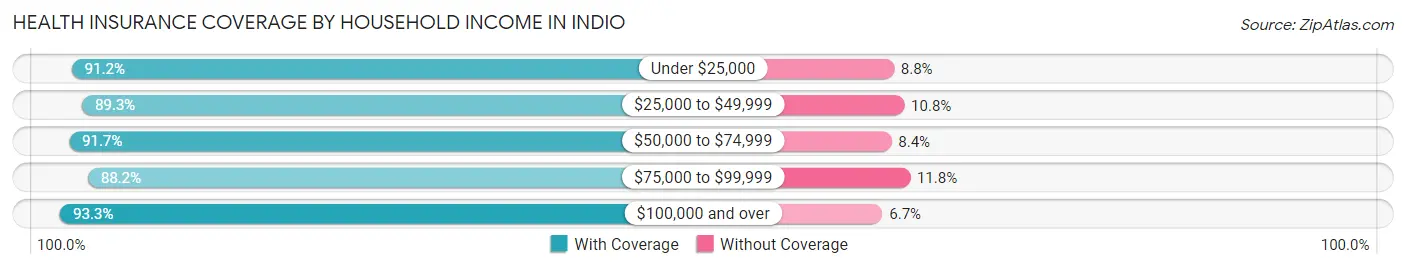
| Household Income | With Coverage | Without Coverage |
| Under $25,000 | 7,989 (91.2%) | 773 (8.8%) |
| $25,000 to $49,999 | 14,797 (89.2%) | 1,782 (10.7%) |
| $50,000 to $74,999 | 12,830 (91.6%) | 1,169 (8.4%) |
| $75,000 to $99,999 | 12,450 (88.2%) | 1,672 (11.8%) |
| $100,000 and over | 32,791 (93.3%) | 2,338 (6.7%) |
Public vs Private Health Insurance Coverage by Age in Indio
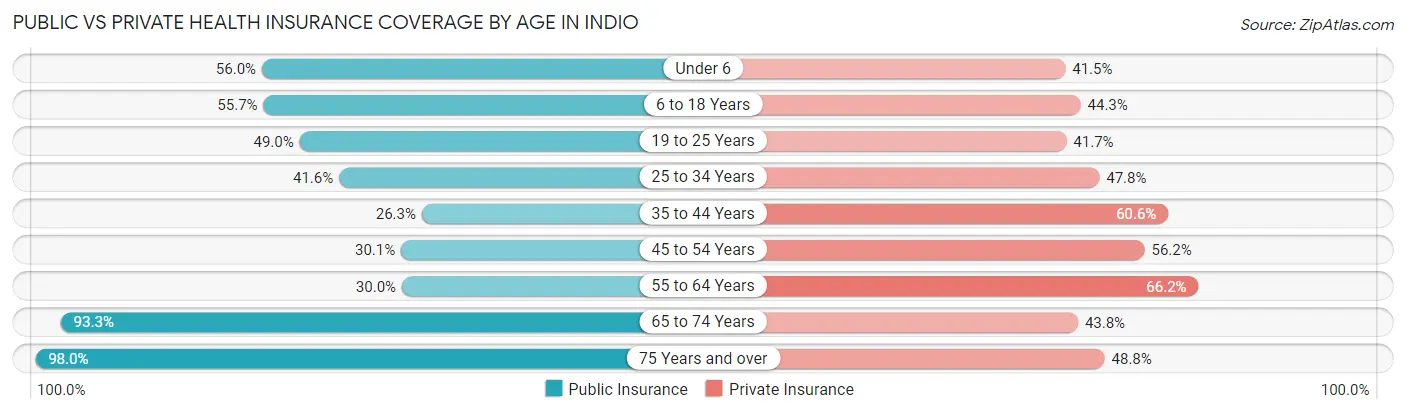
| Age Bracket | Public Insurance | Private Insurance |
| Under 6 | 3,043 (55.9%) | 2,256 (41.5%) |
| 6 to 18 Years | 8,965 (55.7%) | 7,139 (44.3%) |
| 19 to 25 Years | 3,576 (49.0%) | 3,045 (41.7%) |
| 25 to 34 Years | 4,321 (41.6%) | 4,962 (47.8%) |
| 35 to 44 Years | 3,152 (26.3%) | 7,265 (60.6%) |
| 45 to 54 Years | 3,225 (30.1%) | 6,016 (56.2%) |
| 55 to 64 Years | 2,986 (30.0%) | 6,594 (66.2%) |
| 65 to 74 Years | 9,195 (93.3%) | 4,319 (43.8%) |
| 75 Years and over | 7,108 (98.0%) | 3,537 (48.8%) |
| Total | 45,571 (51.2%) | 45,133 (50.7%) |
Disability Status by Sex by Age in Indio
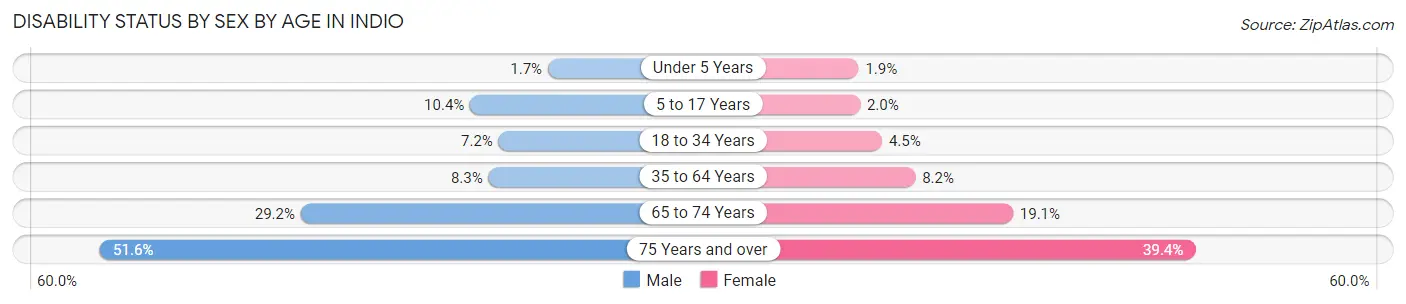
| Age Bracket | Male | Female |
| Under 5 Years | 42 (1.7%) | 39 (1.9%) |
| 5 to 17 Years | 818 (10.4%) | 161 (2.0%) |
| 18 to 34 Years | 681 (7.2%) | 420 (4.5%) |
| 35 to 64 Years | 1,372 (8.3%) | 1,325 (8.2%) |
| 65 to 74 Years | 1,319 (29.2%) | 1,018 (19.1%) |
| 75 Years and over | 1,830 (51.6%) | 1,457 (39.4%) |
Disability Class by Sex by Age in Indio
Disability Class: Hearing Difficulty
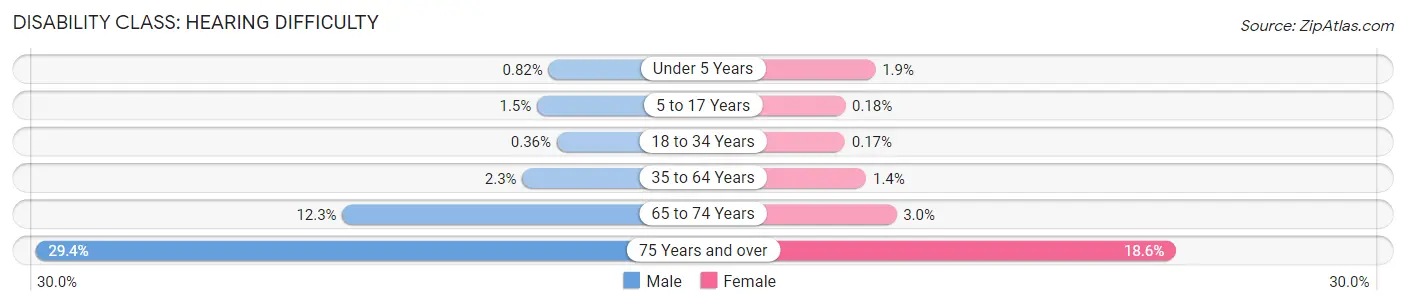
| Age Bracket | Male | Female |
| Under 5 Years | 20 (0.8%) | 39 (1.9%) |
| 5 to 17 Years | 115 (1.5%) | 14 (0.2%) |
| 18 to 34 Years | 34 (0.4%) | 16 (0.2%) |
| 35 to 64 Years | 376 (2.3%) | 219 (1.3%) |
| 65 to 74 Years | 555 (12.3%) | 162 (3.0%) |
| 75 Years and over | 1,043 (29.4%) | 689 (18.6%) |
Disability Class: Vision Difficulty
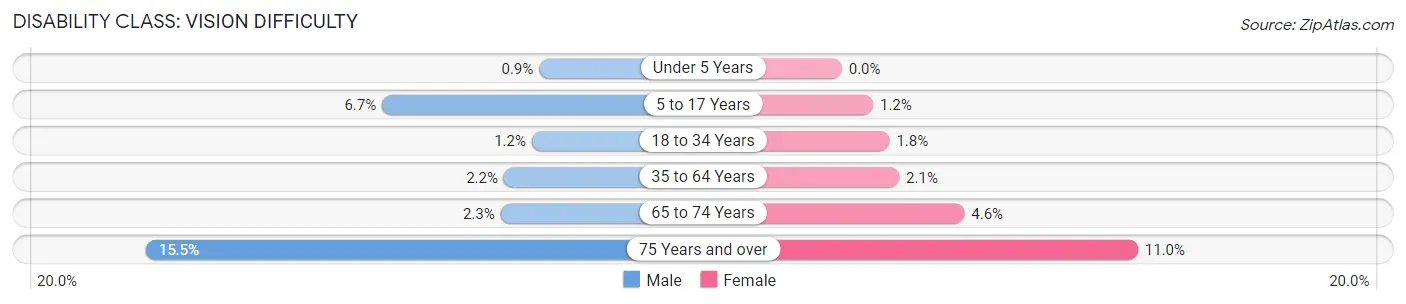
| Age Bracket | Male | Female |
| Under 5 Years | 22 (0.9%) | 0 (0.0%) |
| 5 to 17 Years | 530 (6.7%) | 92 (1.2%) |
| 18 to 34 Years | 111 (1.2%) | 166 (1.8%) |
| 35 to 64 Years | 364 (2.2%) | 345 (2.1%) |
| 65 to 74 Years | 105 (2.3%) | 243 (4.5%) |
| 75 Years and over | 550 (15.5%) | 407 (11.0%) |
Disability Class: Cognitive Difficulty
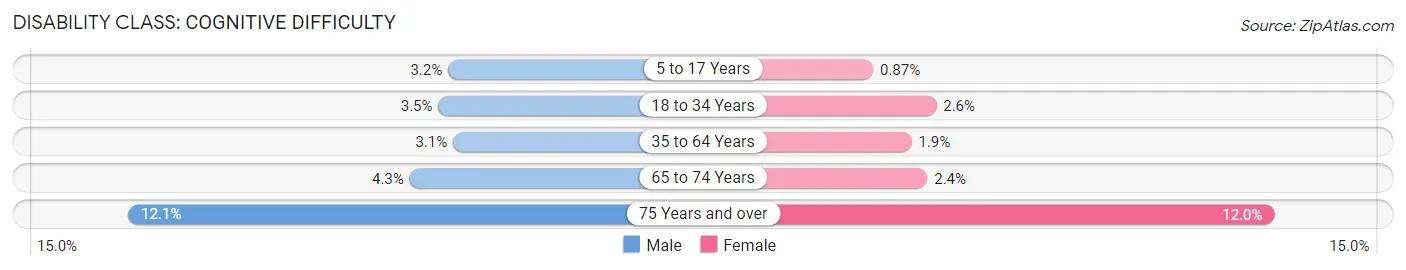
| Age Bracket | Male | Female |
| 5 to 17 Years | 253 (3.2%) | 69 (0.9%) |
| 18 to 34 Years | 329 (3.5%) | 247 (2.6%) |
| 35 to 64 Years | 506 (3.1%) | 314 (1.9%) |
| 65 to 74 Years | 193 (4.3%) | 127 (2.4%) |
| 75 Years and over | 430 (12.1%) | 446 (12.0%) |
Disability Class: Ambulatory Difficulty
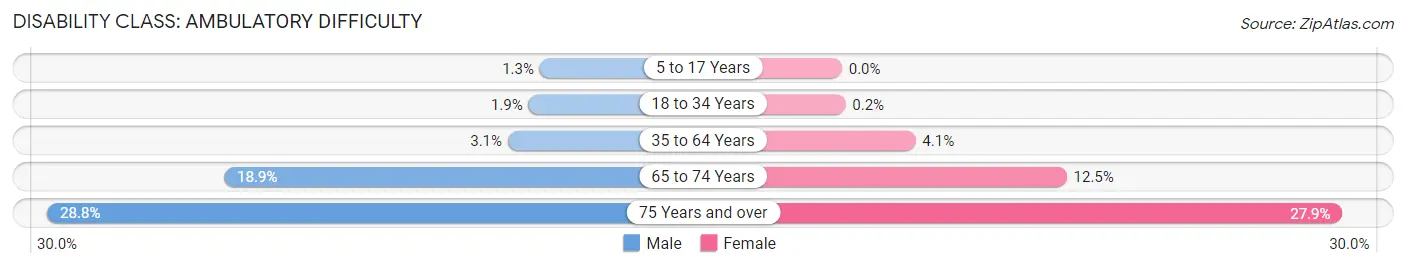
| Age Bracket | Male | Female |
| 5 to 17 Years | 103 (1.3%) | 0 (0.0%) |
| 18 to 34 Years | 183 (1.9%) | 19 (0.2%) |
| 35 to 64 Years | 509 (3.1%) | 664 (4.1%) |
| 65 to 74 Years | 852 (18.9%) | 669 (12.5%) |
| 75 Years and over | 1,020 (28.7%) | 1,032 (27.9%) |
Disability Class: Self-Care Difficulty
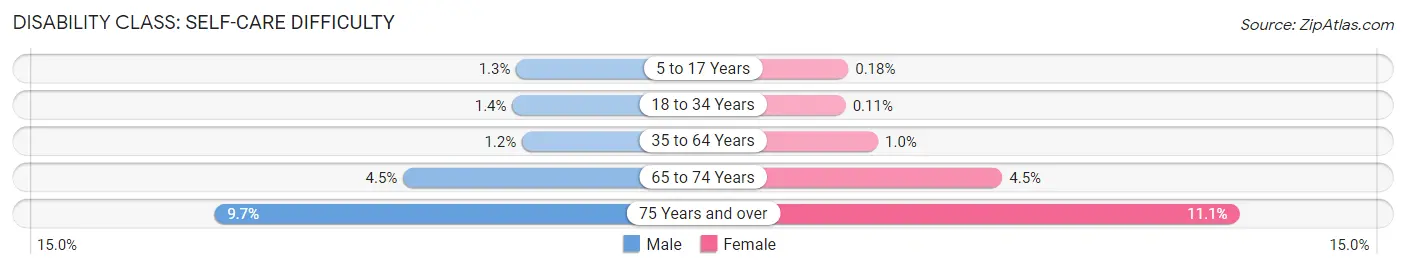
| Age Bracket | Male | Female |
| 5 to 17 Years | 103 (1.3%) | 14 (0.2%) |
| 18 to 34 Years | 134 (1.4%) | 10 (0.1%) |
| 35 to 64 Years | 189 (1.1%) | 164 (1.0%) |
| 65 to 74 Years | 201 (4.5%) | 239 (4.5%) |
| 75 Years and over | 345 (9.7%) | 410 (11.1%) |
Technology Access in Indio
Computing Device Access in Indio
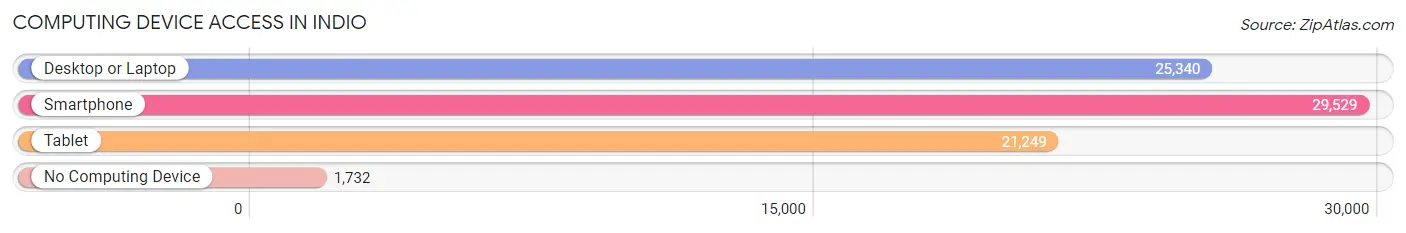
| Device Type | # Households | % Households |
| Desktop or Laptop | 25,340 | 77.8% |
| Smartphone | 29,529 | 90.6% |
| Tablet | 21,249 | 65.2% |
| No Computing Device | 1,732 | 5.3% |
| Total | 32,579 | 100.0% |
Internet Access in Indio
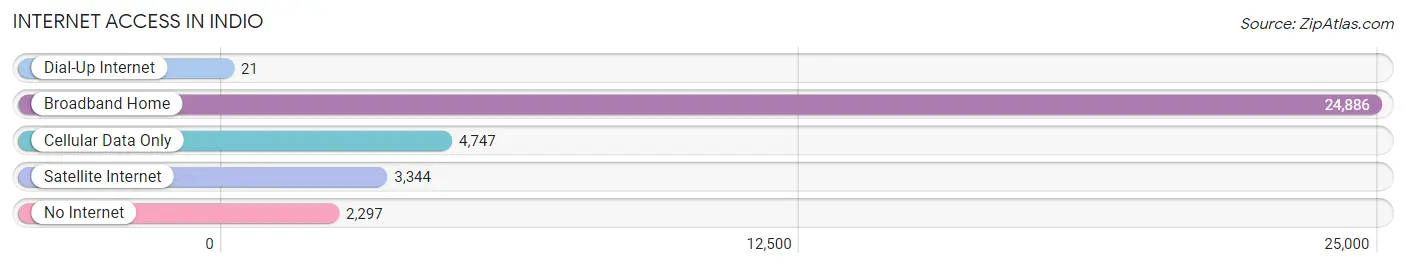
| Internet Type | # Households | % Households |
| Dial-Up Internet | 21 | 0.1% |
| Broadband Home | 24,886 | 76.4% |
| Cellular Data Only | 4,747 | 14.6% |
| Satellite Internet | 3,344 | 10.3% |
| No Internet | 2,297 | 7.0% |
| Total | 32,579 | 100.0% |
Indio Summary
Indio is a city located in Riverside County, California, United States. It is located in the Coachella Valley, a large desert valley in the Colorado Desert. The city is located approximately 25 miles east of Palm Springs and is part of the Greater Palm Springs area. As of the 2010 United States Census, the city had a population of 76,036, up from 49,116 at the 2000 census.
History
Indio was originally inhabited by the Cahuilla people, who were the original inhabitants of the Coachella Valley. The area was first explored by Spanish explorers in the late 1700s, and the first settlement was established in 1876. The city was officially incorporated in 1930.
Indio was a major agricultural center in the early 20th century, and the city was known for its production of dates, citrus, and other crops. The city was also a popular destination for tourists, and it was home to a number of resorts and hotels.
Geography
Indio is located in the Coachella Valley, a large desert valley in the Colorado Desert. The city is located approximately 25 miles east of Palm Springs and is part of the Greater Palm Springs area. The city is bordered by the cities of Coachella, La Quinta, and Palm Desert.
The city has a total area of 28.3 square miles, of which 28.2 square miles is land and 0.1 square miles is water. The city is located at an elevation of approximately 200 feet above sea level.
Economy
Indio is a major economic center in the Coachella Valley. The city is home to a number of major employers, including the Fantasy Springs Resort Casino, the Agua Caliente Casino Resort Spa, and the Indio Hills Golf Course. The city is also home to a number of retail stores, restaurants, and other businesses.
The city is also a major tourist destination, and it is home to a number of resorts and hotels. The city is also home to a number of festivals and events, including the Coachella Valley Music and Arts Festival and the Stagecoach Country Music Festival.
Demographics
As of the 2010 United States Census, the city had a population of 76,036, up from 49,116 at the 2000 census. The racial makeup of the city was 57.2% White, 4.2% African American, 1.2% Native American, 1.7% Asian, 0.2% Pacific Islander, 33.3% from other races, and 2.4% from two or more races. Hispanic or Latino of any race were 62.9% of the population.
The median income for a household in the city was $37,890, and the median income for a family was $45,890. The per capita income for the city was $20,890. About 20.3% of families and 24.2% of the population were below the poverty line, including 33.2% of those under age 18 and 11.2% of those age 65 or over.
Common Questions
What is Per Capita Income in Indio?
Per Capita income in Indio is $33,852.
What is the Median Family Income in Indio?
Median Family Income in Indio is $84,146.
What is the Median Household income in Indio?
Median Household Income in Indio is $68,436.
What is Income or Wage Gap in Indio?
Income or Wage Gap in Indio is 20.5%.
Women in Indio earn 79.5 cents for every dollar earned by a man.
What is Family Income Deficit in Indio?
Family Income Deficit in Indio is $8,286.
Families that are below poverty line in Indio earn $8,286 less on average than the poverty threshold level.
What is Inequality or Gini Index in Indio?
Inequality or Gini Index in Indio is 0.44.
What is the Total Population of Indio?
Total Population of Indio is 89,616.
What is the Total Male Population of Indio?
Total Male Population of Indio is 44,785.
What is the Total Female Population of Indio?
Total Female Population of Indio is 44,831.
What is the Ratio of Males per 100 Females in Indio?
There are 99.90 Males per 100 Females in Indio.
What is the Ratio of Females per 100 Males in Indio?
There are 100.10 Females per 100 Males in Indio.
What is the Median Population Age in Indio?
Median Population Age in Indio is 39.2 Years.
What is the Average Family Size in Indio
Average Family Size in Indio is 3.5 People.
What is the Average Household Size in Indio
Average Household Size in Indio is 2.7 People.
How Large is the Labor Force in Indio?
There are 43,120 People in the Labor Forcein in Indio.
What is the Percentage of People in the Labor Force in Indio?
59.9% of People are in the Labor Force in Indio.
What is the Unemployment Rate in Indio?
Unemployment Rate in Indio is 7.3%.