Murrieta, CA Map & Demographics
Murrieta Map
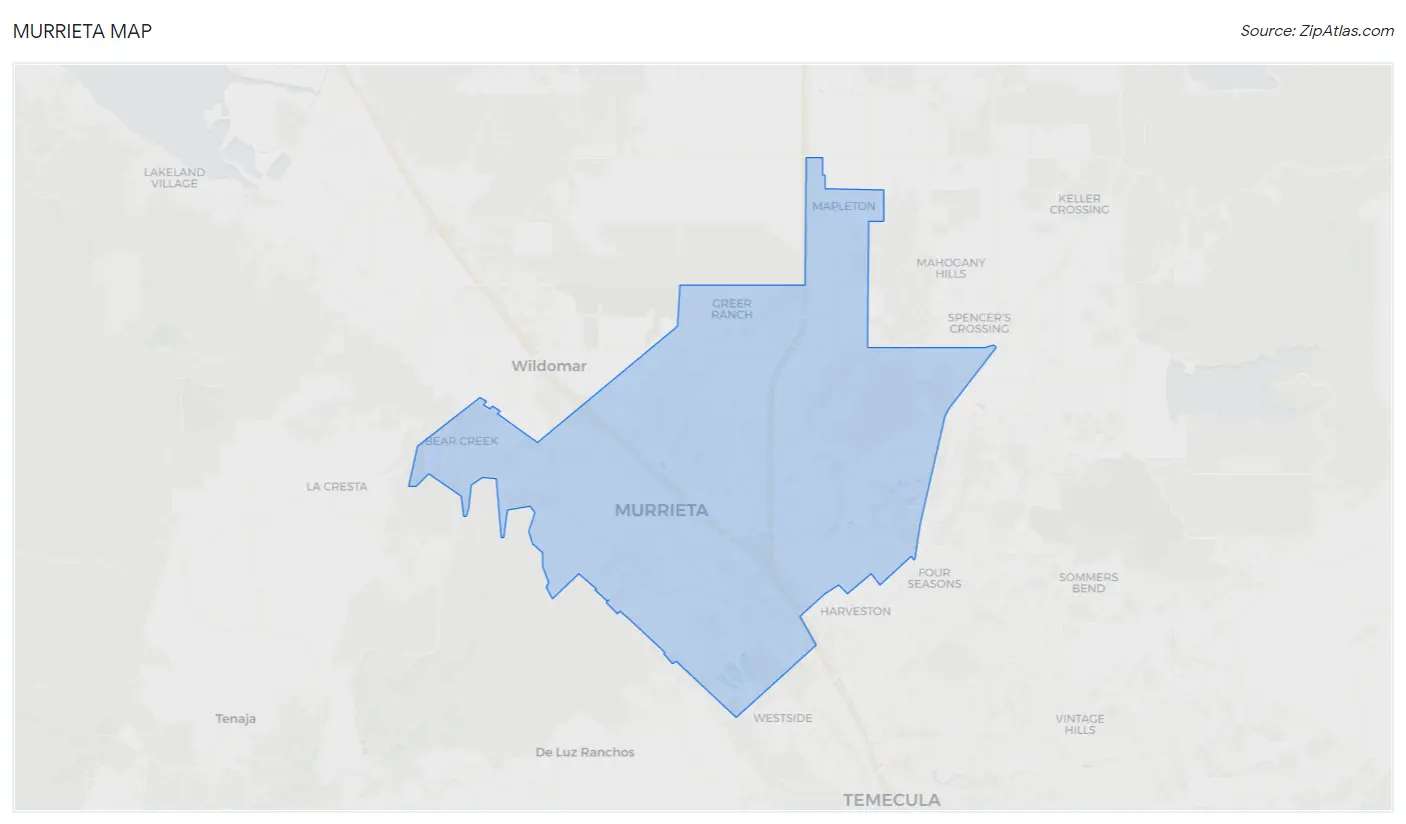
Murrieta Overview
$40,950
PER CAPITA INCOME
$115,231
AVG FAMILY INCOME
$106,925
AVG HOUSEHOLD INCOME
47.6%
WAGE / INCOME GAP [ % ]
52.4¢/ $1
WAGE / INCOME GAP [ $ ]
$12,644
FAMILY INCOME DEFICIT
0.40
INEQUALITY / GINI INDEX
111,899
TOTAL POPULATION
54,829
MALE POPULATION
57,070
FEMALE POPULATION
96.07
MALES / 100 FEMALES
104.09
FEMALES / 100 MALES
35.6
MEDIAN AGE
3.6
AVG FAMILY SIZE
3.2
AVG HOUSEHOLD SIZE
54,049
LABOR FORCE [ PEOPLE ]
63.4%
PERCENT IN LABOR FORCE
6.7%
UNEMPLOYMENT RATE
Murrieta Area Codes
Income in Murrieta
Income Overview in Murrieta
Per Capita Income in Murrieta is $40,950, while median incomes of families and households are $115,231 and $106,925 respectively.
| Characteristic | Number | Measure |
| Per Capita Income | 111,899 | $40,950 |
| Median Family Income | 27,308 | $115,231 |
| Mean Family Income | 27,308 | $140,681 |
| Median Household Income | 34,482 | $106,925 |
| Mean Household Income | 34,482 | $129,765 |
| Income Deficit | 27,308 | $12,644 |
| Wage / Income Gap (%) | 111,899 | 47.58% |
| Wage / Income Gap ($) | 111,899 | 52.42¢ per $1 |
| Gini / Inequality Index | 111,899 | 0.40 |
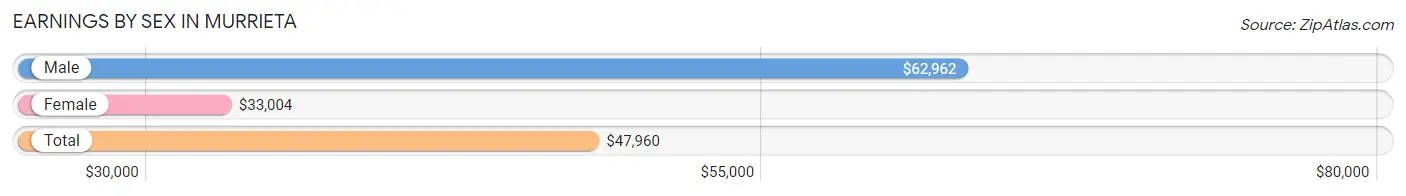
Earnings by Sex in Murrieta
Average Earnings in Murrieta are $47,960, $62,962 for men and $33,004 for women, a difference of 47.6%.
| Sex | Number | Average Earnings |
| Male | 30,542 (54.6%) | $62,962 |
| Female | 25,441 (45.4%) | $33,004 |
| Total | 55,983 (100.0%) | $47,960 |
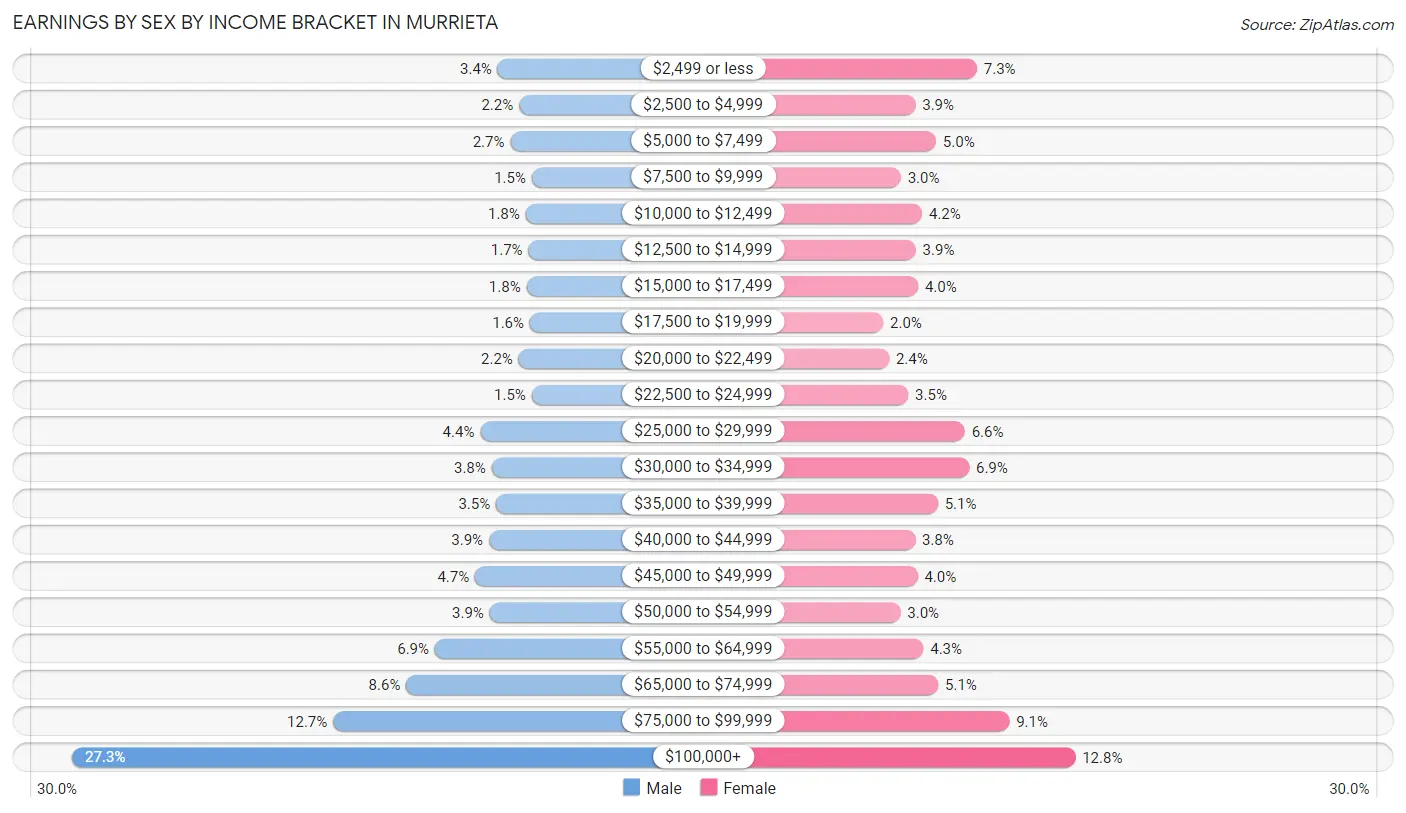
Earnings by Sex by Income Bracket in Murrieta
The most common earnings brackets in Murrieta are $100,000+ for men (8,348 | 27.3%) and $100,000+ for women (3,266 | 12.8%).
| Income | Male | Female |
| $2,499 or less | 1,041 (3.4%) | 1,859 (7.3%) |
| $2,500 to $4,999 | 675 (2.2%) | 979 (3.8%) |
| $5,000 to $7,499 | 825 (2.7%) | 1,275 (5.0%) |
| $7,500 to $9,999 | 456 (1.5%) | 771 (3.0%) |
| $10,000 to $12,499 | 561 (1.8%) | 1,076 (4.2%) |
| $12,500 to $14,999 | 514 (1.7%) | 984 (3.9%) |
| $15,000 to $17,499 | 546 (1.8%) | 1,017 (4.0%) |
| $17,500 to $19,999 | 488 (1.6%) | 520 (2.0%) |
| $20,000 to $22,499 | 680 (2.2%) | 604 (2.4%) |
| $22,500 to $24,999 | 457 (1.5%) | 877 (3.5%) |
| $25,000 to $29,999 | 1,340 (4.4%) | 1,688 (6.6%) |
| $30,000 to $34,999 | 1,146 (3.7%) | 1,749 (6.9%) |
| $35,000 to $39,999 | 1,068 (3.5%) | 1,300 (5.1%) |
| $40,000 to $44,999 | 1,190 (3.9%) | 975 (3.8%) |
| $45,000 to $49,999 | 1,430 (4.7%) | 1,011 (4.0%) |
| $50,000 to $54,999 | 1,179 (3.9%) | 767 (3.0%) |
| $55,000 to $64,999 | 2,120 (6.9%) | 1,095 (4.3%) |
| $65,000 to $74,999 | 2,612 (8.6%) | 1,304 (5.1%) |
| $75,000 to $99,999 | 3,866 (12.7%) | 2,324 (9.1%) |
| $100,000+ | 8,348 (27.3%) | 3,266 (12.8%) |
| Total | 30,542 (100.0%) | 25,441 (100.0%) |
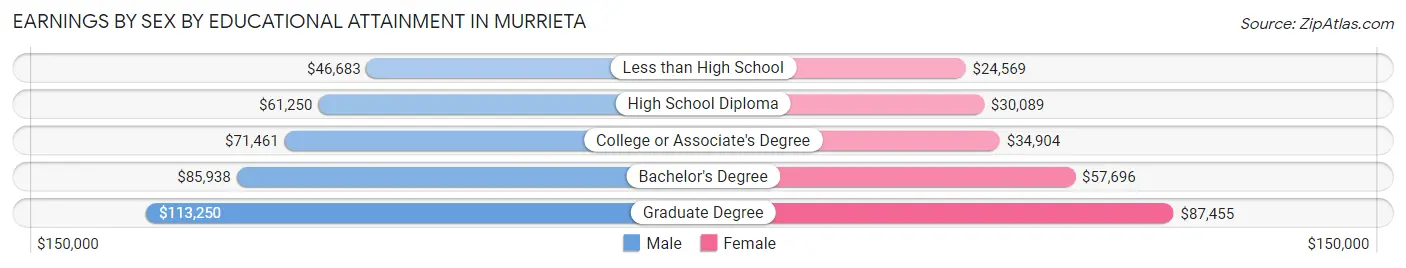
Earnings by Sex by Educational Attainment in Murrieta
Average earnings in Murrieta are $72,069 for men and $39,154 for women, a difference of 45.7%. Men with an educational attainment of graduate degree enjoy the highest average annual earnings of $113,250, while those with less than high school education earn the least with $46,683. Women with an educational attainment of graduate degree earn the most with the average annual earnings of $87,455, while those with less than high school education have the smallest earnings of $24,569.
| Educational Attainment | Male Income | Female Income |
| Less than High School | $46,683 | $24,569 |
| High School Diploma | $61,250 | $30,089 |
| College or Associate's Degree | $71,461 | $34,904 |
| Bachelor's Degree | $85,938 | $57,696 |
| Graduate Degree | $113,250 | $87,455 |
| Total | $72,069 | $39,154 |
Family Income in Murrieta
Family Income Brackets in Murrieta
According to the Murrieta family income data, there are 6,827 families falling into the $100,000 to $149,999 income range, which is the most common income bracket and makes up 25.0% of all families. Conversely, the $10,000 to $14,999 income bracket is the least frequent group with only 273 families (1.0%) belonging to this category.
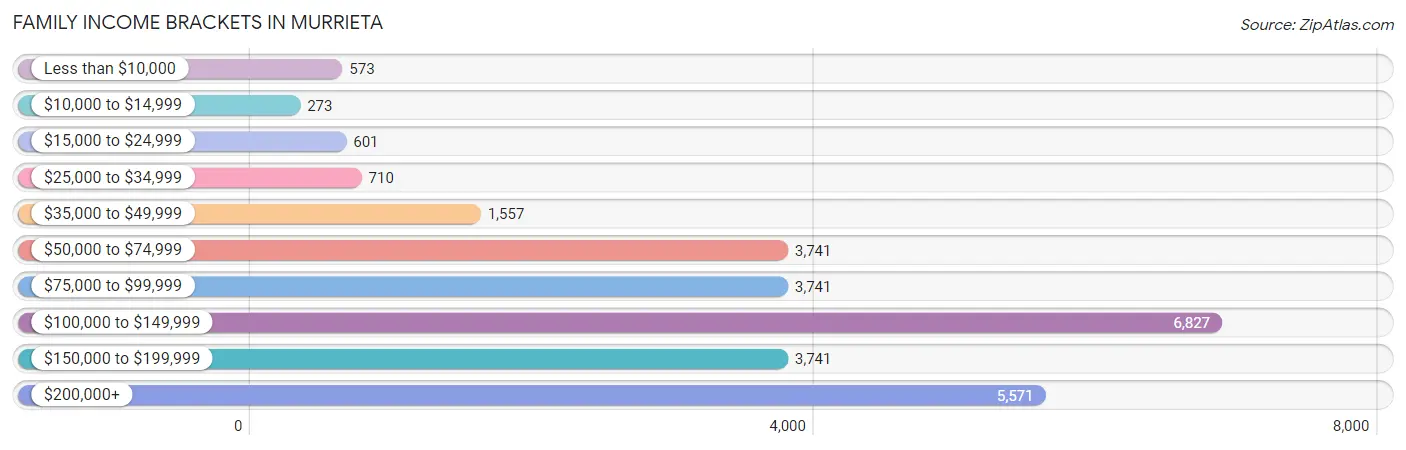
| Income Bracket | # Families | % Families |
| Less than $10,000 | 573 | 2.1% |
| $10,000 to $14,999 | 273 | 1.0% |
| $15,000 to $24,999 | 601 | 2.2% |
| $25,000 to $34,999 | 710 | 2.6% |
| $35,000 to $49,999 | 1,557 | 5.7% |
| $50,000 to $74,999 | 3,741 | 13.7% |
| $75,000 to $99,999 | 3,741 | 13.7% |
| $100,000 to $149,999 | 6,827 | 25.0% |
| $150,000 to $199,999 | 3,741 | 13.7% |
| $200,000+ | 5,571 | 20.4% |
Family Income by Famaliy Size in Murrieta
6-person families (1,225 | 4.5%) account for the highest median family income in Murrieta with $164,125 per family, while 2-person families (8,833 | 32.4%) have the highest median income of $45,227 per family member.
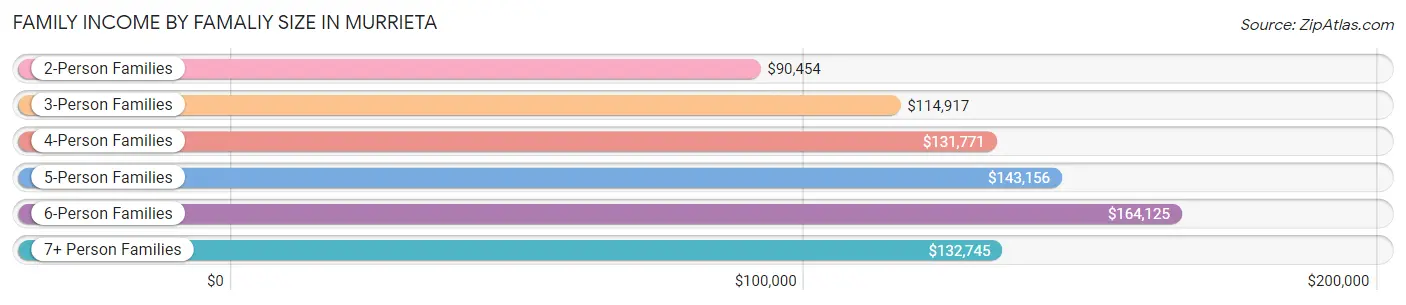
| Income Bracket | # Families | Median Income |
| 2-Person Families | 8,833 (32.4%) | $90,454 |
| 3-Person Families | 6,072 (22.2%) | $114,917 |
| 4-Person Families | 6,655 (24.4%) | $131,771 |
| 5-Person Families | 3,827 (14.0%) | $143,156 |
| 6-Person Families | 1,225 (4.5%) | $164,125 |
| 7+ Person Families | 696 (2.5%) | $132,745 |
| Total | 27,308 (100.0%) | $115,231 |
Family Income by Number of Earners in Murrieta
The median family income in Murrieta is $115,231, with families comprising 3+ earners (4,847) having the highest median family income of $170,847, while families with no earners (2,813) have the lowest median family income of $59,804, accounting for 17.7% and 10.3% of families, respectively.
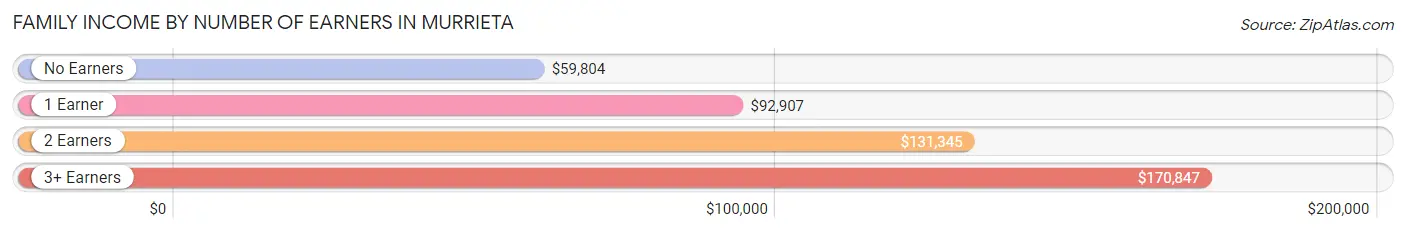
| Number of Earners | # Families | Median Income |
| No Earners | 2,813 (10.3%) | $59,804 |
| 1 Earner | 8,924 (32.7%) | $92,907 |
| 2 Earners | 10,724 (39.3%) | $131,345 |
| 3+ Earners | 4,847 (17.7%) | $170,847 |
| Total | 27,308 (100.0%) | $115,231 |
Household Income in Murrieta
Household Income Brackets in Murrieta
With 8,207 households falling in the category, the $100,000 to $149,999 income range is the most frequent in Murrieta, accounting for 23.8% of all households. In contrast, only 621 households (1.8%) fall into the $10,000 to $14,999 income bracket, making it the least populous group.
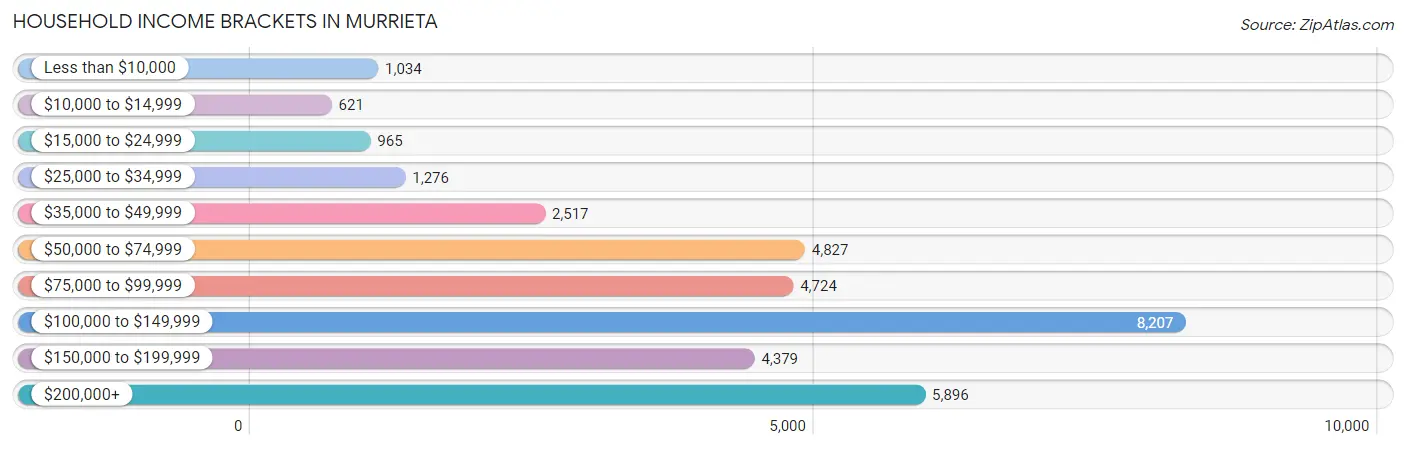
| Income Bracket | # Households | % Households |
| Less than $10,000 | 1,034 | 3.0% |
| $10,000 to $14,999 | 621 | 1.8% |
| $15,000 to $24,999 | 965 | 2.8% |
| $25,000 to $34,999 | 1,276 | 3.7% |
| $35,000 to $49,999 | 2,517 | 7.3% |
| $50,000 to $74,999 | 4,827 | 14.0% |
| $75,000 to $99,999 | 4,724 | 13.7% |
| $100,000 to $149,999 | 8,207 | 23.8% |
| $150,000 to $199,999 | 4,379 | 12.7% |
| $200,000+ | 5,896 | 17.1% |
Household Income by Householder Age in Murrieta
The median household income in Murrieta is $106,925, with the highest median household income of $128,719 found in the 45 to 64 years age bracket for the primary householder. A total of 13,924 households (40.4%) fall into this category. Meanwhile, the 15 to 24 years age bracket for the primary householder has the lowest median household income of $47,991, with 287 households (0.8%) in this group.
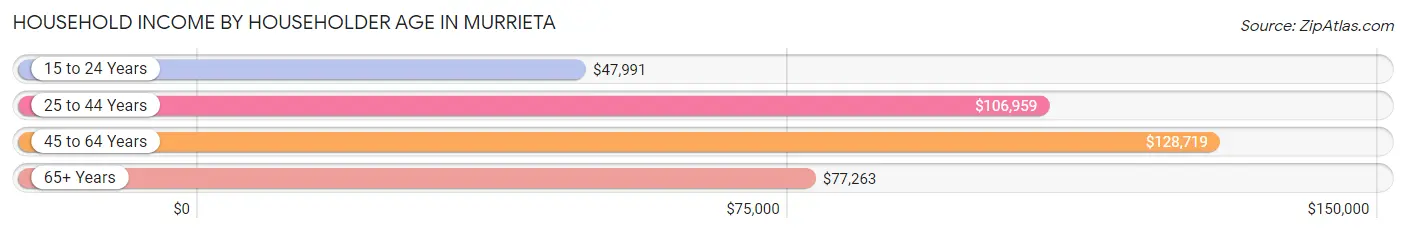
| Income Bracket | # Households | Median Income |
| 15 to 24 Years | 287 (0.8%) | $47,991 |
| 25 to 44 Years | 12,562 (36.4%) | $106,959 |
| 45 to 64 Years | 13,924 (40.4%) | $128,719 |
| 65+ Years | 7,709 (22.4%) | $77,263 |
| Total | 34,482 (100.0%) | $106,925 |
Poverty in Murrieta
Income Below Poverty by Sex and Age in Murrieta
With 5.1% poverty level for males and 8.0% for females among the residents of Murrieta, 15 year old males and 18 to 24 year old females are the most vulnerable to poverty, with 118 males (11.2%) and 684 females (14.0%) in their respective age groups living below the poverty level.
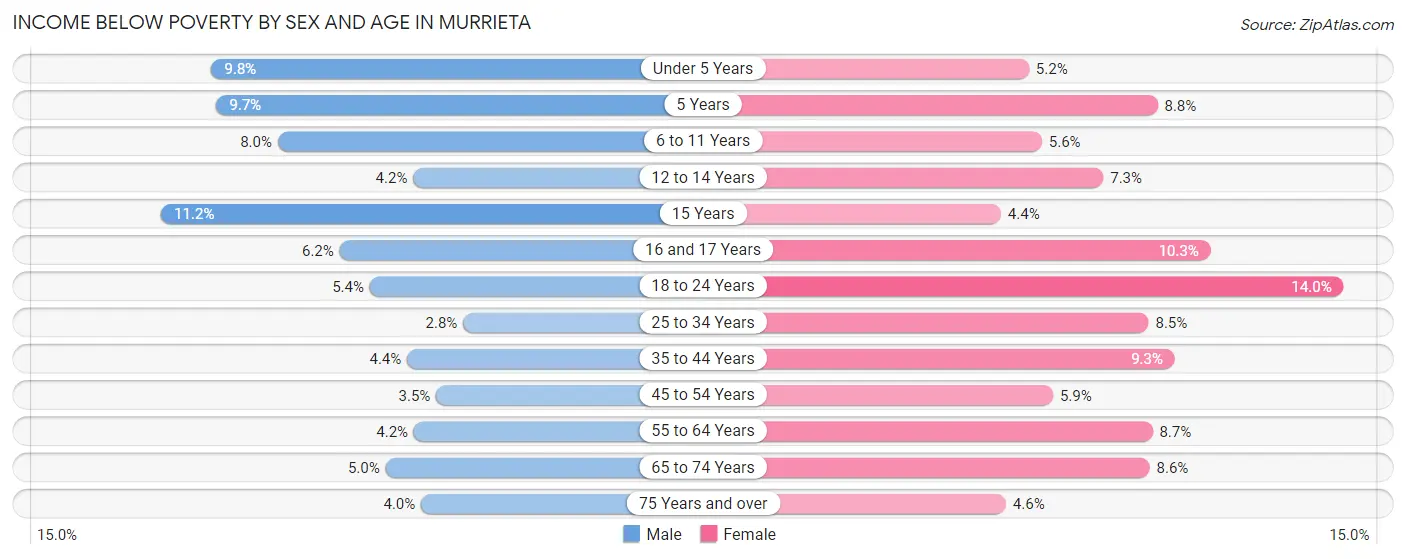
| Age Bracket | Male | Female |
| Under 5 Years | 348 (9.8%) | 201 (5.2%) |
| 5 Years | 46 (9.7%) | 83 (8.8%) |
| 6 to 11 Years | 416 (8.0%) | 280 (5.6%) |
| 12 to 14 Years | 128 (4.2%) | 157 (7.3%) |
| 15 Years | 118 (11.2%) | 47 (4.4%) |
| 16 and 17 Years | 102 (6.2%) | 216 (10.3%) |
| 18 to 24 Years | 305 (5.4%) | 684 (14.0%) |
| 25 to 34 Years | 195 (2.8%) | 583 (8.5%) |
| 35 to 44 Years | 352 (4.3%) | 782 (9.3%) |
| 45 to 54 Years | 242 (3.5%) | 423 (5.9%) |
| 55 to 64 Years | 252 (4.2%) | 558 (8.6%) |
| 65 to 74 Years | 167 (5.0%) | 345 (8.6%) |
| 75 Years and over | 100 (4.0%) | 172 (4.6%) |
| Total | 2,771 (5.1%) | 4,531 (8.0%) |
Income Above Poverty by Sex and Age in Murrieta
According to the poverty statistics in Murrieta, males aged 25 to 34 years and females aged 15 years are the age groups that are most secure financially, with 97.2% of males and 95.6% of females in these age groups living above the poverty line.
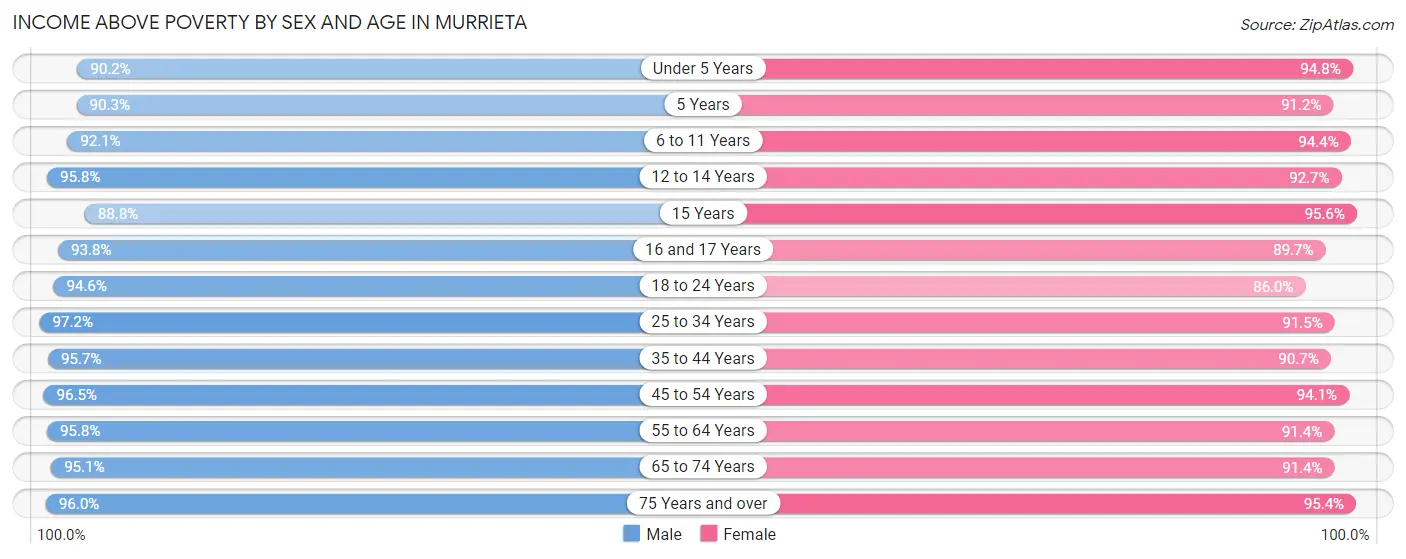
| Age Bracket | Male | Female |
| Under 5 Years | 3,203 (90.2%) | 3,655 (94.8%) |
| 5 Years | 430 (90.3%) | 861 (91.2%) |
| 6 to 11 Years | 4,818 (92.0%) | 4,750 (94.4%) |
| 12 to 14 Years | 2,934 (95.8%) | 2,000 (92.7%) |
| 15 Years | 936 (88.8%) | 1,013 (95.6%) |
| 16 and 17 Years | 1,536 (93.8%) | 1,888 (89.7%) |
| 18 to 24 Years | 5,354 (94.6%) | 4,212 (86.0%) |
| 25 to 34 Years | 6,805 (97.2%) | 6,247 (91.5%) |
| 35 to 44 Years | 7,742 (95.7%) | 7,653 (90.7%) |
| 45 to 54 Years | 6,591 (96.5%) | 6,765 (94.1%) |
| 55 to 64 Years | 5,800 (95.8%) | 5,896 (91.3%) |
| 65 to 74 Years | 3,210 (95.1%) | 3,682 (91.4%) |
| 75 Years and over | 2,427 (96.0%) | 3,594 (95.4%) |
| Total | 51,786 (94.9%) | 52,216 (92.0%) |
Income Below Poverty Among Married-Couple Families in Murrieta
The poverty statistics for married-couple families in Murrieta show that 3.1% or 676 of the total 21,539 families live below the poverty line. Families with 3 or 4 children have the highest poverty rate of 3.4%, comprising of 86 families. On the other hand, families with 5 or more children have the lowest poverty rate of 0.0%, which includes 0 families.
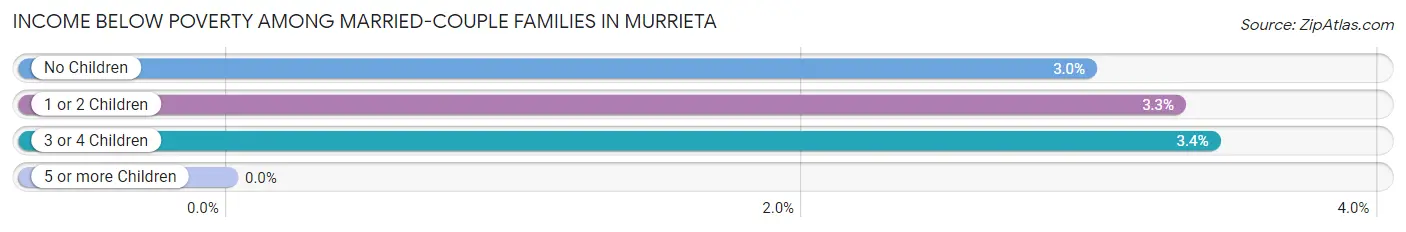
| Children | Above Poverty | Below Poverty |
| No Children | 9,754 (97.0%) | 301 (3.0%) |
| 1 or 2 Children | 8,468 (96.7%) | 289 (3.3%) |
| 3 or 4 Children | 2,429 (96.6%) | 86 (3.4%) |
| 5 or more Children | 212 (100.0%) | 0 (0.0%) |
| Total | 20,863 (96.9%) | 676 (3.1%) |
Income Below Poverty Among Single-Parent Households in Murrieta
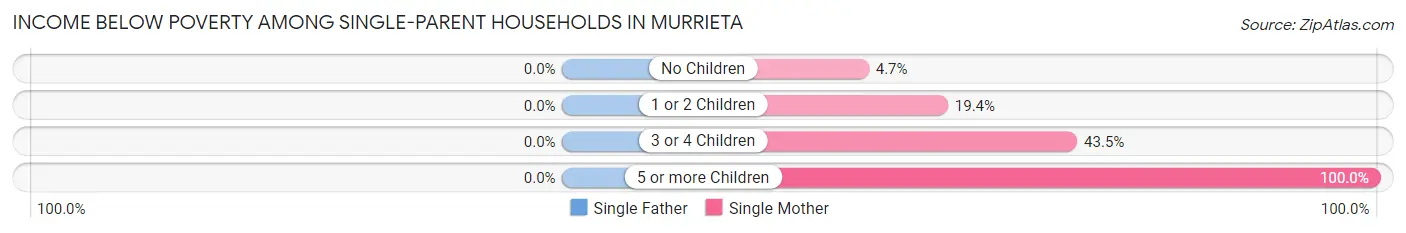
| Children | Single Father | Single Mother |
| No Children | 0 (0.0%) | 77 (4.7%) |
| 1 or 2 Children | 0 (0.0%) | 406 (19.4%) |
| 3 or 4 Children | 0 (0.0%) | 117 (43.5%) |
| 5 or more Children | 0 (0.0%) | 43 (100.0%) |
| Total | 0 (0.0%) | 643 (15.9%) |
Income Below Poverty Among Married-Couple vs Single-Parent Households in Murrieta
The poverty data for Murrieta shows that 676 of the married-couple family households (3.1%) and 643 of the single-parent households (11.2%) are living below the poverty level. Within the married-couple family households, those with 3 or 4 children have the highest poverty rate, with 86 households (3.4%) falling below the poverty line. Among the single-parent households, those with 5 or more children have the highest poverty rate, with 43 household (100.0%) living below poverty.
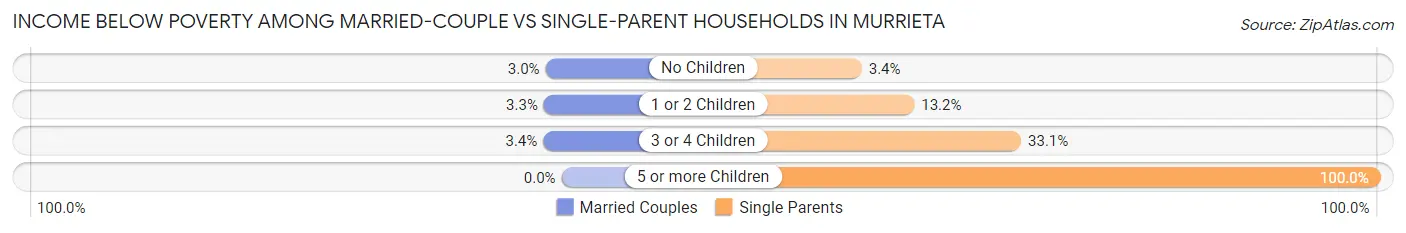
| Children | Married-Couple Families | Single-Parent Households |
| No Children | 301 (3.0%) | 77 (3.4%) |
| 1 or 2 Children | 289 (3.3%) | 406 (13.2%) |
| 3 or 4 Children | 86 (3.4%) | 117 (33.1%) |
| 5 or more Children | 0 (0.0%) | 43 (100.0%) |
| Total | 676 (3.1%) | 643 (11.2%) |
Race in Murrieta
The most populous races in Murrieta are White / Caucasian (65,982 | 59.0%), Hispanic or Latino (38,622 | 34.5%), and Two or more Races (17,301 | 15.5%).
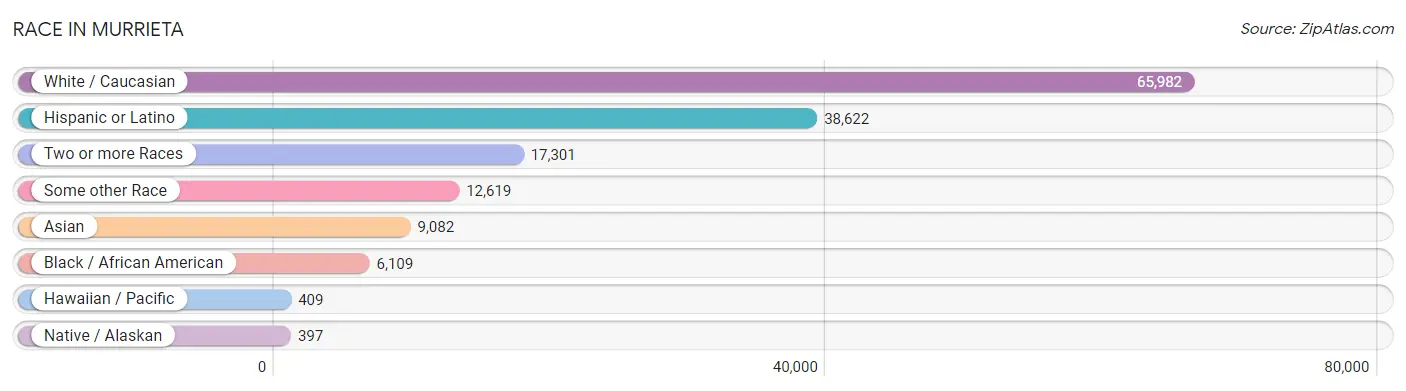
| Race | # Population | % Population |
| Asian | 9,082 | 8.1% |
| Black / African American | 6,109 | 5.5% |
| Hawaiian / Pacific | 409 | 0.4% |
| Hispanic or Latino | 38,622 | 34.5% |
| Native / Alaskan | 397 | 0.4% |
| White / Caucasian | 65,982 | 59.0% |
| Two or more Races | 17,301 | 15.5% |
| Some other Race | 12,619 | 11.3% |
| Total | 111,899 | 100.0% |
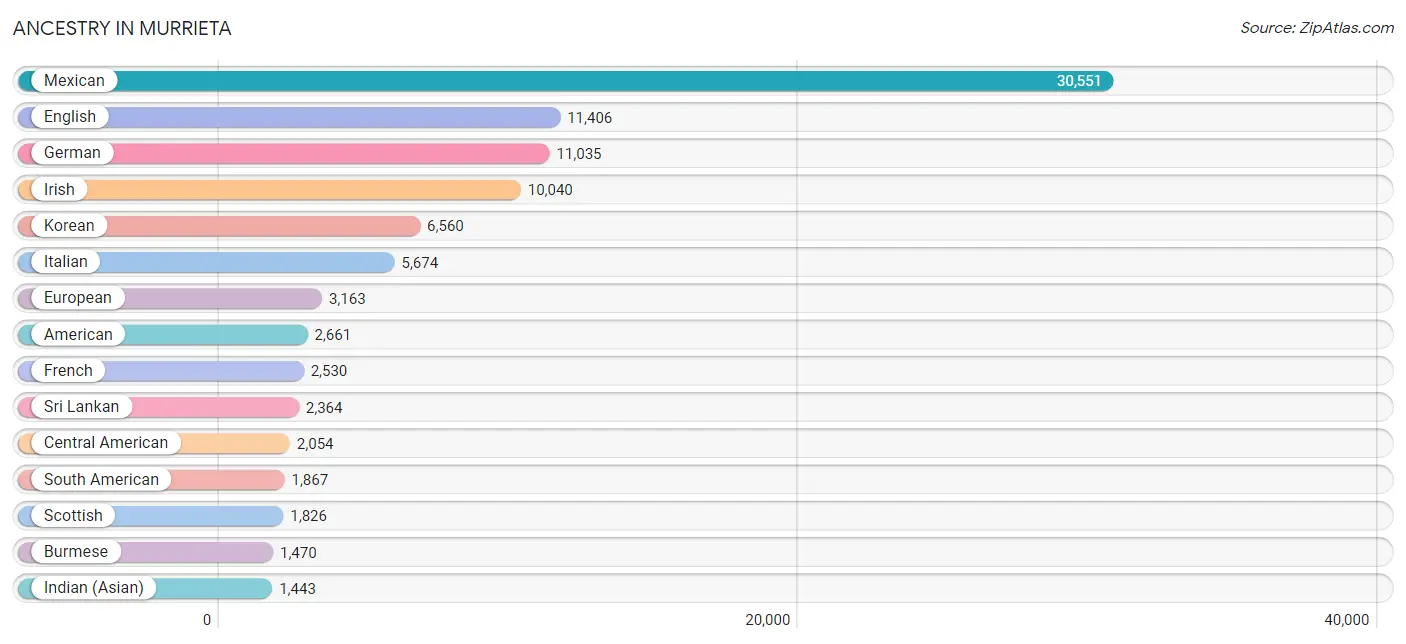
Ancestry in Murrieta
The most populous ancestries reported in Murrieta are Mexican (30,551 | 27.3%), English (11,406 | 10.2%), German (11,035 | 9.9%), Irish (10,040 | 9.0%), and Korean (6,560 | 5.9%), together accounting for 62.2% of all Murrieta residents.
| Ancestry | # Population | % Population |
| Afghan | 226 | 0.2% |
| African | 530 | 0.5% |
| American | 2,661 | 2.4% |
| Apache | 307 | 0.3% |
| Arab | 1,247 | 1.1% |
| Argentinean | 85 | 0.1% |
| Armenian | 265 | 0.2% |
| Australian | 133 | 0.1% |
| Austrian | 85 | 0.1% |
| Basque | 144 | 0.1% |
| Bhutanese | 1,268 | 1.1% |
| Blackfeet | 124 | 0.1% |
| Bolivian | 43 | 0.0% |
| Brazilian | 13 | 0.0% |
| British | 464 | 0.4% |
| Burmese | 1,470 | 1.3% |
| Canadian | 350 | 0.3% |
| Cape Verdean | 7 | 0.0% |
| Central American | 2,054 | 1.8% |
| Central American Indian | 47 | 0.0% |
| Cherokee | 165 | 0.2% |
| Chickasaw | 32 | 0.0% |
| Chippewa | 162 | 0.1% |
| Choctaw | 73 | 0.1% |
| Colombian | 802 | 0.7% |
| Comanche | 79 | 0.1% |
| Costa Rican | 87 | 0.1% |
| Creek | 31 | 0.0% |
| Croatian | 588 | 0.5% |
| Cuban | 519 | 0.5% |
| Czech | 771 | 0.7% |
| Czechoslovakian | 15 | 0.0% |
| Danish | 426 | 0.4% |
| Dominican | 154 | 0.1% |
| Dutch | 889 | 0.8% |
| Eastern European | 238 | 0.2% |
| Ecuadorian | 236 | 0.2% |
| Egyptian | 39 | 0.0% |
| English | 11,406 | 10.2% |
| European | 3,163 | 2.8% |
| Filipino | 8 | 0.0% |
| Finnish | 187 | 0.2% |
| French | 2,530 | 2.3% |
| French Canadian | 562 | 0.5% |
| German | 11,035 | 9.9% |
| Ghanaian | 10 | 0.0% |
| Greek | 335 | 0.3% |
| Guamanian / Chamorro | 218 | 0.2% |
| Guatemalan | 152 | 0.1% |
| Guyanese | 23 | 0.0% |
| Haitian | 39 | 0.0% |
| Honduran | 187 | 0.2% |
| Hungarian | 309 | 0.3% |
| Indian (Asian) | 1,443 | 1.3% |
| Iranian | 330 | 0.3% |
| Iraqi | 8 | 0.0% |
| Irish | 10,040 | 9.0% |
| Iroquois | 44 | 0.0% |
| Israeli | 6 | 0.0% |
| Italian | 5,674 | 5.1% |
| Jamaican | 166 | 0.2% |
| Japanese | 282 | 0.3% |
| Jordanian | 84 | 0.1% |
| Korean | 6,560 | 5.9% |
| Laotian | 263 | 0.2% |
| Latvian | 32 | 0.0% |
| Lebanese | 413 | 0.4% |
| Lithuanian | 96 | 0.1% |
| Malaysian | 216 | 0.2% |
| Maltese | 14 | 0.0% |
| Mexican | 30,551 | 27.3% |
| Mexican American Indian | 57 | 0.1% |
| Mongolian | 24 | 0.0% |
| Native Hawaiian | 470 | 0.4% |
| Nicaraguan | 535 | 0.5% |
| Nigerian | 100 | 0.1% |
| Northern European | 86 | 0.1% |
| Norwegian | 1,396 | 1.3% |
| Paiute | 3 | 0.0% |
| Pakistani | 96 | 0.1% |
| Palestinian | 62 | 0.1% |
| Panamanian | 21 | 0.0% |
| Peruvian | 454 | 0.4% |
| Pima | 5 | 0.0% |
| Polish | 968 | 0.9% |
| Portuguese | 1,038 | 0.9% |
| Puerto Rican | 781 | 0.7% |
| Romanian | 49 | 0.0% |
| Russian | 559 | 0.5% |
| Salvadoran | 1,072 | 1.0% |
| Samoan | 238 | 0.2% |
| Scandinavian | 447 | 0.4% |
| Scotch-Irish | 901 | 0.8% |
| Scottish | 1,826 | 1.6% |
| Serbian | 29 | 0.0% |
| Slavic | 10 | 0.0% |
| Slovak | 221 | 0.2% |
| Slovene | 12 | 0.0% |
| Somali | 80 | 0.1% |
| South African | 42 | 0.0% |
| South American | 1,867 | 1.7% |
| South American Indian | 14 | 0.0% |
| Spaniard | 839 | 0.7% |
| Spanish | 1,074 | 1.0% |
| Sri Lankan | 2,364 | 2.1% |
| Subsaharan African | 769 | 0.7% |
| Swedish | 1,204 | 1.1% |
| Swiss | 103 | 0.1% |
| Syrian | 439 | 0.4% |
| Thai | 386 | 0.3% |
| Tongan | 106 | 0.1% |
| Turkish | 33 | 0.0% |
| Ukrainian | 89 | 0.1% |
| Venezuelan | 94 | 0.1% |
| Welsh | 642 | 0.6% |
| Yaqui | 211 | 0.2% |
| Yugoslavian | 24 | 0.0% | View All 117 Rows |
Immigrants in Murrieta
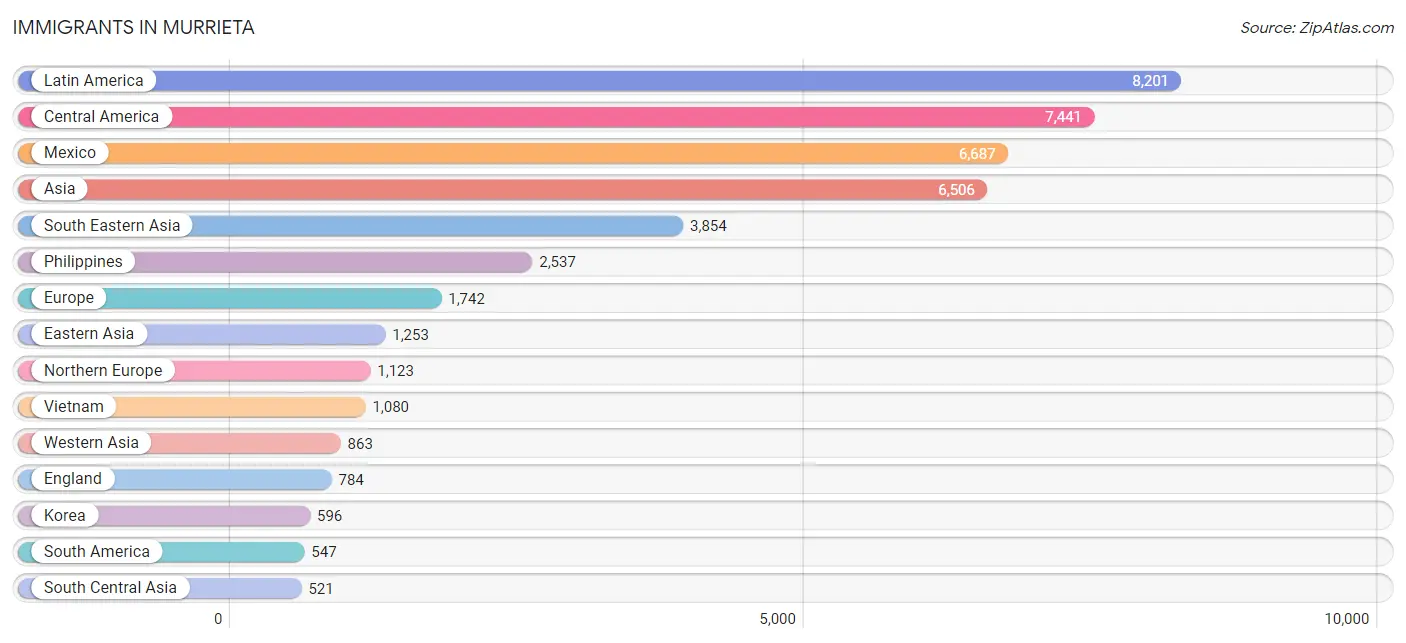
The most numerous immigrant groups reported in Murrieta came from Latin America (8,201 | 7.3%), Central America (7,441 | 6.7%), Mexico (6,687 | 6.0%), Asia (6,506 | 5.8%), and South Eastern Asia (3,854 | 3.4%), together accounting for 29.2% of all Murrieta residents.
| Immigration Origin | # Population | % Population |
| Afghanistan | 194 | 0.2% |
| Africa | 175 | 0.2% |
| Argentina | 9 | 0.0% |
| Armenia | 22 | 0.0% |
| Asia | 6,506 | 5.8% |
| Australia | 151 | 0.1% |
| Austria | 7 | 0.0% |
| Belize | 27 | 0.0% |
| Brazil | 1 | 0.0% |
| Cambodia | 69 | 0.1% |
| Cameroon | 32 | 0.0% |
| Canada | 236 | 0.2% |
| Caribbean | 213 | 0.2% |
| Central America | 7,441 | 6.7% |
| China | 450 | 0.4% |
| Colombia | 220 | 0.2% |
| Costa Rica | 52 | 0.1% |
| Cuba | 109 | 0.1% |
| Denmark | 12 | 0.0% |
| Dominican Republic | 14 | 0.0% |
| Eastern Africa | 34 | 0.0% |
| Eastern Asia | 1,253 | 1.1% |
| Eastern Europe | 165 | 0.2% |
| Ecuador | 83 | 0.1% |
| Egypt | 48 | 0.0% |
| El Salvador | 324 | 0.3% |
| England | 784 | 0.7% |
| Europe | 1,742 | 1.6% |
| Fiji | 66 | 0.1% |
| Germany | 90 | 0.1% |
| Greece | 51 | 0.1% |
| Guatemala | 118 | 0.1% |
| Guyana | 23 | 0.0% |
| Haiti | 39 | 0.0% |
| Honduras | 126 | 0.1% |
| Hungary | 16 | 0.0% |
| India | 158 | 0.1% |
| Indonesia | 55 | 0.1% |
| Iran | 151 | 0.1% |
| Iraq | 106 | 0.1% |
| Ireland | 39 | 0.0% |
| Israel | 35 | 0.0% |
| Italy | 65 | 0.1% |
| Jamaica | 22 | 0.0% |
| Japan | 207 | 0.2% |
| Jordan | 125 | 0.1% |
| Korea | 596 | 0.5% |
| Kuwait | 9 | 0.0% |
| Laos | 69 | 0.1% |
| Latin America | 8,201 | 7.3% |
| Latvia | 37 | 0.0% |
| Lebanon | 153 | 0.1% |
| Lithuania | 39 | 0.0% |
| Mexico | 6,687 | 6.0% |
| Middle Africa | 32 | 0.0% |
| Netherlands | 68 | 0.1% |
| Nicaragua | 86 | 0.1% |
| Nigeria | 18 | 0.0% |
| Northern Africa | 58 | 0.1% |
| Northern Europe | 1,123 | 1.0% |
| Oceania | 315 | 0.3% |
| Pakistan | 8 | 0.0% |
| Panama | 21 | 0.0% |
| Peru | 211 | 0.2% |
| Philippines | 2,537 | 2.3% |
| Poland | 20 | 0.0% |
| Portugal | 29 | 0.0% |
| Romania | 10 | 0.0% |
| Russia | 21 | 0.0% |
| Saudi Arabia | 10 | 0.0% |
| Scotland | 30 | 0.0% |
| Somalia | 34 | 0.0% |
| South Africa | 33 | 0.0% |
| South America | 547 | 0.5% |
| South Central Asia | 521 | 0.5% |
| South Eastern Asia | 3,854 | 3.4% |
| Southern Europe | 257 | 0.2% |
| Spain | 112 | 0.1% |
| Sri Lanka | 10 | 0.0% |
| St. Vincent and the Grenadines | 29 | 0.0% |
| Sweden | 21 | 0.0% |
| Switzerland | 32 | 0.0% |
| Syria | 346 | 0.3% |
| Taiwan | 91 | 0.1% |
| Thailand | 44 | 0.0% |
| Vietnam | 1,080 | 1.0% |
| Western Africa | 18 | 0.0% |
| Western Asia | 863 | 0.8% |
| Western Europe | 197 | 0.2% | View All 89 Rows |
Sex and Age in Murrieta
Sex and Age in Murrieta
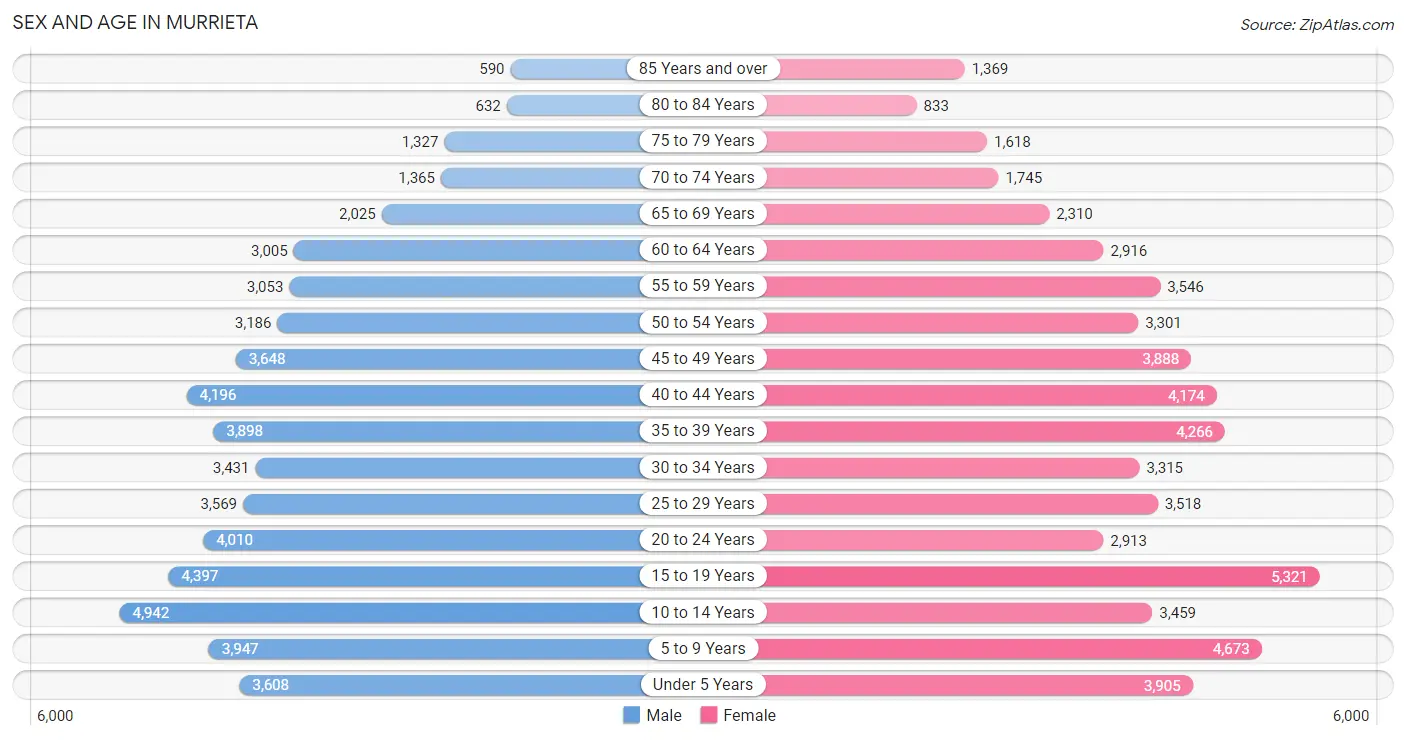
The most populous age groups in Murrieta are 10 to 14 Years (4,942 | 9.0%) for men and 15 to 19 Years (5,321 | 9.3%) for women.
| Age Bracket | Male | Female |
| Under 5 Years | 3,608 (6.6%) | 3,905 (6.8%) |
| 5 to 9 Years | 3,947 (7.2%) | 4,673 (8.2%) |
| 10 to 14 Years | 4,942 (9.0%) | 3,459 (6.1%) |
| 15 to 19 Years | 4,397 (8.0%) | 5,321 (9.3%) |
| 20 to 24 Years | 4,010 (7.3%) | 2,913 (5.1%) |
| 25 to 29 Years | 3,569 (6.5%) | 3,518 (6.2%) |
| 30 to 34 Years | 3,431 (6.3%) | 3,315 (5.8%) |
| 35 to 39 Years | 3,898 (7.1%) | 4,266 (7.5%) |
| 40 to 44 Years | 4,196 (7.6%) | 4,174 (7.3%) |
| 45 to 49 Years | 3,648 (6.7%) | 3,888 (6.8%) |
| 50 to 54 Years | 3,186 (5.8%) | 3,301 (5.8%) |
| 55 to 59 Years | 3,053 (5.6%) | 3,546 (6.2%) |
| 60 to 64 Years | 3,005 (5.5%) | 2,916 (5.1%) |
| 65 to 69 Years | 2,025 (3.7%) | 2,310 (4.1%) |
| 70 to 74 Years | 1,365 (2.5%) | 1,745 (3.1%) |
| 75 to 79 Years | 1,327 (2.4%) | 1,618 (2.8%) |
| 80 to 84 Years | 632 (1.1%) | 833 (1.5%) |
| 85 Years and over | 590 (1.1%) | 1,369 (2.4%) |
| Total | 54,829 (100.0%) | 57,070 (100.0%) |
Families and Households in Murrieta
Median Family Size in Murrieta
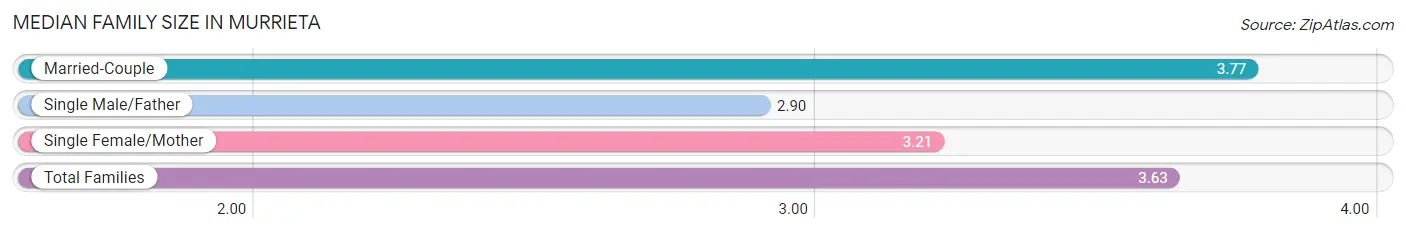
The median family size in Murrieta is 3.63 persons per family, with married-couple families (21,539 | 78.9%) accounting for the largest median family size of 3.77 persons per family. On the other hand, single male/father families (1,721 | 6.3%) represent the smallest median family size with 2.90 persons per family.
| Family Type | # Families | Family Size |
| Married-Couple | 21,539 (78.9%) | 3.77 |
| Single Male/Father | 1,721 (6.3%) | 2.90 |
| Single Female/Mother | 4,048 (14.8%) | 3.21 |
| Total Families | 27,308 (100.0%) | 3.63 |
Median Household Size in Murrieta
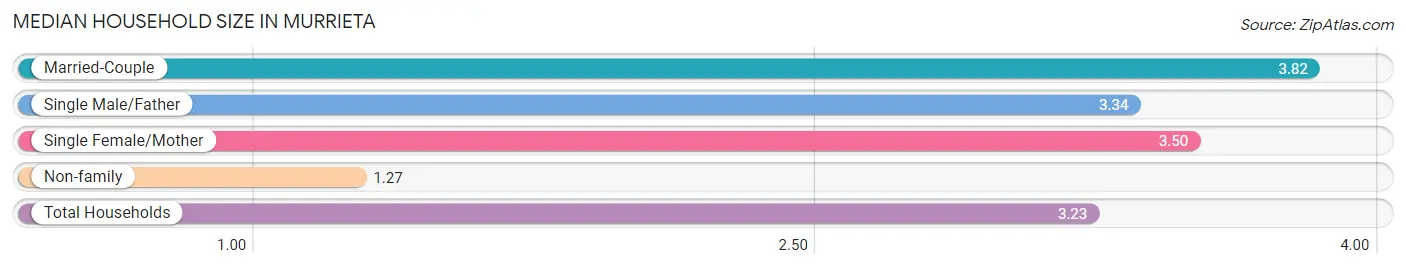
The median household size in Murrieta is 3.23 persons per household, with married-couple households (21,539 | 62.5%) accounting for the largest median household size of 3.82 persons per household. non-family households (7,174 | 20.8%) represent the smallest median household size with 1.27 persons per household.
| Household Type | # Households | Household Size |
| Married-Couple | 21,539 (62.5%) | 3.82 |
| Single Male/Father | 1,721 (5.0%) | 3.34 |
| Single Female/Mother | 4,048 (11.7%) | 3.50 |
| Non-family | 7,174 (20.8%) | 1.27 |
| Total Households | 34,482 (100.0%) | 3.23 |
Household Size by Marriage Status in Murrieta
Out of a total of 34,482 households in Murrieta, 27,308 (79.2%) are family households, while 7,174 (20.8%) are nonfamily households. The most numerous type of family households are 2-person households, comprising 7,881, and the most common type of nonfamily households are 1-person households, comprising 5,759.
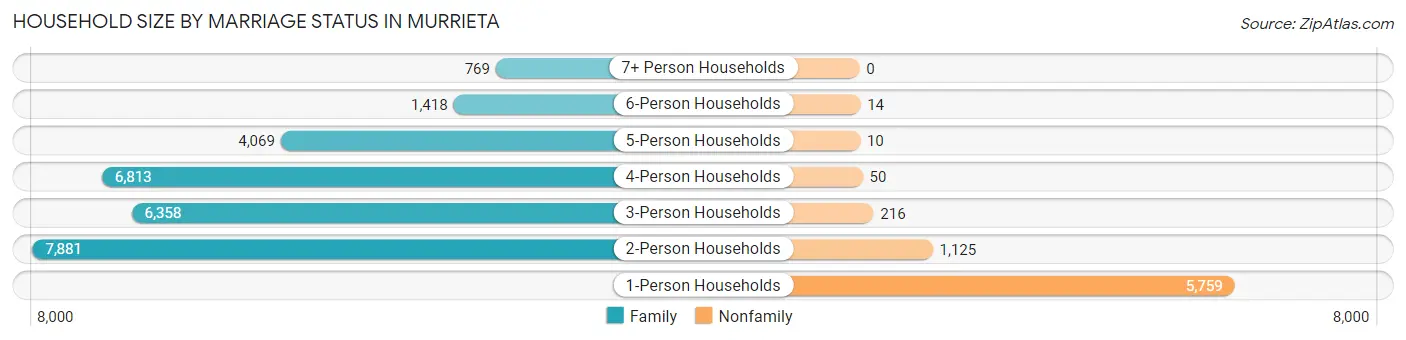
| Household Size | Family Households | Nonfamily Households |
| 1-Person Households | - | 5,759 (16.7%) |
| 2-Person Households | 7,881 (22.9%) | 1,125 (3.3%) |
| 3-Person Households | 6,358 (18.4%) | 216 (0.6%) |
| 4-Person Households | 6,813 (19.8%) | 50 (0.2%) |
| 5-Person Households | 4,069 (11.8%) | 10 (0.0%) |
| 6-Person Households | 1,418 (4.1%) | 14 (0.0%) |
| 7+ Person Households | 769 (2.2%) | 0 (0.0%) |
| Total | 27,308 (79.2%) | 7,174 (20.8%) |
Female Fertility in Murrieta
Fertility by Age in Murrieta
Average fertility rate in Murrieta is 38.0 births per 1,000 women. Women in the age bracket of 20 to 34 years have the highest fertility rate with 59.0 births per 1,000 women. Women in the age bracket of 20 to 34 years acount for 53.9% of all women with births.
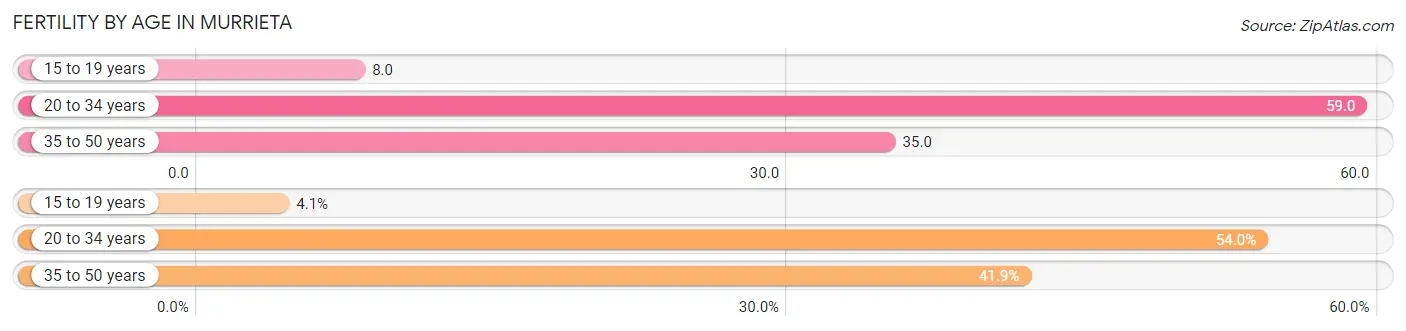
| Age Bracket | Women with Births | Births / 1,000 Women |
| 15 to 19 years | 44 (4.1%) | 8.0 |
| 20 to 34 years | 573 (53.9%) | 59.0 |
| 35 to 50 years | 445 (41.9%) | 35.0 |
| Total | 1,062 (100.0%) | 38.0 |
Fertility by Age by Marriage Status in Murrieta
78.8% of women with births (1,062) in Murrieta are married. The highest percentage of unmarried women with births falls into 15 to 19 years age bracket with 100.0% of them unmarried at the time of birth, while the lowest percentage of unmarried women with births belong to 35 to 50 years age bracket with 7.4% of them unmarried.
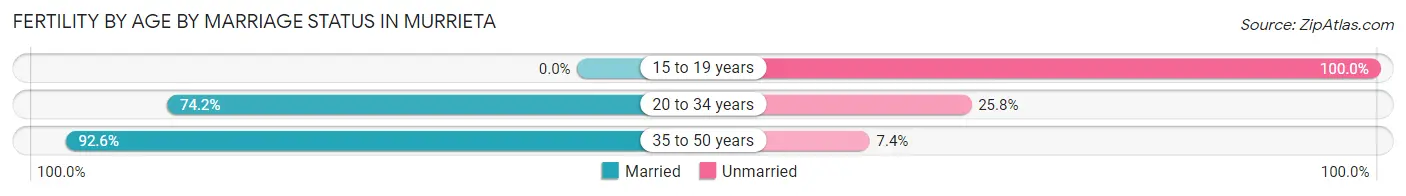
| Age Bracket | Married | Unmarried |
| 15 to 19 years | 0 (0.0%) | 44 (100.0%) |
| 20 to 34 years | 425 (74.2%) | 148 (25.8%) |
| 35 to 50 years | 412 (92.6%) | 33 (7.4%) |
| Total | 837 (78.8%) | 225 (21.2%) |
Fertility by Education in Murrieta
Average fertility rate in Murrieta is 38.0 births per 1,000 women. Women with the education attainment of graduate degree have the highest fertility rate of 74.0 births per 1,000 women, while women with the education attainment of less than high school have the lowest fertility at 7.0 births per 1,000 women. Women with the education attainment of college or associate's degree represent 38.2% of all women with births.
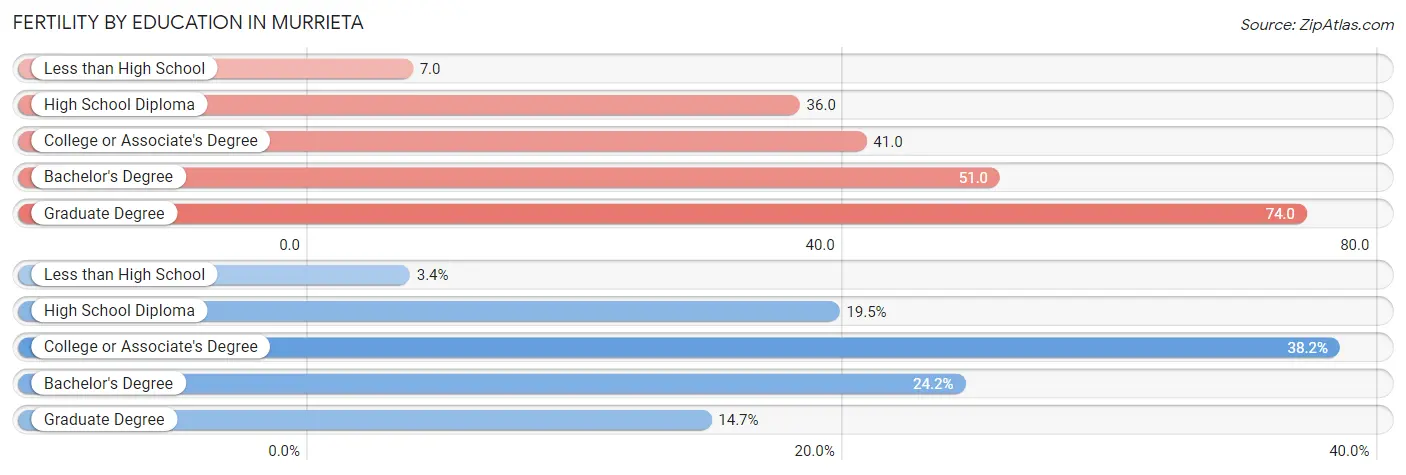
| Educational Attainment | Women with Births | Births / 1,000 Women |
| Less than High School | 36 (3.4%) | 7.0 |
| High School Diploma | 207 (19.5%) | 36.0 |
| College or Associate's Degree | 406 (38.2%) | 41.0 |
| Bachelor's Degree | 257 (24.2%) | 51.0 |
| Graduate Degree | 156 (14.7%) | 74.0 |
| Total | 1,062 (100.0%) | 38.0 |
Fertility by Education by Marriage Status in Murrieta
21.2% of women with births in Murrieta are unmarried. Women with the educational attainment of bachelor's degree are most likely to be married with 100.0% of them married at childbirth, while women with the educational attainment of less than high school are least likely to be married with 100.0% of them unmarried at childbirth.
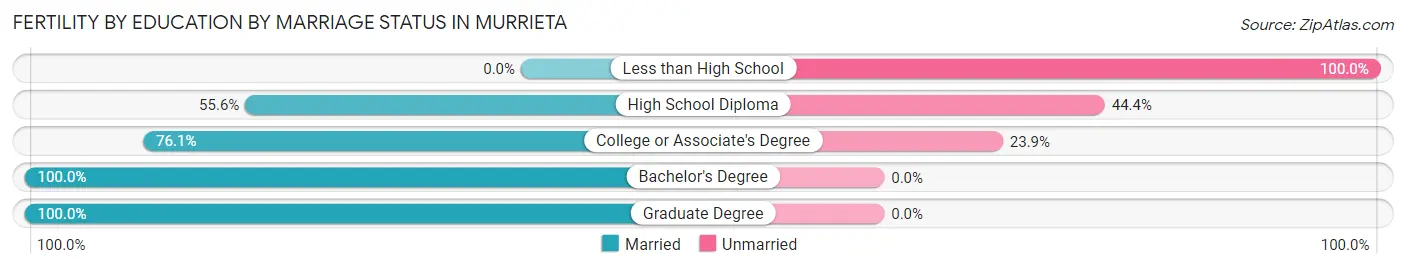
| Educational Attainment | Married | Unmarried |
| Less than High School | 0 (0.0%) | 36 (100.0%) |
| High School Diploma | 115 (55.6%) | 92 (44.4%) |
| College or Associate's Degree | 309 (76.1%) | 97 (23.9%) |
| Bachelor's Degree | 257 (100.0%) | 0 (0.0%) |
| Graduate Degree | 156 (100.0%) | 0 (0.0%) |
| Total | 837 (78.8%) | 225 (21.2%) |
Employment Characteristics in Murrieta
Employment by Class of Employer in Murrieta
Among the 49,203 employed individuals in Murrieta, private company employees (32,327 | 65.7%), local government employees (5,040 | 10.2%), and federal government employees (2,741 | 5.6%) make up the most common classes of employment.
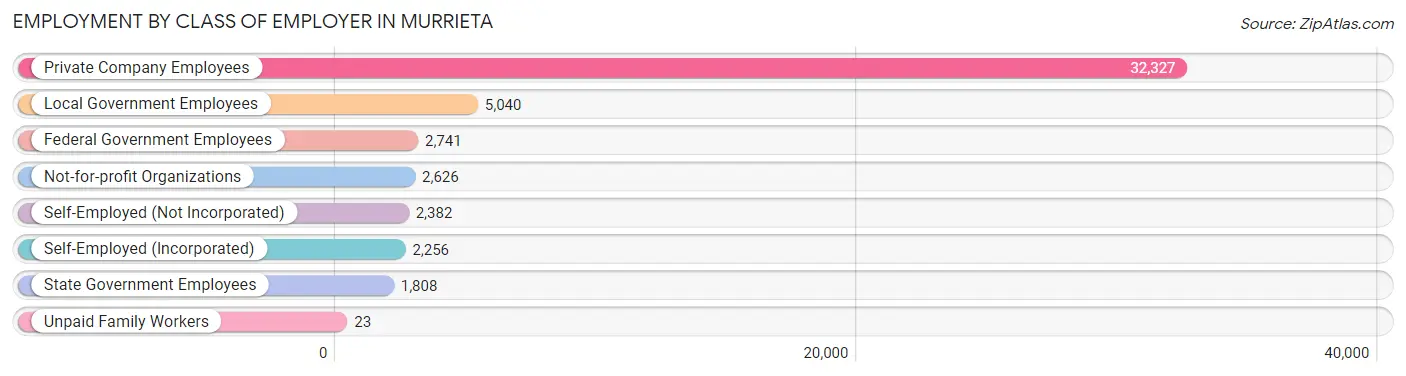
| Employer Class | # Employees | % Employees |
| Private Company Employees | 32,327 | 65.7% |
| Self-Employed (Incorporated) | 2,256 | 4.6% |
| Self-Employed (Not Incorporated) | 2,382 | 4.8% |
| Not-for-profit Organizations | 2,626 | 5.3% |
| Local Government Employees | 5,040 | 10.2% |
| State Government Employees | 1,808 | 3.7% |
| Federal Government Employees | 2,741 | 5.6% |
| Unpaid Family Workers | 23 | 0.1% |
| Total | 49,203 | 100.0% |
Employment Status by Age in Murrieta
According to the labor force statistics for Murrieta, out of the total population over 16 years of age (85,251), 63.4% or 54,049 individuals are in the labor force, with 6.7% or 3,621 of them unemployed. The age group with the highest labor force participation rate is 25 to 29 years, with 82.2% or 5,826 individuals in the labor force. Within the labor force, the 16 to 19 years age range has the highest percentage of unemployed individuals, with 26.7% or 725 of them being unemployed.
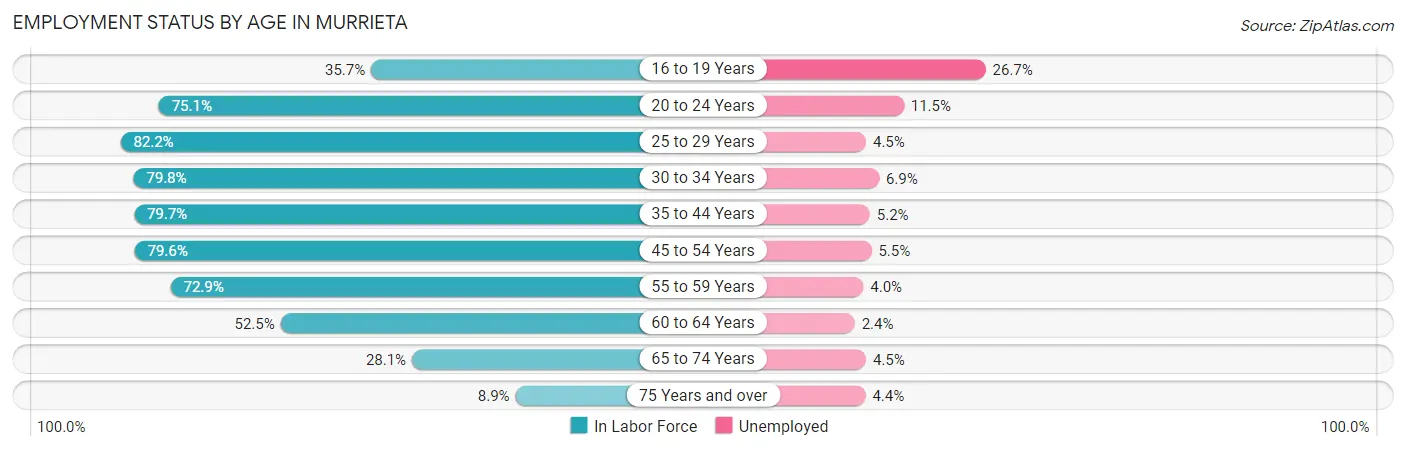
| Age Bracket | In Labor Force | Unemployed |
| 16 to 19 Years | 2,715 (35.7%) | 725 (26.7%) |
| 20 to 24 Years | 5,199 (75.1%) | 598 (11.5%) |
| 25 to 29 Years | 5,826 (82.2%) | 262 (4.5%) |
| 30 to 34 Years | 5,383 (79.8%) | 371 (6.9%) |
| 35 to 44 Years | 13,178 (79.7%) | 685 (5.2%) |
| 45 to 54 Years | 11,162 (79.6%) | 614 (5.5%) |
| 55 to 59 Years | 4,811 (72.9%) | 192 (4.0%) |
| 60 to 64 Years | 3,109 (52.5%) | 75 (2.4%) |
| 65 to 74 Years | 2,092 (28.1%) | 94 (4.5%) |
| 75 Years and over | 567 (8.9%) | 25 (4.4%) |
| Total | 54,049 (63.4%) | 3,621 (6.7%) |
Employment Status by Educational Attainment in Murrieta
According to labor force statistics for Murrieta, 76.4% of individuals (43,479) out of the total population between 25 and 64 years of age (56,910) are in the labor force, with 5.0% or 2,174 of them being unemployed. The group with the highest labor force participation rate are those with the educational attainment of bachelor's degree or higher, with 82.2% or 14,503 individuals in the labor force. Within the labor force, individuals with high school diploma education have the highest percentage of unemployment, with 7.1% or 592 of them being unemployed.
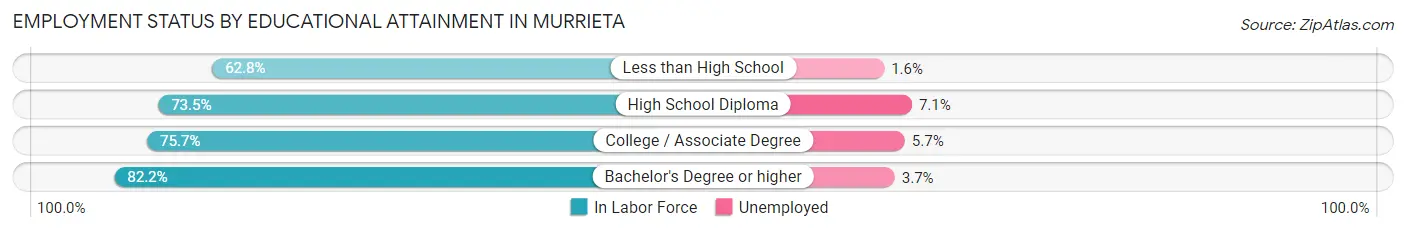
| Educational Attainment | In Labor Force | Unemployed |
| Less than High School | 2,526 (62.8%) | 64 (1.6%) |
| High School Diploma | 8,342 (73.5%) | 806 (7.1%) |
| College / Associate Degree | 18,089 (75.7%) | 1,362 (5.7%) |
| Bachelor's Degree or higher | 14,503 (82.2%) | 653 (3.7%) |
| Total | 43,479 (76.4%) | 2,846 (5.0%) |
Employment Occupations by Sex in Murrieta
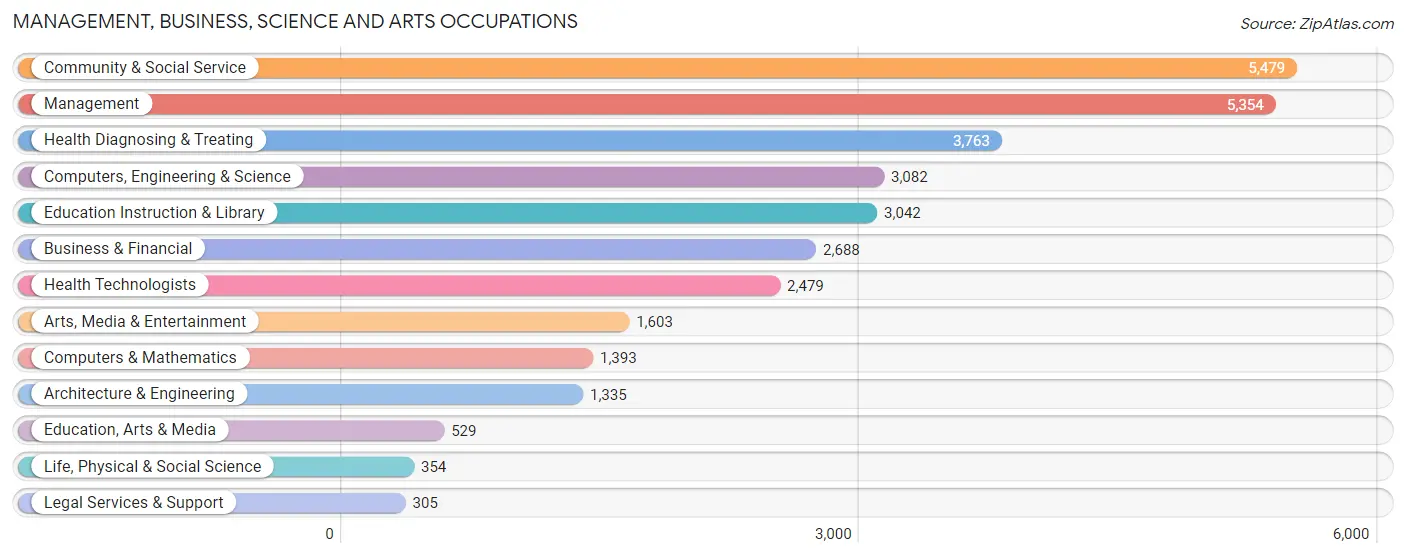
Management, Business, Science and Arts Occupations
The most common Management, Business, Science and Arts occupations in Murrieta are Community & Social Service (5,479 | 11.0%), Management (5,354 | 10.8%), Health Diagnosing & Treating (3,763 | 7.6%), Computers, Engineering & Science (3,082 | 6.2%), and Education Instruction & Library (3,042 | 6.1%).
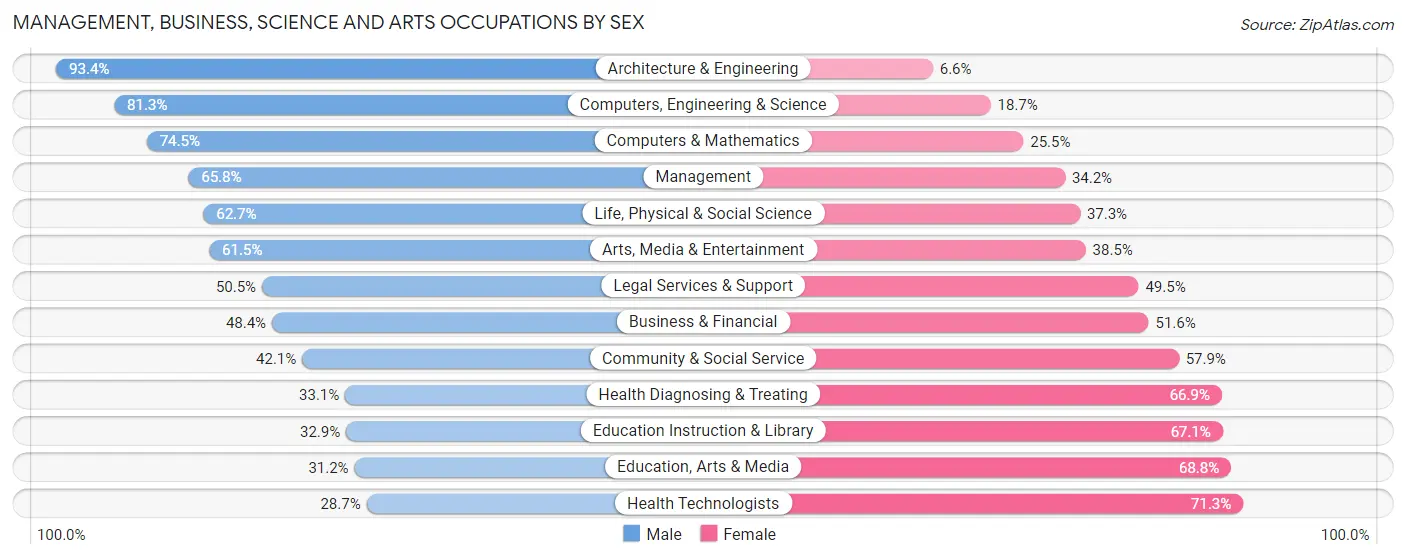
Management, Business, Science and Arts Occupations by Sex
Within the Management, Business, Science and Arts occupations in Murrieta, the most male-oriented occupations are Architecture & Engineering (93.4%), Computers, Engineering & Science (81.3%), and Computers & Mathematics (74.5%), while the most female-oriented occupations are Health Technologists (71.3%), Education, Arts & Media (68.8%), and Education Instruction & Library (67.1%).
| Occupation | Male | Female |
| Management | 3,525 (65.8%) | 1,829 (34.2%) |
| Business & Financial | 1,301 (48.4%) | 1,387 (51.6%) |
| Computers, Engineering & Science | 2,507 (81.3%) | 575 (18.7%) |
| Computers & Mathematics | 1,038 (74.5%) | 355 (25.5%) |
| Architecture & Engineering | 1,247 (93.4%) | 88 (6.6%) |
| Life, Physical & Social Science | 222 (62.7%) | 132 (37.3%) |
| Community & Social Service | 2,307 (42.1%) | 3,172 (57.9%) |
| Education, Arts & Media | 165 (31.2%) | 364 (68.8%) |
| Legal Services & Support | 154 (50.5%) | 151 (49.5%) |
| Education Instruction & Library | 1,002 (32.9%) | 2,040 (67.1%) |
| Arts, Media & Entertainment | 986 (61.5%) | 617 (38.5%) |
| Health Diagnosing & Treating | 1,247 (33.1%) | 2,516 (66.9%) |
| Health Technologists | 711 (28.7%) | 1,768 (71.3%) |
| Total (Category) | 10,887 (53.5%) | 9,479 (46.5%) |
| Total (Overall) | 27,181 (54.8%) | 22,429 (45.2%) |
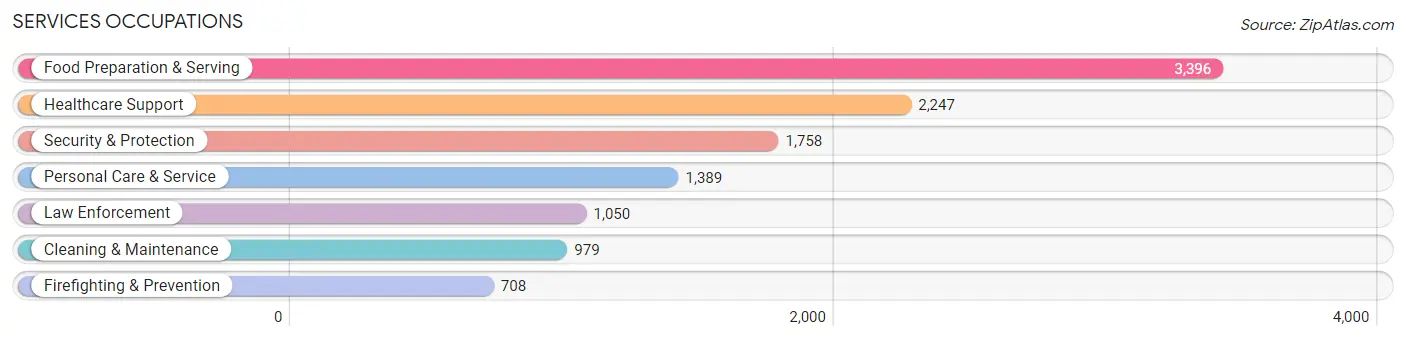
Services Occupations
The most common Services occupations in Murrieta are Food Preparation & Serving (3,396 | 6.9%), Healthcare Support (2,247 | 4.5%), Security & Protection (1,758 | 3.5%), Personal Care & Service (1,389 | 2.8%), and Law Enforcement (1,050 | 2.1%).
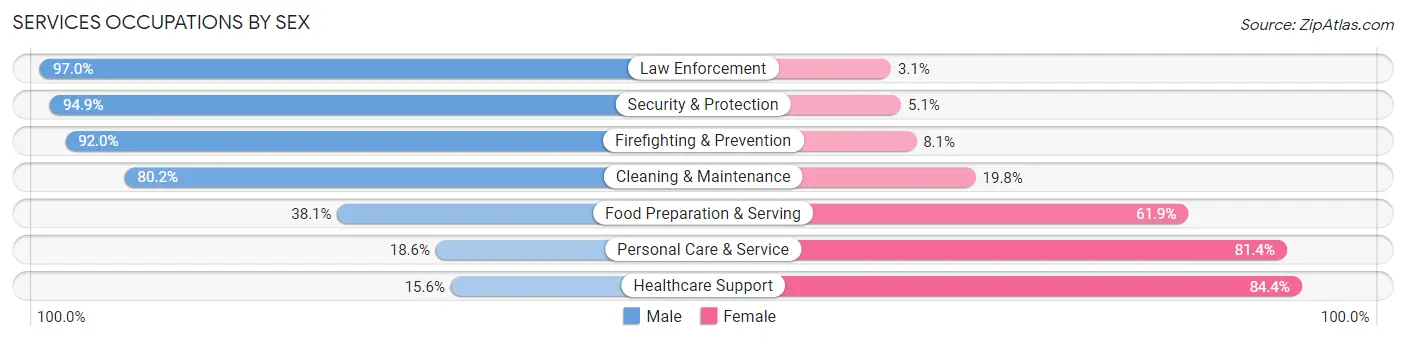
Services Occupations by Sex
Within the Services occupations in Murrieta, the most male-oriented occupations are Law Enforcement (97.0%), Security & Protection (94.9%), and Firefighting & Prevention (91.9%), while the most female-oriented occupations are Healthcare Support (84.4%), Personal Care & Service (81.4%), and Food Preparation & Serving (61.9%).
| Occupation | Male | Female |
| Healthcare Support | 351 (15.6%) | 1,896 (84.4%) |
| Security & Protection | 1,669 (94.9%) | 89 (5.1%) |
| Firefighting & Prevention | 651 (91.9%) | 57 (8.1%) |
| Law Enforcement | 1,018 (97.0%) | 32 (3.0%) |
| Food Preparation & Serving | 1,293 (38.1%) | 2,103 (61.9%) |
| Cleaning & Maintenance | 785 (80.2%) | 194 (19.8%) |
| Personal Care & Service | 258 (18.6%) | 1,131 (81.4%) |
| Total (Category) | 4,356 (44.6%) | 5,413 (55.4%) |
| Total (Overall) | 27,181 (54.8%) | 22,429 (45.2%) |
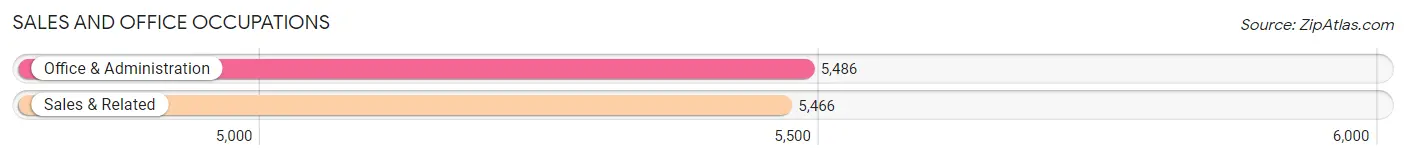
Sales and Office Occupations
The most common Sales and Office occupations in Murrieta are Office & Administration (5,486 | 11.1%), and Sales & Related (5,466 | 11.0%).
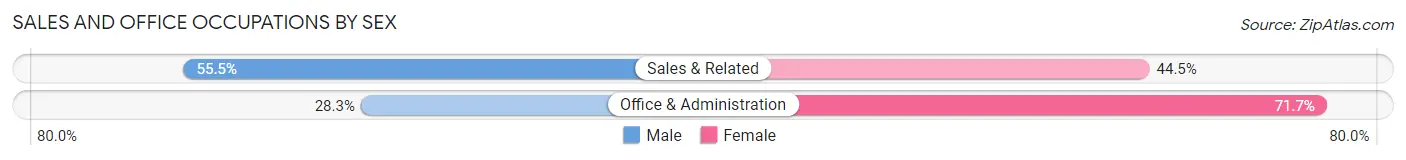
Sales and Office Occupations by Sex
| Occupation | Male | Female |
| Sales & Related | 3,035 (55.5%) | 2,431 (44.5%) |
| Office & Administration | 1,552 (28.3%) | 3,934 (71.7%) |
| Total (Category) | 4,587 (41.9%) | 6,365 (58.1%) |
| Total (Overall) | 27,181 (54.8%) | 22,429 (45.2%) |
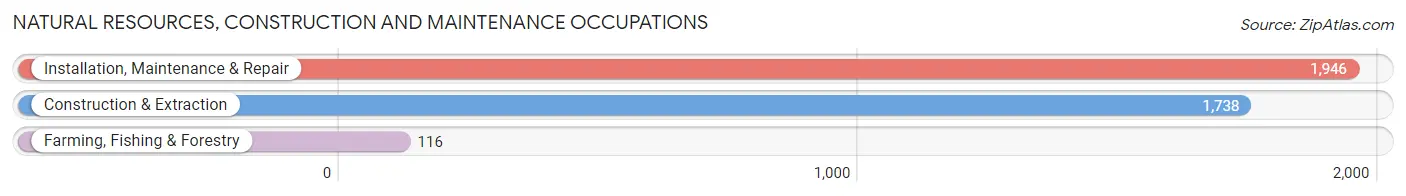
Natural Resources, Construction and Maintenance Occupations
The most common Natural Resources, Construction and Maintenance occupations in Murrieta are Installation, Maintenance & Repair (1,946 | 3.9%), Construction & Extraction (1,738 | 3.5%), and Farming, Fishing & Forestry (116 | 0.2%).
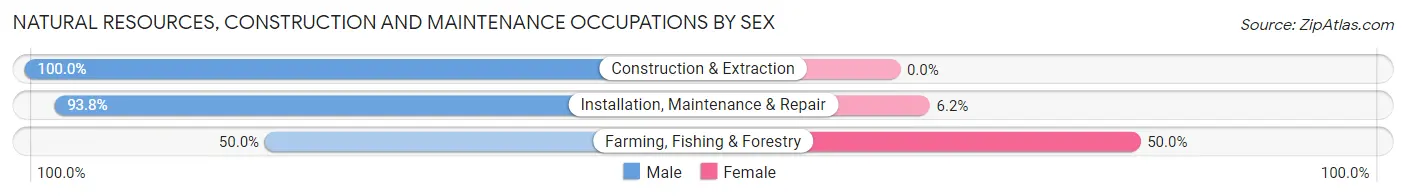
Natural Resources, Construction and Maintenance Occupations by Sex
| Occupation | Male | Female |
| Farming, Fishing & Forestry | 58 (50.0%) | 58 (50.0%) |
| Construction & Extraction | 1,738 (100.0%) | 0 (0.0%) |
| Installation, Maintenance & Repair | 1,826 (93.8%) | 120 (6.2%) |
| Total (Category) | 3,622 (95.3%) | 178 (4.7%) |
| Total (Overall) | 27,181 (54.8%) | 22,429 (45.2%) |
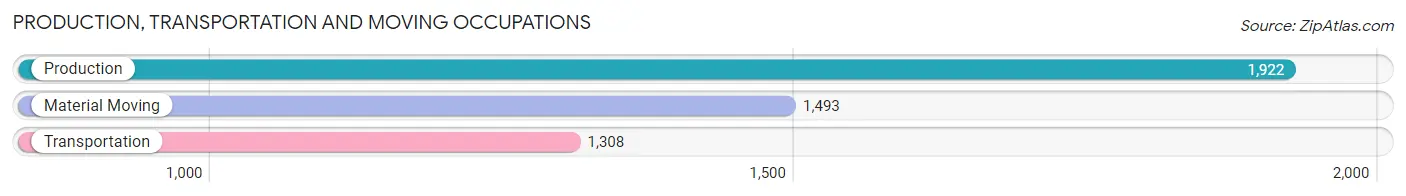
Production, Transportation and Moving Occupations
The most common Production, Transportation and Moving occupations in Murrieta are Production (1,922 | 3.9%), Material Moving (1,493 | 3.0%), and Transportation (1,308 | 2.6%).
Production, Transportation and Moving Occupations by Sex
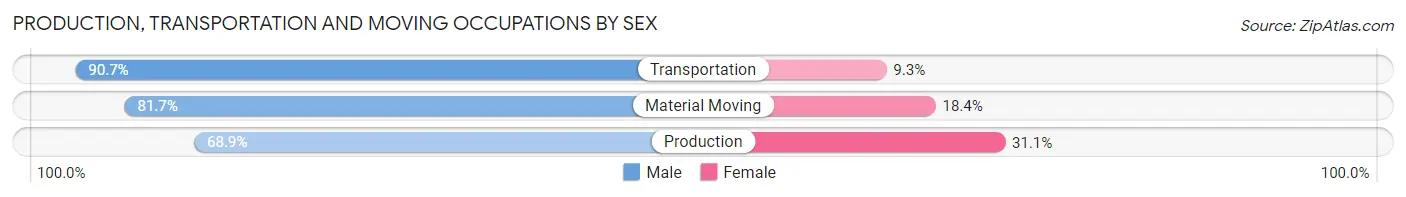
| Occupation | Male | Female |
| Production | 1,324 (68.9%) | 598 (31.1%) |
| Transportation | 1,186 (90.7%) | 122 (9.3%) |
| Material Moving | 1,219 (81.7%) | 274 (18.3%) |
| Total (Category) | 3,729 (78.9%) | 994 (21.0%) |
| Total (Overall) | 27,181 (54.8%) | 22,429 (45.2%) |
Employment Industries by Sex in Murrieta
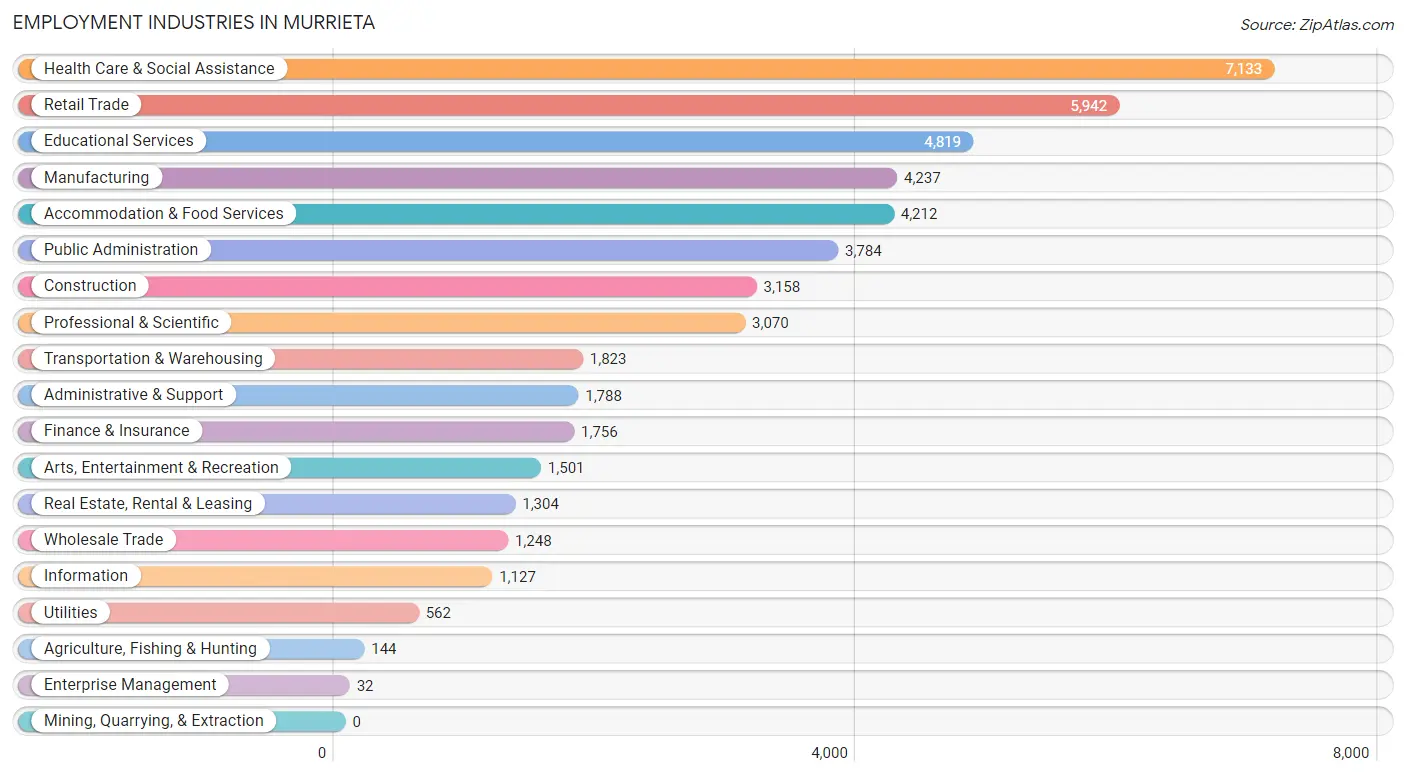
Employment Industries in Murrieta
The major employment industries in Murrieta include Health Care & Social Assistance (7,133 | 14.4%), Retail Trade (5,942 | 12.0%), Educational Services (4,819 | 9.7%), Manufacturing (4,237 | 8.5%), and Accommodation & Food Services (4,212 | 8.5%).
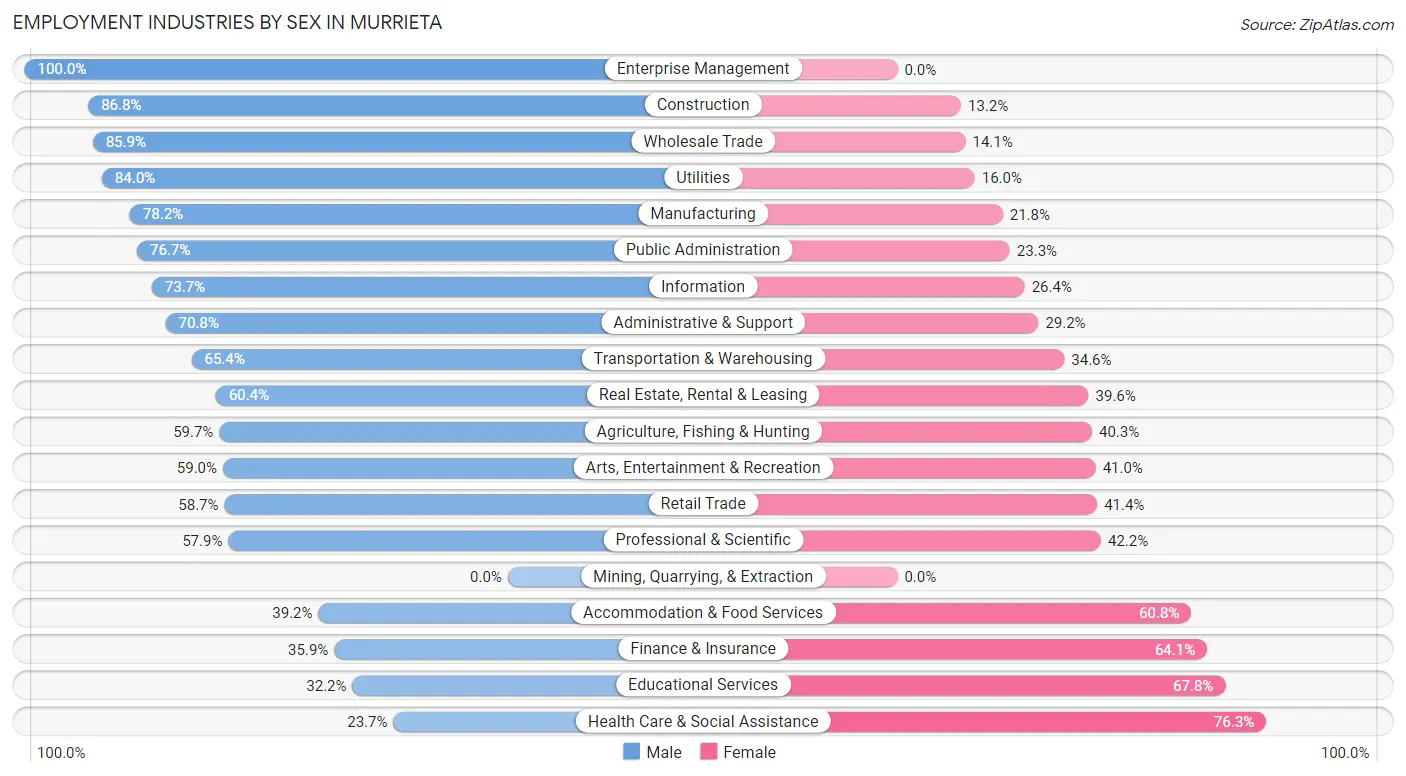
Employment Industries by Sex in Murrieta
The Murrieta industries that see more men than women are Enterprise Management (100.0%), Construction (86.8%), and Wholesale Trade (85.9%), whereas the industries that tend to have a higher number of women are Health Care & Social Assistance (76.3%), Educational Services (67.8%), and Finance & Insurance (64.1%).
| Industry | Male | Female |
| Agriculture, Fishing & Hunting | 86 (59.7%) | 58 (40.3%) |
| Mining, Quarrying, & Extraction | 0 (0.0%) | 0 (0.0%) |
| Construction | 2,742 (86.8%) | 416 (13.2%) |
| Manufacturing | 3,313 (78.2%) | 924 (21.8%) |
| Wholesale Trade | 1,072 (85.9%) | 176 (14.1%) |
| Retail Trade | 3,485 (58.7%) | 2,457 (41.3%) |
| Transportation & Warehousing | 1,193 (65.4%) | 630 (34.6%) |
| Utilities | 472 (84.0%) | 90 (16.0%) |
| Information | 830 (73.7%) | 297 (26.4%) |
| Finance & Insurance | 631 (35.9%) | 1,125 (64.1%) |
| Real Estate, Rental & Leasing | 788 (60.4%) | 516 (39.6%) |
| Professional & Scientific | 1,776 (57.9%) | 1,294 (42.1%) |
| Enterprise Management | 32 (100.0%) | 0 (0.0%) |
| Administrative & Support | 1,266 (70.8%) | 522 (29.2%) |
| Educational Services | 1,550 (32.2%) | 3,269 (67.8%) |
| Health Care & Social Assistance | 1,690 (23.7%) | 5,443 (76.3%) |
| Arts, Entertainment & Recreation | 885 (59.0%) | 616 (41.0%) |
| Accommodation & Food Services | 1,651 (39.2%) | 2,561 (60.8%) |
| Public Administration | 2,903 (76.7%) | 881 (23.3%) |
| Total | 27,181 (54.8%) | 22,429 (45.2%) |
Education in Murrieta
School Enrollment in Murrieta
The most common levels of schooling among the 33,563 students in Murrieta are high school (8,157 | 24.3%), college / undergraduate (7,440 | 22.2%), and middle school (6,739 | 20.1%).
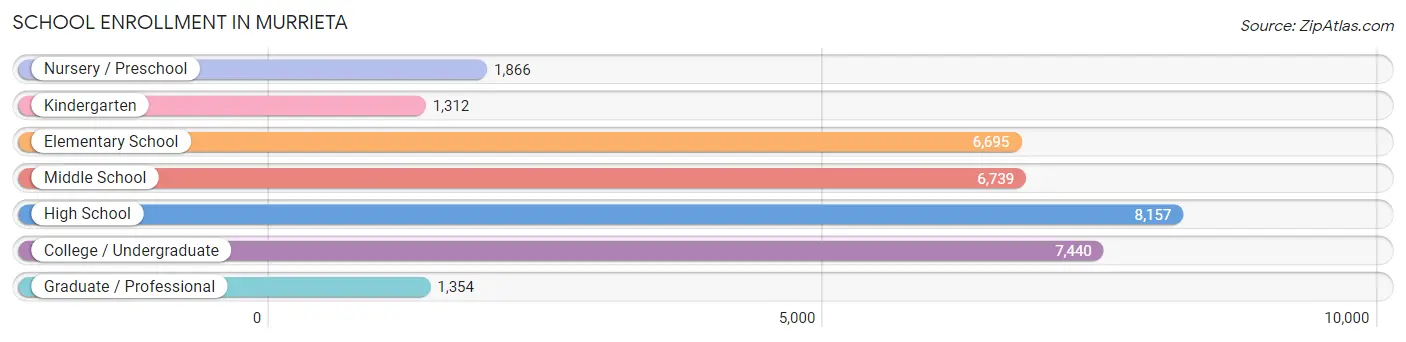
| School Level | # Students | % Students |
| Nursery / Preschool | 1,866 | 5.6% |
| Kindergarten | 1,312 | 3.9% |
| Elementary School | 6,695 | 20.0% |
| Middle School | 6,739 | 20.1% |
| High School | 8,157 | 24.3% |
| College / Undergraduate | 7,440 | 22.2% |
| Graduate / Professional | 1,354 | 4.0% |
| Total | 33,563 | 100.0% |
School Enrollment by Age by Funding Source in Murrieta
Out of a total of 33,563 students who are enrolled in schools in Murrieta, 4,699 (14.0%) attend a private institution, while the remaining 28,864 (86.0%) are enrolled in public schools. The age group of 3 to 4 year olds has the highest likelihood of being enrolled in private schools, with 649 (49.5% in the age bracket) enrolled. Conversely, the age group of 10 to 14 year olds has the lowest likelihood of being enrolled in a private school, with 8,091 (96.6% in the age bracket) attending a public institution.
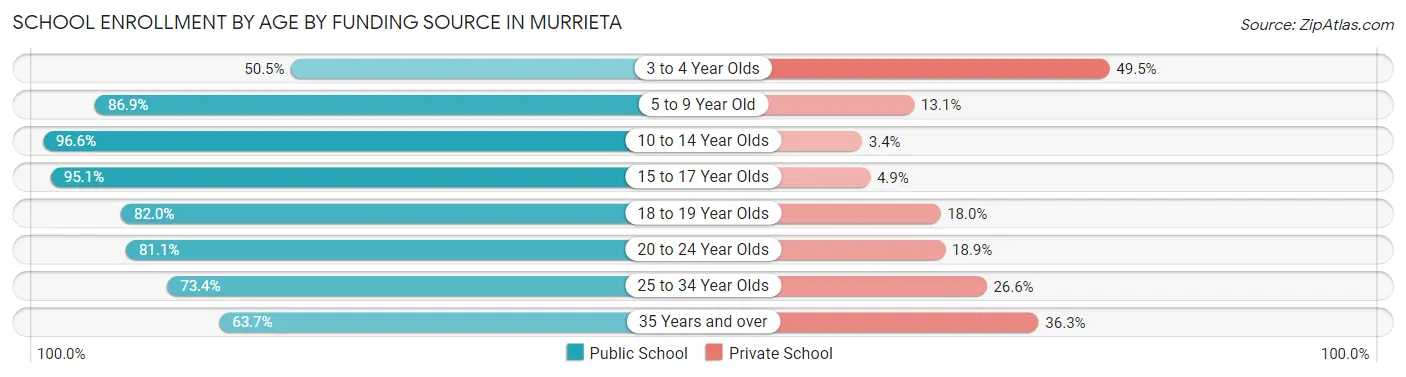
| Age Bracket | Public School | Private School |
| 3 to 4 Year Olds | 662 (50.5%) | 649 (49.5%) |
| 5 to 9 Year Old | 6,816 (86.9%) | 1,030 (13.1%) |
| 10 to 14 Year Olds | 8,091 (96.6%) | 284 (3.4%) |
| 15 to 17 Year Olds | 5,562 (95.1%) | 286 (4.9%) |
| 18 to 19 Year Olds | 2,108 (82.0%) | 462 (18.0%) |
| 20 to 24 Year Olds | 2,507 (81.1%) | 584 (18.9%) |
| 25 to 34 Year Olds | 1,745 (73.4%) | 632 (26.6%) |
| 35 Years and over | 1,367 (63.7%) | 778 (36.3%) |
| Total | 28,864 (86.0%) | 4,699 (14.0%) |
Educational Attainment by Field of Study in Murrieta
Business (4,772 | 21.3%), science & technology (2,765 | 12.4%), social sciences (1,889 | 8.5%), education (1,631 | 7.3%), and arts & humanities (1,610 | 7.2%) are the most common fields of study among 22,364 individuals in Murrieta who have obtained a bachelor's degree or higher.
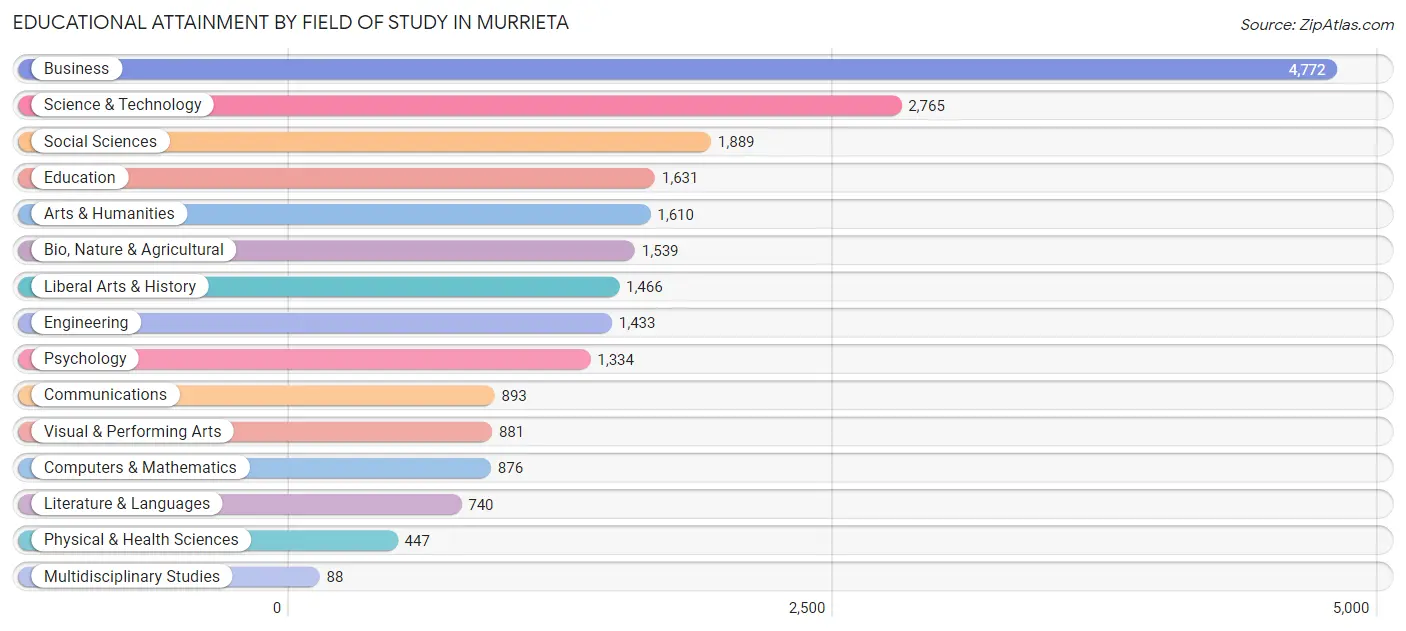
| Field of Study | # Graduates | % Graduates |
| Computers & Mathematics | 876 | 3.9% |
| Bio, Nature & Agricultural | 1,539 | 6.9% |
| Physical & Health Sciences | 447 | 2.0% |
| Psychology | 1,334 | 6.0% |
| Social Sciences | 1,889 | 8.5% |
| Engineering | 1,433 | 6.4% |
| Multidisciplinary Studies | 88 | 0.4% |
| Science & Technology | 2,765 | 12.4% |
| Business | 4,772 | 21.3% |
| Education | 1,631 | 7.3% |
| Literature & Languages | 740 | 3.3% |
| Liberal Arts & History | 1,466 | 6.6% |
| Visual & Performing Arts | 881 | 3.9% |
| Communications | 893 | 4.0% |
| Arts & Humanities | 1,610 | 7.2% |
| Total | 22,364 | 100.0% |
Transportation & Commute in Murrieta
Vehicle Availability by Sex in Murrieta
The most prevalent vehicle ownership categories in Murrieta are males with 2 vehicles (9,680, accounting for 35.3%) and females with 2 vehicles (7,645, making up 44.9%).
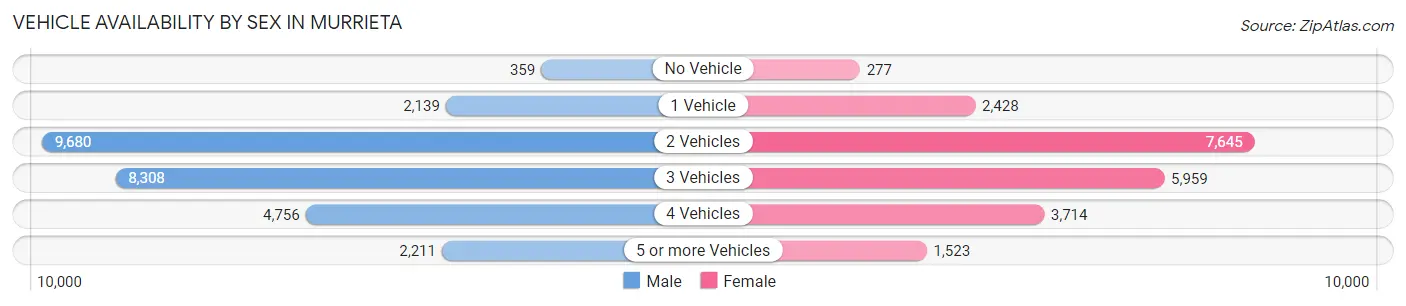
| Vehicles Available | Male | Female |
| No Vehicle | 359 (1.3%) | 277 (1.3%) |
| 1 Vehicle | 2,139 (7.8%) | 2,428 (11.3%) |
| 2 Vehicles | 9,680 (35.3%) | 7,645 (35.5%) |
| 3 Vehicles | 8,308 (30.3%) | 5,959 (27.7%) |
| 4 Vehicles | 4,756 (17.3%) | 3,714 (17.2%) |
| 5 or more Vehicles | 2,211 (8.1%) | 1,523 (7.1%) |
| Total | 27,453 (100.0%) | 21,546 (100.0%) |
Commute Time in Murrieta
The most frequently occuring commute durations in Murrieta are 60 to 89 minutes (7,023 commuters, 16.5%), 15 to 19 minutes (6,753 commuters, 15.8%), and 10 to 14 minutes (6,265 commuters, 14.7%).
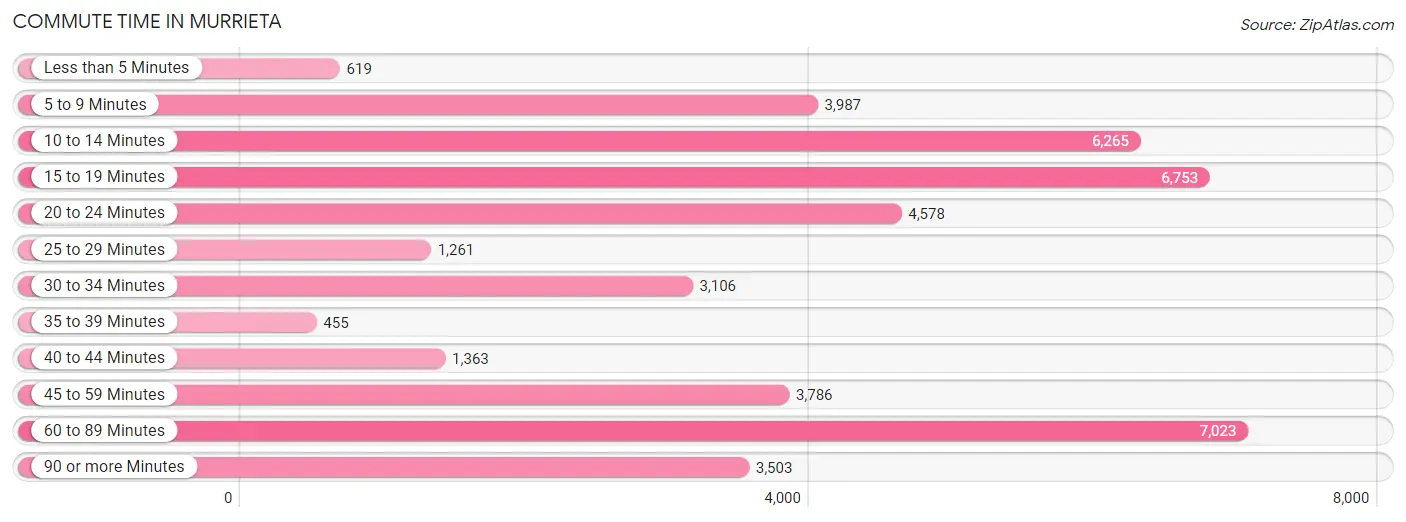
| Commute Time | # Commuters | % Commuters |
| Less than 5 Minutes | 619 | 1.5% |
| 5 to 9 Minutes | 3,987 | 9.3% |
| 10 to 14 Minutes | 6,265 | 14.7% |
| 15 to 19 Minutes | 6,753 | 15.8% |
| 20 to 24 Minutes | 4,578 | 10.7% |
| 25 to 29 Minutes | 1,261 | 2.9% |
| 30 to 34 Minutes | 3,106 | 7.3% |
| 35 to 39 Minutes | 455 | 1.1% |
| 40 to 44 Minutes | 1,363 | 3.2% |
| 45 to 59 Minutes | 3,786 | 8.9% |
| 60 to 89 Minutes | 7,023 | 16.5% |
| 90 or more Minutes | 3,503 | 8.2% |
Commute Time by Sex in Murrieta
The most common commute times in Murrieta are 60 to 89 minutes (5,009 commuters, 21.0%) for males and 15 to 19 minutes (3,852 commuters, 20.5%) for females.
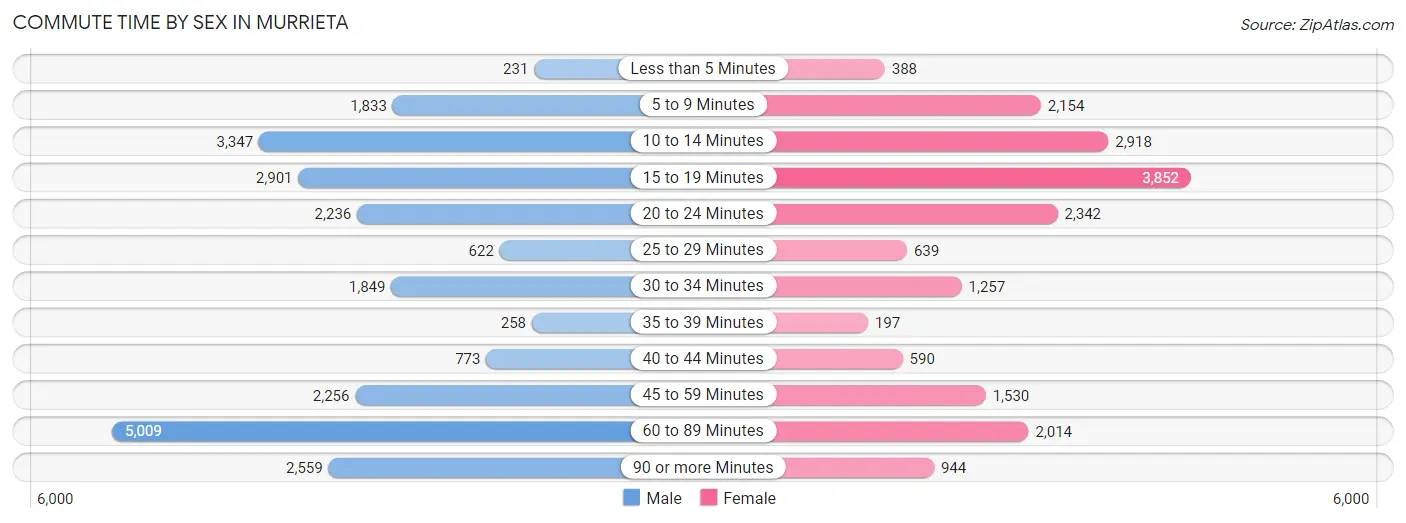
| Commute Time | Male | Female |
| Less than 5 Minutes | 231 (1.0%) | 388 (2.1%) |
| 5 to 9 Minutes | 1,833 (7.7%) | 2,154 (11.4%) |
| 10 to 14 Minutes | 3,347 (14.0%) | 2,918 (15.5%) |
| 15 to 19 Minutes | 2,901 (12.1%) | 3,852 (20.5%) |
| 20 to 24 Minutes | 2,236 (9.4%) | 2,342 (12.4%) |
| 25 to 29 Minutes | 622 (2.6%) | 639 (3.4%) |
| 30 to 34 Minutes | 1,849 (7.7%) | 1,257 (6.7%) |
| 35 to 39 Minutes | 258 (1.1%) | 197 (1.1%) |
| 40 to 44 Minutes | 773 (3.2%) | 590 (3.1%) |
| 45 to 59 Minutes | 2,256 (9.5%) | 1,530 (8.1%) |
| 60 to 89 Minutes | 5,009 (21.0%) | 2,014 (10.7%) |
| 90 or more Minutes | 2,559 (10.7%) | 944 (5.0%) |
Time of Departure to Work by Sex in Murrieta
The most frequent times of departure to work in Murrieta are 12:00 AM to 4:59 AM (3,724, 15.6%) for males and 7:00 AM to 7:29 AM (2,381, 12.7%) for females.
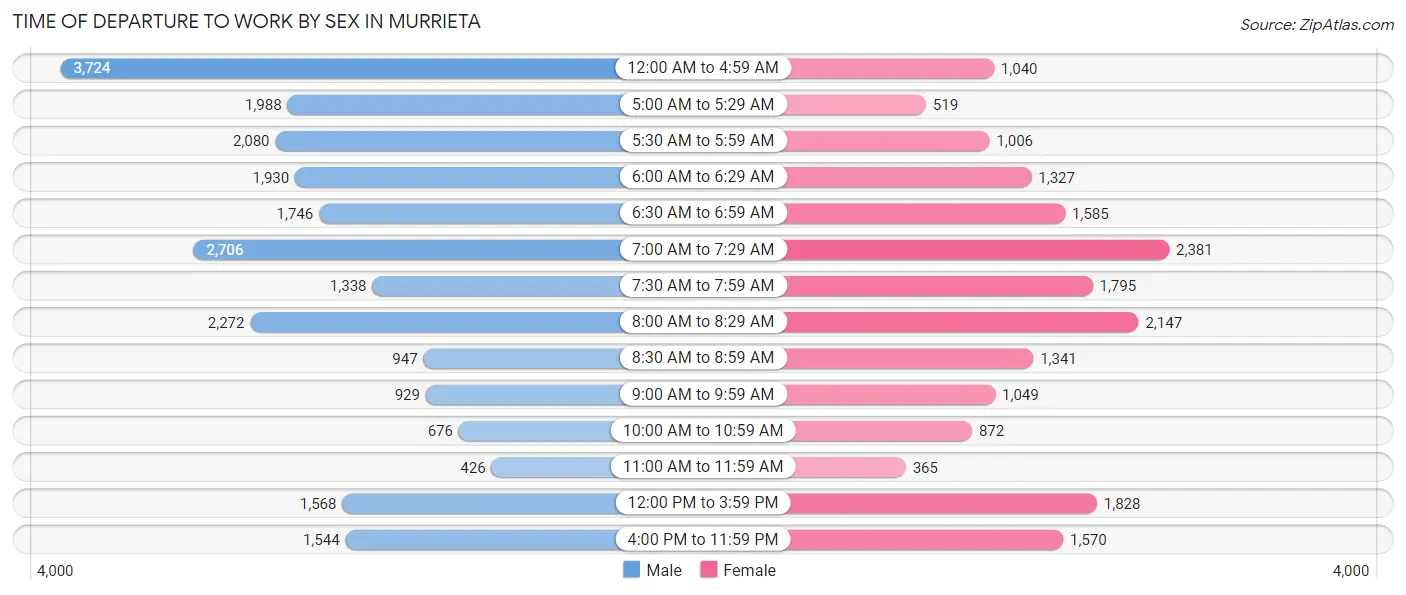
| Time of Departure | Male | Female |
| 12:00 AM to 4:59 AM | 3,724 (15.6%) | 1,040 (5.5%) |
| 5:00 AM to 5:29 AM | 1,988 (8.3%) | 519 (2.8%) |
| 5:30 AM to 5:59 AM | 2,080 (8.7%) | 1,006 (5.3%) |
| 6:00 AM to 6:29 AM | 1,930 (8.1%) | 1,327 (7.0%) |
| 6:30 AM to 6:59 AM | 1,746 (7.3%) | 1,585 (8.4%) |
| 7:00 AM to 7:29 AM | 2,706 (11.3%) | 2,381 (12.7%) |
| 7:30 AM to 7:59 AM | 1,338 (5.6%) | 1,795 (9.5%) |
| 8:00 AM to 8:29 AM | 2,272 (9.5%) | 2,147 (11.4%) |
| 8:30 AM to 8:59 AM | 947 (4.0%) | 1,341 (7.1%) |
| 9:00 AM to 9:59 AM | 929 (3.9%) | 1,049 (5.6%) |
| 10:00 AM to 10:59 AM | 676 (2.8%) | 872 (4.6%) |
| 11:00 AM to 11:59 AM | 426 (1.8%) | 365 (1.9%) |
| 12:00 PM to 3:59 PM | 1,568 (6.6%) | 1,828 (9.7%) |
| 4:00 PM to 11:59 PM | 1,544 (6.5%) | 1,570 (8.3%) |
| Total | 23,874 (100.0%) | 18,825 (100.0%) |
Housing Occupancy in Murrieta
Occupancy by Ownership in Murrieta
Of the total 34,482 dwellings in Murrieta, owner-occupied units account for 23,284 (67.5%), while renter-occupied units make up 11,198 (32.5%).
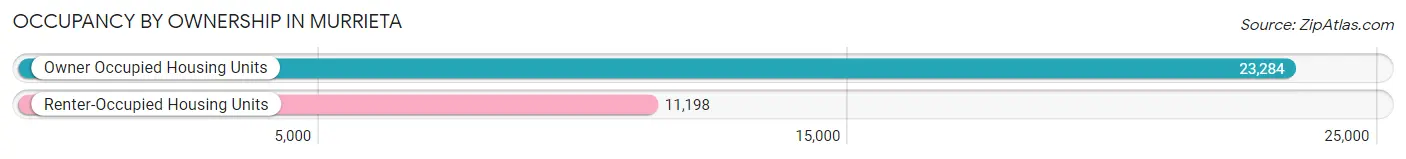
| Occupancy | # Housing Units | % Housing Units |
| Owner Occupied Housing Units | 23,284 | 67.5% |
| Renter-Occupied Housing Units | 11,198 | 32.5% |
| Total Occupied Housing Units | 34,482 | 100.0% |
Occupancy by Household Size in Murrieta
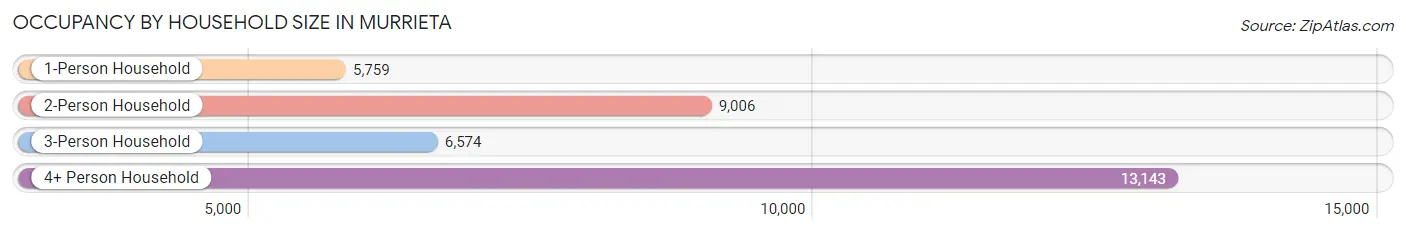
| Household Size | # Housing Units | % Housing Units |
| 1-Person Household | 5,759 | 16.7% |
| 2-Person Household | 9,006 | 26.1% |
| 3-Person Household | 6,574 | 19.1% |
| 4+ Person Household | 13,143 | 38.1% |
| Total Housing Units | 34,482 | 100.0% |
Occupancy by Ownership by Household Size in Murrieta
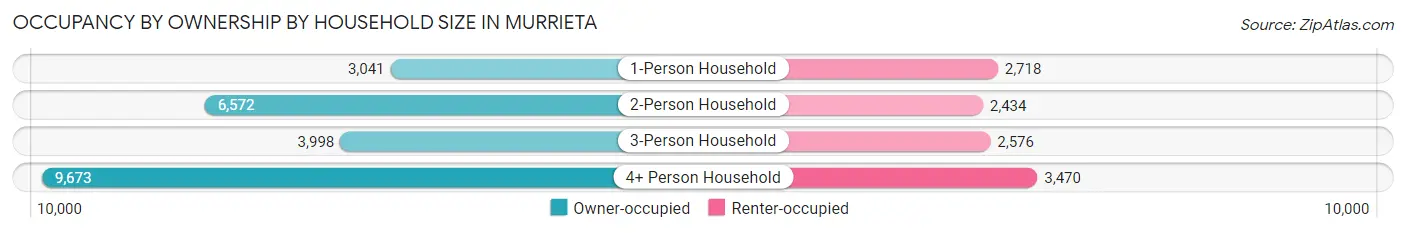
| Household Size | Owner-occupied | Renter-occupied |
| 1-Person Household | 3,041 (52.8%) | 2,718 (47.2%) |
| 2-Person Household | 6,572 (73.0%) | 2,434 (27.0%) |
| 3-Person Household | 3,998 (60.8%) | 2,576 (39.2%) |
| 4+ Person Household | 9,673 (73.6%) | 3,470 (26.4%) |
| Total Housing Units | 23,284 (67.5%) | 11,198 (32.5%) |
Occupancy by Educational Attainment in Murrieta
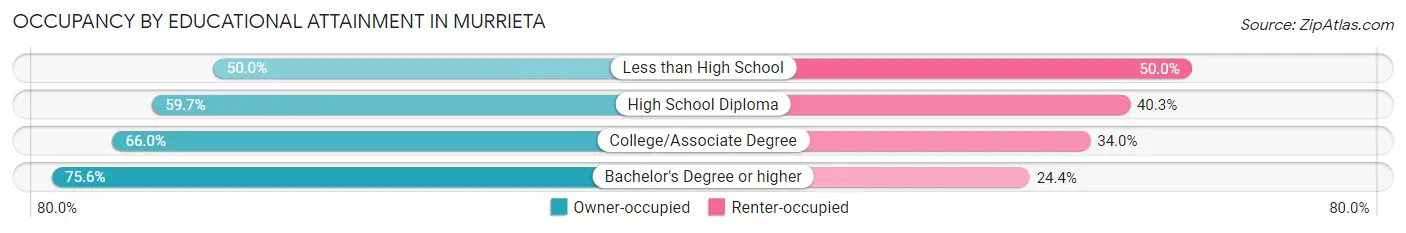
| Household Size | Owner-occupied | Renter-occupied |
| Less than High School | 1,011 (50.0%) | 1,012 (50.0%) |
| High School Diploma | 3,358 (59.7%) | 2,263 (40.3%) |
| College/Associate Degree | 9,523 (66.0%) | 4,898 (34.0%) |
| Bachelor's Degree or higher | 9,392 (75.6%) | 3,025 (24.4%) |
Occupancy by Age of Householder in Murrieta
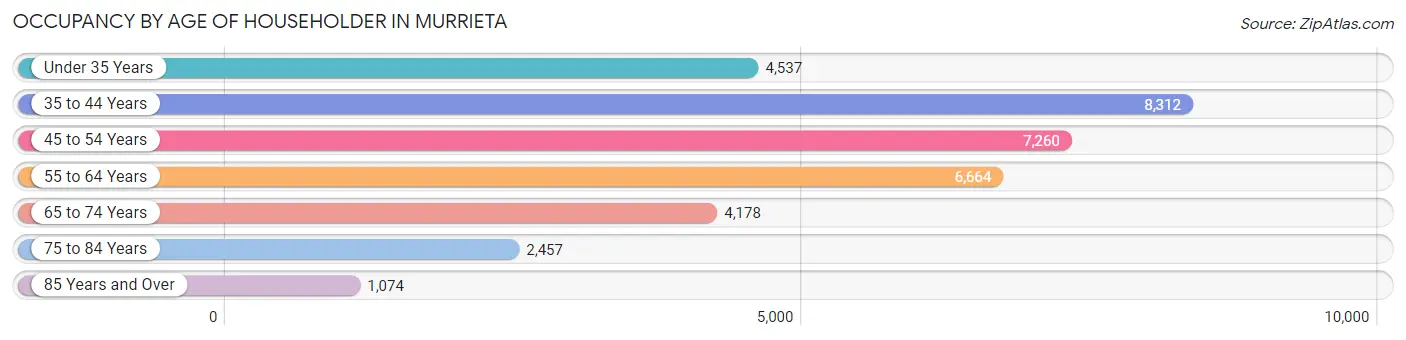
| Age Bracket | # Households | % Households |
| Under 35 Years | 4,537 | 13.2% |
| 35 to 44 Years | 8,312 | 24.1% |
| 45 to 54 Years | 7,260 | 21.0% |
| 55 to 64 Years | 6,664 | 19.3% |
| 65 to 74 Years | 4,178 | 12.1% |
| 75 to 84 Years | 2,457 | 7.1% |
| 85 Years and Over | 1,074 | 3.1% |
| Total | 34,482 | 100.0% |
Housing Finances in Murrieta
Median Income by Occupancy in Murrieta
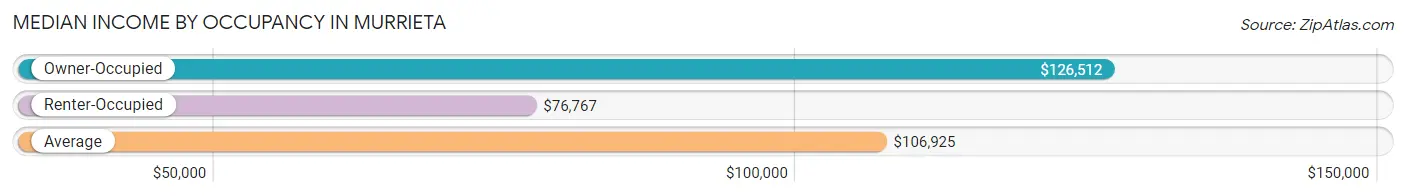
| Occupancy Type | # Households | Median Income |
| Owner-Occupied | 23,284 (67.5%) | $126,512 |
| Renter-Occupied | 11,198 (32.5%) | $76,767 |
| Average | 34,482 (100.0%) | $106,925 |
Occupancy by Householder Income Bracket in Murrieta
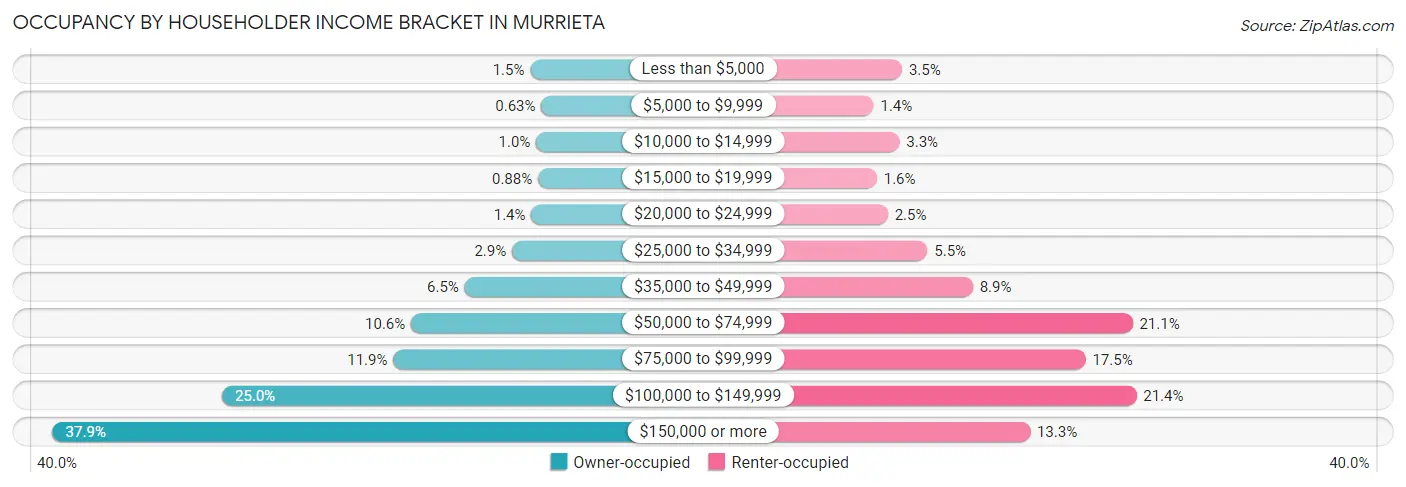
| Income Bracket | Owner-occupied | Renter-occupied |
| Less than $5,000 | 342 (1.5%) | 396 (3.5%) |
| $5,000 to $9,999 | 146 (0.6%) | 153 (1.4%) |
| $10,000 to $14,999 | 238 (1.0%) | 374 (3.3%) |
| $15,000 to $19,999 | 204 (0.9%) | 181 (1.6%) |
| $20,000 to $24,999 | 323 (1.4%) | 274 (2.5%) |
| $25,000 to $34,999 | 666 (2.9%) | 612 (5.5%) |
| $35,000 to $49,999 | 1,507 (6.5%) | 1,000 (8.9%) |
| $50,000 to $74,999 | 2,457 (10.5%) | 2,363 (21.1%) |
| $75,000 to $99,999 | 2,773 (11.9%) | 1,962 (17.5%) |
| $100,000 to $149,999 | 5,812 (25.0%) | 2,395 (21.4%) |
| $150,000 or more | 8,816 (37.9%) | 1,488 (13.3%) |
| Total | 23,284 (100.0%) | 11,198 (100.0%) |
Monthly Housing Cost Tiers in Murrieta
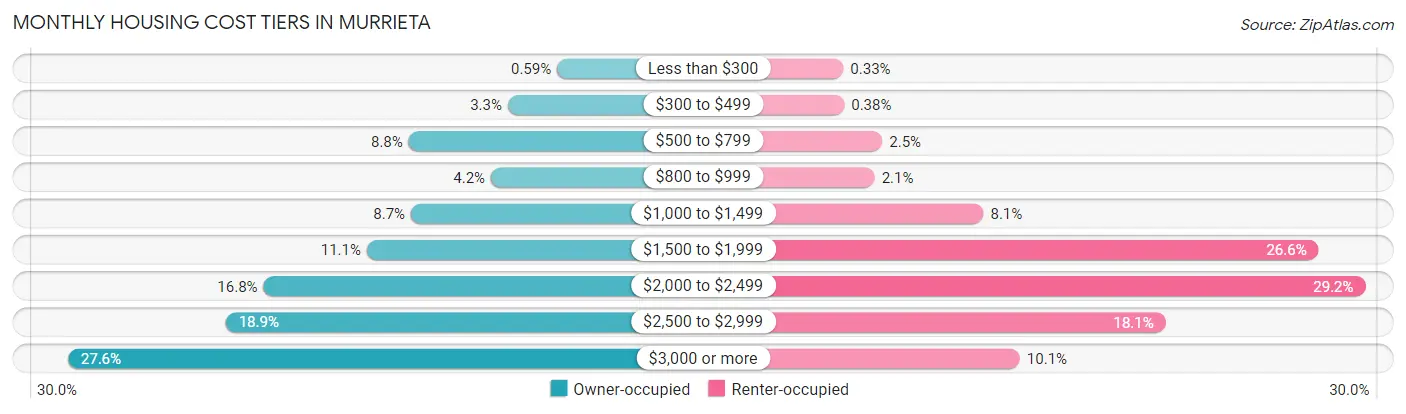
| Monthly Cost | Owner-occupied | Renter-occupied |
| Less than $300 | 138 (0.6%) | 37 (0.3%) |
| $300 to $499 | 771 (3.3%) | 43 (0.4%) |
| $500 to $799 | 2,047 (8.8%) | 278 (2.5%) |
| $800 to $999 | 987 (4.2%) | 231 (2.1%) |
| $1,000 to $1,499 | 2,017 (8.7%) | 904 (8.1%) |
| $1,500 to $1,999 | 2,584 (11.1%) | 2,975 (26.6%) |
| $2,000 to $2,499 | 3,913 (16.8%) | 3,265 (29.2%) |
| $2,500 to $2,999 | 4,399 (18.9%) | 2,029 (18.1%) |
| $3,000 or more | 6,428 (27.6%) | 1,129 (10.1%) |
| Total | 23,284 (100.0%) | 11,198 (100.0%) |
Physical Housing Characteristics in Murrieta
Housing Structures in Murrieta
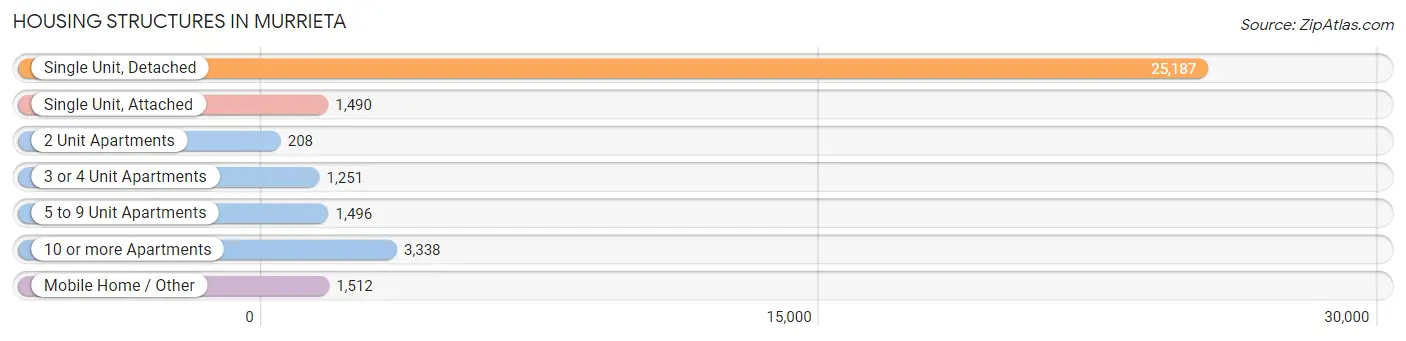
| Structure Type | # Housing Units | % Housing Units |
| Single Unit, Detached | 25,187 | 73.0% |
| Single Unit, Attached | 1,490 | 4.3% |
| 2 Unit Apartments | 208 | 0.6% |
| 3 or 4 Unit Apartments | 1,251 | 3.6% |
| 5 to 9 Unit Apartments | 1,496 | 4.3% |
| 10 or more Apartments | 3,338 | 9.7% |
| Mobile Home / Other | 1,512 | 4.4% |
| Total | 34,482 | 100.0% |
Housing Structures by Occupancy in Murrieta
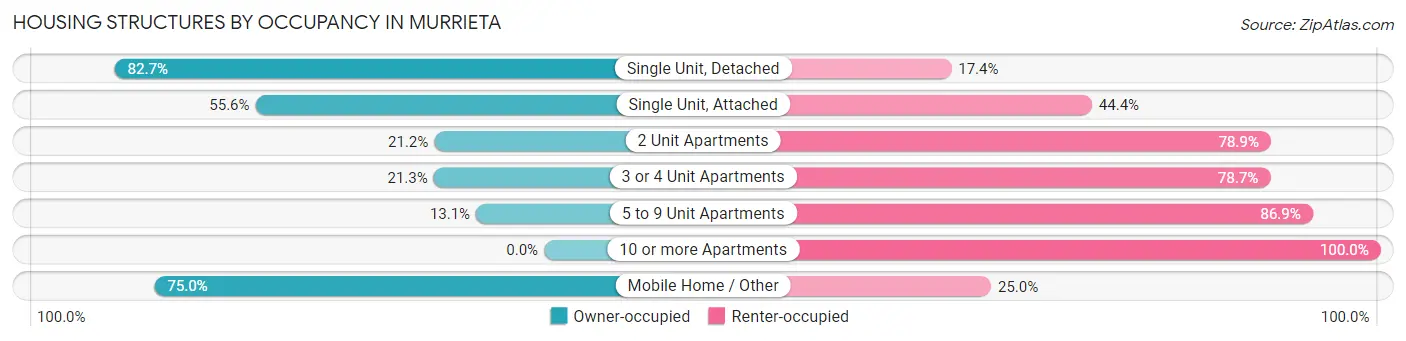
| Structure Type | Owner-occupied | Renter-occupied |
| Single Unit, Detached | 20,816 (82.7%) | 4,371 (17.3%) |
| Single Unit, Attached | 828 (55.6%) | 662 (44.4%) |
| 2 Unit Apartments | 44 (21.1%) | 164 (78.8%) |
| 3 or 4 Unit Apartments | 266 (21.3%) | 985 (78.7%) |
| 5 to 9 Unit Apartments | 196 (13.1%) | 1,300 (86.9%) |
| 10 or more Apartments | 0 (0.0%) | 3,338 (100.0%) |
| Mobile Home / Other | 1,134 (75.0%) | 378 (25.0%) |
| Total | 23,284 (67.5%) | 11,198 (32.5%) |
Housing Structures by Number of Rooms in Murrieta
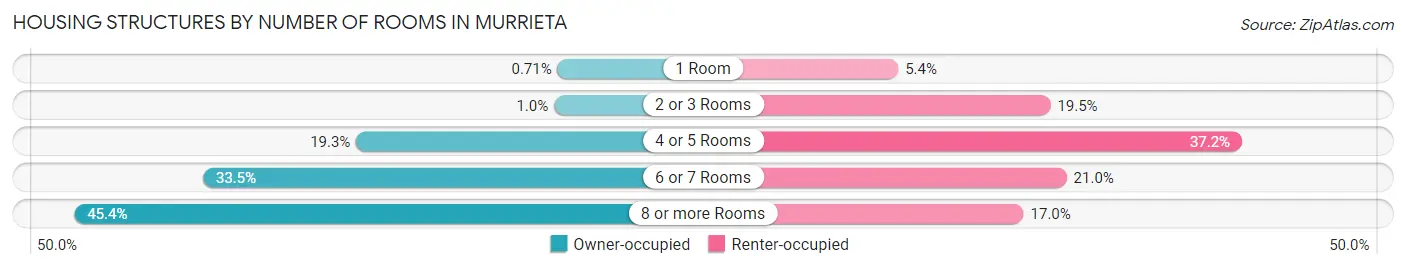
| Number of Rooms | Owner-occupied | Renter-occupied |
| 1 Room | 166 (0.7%) | 604 (5.4%) |
| 2 or 3 Rooms | 240 (1.0%) | 2,180 (19.5%) |
| 4 or 5 Rooms | 4,501 (19.3%) | 4,163 (37.2%) |
| 6 or 7 Rooms | 7,804 (33.5%) | 2,348 (21.0%) |
| 8 or more Rooms | 10,573 (45.4%) | 1,903 (17.0%) |
| Total | 23,284 (100.0%) | 11,198 (100.0%) |
Housing Structure by Heating Type in Murrieta
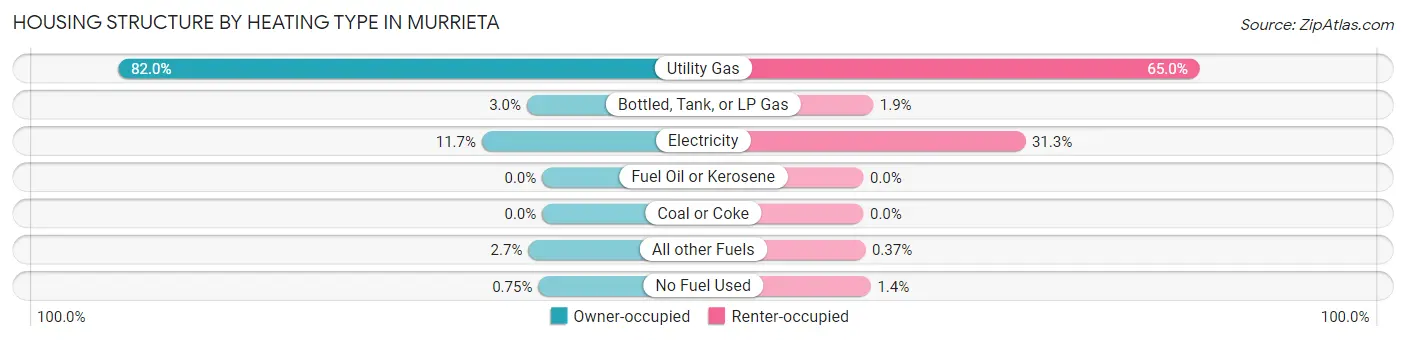
| Heating Type | Owner-occupied | Renter-occupied |
| Utility Gas | 19,082 (82.0%) | 7,281 (65.0%) |
| Bottled, Tank, or LP Gas | 688 (2.9%) | 212 (1.9%) |
| Electricity | 2,716 (11.7%) | 3,504 (31.3%) |
| Fuel Oil or Kerosene | 0 (0.0%) | 0 (0.0%) |
| Coal or Coke | 0 (0.0%) | 0 (0.0%) |
| All other Fuels | 623 (2.7%) | 41 (0.4%) |
| No Fuel Used | 175 (0.7%) | 160 (1.4%) |
| Total | 23,284 (100.0%) | 11,198 (100.0%) |
Household Vehicle Usage in Murrieta
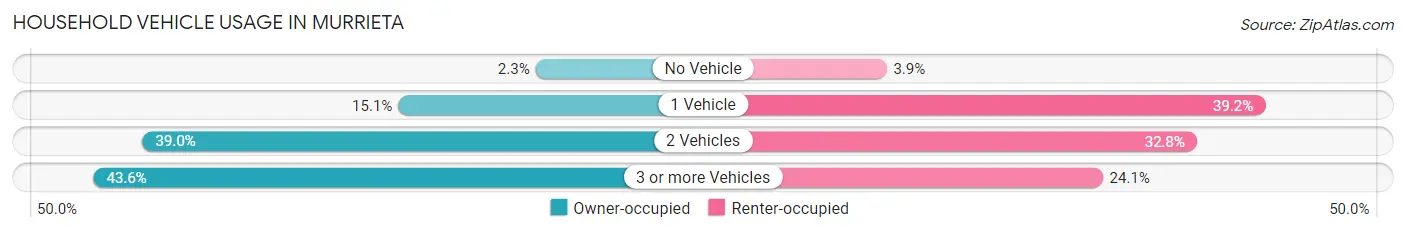
| Vehicles per Household | Owner-occupied | Renter-occupied |
| No Vehicle | 538 (2.3%) | 435 (3.9%) |
| 1 Vehicle | 3,522 (15.1%) | 4,392 (39.2%) |
| 2 Vehicles | 9,080 (39.0%) | 3,677 (32.8%) |
| 3 or more Vehicles | 10,144 (43.6%) | 2,694 (24.1%) |
| Total | 23,284 (100.0%) | 11,198 (100.0%) |
Real Estate & Mortgages in Murrieta
Real Estate and Mortgage Overview in Murrieta
| Characteristic | Without Mortgage | With Mortgage |
| Housing Units | 5,182 | 18,102 |
| Median Property Value | $490,200 | $584,400 |
| Median Household Income | $81,417 | $7,762 |
| Monthly Housing Costs | $758 | $6,400 |
| Real Estate Taxes | $4,428 | $325 |
Property Value by Mortgage Status in Murrieta
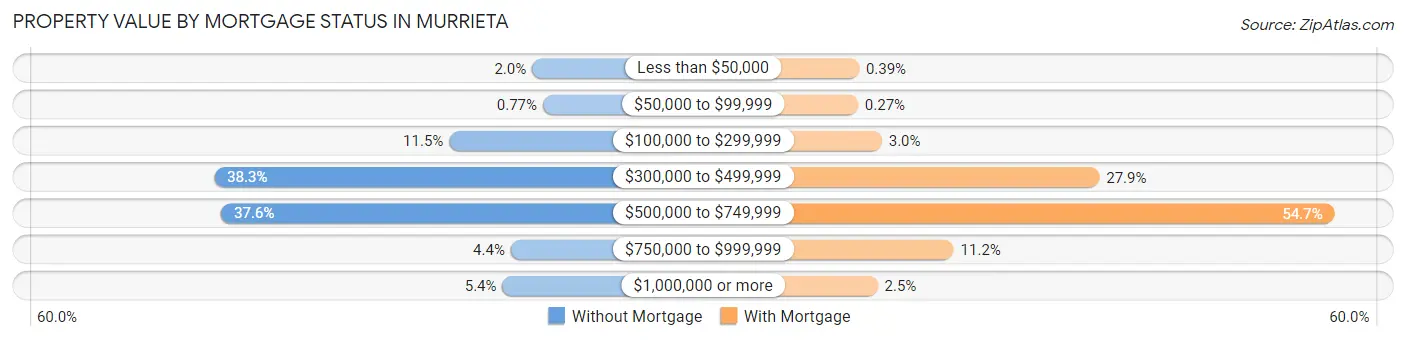
| Property Value | Without Mortgage | With Mortgage |
| Less than $50,000 | 104 (2.0%) | 71 (0.4%) |
| $50,000 to $99,999 | 40 (0.8%) | 48 (0.3%) |
| $100,000 to $299,999 | 595 (11.5%) | 543 (3.0%) |
| $300,000 to $499,999 | 1,987 (38.3%) | 5,044 (27.9%) |
| $500,000 to $749,999 | 1,946 (37.6%) | 9,909 (54.7%) |
| $750,000 to $999,999 | 230 (4.4%) | 2,030 (11.2%) |
| $1,000,000 or more | 280 (5.4%) | 457 (2.5%) |
| Total | 5,182 (100.0%) | 18,102 (100.0%) |
Household Income by Mortgage Status in Murrieta
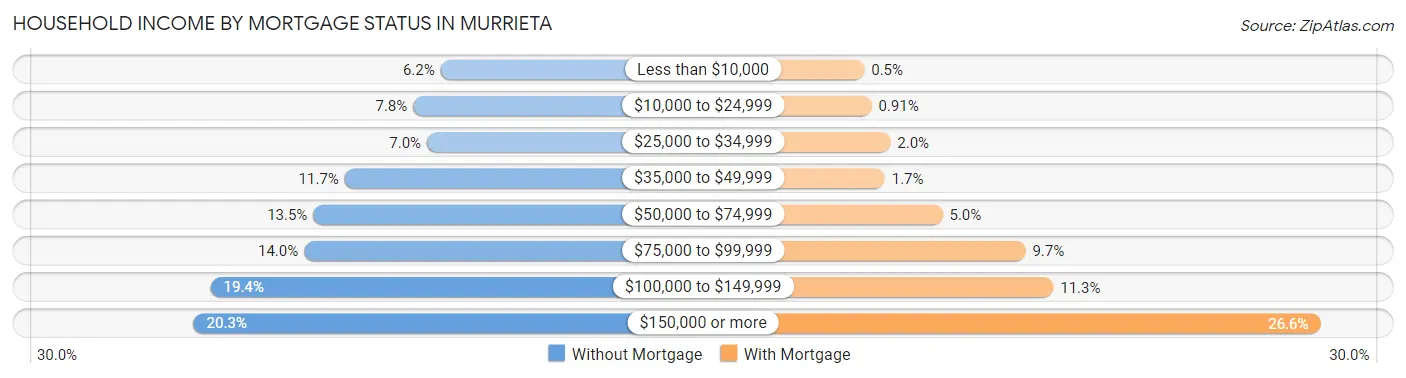
| Household Income | Without Mortgage | With Mortgage |
| Less than $10,000 | 323 (6.2%) | 90 (0.5%) |
| $10,000 to $24,999 | 404 (7.8%) | 165 (0.9%) |
| $25,000 to $34,999 | 363 (7.0%) | 361 (2.0%) |
| $35,000 to $49,999 | 607 (11.7%) | 303 (1.7%) |
| $50,000 to $74,999 | 700 (13.5%) | 900 (5.0%) |
| $75,000 to $99,999 | 727 (14.0%) | 1,757 (9.7%) |
| $100,000 to $149,999 | 1,004 (19.4%) | 2,046 (11.3%) |
| $150,000 or more | 1,054 (20.3%) | 4,808 (26.6%) |
| Total | 5,182 (100.0%) | 18,102 (100.0%) |
Property Value to Household Income Ratio in Murrieta
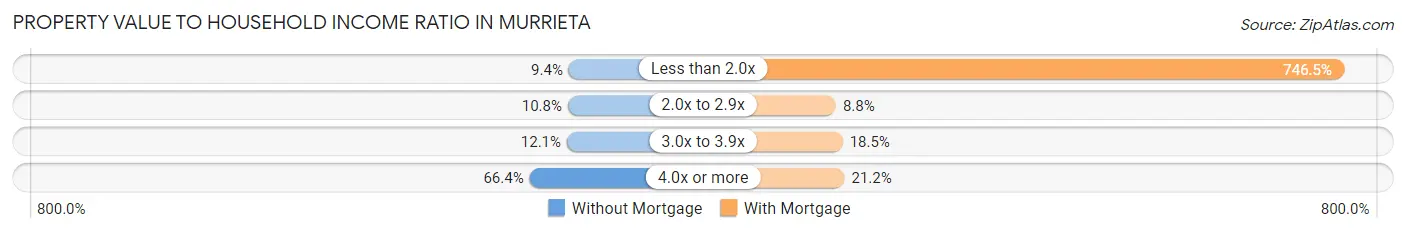
| Value-to-Income Ratio | Without Mortgage | With Mortgage |
| Less than 2.0x | 488 (9.4%) | 135,138 (746.5%) |
| 2.0x to 2.9x | 558 (10.8%) | 1,594 (8.8%) |
| 3.0x to 3.9x | 628 (12.1%) | 3,356 (18.5%) |
| 4.0x or more | 3,443 (66.4%) | 3,843 (21.2%) |
| Total | 5,182 (100.0%) | 18,102 (100.0%) |
Real Estate Taxes by Mortgage Status in Murrieta
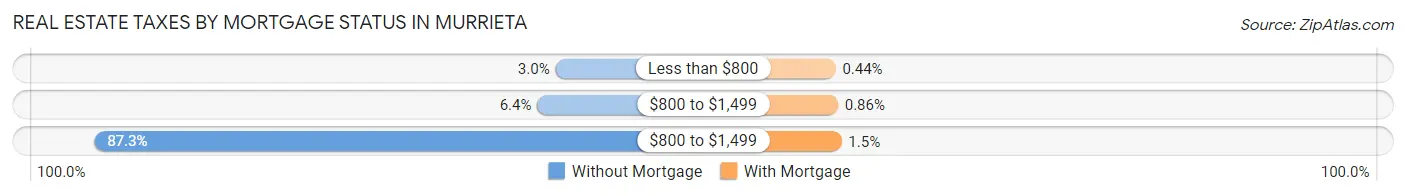
| Property Taxes | Without Mortgage | With Mortgage |
| Less than $800 | 157 (3.0%) | 79 (0.4%) |
| $800 to $1,499 | 329 (6.4%) | 155 (0.9%) |
| $800 to $1,499 | 4,523 (87.3%) | 277 (1.5%) |
| Total | 5,182 (100.0%) | 18,102 (100.0%) |
Health & Disability in Murrieta
Health Insurance Coverage by Age in Murrieta
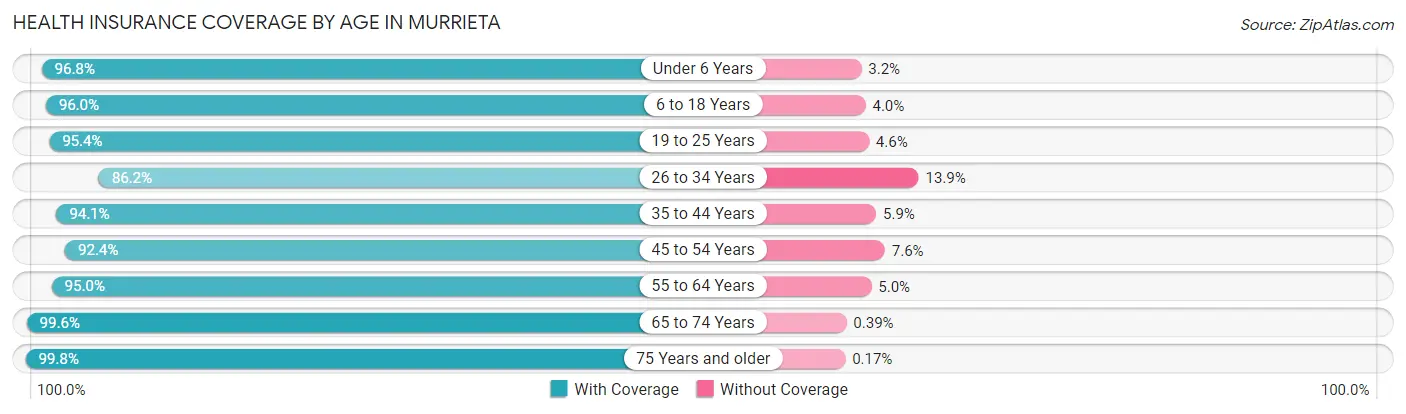
| Age Bracket | With Coverage | Without Coverage |
| Under 6 Years | 8,648 (96.8%) | 284 (3.2%) |
| 6 to 18 Years | 22,419 (96.0%) | 925 (4.0%) |
| 19 to 25 Years | 10,157 (95.4%) | 489 (4.6%) |
| 26 to 34 Years | 9,941 (86.2%) | 1,598 (13.9%) |
| 35 to 44 Years | 15,267 (94.1%) | 963 (5.9%) |
| 45 to 54 Years | 12,954 (92.4%) | 1,060 (7.6%) |
| 55 to 64 Years | 11,876 (95.0%) | 630 (5.0%) |
| 65 to 74 Years | 7,375 (99.6%) | 29 (0.4%) |
| 75 Years and older | 6,282 (99.8%) | 11 (0.2%) |
| Total | 104,919 (94.6%) | 5,989 (5.4%) |
Health Insurance Coverage by Citizenship Status in Murrieta
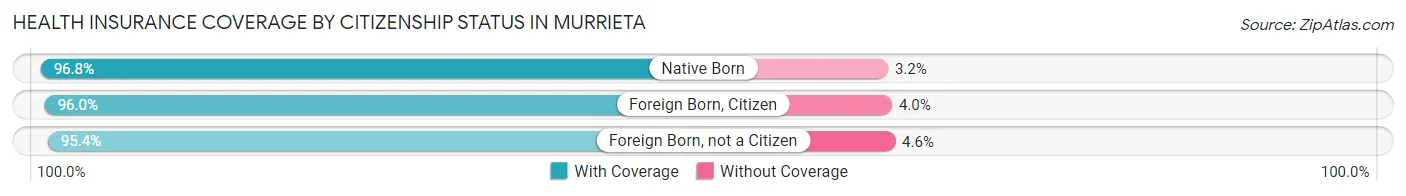
| Citizenship Status | With Coverage | Without Coverage |
| Native Born | 8,648 (96.8%) | 284 (3.2%) |
| Foreign Born, Citizen | 22,419 (96.0%) | 925 (4.0%) |
| Foreign Born, not a Citizen | 10,157 (95.4%) | 489 (4.6%) |
Health Insurance Coverage by Household Income in Murrieta
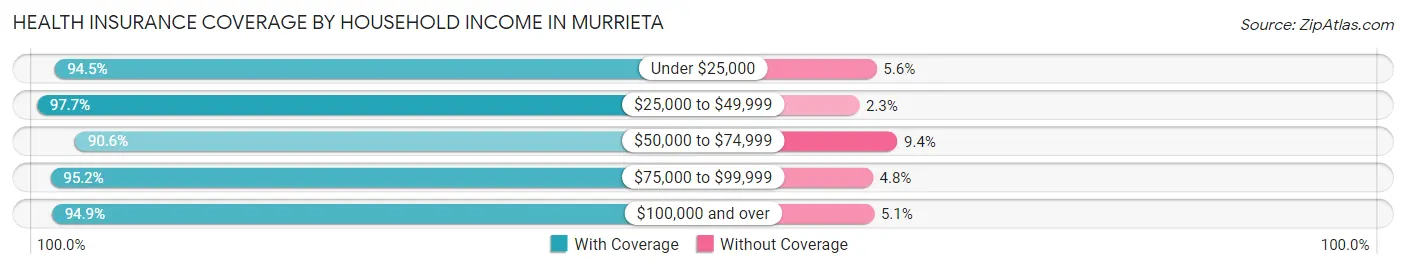
| Household Income | With Coverage | Without Coverage |
| Under $25,000 | 4,871 (94.5%) | 286 (5.6%) |
| $25,000 to $49,999 | 8,122 (97.7%) | 190 (2.3%) |
| $50,000 to $74,999 | 12,263 (90.6%) | 1,275 (9.4%) |
| $75,000 to $99,999 | 14,086 (95.2%) | 715 (4.8%) |
| $100,000 and over | 65,083 (94.9%) | 3,493 (5.1%) |
Public vs Private Health Insurance Coverage by Age in Murrieta
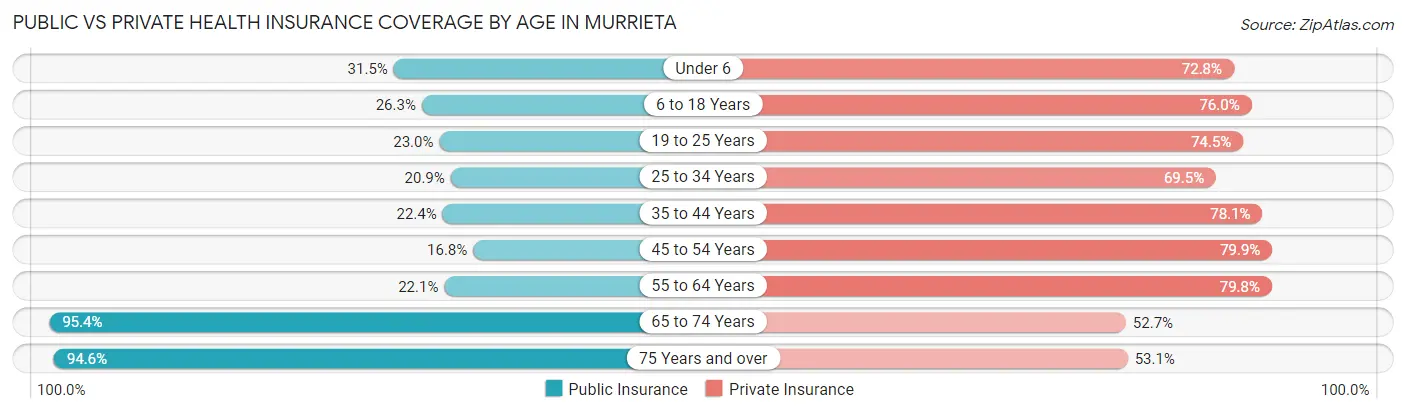
| Age Bracket | Public Insurance | Private Insurance |
| Under 6 | 2,814 (31.5%) | 6,500 (72.8%) |
| 6 to 18 Years | 6,138 (26.3%) | 17,750 (76.0%) |
| 19 to 25 Years | 2,452 (23.0%) | 7,931 (74.5%) |
| 25 to 34 Years | 2,415 (20.9%) | 8,014 (69.5%) |
| 35 to 44 Years | 3,638 (22.4%) | 12,670 (78.1%) |
| 45 to 54 Years | 2,347 (16.8%) | 11,195 (79.9%) |
| 55 to 64 Years | 2,765 (22.1%) | 9,980 (79.8%) |
| 65 to 74 Years | 7,066 (95.4%) | 3,904 (52.7%) |
| 75 Years and over | 5,951 (94.6%) | 3,340 (53.1%) |
| Total | 35,586 (32.1%) | 81,284 (73.3%) |
Disability Status by Sex by Age in Murrieta
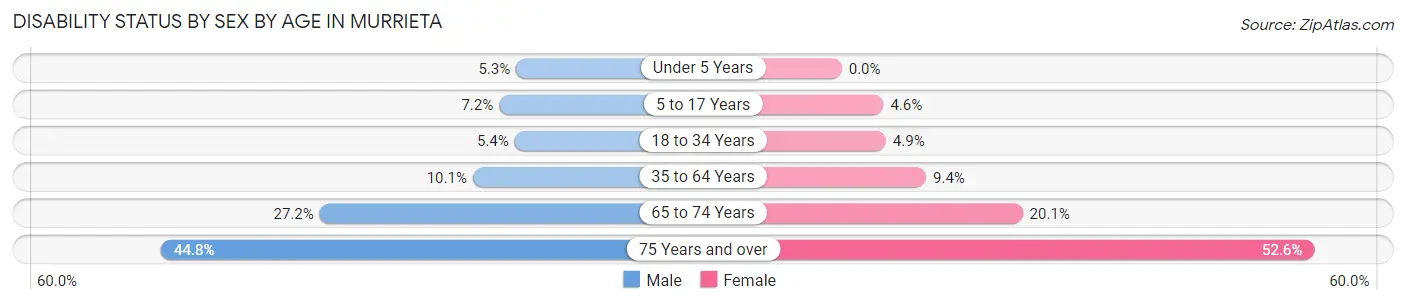
| Age Bracket | Male | Female |
| Under 5 Years | 190 (5.3%) | 0 (0.0%) |
| 5 to 17 Years | 830 (7.2%) | 524 (4.6%) |
| 18 to 34 Years | 662 (5.4%) | 584 (4.9%) |
| 35 to 64 Years | 2,088 (10.1%) | 2,071 (9.4%) |
| 65 to 74 Years | 917 (27.2%) | 811 (20.1%) |
| 75 Years and over | 1,132 (44.8%) | 1,981 (52.6%) |
Disability Class by Sex by Age in Murrieta
Disability Class: Hearing Difficulty
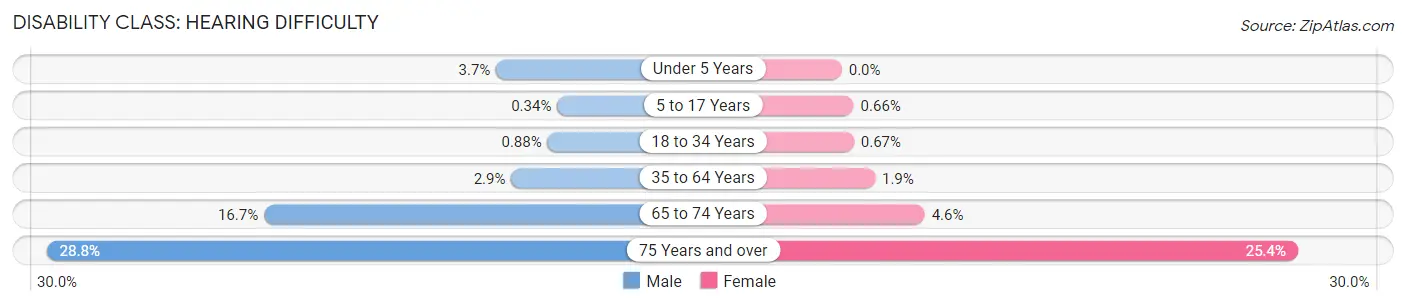
| Age Bracket | Male | Female |
| Under 5 Years | 135 (3.7%) | 0 (0.0%) |
| 5 to 17 Years | 39 (0.3%) | 74 (0.7%) |
| 18 to 34 Years | 107 (0.9%) | 80 (0.7%) |
| 35 to 64 Years | 600 (2.9%) | 408 (1.8%) |
| 65 to 74 Years | 563 (16.7%) | 186 (4.6%) |
| 75 Years and over | 727 (28.8%) | 956 (25.4%) |
Disability Class: Vision Difficulty
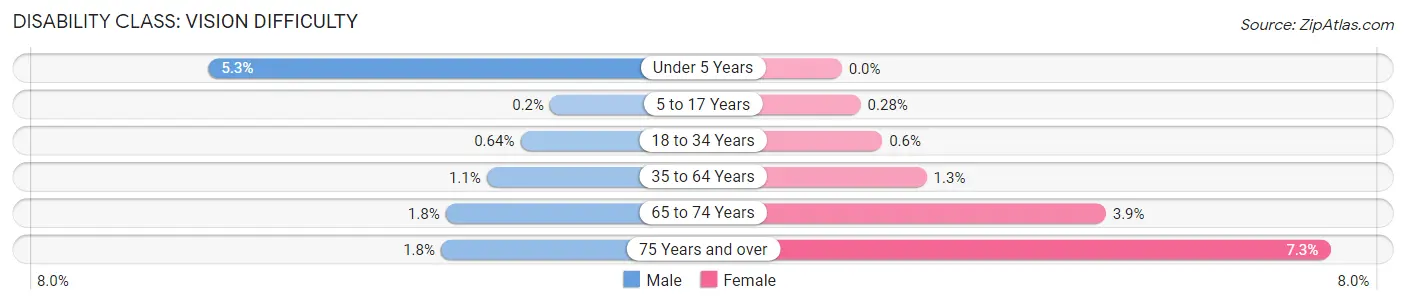
| Age Bracket | Male | Female |
| Under 5 Years | 190 (5.3%) | 0 (0.0%) |
| 5 to 17 Years | 23 (0.2%) | 32 (0.3%) |
| 18 to 34 Years | 78 (0.6%) | 71 (0.6%) |
| 35 to 64 Years | 235 (1.1%) | 277 (1.3%) |
| 65 to 74 Years | 59 (1.8%) | 158 (3.9%) |
| 75 Years and over | 46 (1.8%) | 273 (7.2%) |
Disability Class: Cognitive Difficulty
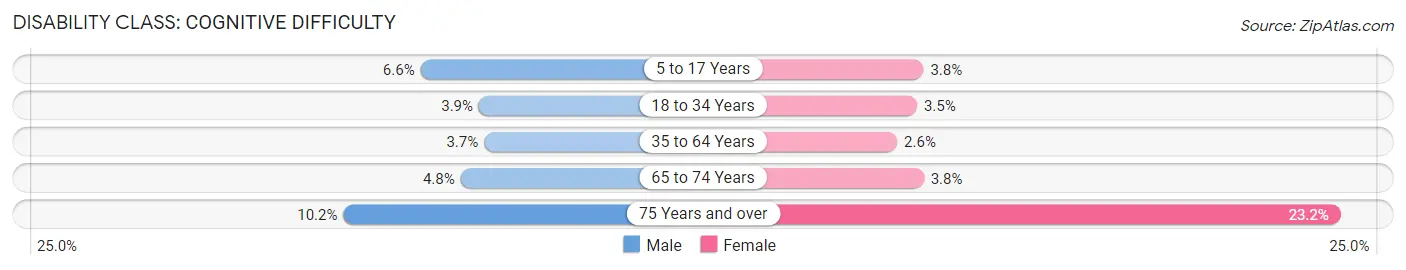
| Age Bracket | Male | Female |
| 5 to 17 Years | 768 (6.6%) | 428 (3.8%) |
| 18 to 34 Years | 478 (3.9%) | 415 (3.5%) |
| 35 to 64 Years | 762 (3.7%) | 567 (2.6%) |
| 65 to 74 Years | 161 (4.8%) | 153 (3.8%) |
| 75 Years and over | 258 (10.2%) | 872 (23.2%) |
Disability Class: Ambulatory Difficulty
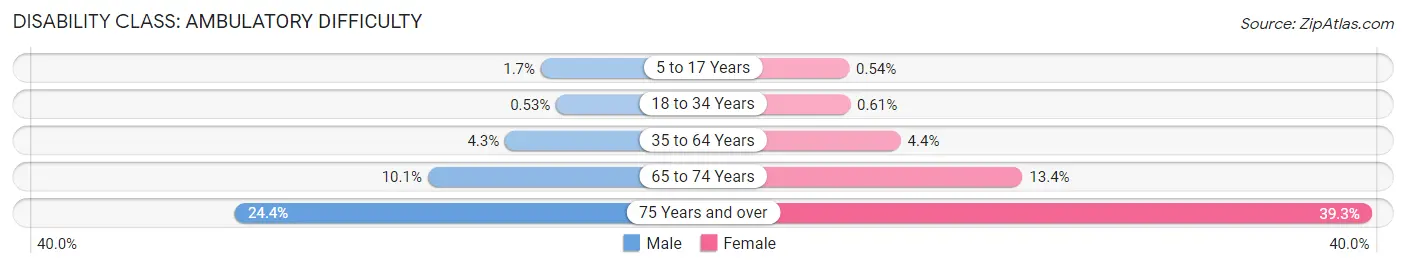
| Age Bracket | Male | Female |
| 5 to 17 Years | 193 (1.7%) | 61 (0.5%) |
| 18 to 34 Years | 65 (0.5%) | 72 (0.6%) |
| 35 to 64 Years | 897 (4.3%) | 964 (4.4%) |
| 65 to 74 Years | 340 (10.1%) | 540 (13.4%) |
| 75 Years and over | 616 (24.4%) | 1,481 (39.3%) |
Disability Class: Self-Care Difficulty
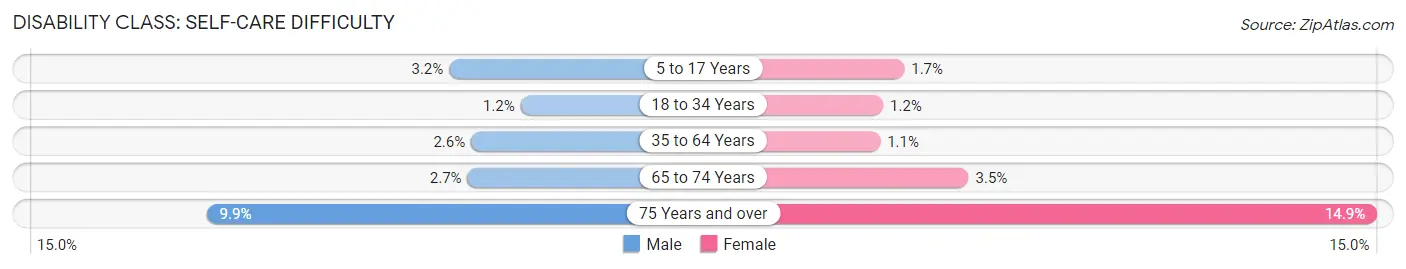
| Age Bracket | Male | Female |
| 5 to 17 Years | 368 (3.2%) | 196 (1.7%) |
| 18 to 34 Years | 145 (1.2%) | 137 (1.1%) |
| 35 to 64 Years | 531 (2.6%) | 236 (1.1%) |
| 65 to 74 Years | 90 (2.7%) | 142 (3.5%) |
| 75 Years and over | 251 (9.9%) | 561 (14.9%) |
Technology Access in Murrieta
Computing Device Access in Murrieta
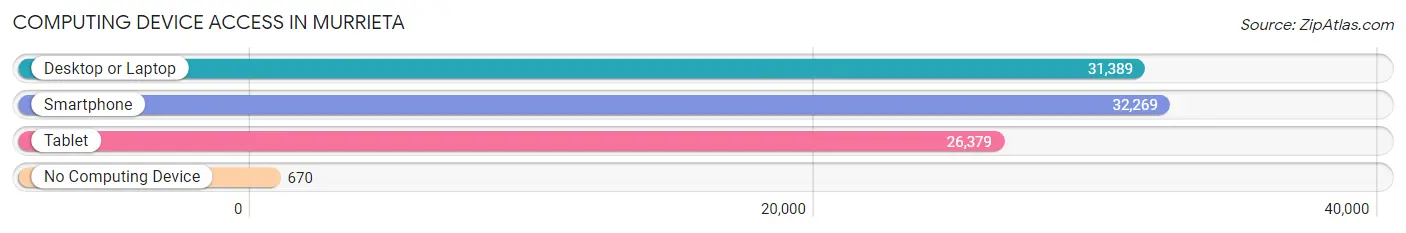
| Device Type | # Households | % Households |
| Desktop or Laptop | 31,389 | 91.0% |
| Smartphone | 32,269 | 93.6% |
| Tablet | 26,379 | 76.5% |
| No Computing Device | 670 | 1.9% |
| Total | 34,482 | 100.0% |
Internet Access in Murrieta
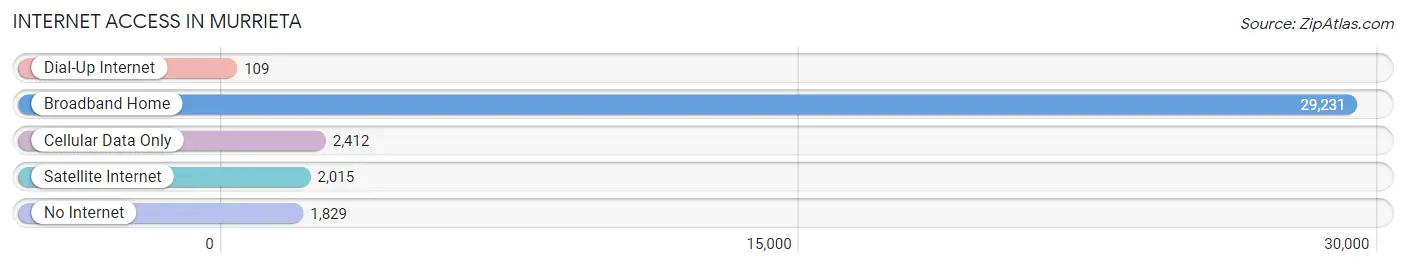
| Internet Type | # Households | % Households |
| Dial-Up Internet | 109 | 0.3% |
| Broadband Home | 29,231 | 84.8% |
| Cellular Data Only | 2,412 | 7.0% |
| Satellite Internet | 2,015 | 5.8% |
| No Internet | 1,829 | 5.3% |
| Total | 34,482 | 100.0% |
Murrieta Summary
Murrieta, California is a city located in Riverside County, California. It is situated in the southwestern corner of the state, about 60 miles southeast of Los Angeles. The city was incorporated in 1991 and has a population of approximately 103,466 people as of 2019.
History
The area that is now Murrieta was originally inhabited by the Luiseño people, who were part of the larger Shoshonean language group. The area was first explored by Spanish missionaries in the late 1700s, and the first permanent settlement was established in 1873. The settlement was named Murrieta after Juan Murrieta, a local rancher.
The city experienced a period of growth in the late 1800s and early 1900s, as the area became known for its hot springs and mineral baths. The city was officially incorporated in 1991, and has since experienced rapid growth due to its proximity to Los Angeles and San Diego.
Geography
Murrieta is located in southwestern Riverside County, California. It is situated in the Temecula Valley, about 60 miles southeast of Los Angeles. The city covers an area of approximately 33.5 square miles, and is bordered by the cities of Temecula, Wildomar, and Menifee.
The city is located at the base of the Santa Ana Mountains, and is surrounded by rolling hills and valleys. The city is home to several parks and recreational areas, including the Santa Rosa Plateau Ecological Reserve and the Murrieta Creek Trail.
Economy
Murrieta’s economy is largely driven by the service sector, with the city’s largest employers being the Murrieta Valley Unified School District, the City of Murrieta, and the County of Riverside. The city is also home to several major corporations, including Abbott Laboratories, Amazon, and Walmart.
The city’s economy is also supported by its tourism industry, with the city being home to several wineries, golf courses, and other attractions. The city is also home to several major shopping centers, including the Promenade Temecula and the Murrieta Town Center.
Demographics
As of 2019, Murrieta had a population of approximately 103,466 people. The city has a diverse population, with the largest ethnic groups being White (63.2%), Hispanic or Latino (25.2%), and Asian (4.3%). The median household income in the city is $87,845, and the median home value is $420,000.
Murrieta is served by the Murrieta Valley Unified School District, which includes 15 elementary schools, four middle schools, and three high schools. The city is also home to several higher education institutions, including the University of California, Riverside, and California State University, San Marcos.
Conclusion
Murrieta, California is a city located in Riverside County, California. It is situated in the southwestern corner of the state, about 60 miles southeast of Los Angeles. The city was incorporated in 1991 and has a population of approximately 103,466 people as of 2019. The city’s economy is largely driven by the service sector, with the city’s largest employers being the Murrieta Valley Unified School District, the City of Murrieta, and the County of Riverside. The city has a diverse population, with the largest ethnic groups being White (63.2%), Hispanic or Latino (25.2%), and Asian (4.3%). Murrieta is served by the Murrieta Valley Unified School District, which includes 15 elementary schools, four middle schools, and three high schools. The city is also home to several higher education institutions, including the University of California, Riverside, and California State University, San Marcos.
Common Questions
What is Per Capita Income in Murrieta?
Per Capita income in Murrieta is $40,950.
What is the Median Family Income in Murrieta?
Median Family Income in Murrieta is $115,231.
What is the Median Household income in Murrieta?
Median Household Income in Murrieta is $106,925.
What is Income or Wage Gap in Murrieta?
Income or Wage Gap in Murrieta is 47.6%.
Women in Murrieta earn 52.4 cents for every dollar earned by a man.
What is Family Income Deficit in Murrieta?
Family Income Deficit in Murrieta is $12,644.
Families that are below poverty line in Murrieta earn $12,644 less on average than the poverty threshold level.
What is Inequality or Gini Index in Murrieta?
Inequality or Gini Index in Murrieta is 0.40.
What is the Total Population of Murrieta?
Total Population of Murrieta is 111,899.
What is the Total Male Population of Murrieta?
Total Male Population of Murrieta is 54,829.
What is the Total Female Population of Murrieta?
Total Female Population of Murrieta is 57,070.
What is the Ratio of Males per 100 Females in Murrieta?
There are 96.07 Males per 100 Females in Murrieta.
What is the Ratio of Females per 100 Males in Murrieta?
There are 104.09 Females per 100 Males in Murrieta.
What is the Median Population Age in Murrieta?
Median Population Age in Murrieta is 35.6 Years.
What is the Average Family Size in Murrieta
Average Family Size in Murrieta is 3.6 People.
What is the Average Household Size in Murrieta
Average Household Size in Murrieta is 3.2 People.
How Large is the Labor Force in Murrieta?
There are 54,049 People in the Labor Forcein in Murrieta.
What is the Percentage of People in the Labor Force in Murrieta?
63.4% of People are in the Labor Force in Murrieta.
What is the Unemployment Rate in Murrieta?
Unemployment Rate in Murrieta is 6.7%.