Cities with the Lowest Percentage of Births to Unmarried Women over the Age of 35 in Colorado

RELATED REPORTS & OPTIONS

Lowest Illegitimacy | Women 35+
Population
Families and Households
Female Fertility
Female Fertility (Unmarried)
Race (Community Size)
Race (Percentage)
Ancestry (Community Size)
AfghanAfricanAlaska NativeAlaskan AthabascanAlbanianAleutAlsatianAmericanApacheArabArapahoArgentineanArmenianAssyrian / Chaldean / SyriacAustralianAustrianBahamianBangladeshiBarbadianBasqueBelgianBelizeanBermudanBhutaneseBlackfeetBolivianBrazilianBritishBritish West IndianBulgarianBurmeseCajunCambodianCanadianCape VerdeanCarpatho RusynCelticCentral AmericanCentral American IndianCherokeeCheyenneChickasawChileanChineseChippewaChoctawColombianColvilleComancheCosta RicanCreeCreekCroatianCrowCubanCypriotCzechCzechoslovakianDanishDelawareDominicanDutchDutch West IndianEastern EuropeanEcuadorianEgyptianEnglishEstonianEthiopianEuropeanFijianFilipinoFinnishFrenchFrench American IndianFrench CanadianGermanGerman RussianGhanaianGreekGuamanian / ChamorroGuatemalanGuyaneseHaitianHmongHonduranHopiHoumaHungarianIcelanderIndian (Asian)IndonesianInupiatIranianIraqiIrishIroquoisIsraeliItalianJamaicanJapaneseJordanianKenyanKiowaKoreanLaotianLatvianLebaneseLiberianLithuanianLumbeeLuxembourgerMacedonianMalaysianMalteseMarshalleseMenomineeMexicanMexican American IndianMongolianMoroccanNative HawaiianNavajoNepaleseNew ZealanderNicaraguanNigerianNorthern EuropeanNorwegianOkinawanOsageOttawaPaiutePakistaniPalestinianPanamanianParaguayanPennsylvania GermanPeruvianPimaPolishPortuguesePotawatomiPuebloPuerto RicanPuget Sound SalishRomanianRussianSalvadoranSamoanScandinavianScotch-IrishScottishSeminoleSenegaleseSerbianShoshoneSierra LeoneanSiouxSlavicSlovakSloveneSomaliSouth AfricanSouth AmericanSouth American IndianSoviet UnionSpaniardSpanishSpanish AmericanSpanish American IndianSri LankanSubsaharan AfricanSudaneseSwedishSwissSyrianTaiwaneseThaiTlingit-HaidaTohono O'OdhamTonganTrinidadian and TobagonianTsimshianTurkishU.S. Virgin IslanderUgandanUkrainianUruguayanUteVenezuelanVietnameseWelshWest IndianYakamaYaquiYugoslavianYumanYup'ikZimbabwean
Ancestry (Percentage)
AfghanAfricanAlaska NativeAlaskan AthabascanAlbanianAleutAlsatianAmericanApacheArabArapahoArgentineanArmenianAssyrian / Chaldean / SyriacAustralianAustrianBahamianBangladeshiBarbadianBasqueBelgianBelizeanBermudanBhutaneseBlackfeetBolivianBrazilianBritishBritish West IndianBulgarianBurmeseCajunCambodianCanadianCape VerdeanCarpatho RusynCelticCentral AmericanCentral American IndianCherokeeCheyenneChickasawChileanChineseChippewaChoctawColombianColvilleComancheCosta RicanCreeCreekCroatianCrowCubanCypriotCzechCzechoslovakianDanishDelawareDominicanDutchDutch West IndianEastern EuropeanEcuadorianEgyptianEnglishEstonianEthiopianEuropeanFijianFilipinoFinnishFrenchFrench American IndianFrench CanadianGermanGerman RussianGhanaianGreekGuamanian / ChamorroGuatemalanGuyaneseHaitianHmongHonduranHopiHoumaHungarianIcelanderIndian (Asian)IndonesianInupiatIranianIraqiIrishIroquoisIsraeliItalianJamaicanJapaneseJordanianKenyanKiowaKoreanLaotianLatvianLebaneseLiberianLithuanianLumbeeLuxembourgerMacedonianMalaysianMalteseMarshalleseMenomineeMexicanMexican American IndianMongolianMoroccanNative HawaiianNavajoNepaleseNew ZealanderNicaraguanNigerianNorthern EuropeanNorwegianOkinawanOsageOttawaPaiutePakistaniPalestinianPanamanianParaguayanPennsylvania GermanPeruvianPimaPolishPortuguesePotawatomiPuebloPuerto RicanPuget Sound SalishRomanianRussianSalvadoranSamoanScandinavianScotch-IrishScottishSeminoleSenegaleseSerbianShoshoneSierra LeoneanSiouxSlavicSlovakSloveneSomaliSouth AfricanSouth AmericanSouth American IndianSoviet UnionSpaniardSpanishSpanish AmericanSpanish American IndianSri LankanSubsaharan AfricanSudaneseSwedishSwissSyrianTaiwaneseThaiTlingit-HaidaTohono O'OdhamTonganTrinidadian and TobagonianTsimshianTurkishU.S. Virgin IslanderUgandanUkrainianUruguayanUteVenezuelanVietnameseWelshWest IndianYakamaYaquiYugoslavianYumanYup'ikZimbabwean
Immigrant Origin (Total)
AfghanistanAfricaAlbaniaArgentinaArmeniaAsiaAustraliaAustriaAzoresBahamasBangladeshBarbadosBelarusBelgiumBelizeBoliviaBosnia and HerzegovinaBrazilBulgariaBurma / MyanmarCabo VerdeCambodiaCameroonCanadaCaribbeanCentral AmericaChileChinaColombiaCongoCosta RicaCroatiaCubaCzechoslovakiaDenmarkDominicaDominican RepublicEastern AfricaEastern AsiaEastern EuropeEcuadorEgyptEl SalvadorEnglandEritreaEthiopiaEuropeFijiFranceGermanyGhanaGreeceGrenadaGuatemalaGuyanaHaitiHondurasHong KongHungaryIndiaIndonesiaIranIraqIrelandIsraelItalyJamaicaJapanJordanKazakhstanKenyaKoreaKuwaitLaosLatin AmericaLatviaLebanonLiberiaLithuaniaMalaysiaMexicoMicronesiaMiddle AfricaMoldovaMoroccoNepalNetherlandsNicaraguaNigeriaNorth MacedoniaNorthern AfricaNorthern EuropeNorwayOceaniaPakistanPanamaPeruPhilippinesPolandPortugalRomaniaRussiaSaudi ArabiaScotlandSenegalSerbiaSierra LeoneSingaporeSomaliaSouth AfricaSouth AmericaSouth Central AsiaSouth Eastern AsiaSouthern EuropeSpainSri LankaSt. Vincent and the GrenadinesSudanSwedenSwitzerlandSyriaTaiwanThailandTrinidad and TobagoTurkeyUgandaUkraineUruguayUzbekistanVenezuelaVietnamWest IndiesWestern AfricaWestern AsiaWestern EuropeYemenZaireZimbabwe
Immigrant Origin (Percentage)
AfghanistanAfricaAlbaniaArgentinaArmeniaAsiaAustraliaAustriaAzoresBahamasBangladeshBarbadosBelarusBelgiumBelizeBoliviaBosnia and HerzegovinaBrazilBulgariaBurma / MyanmarCabo VerdeCambodiaCameroonCanadaCaribbeanCentral AmericaChileChinaColombiaCongoCosta RicaCroatiaCubaCzechoslovakiaDenmarkDominicaDominican RepublicEastern AfricaEastern AsiaEastern EuropeEcuadorEgyptEl SalvadorEnglandEritreaEthiopiaEuropeFijiFranceGermanyGhanaGreeceGrenadaGuatemalaGuyanaHaitiHondurasHong KongHungaryIndiaIndonesiaIranIraqIrelandIsraelItalyJamaicaJapanJordanKazakhstanKenyaKoreaKuwaitLaosLatin AmericaLatviaLebanonLiberiaLithuaniaMalaysiaMexicoMicronesiaMiddle AfricaMoldovaMoroccoNepalNetherlandsNicaraguaNigeriaNorth MacedoniaNorthern AfricaNorthern EuropeNorwayOceaniaPakistanPanamaPeruPhilippinesPolandPortugalRomaniaRussiaSaudi ArabiaScotlandSenegalSerbiaSierra LeoneSingaporeSomaliaSouth AfricaSouth AmericaSouth Central AsiaSouth Eastern AsiaSouthern EuropeSpainSri LankaSt. Vincent and the GrenadinesSudanSwedenSwitzerlandSyriaTaiwanThailandTrinidad and TobagoTurkeyUgandaUkraineUruguayUzbekistanVenezuelaVietnamWest IndiesWestern AfricaWestern AsiaWestern EuropeYemenZaireZimbabwe
Income
Income (Families)
Income (Households)
Poverty
Poverty (Families)
Unemployment
Employment Occupations
Employment Industries
Employer Class
Commute Time
Commute Means
School Enrollment
Education by Degree Field
Occupancy
Finances
Physical Characteristics
Colorado
Compare Cities
Comparison Subject

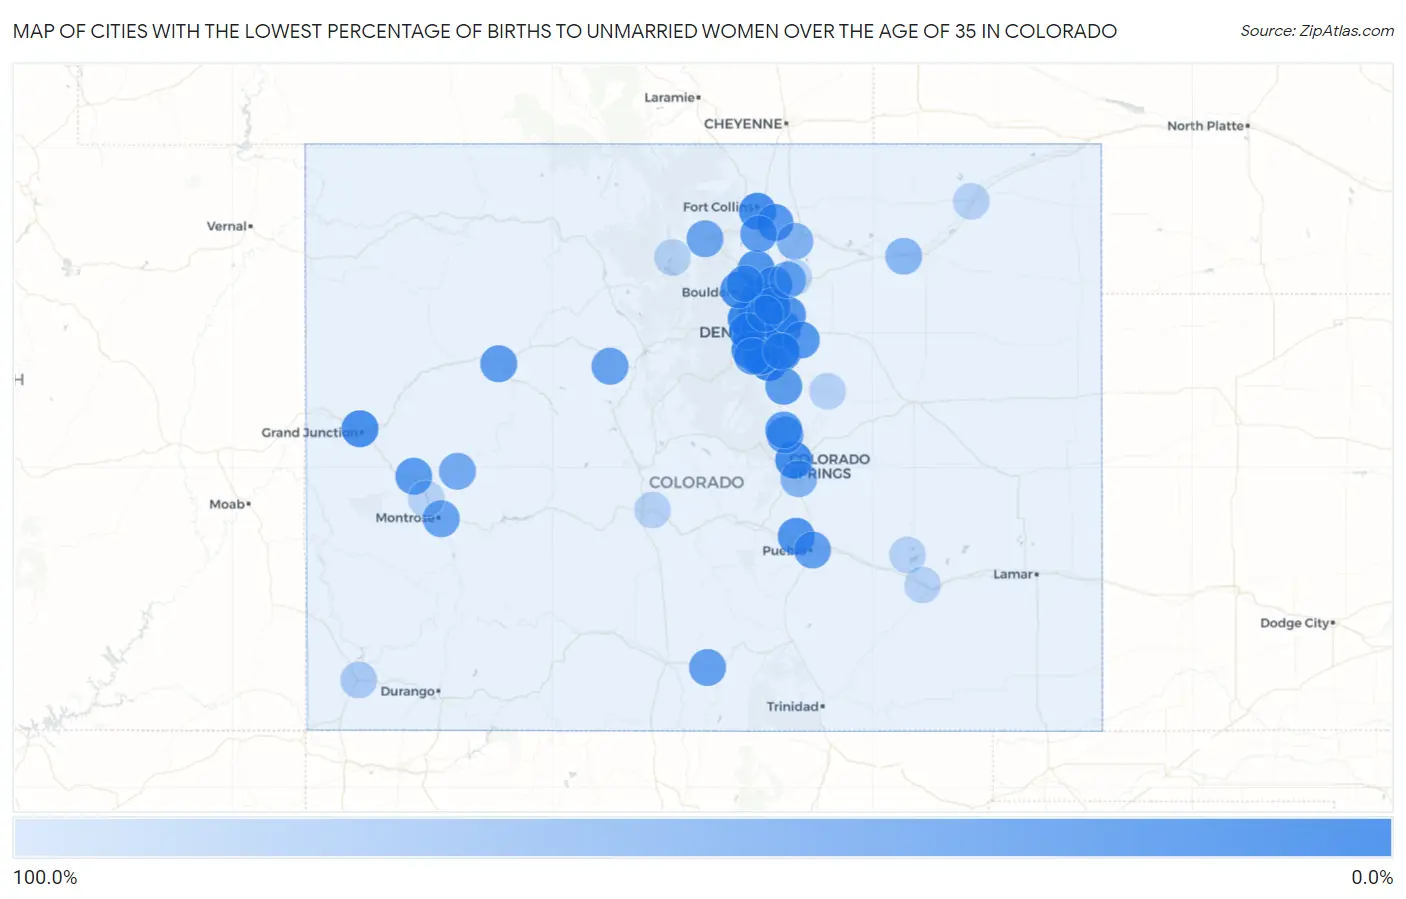
Map of Cities with the Lowest Percentage of Births to Unmarried Women over the Age of 35 in Colorado

100.0%
0.0%
Cities with the Lowest Percentage of Births to Unmarried Women over the Age of 35 in Colorado Map

Cities with the Lowest Percentage of Births to Unmarried Women over the Age of 35 in Colorado

City % Unmarried vs State vs National
1.Westminster2.4%15.3%(-12.9)#120.1%(-17.7)#36
2.Highlands Ranch2.5%15.3%(-12.8)#220.1%(-17.6)#41
3.Lakewood3.2%15.3%(-12.1)#320.1%(-16.9)#51
4.Englewood4.9%15.3%(-10.4)#420.1%(-15.2)#115
5.Broomfield5.3%15.3%(-10.00)#520.1%(-14.8)#132
6.Wheat Ridge5.7%15.3%(-9.60)#620.1%(-14.4)#148
7.Arvada6.0%15.3%(-9.30)#720.1%(-14.1)#163
8.Edgewater7.0%15.3%(-8.30)#820.1%(-13.1)#209
9.Centennial8.3%15.3%(-7.00)#920.1%(-11.8)#271
10.Dakota Ridge8.4%15.3%(-6.90)#1020.1%(-11.7)#277
11.Northglenn9.6%15.3%(-5.70)#1120.1%(-10.5)#328
12.Fort Collins12.2%15.3%(-3.10)#1220.1%(-7.90)#440
13.Columbine12.6%15.3%(-2.70)#1320.1%(-7.50)#469
14.Colorado Springs12.9%15.3%(-2.40)#1420.1%(-7.20)#484
15.Littleton13.7%15.3%(-1.60)#1520.1%(-6.40)#531
16.Grand Junction16.1%15.3%(+0.800)#1620.1%(-4.00)#677
17.Boulder16.7%15.3%(+1.40)#1720.1%(-3.40)#705
18.Denver19.9%15.3%(+4.60)#1820.1%(-0.200)#866
19.Longmont21.3%15.3%(+6.00)#1920.1%(+1.20)#943
20.Pueblo West21.5%15.3%(+6.20)#2020.1%(+1.40)#957
21.Commerce City21.6%15.3%(+6.30)#2120.1%(+1.50)#962
22.Dacono23.3%15.3%(+8.00)#2220.1%(+3.20)#1,036
23.Windsor26.2%15.3%(+10.9)#2320.1%(+6.10)#1,164
24.Aurora27.0%15.3%(+11.7)#2420.1%(+6.90)#1,200
25.Applewood28.6%15.3%(+13.3)#2520.1%(+8.50)#1,279
26.Delta29.6%15.3%(+14.3)#2620.1%(+9.50)#1,324
27.Castle Rock32.1%15.3%(+16.8)#2720.1%(+12.0)#1,421
28.Loveland32.7%15.3%(+17.4)#2820.1%(+12.6)#1,442
29.Glenwood Springs33.3%15.3%(+18.0)#2920.1%(+13.2)#1,473
30.Gleneagle33.3%15.3%(+18.0)#3020.1%(+13.2)#1,478
31.Thornton34.1%15.3%(+18.8)#3120.1%(+14.0)#1,523
32.Gunbarrel35.6%15.3%(+20.3)#3220.1%(+15.5)#1,585
33.Monument35.7%15.3%(+20.4)#3320.1%(+15.6)#1,593
34.Pueblo37.0%15.3%(+21.7)#3420.1%(+16.9)#1,633
35.Blanca37.5%15.3%(+22.2)#3520.1%(+17.4)#1,663
36.Ken Caryl39.5%15.3%(+24.2)#3620.1%(+19.4)#1,723
37.Red Cliff40.0%15.3%(+24.7)#3720.1%(+19.9)#1,761
38.Montrose41.7%15.3%(+26.4)#3820.1%(+21.6)#1,803
39.Cherry Creek42.4%15.3%(+27.1)#3920.1%(+22.3)#1,820
40.Estes Park45.5%15.3%(+30.2)#4020.1%(+25.4)#1,918
41.Fort Lupton50.0%15.3%(+34.7)#4120.1%(+29.9)#2,039
42.Hotchkiss50.0%15.3%(+34.7)#4220.1%(+29.9)#2,062
43.Evans61.3%15.3%(+46.0)#4320.1%(+41.2)#2,322
44.Security Widefield62.7%15.3%(+47.4)#4420.1%(+42.6)#2,369
45.Twin Lakes Cdp Adams County65.3%15.3%(+50.0)#4520.1%(+45.2)#2,428
46.Fort Morgan66.3%15.3%(+51.0)#4620.1%(+46.2)#2,439
47.Sterling Ranch78.0%15.3%(+62.7)#4720.1%(+57.9)#2,610
48.Cortez89.5%15.3%(+74.2)#4820.1%(+69.4)#2,703
49.Federal Heights100.0%15.3%(+84.7)#4920.1%(+79.9)#2,831
50.Sterling100.0%15.3%(+84.7)#5020.1%(+79.9)#2,845
51.Salida100.0%15.3%(+84.7)#5120.1%(+79.9)#3,078
52.Aristocrat Ranchettes100.0%15.3%(+84.7)#5220.1%(+79.9)#3,453
53.Olathe100.0%15.3%(+84.7)#5320.1%(+79.9)#3,468
54.Ordway100.0%15.3%(+84.7)#5420.1%(+79.9)#3,474
55.Swink100.0%15.3%(+84.7)#5520.1%(+79.9)#3,850
56.Kiowa100.0%15.3%(+84.7)#5620.1%(+79.9)#3,883
57.Grand Lake100.0%15.3%(+84.7)#5720.1%(+79.9)#4,064

Common Questions

What are the Top 10 Cities with the Lowest Percentage of Births to Unmarried Women over the Age of 35 in Colorado?
Top 10 Cities with the Lowest Percentage of Births to Unmarried Women over the Age of 35 in Colorado are:
#1
0.0%
#2
0.0%
#3
0.0%
#4
0.0%
#5
0.0%
#6
0.0%
#7
0.0%
#8
0.0%
#9
0.0%
#10
0.0%
What city has the Lowest Percentage of Births to Unmarried Women over the Age of 35 in Colorado?
Westminster has the Lowest Percentage of Births to Unmarried Women over the Age of 35 in Colorado with 2.4%.
What is the Percentage of Births to Unmarried Women over the Age of 35 in the State of Colorado?
Percentage of Births to Unmarried Women over the Age of 35 in Colorado is 15.3%.
What is the Percentage of Births to Unmarried Women over the Age of 35 in the United States?
Percentage of Births to Unmarried Women over the Age of 35 in the United States is 20.1%.