Cities with the Lowest Percentage of Births to Unmarried Women over the Age of 35 in Wisconsin
RELATED REPORTS & OPTIONS
Lowest Illegitimacy | Women 35+
Wisconsin
Compare Cities
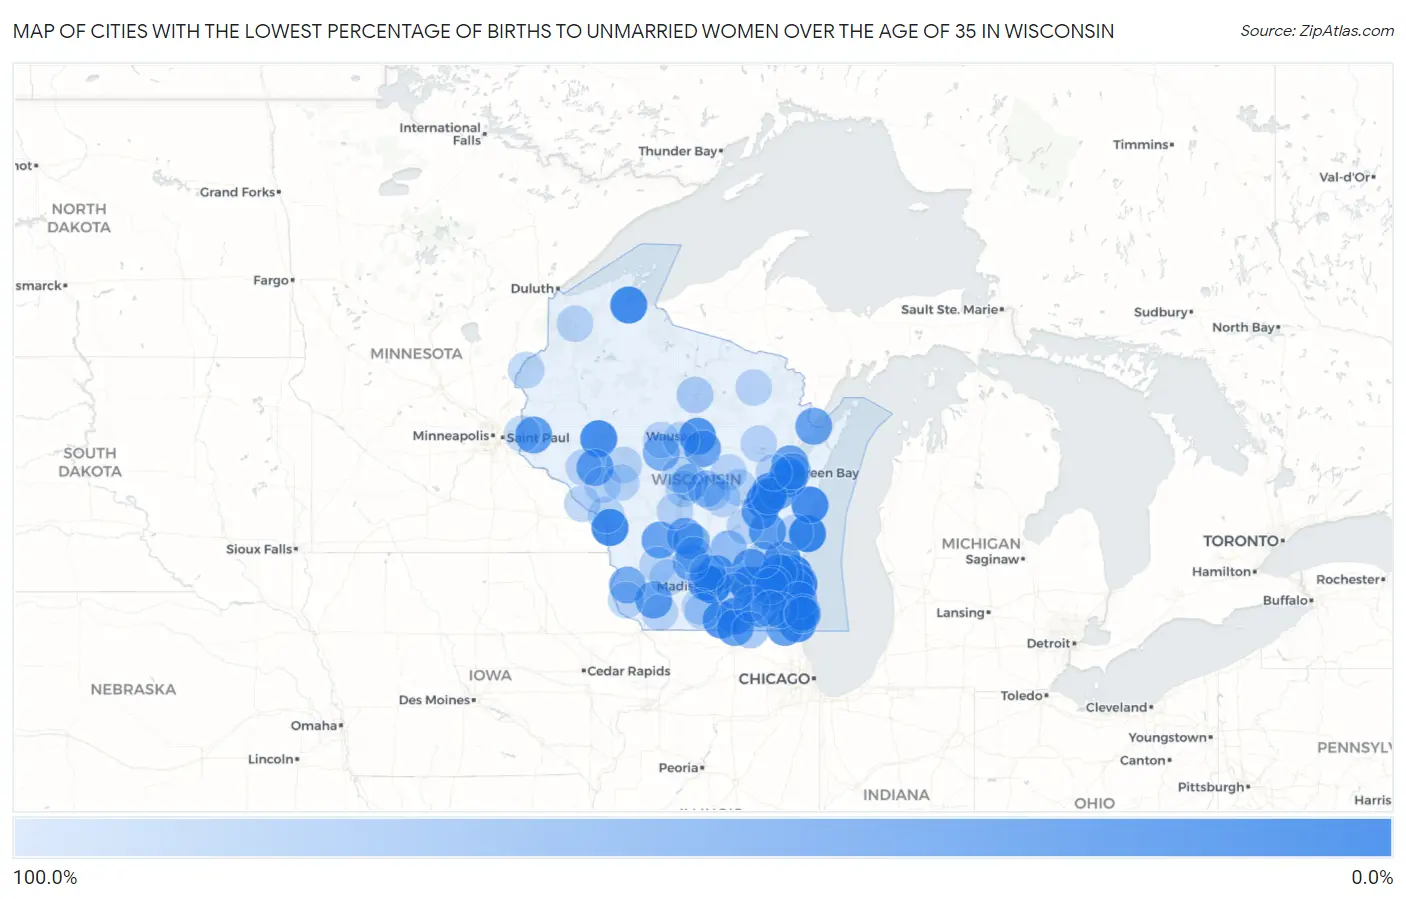
Map of Cities with the Lowest Percentage of Births to Unmarried Women over the Age of 35 in Wisconsin
100.0%
0.0%
Cities with the Lowest Percentage of Births to Unmarried Women over the Age of 35 in Wisconsin
| City | % Unmarried | vs State | vs National | |
| 1. | West Allis | 4.6% | 17.7%(-13.1)#1 | 20.1%(-15.5)#100 |
| 2. | Neenah | 5.7% | 17.7%(-12.0)#2 | 20.1%(-14.4)#149 |
| 3. | Franklin | 6.9% | 17.7%(-10.8)#3 | 20.1%(-13.2)#198 |
| 4. | Mequon | 7.1% | 17.7%(-10.6)#4 | 20.1%(-13.0)#217 |
| 5. | Sheboygan | 7.4% | 17.7%(-10.3)#5 | 20.1%(-12.7)#224 |
| 6. | Johnson Creek | 9.1% | 17.7%(-8.60)#6 | 20.1%(-11.0)#310 |
| 7. | Madison | 9.4% | 17.7%(-8.30)#7 | 20.1%(-10.7)#316 |
| 8. | Mount Pleasant | 11.4% | 17.7%(-6.30)#8 | 20.1%(-8.70)#406 |
| 9. | La Crosse | 13.2% | 17.7%(-4.50)#9 | 20.1%(-6.90)#502 |
| 10. | Ashland | 13.3% | 17.7%(-4.40)#10 | 20.1%(-6.80)#508 |
| 11. | Manitowoc | 14.5% | 17.7%(-3.20)#11 | 20.1%(-5.60)#580 |
| 12. | Whitefish Bay | 15.8% | 17.7%(-1.90)#12 | 20.1%(-4.30)#665 |
| 13. | Chippewa Falls | 16.1% | 17.7%(-1.60)#13 | 20.1%(-4.00)#680 |
| 14. | Kenosha | 16.8% | 17.7%(-0.900)#14 | 20.1%(-3.30)#717 |
| 15. | Greenfield | 17.3% | 17.7%(-0.400)#15 | 20.1%(-2.80)#743 |
| 16. | Oconomowoc | 19.1% | 17.7%(+1.40)#16 | 20.1%(-1.00)#838 |
| 17. | Wauwatosa | 19.5% | 17.7%(+1.80)#17 | 20.1%(-0.600)#850 |
| 18. | Orfordville | 22.2% | 17.7%(+4.50)#18 | 20.1%(+2.10)#997 |
| 19. | Shorewood | 23.9% | 17.7%(+6.20)#19 | 20.1%(+3.80)#1,063 |
| 20. | West Bend | 24.4% | 17.7%(+6.70)#20 | 20.1%(+4.30)#1,080 |
| 21. | Wausau | 25.0% | 17.7%(+7.30)#21 | 20.1%(+4.90)#1,102 |
| 22. | Wales | 25.6% | 17.7%(+7.90)#22 | 20.1%(+5.50)#1,137 |
| 23. | De Pere | 26.1% | 17.7%(+8.40)#23 | 20.1%(+6.00)#1,162 |
| 24. | Glendale | 27.9% | 17.7%(+10.2)#24 | 20.1%(+7.80)#1,241 |
| 25. | Deforest | 27.9% | 17.7%(+10.2)#25 | 20.1%(+7.80)#1,242 |
| 26. | Janesville | 31.9% | 17.7%(+14.2)#26 | 20.1%(+11.8)#1,414 |
| 27. | Fond Du Lac | 33.0% | 17.7%(+15.3)#27 | 20.1%(+12.9)#1,452 |
| 28. | Clyman | 33.3% | 17.7%(+15.6)#28 | 20.1%(+13.2)#1,506 |
| 29. | Appleton | 33.8% | 17.7%(+16.1)#29 | 20.1%(+13.7)#1,516 |
| 30. | Sturtevant | 35.5% | 17.7%(+17.8)#30 | 20.1%(+15.4)#1,581 |
| 31. | Roberts | 36.4% | 17.7%(+18.7)#31 | 20.1%(+16.3)#1,616 |
| 32. | Salem Lakes | 37.1% | 17.7%(+19.4)#32 | 20.1%(+17.0)#1,637 |
| 33. | Oshkosh | 37.3% | 17.7%(+19.6)#33 | 20.1%(+17.2)#1,643 |
| 34. | Beloit | 37.5% | 17.7%(+19.8)#34 | 20.1%(+17.4)#1,650 |
| 35. | Milwaukee | 38.5% | 17.7%(+20.8)#35 | 20.1%(+18.4)#1,698 |
| 36. | Eleva | 40.0% | 17.7%(+22.3)#36 | 20.1%(+19.9)#1,755 |
| 37. | Livingston | 40.0% | 17.7%(+22.3)#37 | 20.1%(+19.9)#1,759 |
| 38. | Germantown | 42.1% | 17.7%(+24.4)#38 | 20.1%(+22.0)#1,812 |
| 39. | Kronenwetter | 42.3% | 17.7%(+24.6)#39 | 20.1%(+22.2)#1,818 |
| 40. | Marinette | 42.4% | 17.7%(+24.7)#40 | 20.1%(+22.3)#1,821 |
| 41. | Richfield | 42.9% | 17.7%(+25.2)#41 | 20.1%(+22.8)#1,829 |
| 42. | Hillsboro | 42.9% | 17.7%(+25.2)#42 | 20.1%(+22.8)#1,841 |
| 43. | Suamico | 43.2% | 17.7%(+25.5)#43 | 20.1%(+23.1)#1,847 |
| 44. | Middleton | 43.3% | 17.7%(+25.6)#44 | 20.1%(+23.2)#1,849 |
| 45. | Kaukauna | 44.4% | 17.7%(+26.7)#45 | 20.1%(+24.3)#1,882 |
| 46. | Lauderdale Lakes | 46.2% | 17.7%(+28.5)#46 | 20.1%(+26.1)#1,943 |
| 47. | Hartland | 47.5% | 17.7%(+29.8)#47 | 20.1%(+27.4)#1,974 |
| 48. | Oak Creek | 48.6% | 17.7%(+30.9)#48 | 20.1%(+28.5)#2,001 |
| 49. | Ashwaubenon | 50.0% | 17.7%(+32.3)#49 | 20.1%(+29.9)#2,033 |
| 50. | Lyndon Station | 50.0% | 17.7%(+32.3)#50 | 20.1%(+29.9)#2,065 |
| 51. | Bluffview | 50.0% | 17.7%(+32.3)#51 | 20.1%(+29.9)#2,070 |
| 52. | Waterford | 52.9% | 17.7%(+35.2)#52 | 20.1%(+32.8)#2,147 |
| 53. | Menasha | 53.1% | 17.7%(+35.4)#53 | 20.1%(+33.0)#2,150 |
| 54. | Wauzeka | 54.5% | 17.7%(+36.8)#54 | 20.1%(+34.4)#2,182 |
| 55. | Spencer | 56.0% | 17.7%(+38.3)#55 | 20.1%(+35.9)#2,210 |
| 56. | Wisconsin Dells | 56.3% | 17.7%(+38.6)#56 | 20.1%(+36.2)#2,212 |
| 57. | Racine | 60.0% | 17.7%(+42.3)#57 | 20.1%(+39.9)#2,291 |
| 58. | Green Bay | 67.9% | 17.7%(+50.2)#58 | 20.1%(+47.8)#2,476 |
| 59. | Wisconsin Rapids | 68.9% | 17.7%(+51.2)#59 | 20.1%(+48.8)#2,490 |
| 60. | Whitewater | 75.0% | 17.7%(+57.3)#60 | 20.1%(+54.9)#2,562 |
| 61. | Cambria | 75.0% | 17.7%(+57.3)#61 | 20.1%(+54.9)#2,573 |
| 62. | Bancroft | 77.8% | 17.7%(+60.1)#62 | 20.1%(+57.7)#2,606 |
| 63. | Baraboo | 78.6% | 17.7%(+60.9)#63 | 20.1%(+58.5)#2,616 |
| 64. | Sharon | 81.8% | 17.7%(+64.1)#64 | 20.1%(+61.7)#2,645 |
| 65. | Tomahawk | 90.0% | 17.7%(+72.3)#65 | 20.1%(+69.9)#2,705 |
| 66. | Holmen | 100.0% | 17.7%(+82.3)#66 | 20.1%(+79.9)#2,892 |
| 67. | Plymouth | 100.0% | 17.7%(+82.3)#67 | 20.1%(+79.9)#2,954 |
| 68. | Ripon | 100.0% | 17.7%(+82.3)#68 | 20.1%(+79.9)#2,982 |
| 69. | Delafield | 100.0% | 17.7%(+82.3)#69 | 20.1%(+79.9)#3,006 |
| 70. | Richland Center | 100.0% | 17.7%(+82.3)#70 | 20.1%(+79.9)#3,118 |
| 71. | East Troy | 100.0% | 17.7%(+82.3)#71 | 20.1%(+79.9)#3,141 |
| 72. | North Hudson | 100.0% | 17.7%(+82.3)#72 | 20.1%(+79.9)#3,203 |
| 73. | Seymour | 100.0% | 17.7%(+82.3)#73 | 20.1%(+79.9)#3,228 |
| 74. | Mondovi | 100.0% | 17.7%(+82.3)#74 | 20.1%(+79.9)#3,300 |
| 75. | Nekoosa | 100.0% | 17.7%(+82.3)#75 | 20.1%(+79.9)#3,376 |
| 76. | New Glarus | 100.0% | 17.7%(+82.3)#76 | 20.1%(+79.9)#3,388 |
| 77. | Colby | 100.0% | 17.7%(+82.3)#77 | 20.1%(+79.9)#3,421 |
| 78. | Weyauwega | 100.0% | 17.7%(+82.3)#78 | 20.1%(+79.9)#3,481 |
| 79. | Whitehall | 100.0% | 17.7%(+82.3)#79 | 20.1%(+79.9)#3,550 |
| 80. | Cambridge | 100.0% | 17.7%(+82.3)#80 | 20.1%(+79.9)#3,582 |
| 81. | Keshena | 100.0% | 17.7%(+82.3)#81 | 20.1%(+79.9)#3,584 |
| 82. | Grantsburg | 100.0% | 17.7%(+82.3)#82 | 20.1%(+79.9)#3,591 |
| 83. | Edgar | 100.0% | 17.7%(+82.3)#83 | 20.1%(+79.9)#3,593 |
| 84. | Iola | 100.0% | 17.7%(+82.3)#84 | 20.1%(+79.9)#3,660 |
| 85. | Monticello | 100.0% | 17.7%(+82.3)#85 | 20.1%(+79.9)#3,662 |
| 86. | Necedah | 100.0% | 17.7%(+82.3)#86 | 20.1%(+79.9)#3,667 |
| 87. | Dane | 100.0% | 17.7%(+82.3)#87 | 20.1%(+79.9)#3,675 |
| 88. | Iron Ridge | 100.0% | 17.7%(+82.3)#88 | 20.1%(+79.9)#3,708 |
| 89. | Belmont | 100.0% | 17.7%(+82.3)#89 | 20.1%(+79.9)#3,715 |
| 90. | Wild Rose | 100.0% | 17.7%(+82.3)#90 | 20.1%(+79.9)#3,732 |
| 91. | Lone Rock | 100.0% | 17.7%(+82.3)#91 | 20.1%(+79.9)#3,784 |
| 92. | Solon Springs | 100.0% | 17.7%(+82.3)#92 | 20.1%(+79.9)#3,808 |
| 93. | Bloomington | 100.0% | 17.7%(+82.3)#93 | 20.1%(+79.9)#3,818 |
| 94. | Fountain City | 100.0% | 17.7%(+82.3)#94 | 20.1%(+79.9)#3,829 |
| 95. | Laona | 100.0% | 17.7%(+82.3)#95 | 20.1%(+79.9)#3,921 |
| 96. | Elmwood Park | 100.0% | 17.7%(+82.3)#96 | 20.1%(+79.9)#3,931 |
| 97. | Fairchild | 100.0% | 17.7%(+82.3)#97 | 20.1%(+79.9)#3,948 |
| 98. | Vesper | 100.0% | 17.7%(+82.3)#98 | 20.1%(+79.9)#3,950 |
| 99. | Almond | 100.0% | 17.7%(+82.3)#99 | 20.1%(+79.9)#3,978 |
| 100. | Hixton | 100.0% | 17.7%(+82.3)#100 | 20.1%(+79.9)#3,990 |
Common Questions
What are the Top 10 Cities with the Lowest Percentage of Births to Unmarried Women over the Age of 35 in Wisconsin?
Top 10 Cities with the Lowest Percentage of Births to Unmarried Women over the Age of 35 in Wisconsin are:
#1
4.6%
#2
5.7%
#3
6.9%
#4
7.1%
#5
7.4%
#6
9.1%
#7
9.4%
#8
11.4%
#9
13.2%
#10
13.3%
What city has the Lowest Percentage of Births to Unmarried Women over the Age of 35 in Wisconsin?
West Allis has the Lowest Percentage of Births to Unmarried Women over the Age of 35 in Wisconsin with 4.6%.
What is the Percentage of Births to Unmarried Women over the Age of 35 in the State of Wisconsin?
Percentage of Births to Unmarried Women over the Age of 35 in Wisconsin is 17.7%.
What is the Percentage of Births to Unmarried Women over the Age of 35 in the United States?
Percentage of Births to Unmarried Women over the Age of 35 in the United States is 20.1%.