Bella Vista, CA Map & Demographics
Bella Vista Map
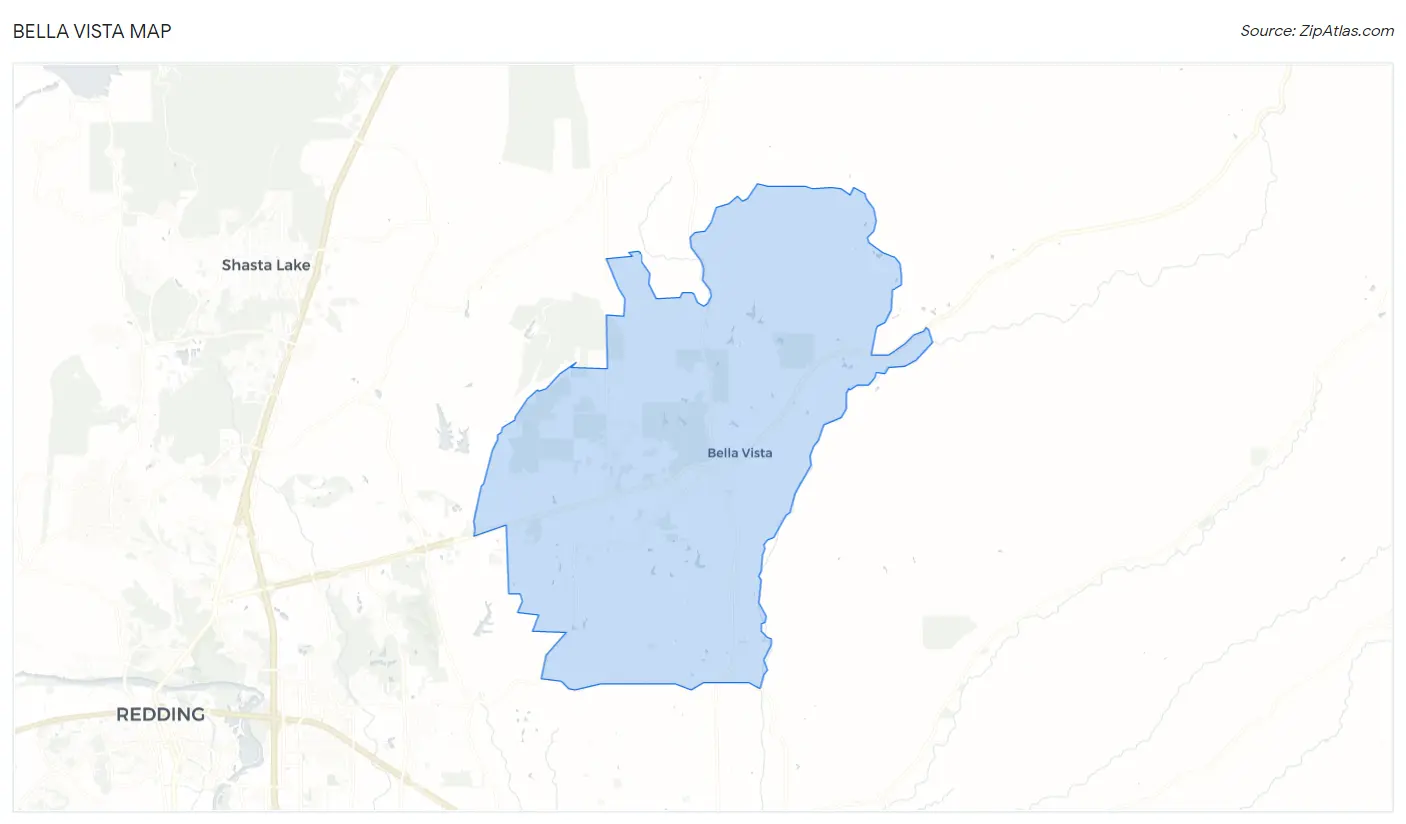
Bella Vista Overview
$38,353
PER CAPITA INCOME
$91,781
AVG FAMILY INCOME
$86,583
AVG HOUSEHOLD INCOME
44.6%
WAGE / INCOME GAP [ % ]
55.4¢/ $1
WAGE / INCOME GAP [ $ ]
0.43
INEQUALITY / GINI INDEX
3,955
TOTAL POPULATION
2,040
MALE POPULATION
1,915
FEMALE POPULATION
106.53
MALES / 100 FEMALES
93.87
FEMALES / 100 MALES
43.4
MEDIAN AGE
3.4
AVG FAMILY SIZE
2.9
AVG HOUSEHOLD SIZE
1,839
LABOR FORCE [ PEOPLE ]
60.6%
PERCENT IN LABOR FORCE
8.4%
UNEMPLOYMENT RATE
Bella Vista Zip Codes
Bella Vista Area Codes
Income in Bella Vista
Income Overview in Bella Vista
Per Capita Income in Bella Vista is $38,353, while median incomes of families and households are $91,781 and $86,583 respectively.
| Characteristic | Number | Measure |
| Per Capita Income | 3,955 | $38,353 |
| Median Family Income | 997 | $91,781 |
| Mean Family Income | 997 | $124,544 |
| Median Household Income | 1,342 | $86,583 |
| Mean Household Income | 1,342 | $112,581 |
| Income Deficit | 997 | $0 |
| Wage / Income Gap (%) | 3,955 | 44.61% |
| Wage / Income Gap ($) | 3,955 | 55.39¢ per $1 |
| Gini / Inequality Index | 3,955 | 0.43 |
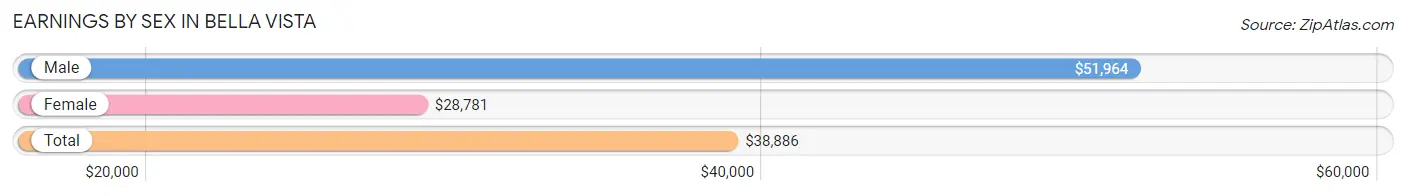
Earnings by Sex in Bella Vista
Average Earnings in Bella Vista are $38,886, $51,964 for men and $28,781 for women, a difference of 44.6%.
| Sex | Number | Average Earnings |
| Male | 912 (47.8%) | $51,964 |
| Female | 997 (52.2%) | $28,781 |
| Total | 1,909 (100.0%) | $38,886 |
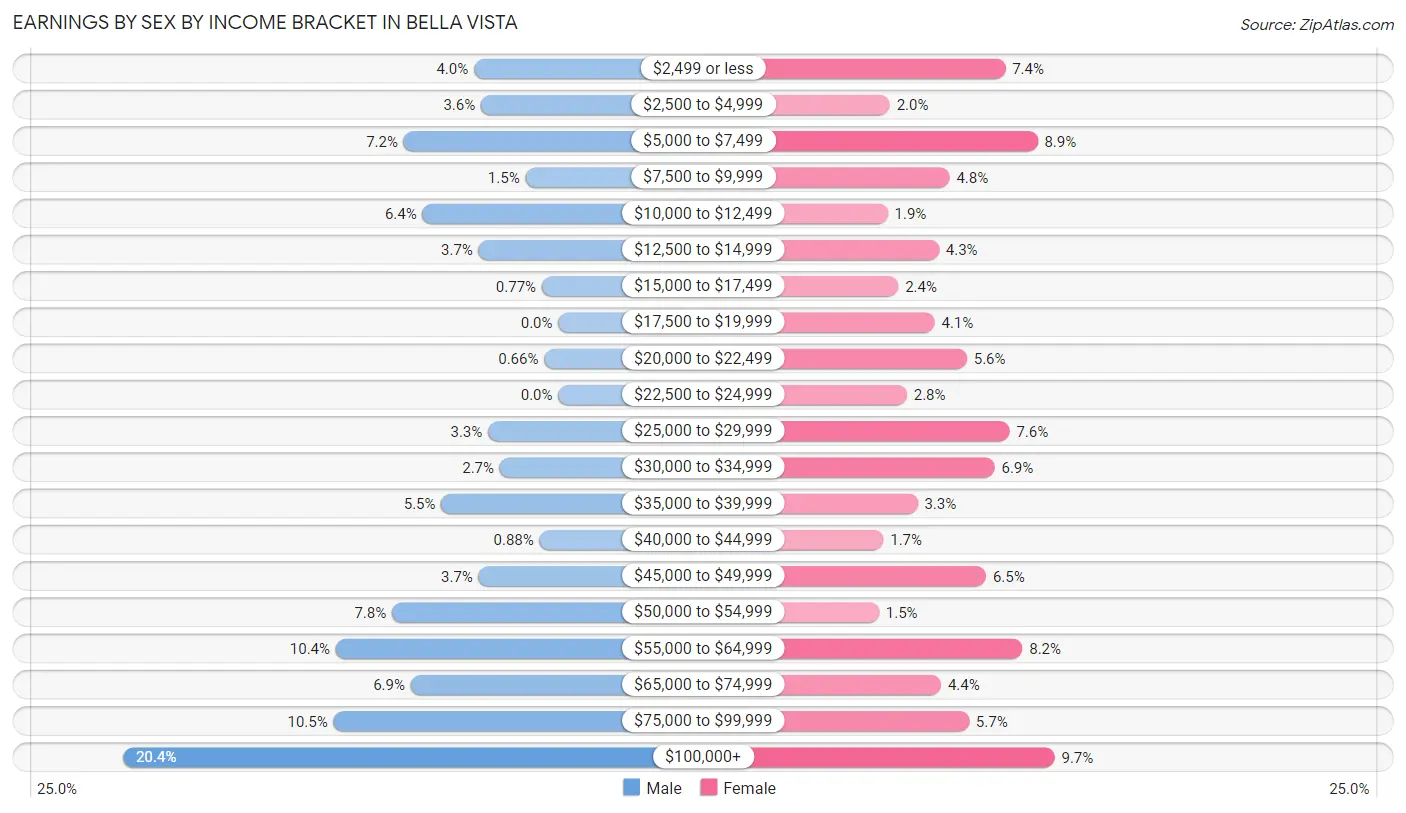
Earnings by Sex by Income Bracket in Bella Vista
The most common earnings brackets in Bella Vista are $100,000+ for men (186 | 20.4%) and $100,000+ for women (97 | 9.7%).
| Income | Male | Female |
| $2,499 or less | 36 (4.0%) | 74 (7.4%) |
| $2,500 to $4,999 | 33 (3.6%) | 20 (2.0%) |
| $5,000 to $7,499 | 66 (7.2%) | 89 (8.9%) |
| $7,500 to $9,999 | 14 (1.5%) | 48 (4.8%) |
| $10,000 to $12,499 | 58 (6.4%) | 19 (1.9%) |
| $12,500 to $14,999 | 34 (3.7%) | 43 (4.3%) |
| $15,000 to $17,499 | 7 (0.8%) | 24 (2.4%) |
| $17,500 to $19,999 | 0 (0.0%) | 41 (4.1%) |
| $20,000 to $22,499 | 6 (0.7%) | 56 (5.6%) |
| $22,500 to $24,999 | 0 (0.0%) | 28 (2.8%) |
| $25,000 to $29,999 | 30 (3.3%) | 76 (7.6%) |
| $30,000 to $34,999 | 25 (2.7%) | 69 (6.9%) |
| $35,000 to $39,999 | 50 (5.5%) | 33 (3.3%) |
| $40,000 to $44,999 | 8 (0.9%) | 17 (1.7%) |
| $45,000 to $49,999 | 34 (3.7%) | 65 (6.5%) |
| $50,000 to $54,999 | 71 (7.8%) | 15 (1.5%) |
| $55,000 to $64,999 | 95 (10.4%) | 82 (8.2%) |
| $65,000 to $74,999 | 63 (6.9%) | 44 (4.4%) |
| $75,000 to $99,999 | 96 (10.5%) | 57 (5.7%) |
| $100,000+ | 186 (20.4%) | 97 (9.7%) |
| Total | 912 (100.0%) | 997 (100.0%) |
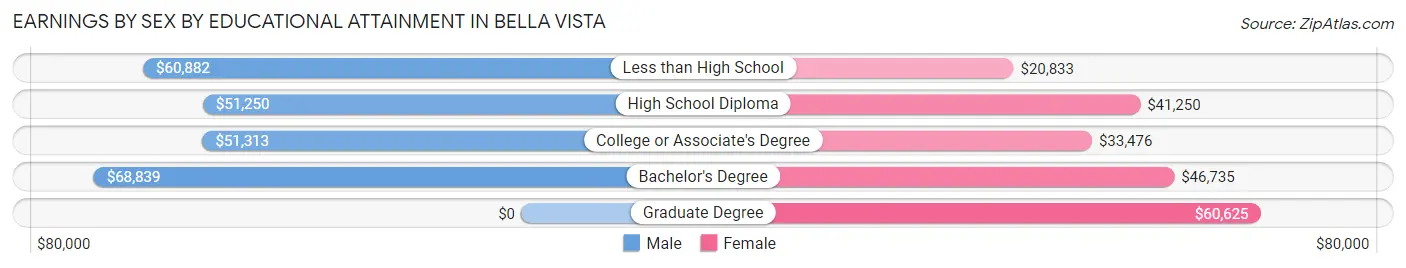
Earnings by Sex by Educational Attainment in Bella Vista
Average earnings in Bella Vista are $60,091 for men and $35,347 for women, a difference of 41.2%. Men with an educational attainment of bachelor's degree enjoy the highest average annual earnings of $68,839, while those with high school diploma education earn the least with $51,250. Women with an educational attainment of graduate degree earn the most with the average annual earnings of $60,625, while those with less than high school education have the smallest earnings of $20,833.
| Educational Attainment | Male Income | Female Income |
| Less than High School | $60,882 | $20,833 |
| High School Diploma | $51,250 | $41,250 |
| College or Associate's Degree | $51,313 | $33,476 |
| Bachelor's Degree | $68,839 | $46,735 |
| Graduate Degree | - | - |
| Total | $60,091 | $35,347 |
Family Income in Bella Vista
Family Income Brackets in Bella Vista
According to the Bella Vista family income data, there are 235 families falling into the $75,000 to $99,999 income range, which is the most common income bracket and makes up 23.6% of all families.
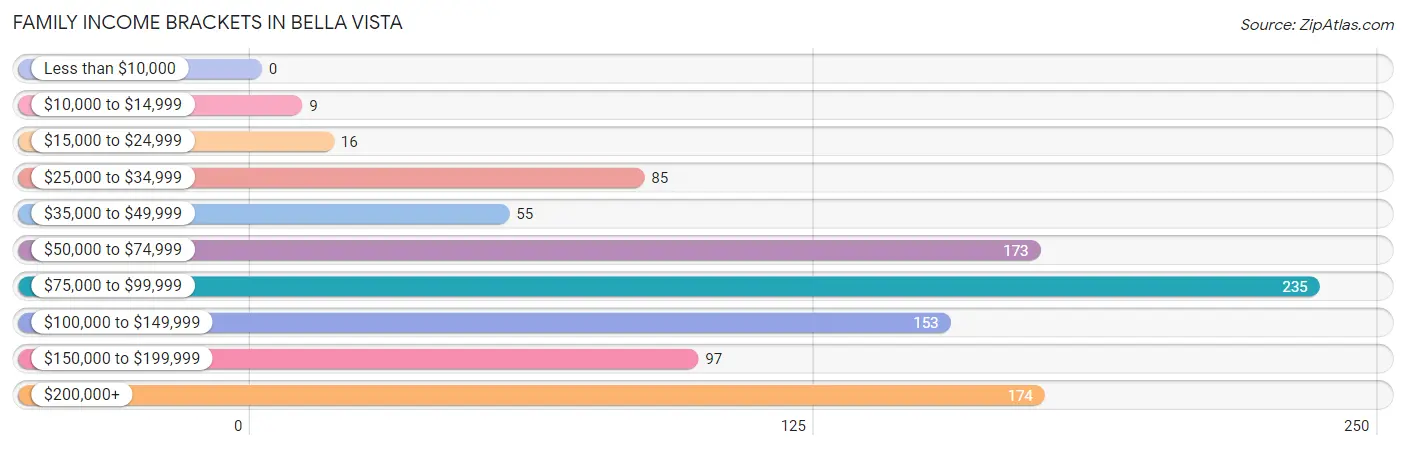
| Income Bracket | # Families | % Families |
| Less than $10,000 | 0 | 0.0% |
| $10,000 to $14,999 | 9 | 0.9% |
| $15,000 to $24,999 | 16 | 1.6% |
| $25,000 to $34,999 | 85 | 8.5% |
| $35,000 to $49,999 | 55 | 5.5% |
| $50,000 to $74,999 | 173 | 17.4% |
| $75,000 to $99,999 | 235 | 23.6% |
| $100,000 to $149,999 | 153 | 15.3% |
| $150,000 to $199,999 | 97 | 9.7% |
| $200,000+ | 174 | 17.5% |
Family Income by Famaliy Size in Bella Vista
5-person families (84 | 8.4%) account for the highest median family income in Bella Vista with $133,571 per family, while 2-person families (453 | 45.4%) have the highest median income of $41,640 per family member.
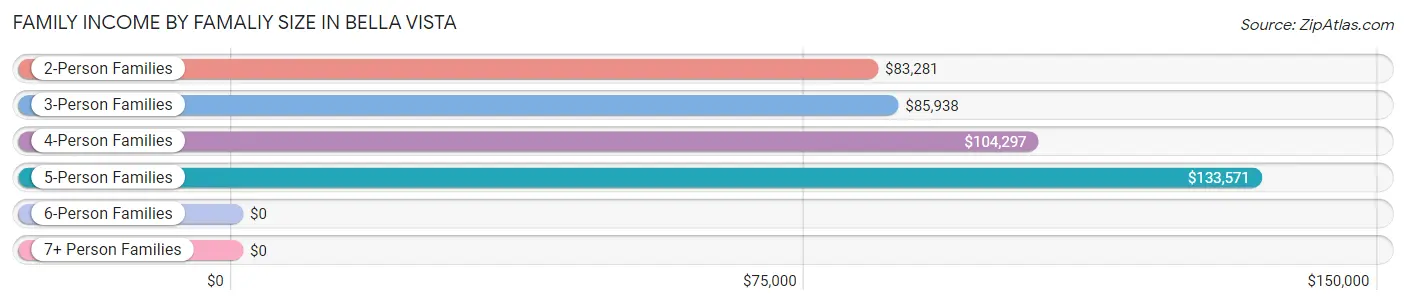
| Income Bracket | # Families | Median Income |
| 2-Person Families | 453 (45.4%) | $83,281 |
| 3-Person Families | 234 (23.5%) | $85,938 |
| 4-Person Families | 151 (15.1%) | $104,297 |
| 5-Person Families | 84 (8.4%) | $133,571 |
| 6-Person Families | 22 (2.2%) | $0 |
| 7+ Person Families | 53 (5.3%) | $0 |
| Total | 997 (100.0%) | $91,781 |
Family Income by Number of Earners in Bella Vista
The median family income in Bella Vista is $91,781, with families comprising 3+ earners (162) having the highest median family income of $119,833, while families with no earners (275) have the lowest median family income of $70,536, accounting for 16.3% and 27.6% of families, respectively.
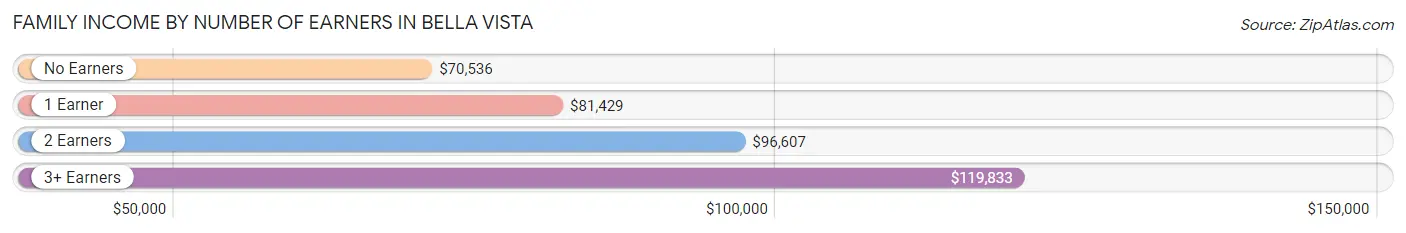
| Number of Earners | # Families | Median Income |
| No Earners | 275 (27.6%) | $70,536 |
| 1 Earner | 172 (17.2%) | $81,429 |
| 2 Earners | 388 (38.9%) | $96,607 |
| 3+ Earners | 162 (16.3%) | $119,833 |
| Total | 997 (100.0%) | $91,781 |
Household Income in Bella Vista
Household Income Brackets in Bella Vista
With 306 households falling in the category, the $75,000 to $99,999 income range is the most frequent in Bella Vista, accounting for 22.8% of all households. In contrast, only 30 households (2.2%) fall into the $10,000 to $14,999 income bracket, making it the least populous group.
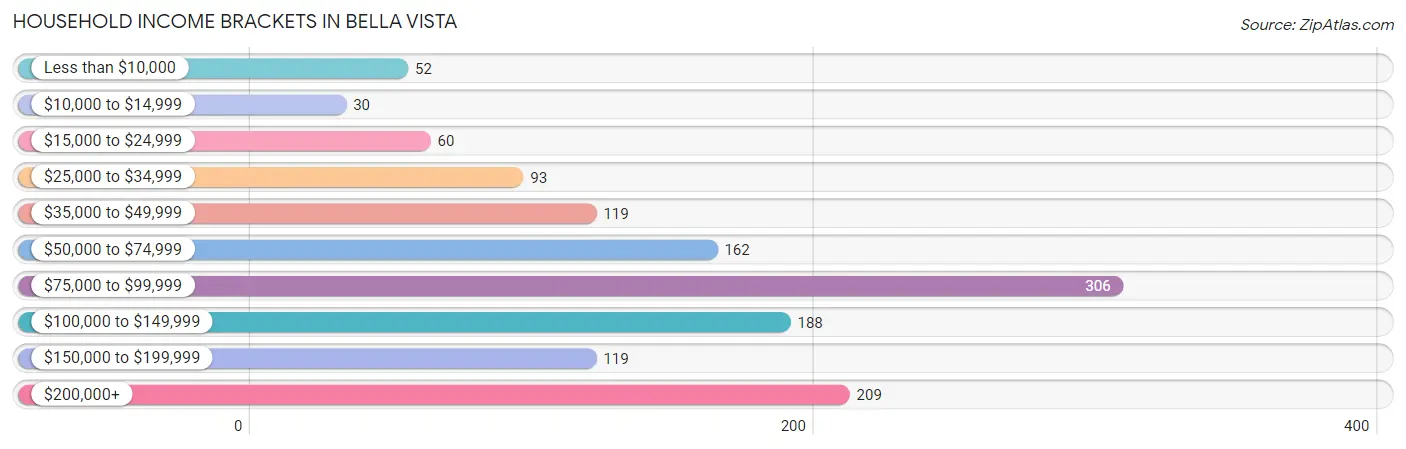
| Income Bracket | # Households | % Households |
| Less than $10,000 | 52 | 3.9% |
| $10,000 to $14,999 | 30 | 2.2% |
| $15,000 to $24,999 | 60 | 4.5% |
| $25,000 to $34,999 | 93 | 6.9% |
| $35,000 to $49,999 | 119 | 8.9% |
| $50,000 to $74,999 | 162 | 12.1% |
| $75,000 to $99,999 | 306 | 22.8% |
| $100,000 to $149,999 | 188 | 14.0% |
| $150,000 to $199,999 | 119 | 8.9% |
| $200,000+ | 209 | 15.6% |
Household Income by Householder Age in Bella Vista
The median household income in Bella Vista is $86,583, with the highest median household income of $103,173 found in the 45 to 64 years age bracket for the primary householder. A total of 546 households (40.7%) fall into this category. Meanwhile, the 15 to 24 years age bracket for the primary householder has the lowest median household income of $0, with 19 households (1.4%) in this group.
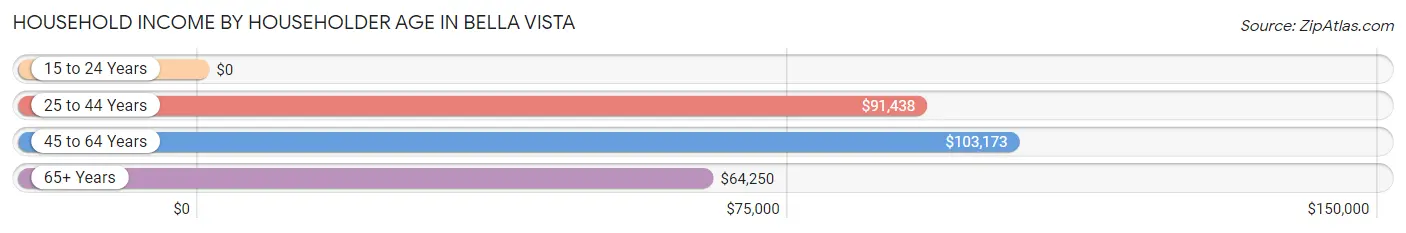
| Income Bracket | # Households | Median Income |
| 15 to 24 Years | 19 (1.4%) | $0 |
| 25 to 44 Years | 334 (24.9%) | $91,438 |
| 45 to 64 Years | 546 (40.7%) | $103,173 |
| 65+ Years | 443 (33.0%) | $64,250 |
| Total | 1,342 (100.0%) | $86,583 |
Poverty in Bella Vista
Income Below Poverty by Sex and Age in Bella Vista
With 5.1% poverty level for males and 5.6% for females among the residents of Bella Vista, 18 to 24 year old males and 75 year old and over females are the most vulnerable to poverty, with 19 males (23.5%) and 44 females (18.6%) in their respective age groups living below the poverty level.
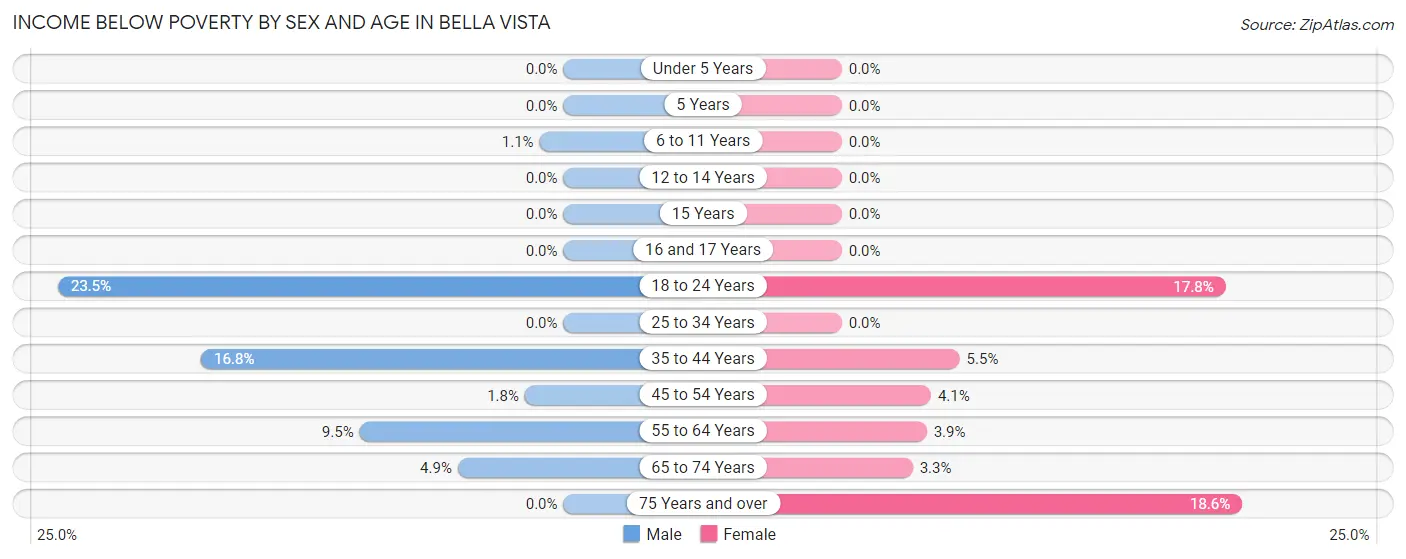
| Age Bracket | Male | Female |
| Under 5 Years | 0 (0.0%) | 0 (0.0%) |
| 5 Years | 0 (0.0%) | 0 (0.0%) |
| 6 to 11 Years | 3 (1.1%) | 0 (0.0%) |
| 12 to 14 Years | 0 (0.0%) | 0 (0.0%) |
| 15 Years | 0 (0.0%) | 0 (0.0%) |
| 16 and 17 Years | 0 (0.0%) | 0 (0.0%) |
| 18 to 24 Years | 19 (23.5%) | 26 (17.8%) |
| 25 to 34 Years | 0 (0.0%) | 0 (0.0%) |
| 35 to 44 Years | 39 (16.8%) | 7 (5.5%) |
| 45 to 54 Years | 4 (1.8%) | 13 (4.1%) |
| 55 to 64 Years | 30 (9.5%) | 10 (3.9%) |
| 65 to 74 Years | 10 (4.9%) | 8 (3.3%) |
| 75 Years and over | 0 (0.0%) | 44 (18.6%) |
| Total | 105 (5.1%) | 108 (5.6%) |
Income Above Poverty by Sex and Age in Bella Vista
According to the poverty statistics in Bella Vista, males aged under 5 years and females aged under 5 years are the age groups that are most secure financially, with 100.0% of males and 100.0% of females in these age groups living above the poverty line.
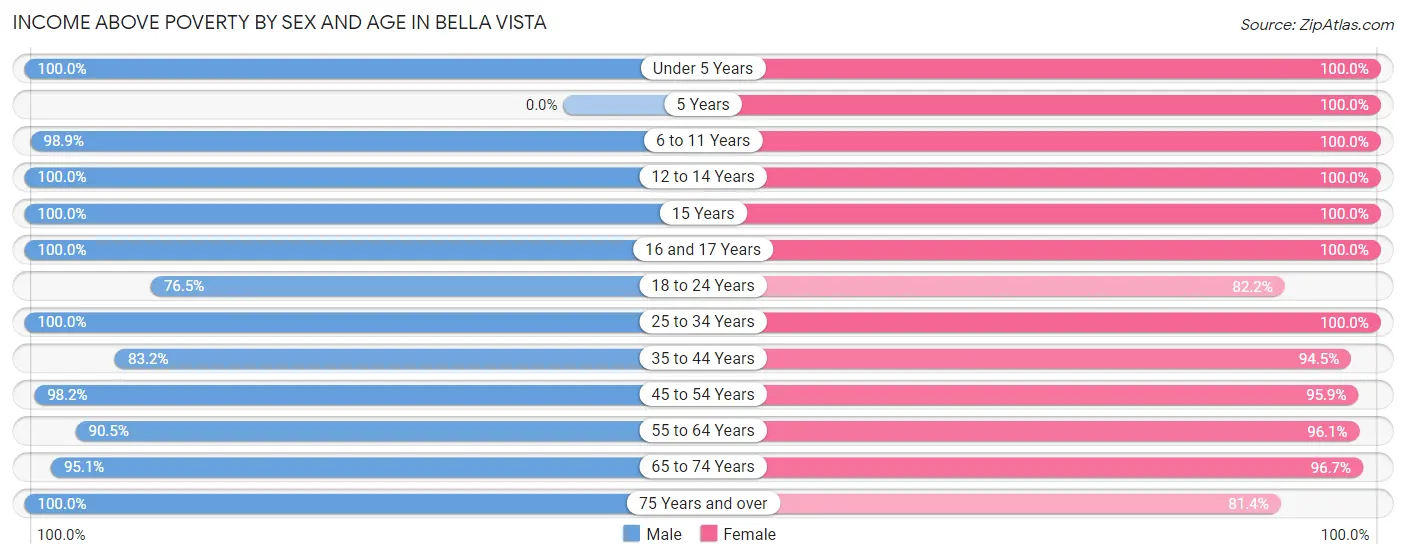
| Age Bracket | Male | Female |
| Under 5 Years | 149 (100.0%) | 63 (100.0%) |
| 5 Years | 0 (0.0%) | 20 (100.0%) |
| 6 to 11 Years | 268 (98.9%) | 114 (100.0%) |
| 12 to 14 Years | 148 (100.0%) | 7 (100.0%) |
| 15 Years | 54 (100.0%) | 95 (100.0%) |
| 16 and 17 Years | 54 (100.0%) | 87 (100.0%) |
| 18 to 24 Years | 62 (76.5%) | 120 (82.2%) |
| 25 to 34 Years | 177 (100.0%) | 207 (100.0%) |
| 35 to 44 Years | 193 (83.2%) | 121 (94.5%) |
| 45 to 54 Years | 220 (98.2%) | 301 (95.9%) |
| 55 to 64 Years | 287 (90.5%) | 244 (96.1%) |
| 65 to 74 Years | 194 (95.1%) | 235 (96.7%) |
| 75 Years and over | 128 (100.0%) | 193 (81.4%) |
| Total | 1,934 (94.9%) | 1,807 (94.4%) |
Income Below Poverty Among Married-Couple Families in Bella Vista
The poverty statistics for married-couple families in Bella Vista show that 0.7% or 6 of the total 825 families live below the poverty line. Families with no children have the highest poverty rate of 1.3%, comprising of 6 families. On the other hand, families with 1 or 2 children have the lowest poverty rate of 0.0%, which includes 0 families.
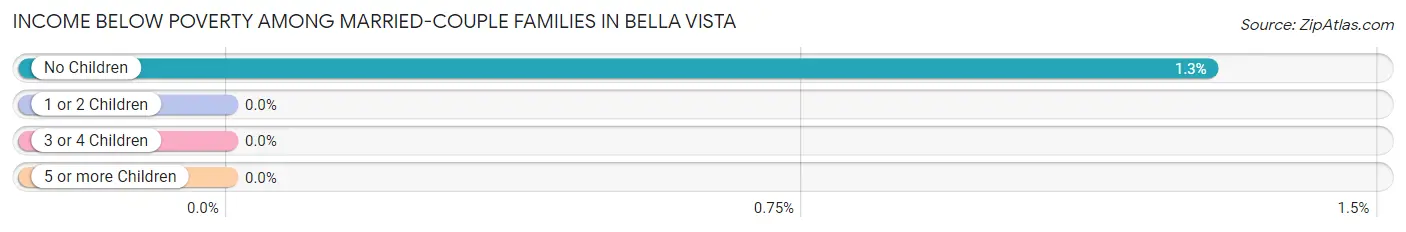
| Children | Above Poverty | Below Poverty |
| No Children | 461 (98.7%) | 6 (1.3%) |
| 1 or 2 Children | 241 (100.0%) | 0 (0.0%) |
| 3 or 4 Children | 77 (100.0%) | 0 (0.0%) |
| 5 or more Children | 40 (100.0%) | 0 (0.0%) |
| Total | 819 (99.3%) | 6 (0.7%) |
Income Below Poverty Among Single-Parent Households in Bella Vista
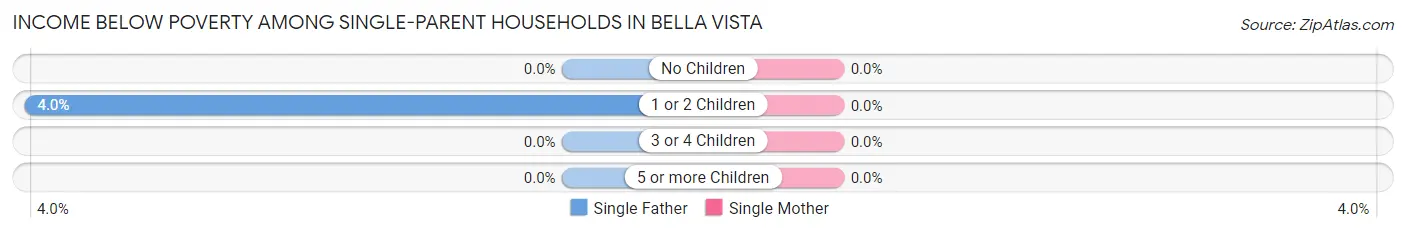
| Children | Single Father | Single Mother |
| No Children | 0 (0.0%) | 0 (0.0%) |
| 1 or 2 Children | 3 (4.0%) | 0 (0.0%) |
| 3 or 4 Children | 0 (0.0%) | 0 (0.0%) |
| 5 or more Children | 0 (0.0%) | 0 (0.0%) |
| Total | 3 (2.8%) | 0 (0.0%) |
Income Below Poverty Among Married-Couple vs Single-Parent Households in Bella Vista
The poverty data for Bella Vista shows that 6 of the married-couple family households (0.7%) and 3 of the single-parent households (1.7%) are living below the poverty level. Within the married-couple family households, those with no children have the highest poverty rate, with 6 households (1.3%) falling below the poverty line. Among the single-parent households, those with 1 or 2 children have the highest poverty rate, with 3 household (3.8%) living below poverty.
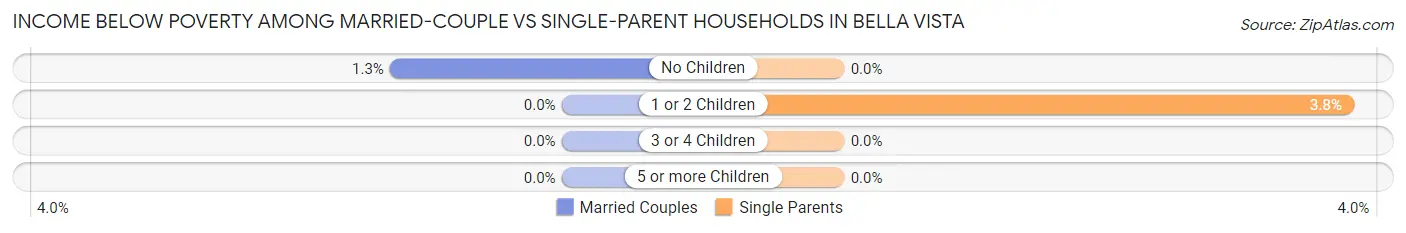
| Children | Married-Couple Families | Single-Parent Households |
| No Children | 6 (1.3%) | 0 (0.0%) |
| 1 or 2 Children | 0 (0.0%) | 3 (3.8%) |
| 3 or 4 Children | 0 (0.0%) | 0 (0.0%) |
| 5 or more Children | 0 (0.0%) | 0 (0.0%) |
| Total | 6 (0.7%) | 3 (1.7%) |
Race in Bella Vista
The most populous races in Bella Vista are White / Caucasian (3,314 | 83.8%), Asian (272 | 6.9%), and Hispanic or Latino (271 | 6.9%).
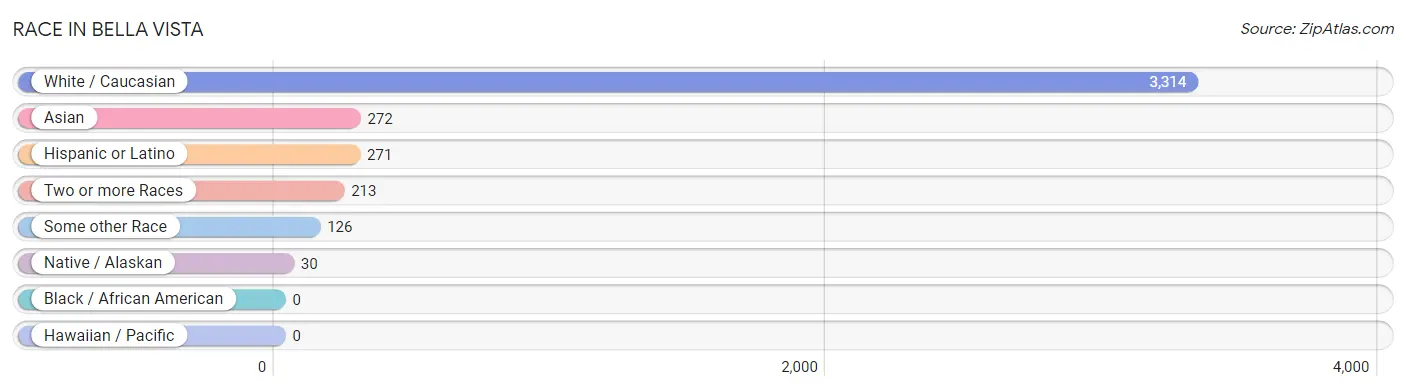
| Race | # Population | % Population |
| Asian | 272 | 6.9% |
| Black / African American | 0 | 0.0% |
| Hawaiian / Pacific | 0 | 0.0% |
| Hispanic or Latino | 271 | 6.9% |
| Native / Alaskan | 30 | 0.8% |
| White / Caucasian | 3,314 | 83.8% |
| Two or more Races | 213 | 5.4% |
| Some other Race | 126 | 3.2% |
| Total | 3,955 | 100.0% |
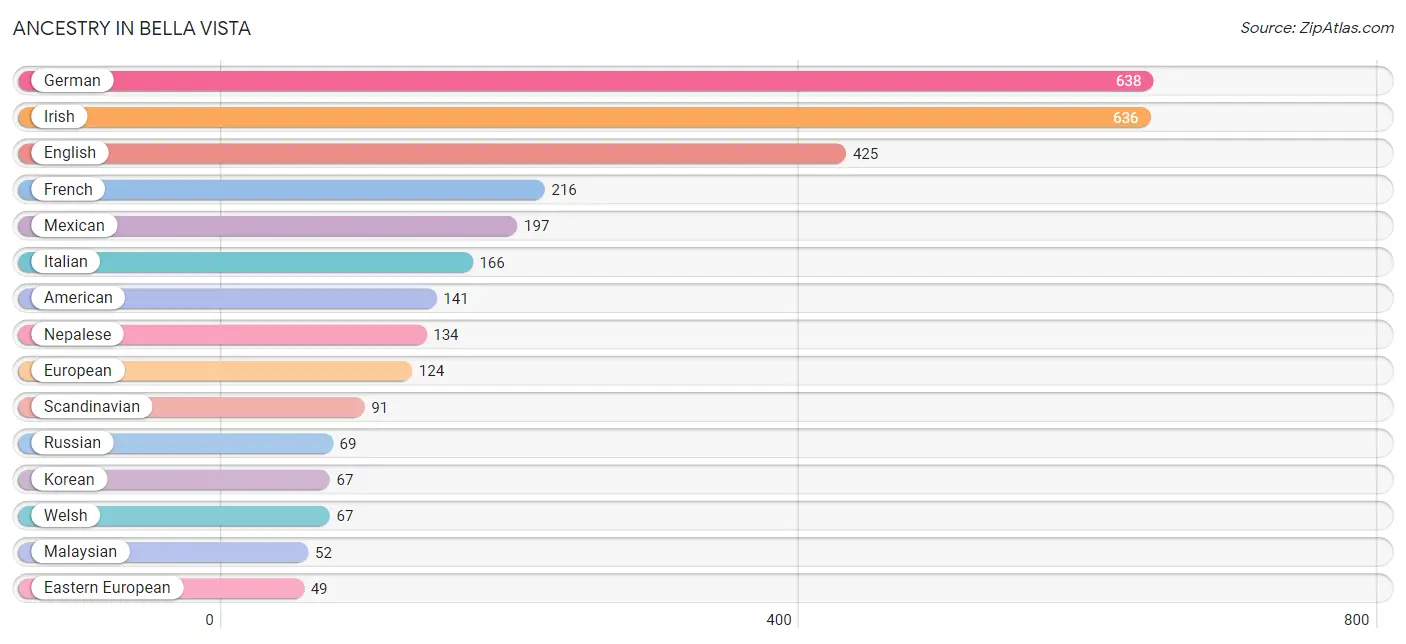
Ancestry in Bella Vista
The most populous ancestries reported in Bella Vista are German (638 | 16.1%), Irish (636 | 16.1%), English (425 | 10.7%), French (216 | 5.5%), and Mexican (197 | 5.0%), together accounting for 53.4% of all Bella Vista residents.
| Ancestry | # Population | % Population |
| American | 141 | 3.6% |
| Blackfeet | 2 | 0.1% |
| British | 35 | 0.9% |
| Burmese | 12 | 0.3% |
| Canadian | 46 | 1.2% |
| Chickasaw | 3 | 0.1% |
| Choctaw | 24 | 0.6% |
| Colombian | 6 | 0.2% |
| Croatian | 20 | 0.5% |
| Cuban | 31 | 0.8% |
| Czech | 18 | 0.5% |
| Danish | 29 | 0.7% |
| Dutch | 36 | 0.9% |
| Eastern European | 49 | 1.2% |
| English | 425 | 10.7% |
| European | 124 | 3.1% |
| Finnish | 6 | 0.2% |
| French | 216 | 5.5% |
| French Canadian | 20 | 0.5% |
| German | 638 | 16.1% |
| Greek | 11 | 0.3% |
| Irish | 636 | 16.1% |
| Italian | 166 | 4.2% |
| Korean | 67 | 1.7% |
| Luxembourger | 7 | 0.2% |
| Malaysian | 52 | 1.3% |
| Mexican | 197 | 5.0% |
| Nepalese | 134 | 3.4% |
| Northern European | 44 | 1.1% |
| Norwegian | 46 | 1.2% |
| Pakistani | 18 | 0.5% |
| Polish | 40 | 1.0% |
| Portuguese | 14 | 0.4% |
| Romanian | 6 | 0.2% |
| Russian | 69 | 1.7% |
| Scandinavian | 91 | 2.3% |
| Scotch-Irish | 26 | 0.7% |
| Scottish | 28 | 0.7% |
| Sioux | 2 | 0.1% |
| South American | 6 | 0.2% |
| Spaniard | 19 | 0.5% |
| Spanish | 18 | 0.5% |
| Swedish | 14 | 0.4% |
| Swiss | 38 | 1.0% |
| Thai | 44 | 1.1% |
| Welsh | 67 | 1.7% | View All 46 Rows |
Immigrants in Bella Vista
The most numerous immigrant groups reported in Bella Vista came from Asia (117 | 3.0%), South Eastern Asia (117 | 3.0%), Laos (52 | 1.3%), Africa (35 | 0.9%), and Eastern Africa (35 | 0.9%), together accounting for 9.0% of all Bella Vista residents.
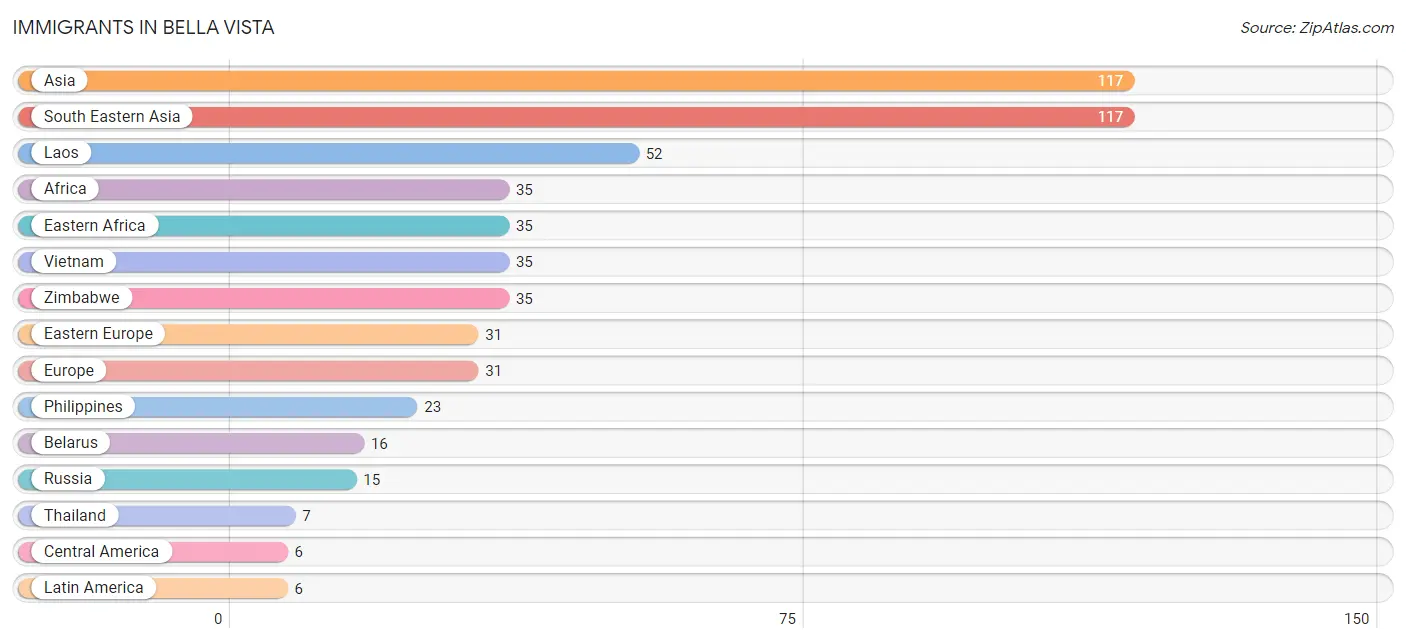
| Immigration Origin | # Population | % Population |
| Africa | 35 | 0.9% |
| Asia | 117 | 3.0% |
| Belarus | 16 | 0.4% |
| Central America | 6 | 0.2% |
| Eastern Africa | 35 | 0.9% |
| Eastern Europe | 31 | 0.8% |
| Europe | 31 | 0.8% |
| Laos | 52 | 1.3% |
| Latin America | 6 | 0.2% |
| Mexico | 6 | 0.2% |
| Philippines | 23 | 0.6% |
| Russia | 15 | 0.4% |
| South Eastern Asia | 117 | 3.0% |
| Thailand | 7 | 0.2% |
| Vietnam | 35 | 0.9% |
| Zimbabwe | 35 | 0.9% | View All 16 Rows |
Sex and Age in Bella Vista
Sex and Age in Bella Vista
The most populous age groups in Bella Vista are 5 to 9 Years (241 | 11.8%) for men and 15 to 19 Years (225 | 11.7%) for women.
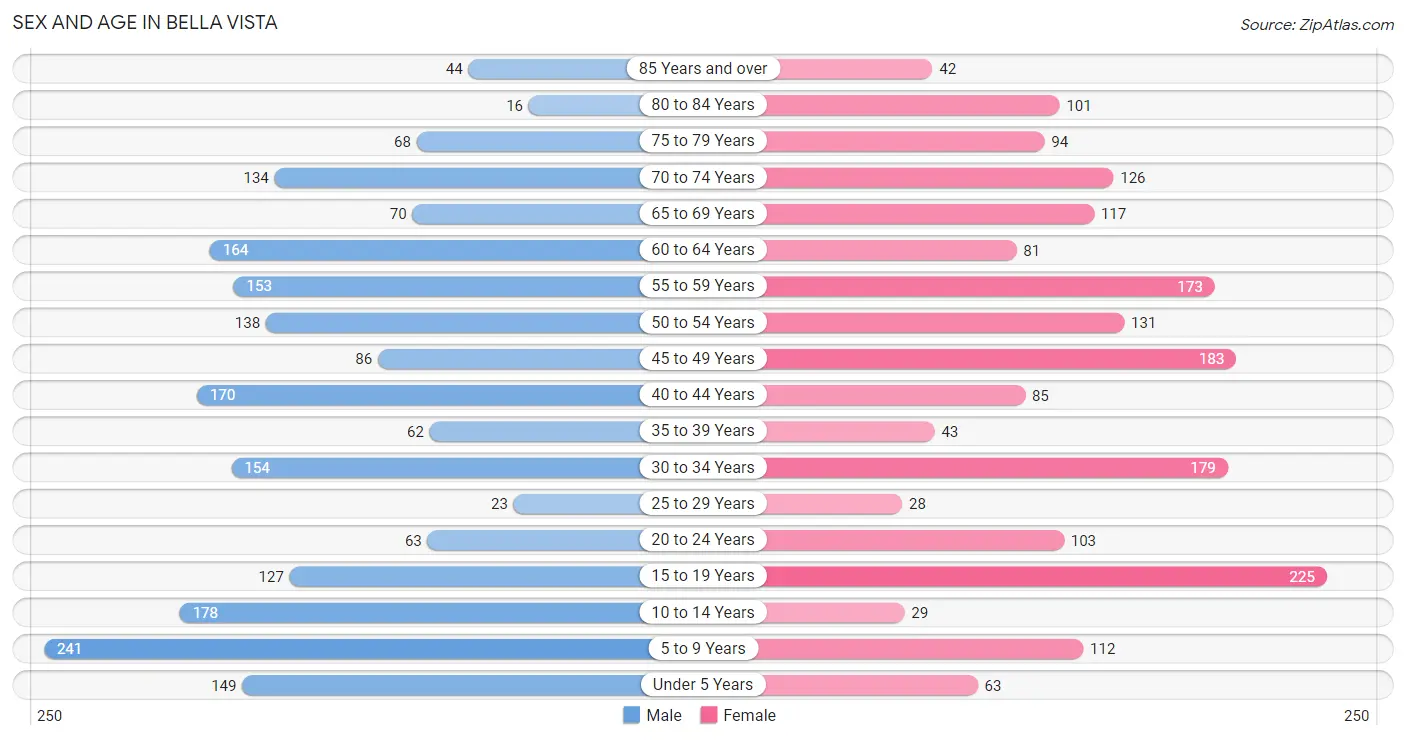
| Age Bracket | Male | Female |
| Under 5 Years | 149 (7.3%) | 63 (3.3%) |
| 5 to 9 Years | 241 (11.8%) | 112 (5.9%) |
| 10 to 14 Years | 178 (8.7%) | 29 (1.5%) |
| 15 to 19 Years | 127 (6.2%) | 225 (11.7%) |
| 20 to 24 Years | 63 (3.1%) | 103 (5.4%) |
| 25 to 29 Years | 23 (1.1%) | 28 (1.5%) |
| 30 to 34 Years | 154 (7.5%) | 179 (9.3%) |
| 35 to 39 Years | 62 (3.0%) | 43 (2.2%) |
| 40 to 44 Years | 170 (8.3%) | 85 (4.4%) |
| 45 to 49 Years | 86 (4.2%) | 183 (9.6%) |
| 50 to 54 Years | 138 (6.8%) | 131 (6.8%) |
| 55 to 59 Years | 153 (7.5%) | 173 (9.0%) |
| 60 to 64 Years | 164 (8.0%) | 81 (4.2%) |
| 65 to 69 Years | 70 (3.4%) | 117 (6.1%) |
| 70 to 74 Years | 134 (6.6%) | 126 (6.6%) |
| 75 to 79 Years | 68 (3.3%) | 94 (4.9%) |
| 80 to 84 Years | 16 (0.8%) | 101 (5.3%) |
| 85 Years and over | 44 (2.2%) | 42 (2.2%) |
| Total | 2,040 (100.0%) | 1,915 (100.0%) |
Families and Households in Bella Vista
Median Family Size in Bella Vista
The median family size in Bella Vista is 3.38 persons per family, with married-couple families (825 | 82.8%) accounting for the largest median family size of 3.51 persons per family. On the other hand, single female/mother families (66 | 6.6%) represent the smallest median family size with 2.33 persons per family.
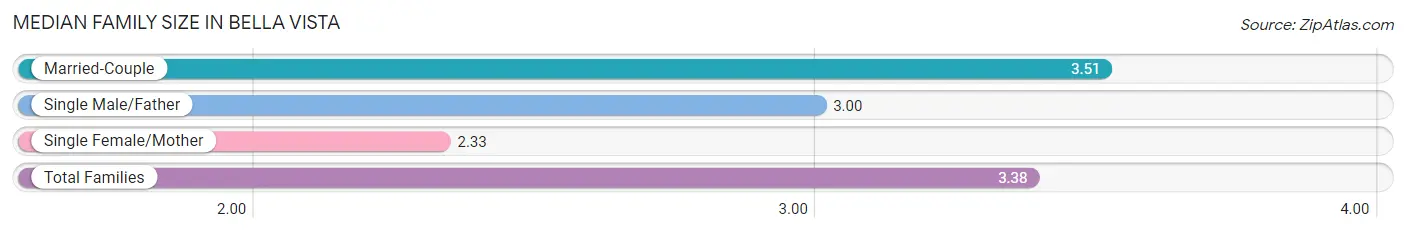
| Family Type | # Families | Family Size |
| Married-Couple | 825 (82.8%) | 3.51 |
| Single Male/Father | 106 (10.6%) | 3.00 |
| Single Female/Mother | 66 (6.6%) | 2.33 |
| Total Families | 997 (100.0%) | 3.38 |
Median Household Size in Bella Vista
The median household size in Bella Vista is 2.94 persons per household, with married-couple households (825 | 61.5%) accounting for the largest median household size of 3.58 persons per household. non-family households (345 | 25.7%) represent the smallest median household size with 1.37 persons per household.
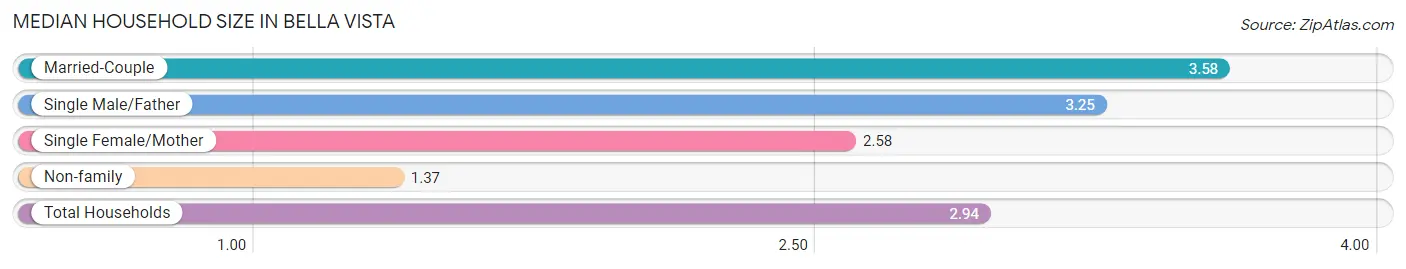
| Household Type | # Households | Household Size |
| Married-Couple | 825 (61.5%) | 3.58 |
| Single Male/Father | 106 (7.9%) | 3.25 |
| Single Female/Mother | 66 (4.9%) | 2.58 |
| Non-family | 345 (25.7%) | 1.37 |
| Total Households | 1,342 (100.0%) | 2.94 |
Household Size by Marriage Status in Bella Vista
Out of a total of 1,342 households in Bella Vista, 997 (74.3%) are family households, while 345 (25.7%) are nonfamily households. The most numerous type of family households are 2-person households, comprising 440, and the most common type of nonfamily households are 1-person households, comprising 236.
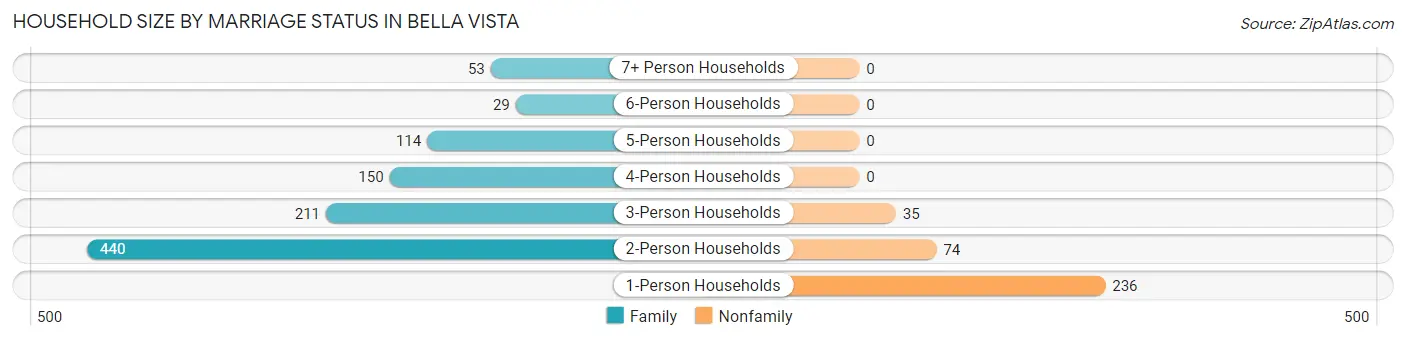
| Household Size | Family Households | Nonfamily Households |
| 1-Person Households | - | 236 (17.6%) |
| 2-Person Households | 440 (32.8%) | 74 (5.5%) |
| 3-Person Households | 211 (15.7%) | 35 (2.6%) |
| 4-Person Households | 150 (11.2%) | 0 (0.0%) |
| 5-Person Households | 114 (8.5%) | 0 (0.0%) |
| 6-Person Households | 29 (2.2%) | 0 (0.0%) |
| 7+ Person Households | 53 (4.0%) | 0 (0.0%) |
| Total | 997 (74.3%) | 345 (25.7%) |
Female Fertility in Bella Vista
Fertility by Age in Bella Vista
Average fertility rate in Bella Vista is 98.0 births per 1,000 women. Women in the age bracket of 20 to 34 years have the highest fertility rate with 235.0 births per 1,000 women. Women in the age bracket of 20 to 34 years acount for 83.0% of all women with births.
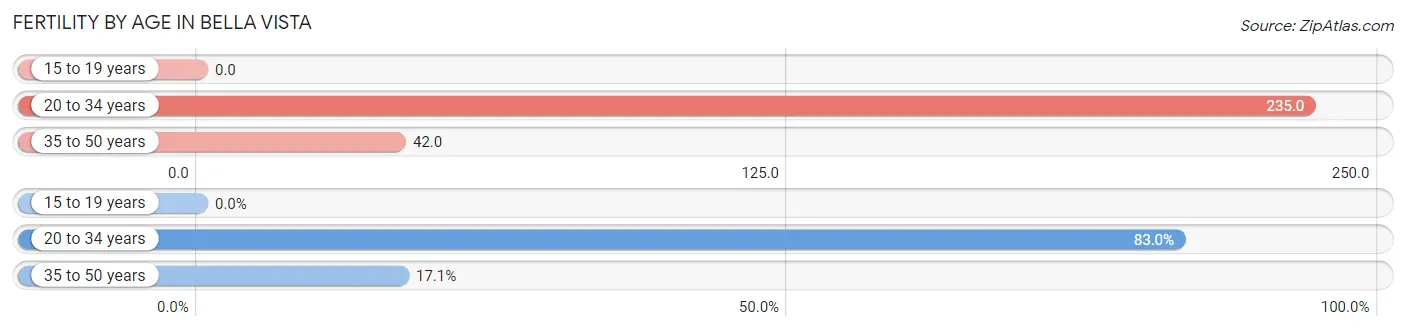
| Age Bracket | Women with Births | Births / 1,000 Women |
| 15 to 19 years | 0 (0.0%) | 0.0 |
| 20 to 34 years | 73 (83.0%) | 235.0 |
| 35 to 50 years | 15 (17.1%) | 42.0 |
| Total | 88 (100.0%) | 98.0 |
Fertility by Age by Marriage Status in Bella Vista
84.1% of women with births (88) in Bella Vista are married. The highest percentage of unmarried women with births falls into 20 to 34 years age bracket with 19.2% of them unmarried at the time of birth, while the lowest percentage of unmarried women with births belong to 35 to 50 years age bracket with 0.0% of them unmarried.
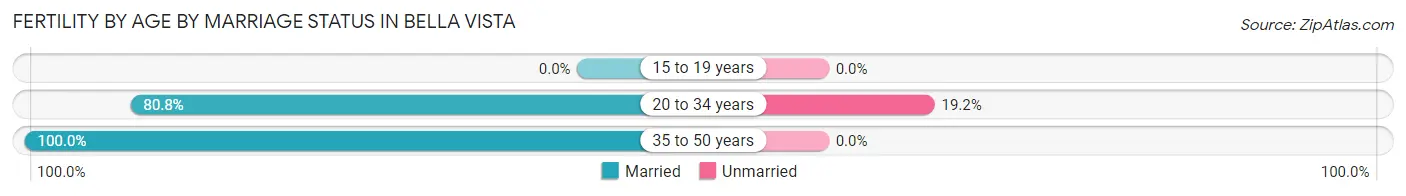
| Age Bracket | Married | Unmarried |
| 15 to 19 years | 0 (0.0%) | 0 (0.0%) |
| 20 to 34 years | 59 (80.8%) | 14 (19.2%) |
| 35 to 50 years | 15 (100.0%) | 0 (0.0%) |
| Total | 74 (84.1%) | 14 (15.9%) |
Fertility by Education in Bella Vista
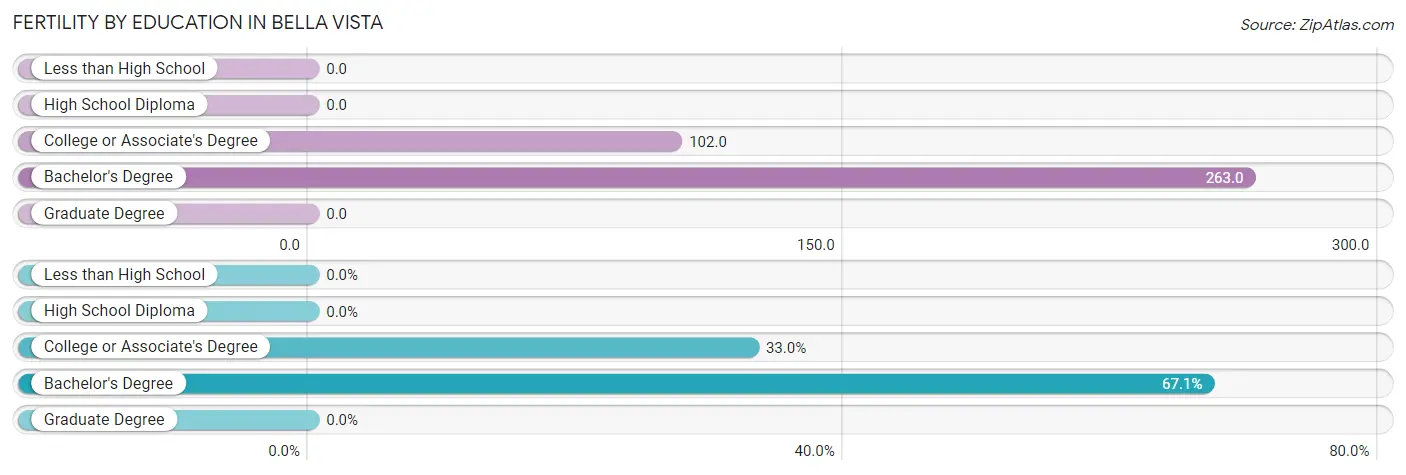
| Educational Attainment | Women with Births | Births / 1,000 Women |
| Less than High School | 0 (0.0%) | 0.0 |
| High School Diploma | 0 (0.0%) | 0.0 |
| College or Associate's Degree | 29 (33.0%) | 102.0 |
| Bachelor's Degree | 59 (67.0%) | 263.0 |
| Graduate Degree | 0 (0.0%) | 0.0 |
| Total | 88 (100.0%) | 98.0 |
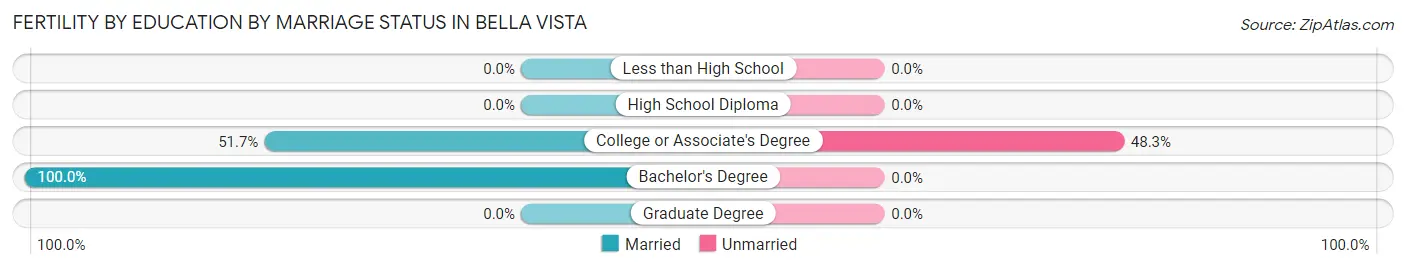
Fertility by Education by Marriage Status in Bella Vista
15.9% of women with births in Bella Vista are unmarried. Women with the educational attainment of bachelor's degree are most likely to be married with 100.0% of them married at childbirth, while women with the educational attainment of college or associate's degree are least likely to be married with 48.3% of them unmarried at childbirth.
| Educational Attainment | Married | Unmarried |
| Less than High School | 0 (0.0%) | 0 (0.0%) |
| High School Diploma | 0 (0.0%) | 0 (0.0%) |
| College or Associate's Degree | 15 (51.7%) | 14 (48.3%) |
| Bachelor's Degree | 59 (100.0%) | 0 (0.0%) |
| Graduate Degree | 0 (0.0%) | 0 (0.0%) |
| Total | 74 (84.1%) | 14 (15.9%) |
Employment Characteristics in Bella Vista
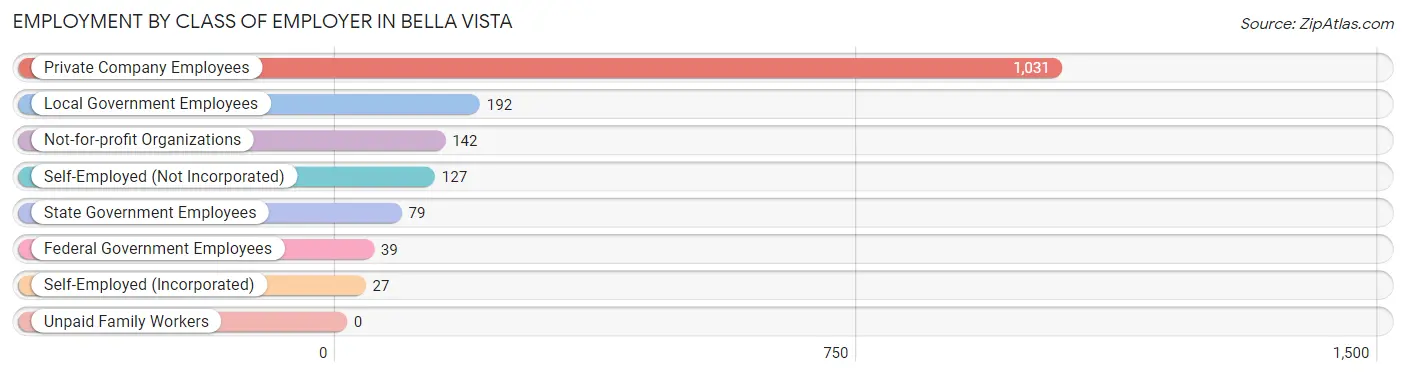
Employment by Class of Employer in Bella Vista
Among the 1,637 employed individuals in Bella Vista, private company employees (1,031 | 63.0%), local government employees (192 | 11.7%), and not-for-profit organizations (142 | 8.7%) make up the most common classes of employment.
| Employer Class | # Employees | % Employees |
| Private Company Employees | 1,031 | 63.0% |
| Self-Employed (Incorporated) | 27 | 1.7% |
| Self-Employed (Not Incorporated) | 127 | 7.8% |
| Not-for-profit Organizations | 142 | 8.7% |
| Local Government Employees | 192 | 11.7% |
| State Government Employees | 79 | 4.8% |
| Federal Government Employees | 39 | 2.4% |
| Unpaid Family Workers | 0 | 0.0% |
| Total | 1,637 | 100.0% |
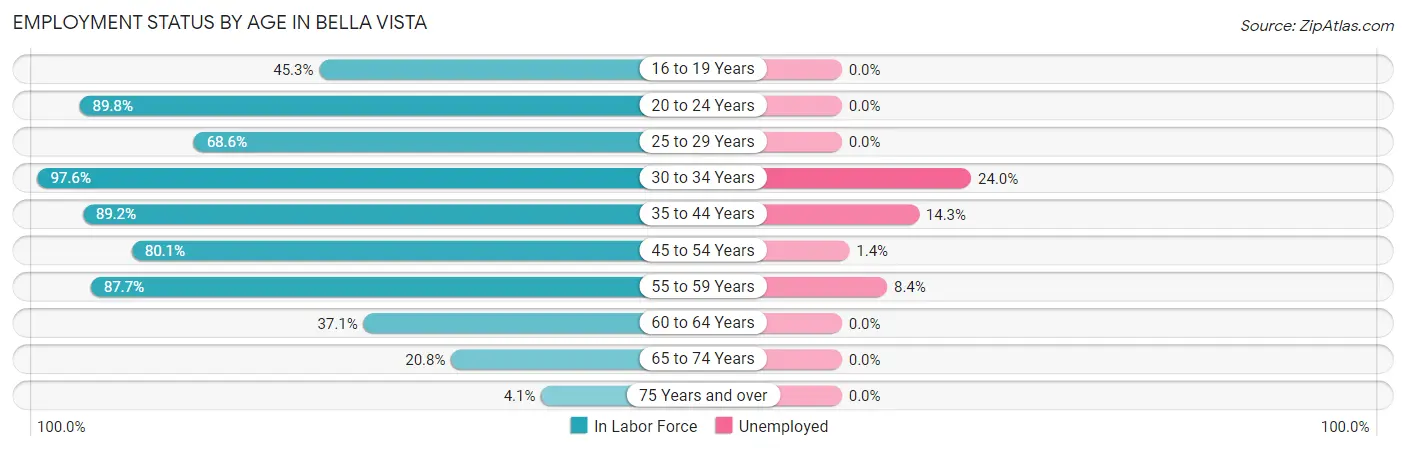
Employment Status by Age in Bella Vista
According to the labor force statistics for Bella Vista, out of the total population over 16 years of age (3,034), 60.6% or 1,839 individuals are in the labor force, with 8.4% or 154 of them unemployed. The age group with the highest labor force participation rate is 30 to 34 years, with 97.6% or 325 individuals in the labor force. Within the labor force, the 30 to 34 years age range has the highest percentage of unemployed individuals, with 24.0% or 78 of them being unemployed.
| Age Bracket | In Labor Force | Unemployed |
| 16 to 19 Years | 92 (45.3%) | 0 (0.0%) |
| 20 to 24 Years | 149 (89.8%) | 0 (0.0%) |
| 25 to 29 Years | 35 (68.6%) | 0 (0.0%) |
| 30 to 34 Years | 325 (97.6%) | 78 (24.0%) |
| 35 to 44 Years | 321 (89.2%) | 46 (14.3%) |
| 45 to 54 Years | 431 (80.1%) | 6 (1.4%) |
| 55 to 59 Years | 286 (87.7%) | 24 (8.4%) |
| 60 to 64 Years | 91 (37.1%) | 0 (0.0%) |
| 65 to 74 Years | 93 (20.8%) | 0 (0.0%) |
| 75 Years and over | 15 (4.1%) | 0 (0.0%) |
| Total | 1,839 (60.6%) | 154 (8.4%) |
Employment Status by Educational Attainment in Bella Vista
According to labor force statistics for Bella Vista, 80.4% of individuals (1,490) out of the total population between 25 and 64 years of age (1,853) are in the labor force, with 10.3% or 153 of them being unemployed. The group with the highest labor force participation rate are those with the educational attainment of bachelor's degree or higher, with 86.8% or 501 individuals in the labor force. Within the labor force, individuals with high school diploma education have the highest percentage of unemployment, with 25.0% or 60 of them being unemployed.

| Educational Attainment | In Labor Force | Unemployed |
| Less than High School | 89 (72.4%) | 0 (0.0%) |
| High School Diploma | 240 (75.2%) | 80 (25.0%) |
| College / Associate Degree | 659 (79.0%) | 119 (14.3%) |
| Bachelor's Degree or higher | 501 (86.8%) | 0 (0.0%) |
| Total | 1,490 (80.4%) | 191 (10.3%) |
Employment Occupations by Sex in Bella Vista
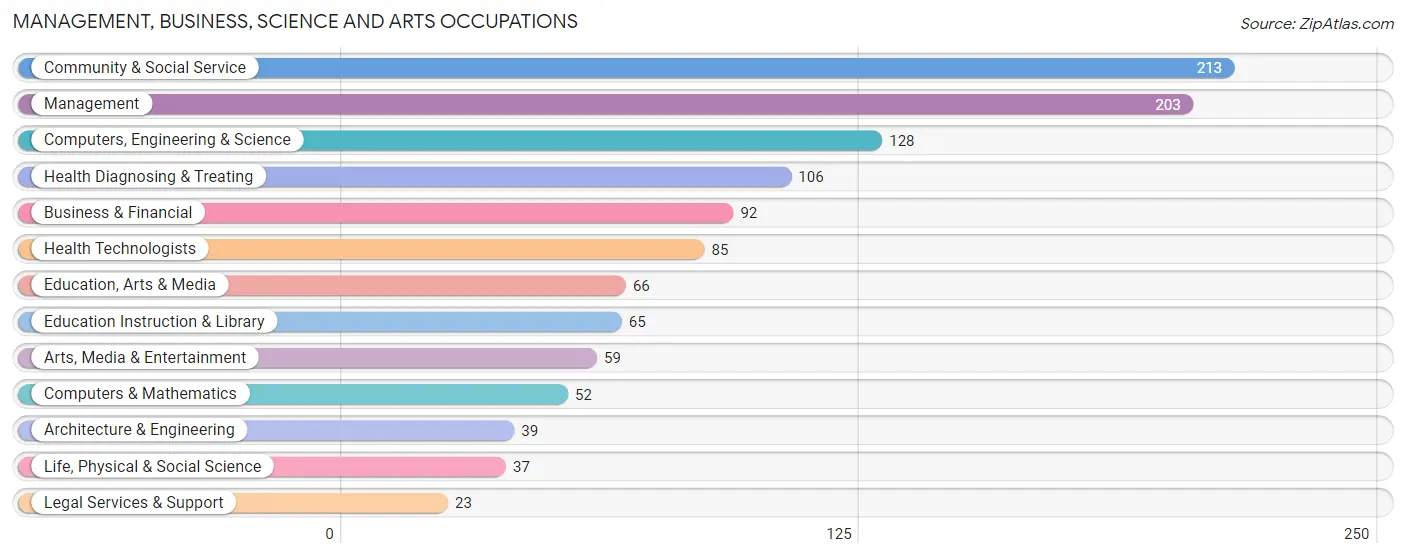
Management, Business, Science and Arts Occupations
The most common Management, Business, Science and Arts occupations in Bella Vista are Community & Social Service (213 | 12.7%), Management (203 | 12.0%), Computers, Engineering & Science (128 | 7.6%), Health Diagnosing & Treating (106 | 6.3%), and Business & Financial (92 | 5.5%).
Management, Business, Science and Arts Occupations by Sex
Within the Management, Business, Science and Arts occupations in Bella Vista, the most male-oriented occupations are Computers & Mathematics (90.4%), Computers, Engineering & Science (79.7%), and Architecture & Engineering (74.4%), while the most female-oriented occupations are Legal Services & Support (100.0%), Education, Arts & Media (95.5%), and Health Diagnosing & Treating (94.3%).
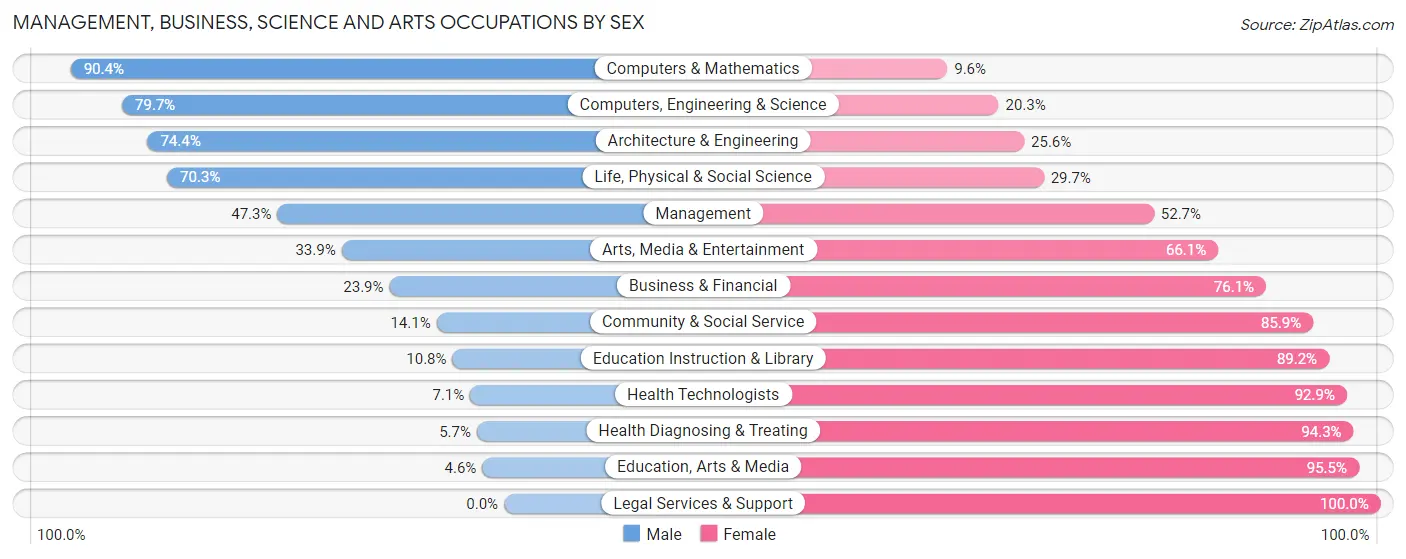
| Occupation | Male | Female |
| Management | 96 (47.3%) | 107 (52.7%) |
| Business & Financial | 22 (23.9%) | 70 (76.1%) |
| Computers, Engineering & Science | 102 (79.7%) | 26 (20.3%) |
| Computers & Mathematics | 47 (90.4%) | 5 (9.6%) |
| Architecture & Engineering | 29 (74.4%) | 10 (25.6%) |
| Life, Physical & Social Science | 26 (70.3%) | 11 (29.7%) |
| Community & Social Service | 30 (14.1%) | 183 (85.9%) |
| Education, Arts & Media | 3 (4.5%) | 63 (95.5%) |
| Legal Services & Support | 0 (0.0%) | 23 (100.0%) |
| Education Instruction & Library | 7 (10.8%) | 58 (89.2%) |
| Arts, Media & Entertainment | 20 (33.9%) | 39 (66.1%) |
| Health Diagnosing & Treating | 6 (5.7%) | 100 (94.3%) |
| Health Technologists | 6 (7.1%) | 79 (92.9%) |
| Total (Category) | 256 (34.5%) | 486 (65.5%) |
| Total (Overall) | 777 (46.1%) | 907 (53.9%) |
Services Occupations
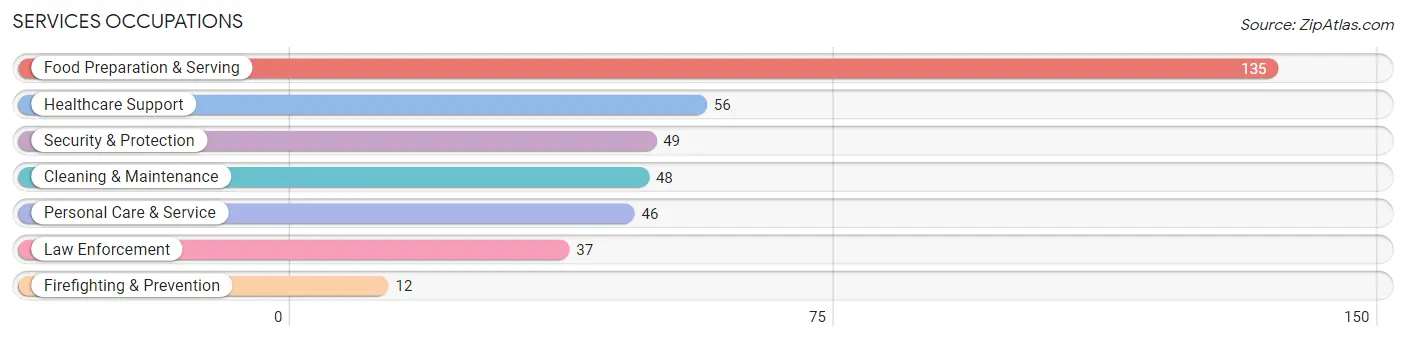
The most common Services occupations in Bella Vista are Food Preparation & Serving (135 | 8.0%), Healthcare Support (56 | 3.3%), Security & Protection (49 | 2.9%), Cleaning & Maintenance (48 | 2.9%), and Personal Care & Service (46 | 2.7%).
Services Occupations by Sex
Within the Services occupations in Bella Vista, the most male-oriented occupations are Law Enforcement (100.0%), Security & Protection (95.9%), and Firefighting & Prevention (83.3%), while the most female-oriented occupations are Healthcare Support (100.0%), Food Preparation & Serving (77.8%), and Personal Care & Service (76.1%).
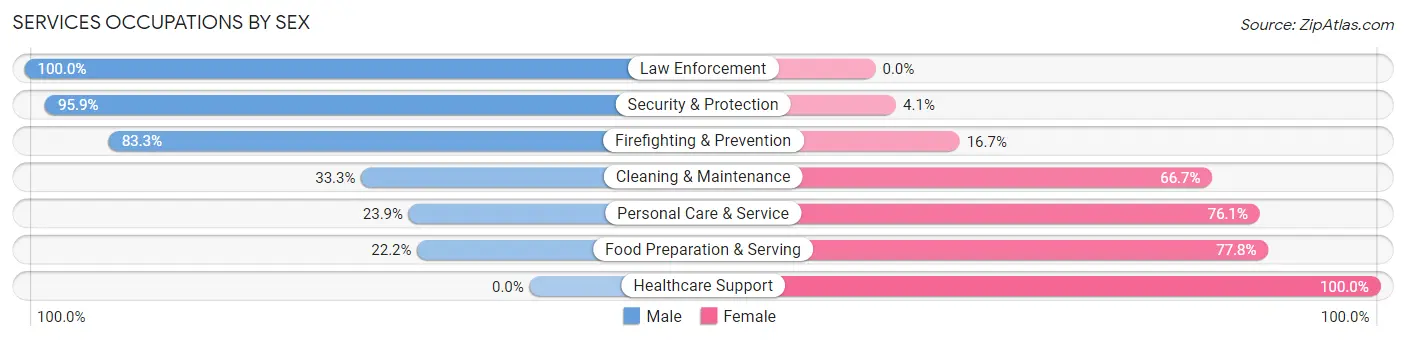
| Occupation | Male | Female |
| Healthcare Support | 0 (0.0%) | 56 (100.0%) |
| Security & Protection | 47 (95.9%) | 2 (4.1%) |
| Firefighting & Prevention | 10 (83.3%) | 2 (16.7%) |
| Law Enforcement | 37 (100.0%) | 0 (0.0%) |
| Food Preparation & Serving | 30 (22.2%) | 105 (77.8%) |
| Cleaning & Maintenance | 16 (33.3%) | 32 (66.7%) |
| Personal Care & Service | 11 (23.9%) | 35 (76.1%) |
| Total (Category) | 104 (31.1%) | 230 (68.9%) |
| Total (Overall) | 777 (46.1%) | 907 (53.9%) |
Sales and Office Occupations
The most common Sales and Office occupations in Bella Vista are Office & Administration (138 | 8.2%), and Sales & Related (85 | 5.1%).

Sales and Office Occupations by Sex

| Occupation | Male | Female |
| Sales & Related | 33 (38.8%) | 52 (61.2%) |
| Office & Administration | 44 (31.9%) | 94 (68.1%) |
| Total (Category) | 77 (34.5%) | 146 (65.5%) |
| Total (Overall) | 777 (46.1%) | 907 (53.9%) |
Natural Resources, Construction and Maintenance Occupations
The most common Natural Resources, Construction and Maintenance occupations in Bella Vista are Construction & Extraction (118 | 7.0%), Installation, Maintenance & Repair (87 | 5.2%), and Farming, Fishing & Forestry (30 | 1.8%).

Natural Resources, Construction and Maintenance Occupations by Sex

| Occupation | Male | Female |
| Farming, Fishing & Forestry | 30 (100.0%) | 0 (0.0%) |
| Construction & Extraction | 118 (100.0%) | 0 (0.0%) |
| Installation, Maintenance & Repair | 87 (100.0%) | 0 (0.0%) |
| Total (Category) | 235 (100.0%) | 0 (0.0%) |
| Total (Overall) | 777 (46.1%) | 907 (53.9%) |
Production, Transportation and Moving Occupations
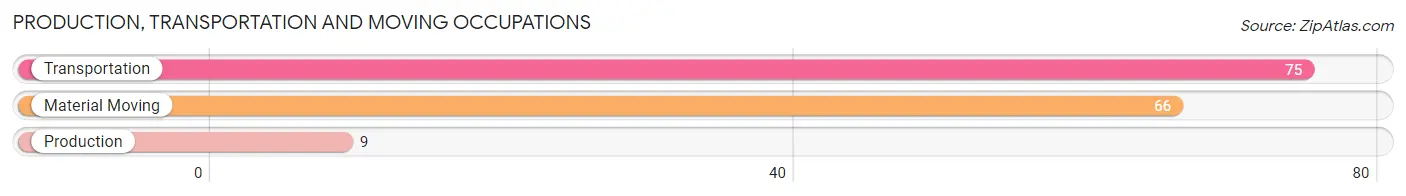
The most common Production, Transportation and Moving occupations in Bella Vista are Transportation (75 | 4.4%), Material Moving (66 | 3.9%), and Production (9 | 0.5%).
Production, Transportation and Moving Occupations by Sex

| Occupation | Male | Female |
| Production | 9 (100.0%) | 0 (0.0%) |
| Transportation | 75 (100.0%) | 0 (0.0%) |
| Material Moving | 21 (31.8%) | 45 (68.2%) |
| Total (Category) | 105 (70.0%) | 45 (30.0%) |
| Total (Overall) | 777 (46.1%) | 907 (53.9%) |
Employment Industries by Sex in Bella Vista
Employment Industries in Bella Vista
The major employment industries in Bella Vista include Health Care & Social Assistance (313 | 18.6%), Public Administration (192 | 11.4%), Retail Trade (190 | 11.3%), Accommodation & Food Services (187 | 11.1%), and Construction (168 | 10.0%).
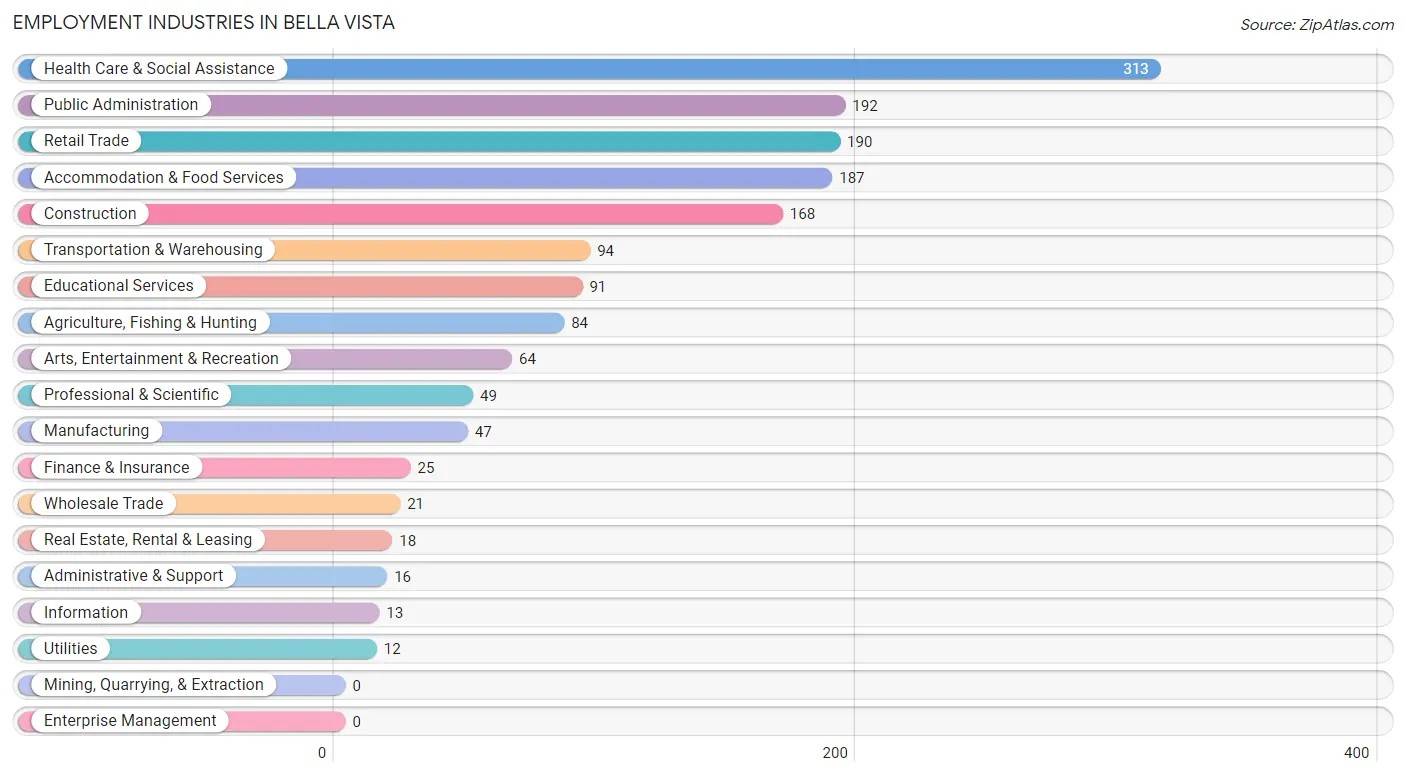
Employment Industries by Sex in Bella Vista
The Bella Vista industries that see more men than women are Wholesale Trade (100.0%), Administrative & Support (100.0%), and Construction (97.0%), whereas the industries that tend to have a higher number of women are Real Estate, Rental & Leasing (100.0%), Arts, Entertainment & Recreation (90.6%), and Health Care & Social Assistance (83.1%).

| Industry | Male | Female |
| Agriculture, Fishing & Hunting | 80 (95.2%) | 4 (4.8%) |
| Mining, Quarrying, & Extraction | 0 (0.0%) | 0 (0.0%) |
| Construction | 163 (97.0%) | 5 (3.0%) |
| Manufacturing | 44 (93.6%) | 3 (6.4%) |
| Wholesale Trade | 21 (100.0%) | 0 (0.0%) |
| Retail Trade | 33 (17.4%) | 157 (82.6%) |
| Transportation & Warehousing | 50 (53.2%) | 44 (46.8%) |
| Utilities | 6 (50.0%) | 6 (50.0%) |
| Information | 8 (61.5%) | 5 (38.5%) |
| Finance & Insurance | 20 (80.0%) | 5 (20.0%) |
| Real Estate, Rental & Leasing | 0 (0.0%) | 18 (100.0%) |
| Professional & Scientific | 36 (73.5%) | 13 (26.5%) |
| Enterprise Management | 0 (0.0%) | 0 (0.0%) |
| Administrative & Support | 16 (100.0%) | 0 (0.0%) |
| Educational Services | 24 (26.4%) | 67 (73.6%) |
| Health Care & Social Assistance | 53 (16.9%) | 260 (83.1%) |
| Arts, Entertainment & Recreation | 6 (9.4%) | 58 (90.6%) |
| Accommodation & Food Services | 63 (33.7%) | 124 (66.3%) |
| Public Administration | 79 (41.1%) | 113 (58.9%) |
| Total | 777 (46.1%) | 907 (53.9%) |
Education in Bella Vista
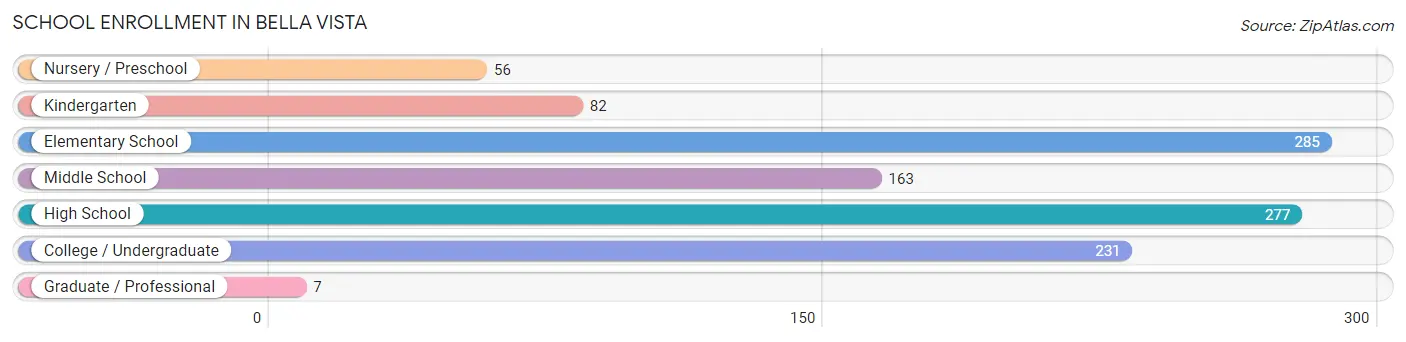
School Enrollment in Bella Vista
The most common levels of schooling among the 1,101 students in Bella Vista are elementary school (285 | 25.9%), high school (277 | 25.2%), and college / undergraduate (231 | 21.0%).
| School Level | # Students | % Students |
| Nursery / Preschool | 56 | 5.1% |
| Kindergarten | 82 | 7.4% |
| Elementary School | 285 | 25.9% |
| Middle School | 163 | 14.8% |
| High School | 277 | 25.2% |
| College / Undergraduate | 231 | 21.0% |
| Graduate / Professional | 7 | 0.6% |
| Total | 1,101 | 100.0% |
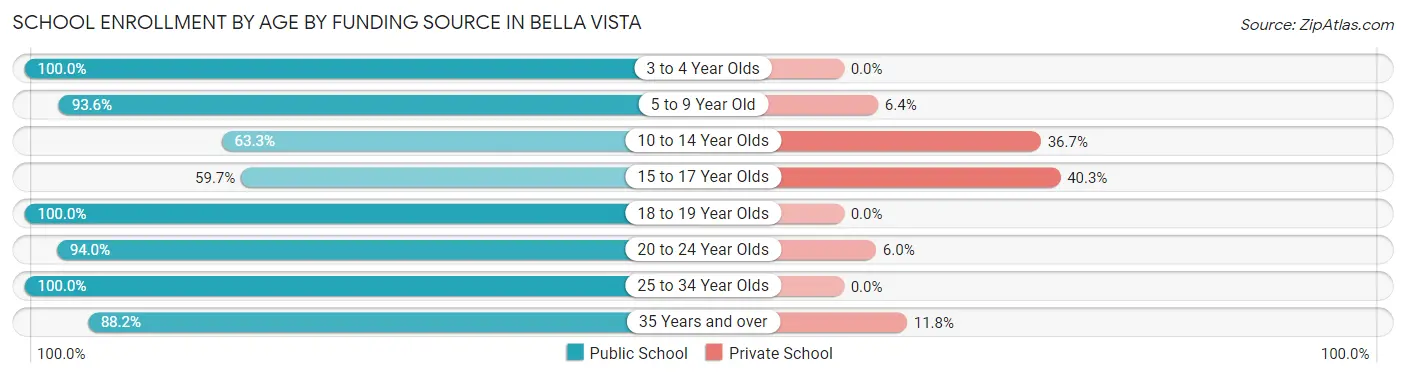
School Enrollment by Age by Funding Source in Bella Vista
Out of a total of 1,101 students who are enrolled in schools in Bella Vista, 206 (18.7%) attend a private institution, while the remaining 895 (81.3%) are enrolled in public schools. The age group of 15 to 17 year olds has the highest likelihood of being enrolled in private schools, with 98 (40.3% in the age bracket) enrolled. Conversely, the age group of 3 to 4 year olds has the lowest likelihood of being enrolled in a private school, with 56 (100.0% in the age bracket) attending a public institution.
| Age Bracket | Public School | Private School |
| 3 to 4 Year Olds | 56 (100.0%) | 0 (0.0%) |
| 5 to 9 Year Old | 323 (93.6%) | 22 (6.4%) |
| 10 to 14 Year Olds | 131 (63.3%) | 76 (36.7%) |
| 15 to 17 Year Olds | 145 (59.7%) | 98 (40.3%) |
| 18 to 19 Year Olds | 61 (100.0%) | 0 (0.0%) |
| 20 to 24 Year Olds | 94 (94.0%) | 6 (6.0%) |
| 25 to 34 Year Olds | 55 (100.0%) | 0 (0.0%) |
| 35 Years and over | 30 (88.2%) | 4 (11.8%) |
| Total | 895 (81.3%) | 206 (18.7%) |
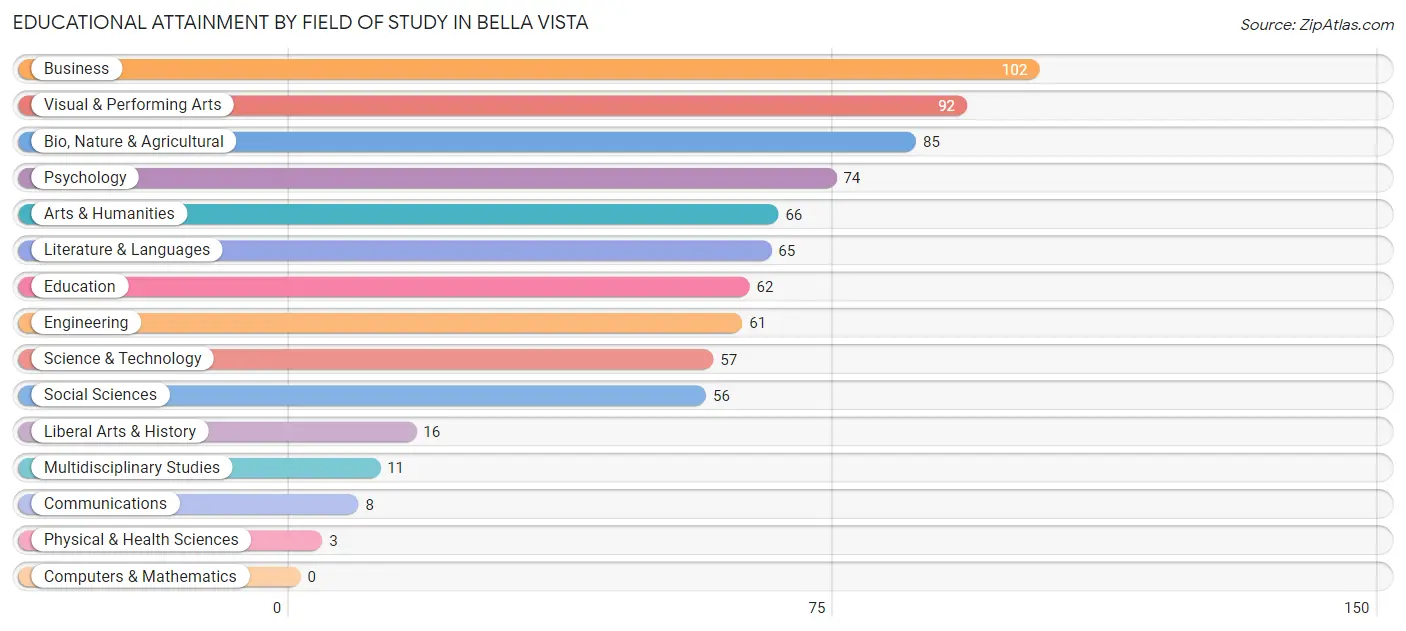
Educational Attainment by Field of Study in Bella Vista
Business (102 | 13.5%), visual & performing arts (92 | 12.1%), bio, nature & agricultural (85 | 11.2%), psychology (74 | 9.8%), and arts & humanities (66 | 8.7%) are the most common fields of study among 758 individuals in Bella Vista who have obtained a bachelor's degree or higher.
| Field of Study | # Graduates | % Graduates |
| Computers & Mathematics | 0 | 0.0% |
| Bio, Nature & Agricultural | 85 | 11.2% |
| Physical & Health Sciences | 3 | 0.4% |
| Psychology | 74 | 9.8% |
| Social Sciences | 56 | 7.4% |
| Engineering | 61 | 8.1% |
| Multidisciplinary Studies | 11 | 1.5% |
| Science & Technology | 57 | 7.5% |
| Business | 102 | 13.5% |
| Education | 62 | 8.2% |
| Literature & Languages | 65 | 8.6% |
| Liberal Arts & History | 16 | 2.1% |
| Visual & Performing Arts | 92 | 12.1% |
| Communications | 8 | 1.1% |
| Arts & Humanities | 66 | 8.7% |
| Total | 758 | 100.0% |
Transportation & Commute in Bella Vista
Vehicle Availability by Sex in Bella Vista
The most prevalent vehicle ownership categories in Bella Vista are males with 4 vehicles (202, accounting for 27.8%) and females with 4 vehicles (273, making up 22.4%).
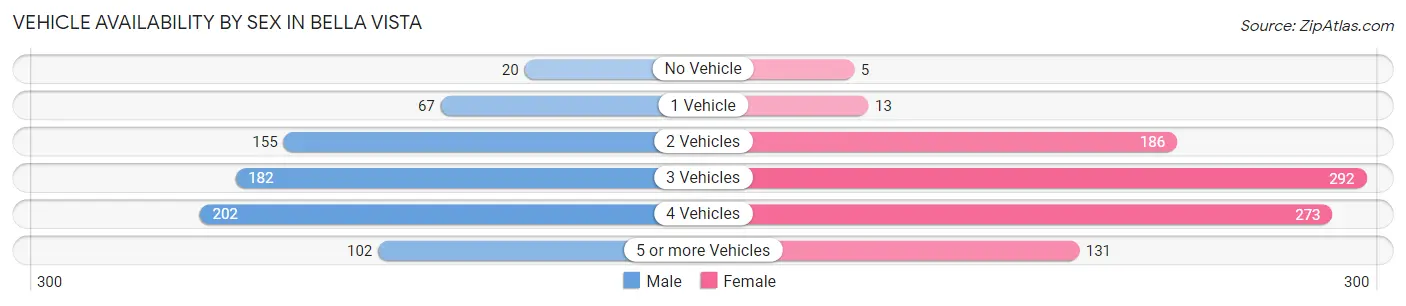
| Vehicles Available | Male | Female |
| No Vehicle | 20 (2.8%) | 5 (0.6%) |
| 1 Vehicle | 67 (9.2%) | 13 (1.4%) |
| 2 Vehicles | 155 (21.3%) | 186 (20.7%) |
| 3 Vehicles | 182 (25.0%) | 292 (32.4%) |
| 4 Vehicles | 202 (27.8%) | 273 (30.3%) |
| 5 or more Vehicles | 102 (14.0%) | 131 (14.6%) |
| Total | 728 (100.0%) | 900 (100.0%) |
Commute Time in Bella Vista
The most frequently occuring commute durations in Bella Vista are 15 to 19 minutes (518 commuters, 33.8%), 20 to 24 minutes (473 commuters, 30.9%), and 10 to 14 minutes (233 commuters, 15.2%).
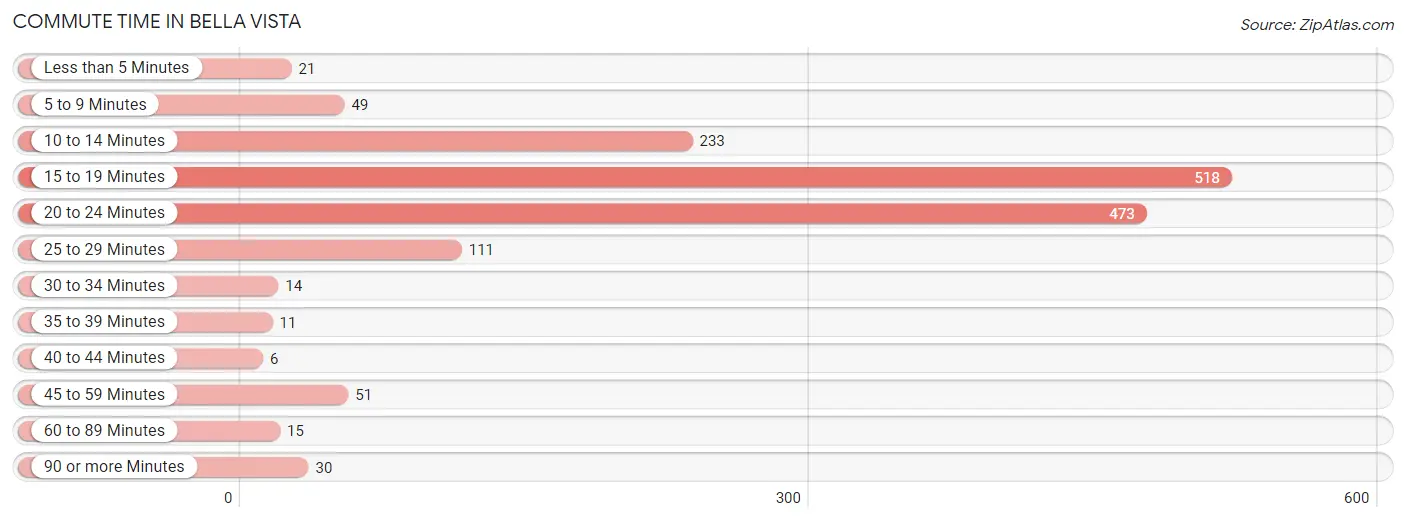
| Commute Time | # Commuters | % Commuters |
| Less than 5 Minutes | 21 | 1.4% |
| 5 to 9 Minutes | 49 | 3.2% |
| 10 to 14 Minutes | 233 | 15.2% |
| 15 to 19 Minutes | 518 | 33.8% |
| 20 to 24 Minutes | 473 | 30.9% |
| 25 to 29 Minutes | 111 | 7.2% |
| 30 to 34 Minutes | 14 | 0.9% |
| 35 to 39 Minutes | 11 | 0.7% |
| 40 to 44 Minutes | 6 | 0.4% |
| 45 to 59 Minutes | 51 | 3.3% |
| 60 to 89 Minutes | 15 | 1.0% |
| 90 or more Minutes | 30 | 2.0% |
Commute Time by Sex in Bella Vista
The most common commute times in Bella Vista are 15 to 19 minutes (232 commuters, 34.2%) for males and 20 to 24 minutes (307 commuters, 35.9%) for females.
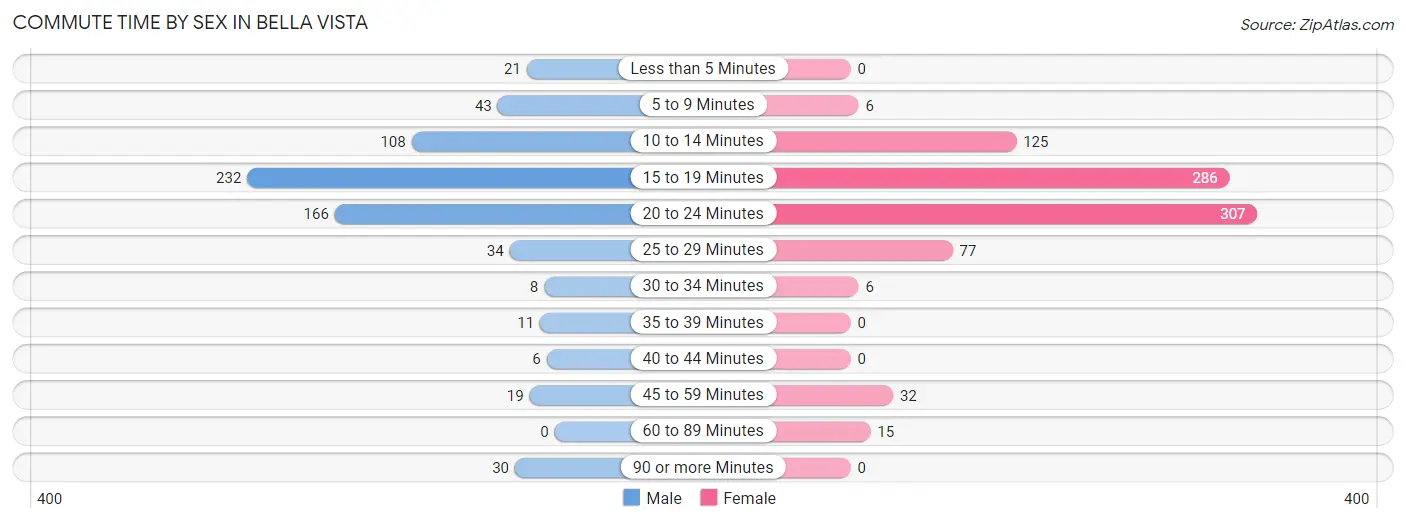
| Commute Time | Male | Female |
| Less than 5 Minutes | 21 (3.1%) | 0 (0.0%) |
| 5 to 9 Minutes | 43 (6.3%) | 6 (0.7%) |
| 10 to 14 Minutes | 108 (15.9%) | 125 (14.6%) |
| 15 to 19 Minutes | 232 (34.2%) | 286 (33.5%) |
| 20 to 24 Minutes | 166 (24.5%) | 307 (35.9%) |
| 25 to 29 Minutes | 34 (5.0%) | 77 (9.0%) |
| 30 to 34 Minutes | 8 (1.2%) | 6 (0.7%) |
| 35 to 39 Minutes | 11 (1.6%) | 0 (0.0%) |
| 40 to 44 Minutes | 6 (0.9%) | 0 (0.0%) |
| 45 to 59 Minutes | 19 (2.8%) | 32 (3.7%) |
| 60 to 89 Minutes | 0 (0.0%) | 15 (1.8%) |
| 90 or more Minutes | 30 (4.4%) | 0 (0.0%) |
Time of Departure to Work by Sex in Bella Vista
The most frequent times of departure to work in Bella Vista are 7:00 AM to 7:29 AM (175, 25.8%) for males and 7:00 AM to 7:29 AM (247, 28.9%) for females.
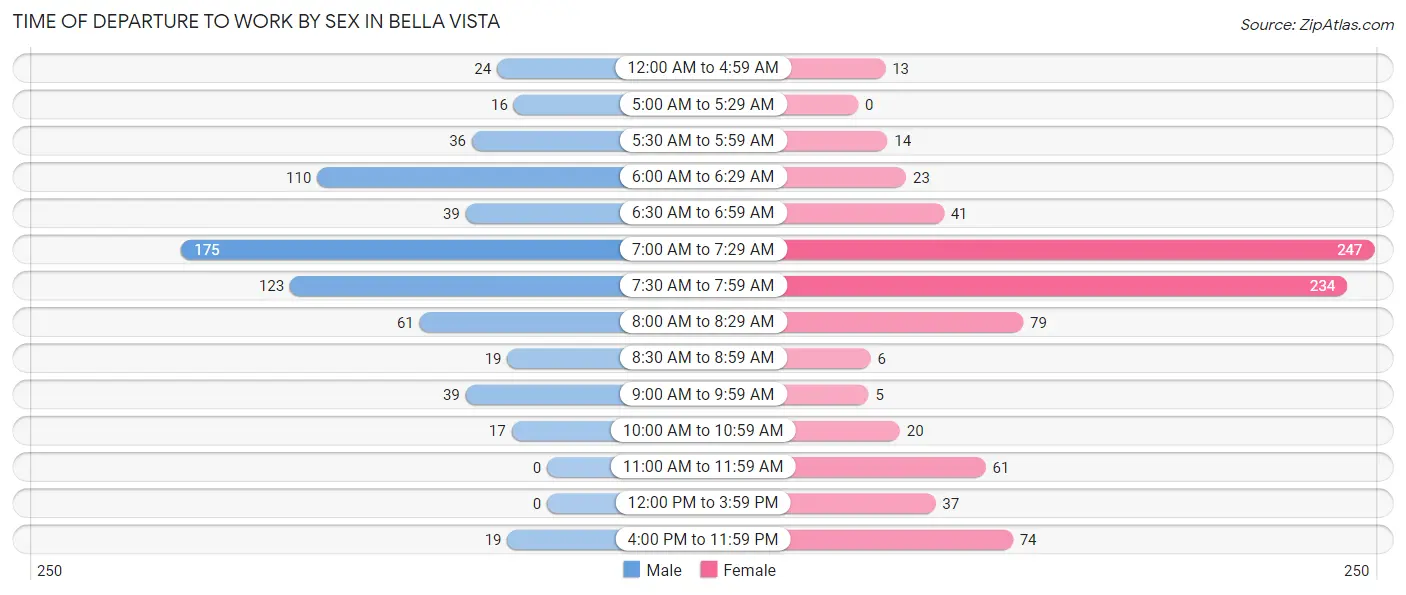
| Time of Departure | Male | Female |
| 12:00 AM to 4:59 AM | 24 (3.5%) | 13 (1.5%) |
| 5:00 AM to 5:29 AM | 16 (2.4%) | 0 (0.0%) |
| 5:30 AM to 5:59 AM | 36 (5.3%) | 14 (1.6%) |
| 6:00 AM to 6:29 AM | 110 (16.2%) | 23 (2.7%) |
| 6:30 AM to 6:59 AM | 39 (5.8%) | 41 (4.8%) |
| 7:00 AM to 7:29 AM | 175 (25.8%) | 247 (28.9%) |
| 7:30 AM to 7:59 AM | 123 (18.1%) | 234 (27.4%) |
| 8:00 AM to 8:29 AM | 61 (9.0%) | 79 (9.2%) |
| 8:30 AM to 8:59 AM | 19 (2.8%) | 6 (0.7%) |
| 9:00 AM to 9:59 AM | 39 (5.8%) | 5 (0.6%) |
| 10:00 AM to 10:59 AM | 17 (2.5%) | 20 (2.3%) |
| 11:00 AM to 11:59 AM | 0 (0.0%) | 61 (7.1%) |
| 12:00 PM to 3:59 PM | 0 (0.0%) | 37 (4.3%) |
| 4:00 PM to 11:59 PM | 19 (2.8%) | 74 (8.7%) |
| Total | 678 (100.0%) | 854 (100.0%) |
Housing Occupancy in Bella Vista
Occupancy by Ownership in Bella Vista
Of the total 1,342 dwellings in Bella Vista, owner-occupied units account for 1,149 (85.6%), while renter-occupied units make up 193 (14.4%).
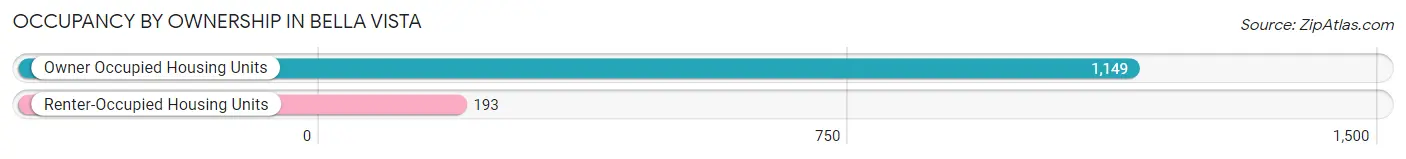
| Occupancy | # Housing Units | % Housing Units |
| Owner Occupied Housing Units | 1,149 | 85.6% |
| Renter-Occupied Housing Units | 193 | 14.4% |
| Total Occupied Housing Units | 1,342 | 100.0% |
Occupancy by Household Size in Bella Vista
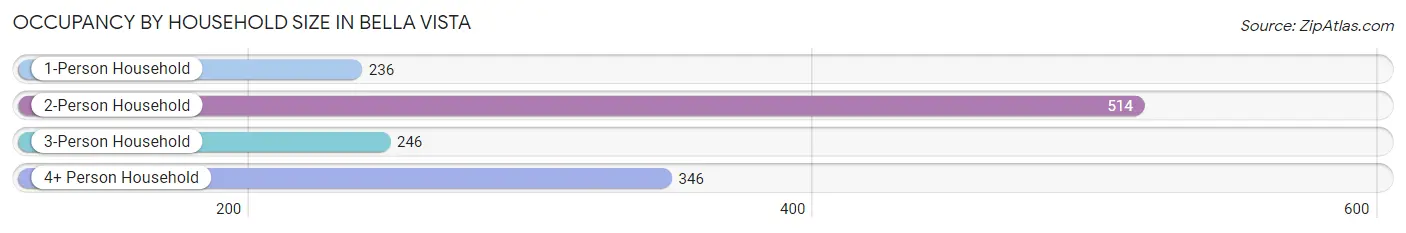
| Household Size | # Housing Units | % Housing Units |
| 1-Person Household | 236 | 17.6% |
| 2-Person Household | 514 | 38.3% |
| 3-Person Household | 246 | 18.3% |
| 4+ Person Household | 346 | 25.8% |
| Total Housing Units | 1,342 | 100.0% |
Occupancy by Ownership by Household Size in Bella Vista
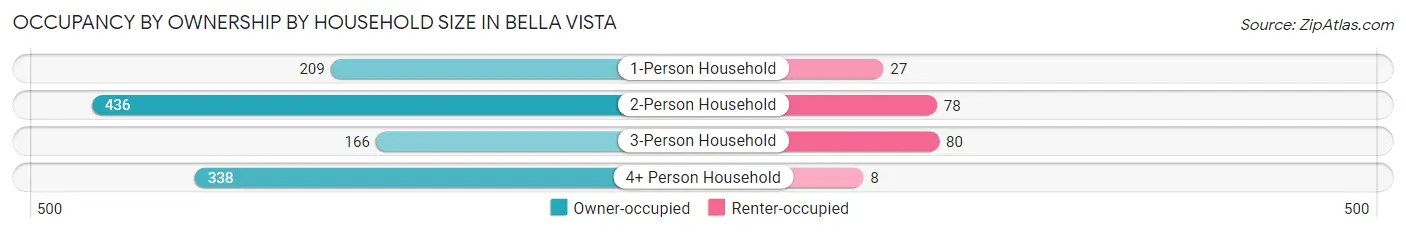
| Household Size | Owner-occupied | Renter-occupied |
| 1-Person Household | 209 (88.6%) | 27 (11.4%) |
| 2-Person Household | 436 (84.8%) | 78 (15.2%) |
| 3-Person Household | 166 (67.5%) | 80 (32.5%) |
| 4+ Person Household | 338 (97.7%) | 8 (2.3%) |
| Total Housing Units | 1,149 (85.6%) | 193 (14.4%) |
Occupancy by Educational Attainment in Bella Vista
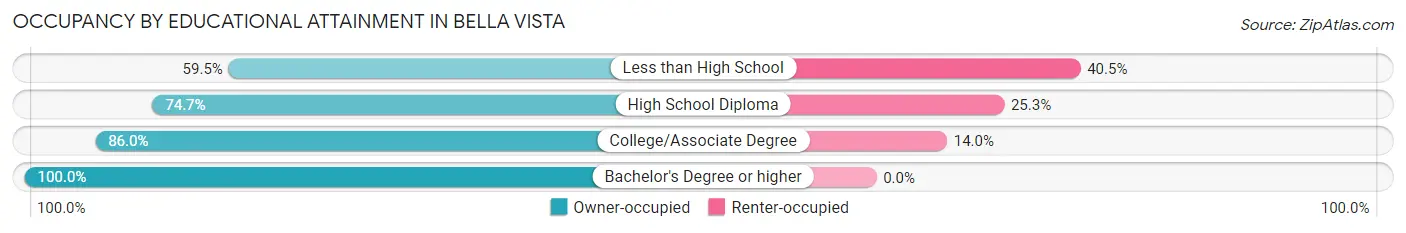
| Household Size | Owner-occupied | Renter-occupied |
| Less than High School | 78 (59.5%) | 53 (40.5%) |
| High School Diploma | 165 (74.7%) | 56 (25.3%) |
| College/Associate Degree | 516 (86.0%) | 84 (14.0%) |
| Bachelor's Degree or higher | 390 (100.0%) | 0 (0.0%) |
Occupancy by Age of Householder in Bella Vista
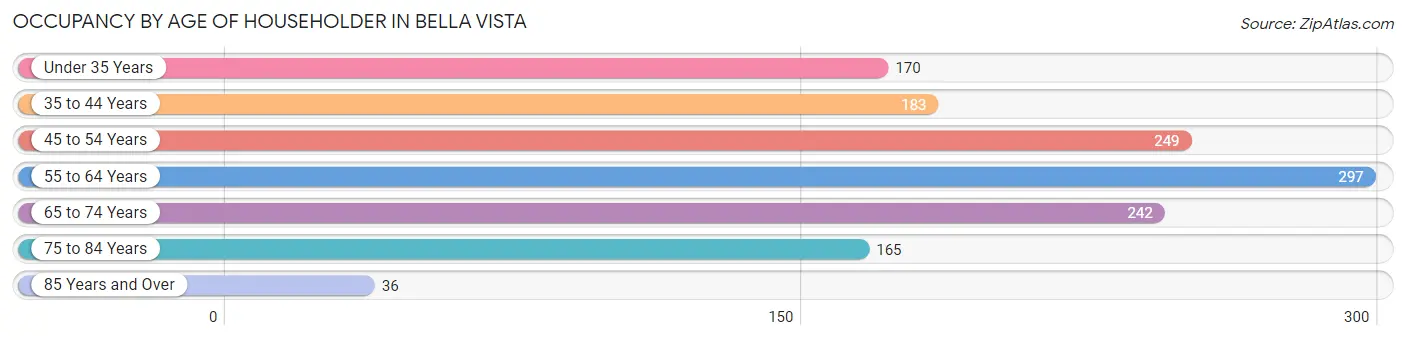
| Age Bracket | # Households | % Households |
| Under 35 Years | 170 | 12.7% |
| 35 to 44 Years | 183 | 13.6% |
| 45 to 54 Years | 249 | 18.5% |
| 55 to 64 Years | 297 | 22.1% |
| 65 to 74 Years | 242 | 18.0% |
| 75 to 84 Years | 165 | 12.3% |
| 85 Years and Over | 36 | 2.7% |
| Total | 1,342 | 100.0% |
Housing Finances in Bella Vista
Median Income by Occupancy in Bella Vista
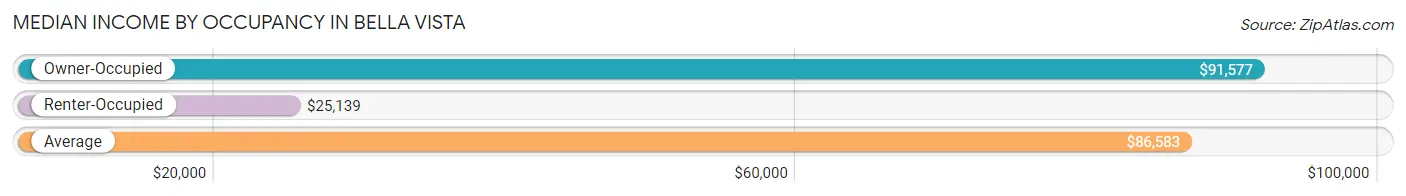
| Occupancy Type | # Households | Median Income |
| Owner-Occupied | 1,149 (85.6%) | $91,577 |
| Renter-Occupied | 193 (14.4%) | $25,139 |
| Average | 1,342 (100.0%) | $86,583 |
Occupancy by Householder Income Bracket in Bella Vista
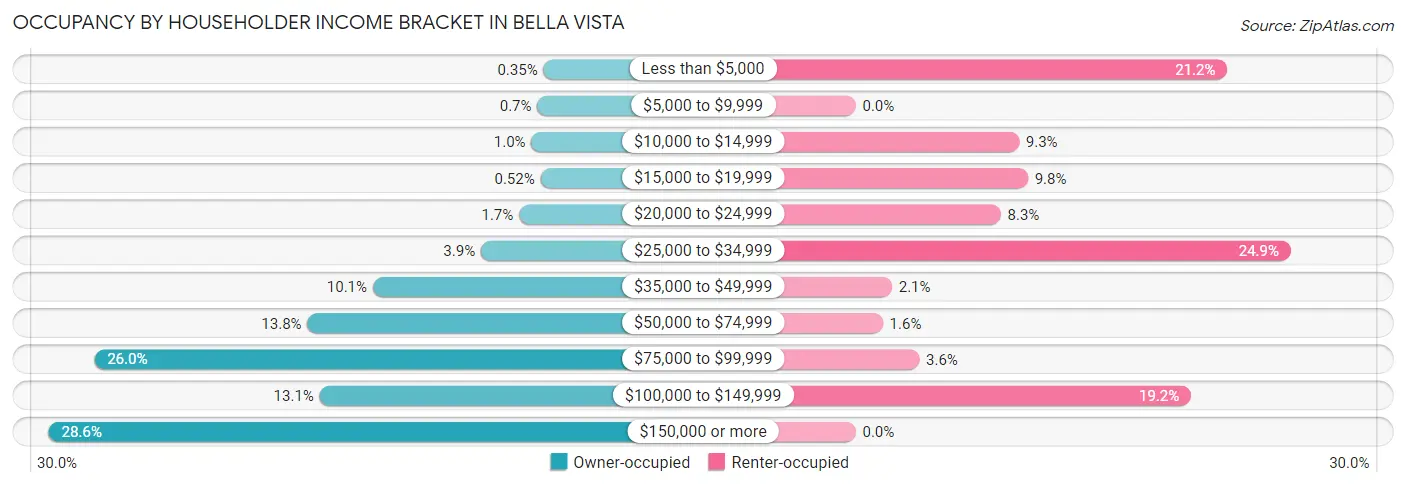
| Income Bracket | Owner-occupied | Renter-occupied |
| Less than $5,000 | 4 (0.4%) | 41 (21.2%) |
| $5,000 to $9,999 | 8 (0.7%) | 0 (0.0%) |
| $10,000 to $14,999 | 12 (1.0%) | 18 (9.3%) |
| $15,000 to $19,999 | 6 (0.5%) | 19 (9.8%) |
| $20,000 to $24,999 | 20 (1.7%) | 16 (8.3%) |
| $25,000 to $34,999 | 45 (3.9%) | 48 (24.9%) |
| $35,000 to $49,999 | 116 (10.1%) | 4 (2.1%) |
| $50,000 to $74,999 | 159 (13.8%) | 3 (1.5%) |
| $75,000 to $99,999 | 299 (26.0%) | 7 (3.6%) |
| $100,000 to $149,999 | 151 (13.1%) | 37 (19.2%) |
| $150,000 or more | 329 (28.6%) | 0 (0.0%) |
| Total | 1,149 (100.0%) | 193 (100.0%) |
Monthly Housing Cost Tiers in Bella Vista
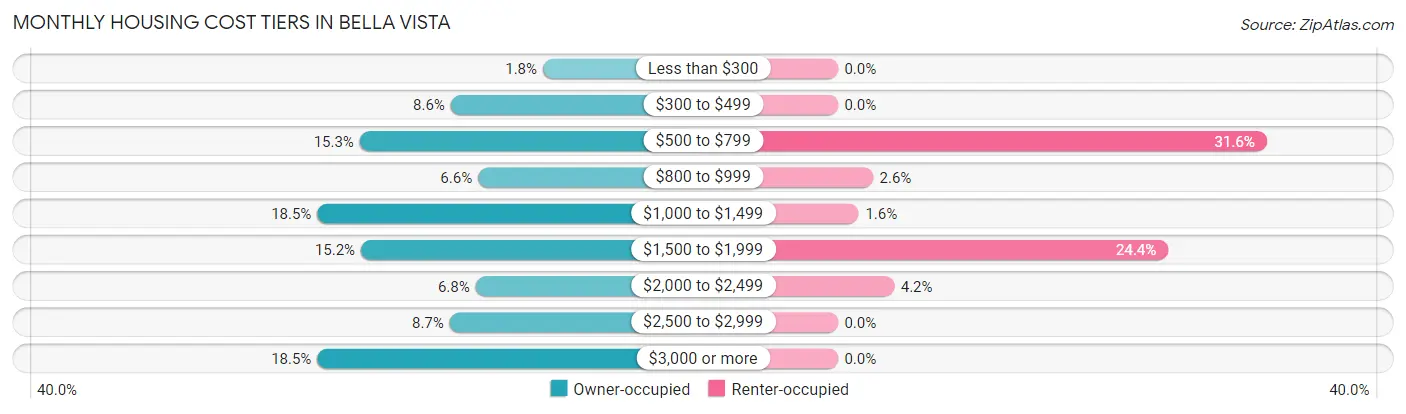
| Monthly Cost | Owner-occupied | Renter-occupied |
| Less than $300 | 21 (1.8%) | 0 (0.0%) |
| $300 to $499 | 99 (8.6%) | 0 (0.0%) |
| $500 to $799 | 176 (15.3%) | 61 (31.6%) |
| $800 to $999 | 76 (6.6%) | 5 (2.6%) |
| $1,000 to $1,499 | 212 (18.4%) | 3 (1.5%) |
| $1,500 to $1,999 | 175 (15.2%) | 47 (24.3%) |
| $2,000 to $2,499 | 78 (6.8%) | 8 (4.2%) |
| $2,500 to $2,999 | 100 (8.7%) | 0 (0.0%) |
| $3,000 or more | 212 (18.4%) | 0 (0.0%) |
| Total | 1,149 (100.0%) | 193 (100.0%) |
Physical Housing Characteristics in Bella Vista
Housing Structures in Bella Vista
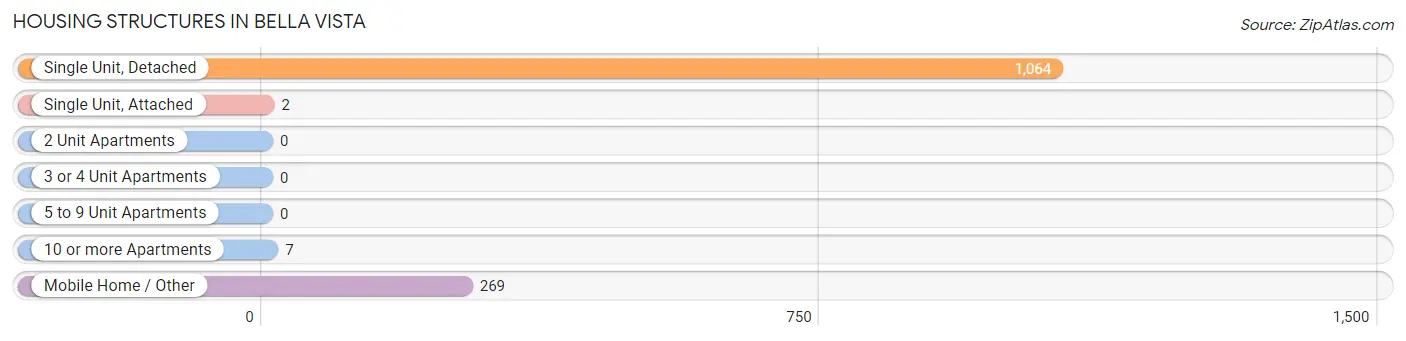
| Structure Type | # Housing Units | % Housing Units |
| Single Unit, Detached | 1,064 | 79.3% |
| Single Unit, Attached | 2 | 0.2% |
| 2 Unit Apartments | 0 | 0.0% |
| 3 or 4 Unit Apartments | 0 | 0.0% |
| 5 to 9 Unit Apartments | 0 | 0.0% |
| 10 or more Apartments | 7 | 0.5% |
| Mobile Home / Other | 269 | 20.0% |
| Total | 1,342 | 100.0% |
Housing Structures by Occupancy in Bella Vista
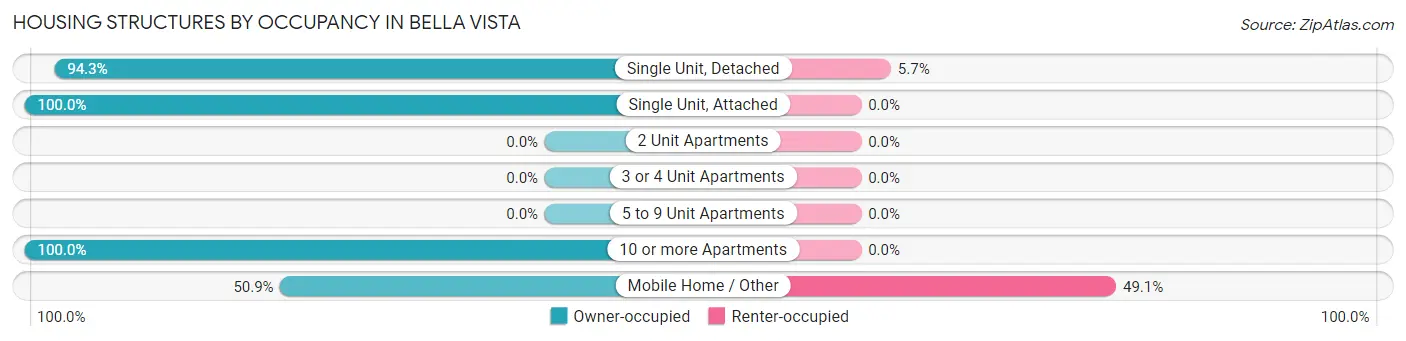
| Structure Type | Owner-occupied | Renter-occupied |
| Single Unit, Detached | 1,003 (94.3%) | 61 (5.7%) |
| Single Unit, Attached | 2 (100.0%) | 0 (0.0%) |
| 2 Unit Apartments | 0 (0.0%) | 0 (0.0%) |
| 3 or 4 Unit Apartments | 0 (0.0%) | 0 (0.0%) |
| 5 to 9 Unit Apartments | 0 (0.0%) | 0 (0.0%) |
| 10 or more Apartments | 7 (100.0%) | 0 (0.0%) |
| Mobile Home / Other | 137 (50.9%) | 132 (49.1%) |
| Total | 1,149 (85.6%) | 193 (14.4%) |
Housing Structures by Number of Rooms in Bella Vista
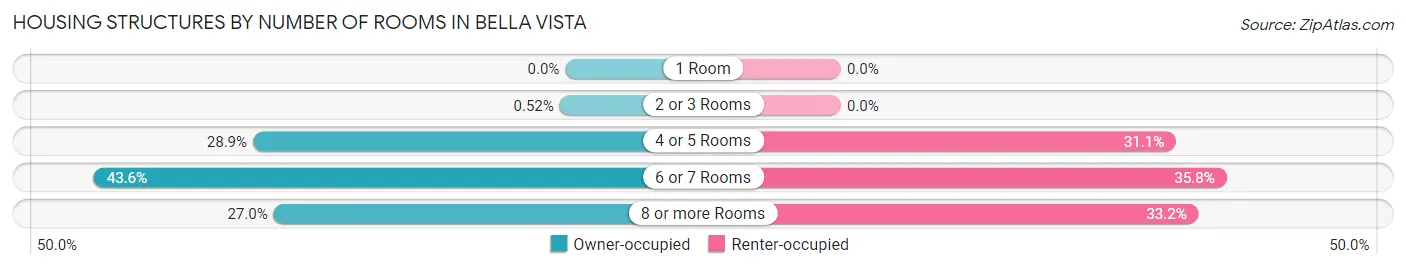
| Number of Rooms | Owner-occupied | Renter-occupied |
| 1 Room | 0 (0.0%) | 0 (0.0%) |
| 2 or 3 Rooms | 6 (0.5%) | 0 (0.0%) |
| 4 or 5 Rooms | 332 (28.9%) | 60 (31.1%) |
| 6 or 7 Rooms | 501 (43.6%) | 69 (35.7%) |
| 8 or more Rooms | 310 (27.0%) | 64 (33.2%) |
| Total | 1,149 (100.0%) | 193 (100.0%) |
Housing Structure by Heating Type in Bella Vista
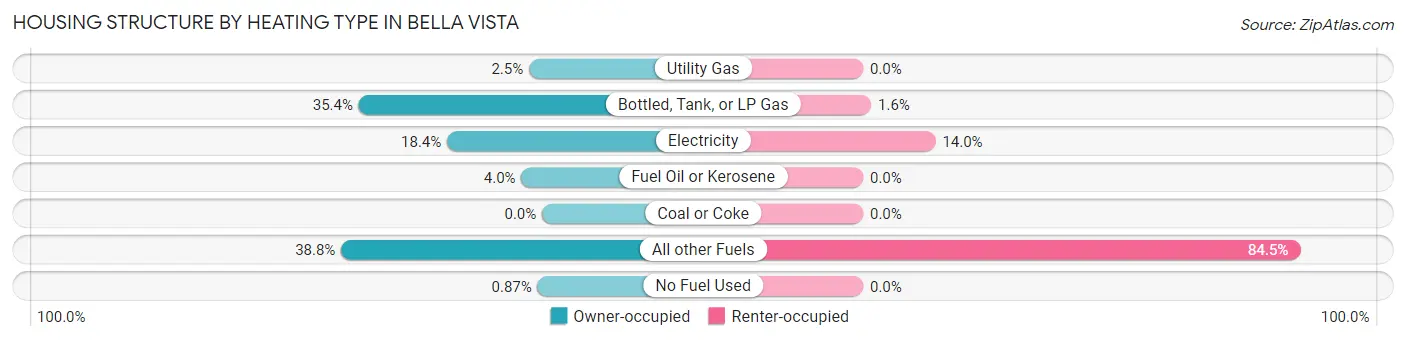
| Heating Type | Owner-occupied | Renter-occupied |
| Utility Gas | 29 (2.5%) | 0 (0.0%) |
| Bottled, Tank, or LP Gas | 407 (35.4%) | 3 (1.5%) |
| Electricity | 211 (18.4%) | 27 (14.0%) |
| Fuel Oil or Kerosene | 46 (4.0%) | 0 (0.0%) |
| Coal or Coke | 0 (0.0%) | 0 (0.0%) |
| All other Fuels | 446 (38.8%) | 163 (84.5%) |
| No Fuel Used | 10 (0.9%) | 0 (0.0%) |
| Total | 1,149 (100.0%) | 193 (100.0%) |
Household Vehicle Usage in Bella Vista
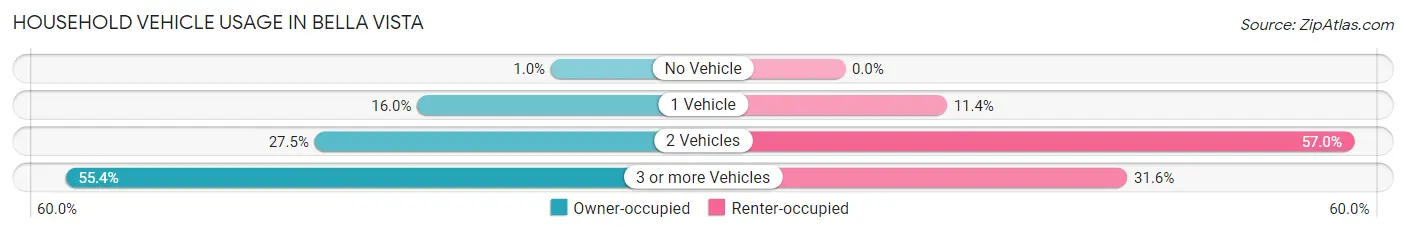
| Vehicles per Household | Owner-occupied | Renter-occupied |
| No Vehicle | 12 (1.0%) | 0 (0.0%) |
| 1 Vehicle | 184 (16.0%) | 22 (11.4%) |
| 2 Vehicles | 316 (27.5%) | 110 (57.0%) |
| 3 or more Vehicles | 637 (55.4%) | 61 (31.6%) |
| Total | 1,149 (100.0%) | 193 (100.0%) |
Real Estate & Mortgages in Bella Vista
Real Estate and Mortgage Overview in Bella Vista
| Characteristic | Without Mortgage | With Mortgage |
| Housing Units | 480 | 669 |
| Median Property Value | $370,200 | $449,200 |
| Median Household Income | $76,250 | $219 |
| Monthly Housing Costs | $711 | $212 |
| Real Estate Taxes | $2,580 | $23 |
Property Value by Mortgage Status in Bella Vista
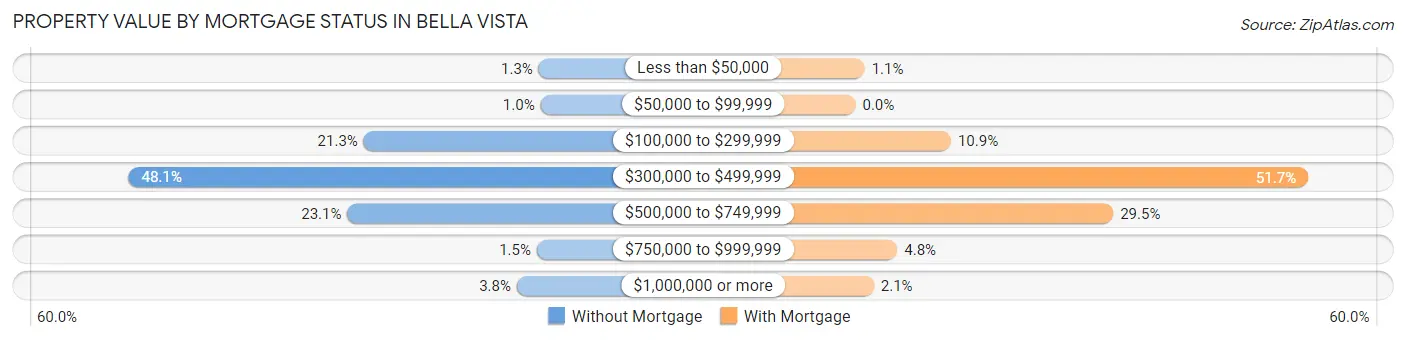
| Property Value | Without Mortgage | With Mortgage |
| Less than $50,000 | 6 (1.3%) | 7 (1.1%) |
| $50,000 to $99,999 | 5 (1.0%) | 0 (0.0%) |
| $100,000 to $299,999 | 102 (21.2%) | 73 (10.9%) |
| $300,000 to $499,999 | 231 (48.1%) | 346 (51.7%) |
| $500,000 to $749,999 | 111 (23.1%) | 197 (29.4%) |
| $750,000 to $999,999 | 7 (1.5%) | 32 (4.8%) |
| $1,000,000 or more | 18 (3.7%) | 14 (2.1%) |
| Total | 480 (100.0%) | 669 (100.0%) |
Household Income by Mortgage Status in Bella Vista
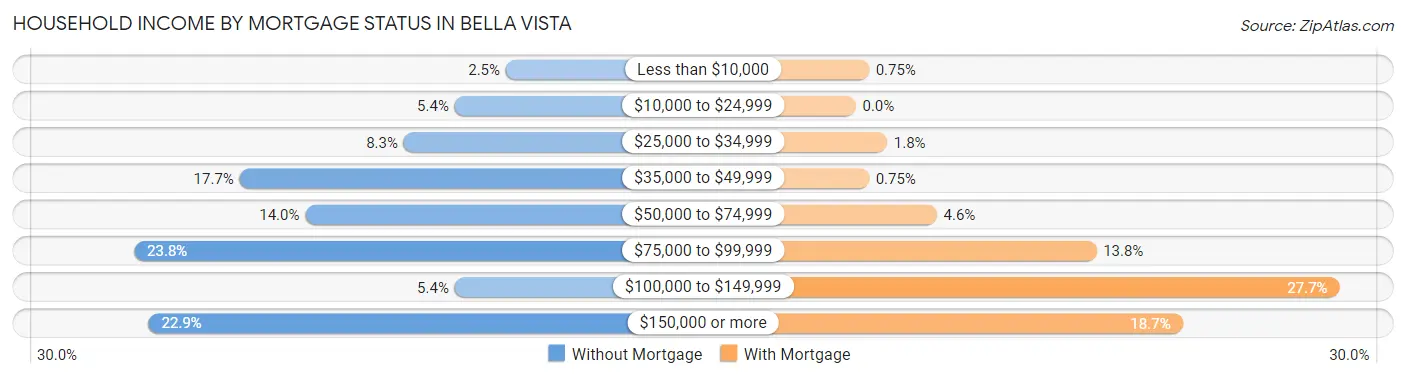
| Household Income | Without Mortgage | With Mortgage |
| Less than $10,000 | 12 (2.5%) | 5 (0.7%) |
| $10,000 to $24,999 | 26 (5.4%) | 0 (0.0%) |
| $25,000 to $34,999 | 40 (8.3%) | 12 (1.8%) |
| $35,000 to $49,999 | 85 (17.7%) | 5 (0.7%) |
| $50,000 to $74,999 | 67 (14.0%) | 31 (4.6%) |
| $75,000 to $99,999 | 114 (23.7%) | 92 (13.8%) |
| $100,000 to $149,999 | 26 (5.4%) | 185 (27.7%) |
| $150,000 or more | 110 (22.9%) | 125 (18.7%) |
| Total | 480 (100.0%) | 669 (100.0%) |
Property Value to Household Income Ratio in Bella Vista
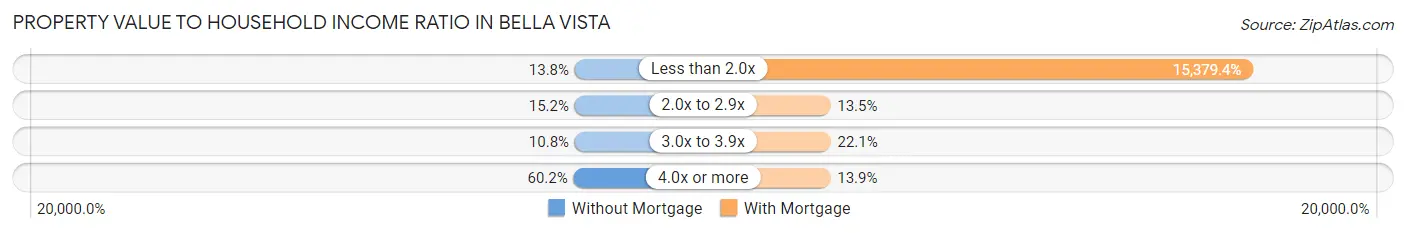
| Value-to-Income Ratio | Without Mortgage | With Mortgage |
| Less than 2.0x | 66 (13.8%) | 102,888 (15,379.4%) |
| 2.0x to 2.9x | 73 (15.2%) | 90 (13.5%) |
| 3.0x to 3.9x | 52 (10.8%) | 148 (22.1%) |
| 4.0x or more | 289 (60.2%) | 93 (13.9%) |
| Total | 480 (100.0%) | 669 (100.0%) |
Real Estate Taxes by Mortgage Status in Bella Vista

| Property Taxes | Without Mortgage | With Mortgage |
| Less than $800 | 12 (2.5%) | 0 (0.0%) |
| $800 to $1,499 | 77 (16.0%) | 6 (0.9%) |
| $800 to $1,499 | 385 (80.2%) | 44 (6.6%) |
| Total | 480 (100.0%) | 669 (100.0%) |
Health & Disability in Bella Vista
Health Insurance Coverage by Age in Bella Vista
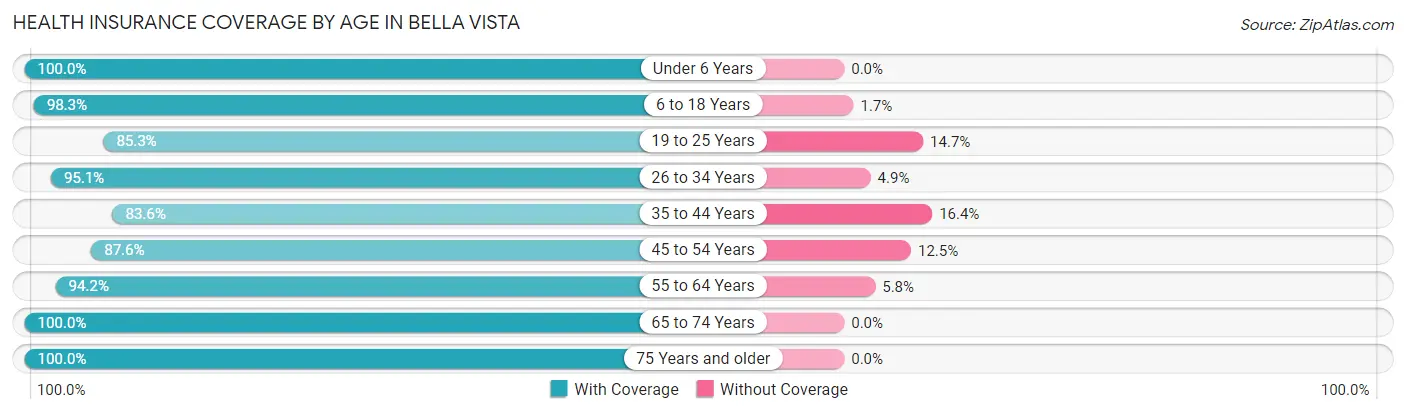
| Age Bracket | With Coverage | Without Coverage |
| Under 6 Years | 232 (100.0%) | 0 (0.0%) |
| 6 to 18 Years | 856 (98.3%) | 15 (1.7%) |
| 19 to 25 Years | 174 (85.3%) | 30 (14.7%) |
| 26 to 34 Years | 348 (95.1%) | 18 (4.9%) |
| 35 to 44 Years | 301 (83.6%) | 59 (16.4%) |
| 45 to 54 Years | 471 (87.5%) | 67 (12.4%) |
| 55 to 64 Years | 538 (94.2%) | 33 (5.8%) |
| 65 to 74 Years | 447 (100.0%) | 0 (0.0%) |
| 75 Years and older | 365 (100.0%) | 0 (0.0%) |
| Total | 3,732 (94.4%) | 222 (5.6%) |
Health Insurance Coverage by Citizenship Status in Bella Vista

| Citizenship Status | With Coverage | Without Coverage |
| Native Born | 232 (100.0%) | 0 (0.0%) |
| Foreign Born, Citizen | 856 (98.3%) | 15 (1.7%) |
| Foreign Born, not a Citizen | 174 (85.3%) | 30 (14.7%) |
Health Insurance Coverage by Household Income in Bella Vista

| Household Income | With Coverage | Without Coverage |
| Under $25,000 | 244 (93.1%) | 18 (6.9%) |
| $25,000 to $49,999 | 377 (91.9%) | 33 (8.1%) |
| $50,000 to $74,999 | 354 (100.0%) | 0 (0.0%) |
| $75,000 to $99,999 | 1,160 (95.2%) | 59 (4.8%) |
| $100,000 and over | 1,586 (93.6%) | 109 (6.4%) |
Public vs Private Health Insurance Coverage by Age in Bella Vista
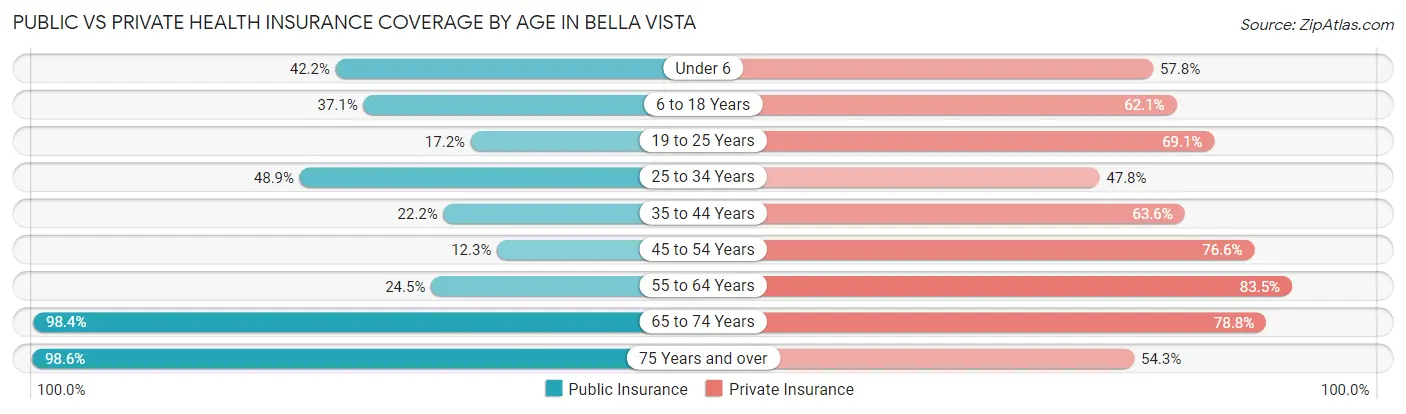
| Age Bracket | Public Insurance | Private Insurance |
| Under 6 | 98 (42.2%) | 134 (57.8%) |
| 6 to 18 Years | 323 (37.1%) | 541 (62.1%) |
| 19 to 25 Years | 35 (17.2%) | 141 (69.1%) |
| 25 to 34 Years | 179 (48.9%) | 175 (47.8%) |
| 35 to 44 Years | 80 (22.2%) | 229 (63.6%) |
| 45 to 54 Years | 66 (12.3%) | 412 (76.6%) |
| 55 to 64 Years | 140 (24.5%) | 477 (83.5%) |
| 65 to 74 Years | 440 (98.4%) | 352 (78.7%) |
| 75 Years and over | 360 (98.6%) | 198 (54.2%) |
| Total | 1,721 (43.5%) | 2,659 (67.2%) |
Disability Status by Sex by Age in Bella Vista
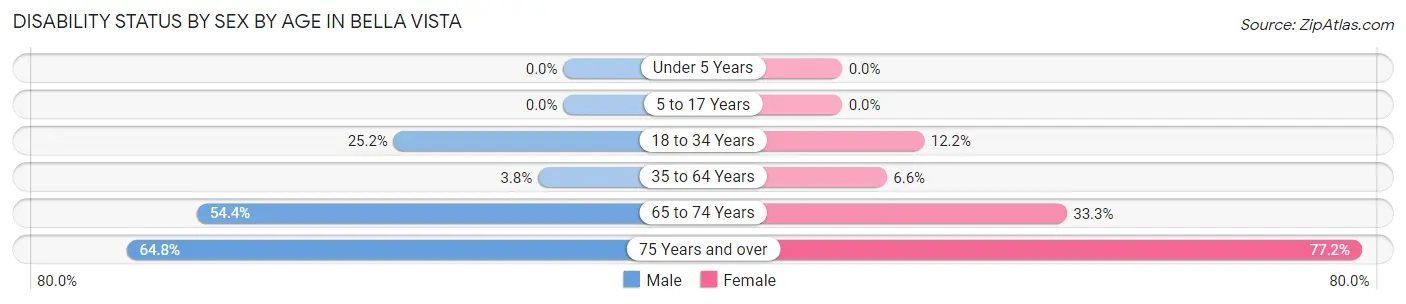
| Age Bracket | Male | Female |
| Under 5 Years | 0 (0.0%) | 0 (0.0%) |
| 5 to 17 Years | 0 (0.0%) | 0 (0.0%) |
| 18 to 34 Years | 65 (25.2%) | 43 (12.2%) |
| 35 to 64 Years | 29 (3.7%) | 46 (6.6%) |
| 65 to 74 Years | 111 (54.4%) | 81 (33.3%) |
| 75 Years and over | 83 (64.8%) | 183 (77.2%) |
Disability Class by Sex by Age in Bella Vista
Disability Class: Hearing Difficulty
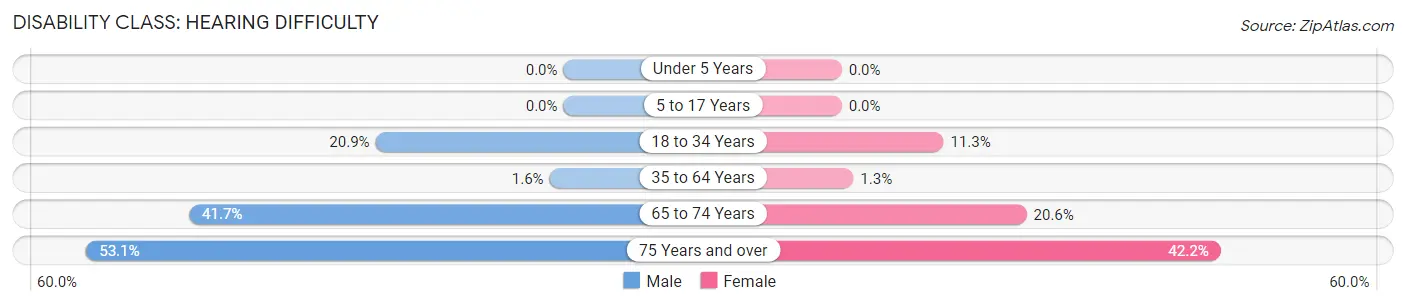
| Age Bracket | Male | Female |
| Under 5 Years | 0 (0.0%) | 0 (0.0%) |
| 5 to 17 Years | 0 (0.0%) | 0 (0.0%) |
| 18 to 34 Years | 54 (20.9%) | 40 (11.3%) |
| 35 to 64 Years | 12 (1.5%) | 9 (1.3%) |
| 65 to 74 Years | 85 (41.7%) | 50 (20.6%) |
| 75 Years and over | 68 (53.1%) | 100 (42.2%) |
Disability Class: Vision Difficulty
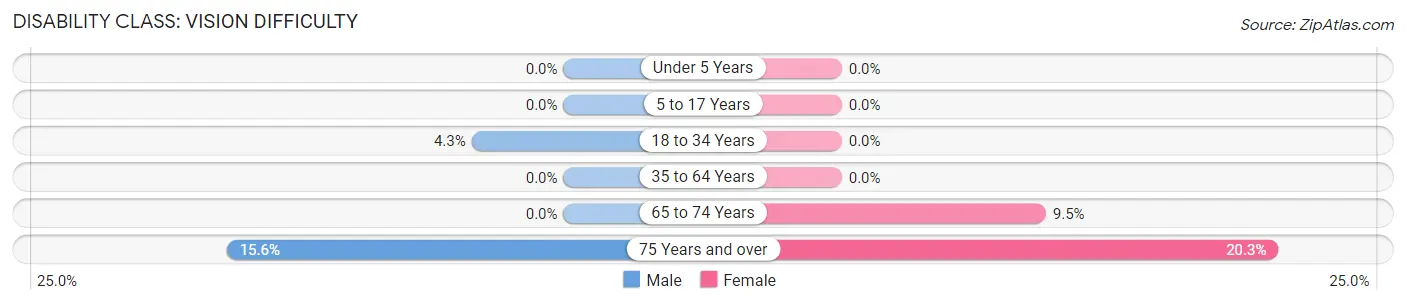
| Age Bracket | Male | Female |
| Under 5 Years | 0 (0.0%) | 0 (0.0%) |
| 5 to 17 Years | 0 (0.0%) | 0 (0.0%) |
| 18 to 34 Years | 11 (4.3%) | 0 (0.0%) |
| 35 to 64 Years | 0 (0.0%) | 0 (0.0%) |
| 65 to 74 Years | 0 (0.0%) | 23 (9.5%) |
| 75 Years and over | 20 (15.6%) | 48 (20.3%) |
Disability Class: Cognitive Difficulty
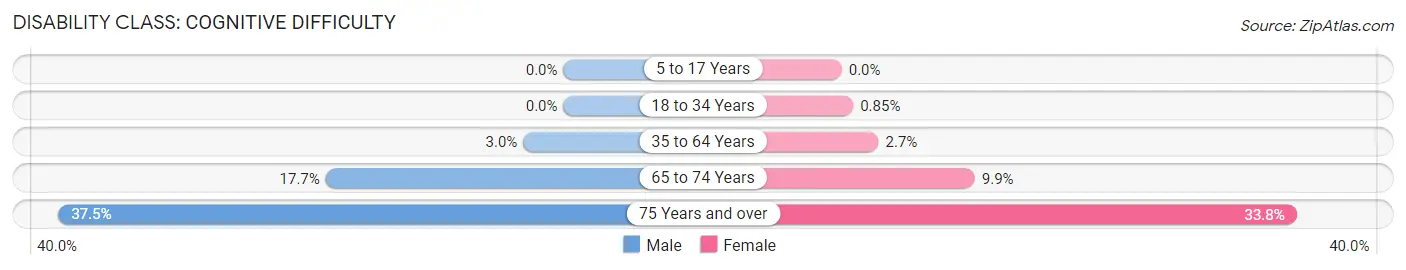
| Age Bracket | Male | Female |
| 5 to 17 Years | 0 (0.0%) | 0 (0.0%) |
| 18 to 34 Years | 0 (0.0%) | 3 (0.9%) |
| 35 to 64 Years | 23 (3.0%) | 19 (2.7%) |
| 65 to 74 Years | 36 (17.6%) | 24 (9.9%) |
| 75 Years and over | 48 (37.5%) | 80 (33.8%) |
Disability Class: Ambulatory Difficulty
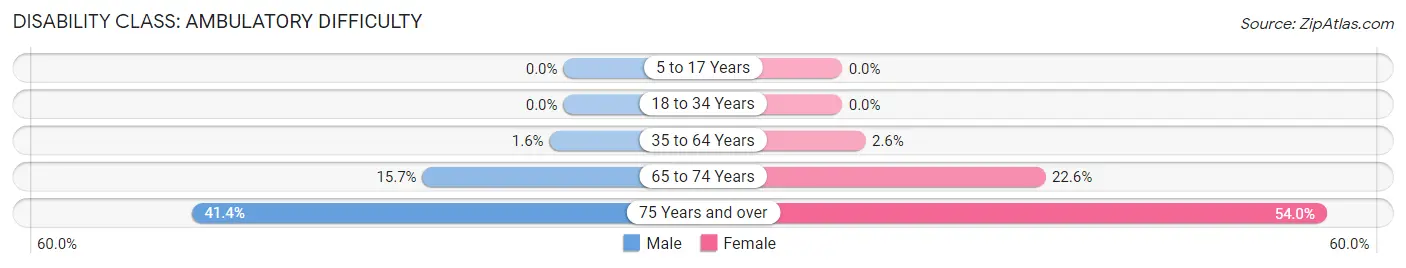
| Age Bracket | Male | Female |
| 5 to 17 Years | 0 (0.0%) | 0 (0.0%) |
| 18 to 34 Years | 0 (0.0%) | 0 (0.0%) |
| 35 to 64 Years | 12 (1.5%) | 18 (2.6%) |
| 65 to 74 Years | 32 (15.7%) | 55 (22.6%) |
| 75 Years and over | 53 (41.4%) | 128 (54.0%) |
Disability Class: Self-Care Difficulty
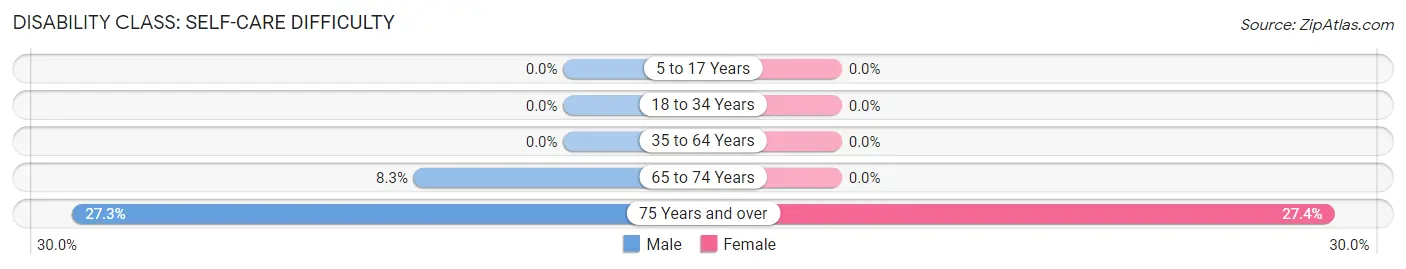
| Age Bracket | Male | Female |
| 5 to 17 Years | 0 (0.0%) | 0 (0.0%) |
| 18 to 34 Years | 0 (0.0%) | 0 (0.0%) |
| 35 to 64 Years | 0 (0.0%) | 0 (0.0%) |
| 65 to 74 Years | 17 (8.3%) | 0 (0.0%) |
| 75 Years and over | 35 (27.3%) | 65 (27.4%) |
Technology Access in Bella Vista
Computing Device Access in Bella Vista
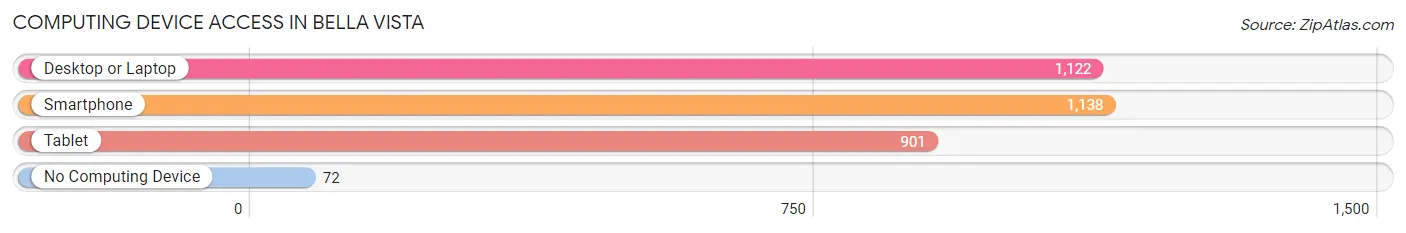
| Device Type | # Households | % Households |
| Desktop or Laptop | 1,122 | 83.6% |
| Smartphone | 1,138 | 84.8% |
| Tablet | 901 | 67.1% |
| No Computing Device | 72 | 5.4% |
| Total | 1,342 | 100.0% |
Internet Access in Bella Vista
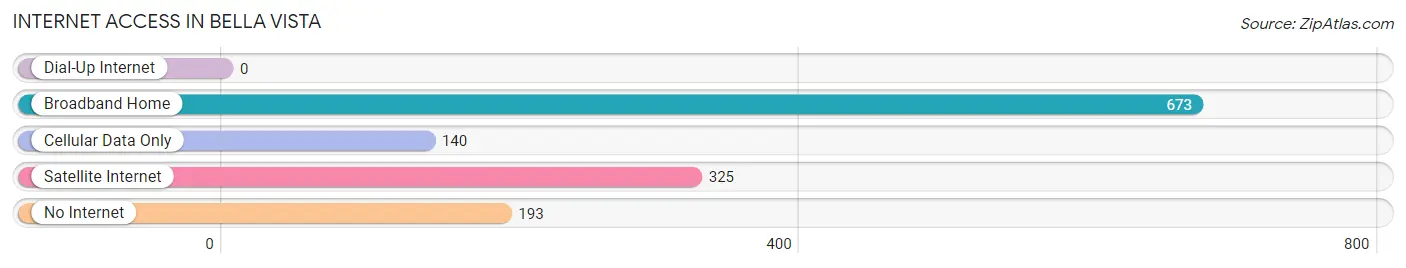
| Internet Type | # Households | % Households |
| Dial-Up Internet | 0 | 0.0% |
| Broadband Home | 673 | 50.1% |
| Cellular Data Only | 140 | 10.4% |
| Satellite Internet | 325 | 24.2% |
| No Internet | 193 | 14.4% |
| Total | 1,342 | 100.0% |
Bella Vista Summary
Bella Vista is a small town located in the Sierra Nevada foothills of Northern California. It is situated in Shasta County, approximately 30 miles east of Redding. The town is known for its picturesque views of the surrounding mountains and its proximity to the Sacramento River.
History
Bella Vista was founded in 1852 by a group of settlers from the Midwest. The town was originally called “Bella Vista”, which means “beautiful view” in Spanish. The settlers were attracted to the area due to its fertile soil and abundant natural resources. The town quickly grew and by the late 1800s, it had become a bustling center of commerce and industry.
The town was home to several sawmills, a flour mill, a brickyard, and a blacksmith shop. In addition, the town was home to a number of stores, saloons, and hotels. The town also had a post office, a school, and a church.
In the early 1900s, the town began to decline due to the depletion of natural resources and the decline of the lumber industry. By the mid-1900s, the town had become a quiet, rural community.
Geography
Bella Vista is located in the Sierra Nevada foothills of Northern California. The town is situated in Shasta County, approximately 30 miles east of Redding. The town is surrounded by the Sacramento River to the north, the Cascade Range to the east, and the Sierra Nevada Mountains to the south.
The town has a total area of 1.2 square miles, all of which is land. The town has an elevation of 1,890 feet above sea level. The climate in Bella Vista is mild and temperate, with hot summers and cool winters.
Economy
Bella Vista’s economy is largely based on agriculture and tourism. The town is home to several farms and ranches, which produce a variety of crops, including apples, pears, peaches, and walnuts. The town is also home to several wineries, which produce a variety of wines.
In addition, the town is home to several small businesses, including restaurants, cafes, and shops. The town is also home to a number of bed and breakfasts, which attract tourists from all over the world.
Demographics
As of the 2010 census, the population of Bella Vista was 1,890. The town has a population density of 1,541 people per square mile. The median age of the population is 44.7 years. The median household income is $45,000.
The racial makeup of the town is 87.3% White, 0.7% African American, 0.3% Native American, 0.3% Asian, 0.1% Pacific Islander, 8.7% from other races, and 2.9% from two or more races. The town is home to a large Hispanic population, with 37.3% of the population identifying as Hispanic or Latino.
Conclusion
Bella Vista is a small town located in the Sierra Nevada foothills of Northern California. It is situated in Shasta County, approximately 30 miles east of Redding. The town is known for its picturesque views of the surrounding mountains and its proximity to the Sacramento River. The town’s economy is largely based on agriculture and tourism. The town has a population of 1,890, with a median age of 44.7 years and a median household income of $45,000. The town is home to a large Hispanic population, with 37.3% of the population identifying as Hispanic or Latino.
Common Questions
What is Per Capita Income in Bella Vista?
Per Capita income in Bella Vista is $38,353.
What is the Median Family Income in Bella Vista?
Median Family Income in Bella Vista is $91,781.
What is the Median Household income in Bella Vista?
Median Household Income in Bella Vista is $86,583.
What is Income or Wage Gap in Bella Vista?
Income or Wage Gap in Bella Vista is 44.6%.
Women in Bella Vista earn 55.4 cents for every dollar earned by a man.
What is Inequality or Gini Index in Bella Vista?
Inequality or Gini Index in Bella Vista is 0.43.
What is the Total Population of Bella Vista?
Total Population of Bella Vista is 3,955.
What is the Total Male Population of Bella Vista?
Total Male Population of Bella Vista is 2,040.
What is the Total Female Population of Bella Vista?
Total Female Population of Bella Vista is 1,915.
What is the Ratio of Males per 100 Females in Bella Vista?
There are 106.53 Males per 100 Females in Bella Vista.
What is the Ratio of Females per 100 Males in Bella Vista?
There are 93.87 Females per 100 Males in Bella Vista.
What is the Median Population Age in Bella Vista?
Median Population Age in Bella Vista is 43.4 Years.
What is the Average Family Size in Bella Vista
Average Family Size in Bella Vista is 3.4 People.
What is the Average Household Size in Bella Vista
Average Household Size in Bella Vista is 2.9 People.
How Large is the Labor Force in Bella Vista?
There are 1,839 People in the Labor Forcein in Bella Vista.
What is the Percentage of People in the Labor Force in Bella Vista?
60.6% of People are in the Labor Force in Bella Vista.
What is the Unemployment Rate in Bella Vista?
Unemployment Rate in Bella Vista is 8.4%.