Cities with the Lowest Poverty Level Among Families in Maryland
RELATED REPORTS & OPTIONS
Lowest Family Poverty
Maryland
Compare Cities
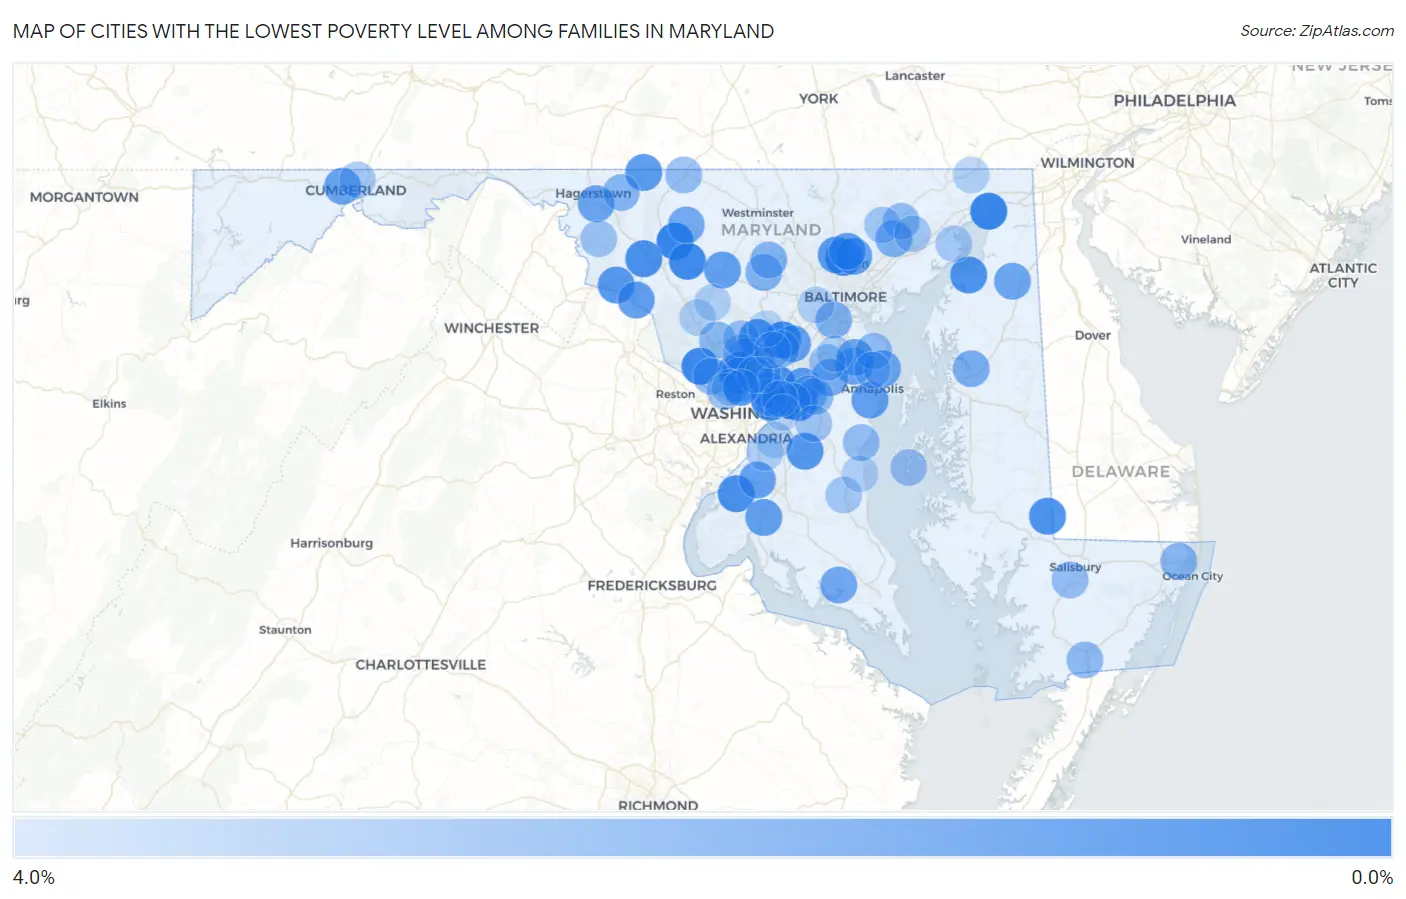
Map of Cities with the Lowest Poverty Level Among Families in Maryland
4.0%
0.0%
Cities with the Lowest Poverty Level Among Families in Maryland
| City | Family Poverty | vs State | vs National | |
| 1. | Walkersville | 0.50% | 6.2%(-5.71)#1 | 8.8%(-8.28)#87 |
| 2. | Charlestown | 0.55% | 6.2%(-5.67)#2 | 8.8%(-8.23)#116 |
| 3. | Brown Station | 0.57% | 6.2%(-5.64)#3 | 8.8%(-8.21)#138 |
| 4. | Scaggsville | 0.60% | 6.2%(-5.62)#4 | 8.8%(-8.19)#153 |
| 5. | Travilah | 0.63% | 6.2%(-5.58)#5 | 8.8%(-8.15)#175 |
| 6. | Linganore | 0.69% | 6.2%(-5.53)#6 | 8.8%(-8.09)#221 |
| 7. | Abingdon | 0.76% | 6.2%(-5.46)#7 | 8.8%(-8.02)#275 |
| 8. | Lutherville | 0.77% | 6.2%(-5.45)#8 | 8.8%(-8.01)#289 |
| 9. | Berwyn Heights | 0.79% | 6.2%(-5.43)#9 | 8.8%(-7.99)#309 |
| 10. | Garrett Park | 0.81% | 6.2%(-5.41)#10 | 8.8%(-7.97)#326 |
| 11. | Mitchellville | 0.83% | 6.2%(-5.38)#11 | 8.8%(-7.95)#351 |
| 12. | Ashton Sandy Spring | 0.83% | 6.2%(-5.38)#12 | 8.8%(-7.95)#356 |
| 13. | Bryans Road | 0.84% | 6.2%(-5.37)#13 | 8.8%(-7.94)#362 |
| 14. | Braddock Heights | 0.86% | 6.2%(-5.36)#14 | 8.8%(-7.93)#375 |
| 15. | Betterton | 0.91% | 6.2%(-5.31)#15 | 8.8%(-7.87)#438 |
| 16. | Sharptown | 0.93% | 6.2%(-5.29)#16 | 8.8%(-7.86)#456 |
| 17. | Colmar Manor | 1.0% | 6.2%(-5.19)#17 | 8.8%(-7.75)#556 |
| 18. | Marlton | 1.0% | 6.2%(-5.18)#18 | 8.8%(-7.75)#566 |
| 19. | South Kensington | 1.0% | 6.2%(-5.17)#19 | 8.8%(-7.74)#582 |
| 20. | Rosemont | 1.1% | 6.2%(-5.08)#20 | 8.8%(-7.65)#680 |
| 21. | Highfield Cascade | 1.2% | 6.2%(-5.06)#21 | 8.8%(-7.62)#705 |
| 22. | Mays Chapel | 1.2% | 6.2%(-5.05)#22 | 8.8%(-7.61)#718 |
| 23. | Glenn Dale | 1.2% | 6.2%(-5.00)#23 | 8.8%(-7.57)#777 |
| 24. | Bladensburg | 1.2% | 6.2%(-5.00)#24 | 8.8%(-7.56)#780 |
| 25. | Colesville | 1.3% | 6.2%(-4.91)#25 | 8.8%(-7.47)#889 |
| 26. | Point Of Rocks | 1.3% | 6.2%(-4.90)#26 | 8.8%(-7.47)#895 |
| 27. | Annapolis Neck | 1.3% | 6.2%(-4.89)#27 | 8.8%(-7.46)#914 |
| 28. | Hampton | 1.3% | 6.2%(-4.88)#28 | 8.8%(-7.45)#919 |
| 29. | La Plata | 1.3% | 6.2%(-4.88)#29 | 8.8%(-7.45)#929 |
| 30. | North Laurel | 1.3% | 6.2%(-4.88)#30 | 8.8%(-7.45)#930 |
| 31. | Mount Airy | 1.3% | 6.2%(-4.87)#31 | 8.8%(-7.44)#940 |
| 32. | Accokeek | 1.4% | 6.2%(-4.84)#32 | 8.8%(-7.40)#979 |
| 33. | Timonium | 1.4% | 6.2%(-4.79)#33 | 8.8%(-7.36)#1,040 |
| 34. | Herald Harbor | 1.5% | 6.2%(-4.71)#34 | 8.8%(-7.28)#1,146 |
| 35. | La Vale | 1.5% | 6.2%(-4.70)#35 | 8.8%(-7.27)#1,162 |
| 36. | Funkstown | 1.5% | 6.2%(-4.69)#36 | 8.8%(-7.26)#1,179 |
| 37. | Severna Park | 1.5% | 6.2%(-4.69)#37 | 8.8%(-7.26)#1,182 |
| 38. | Galena | 1.5% | 6.2%(-4.67)#38 | 8.8%(-7.24)#1,218 |
| 39. | Cape St Claire | 1.6% | 6.2%(-4.65)#39 | 8.8%(-7.21)#1,246 |
| 40. | Layhill | 1.6% | 6.2%(-4.60)#40 | 8.8%(-7.17)#1,306 |
| 41. | Leonardtown | 1.6% | 6.2%(-4.57)#41 | 8.8%(-7.14)#1,347 |
| 42. | Chevy Chase | 1.6% | 6.2%(-4.57)#42 | 8.8%(-7.13)#1,352 |
| 43. | University Park | 1.7% | 6.2%(-4.56)#43 | 8.8%(-7.12)#1,367 |
| 44. | Green Valley | 1.7% | 6.2%(-4.52)#44 | 8.8%(-7.08)#1,425 |
| 45. | Woodsboro | 1.7% | 6.2%(-4.51)#45 | 8.8%(-7.08)#1,427 |
| 46. | Honeygo | 1.7% | 6.2%(-4.50)#46 | 8.8%(-7.07)#1,441 |
| 47. | Chevy Chase Section Three | 1.7% | 6.2%(-4.48)#47 | 8.8%(-7.05)#1,491 |
| 48. | Crofton | 1.8% | 6.2%(-4.46)#48 | 8.8%(-7.02)#1,527 |
| 49. | Centreville | 1.8% | 6.2%(-4.42)#49 | 8.8%(-6.98)#1,588 |
| 50. | Pleasant Hills | 1.8% | 6.2%(-4.38)#50 | 8.8%(-6.95)#1,633 |
| 51. | Linthicum | 1.9% | 6.2%(-4.30)#51 | 8.8%(-6.86)#1,770 |
| 52. | North Kensington | 2.0% | 6.2%(-4.25)#52 | 8.8%(-6.82)#1,841 |
| 53. | Sykesville | 2.0% | 6.2%(-4.25)#53 | 8.8%(-6.82)#1,844 |
| 54. | West Laurel | 2.0% | 6.2%(-4.25)#54 | 8.8%(-6.81)#1,850 |
| 55. | Eldersburg | 2.1% | 6.2%(-4.16)#55 | 8.8%(-6.72)#1,974 |
| 56. | Ocean Pines | 2.1% | 6.2%(-4.12)#56 | 8.8%(-6.68)#2,030 |
| 57. | Callaway | 2.1% | 6.2%(-4.11)#57 | 8.8%(-6.68)#2,035 |
| 58. | Cavetown | 2.1% | 6.2%(-4.11)#58 | 8.8%(-6.67)#2,046 |
| 59. | Chevy Chase View | 2.1% | 6.2%(-4.10)#59 | 8.8%(-6.67)#2,048 |
| 60. | Fairwood | 2.1% | 6.2%(-4.09)#60 | 8.8%(-6.66)#2,068 |
| 61. | Washington Grove | 2.1% | 6.2%(-4.07)#61 | 8.8%(-6.64)#2,092 |
| 62. | Bowie | 2.2% | 6.2%(-4.01)#62 | 8.8%(-6.58)#2,177 |
| 63. | Pocomoke City | 2.2% | 6.2%(-3.97)#63 | 8.8%(-6.54)#2,255 |
| 64. | Springdale | 2.3% | 6.2%(-3.96)#64 | 8.8%(-6.52)#2,280 |
| 65. | Lake Shore | 2.3% | 6.2%(-3.90)#65 | 8.8%(-6.46)#2,372 |
| 66. | Potomac | 2.3% | 6.2%(-3.88)#66 | 8.8%(-6.45)#2,407 |
| 67. | Emmitsburg | 2.3% | 6.2%(-3.87)#67 | 8.8%(-6.44)#2,423 |
| 68. | North Brentwood | 2.4% | 6.2%(-3.86)#68 | 8.8%(-6.43)#2,432 |
| 69. | Glen Echo | 2.4% | 6.2%(-3.86)#69 | 8.8%(-6.43)#2,435 |
| 70. | Fruitland | 2.4% | 6.2%(-3.85)#70 | 8.8%(-6.42)#2,444 |
| 71. | Bel Air North | 2.4% | 6.2%(-3.85)#71 | 8.8%(-6.42)#2,450 |
| 72. | Deale | 2.4% | 6.2%(-3.85)#72 | 8.8%(-6.41)#2,458 |
| 73. | Leisure World | 2.4% | 6.2%(-3.83)#73 | 8.8%(-6.39)#2,491 |
| 74. | Tilghman Island | 2.4% | 6.2%(-3.80)#74 | 8.8%(-6.36)#2,547 |
| 75. | Olney | 2.4% | 6.2%(-3.78)#75 | 8.8%(-6.35)#2,564 |
| 76. | Keedysville | 2.5% | 6.2%(-3.75)#76 | 8.8%(-6.31)#2,630 |
| 77. | Hillandale | 2.5% | 6.2%(-3.74)#77 | 8.8%(-6.31)#2,634 |
| 78. | Odenton | 2.5% | 6.2%(-3.73)#78 | 8.8%(-6.30)#2,651 |
| 79. | Four Corners | 2.5% | 6.2%(-3.71)#79 | 8.8%(-6.28)#2,675 |
| 80. | Brock Hall | 2.6% | 6.2%(-3.65)#80 | 8.8%(-6.21)#2,798 |
| 81. | Arnold | 2.6% | 6.2%(-3.63)#81 | 8.8%(-6.19)#2,830 |
| 82. | Fallston | 2.6% | 6.2%(-3.62)#82 | 8.8%(-6.19)#2,839 |
| 83. | Bel Air South | 2.6% | 6.2%(-3.58)#83 | 8.8%(-6.15)#2,890 |
| 84. | Landover Hills | 2.6% | 6.2%(-3.57)#84 | 8.8%(-6.13)#2,933 |
| 85. | Huntingtown | 2.7% | 6.2%(-3.55)#85 | 8.8%(-6.12)#2,962 |
| 86. | Bowmans Addition | 2.7% | 6.2%(-3.52)#86 | 8.8%(-6.09)#3,011 |
| 87. | Aberdeen Proving Ground | 2.7% | 6.2%(-3.51)#87 | 8.8%(-6.07)#3,037 |
| 88. | Bethesda | 2.7% | 6.2%(-3.50)#88 | 8.8%(-6.06)#3,055 |
| 89. | Martin S Additions | 2.9% | 6.2%(-3.36)#89 | 8.8%(-5.92)#3,299 |
| 90. | Clarksburg | 2.9% | 6.2%(-3.35)#90 | 8.8%(-5.92)#3,325 |
| 91. | Catonsville | 2.9% | 6.2%(-3.33)#91 | 8.8%(-5.89)#3,354 |
| 92. | Camp Springs | 2.9% | 6.2%(-3.32)#92 | 8.8%(-5.89)#3,360 |
| 93. | Rising Sun | 2.9% | 6.2%(-3.30)#93 | 8.8%(-5.86)#3,404 |
| 94. | Friendly | 2.9% | 6.2%(-3.29)#94 | 8.8%(-5.86)#3,413 |
| 95. | Chesapeake Beach | 2.9% | 6.2%(-3.29)#95 | 8.8%(-5.85)#3,430 |
| 96. | Damascus | 2.9% | 6.2%(-3.28)#96 | 8.8%(-5.85)#3,439 |
| 97. | Gambrills | 3.0% | 6.2%(-3.24)#97 | 8.8%(-5.81)#3,512 |
| 98. | Highland | 3.0% | 6.2%(-3.22)#98 | 8.8%(-5.79)#3,542 |
| 99. | Peppermill Village | 3.0% | 6.2%(-3.19)#99 | 8.8%(-5.76)#3,589 |
| 100. | Burtonsville | 3.0% | 6.2%(-3.19)#100 | 8.8%(-5.75)#3,593 |
Common Questions
What are the Top 10 Cities with the Lowest Poverty Level Among Families in Maryland?
Top 10 Cities with the Lowest Poverty Level Among Families in Maryland are:
#1
0.50%
#2
0.55%
#3
0.60%
#4
0.63%
#5
0.69%
#6
0.77%
#7
0.79%
#8
0.81%
#9
0.83%
#10
0.83%
What city has the Lowest Poverty Level Among Families in Maryland?
Walkersville has the Lowest Poverty Level Among Families in Maryland with 0.50%.
What is the Poverty Level Among Families in the State of Maryland?
Poverty Level Among Families in Maryland is 6.2%.
What is the Poverty Level Among Families in the United States?
Poverty Level Among Families in the United States is 8.8%.