Cities with the Lowest Poverty Level Among Families in Mississippi
RELATED REPORTS & OPTIONS
Lowest Family Poverty
Mississippi
Compare Cities
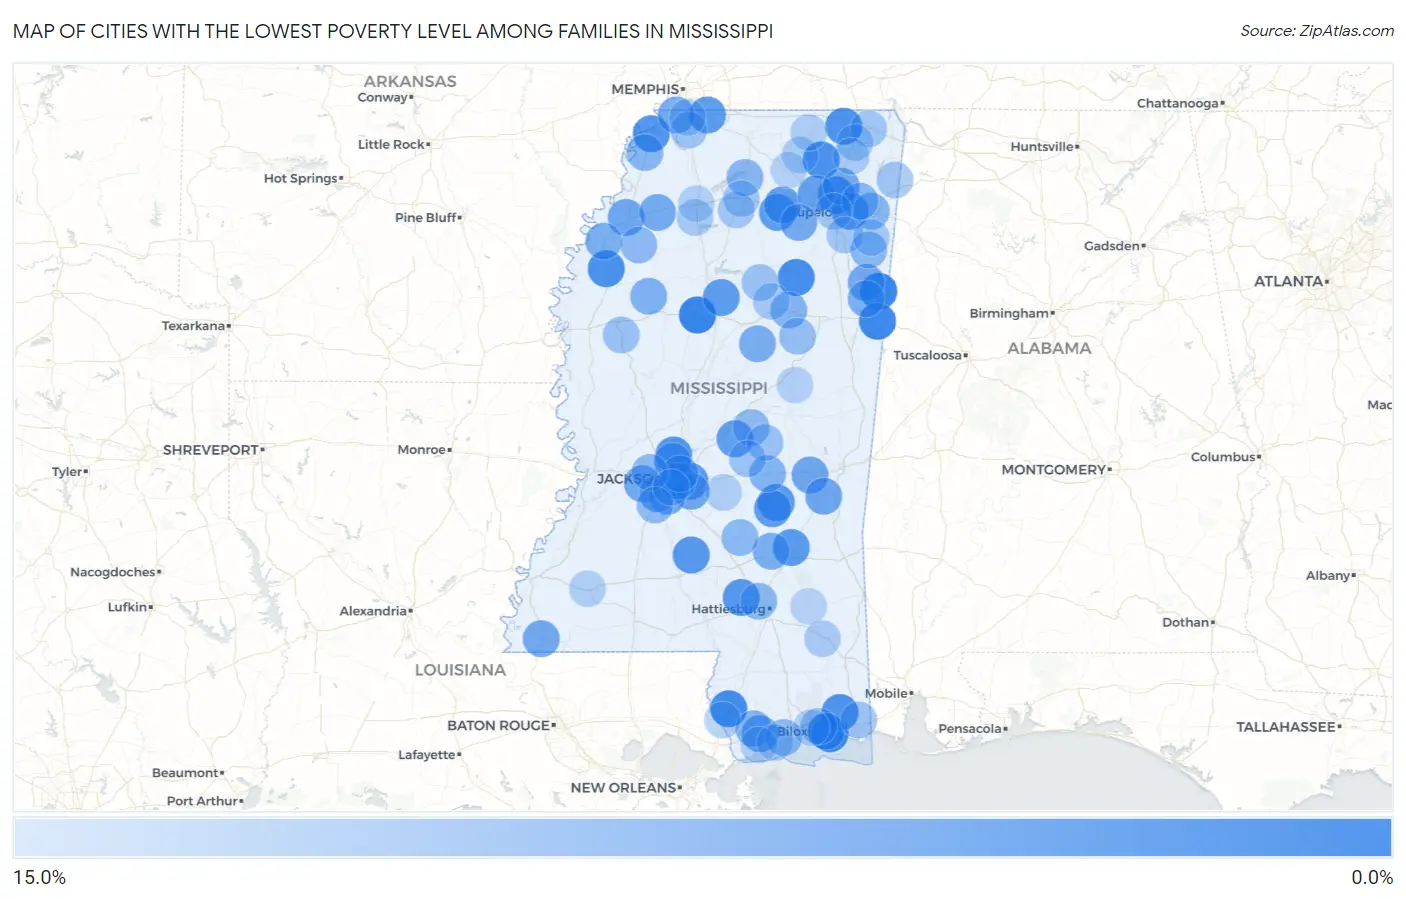
Map of Cities with the Lowest Poverty Level Among Families in Mississippi
15.0%
0.0%
Cities with the Lowest Poverty Level Among Families in Mississippi
| City | Family Poverty | vs State | vs National | |
| 1. | Carrollton | 0.82% | 14.4%(-13.6)#1 | 8.8%(-7.96)#339 |
| 2. | Caledonia | 1.0% | 14.4%(-13.4)#2 | 8.8%(-7.74)#574 |
| 3. | New Hope | 1.3% | 14.4%(-13.1)#3 | 8.8%(-7.45)#931 |
| 4. | Gulf Park Estates | 1.6% | 14.4%(-12.8)#4 | 8.8%(-7.18)#1,288 |
| 5. | Hide A Way Lake | 1.7% | 14.4%(-12.8)#5 | 8.8%(-7.13)#1,355 |
| 6. | Woodland | 1.9% | 14.4%(-12.6)#6 | 8.8%(-6.93)#1,660 |
| 7. | Dumas | 2.3% | 14.4%(-12.1)#7 | 8.8%(-6.51)#2,305 |
| 8. | Merigold | 2.5% | 14.4%(-11.9)#8 | 8.8%(-6.32)#2,612 |
| 9. | Kossuth | 2.6% | 14.4%(-11.8)#9 | 8.8%(-6.15)#2,906 |
| 10. | Vancleave | 2.8% | 14.4%(-11.6)#10 | 8.8%(-6.01)#3,142 |
| 11. | Tunica Resorts | 2.9% | 14.4%(-11.5)#11 | 8.8%(-5.84)#3,448 |
| 12. | Saltillo | 3.1% | 14.4%(-11.3)#12 | 8.8%(-5.65)#3,780 |
| 13. | Ocean Springs | 3.1% | 14.4%(-11.3)#13 | 8.8%(-5.64)#3,791 |
| 14. | Madison | 3.1% | 14.4%(-11.3)#14 | 8.8%(-5.64)#3,802 |
| 15. | Sumrall | 3.4% | 14.4%(-11.0)#15 | 8.8%(-5.38)#4,217 |
| 16. | Montrose | 3.4% | 14.4%(-11.0)#16 | 8.8%(-5.33)#4,305 |
| 17. | New Hebron | 3.5% | 14.4%(-10.9)#17 | 8.8%(-5.24)#4,432 |
| 18. | Sharon | 3.7% | 14.4%(-10.7)#18 | 8.8%(-5.05)#4,782 |
| 19. | Brandon | 3.8% | 14.4%(-10.7)#19 | 8.8%(-5.03)#4,809 |
| 20. | Olive Branch | 3.8% | 14.4%(-10.6)#20 | 8.8%(-4.95)#4,924 |
| 21. | Mooreville | 3.8% | 14.4%(-10.6)#21 | 8.8%(-4.94)#4,938 |
| 22. | Toccopola | 3.8% | 14.4%(-10.6)#22 | 8.8%(-4.94)#4,951 |
| 23. | Duck Hill | 4.0% | 14.4%(-10.4)#23 | 8.8%(-4.74)#5,258 |
| 24. | Thaxton | 4.1% | 14.4%(-10.3)#24 | 8.8%(-4.65)#5,385 |
| 25. | Louin | 4.2% | 14.4%(-10.2)#25 | 8.8%(-4.56)#5,518 |
| 26. | Lena | 4.3% | 14.4%(-10.1)#26 | 8.8%(-4.43)#5,765 |
| 27. | Victoria | 4.4% | 14.4%(-10.0)#27 | 8.8%(-4.41)#5,792 |
| 28. | Blue Springs | 4.8% | 14.4%(-9.64)#28 | 8.8%(-4.02)#6,378 |
| 29. | Diamondhead | 5.4% | 14.4%(-9.01)#29 | 8.8%(-3.39)#7,376 |
| 30. | Lyon | 5.4% | 14.4%(-9.00)#30 | 8.8%(-3.38)#7,394 |
| 31. | Chunky | 5.4% | 14.4%(-9.00)#31 | 8.8%(-3.38)#7,400 |
| 32. | Enterprise | 5.4% | 14.4%(-8.98)#32 | 8.8%(-3.36)#7,434 |
| 33. | Robinhood | 5.5% | 14.4%(-8.91)#33 | 8.8%(-3.29)#7,543 |
| 34. | Ridgeland | 5.5% | 14.4%(-8.87)#34 | 8.8%(-3.25)#7,577 |
| 35. | Woodville | 5.6% | 14.4%(-8.77)#35 | 8.8%(-3.14)#7,745 |
| 36. | Raymond | 5.7% | 14.4%(-8.74)#36 | 8.8%(-3.11)#7,793 |
| 37. | Cleary | 5.8% | 14.4%(-8.63)#37 | 8.8%(-3.00)#7,964 |
| 38. | Lynchburg | 5.8% | 14.4%(-8.62)#38 | 8.8%(-3.00)#7,973 |
| 39. | New Hamilton | 5.8% | 14.4%(-8.59)#39 | 8.8%(-2.96)#8,032 |
| 40. | Algoma | 6.0% | 14.4%(-8.45)#40 | 8.8%(-2.82)#8,235 |
| 41. | Guntown | 6.0% | 14.4%(-8.42)#41 | 8.8%(-2.80)#8,267 |
| 42. | Marks | 6.0% | 14.4%(-8.38)#42 | 8.8%(-2.75)#8,339 |
| 43. | French Camp | 6.3% | 14.4%(-8.06)#43 | 8.8%(-2.43)#8,847 |
| 44. | Byram | 6.4% | 14.4%(-8.00)#44 | 8.8%(-2.37)#8,932 |
| 45. | Soso | 6.5% | 14.4%(-7.95)#45 | 8.8%(-2.33)#8,988 |
| 46. | Duncan | 6.5% | 14.4%(-7.95)#46 | 8.8%(-2.33)#8,994 |
| 47. | Columbus Afb | 6.6% | 14.4%(-7.83)#47 | 8.8%(-2.21)#9,172 |
| 48. | Schlater | 6.9% | 14.4%(-7.51)#48 | 8.8%(-1.89)#9,580 |
| 49. | Gluckstadt | 6.9% | 14.4%(-7.49)#49 | 8.8%(-1.86)#9,619 |
| 50. | Pearl | 7.2% | 14.4%(-7.24)#50 | 8.8%(-1.61)#9,962 |
| 51. | Flowood | 7.2% | 14.4%(-7.21)#51 | 8.8%(-1.58)#9,992 |
| 52. | Lake | 7.2% | 14.4%(-7.16)#52 | 8.8%(-1.54)#10,052 |
| 53. | Kiln | 7.3% | 14.4%(-7.14)#53 | 8.8%(-1.52)#10,078 |
| 54. | Mathiston | 7.3% | 14.4%(-7.06)#54 | 8.8%(-1.43)#10,204 |
| 55. | Abbeville | 7.6% | 14.4%(-6.81)#55 | 8.8%(-1.19)#10,522 |
| 56. | Tunica | 7.6% | 14.4%(-6.81)#56 | 8.8%(-1.18)#10,533 |
| 57. | Fulton | 7.6% | 14.4%(-6.76)#57 | 8.8%(-1.13)#10,579 |
| 58. | Rawls Springs | 7.7% | 14.4%(-6.74)#58 | 8.8%(-1.12)#10,599 |
| 59. | Hatley | 7.8% | 14.4%(-6.59)#59 | 8.8%(-0.969)#10,809 |
| 60. | Mantachie | 7.8% | 14.4%(-6.59)#60 | 8.8%(-0.966)#10,819 |
| 61. | Long Beach | 7.9% | 14.4%(-6.55)#61 | 8.8%(-0.925)#10,876 |
| 62. | Mize | 7.9% | 14.4%(-6.54)#62 | 8.8%(-0.916)#10,888 |
| 63. | Tutwiler | 8.1% | 14.4%(-6.32)#63 | 8.8%(-0.697)#11,154 |
| 64. | Clinton | 8.1% | 14.4%(-6.31)#64 | 8.8%(-0.690)#11,165 |
| 65. | Standing Pine | 8.2% | 14.4%(-6.20)#65 | 8.8%(-0.573)#11,331 |
| 66. | Terry | 8.3% | 14.4%(-6.13)#66 | 8.8%(-0.507)#11,412 |
| 67. | Sturgis | 8.9% | 14.4%(-5.52)#67 | 8.8%(+0.107)#12,193 |
| 68. | Sebastopol | 9.0% | 14.4%(-5.45)#68 | 8.8%(+0.174)#12,258 |
| 69. | St Martin | 9.0% | 14.4%(-5.41)#69 | 8.8%(+0.211)#12,300 |
| 70. | Inverness | 9.1% | 14.4%(-5.31)#70 | 8.8%(+0.309)#12,392 |
| 71. | Slate Springs | 9.1% | 14.4%(-5.31)#71 | 8.8%(+0.309)#12,444 |
| 72. | Hernando | 9.4% | 14.4%(-5.05)#72 | 8.8%(+0.573)#12,708 |
| 73. | Hillsboro | 9.4% | 14.4%(-4.98)#73 | 8.8%(+0.642)#12,777 |
| 74. | Helena | 9.4% | 14.4%(-4.98)#74 | 8.8%(+0.646)#12,783 |
| 75. | Golden | 9.6% | 14.4%(-4.79)#75 | 8.8%(+0.834)#12,993 |
| 76. | Tupelo | 9.6% | 14.4%(-4.76)#76 | 8.8%(+0.862)#13,021 |
| 77. | Taylor | 9.7% | 14.4%(-4.68)#77 | 8.8%(+0.941)#13,129 |
| 78. | Nettleton | 9.7% | 14.4%(-4.67)#78 | 8.8%(+0.953)#13,144 |
| 79. | Oxford | 9.8% | 14.4%(-4.61)#79 | 8.8%(+1.01)#13,215 |
| 80. | Glen | 9.8% | 14.4%(-4.60)#80 | 8.8%(+1.02)#13,227 |
| 81. | Walthall | 10.0% | 14.4%(-4.41)#81 | 8.8%(+1.22)#13,465 |
| 82. | Rienzi | 10.1% | 14.4%(-4.28)#82 | 8.8%(+1.34)#13,593 |
| 83. | Pope | 10.2% | 14.4%(-4.16)#83 | 8.8%(+1.46)#13,710 |
| 84. | Smithville | 10.3% | 14.4%(-4.14)#84 | 8.8%(+1.49)#13,740 |
| 85. | Mclain | 10.5% | 14.4%(-3.94)#85 | 8.8%(+1.68)#13,941 |
| 86. | Blue Mountain | 10.5% | 14.4%(-3.91)#86 | 8.8%(+1.72)#13,986 |
| 87. | Booneville | 10.6% | 14.4%(-3.82)#87 | 8.8%(+1.81)#14,083 |
| 88. | Southaven | 10.7% | 14.4%(-3.71)#88 | 8.8%(+1.91)#14,188 |
| 89. | Falkner | 10.7% | 14.4%(-3.67)#89 | 8.8%(+1.95)#14,224 |
| 90. | Meadville | 10.9% | 14.4%(-3.52)#90 | 8.8%(+2.10)#14,363 |
| 91. | Polkville | 10.9% | 14.4%(-3.52)#91 | 8.8%(+2.10)#14,366 |
| 92. | Waveland | 10.9% | 14.4%(-3.51)#92 | 8.8%(+2.12)#14,380 |
| 93. | Nicholson | 10.9% | 14.4%(-3.49)#93 | 8.8%(+2.14)#14,403 |
| 94. | Noxapater | 11.0% | 14.4%(-3.38)#94 | 8.8%(+2.24)#14,497 |
| 95. | Batesville | 11.1% | 14.4%(-3.32)#95 | 8.8%(+2.30)#14,539 |
| 96. | Biloxi | 11.2% | 14.4%(-3.19)#96 | 8.8%(+2.43)#14,676 |
| 97. | Myrtle | 11.4% | 14.4%(-3.03)#97 | 8.8%(+2.60)#14,838 |
| 98. | Richton | 11.4% | 14.4%(-2.98)#98 | 8.8%(+2.65)#14,878 |
| 99. | Richland | 11.4% | 14.4%(-2.96)#99 | 8.8%(+2.67)#14,910 |
| 100. | Pass Christian | 11.5% | 14.4%(-2.94)#100 | 8.8%(+2.68)#14,929 |
Common Questions
What are the Top 10 Cities with the Lowest Poverty Level Among Families in Mississippi?
Top 10 Cities with the Lowest Poverty Level Among Families in Mississippi are:
#1
0.82%
#2
1.0%
#3
1.3%
#4
1.6%
#5
1.7%
#6
1.9%
#7
2.3%
#8
2.5%
#9
2.6%
#10
2.8%
What city has the Lowest Poverty Level Among Families in Mississippi?
Carrollton has the Lowest Poverty Level Among Families in Mississippi with 0.82%.
What is the Poverty Level Among Families in the State of Mississippi?
Poverty Level Among Families in Mississippi is 14.4%.
What is the Poverty Level Among Families in the United States?
Poverty Level Among Families in the United States is 8.8%.