Cities with the Lowest Poverty Level Among Families in Connecticut
RELATED REPORTS & OPTIONS
Lowest Family Poverty
Connecticut
Compare Cities
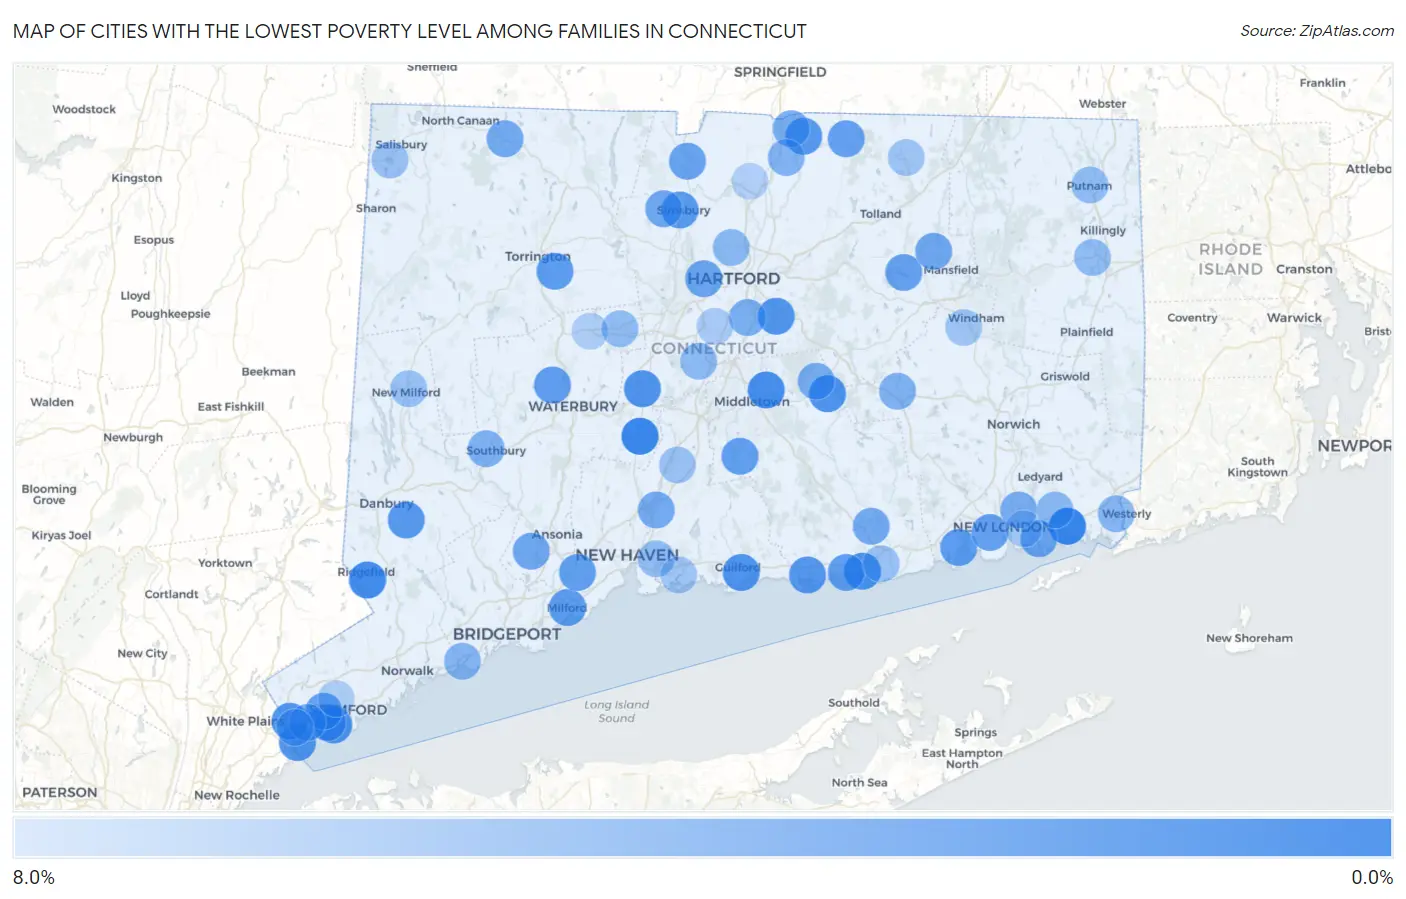
Map of Cities with the Lowest Poverty Level Among Families in Connecticut
8.0%
0.0%
Cities with the Lowest Poverty Level Among Families in Connecticut
| City | Family Poverty | vs State | vs National | |
| 1. | Mystic | 0.34% | 6.8%(-6.51)#1 | 8.8%(-8.45)#34 |
| 2. | Cheshire Village | 0.52% | 6.8%(-6.33)#2 | 8.8%(-8.26)#103 |
| 3. | Newtown Borough | 0.55% | 6.8%(-6.29)#3 | 8.8%(-8.23)#118 |
| 4. | Woodmont Borough | 0.71% | 6.8%(-6.14)#4 | 8.8%(-8.08)#235 |
| 5. | Tashua | 0.91% | 6.8%(-5.94)#5 | 8.8%(-7.87)#439 |
| 6. | Ridgefield | 0.92% | 6.8%(-5.93)#6 | 8.8%(-7.86)#450 |
| 7. | Portland | 1.2% | 6.8%(-5.61)#7 | 8.8%(-7.55)#806 |
| 8. | Greens Farms | 1.3% | 6.8%(-5.58)#8 | 8.8%(-7.52)#843 |
| 9. | Westport | 1.4% | 6.8%(-5.48)#9 | 8.8%(-7.41)#967 |
| 10. | Saugatuck | 1.4% | 6.8%(-5.44)#10 | 8.8%(-7.38)#1,003 |
| 11. | Stonington Borough | 1.4% | 6.8%(-5.44)#11 | 8.8%(-7.38)#1,006 |
| 12. | Saybrook Manor | 1.5% | 6.8%(-5.39)#12 | 8.8%(-7.33)#1,082 |
| 13. | Ridgebury | 1.5% | 6.8%(-5.35)#13 | 8.8%(-7.28)#1,144 |
| 14. | Mill Plain | 1.5% | 6.8%(-5.30)#14 | 8.8%(-7.24)#1,213 |
| 15. | East Hampton | 1.5% | 6.8%(-5.30)#15 | 8.8%(-7.23)#1,219 |
| 16. | Old Greenwich | 1.7% | 6.8%(-5.18)#16 | 8.8%(-7.11)#1,390 |
| 17. | Plantsville | 1.7% | 6.8%(-5.14)#17 | 8.8%(-7.08)#1,431 |
| 18. | Guilford Center | 1.7% | 6.8%(-5.13)#18 | 8.8%(-7.07)#1,443 |
| 19. | Glastonbury Center | 1.8% | 6.8%(-5.00)#19 | 8.8%(-6.94)#1,652 |
| 20. | Byram | 1.8% | 6.8%(-5.00)#20 | 8.8%(-6.93)#1,654 |
| 21. | Glenville | 1.9% | 6.8%(-4.97)#21 | 8.8%(-6.90)#1,703 |
| 22. | Old Hill | 1.9% | 6.8%(-4.96)#22 | 8.8%(-6.89)#1,726 |
| 23. | Clinton | 2.0% | 6.8%(-4.82)#23 | 8.8%(-6.76)#1,922 |
| 24. | Sandy Hook | 2.1% | 6.8%(-4.73)#24 | 8.8%(-6.67)#2,052 |
| 25. | Hazardville | 2.1% | 6.8%(-4.70)#25 | 8.8%(-6.64)#2,089 |
| 26. | Bethel | 2.2% | 6.8%(-4.68)#26 | 8.8%(-6.62)#2,121 |
| 27. | Simsbury Center | 2.3% | 6.8%(-4.57)#27 | 8.8%(-6.51)#2,317 |
| 28. | Riverside | 2.3% | 6.8%(-4.52)#28 | 8.8%(-6.46)#2,383 |
| 29. | Niantic | 2.4% | 6.8%(-4.44)#29 | 8.8%(-6.38)#2,519 |
| 30. | Milford City Balance | 2.4% | 6.8%(-4.42)#30 | 8.8%(-6.36)#2,551 |
| 31. | Poplar Plains | 2.4% | 6.8%(-4.42)#31 | 8.8%(-6.35)#2,558 |
| 32. | Northwest Harwinton | 2.5% | 6.8%(-4.35)#32 | 8.8%(-6.29)#2,670 |
| 33. | Oakville | 2.7% | 6.8%(-4.15)#33 | 8.8%(-6.09)#3,016 |
| 34. | Naugatuck Borough | 2.7% | 6.8%(-4.12)#34 | 8.8%(-6.05)#3,071 |
| 35. | Westbrook Center | 2.8% | 6.8%(-4.10)#35 | 8.8%(-6.03)#3,113 |
| 36. | Orange | 2.8% | 6.8%(-4.05)#36 | 8.8%(-5.98)#3,197 |
| 37. | New Canaan | 2.8% | 6.8%(-4.04)#37 | 8.8%(-5.98)#3,205 |
| 38. | Durham | 2.8% | 6.8%(-4.03)#38 | 8.8%(-5.96)#3,245 |
| 39. | Litchfield Borough | 2.8% | 6.8%(-4.02)#39 | 8.8%(-5.96)#3,249 |
| 40. | Waterford | 2.9% | 6.8%(-3.94)#40 | 8.8%(-5.88)#3,383 |
| 41. | Cos Cob | 2.9% | 6.8%(-3.91)#41 | 8.8%(-5.85)#3,433 |
| 42. | Somers | 3.0% | 6.8%(-3.89)#42 | 8.8%(-5.83)#3,486 |
| 43. | Jewett City Borough | 3.0% | 6.8%(-3.84)#43 | 8.8%(-5.78)#3,562 |
| 44. | South Coventry | 3.1% | 6.8%(-3.72)#44 | 8.8%(-5.66)#3,760 |
| 45. | Salmon Brook | 3.1% | 6.8%(-3.71)#45 | 8.8%(-5.64)#3,794 |
| 46. | Tokeneke | 3.2% | 6.8%(-3.65)#46 | 8.8%(-5.59)#3,869 |
| 47. | Stepney | 3.3% | 6.8%(-3.57)#47 | 8.8%(-5.51)#4,001 |
| 48. | West Hartford | 3.3% | 6.8%(-3.55)#48 | 8.8%(-5.49)#4,041 |
| 49. | Poquonock Bridge | 3.3% | 6.8%(-3.51)#49 | 8.8%(-5.45)#4,104 |
| 50. | West Simsbury | 3.5% | 6.8%(-3.32)#50 | 8.8%(-5.25)#4,409 |
| 51. | Shelton | 3.5% | 6.8%(-3.32)#51 | 8.8%(-5.25)#4,417 |
| 52. | Storrs | 3.5% | 6.8%(-3.31)#52 | 8.8%(-5.25)#4,419 |
| 53. | Northford | 3.5% | 6.8%(-3.31)#53 | 8.8%(-5.24)#4,429 |
| 54. | Noroton | 3.7% | 6.8%(-3.15)#54 | 8.8%(-5.09)#4,693 |
| 55. | Norfolk | 3.8% | 6.8%(-3.05)#55 | 8.8%(-4.98)#4,875 |
| 56. | Trumbull Center | 3.8% | 6.8%(-3.03)#56 | 8.8%(-4.96)#4,906 |
| 57. | Essex Village | 3.9% | 6.8%(-3.00)#57 | 8.8%(-4.93)#4,968 |
| 58. | Plattsville | 3.9% | 6.8%(-2.94)#58 | 8.8%(-4.88)#5,027 |
| 59. | Stratford Downtown | 4.0% | 6.8%(-2.89)#59 | 8.8%(-4.83)#5,116 |
| 60. | North Haven | 4.0% | 6.8%(-2.86)#60 | 8.8%(-4.80)#5,160 |
| 61. | Sherwood Manor | 4.0% | 6.8%(-2.83)#61 | 8.8%(-4.76)#5,219 |
| 62. | Lake Pocotopaug | 4.1% | 6.8%(-2.78)#62 | 8.8%(-4.72)#5,292 |
| 63. | Oronoque | 4.1% | 6.8%(-2.71)#63 | 8.8%(-4.65)#5,395 |
| 64. | Conning Towers Nautilus Park | 4.2% | 6.8%(-2.60)#64 | 8.8%(-4.54)#5,568 |
| 65. | Wethersfield | 4.3% | 6.8%(-2.53)#65 | 8.8%(-4.47)#5,686 |
| 66. | Greenwich | 4.3% | 6.8%(-2.52)#66 | 8.8%(-4.45)#5,707 |
| 67. | Coleytown | 4.4% | 6.8%(-2.41)#67 | 8.8%(-4.35)#5,874 |
| 68. | Heritage Village | 4.5% | 6.8%(-2.34)#68 | 8.8%(-4.27)#5,984 |
| 69. | Candlewood Orchards | 4.6% | 6.8%(-2.27)#69 | 8.8%(-4.21)#6,094 |
| 70. | Colchester | 4.6% | 6.8%(-2.27)#70 | 8.8%(-4.21)#6,095 |
| 71. | Pemberwick | 4.7% | 6.8%(-2.11)#71 | 8.8%(-4.05)#6,343 |
| 72. | Southwood Acres | 4.8% | 6.8%(-2.08)#72 | 8.8%(-4.02)#6,359 |
| 73. | Southport | 4.9% | 6.8%(-1.91)#73 | 8.8%(-3.85)#6,641 |
| 74. | Pawcatuck | 5.0% | 6.8%(-1.80)#74 | 8.8%(-3.74)#6,847 |
| 75. | Daniels Farm | 5.1% | 6.8%(-1.76)#75 | 8.8%(-3.69)#6,908 |
| 76. | Old Mystic | 5.2% | 6.8%(-1.65)#76 | 8.8%(-3.59)#7,060 |
| 77. | Blue Hills | 5.2% | 6.8%(-1.63)#77 | 8.8%(-3.56)#7,090 |
| 78. | Kensington | 5.4% | 6.8%(-1.48)#78 | 8.8%(-3.41)#7,343 |
| 79. | Bristol | 5.7% | 6.8%(-1.20)#79 | 8.8%(-3.13)#7,755 |
| 80. | Ball Pond | 5.7% | 6.8%(-1.14)#80 | 8.8%(-3.07)#7,860 |
| 81. | East Brooklyn | 5.7% | 6.8%(-1.13)#81 | 8.8%(-3.07)#7,862 |
| 82. | Putnam | 5.7% | 6.8%(-1.10)#82 | 8.8%(-3.04)#7,906 |
| 83. | East Haven | 5.8% | 6.8%(-1.04)#83 | 8.8%(-2.97)#8,014 |
| 84. | New Milford | 6.0% | 6.8%(-0.838)#84 | 8.8%(-2.77)#8,301 |
| 85. | Lakeville | 6.0% | 6.8%(-0.811)#85 | 8.8%(-2.75)#8,349 |
| 86. | Compo | 6.1% | 6.8%(-0.719)#86 | 8.8%(-2.65)#8,483 |
| 87. | Lordship | 6.2% | 6.8%(-0.669)#87 | 8.8%(-2.61)#8,560 |
| 88. | Wallingford Center | 6.2% | 6.8%(-0.625)#88 | 8.8%(-2.56)#8,614 |
| 89. | Old Saybrook Center | 6.2% | 6.8%(-0.623)#89 | 8.8%(-2.56)#8,617 |
| 90. | Staples | 6.4% | 6.8%(-0.404)#90 | 8.8%(-2.34)#8,979 |
| 91. | Stafford Springs | 6.5% | 6.8%(-0.383)#91 | 8.8%(-2.32)#9,017 |
| 92. | Branford Center | 6.5% | 6.8%(-0.297)#92 | 8.8%(-2.23)#9,135 |
| 93. | Riverton | 6.6% | 6.8%(-0.289)#93 | 8.8%(-2.22)#9,152 |
| 94. | South Windham | 6.6% | 6.8%(-0.263)#94 | 8.8%(-2.20)#9,186 |
| 95. | Long Hill | 6.8% | 6.8%(-0.006)#95 | 8.8%(-1.94)#9,518 |
| 96. | Newington | 7.1% | 6.8%(+0.231)#96 | 8.8%(-1.70)#9,811 |
| 97. | Terryville | 7.3% | 6.8%(+0.458)#97 | 8.8%(-1.48)#10,137 |
| 98. | Stamford | 7.3% | 6.8%(+0.490)#98 | 8.8%(-1.45)#10,187 |
| 99. | Windsor Locks | 7.5% | 6.8%(+0.688)#99 | 8.8%(-1.25)#10,453 |
| 100. | Noroton Heights | 7.8% | 6.8%(+0.959)#100 | 8.8%(-0.977)#10,799 |
1
2Common Questions
What are the Top 10 Cities with the Lowest Poverty Level Among Families in Connecticut?
Top 10 Cities with the Lowest Poverty Level Among Families in Connecticut are:
#1
0.34%
#2
0.52%
#3
0.92%
#4
1.2%
#5
1.5%
#6
1.5%
#7
1.7%
#8
1.7%
#9
1.7%
#10
1.8%
What city has the Lowest Poverty Level Among Families in Connecticut?
Mystic has the Lowest Poverty Level Among Families in Connecticut with 0.34%.
What is the Poverty Level Among Families in the State of Connecticut?
Poverty Level Among Families in Connecticut is 6.8%.
What is the Poverty Level Among Families in the United States?
Poverty Level Among Families in the United States is 8.8%.