Cities with the Lowest Poverty Level Among Families in Alabama
RELATED REPORTS & OPTIONS
Lowest Family Poverty
Alabama
Compare Cities
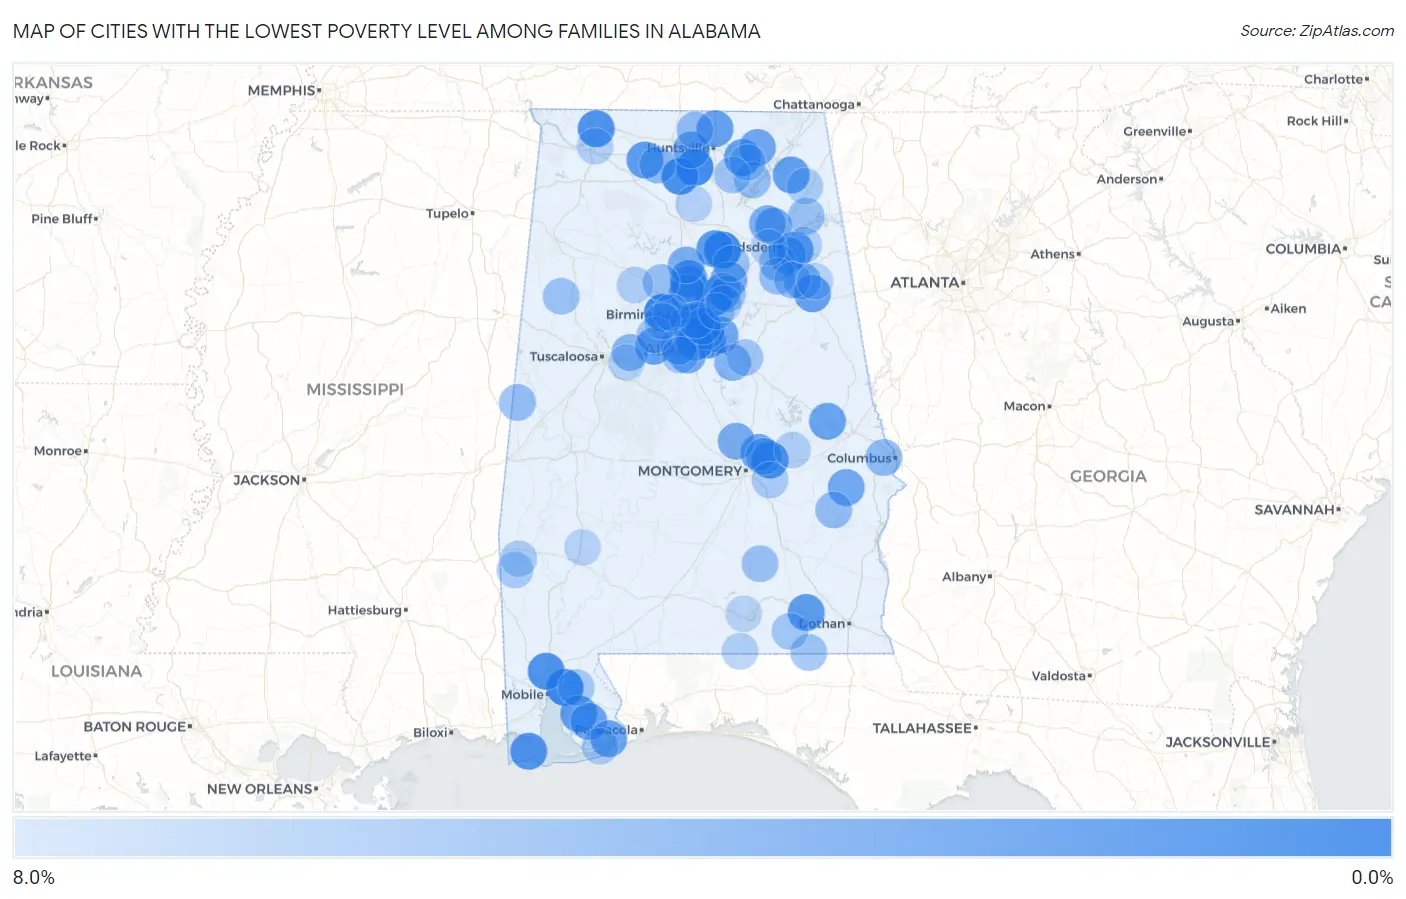
Map of Cities with the Lowest Poverty Level Among Families in Alabama
8.0%
0.0%
Cities with the Lowest Poverty Level Among Families in Alabama
| City | Family Poverty | vs State | vs National | |
| 1. | Sylvan Springs | 0.23% | 11.3%(-11.1)#1 | 8.8%(-8.56)#10 |
| 2. | Spanish Fort | 0.55% | 11.3%(-10.7)#2 | 8.8%(-8.23)#115 |
| 3. | Triana | 0.68% | 11.3%(-10.6)#3 | 8.8%(-8.10)#212 |
| 4. | Rosa | 0.72% | 11.3%(-10.6)#4 | 8.8%(-8.06)#251 |
| 5. | Trussville | 0.82% | 11.3%(-10.5)#5 | 8.8%(-7.97)#335 |
| 6. | Priceville | 1.0% | 11.3%(-10.2)#6 | 8.8%(-7.74)#583 |
| 7. | St Florian | 1.2% | 11.3%(-10.1)#7 | 8.8%(-7.57)#776 |
| 8. | Satsuma | 1.3% | 11.3%(-9.98)#8 | 8.8%(-7.47)#891 |
| 9. | Dauphin Island | 1.5% | 11.3%(-9.78)#9 | 8.8%(-7.27)#1,165 |
| 10. | Emerald Mountain | 1.6% | 11.3%(-9.66)#10 | 8.8%(-7.15)#1,333 |
| 11. | Vestavia Hills | 1.7% | 11.3%(-9.63)#11 | 8.8%(-7.12)#1,371 |
| 12. | Kimberly | 1.7% | 11.3%(-9.61)#12 | 8.8%(-7.10)#1,398 |
| 13. | Chelsea | 1.9% | 11.3%(-9.44)#13 | 8.8%(-6.93)#1,662 |
| 14. | Silverhill | 1.9% | 11.3%(-9.43)#14 | 8.8%(-6.92)#1,674 |
| 15. | Cleveland | 1.9% | 11.3%(-9.40)#15 | 8.8%(-6.89)#1,715 |
| 16. | Level Plains | 2.0% | 11.3%(-9.31)#16 | 8.8%(-6.80)#1,863 |
| 17. | Hillsboro | 2.0% | 11.3%(-9.30)#17 | 8.8%(-6.79)#1,876 |
| 18. | Paint Rock | 2.1% | 11.3%(-9.21)#18 | 8.8%(-6.70)#2,007 |
| 19. | Hokes Bluff | 2.1% | 11.3%(-9.20)#19 | 8.8%(-6.69)#2,016 |
| 20. | Meadowbrook | 2.2% | 11.3%(-9.14)#20 | 8.8%(-6.63)#2,115 |
| 21. | Powell | 2.2% | 11.3%(-9.12)#21 | 8.8%(-6.61)#2,139 |
| 22. | Lake View | 2.3% | 11.3%(-8.97)#22 | 8.8%(-6.46)#2,387 |
| 23. | Choccolocco | 2.3% | 11.3%(-8.94)#23 | 8.8%(-6.43)#2,424 |
| 24. | Meridianville | 2.4% | 11.3%(-8.87)#24 | 8.8%(-6.36)#2,550 |
| 25. | Summerdale | 2.5% | 11.3%(-8.83)#25 | 8.8%(-6.32)#2,607 |
| 26. | Homewood | 2.5% | 11.3%(-8.81)#26 | 8.8%(-6.30)#2,642 |
| 27. | Glencoe | 2.5% | 11.3%(-8.78)#27 | 8.8%(-6.27)#2,707 |
| 28. | Waverly | 2.6% | 11.3%(-8.73)#28 | 8.8%(-6.22)#2,788 |
| 29. | Blue Ridge | 2.6% | 11.3%(-8.69)#29 | 8.8%(-6.18)#2,856 |
| 30. | Morris | 2.6% | 11.3%(-8.68)#30 | 8.8%(-6.17)#2,868 |
| 31. | Perdido Beach | 2.6% | 11.3%(-8.68)#31 | 8.8%(-6.17)#2,870 |
| 32. | Whitesboro | 2.8% | 11.3%(-8.50)#32 | 8.8%(-5.99)#3,185 |
| 33. | Westover | 2.8% | 11.3%(-8.48)#33 | 8.8%(-5.97)#3,224 |
| 34. | Springville | 2.8% | 11.3%(-8.45)#34 | 8.8%(-5.94)#3,272 |
| 35. | Hurtsboro | 2.9% | 11.3%(-8.41)#35 | 8.8%(-5.90)#3,351 |
| 36. | Pleasant Groves | 2.9% | 11.3%(-8.39)#36 | 8.8%(-5.88)#3,374 |
| 37. | Madison | 2.9% | 11.3%(-8.37)#37 | 8.8%(-5.86)#3,423 |
| 38. | Alabaster | 3.0% | 11.3%(-8.29)#38 | 8.8%(-5.78)#3,563 |
| 39. | Gardendale | 3.0% | 11.3%(-8.25)#39 | 8.8%(-5.74)#3,627 |
| 40. | Hoover | 3.1% | 11.3%(-8.22)#40 | 8.8%(-5.71)#3,667 |
| 41. | Remlap | 3.1% | 11.3%(-8.17)#41 | 8.8%(-5.66)#3,752 |
| 42. | Deatsville | 3.1% | 11.3%(-8.14)#42 | 8.8%(-5.63)#3,805 |
| 43. | Highland Lakes | 3.2% | 11.3%(-8.08)#43 | 8.8%(-5.57)#3,901 |
| 44. | Pelham | 3.2% | 11.3%(-8.06)#44 | 8.8%(-5.55)#3,939 |
| 45. | Helena | 3.2% | 11.3%(-8.05)#45 | 8.8%(-5.54)#3,943 |
| 46. | Smoke Rise | 3.3% | 11.3%(-8.00)#46 | 8.8%(-5.49)#4,027 |
| 47. | Eagle Point | 3.4% | 11.3%(-7.88)#47 | 8.8%(-5.37)#4,246 |
| 48. | Sardis City | 3.4% | 11.3%(-7.87)#48 | 8.8%(-5.36)#4,257 |
| 49. | Argo | 3.5% | 11.3%(-7.77)#49 | 8.8%(-5.26)#4,406 |
| 50. | Brook Highland | 3.8% | 11.3%(-7.53)#50 | 8.8%(-5.02)#4,819 |
| 51. | Weaver | 3.8% | 11.3%(-7.49)#51 | 8.8%(-4.98)#4,884 |
| 52. | Mountain Brook | 3.9% | 11.3%(-7.42)#52 | 8.8%(-4.91)#4,990 |
| 53. | Fayetteville | 3.9% | 11.3%(-7.42)#53 | 8.8%(-4.91)#4,992 |
| 54. | Brookwood | 3.9% | 11.3%(-7.36)#54 | 8.8%(-4.85)#5,072 |
| 55. | Redland | 4.1% | 11.3%(-7.23)#55 | 8.8%(-4.72)#5,288 |
| 56. | Trinity | 4.2% | 11.3%(-7.04)#56 | 8.8%(-4.53)#5,577 |
| 57. | Ladonia | 4.3% | 11.3%(-7.02)#57 | 8.8%(-4.51)#5,623 |
| 58. | Mount Olive Cdp Jefferson County | 4.3% | 11.3%(-7.01)#58 | 8.8%(-4.50)#5,634 |
| 59. | Harvest | 4.3% | 11.3%(-6.95)#59 | 8.8%(-4.44)#5,725 |
| 60. | Southside | 4.5% | 11.3%(-6.84)#60 | 8.8%(-4.33)#5,901 |
| 61. | Midway | 4.5% | 11.3%(-6.83)#61 | 8.8%(-4.32)#5,914 |
| 62. | Ohatchee | 4.6% | 11.3%(-6.70)#62 | 8.8%(-4.19)#6,127 |
| 63. | Geiger | 4.6% | 11.3%(-6.69)#63 | 8.8%(-4.18)#6,139 |
| 64. | Sumiton | 4.6% | 11.3%(-6.67)#64 | 8.8%(-4.16)#6,176 |
| 65. | Alexandria | 4.7% | 11.3%(-6.62)#65 | 8.8%(-4.11)#6,261 |
| 66. | Glenwood | 4.8% | 11.3%(-6.53)#66 | 8.8%(-4.02)#6,385 |
| 67. | Margaret | 4.8% | 11.3%(-6.48)#67 | 8.8%(-3.97)#6,459 |
| 68. | Grant | 4.8% | 11.3%(-6.44)#68 | 8.8%(-3.93)#6,508 |
| 69. | Belk | 4.9% | 11.3%(-6.41)#69 | 8.8%(-3.90)#6,554 |
| 70. | Sand Rock | 4.9% | 11.3%(-6.40)#70 | 8.8%(-3.89)#6,576 |
| 71. | Highland Lake | 4.9% | 11.3%(-6.40)#71 | 8.8%(-3.89)#6,582 |
| 72. | Black | 5.0% | 11.3%(-6.29)#72 | 8.8%(-3.78)#6,751 |
| 73. | North Johns | 5.0% | 11.3%(-6.29)#73 | 8.8%(-3.78)#6,769 |
| 74. | New Hope | 5.0% | 11.3%(-6.27)#74 | 8.8%(-3.76)#6,805 |
| 75. | Oak Grove | 5.2% | 11.3%(-6.14)#75 | 8.8%(-3.63)#7,015 |
| 76. | Coffee Springs | 5.2% | 11.3%(-6.12)#76 | 8.8%(-3.61)#7,032 |
| 77. | Brantleyville | 5.3% | 11.3%(-5.97)#77 | 8.8%(-3.46)#7,276 |
| 78. | Mccalla | 5.3% | 11.3%(-5.95)#78 | 8.8%(-3.44)#7,314 |
| 79. | Edgewater | 5.4% | 11.3%(-5.89)#79 | 8.8%(-3.38)#7,386 |
| 80. | Stapleton | 5.5% | 11.3%(-5.79)#80 | 8.8%(-3.28)#7,551 |
| 81. | Millry | 5.6% | 11.3%(-5.74)#81 | 8.8%(-3.23)#7,616 |
| 82. | Pike Road | 5.6% | 11.3%(-5.70)#82 | 8.8%(-3.19)#7,677 |
| 83. | Pine Ridge | 5.6% | 11.3%(-5.67)#83 | 8.8%(-3.16)#7,729 |
| 84. | Leeds | 5.6% | 11.3%(-5.65)#84 | 8.8%(-3.14)#7,744 |
| 85. | Orange Beach | 5.7% | 11.3%(-5.63)#85 | 8.8%(-3.12)#7,766 |
| 86. | Cullomburg | 5.7% | 11.3%(-5.63)#86 | 8.8%(-3.12)#7,777 |
| 87. | Woodville | 5.7% | 11.3%(-5.62)#87 | 8.8%(-3.11)#7,791 |
| 88. | Ballplay | 5.8% | 11.3%(-5.54)#88 | 8.8%(-3.03)#7,930 |
| 89. | Parrish | 5.8% | 11.3%(-5.53)#89 | 8.8%(-3.02)#7,938 |
| 90. | Tallassee | 5.8% | 11.3%(-5.51)#90 | 8.8%(-3.00)#7,979 |
| 91. | Moody | 5.8% | 11.3%(-5.45)#91 | 8.8%(-2.94)#8,066 |
| 92. | Lockhart | 5.9% | 11.3%(-5.41)#92 | 8.8%(-2.90)#8,123 |
| 93. | Muscle Shoals | 5.9% | 11.3%(-5.38)#93 | 8.8%(-2.87)#8,174 |
| 94. | Concord | 5.9% | 11.3%(-5.36)#94 | 8.8%(-2.85)#8,202 |
| 95. | Eva | 6.0% | 11.3%(-5.29)#95 | 8.8%(-2.78)#8,285 |
| 96. | Coaling | 6.0% | 11.3%(-5.27)#96 | 8.8%(-2.76)#8,323 |
| 97. | Fulton | 6.0% | 11.3%(-5.27)#97 | 8.8%(-2.76)#8,331 |
| 98. | White Plains | 6.1% | 11.3%(-5.22)#98 | 8.8%(-2.71)#8,416 |
| 99. | Babbie | 6.1% | 11.3%(-5.18)#99 | 8.8%(-2.67)#8,461 |
| 100. | Attalla | 6.2% | 11.3%(-5.14)#100 | 8.8%(-2.63)#8,525 |
Common Questions
What are the Top 10 Cities with the Lowest Poverty Level Among Families in Alabama?
Top 10 Cities with the Lowest Poverty Level Among Families in Alabama are:
#1
0.23%
#2
0.55%
#3
0.68%
#4
0.72%
#5
0.82%
#6
1.0%
#7
1.2%
#8
1.3%
#9
1.5%
#10
1.6%
What city has the Lowest Poverty Level Among Families in Alabama?
Sylvan Springs has the Lowest Poverty Level Among Families in Alabama with 0.23%.
What is the Poverty Level Among Families in the State of Alabama?
Poverty Level Among Families in Alabama is 11.3%.
What is the Poverty Level Among Families in the United States?
Poverty Level Among Families in the United States is 8.8%.