East Whittier, CA Map & Demographics
East Whittier Map
East Whittier Overview
$36,426
PER CAPITA INCOME
$110,642
AVG FAMILY INCOME
$92,650
AVG HOUSEHOLD INCOME
21.7%
WAGE / INCOME GAP [ % ]
78.3¢/ $1
WAGE / INCOME GAP [ $ ]
0.39
INEQUALITY / GINI INDEX
10,248
TOTAL POPULATION
4,989
MALE POPULATION
5,259
FEMALE POPULATION
94.87
MALES / 100 FEMALES
105.41
FEMALES / 100 MALES
39.3
MEDIAN AGE
3.5
AVG FAMILY SIZE
3.0
AVG HOUSEHOLD SIZE
5,168
LABOR FORCE [ PEOPLE ]
61.3%
PERCENT IN LABOR FORCE
3.4%
UNEMPLOYMENT RATE
Income in East Whittier
Income Overview in East Whittier
Per Capita Income in East Whittier is $36,426, while median incomes of families and households are $110,642 and $92,650 respectively.
| Characteristic | Number | Measure |
| Per Capita Income | 10,248 | $36,426 |
| Median Family Income | 2,531 | $110,642 |
| Mean Family Income | 2,531 | $124,581 |
| Median Household Income | 3,345 | $92,650 |
| Mean Household Income | 3,345 | $108,110 |
| Income Deficit | 2,531 | $0 |
| Wage / Income Gap (%) | 10,248 | 21.75% |
| Wage / Income Gap ($) | 10,248 | 78.25¢ per $1 |
| Gini / Inequality Index | 10,248 | 0.39 |
Earnings by Sex in East Whittier
Average Earnings in East Whittier are $47,841, $53,804 for men and $42,102 for women, a difference of 21.7%.
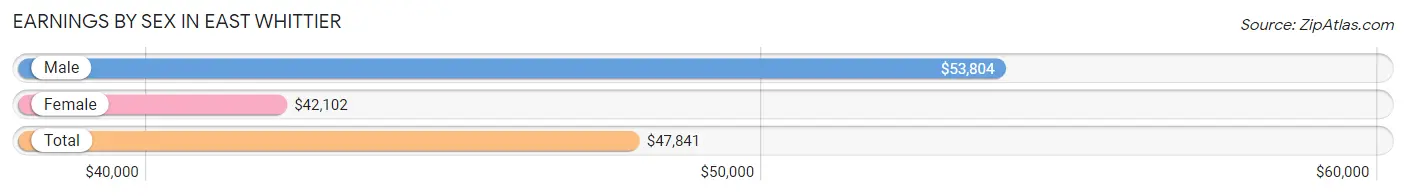
| Sex | Number | Average Earnings |
| Male | 2,890 (54.6%) | $53,804 |
| Female | 2,403 (45.4%) | $42,102 |
| Total | 5,293 (100.0%) | $47,841 |
Earnings by Sex by Income Bracket in East Whittier
The most common earnings brackets in East Whittier are $100,000+ for men (697 | 24.1%) and $100,000+ for women (332 | 13.8%).
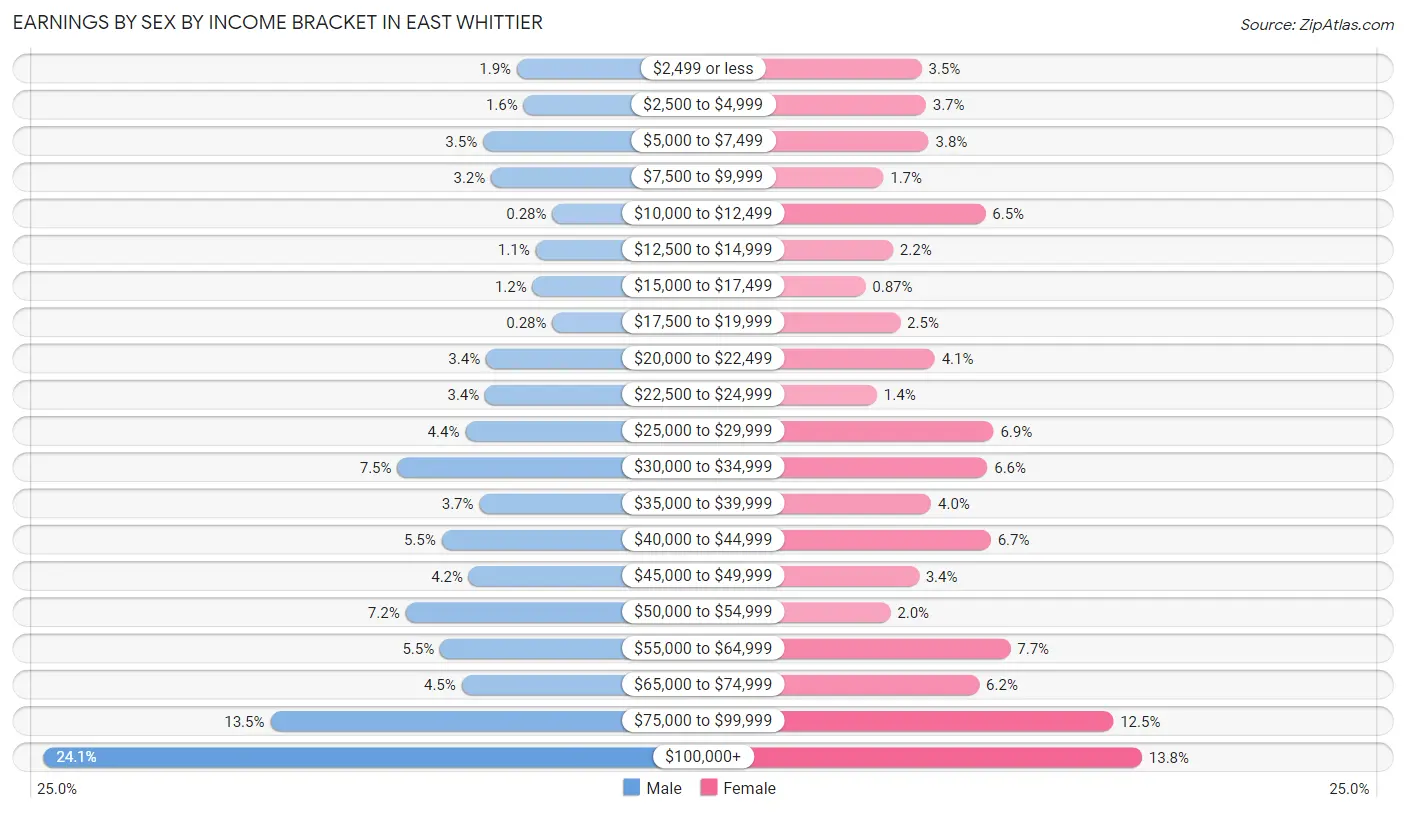
| Income | Male | Female |
| $2,499 or less | 56 (1.9%) | 84 (3.5%) |
| $2,500 to $4,999 | 47 (1.6%) | 89 (3.7%) |
| $5,000 to $7,499 | 102 (3.5%) | 92 (3.8%) |
| $7,500 to $9,999 | 91 (3.2%) | 41 (1.7%) |
| $10,000 to $12,499 | 8 (0.3%) | 156 (6.5%) |
| $12,500 to $14,999 | 31 (1.1%) | 52 (2.2%) |
| $15,000 to $17,499 | 35 (1.2%) | 21 (0.9%) |
| $17,500 to $19,999 | 8 (0.3%) | 60 (2.5%) |
| $20,000 to $22,499 | 98 (3.4%) | 99 (4.1%) |
| $22,500 to $24,999 | 99 (3.4%) | 34 (1.4%) |
| $25,000 to $29,999 | 126 (4.4%) | 165 (6.9%) |
| $30,000 to $34,999 | 218 (7.5%) | 158 (6.6%) |
| $35,000 to $39,999 | 107 (3.7%) | 95 (4.0%) |
| $40,000 to $44,999 | 158 (5.5%) | 162 (6.7%) |
| $45,000 to $49,999 | 121 (4.2%) | 81 (3.4%) |
| $50,000 to $54,999 | 207 (7.2%) | 49 (2.0%) |
| $55,000 to $64,999 | 160 (5.5%) | 184 (7.7%) |
| $65,000 to $74,999 | 131 (4.5%) | 149 (6.2%) |
| $75,000 to $99,999 | 390 (13.5%) | 300 (12.5%) |
| $100,000+ | 697 (24.1%) | 332 (13.8%) |
| Total | 2,890 (100.0%) | 2,403 (100.0%) |
Earnings by Sex by Educational Attainment in East Whittier
Average earnings in East Whittier are $62,333 for men and $45,655 for women, a difference of 26.8%. Men with an educational attainment of bachelor's degree enjoy the highest average annual earnings of $104,479, while those with less than high school education earn the least with $38,875. Women with an educational attainment of bachelor's degree earn the most with the average annual earnings of $77,674, while those with less than high school education have the smallest earnings of $13,920.
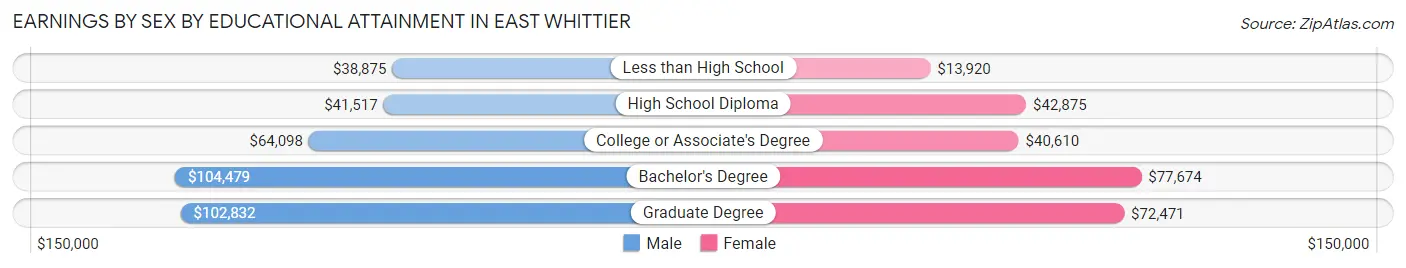
| Educational Attainment | Male Income | Female Income |
| Less than High School | $38,875 | $13,920 |
| High School Diploma | $41,517 | $42,875 |
| College or Associate's Degree | $64,098 | $40,610 |
| Bachelor's Degree | $104,479 | $77,674 |
| Graduate Degree | $102,832 | $72,471 |
| Total | $62,333 | $45,655 |
Family Income in East Whittier
Family Income Brackets in East Whittier
According to the East Whittier family income data, there are 572 families falling into the $100,000 to $149,999 income range, which is the most common income bracket and makes up 22.6% of all families.
| Income Bracket | # Families | % Families |
| Less than $10,000 | 23 | 0.9% |
| $10,000 to $14,999 | 0 | 0.0% |
| $15,000 to $24,999 | 40 | 1.6% |
| $25,000 to $34,999 | 111 | 4.4% |
| $35,000 to $49,999 | 283 | 11.2% |
| $50,000 to $74,999 | 354 | 14.0% |
| $75,000 to $99,999 | 337 | 13.3% |
| $100,000 to $149,999 | 572 | 22.6% |
| $150,000 to $199,999 | 380 | 15.0% |
| $200,000+ | 430 | 17.0% |
Family Income by Famaliy Size in East Whittier
5-person families (291 | 11.5%) account for the highest median family income in East Whittier with $150,048 per family, while 2-person families (776 | 30.7%) have the highest median income of $40,118 per family member.
| Income Bracket | # Families | Median Income |
| 2-Person Families | 776 (30.7%) | $80,236 |
| 3-Person Families | 626 (24.7%) | $118,269 |
| 4-Person Families | 774 (30.6%) | $131,818 |
| 5-Person Families | 291 (11.5%) | $150,048 |
| 6-Person Families | 51 (2.0%) | $149,792 |
| 7+ Person Families | 13 (0.5%) | $0 |
| Total | 2,531 (100.0%) | $110,642 |
Family Income by Number of Earners in East Whittier
The median family income in East Whittier is $110,642, with families comprising 3+ earners (398) having the highest median family income of $177,857, while families with no earners (327) have the lowest median family income of $52,546, accounting for 15.7% and 12.9% of families, respectively.
| Number of Earners | # Families | Median Income |
| No Earners | 327 (12.9%) | $52,546 |
| 1 Earner | 633 (25.0%) | $74,693 |
| 2 Earners | 1,173 (46.4%) | $131,705 |
| 3+ Earners | 398 (15.7%) | $177,857 |
| Total | 2,531 (100.0%) | $110,642 |
Household Income in East Whittier
Household Income Brackets in East Whittier
With 612 households falling in the category, the $100,000 to $149,999 income range is the most frequent in East Whittier, accounting for 18.3% of all households. In contrast, only 23 households (0.7%) fall into the $10,000 to $14,999 income bracket, making it the least populous group.
| Income Bracket | # Households | % Households |
| Less than $10,000 | 161 | 4.8% |
| $10,000 to $14,999 | 23 | 0.7% |
| $15,000 to $24,999 | 137 | 4.1% |
| $25,000 to $34,999 | 221 | 6.6% |
| $35,000 to $49,999 | 405 | 12.1% |
| $50,000 to $74,999 | 432 | 12.9% |
| $75,000 to $99,999 | 485 | 14.5% |
| $100,000 to $149,999 | 612 | 18.3% |
| $150,000 to $199,999 | 421 | 12.6% |
| $200,000+ | 448 | 13.4% |
Household Income by Householder Age in East Whittier
The median household income in East Whittier is $92,650, with the highest median household income of $115,000 found in the 45 to 64 years age bracket for the primary householder. A total of 1,360 households (40.7%) fall into this category. Meanwhile, the 15 to 24 years age bracket for the primary householder has the lowest median household income of $0, with 48 households (1.4%) in this group.
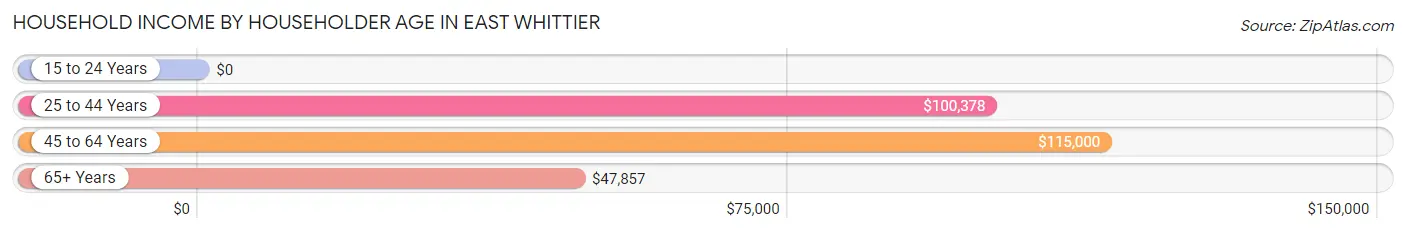
| Income Bracket | # Households | Median Income |
| 15 to 24 Years | 48 (1.4%) | $0 |
| 25 to 44 Years | 1,057 (31.6%) | $100,378 |
| 45 to 64 Years | 1,360 (40.7%) | $115,000 |
| 65+ Years | 880 (26.3%) | $47,857 |
| Total | 3,345 (100.0%) | $92,650 |
Poverty in East Whittier
Income Below Poverty by Sex and Age in East Whittier
With 5.8% poverty level for males and 6.6% for females among the residents of East Whittier, 18 to 24 year old males and 75 year old and over females are the most vulnerable to poverty, with 114 males (21.1%) and 132 females (28.2%) in their respective age groups living below the poverty level.
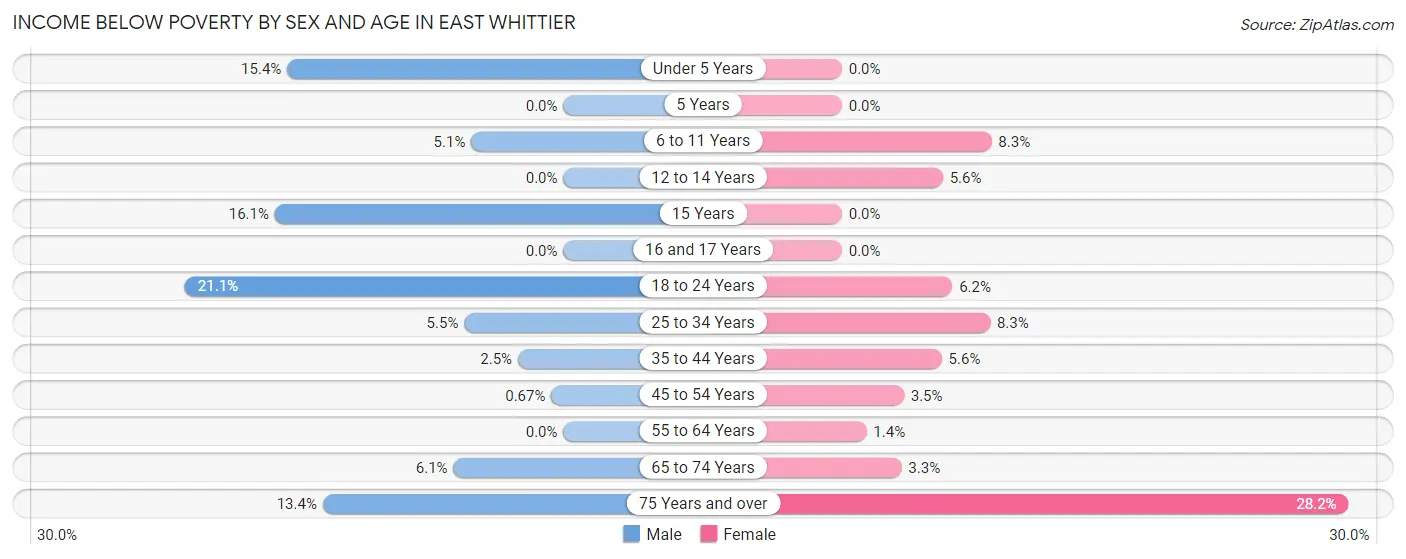
| Age Bracket | Male | Female |
| Under 5 Years | 26 (15.4%) | 0 (0.0%) |
| 5 Years | 0 (0.0%) | 0 (0.0%) |
| 6 to 11 Years | 12 (5.1%) | 33 (8.3%) |
| 12 to 14 Years | 0 (0.0%) | 10 (5.6%) |
| 15 Years | 9 (16.1%) | 0 (0.0%) |
| 16 and 17 Years | 0 (0.0%) | 0 (0.0%) |
| 18 to 24 Years | 114 (21.1%) | 26 (6.1%) |
| 25 to 34 Years | 38 (5.5%) | 59 (8.3%) |
| 35 to 44 Years | 21 (2.5%) | 36 (5.6%) |
| 45 to 54 Years | 5 (0.7%) | 28 (3.5%) |
| 55 to 64 Years | 0 (0.0%) | 8 (1.4%) |
| 65 to 74 Years | 24 (6.1%) | 14 (3.3%) |
| 75 Years and over | 41 (13.4%) | 132 (28.2%) |
| Total | 290 (5.8%) | 346 (6.6%) |
Income Above Poverty by Sex and Age in East Whittier
According to the poverty statistics in East Whittier, males aged 5 years and females aged under 5 years are the age groups that are most secure financially, with 100.0% of males and 100.0% of females in these age groups living above the poverty line.
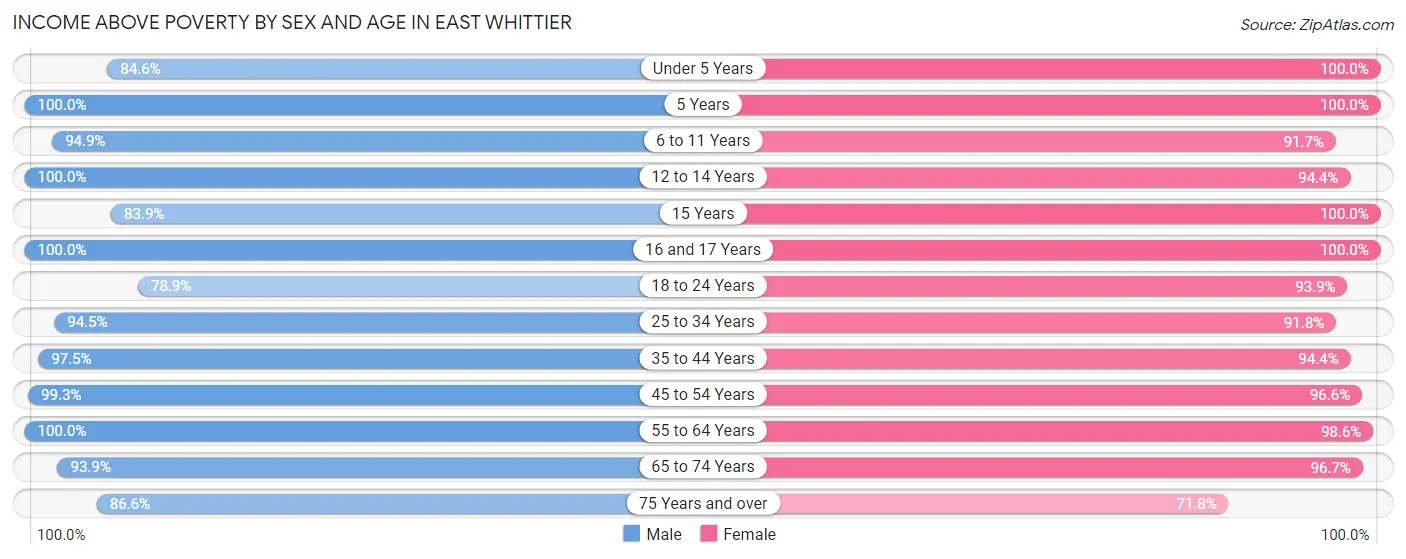
| Age Bracket | Male | Female |
| Under 5 Years | 143 (84.6%) | 352 (100.0%) |
| 5 Years | 95 (100.0%) | 134 (100.0%) |
| 6 to 11 Years | 222 (94.9%) | 363 (91.7%) |
| 12 to 14 Years | 152 (100.0%) | 168 (94.4%) |
| 15 Years | 47 (83.9%) | 26 (100.0%) |
| 16 and 17 Years | 252 (100.0%) | 102 (100.0%) |
| 18 to 24 Years | 427 (78.9%) | 397 (93.9%) |
| 25 to 34 Years | 650 (94.5%) | 656 (91.7%) |
| 35 to 44 Years | 808 (97.5%) | 612 (94.4%) |
| 45 to 54 Years | 739 (99.3%) | 783 (96.6%) |
| 55 to 64 Years | 506 (100.0%) | 576 (98.6%) |
| 65 to 74 Years | 368 (93.9%) | 408 (96.7%) |
| 75 Years and over | 265 (86.6%) | 336 (71.8%) |
| Total | 4,674 (94.2%) | 4,913 (93.4%) |
Income Below Poverty Among Married-Couple Families in East Whittier
The poverty statistics for married-couple families in East Whittier show that 1.9% or 40 of the total 2,155 families live below the poverty line. Families with 3 or 4 children have the highest poverty rate of 20.3%, comprising of 13 families. On the other hand, families with 1 or 2 children have the lowest poverty rate of 1.0%, which includes 10 families.
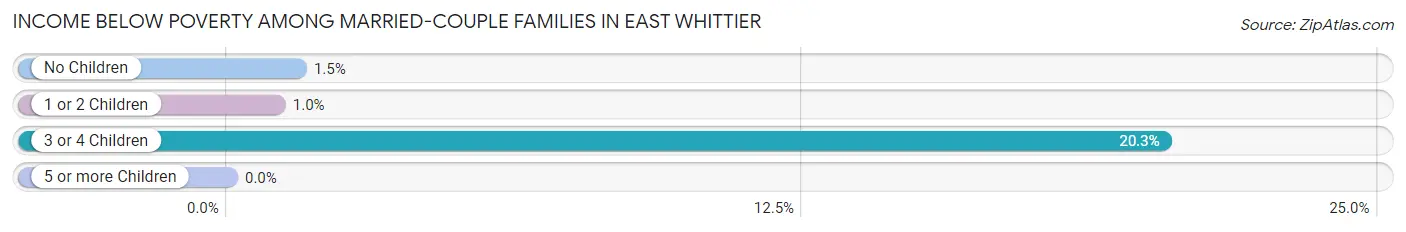
| Children | Above Poverty | Below Poverty |
| No Children | 1,115 (98.5%) | 17 (1.5%) |
| 1 or 2 Children | 949 (99.0%) | 10 (1.0%) |
| 3 or 4 Children | 51 (79.7%) | 13 (20.3%) |
| 5 or more Children | 0 (0.0%) | 0 (0.0%) |
| Total | 2,115 (98.1%) | 40 (1.9%) |
Income Below Poverty Among Single-Parent Households in East Whittier
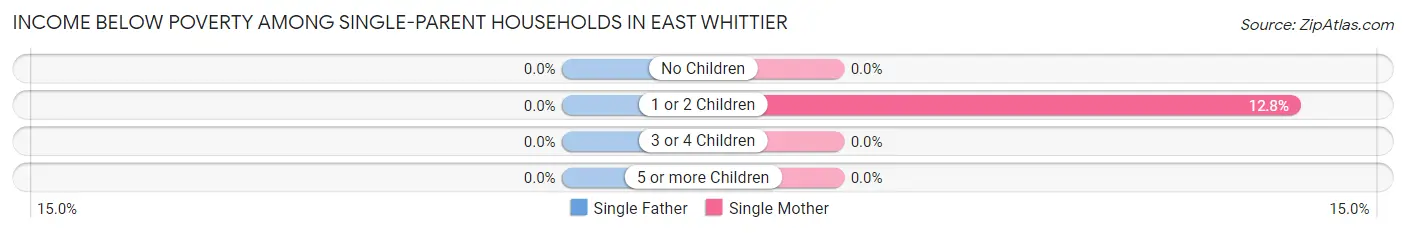
| Children | Single Father | Single Mother |
| No Children | 0 (0.0%) | 0 (0.0%) |
| 1 or 2 Children | 0 (0.0%) | 12 (12.8%) |
| 3 or 4 Children | 0 (0.0%) | 0 (0.0%) |
| 5 or more Children | 0 (0.0%) | 0 (0.0%) |
| Total | 0 (0.0%) | 12 (6.6%) |
Income Below Poverty Among Married-Couple vs Single-Parent Households in East Whittier
The poverty data for East Whittier shows that 40 of the married-couple family households (1.9%) and 12 of the single-parent households (3.2%) are living below the poverty level. Within the married-couple family households, those with 3 or 4 children have the highest poverty rate, with 13 households (20.3%) falling below the poverty line. Among the single-parent households, those with 1 or 2 children have the highest poverty rate, with 12 household (6.1%) living below poverty.
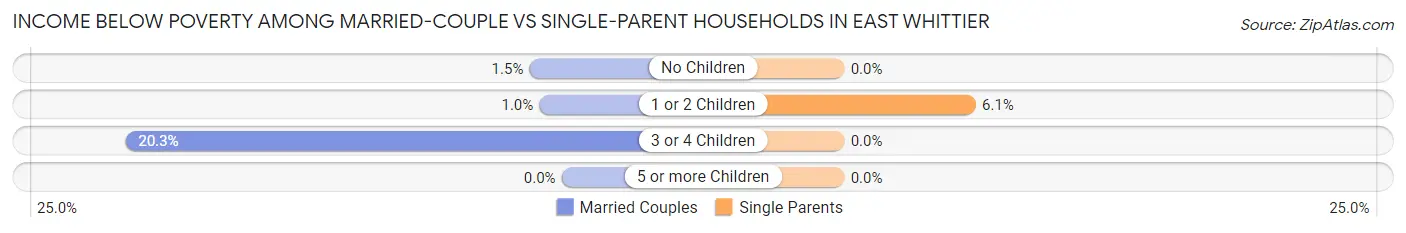
| Children | Married-Couple Families | Single-Parent Households |
| No Children | 17 (1.5%) | 0 (0.0%) |
| 1 or 2 Children | 10 (1.0%) | 12 (6.1%) |
| 3 or 4 Children | 13 (20.3%) | 0 (0.0%) |
| 5 or more Children | 0 (0.0%) | 0 (0.0%) |
| Total | 40 (1.9%) | 12 (3.2%) |
Race in East Whittier
The most populous races in East Whittier are Hispanic or Latino (5,556 | 54.2%), White / Caucasian (5,123 | 50.0%), and Some other Race (2,397 | 23.4%).
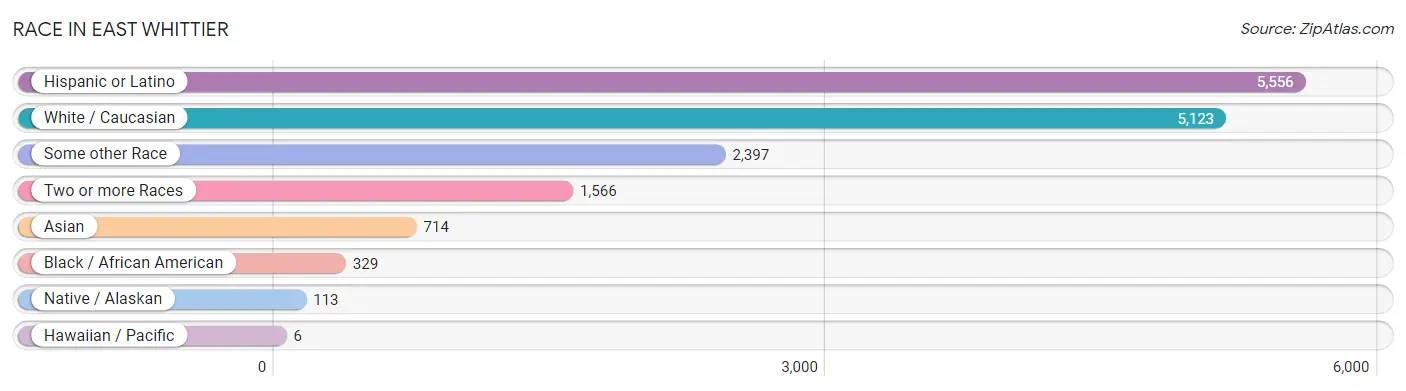
| Race | # Population | % Population |
| Asian | 714 | 7.0% |
| Black / African American | 329 | 3.2% |
| Hawaiian / Pacific | 6 | 0.1% |
| Hispanic or Latino | 5,556 | 54.2% |
| Native / Alaskan | 113 | 1.1% |
| White / Caucasian | 5,123 | 50.0% |
| Two or more Races | 1,566 | 15.3% |
| Some other Race | 2,397 | 23.4% |
| Total | 10,248 | 100.0% |
Ancestry in East Whittier
The most populous ancestries reported in East Whittier are Mexican (4,351 | 42.5%), Irish (782 | 7.6%), English (751 | 7.3%), German (687 | 6.7%), and American (462 | 4.5%), together accounting for 68.6% of all East Whittier residents.
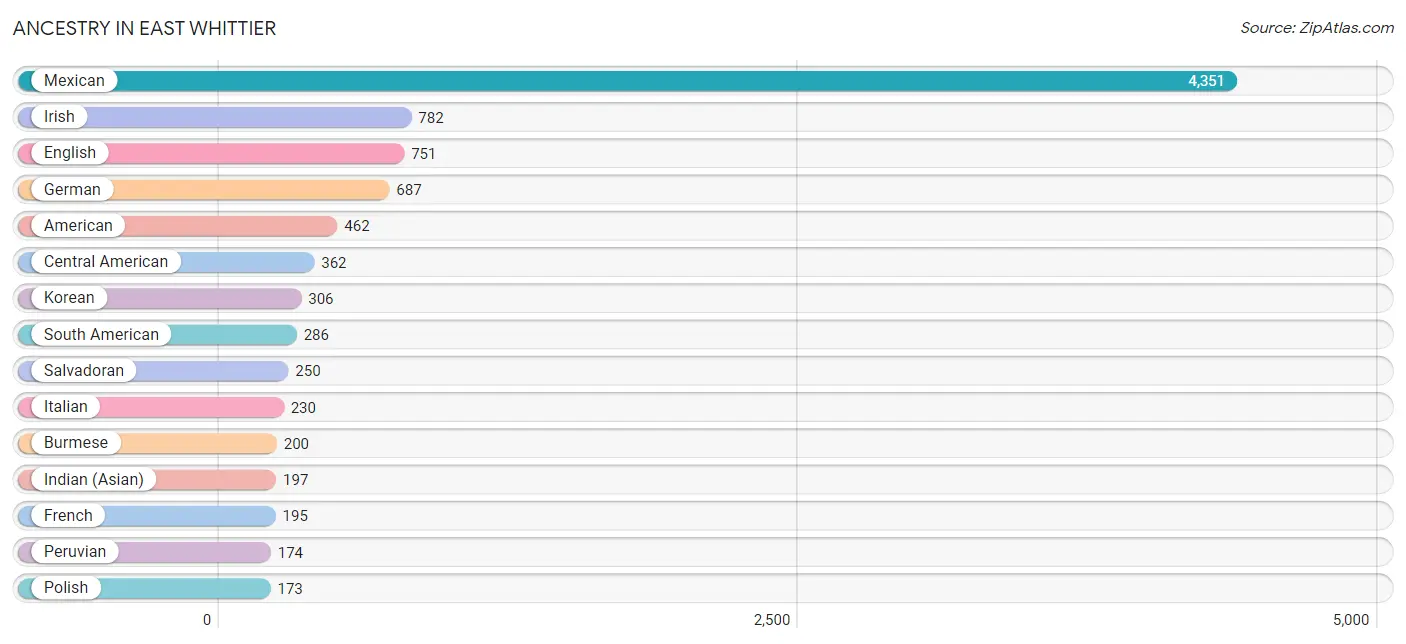
| Ancestry | # Population | % Population |
| African | 33 | 0.3% |
| American | 462 | 4.5% |
| Apache | 12 | 0.1% |
| Arab | 143 | 1.4% |
| Argentinean | 43 | 0.4% |
| Armenian | 7 | 0.1% |
| Basque | 8 | 0.1% |
| Bhutanese | 132 | 1.3% |
| British | 121 | 1.2% |
| Burmese | 200 | 1.9% |
| Canadian | 34 | 0.3% |
| Central American | 362 | 3.5% |
| Central American Indian | 9 | 0.1% |
| Colombian | 33 | 0.3% |
| Costa Rican | 26 | 0.3% |
| Croatian | 8 | 0.1% |
| Cuban | 134 | 1.3% |
| Danish | 123 | 1.2% |
| Dominican | 28 | 0.3% |
| Dutch | 124 | 1.2% |
| Ecuadorian | 36 | 0.4% |
| Egyptian | 45 | 0.4% |
| English | 751 | 7.3% |
| Ethiopian | 22 | 0.2% |
| European | 108 | 1.1% |
| Finnish | 16 | 0.2% |
| French | 195 | 1.9% |
| French Canadian | 7 | 0.1% |
| German | 687 | 6.7% |
| Greek | 41 | 0.4% |
| Guamanian / Chamorro | 6 | 0.1% |
| Guatemalan | 50 | 0.5% |
| Haitian | 1 | 0.0% |
| Honduran | 8 | 0.1% |
| Hungarian | 16 | 0.2% |
| Icelander | 7 | 0.1% |
| Indian (Asian) | 197 | 1.9% |
| Irish | 782 | 7.6% |
| Italian | 230 | 2.2% |
| Korean | 306 | 3.0% |
| Lebanese | 44 | 0.4% |
| Lithuanian | 6 | 0.1% |
| Mexican | 4,351 | 42.5% |
| Mexican American Indian | 52 | 0.5% |
| Native Hawaiian | 33 | 0.3% |
| Nicaraguan | 28 | 0.3% |
| Norwegian | 25 | 0.2% |
| Peruvian | 174 | 1.7% |
| Polish | 173 | 1.7% |
| Portuguese | 79 | 0.8% |
| Puerto Rican | 90 | 0.9% |
| Romanian | 69 | 0.7% |
| Russian | 90 | 0.9% |
| Salvadoran | 250 | 2.4% |
| Scandinavian | 49 | 0.5% |
| Scotch-Irish | 38 | 0.4% |
| Scottish | 123 | 1.2% |
| South American | 286 | 2.8% |
| Spaniard | 127 | 1.2% |
| Sri Lankan | 31 | 0.3% |
| Subsaharan African | 55 | 0.5% |
| Swedish | 88 | 0.9% |
| Swiss | 5 | 0.1% |
| Thai | 24 | 0.2% |
| Ukrainian | 130 | 1.3% |
| Welsh | 160 | 1.6% | View All 66 Rows |
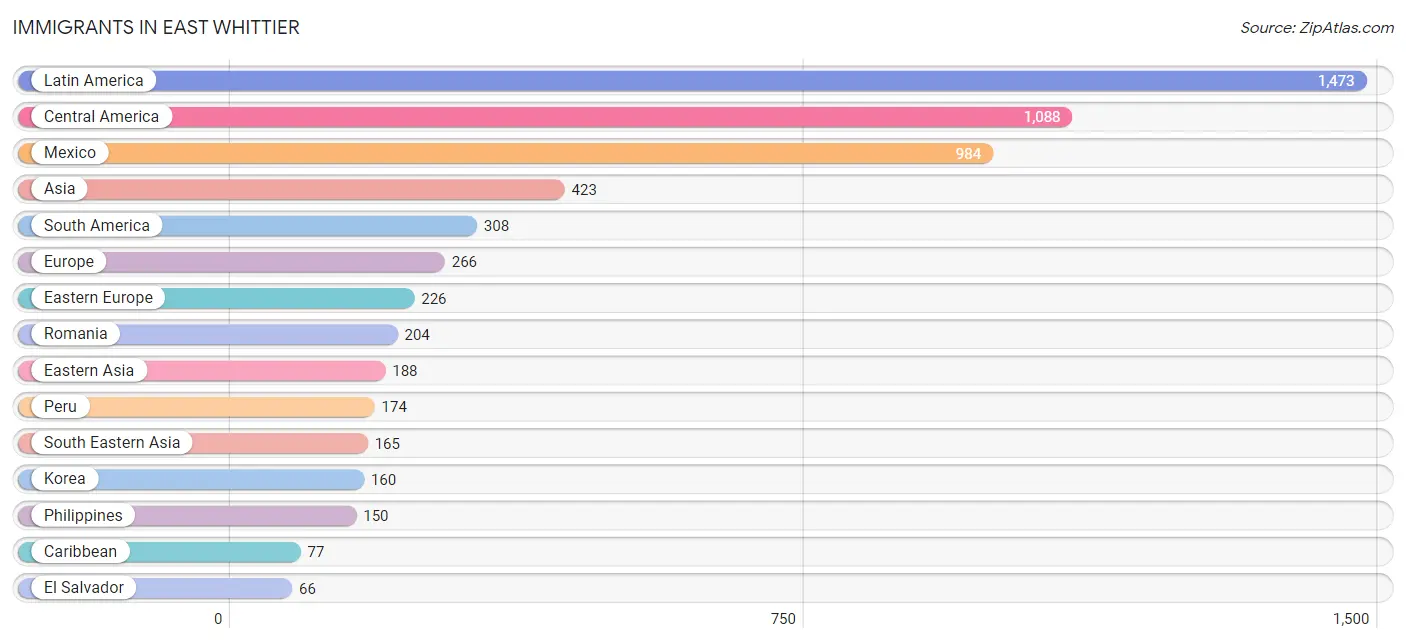
Immigrants in East Whittier
The most numerous immigrant groups reported in East Whittier came from Latin America (1,473 | 14.4%), Central America (1,088 | 10.6%), Mexico (984 | 9.6%), Asia (423 | 4.1%), and South America (308 | 3.0%), together accounting for 41.7% of all East Whittier residents.
| Immigration Origin | # Population | % Population |
| Africa | 41 | 0.4% |
| Argentina | 37 | 0.4% |
| Asia | 423 | 4.1% |
| Bolivia | 7 | 0.1% |
| Canada | 27 | 0.3% |
| Caribbean | 77 | 0.7% |
| Central America | 1,088 | 10.6% |
| China | 24 | 0.2% |
| Colombia | 33 | 0.3% |
| Croatia | 7 | 0.1% |
| Cuba | 49 | 0.5% |
| Dominican Republic | 28 | 0.3% |
| Eastern Africa | 8 | 0.1% |
| Eastern Asia | 188 | 1.8% |
| Eastern Europe | 226 | 2.2% |
| Ecuador | 57 | 0.6% |
| El Salvador | 66 | 0.6% |
| England | 5 | 0.1% |
| Eritrea | 8 | 0.1% |
| Europe | 266 | 2.6% |
| France | 15 | 0.2% |
| Germany | 5 | 0.1% |
| Guatemala | 24 | 0.2% |
| Honduras | 8 | 0.1% |
| Italy | 15 | 0.2% |
| Japan | 4 | 0.0% |
| Korea | 160 | 1.6% |
| Latin America | 1,473 | 14.4% |
| Mexico | 984 | 9.6% |
| Nepal | 46 | 0.4% |
| Nicaragua | 6 | 0.1% |
| Northern Europe | 5 | 0.1% |
| Peru | 174 | 1.7% |
| Philippines | 150 | 1.5% |
| Poland | 5 | 0.1% |
| Romania | 204 | 2.0% |
| Serbia | 10 | 0.1% |
| South America | 308 | 3.0% |
| South Central Asia | 46 | 0.4% |
| South Eastern Asia | 165 | 1.6% |
| Southern Europe | 15 | 0.2% |
| Vietnam | 15 | 0.2% |
| Western Europe | 20 | 0.2% | View All 43 Rows |
Sex and Age in East Whittier
Sex and Age in East Whittier
The most populous age groups in East Whittier are 40 to 44 Years (489 | 9.8%) for men and 45 to 49 Years (460 | 8.7%) for women.
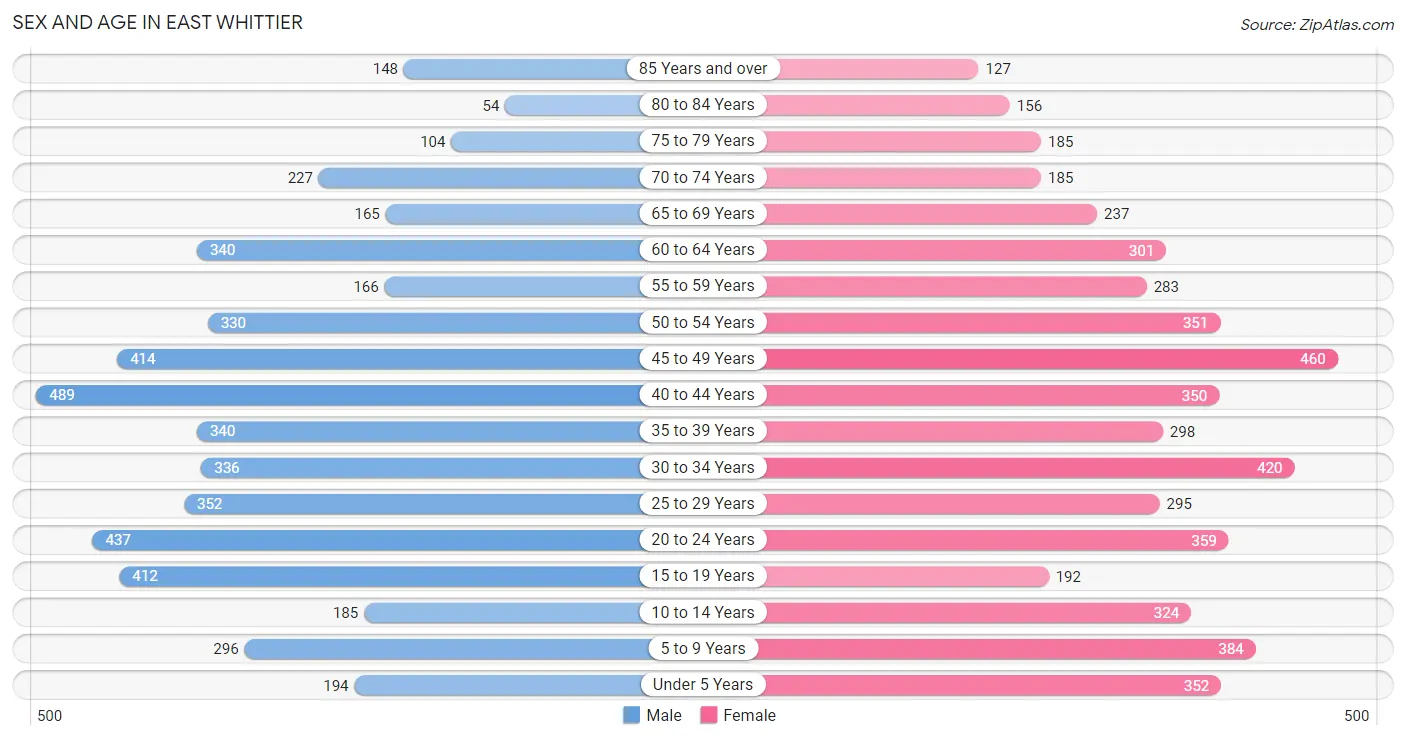
| Age Bracket | Male | Female |
| Under 5 Years | 194 (3.9%) | 352 (6.7%) |
| 5 to 9 Years | 296 (5.9%) | 384 (7.3%) |
| 10 to 14 Years | 185 (3.7%) | 324 (6.2%) |
| 15 to 19 Years | 412 (8.3%) | 192 (3.6%) |
| 20 to 24 Years | 437 (8.8%) | 359 (6.8%) |
| 25 to 29 Years | 352 (7.1%) | 295 (5.6%) |
| 30 to 34 Years | 336 (6.7%) | 420 (8.0%) |
| 35 to 39 Years | 340 (6.8%) | 298 (5.7%) |
| 40 to 44 Years | 489 (9.8%) | 350 (6.7%) |
| 45 to 49 Years | 414 (8.3%) | 460 (8.7%) |
| 50 to 54 Years | 330 (6.6%) | 351 (6.7%) |
| 55 to 59 Years | 166 (3.3%) | 283 (5.4%) |
| 60 to 64 Years | 340 (6.8%) | 301 (5.7%) |
| 65 to 69 Years | 165 (3.3%) | 237 (4.5%) |
| 70 to 74 Years | 227 (4.5%) | 185 (3.5%) |
| 75 to 79 Years | 104 (2.1%) | 185 (3.5%) |
| 80 to 84 Years | 54 (1.1%) | 156 (3.0%) |
| 85 Years and over | 148 (3.0%) | 127 (2.4%) |
| Total | 4,989 (100.0%) | 5,259 (100.0%) |
Families and Households in East Whittier
Median Family Size in East Whittier
The median family size in East Whittier is 3.52 persons per family, with single female/mother families (182 | 7.2%) accounting for the largest median family size of 4.02 persons per family. On the other hand, single male/father families (194 | 7.7%) represent the smallest median family size with 2.71 persons per family.
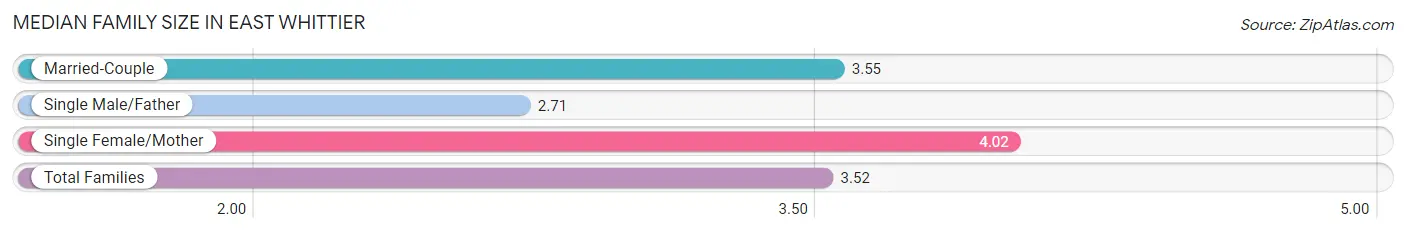
| Family Type | # Families | Family Size |
| Married-Couple | 2,155 (85.1%) | 3.55 |
| Single Male/Father | 194 (7.7%) | 2.71 |
| Single Female/Mother | 182 (7.2%) | 4.02 |
| Total Families | 2,531 (100.0%) | 3.52 |
Median Household Size in East Whittier
The median household size in East Whittier is 3.05 persons per household, with single female/mother households (182 | 5.4%) accounting for the largest median household size of 4.22 persons per household. non-family households (814 | 24.3%) represent the smallest median household size with 1.37 persons per household.
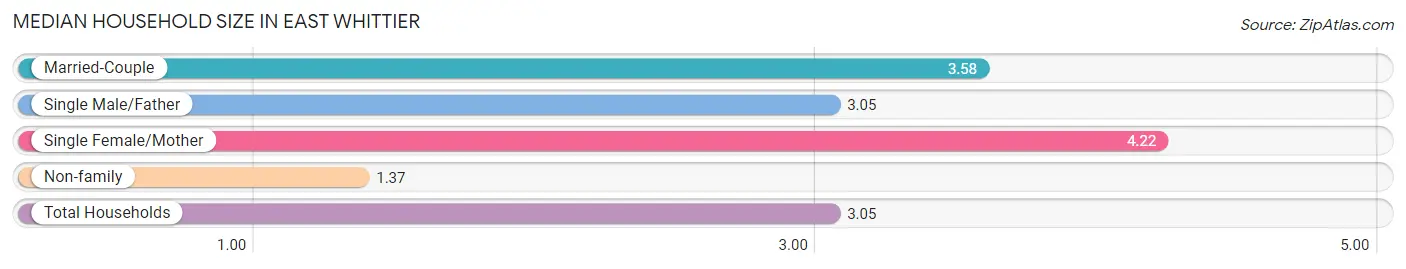
| Household Type | # Households | Household Size |
| Married-Couple | 2,155 (64.4%) | 3.58 |
| Single Male/Father | 194 (5.8%) | 3.05 |
| Single Female/Mother | 182 (5.4%) | 4.22 |
| Non-family | 814 (24.3%) | 1.37 |
| Total Households | 3,345 (100.0%) | 3.05 |
Household Size by Marriage Status in East Whittier
Out of a total of 3,345 households in East Whittier, 2,531 (75.7%) are family households, while 814 (24.3%) are nonfamily households. The most numerous type of family households are 4-person households, comprising 814, and the most common type of nonfamily households are 1-person households, comprising 656.
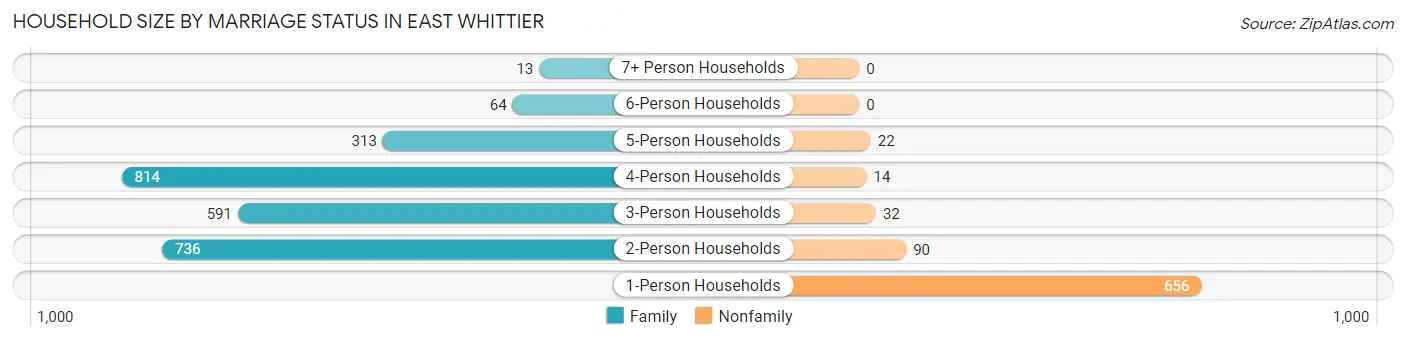
| Household Size | Family Households | Nonfamily Households |
| 1-Person Households | - | 656 (19.6%) |
| 2-Person Households | 736 (22.0%) | 90 (2.7%) |
| 3-Person Households | 591 (17.7%) | 32 (1.0%) |
| 4-Person Households | 814 (24.3%) | 14 (0.4%) |
| 5-Person Households | 313 (9.4%) | 22 (0.7%) |
| 6-Person Households | 64 (1.9%) | 0 (0.0%) |
| 7+ Person Households | 13 (0.4%) | 0 (0.0%) |
| Total | 2,531 (75.7%) | 814 (24.3%) |
Female Fertility in East Whittier
Fertility by Age in East Whittier
Average fertility rate in East Whittier is 6.0 births per 1,000 women. Women in the age bracket of 20 to 34 years have the highest fertility rate with 13.0 births per 1,000 women. Women in the age bracket of 20 to 34 years acount for 100.0% of all women with births.
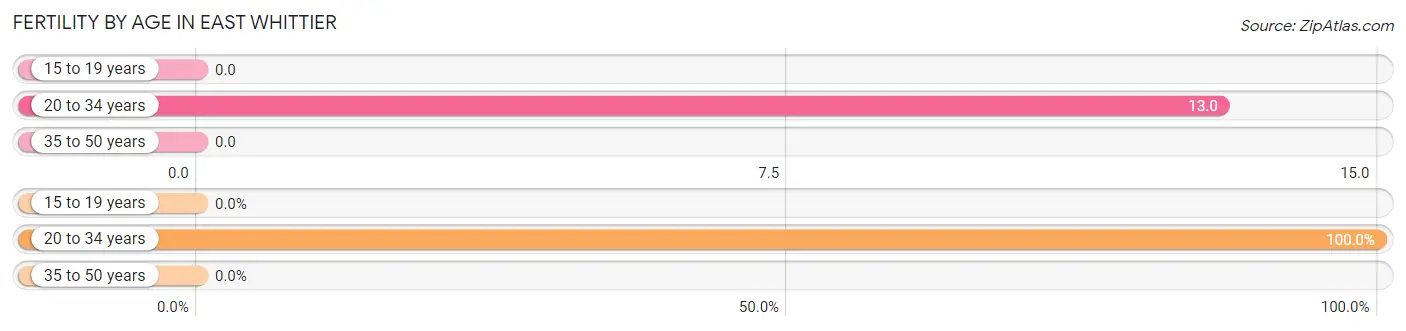
| Age Bracket | Women with Births | Births / 1,000 Women |
| 15 to 19 years | 0 (0.0%) | 0.0 |
| 20 to 34 years | 14 (100.0%) | 13.0 |
| 35 to 50 years | 0 (0.0%) | 0.0 |
| Total | 14 (100.0%) | 6.0 |
Fertility by Age by Marriage Status in East Whittier
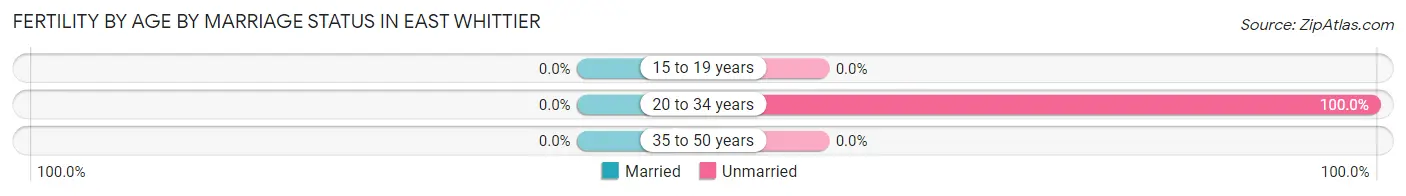
| Age Bracket | Married | Unmarried |
| 15 to 19 years | 0 (0.0%) | 0 (0.0%) |
| 20 to 34 years | 0 (0.0%) | 14 (100.0%) |
| 35 to 50 years | 0 (0.0%) | 0 (0.0%) |
| Total | 0 (0.0%) | 14 (100.0%) |
Fertility by Education in East Whittier
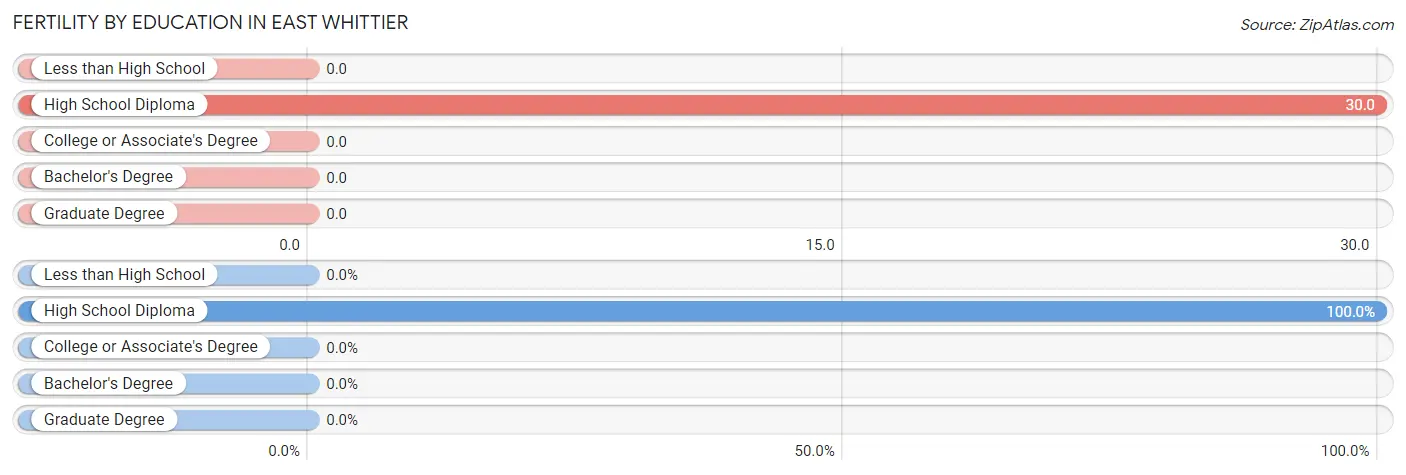
| Educational Attainment | Women with Births | Births / 1,000 Women |
| Less than High School | 0 (0.0%) | 0.0 |
| High School Diploma | 14 (100.0%) | 30.0 |
| College or Associate's Degree | 0 (0.0%) | 0.0 |
| Bachelor's Degree | 0 (0.0%) | 0.0 |
| Graduate Degree | 0 (0.0%) | 0.0 |
| Total | 14 (100.0%) | 6.0 |
Fertility by Education by Marriage Status in East Whittier
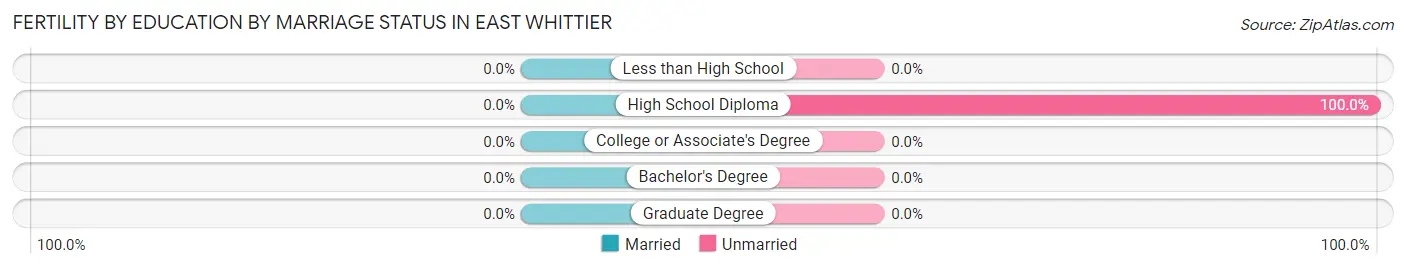
| Educational Attainment | Married | Unmarried |
| Less than High School | 0 (0.0%) | 0 (0.0%) |
| High School Diploma | 0 (0.0%) | 14 (100.0%) |
| College or Associate's Degree | 0 (0.0%) | 0 (0.0%) |
| Bachelor's Degree | 0 (0.0%) | 0 (0.0%) |
| Graduate Degree | 0 (0.0%) | 0 (0.0%) |
| Total | 0 (0.0%) | 14 (100.0%) |
Employment Characteristics in East Whittier
Employment by Class of Employer in East Whittier
Among the 4,910 employed individuals in East Whittier, private company employees (3,358 | 68.4%), local government employees (616 | 12.6%), and not-for-profit organizations (348 | 7.1%) make up the most common classes of employment.
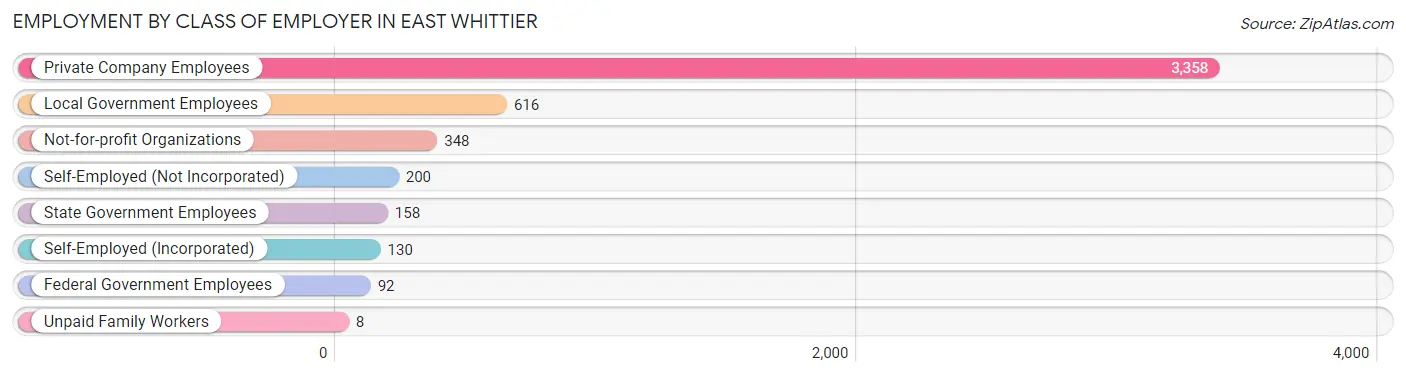
| Employer Class | # Employees | % Employees |
| Private Company Employees | 3,358 | 68.4% |
| Self-Employed (Incorporated) | 130 | 2.6% |
| Self-Employed (Not Incorporated) | 200 | 4.1% |
| Not-for-profit Organizations | 348 | 7.1% |
| Local Government Employees | 616 | 12.6% |
| State Government Employees | 158 | 3.2% |
| Federal Government Employees | 92 | 1.9% |
| Unpaid Family Workers | 8 | 0.2% |
| Total | 4,910 | 100.0% |
Employment Status by Age in East Whittier
According to the labor force statistics for East Whittier, out of the total population over 16 years of age (8,431), 61.3% or 5,168 individuals are in the labor force, with 3.4% or 176 of them unemployed. The age group with the highest labor force participation rate is 45 to 54 years, with 86.0% or 1,337 individuals in the labor force. Within the labor force, the 20 to 24 years age range has the highest percentage of unemployed individuals, with 12.2% or 64 of them being unemployed.
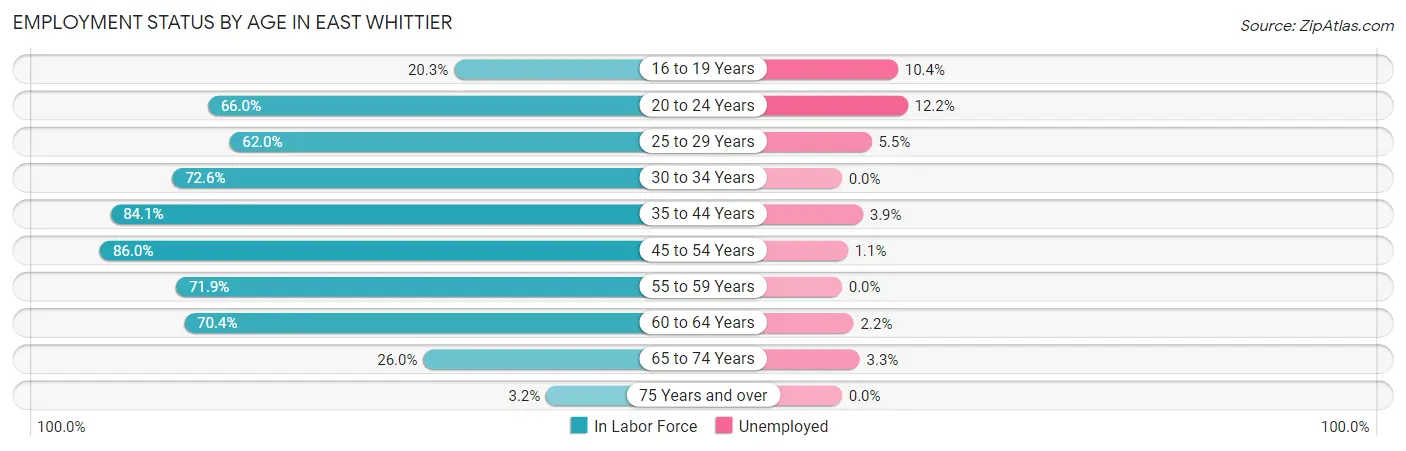
| Age Bracket | In Labor Force | Unemployed |
| 16 to 19 Years | 106 (20.3%) | 11 (10.4%) |
| 20 to 24 Years | 525 (66.0%) | 64 (12.2%) |
| 25 to 29 Years | 401 (62.0%) | 22 (5.5%) |
| 30 to 34 Years | 549 (72.6%) | 0 (0.0%) |
| 35 to 44 Years | 1,242 (84.1%) | 48 (3.9%) |
| 45 to 54 Years | 1,337 (86.0%) | 15 (1.1%) |
| 55 to 59 Years | 323 (71.9%) | 0 (0.0%) |
| 60 to 64 Years | 451 (70.4%) | 10 (2.2%) |
| 65 to 74 Years | 212 (26.0%) | 7 (3.3%) |
| 75 Years and over | 25 (3.2%) | 0 (0.0%) |
| Total | 5,168 (61.3%) | 176 (3.4%) |
Employment Status by Educational Attainment in East Whittier
According to labor force statistics for East Whittier, 77.9% of individuals (4,304) out of the total population between 25 and 64 years of age (5,525) are in the labor force, with 2.2% or 95 of them being unemployed. The group with the highest labor force participation rate are those with the educational attainment of bachelor's degree or higher, with 87.8% or 1,606 individuals in the labor force. Within the labor force, individuals with less than high school education have the highest percentage of unemployment, with 19.3% or 27 of them being unemployed.
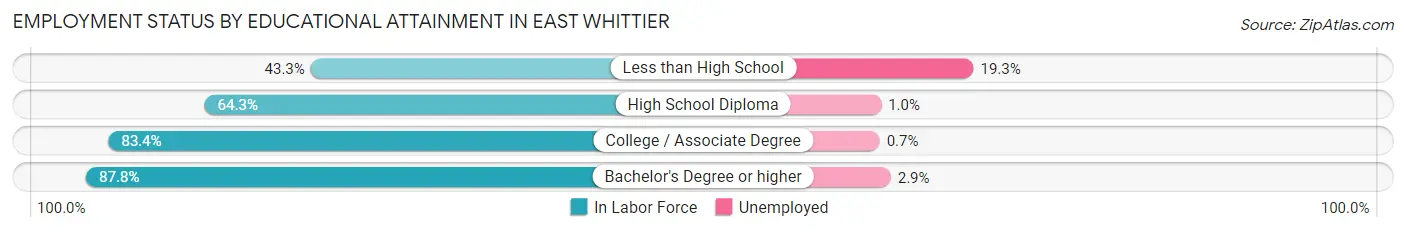
| Educational Attainment | In Labor Force | Unemployed |
| Less than High School | 140 (43.3%) | 62 (19.3%) |
| High School Diploma | 865 (64.3%) | 13 (1.0%) |
| College / Associate Degree | 1,691 (83.4%) | 14 (0.7%) |
| Bachelor's Degree or higher | 1,606 (87.8%) | 53 (2.9%) |
| Total | 4,304 (77.9%) | 122 (2.2%) |
Employment Occupations by Sex in East Whittier
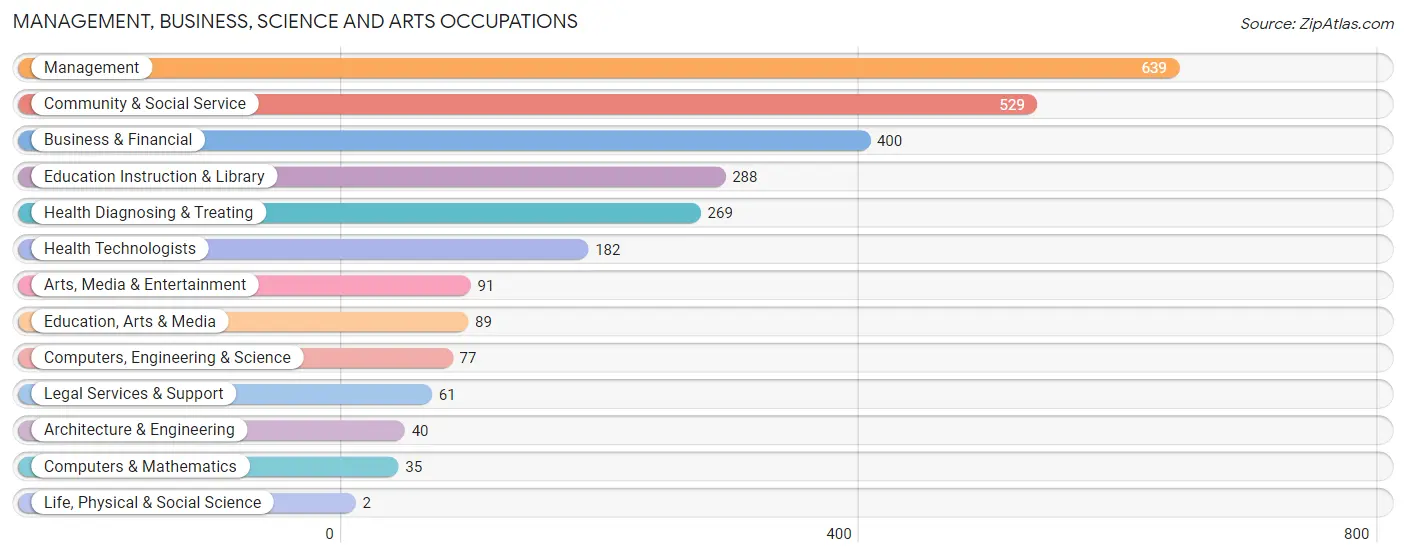
Management, Business, Science and Arts Occupations
The most common Management, Business, Science and Arts occupations in East Whittier are Management (639 | 12.8%), Community & Social Service (529 | 10.6%), Business & Financial (400 | 8.0%), Education Instruction & Library (288 | 5.8%), and Health Diagnosing & Treating (269 | 5.4%).
Management, Business, Science and Arts Occupations by Sex
Within the Management, Business, Science and Arts occupations in East Whittier, the most male-oriented occupations are Architecture & Engineering (100.0%), Life, Physical & Social Science (100.0%), and Computers, Engineering & Science (94.8%), while the most female-oriented occupations are Business & Financial (83.8%), Education Instruction & Library (83.0%), and Health Technologists (70.9%).
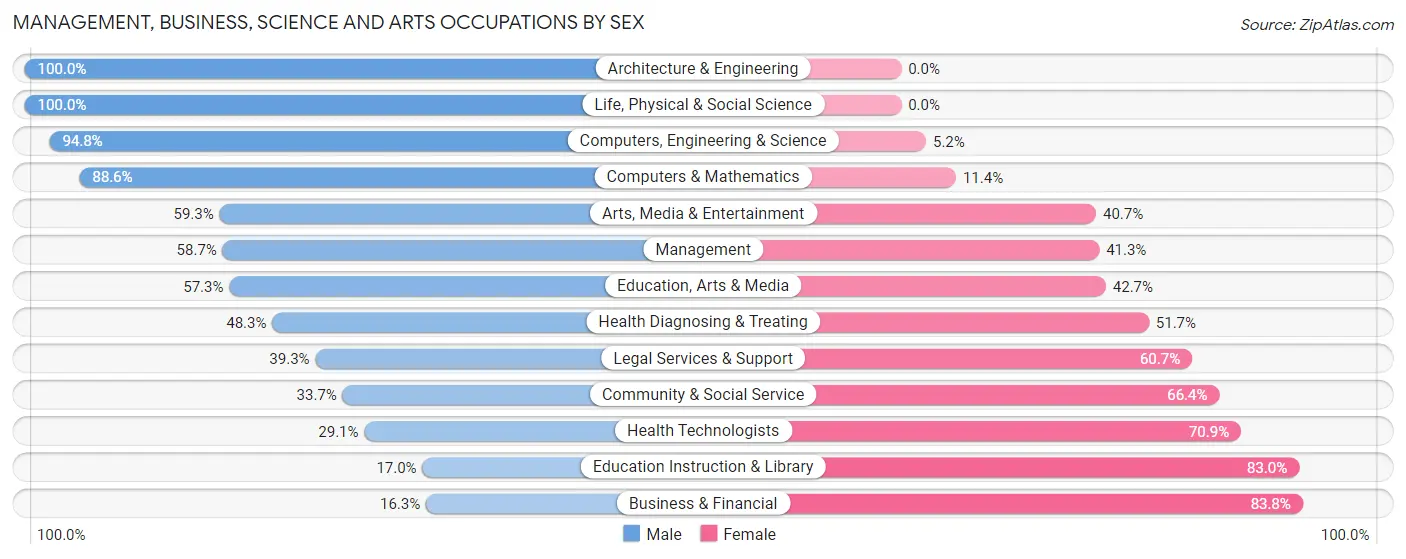
| Occupation | Male | Female |
| Management | 375 (58.7%) | 264 (41.3%) |
| Business & Financial | 65 (16.3%) | 335 (83.8%) |
| Computers, Engineering & Science | 73 (94.8%) | 4 (5.2%) |
| Computers & Mathematics | 31 (88.6%) | 4 (11.4%) |
| Architecture & Engineering | 40 (100.0%) | 0 (0.0%) |
| Life, Physical & Social Science | 2 (100.0%) | 0 (0.0%) |
| Community & Social Service | 178 (33.7%) | 351 (66.3%) |
| Education, Arts & Media | 51 (57.3%) | 38 (42.7%) |
| Legal Services & Support | 24 (39.3%) | 37 (60.7%) |
| Education Instruction & Library | 49 (17.0%) | 239 (83.0%) |
| Arts, Media & Entertainment | 54 (59.3%) | 37 (40.7%) |
| Health Diagnosing & Treating | 130 (48.3%) | 139 (51.7%) |
| Health Technologists | 53 (29.1%) | 129 (70.9%) |
| Total (Category) | 821 (42.9%) | 1,093 (57.1%) |
| Total (Overall) | 2,791 (55.9%) | 2,203 (44.1%) |
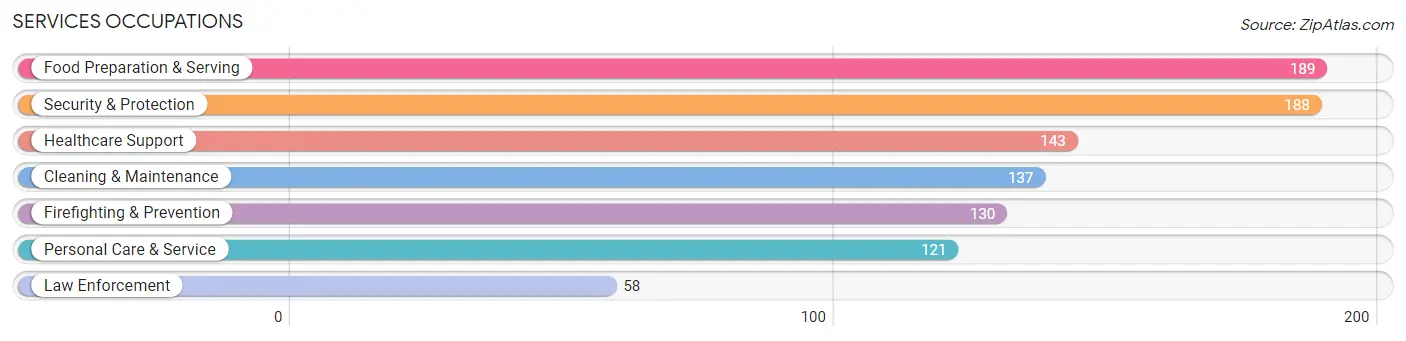
Services Occupations
The most common Services occupations in East Whittier are Food Preparation & Serving (189 | 3.8%), Security & Protection (188 | 3.8%), Healthcare Support (143 | 2.9%), Cleaning & Maintenance (137 | 2.7%), and Firefighting & Prevention (130 | 2.6%).
Services Occupations by Sex
Within the Services occupations in East Whittier, the most male-oriented occupations are Law Enforcement (100.0%), Cleaning & Maintenance (100.0%), and Security & Protection (94.7%), while the most female-oriented occupations are Healthcare Support (63.6%), Personal Care & Service (62.8%), and Food Preparation & Serving (61.4%).
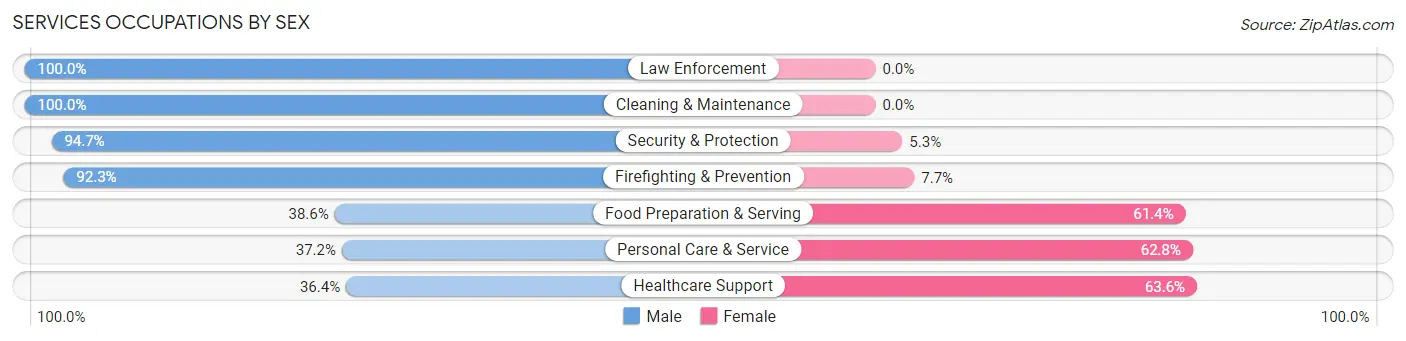
| Occupation | Male | Female |
| Healthcare Support | 52 (36.4%) | 91 (63.6%) |
| Security & Protection | 178 (94.7%) | 10 (5.3%) |
| Firefighting & Prevention | 120 (92.3%) | 10 (7.7%) |
| Law Enforcement | 58 (100.0%) | 0 (0.0%) |
| Food Preparation & Serving | 73 (38.6%) | 116 (61.4%) |
| Cleaning & Maintenance | 137 (100.0%) | 0 (0.0%) |
| Personal Care & Service | 45 (37.2%) | 76 (62.8%) |
| Total (Category) | 485 (62.3%) | 293 (37.7%) |
| Total (Overall) | 2,791 (55.9%) | 2,203 (44.1%) |
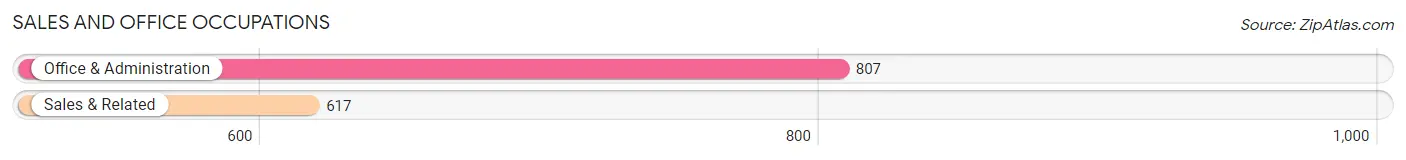
Sales and Office Occupations
The most common Sales and Office occupations in East Whittier are Office & Administration (807 | 16.2%), and Sales & Related (617 | 12.3%).
Sales and Office Occupations by Sex
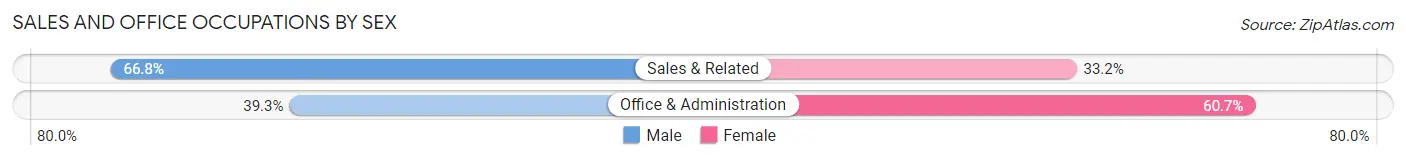
| Occupation | Male | Female |
| Sales & Related | 412 (66.8%) | 205 (33.2%) |
| Office & Administration | 317 (39.3%) | 490 (60.7%) |
| Total (Category) | 729 (51.2%) | 695 (48.8%) |
| Total (Overall) | 2,791 (55.9%) | 2,203 (44.1%) |
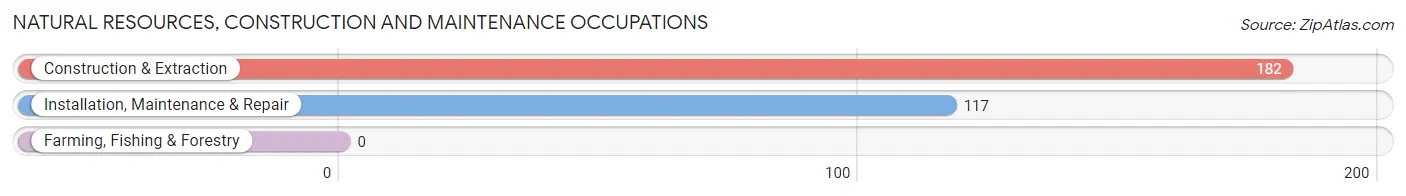
Natural Resources, Construction and Maintenance Occupations
The most common Natural Resources, Construction and Maintenance occupations in East Whittier are Construction & Extraction (182 | 3.6%), and Installation, Maintenance & Repair (117 | 2.3%).
Natural Resources, Construction and Maintenance Occupations by Sex
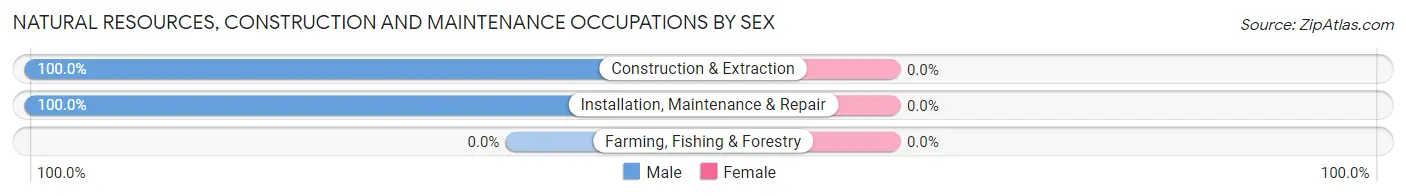
| Occupation | Male | Female |
| Farming, Fishing & Forestry | 0 (0.0%) | 0 (0.0%) |
| Construction & Extraction | 182 (100.0%) | 0 (0.0%) |
| Installation, Maintenance & Repair | 117 (100.0%) | 0 (0.0%) |
| Total (Category) | 299 (100.0%) | 0 (0.0%) |
| Total (Overall) | 2,791 (55.9%) | 2,203 (44.1%) |
Production, Transportation and Moving Occupations
The most common Production, Transportation and Moving occupations in East Whittier are Material Moving (215 | 4.3%), Production (191 | 3.8%), and Transportation (173 | 3.5%).
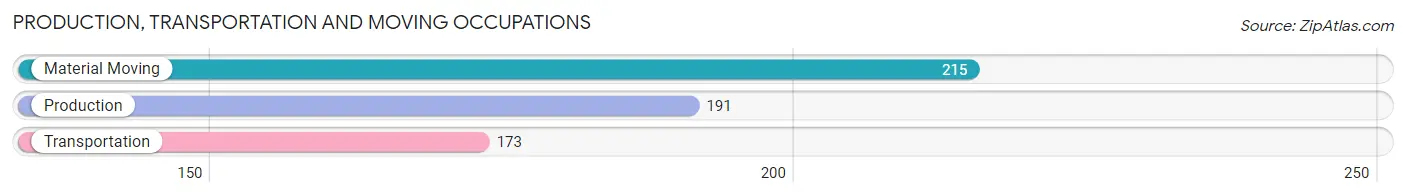
Production, Transportation and Moving Occupations by Sex
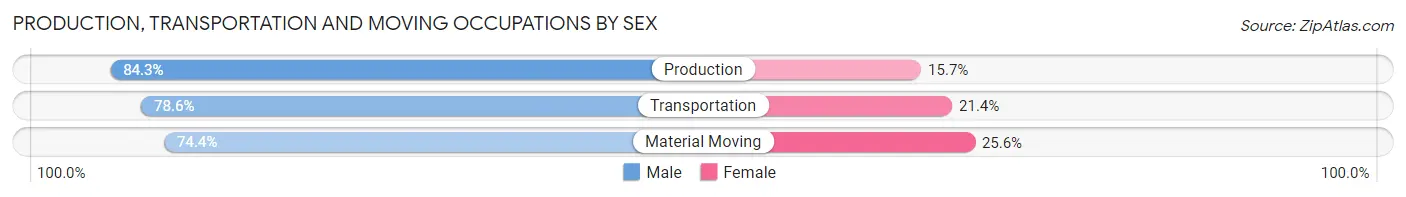
| Occupation | Male | Female |
| Production | 161 (84.3%) | 30 (15.7%) |
| Transportation | 136 (78.6%) | 37 (21.4%) |
| Material Moving | 160 (74.4%) | 55 (25.6%) |
| Total (Category) | 457 (78.9%) | 122 (21.1%) |
| Total (Overall) | 2,791 (55.9%) | 2,203 (44.1%) |
Employment Industries by Sex in East Whittier
Employment Industries in East Whittier
The major employment industries in East Whittier include Health Care & Social Assistance (745 | 14.9%), Retail Trade (624 | 12.5%), Educational Services (486 | 9.7%), Construction (387 | 7.7%), and Manufacturing (353 | 7.1%).
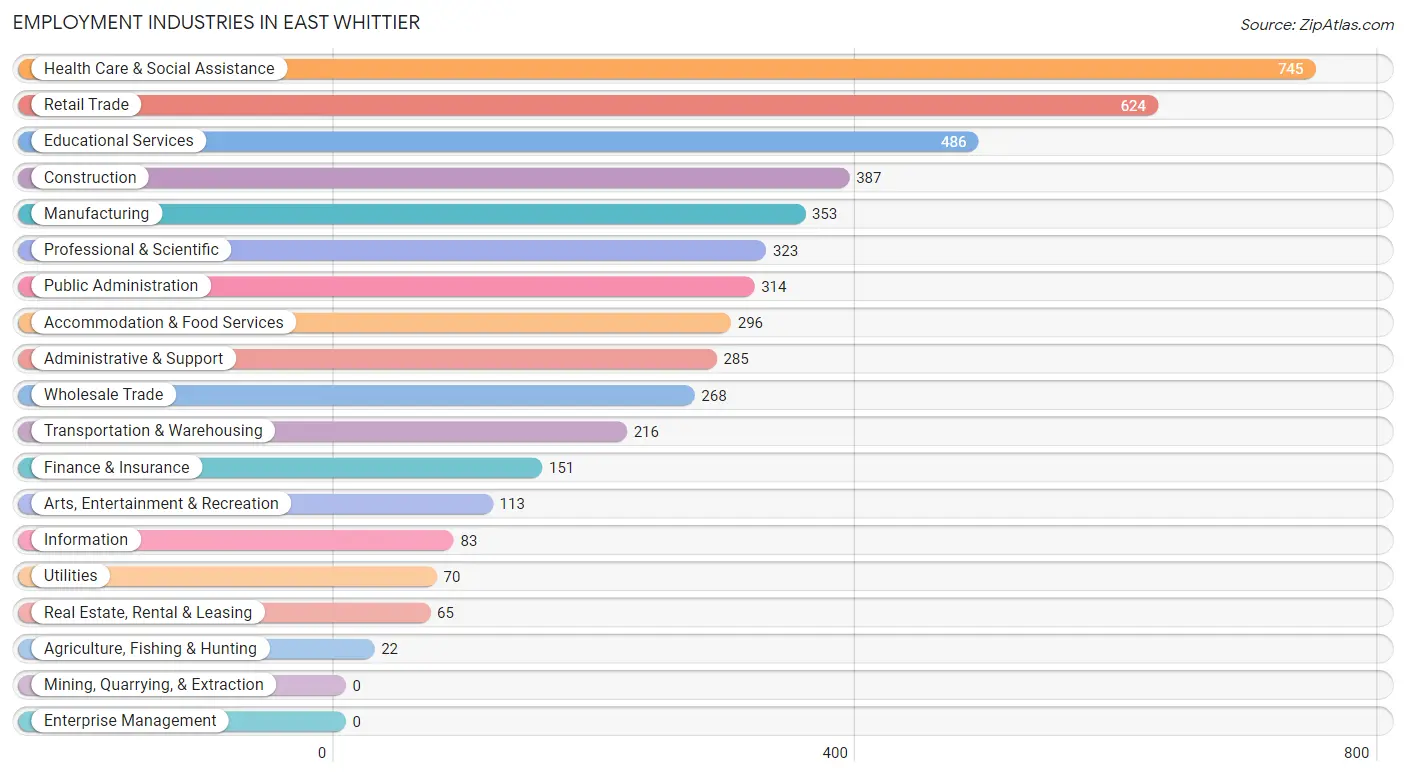
Employment Industries by Sex in East Whittier
The East Whittier industries that see more men than women are Agriculture, Fishing & Hunting (100.0%), Utilities (100.0%), and Transportation & Warehousing (94.0%), whereas the industries that tend to have a higher number of women are Educational Services (73.1%), Accommodation & Food Services (64.9%), and Health Care & Social Assistance (62.4%).
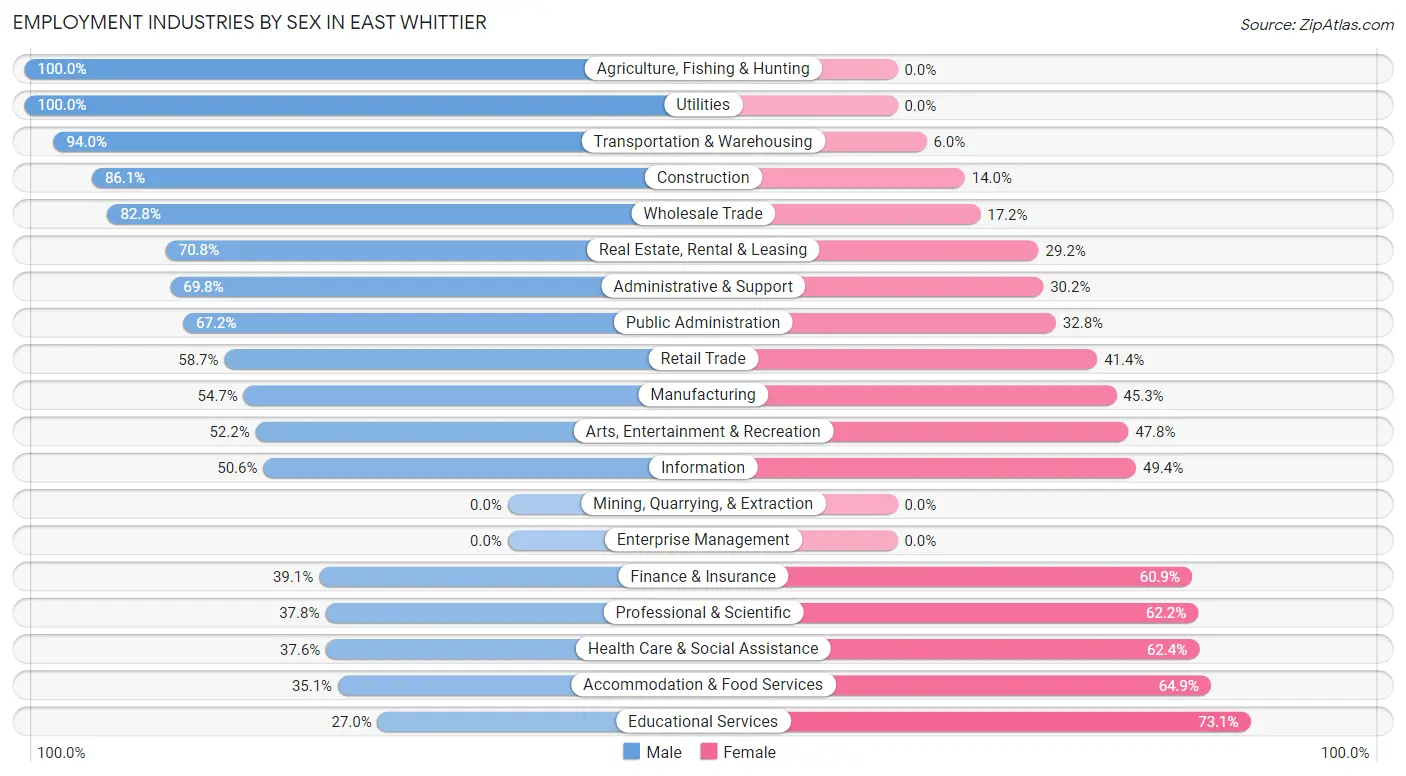
| Industry | Male | Female |
| Agriculture, Fishing & Hunting | 22 (100.0%) | 0 (0.0%) |
| Mining, Quarrying, & Extraction | 0 (0.0%) | 0 (0.0%) |
| Construction | 333 (86.1%) | 54 (14.0%) |
| Manufacturing | 193 (54.7%) | 160 (45.3%) |
| Wholesale Trade | 222 (82.8%) | 46 (17.2%) |
| Retail Trade | 366 (58.7%) | 258 (41.3%) |
| Transportation & Warehousing | 203 (94.0%) | 13 (6.0%) |
| Utilities | 70 (100.0%) | 0 (0.0%) |
| Information | 42 (50.6%) | 41 (49.4%) |
| Finance & Insurance | 59 (39.1%) | 92 (60.9%) |
| Real Estate, Rental & Leasing | 46 (70.8%) | 19 (29.2%) |
| Professional & Scientific | 122 (37.8%) | 201 (62.2%) |
| Enterprise Management | 0 (0.0%) | 0 (0.0%) |
| Administrative & Support | 199 (69.8%) | 86 (30.2%) |
| Educational Services | 131 (27.0%) | 355 (73.1%) |
| Health Care & Social Assistance | 280 (37.6%) | 465 (62.4%) |
| Arts, Entertainment & Recreation | 59 (52.2%) | 54 (47.8%) |
| Accommodation & Food Services | 104 (35.1%) | 192 (64.9%) |
| Public Administration | 211 (67.2%) | 103 (32.8%) |
| Total | 2,791 (55.9%) | 2,203 (44.1%) |
Education in East Whittier
School Enrollment in East Whittier
The most common levels of schooling among the 2,730 students in East Whittier are college / undergraduate (809 | 29.6%), high school (602 | 22.1%), and elementary school (423 | 15.5%).
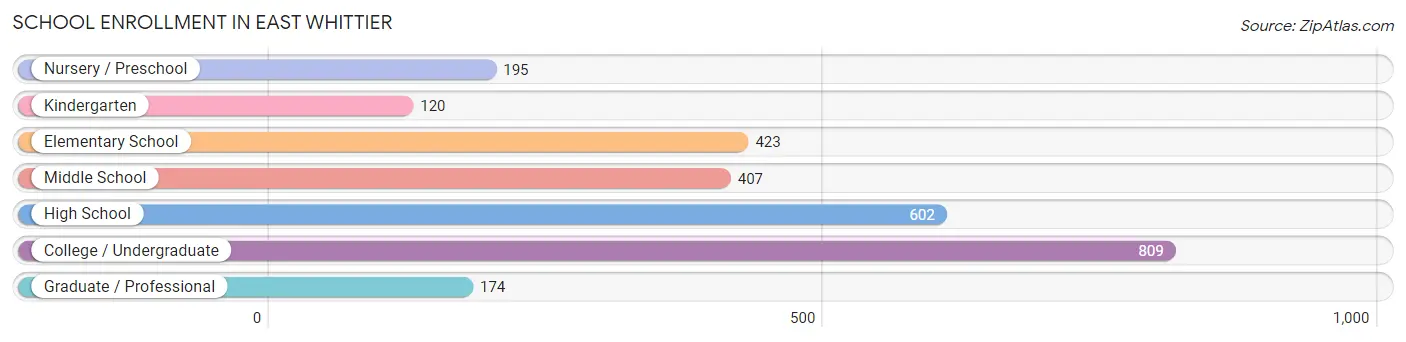
| School Level | # Students | % Students |
| Nursery / Preschool | 195 | 7.1% |
| Kindergarten | 120 | 4.4% |
| Elementary School | 423 | 15.5% |
| Middle School | 407 | 14.9% |
| High School | 602 | 22.1% |
| College / Undergraduate | 809 | 29.6% |
| Graduate / Professional | 174 | 6.4% |
| Total | 2,730 | 100.0% |
School Enrollment by Age by Funding Source in East Whittier
Out of a total of 2,730 students who are enrolled in schools in East Whittier, 511 (18.7%) attend a private institution, while the remaining 2,219 (81.3%) are enrolled in public schools. The age group of 20 to 24 year olds has the highest likelihood of being enrolled in private schools, with 251 (49.7% in the age bracket) enrolled. Conversely, the age group of 10 to 14 year olds has the lowest likelihood of being enrolled in a private school, with 492 (96.7% in the age bracket) attending a public institution.
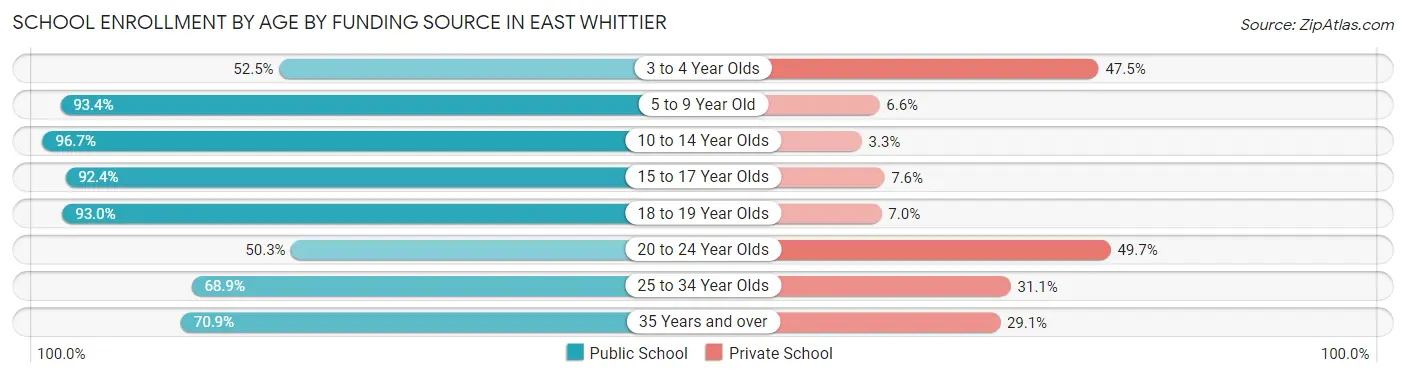
| Age Bracket | Public School | Private School |
| 3 to 4 Year Olds | 31 (52.5%) | 28 (47.5%) |
| 5 to 9 Year Old | 619 (93.4%) | 44 (6.6%) |
| 10 to 14 Year Olds | 492 (96.7%) | 17 (3.3%) |
| 15 to 17 Year Olds | 403 (92.4%) | 33 (7.6%) |
| 18 to 19 Year Olds | 119 (93.0%) | 9 (7.0%) |
| 20 to 24 Year Olds | 254 (50.3%) | 251 (49.7%) |
| 25 to 34 Year Olds | 133 (68.9%) | 60 (31.1%) |
| 35 Years and over | 168 (70.9%) | 69 (29.1%) |
| Total | 2,219 (81.3%) | 511 (18.7%) |
Educational Attainment by Field of Study in East Whittier
Business (548 | 23.6%), education (222 | 9.6%), psychology (198 | 8.5%), engineering (182 | 7.8%), and science & technology (176 | 7.6%) are the most common fields of study among 2,325 individuals in East Whittier who have obtained a bachelor's degree or higher.
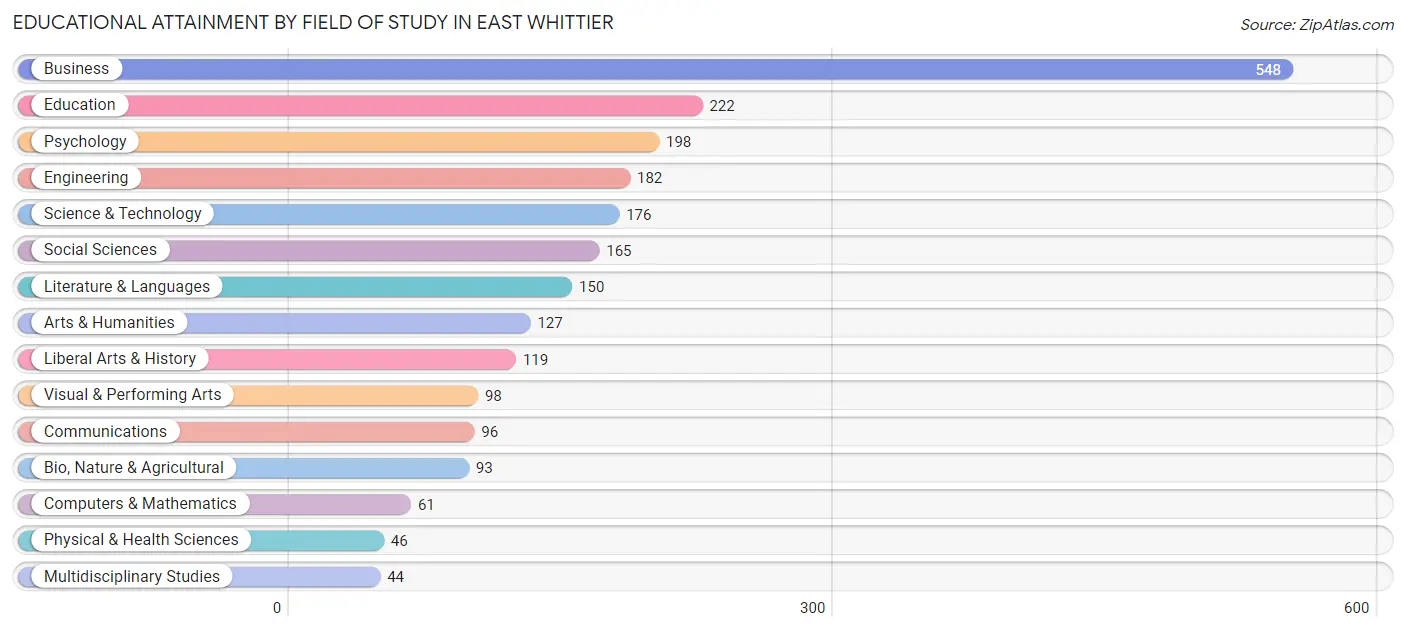
| Field of Study | # Graduates | % Graduates |
| Computers & Mathematics | 61 | 2.6% |
| Bio, Nature & Agricultural | 93 | 4.0% |
| Physical & Health Sciences | 46 | 2.0% |
| Psychology | 198 | 8.5% |
| Social Sciences | 165 | 7.1% |
| Engineering | 182 | 7.8% |
| Multidisciplinary Studies | 44 | 1.9% |
| Science & Technology | 176 | 7.6% |
| Business | 548 | 23.6% |
| Education | 222 | 9.6% |
| Literature & Languages | 150 | 6.5% |
| Liberal Arts & History | 119 | 5.1% |
| Visual & Performing Arts | 98 | 4.2% |
| Communications | 96 | 4.1% |
| Arts & Humanities | 127 | 5.5% |
| Total | 2,325 | 100.0% |
Transportation & Commute in East Whittier
Vehicle Availability by Sex in East Whittier
The most prevalent vehicle ownership categories in East Whittier are males with 2 vehicles (1,115, accounting for 40.7%) and females with 2 vehicles (955, making up 51.4%).
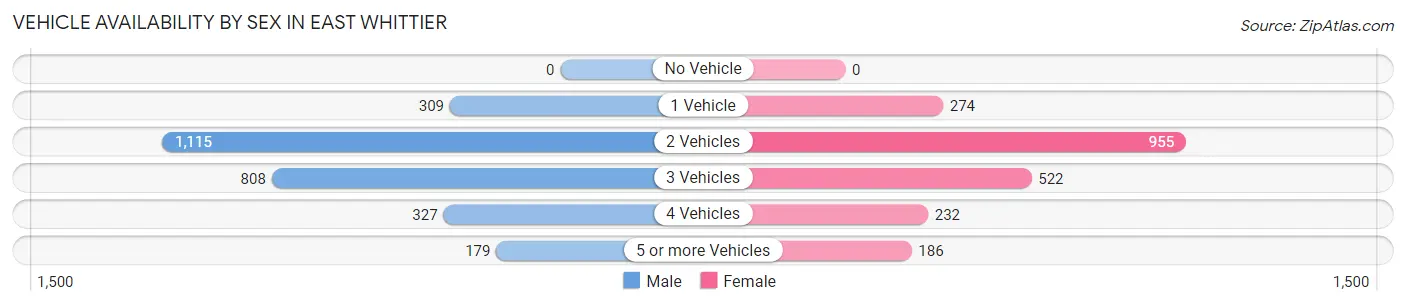
| Vehicles Available | Male | Female |
| No Vehicle | 0 (0.0%) | 0 (0.0%) |
| 1 Vehicle | 309 (11.3%) | 274 (12.6%) |
| 2 Vehicles | 1,115 (40.7%) | 955 (44.0%) |
| 3 Vehicles | 808 (29.5%) | 522 (24.1%) |
| 4 Vehicles | 327 (11.9%) | 232 (10.7%) |
| 5 or more Vehicles | 179 (6.5%) | 186 (8.6%) |
| Total | 2,738 (100.0%) | 2,169 (100.0%) |
Commute Time in East Whittier
The most frequently occuring commute durations in East Whittier are 45 to 59 minutes (799 commuters, 17.6%), 20 to 24 minutes (669 commuters, 14.8%), and 30 to 34 minutes (534 commuters, 11.8%).
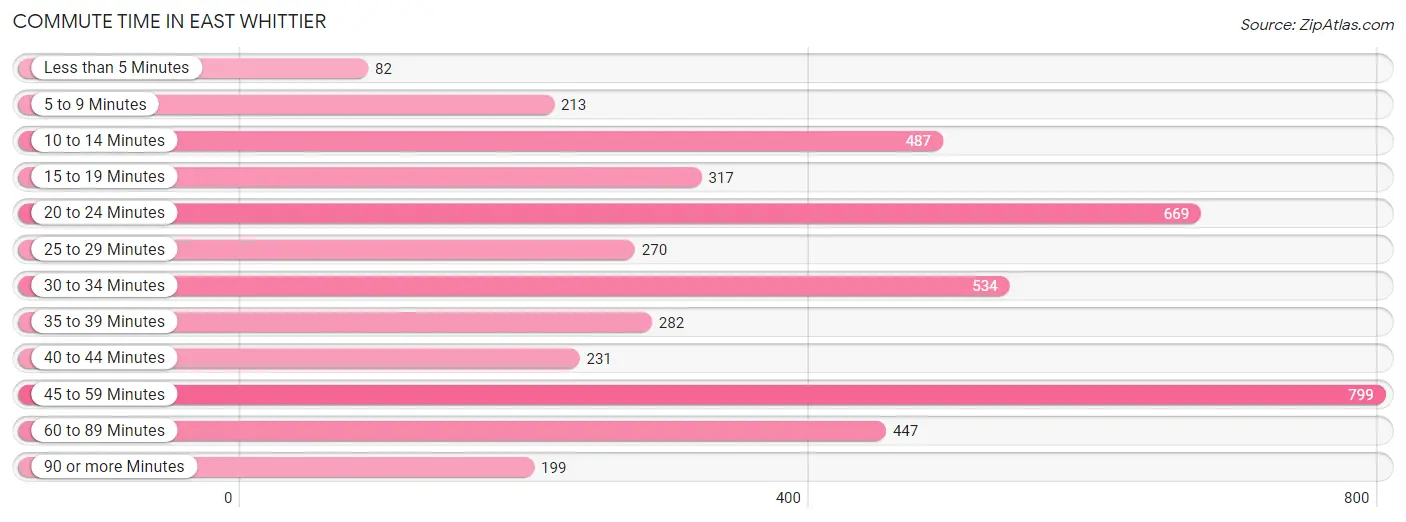
| Commute Time | # Commuters | % Commuters |
| Less than 5 Minutes | 82 | 1.8% |
| 5 to 9 Minutes | 213 | 4.7% |
| 10 to 14 Minutes | 487 | 10.7% |
| 15 to 19 Minutes | 317 | 7.0% |
| 20 to 24 Minutes | 669 | 14.8% |
| 25 to 29 Minutes | 270 | 6.0% |
| 30 to 34 Minutes | 534 | 11.8% |
| 35 to 39 Minutes | 282 | 6.2% |
| 40 to 44 Minutes | 231 | 5.1% |
| 45 to 59 Minutes | 799 | 17.6% |
| 60 to 89 Minutes | 447 | 9.9% |
| 90 or more Minutes | 199 | 4.4% |
Commute Time by Sex in East Whittier
The most common commute times in East Whittier are 45 to 59 minutes (506 commuters, 19.4%) for males and 20 to 24 minutes (336 commuters, 17.4%) for females.
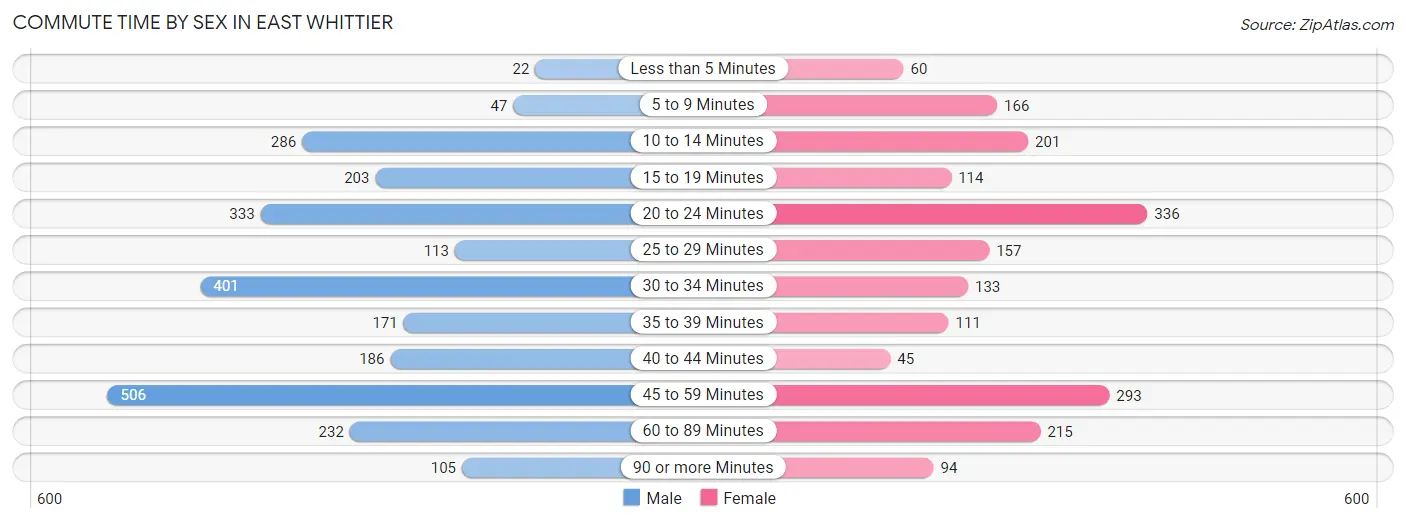
| Commute Time | Male | Female |
| Less than 5 Minutes | 22 (0.8%) | 60 (3.1%) |
| 5 to 9 Minutes | 47 (1.8%) | 166 (8.6%) |
| 10 to 14 Minutes | 286 (11.0%) | 201 (10.4%) |
| 15 to 19 Minutes | 203 (7.8%) | 114 (5.9%) |
| 20 to 24 Minutes | 333 (12.8%) | 336 (17.4%) |
| 25 to 29 Minutes | 113 (4.3%) | 157 (8.2%) |
| 30 to 34 Minutes | 401 (15.4%) | 133 (6.9%) |
| 35 to 39 Minutes | 171 (6.6%) | 111 (5.8%) |
| 40 to 44 Minutes | 186 (7.1%) | 45 (2.3%) |
| 45 to 59 Minutes | 506 (19.4%) | 293 (15.2%) |
| 60 to 89 Minutes | 232 (8.9%) | 215 (11.2%) |
| 90 or more Minutes | 105 (4.0%) | 94 (4.9%) |
Time of Departure to Work by Sex in East Whittier
The most frequent times of departure to work in East Whittier are 8:00 AM to 8:29 AM (302, 11.6%) for males and 7:30 AM to 7:59 AM (356, 18.5%) for females.
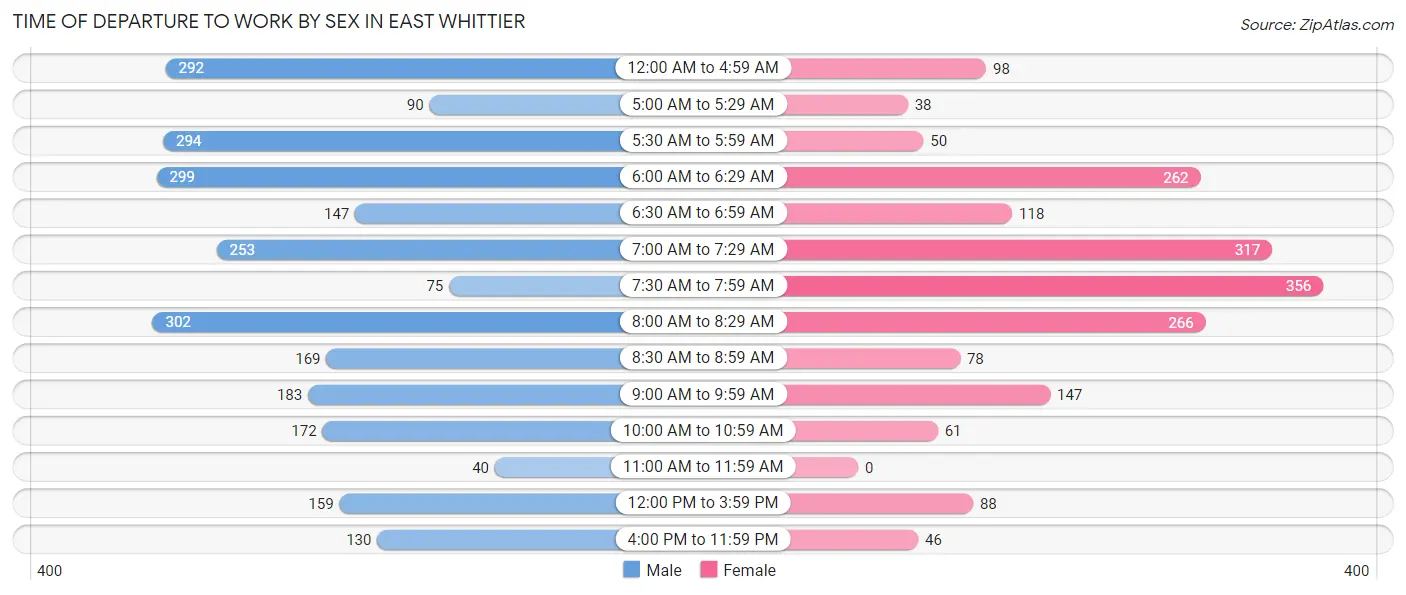
| Time of Departure | Male | Female |
| 12:00 AM to 4:59 AM | 292 (11.2%) | 98 (5.1%) |
| 5:00 AM to 5:29 AM | 90 (3.5%) | 38 (2.0%) |
| 5:30 AM to 5:59 AM | 294 (11.3%) | 50 (2.6%) |
| 6:00 AM to 6:29 AM | 299 (11.5%) | 262 (13.6%) |
| 6:30 AM to 6:59 AM | 147 (5.6%) | 118 (6.1%) |
| 7:00 AM to 7:29 AM | 253 (9.7%) | 317 (16.5%) |
| 7:30 AM to 7:59 AM | 75 (2.9%) | 356 (18.5%) |
| 8:00 AM to 8:29 AM | 302 (11.6%) | 266 (13.8%) |
| 8:30 AM to 8:59 AM | 169 (6.5%) | 78 (4.1%) |
| 9:00 AM to 9:59 AM | 183 (7.0%) | 147 (7.6%) |
| 10:00 AM to 10:59 AM | 172 (6.6%) | 61 (3.2%) |
| 11:00 AM to 11:59 AM | 40 (1.5%) | 0 (0.0%) |
| 12:00 PM to 3:59 PM | 159 (6.1%) | 88 (4.6%) |
| 4:00 PM to 11:59 PM | 130 (5.0%) | 46 (2.4%) |
| Total | 2,605 (100.0%) | 1,925 (100.0%) |
Housing Occupancy in East Whittier
Occupancy by Ownership in East Whittier
Of the total 3,345 dwellings in East Whittier, owner-occupied units account for 1,930 (57.7%), while renter-occupied units make up 1,415 (42.3%).
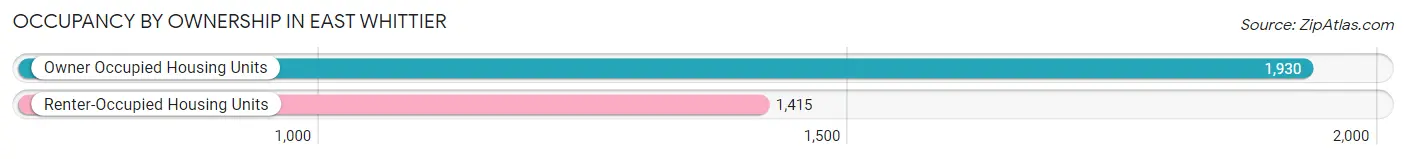
| Occupancy | # Housing Units | % Housing Units |
| Owner Occupied Housing Units | 1,930 | 57.7% |
| Renter-Occupied Housing Units | 1,415 | 42.3% |
| Total Occupied Housing Units | 3,345 | 100.0% |
Occupancy by Household Size in East Whittier
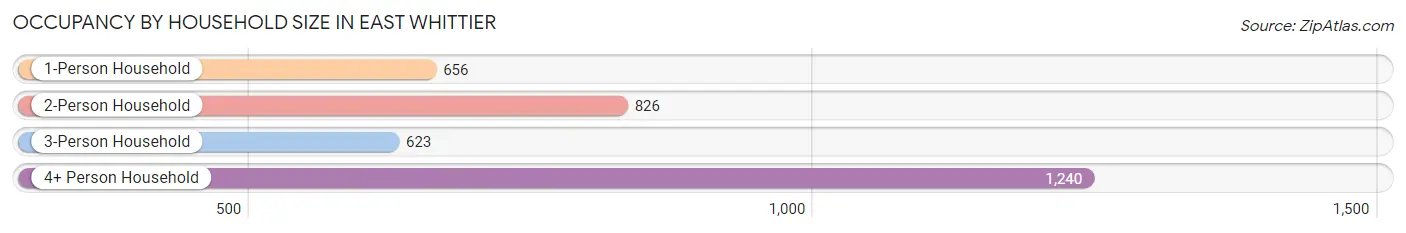
| Household Size | # Housing Units | % Housing Units |
| 1-Person Household | 656 | 19.6% |
| 2-Person Household | 826 | 24.7% |
| 3-Person Household | 623 | 18.6% |
| 4+ Person Household | 1,240 | 37.1% |
| Total Housing Units | 3,345 | 100.0% |
Occupancy by Ownership by Household Size in East Whittier
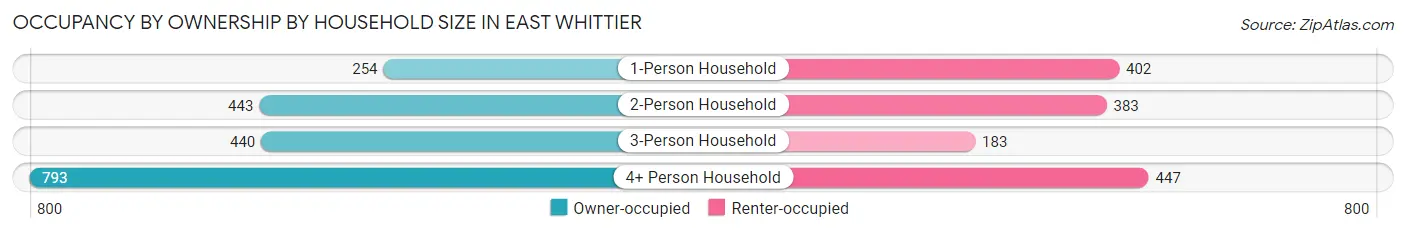
| Household Size | Owner-occupied | Renter-occupied |
| 1-Person Household | 254 (38.7%) | 402 (61.3%) |
| 2-Person Household | 443 (53.6%) | 383 (46.4%) |
| 3-Person Household | 440 (70.6%) | 183 (29.4%) |
| 4+ Person Household | 793 (63.9%) | 447 (36.0%) |
| Total Housing Units | 1,930 (57.7%) | 1,415 (42.3%) |
Occupancy by Educational Attainment in East Whittier
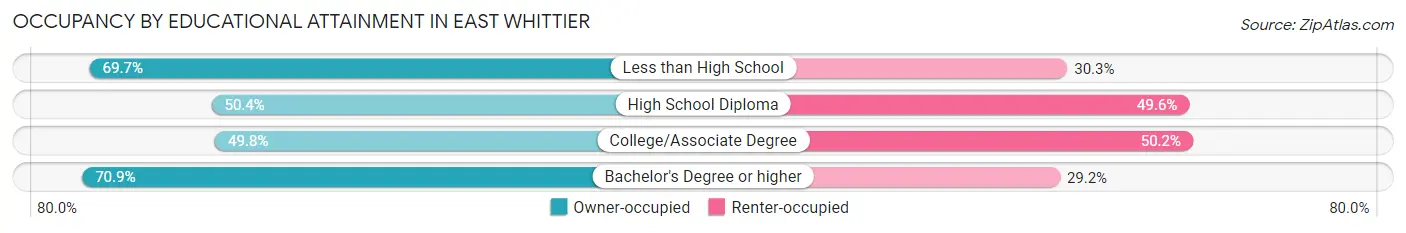
| Household Size | Owner-occupied | Renter-occupied |
| Less than High School | 108 (69.7%) | 47 (30.3%) |
| High School Diploma | 352 (50.4%) | 347 (49.6%) |
| College/Associate Degree | 697 (49.8%) | 703 (50.2%) |
| Bachelor's Degree or higher | 773 (70.9%) | 318 (29.1%) |
Occupancy by Age of Householder in East Whittier
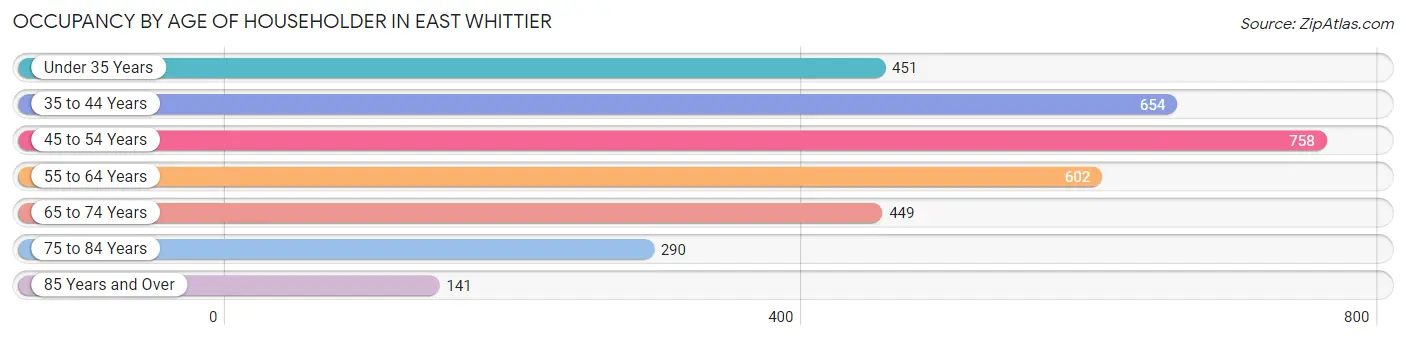
| Age Bracket | # Households | % Households |
| Under 35 Years | 451 | 13.5% |
| 35 to 44 Years | 654 | 19.6% |
| 45 to 54 Years | 758 | 22.7% |
| 55 to 64 Years | 602 | 18.0% |
| 65 to 74 Years | 449 | 13.4% |
| 75 to 84 Years | 290 | 8.7% |
| 85 Years and Over | 141 | 4.2% |
| Total | 3,345 | 100.0% |
Housing Finances in East Whittier
Median Income by Occupancy in East Whittier
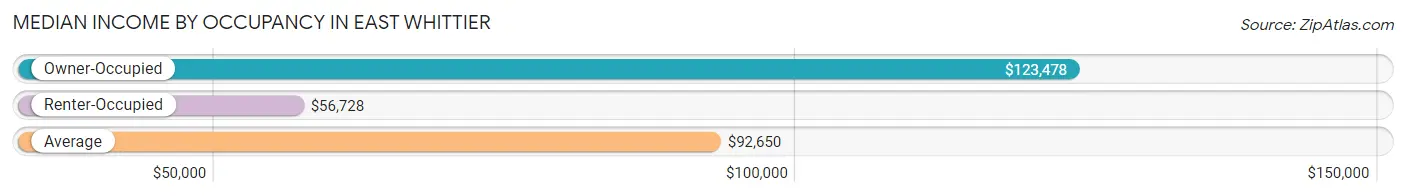
| Occupancy Type | # Households | Median Income |
| Owner-Occupied | 1,930 (57.7%) | $123,478 |
| Renter-Occupied | 1,415 (42.3%) | $56,728 |
| Average | 3,345 (100.0%) | $92,650 |
Occupancy by Householder Income Bracket in East Whittier
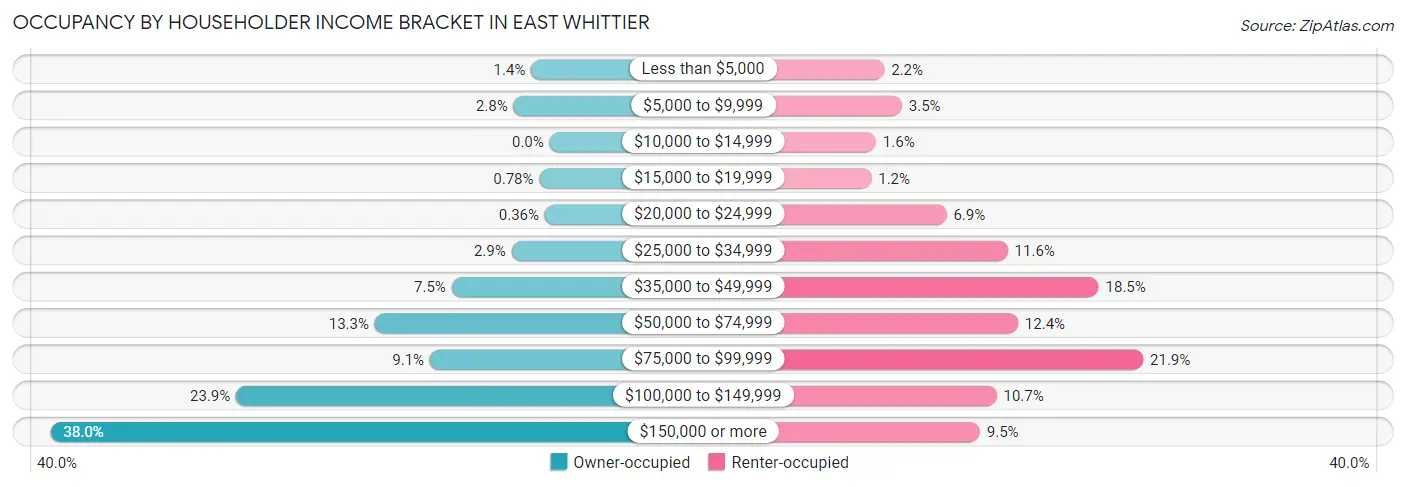
| Income Bracket | Owner-occupied | Renter-occupied |
| Less than $5,000 | 27 (1.4%) | 31 (2.2%) |
| $5,000 to $9,999 | 53 (2.8%) | 50 (3.5%) |
| $10,000 to $14,999 | 0 (0.0%) | 22 (1.5%) |
| $15,000 to $19,999 | 15 (0.8%) | 17 (1.2%) |
| $20,000 to $24,999 | 7 (0.4%) | 98 (6.9%) |
| $25,000 to $34,999 | 56 (2.9%) | 164 (11.6%) |
| $35,000 to $49,999 | 144 (7.5%) | 262 (18.5%) |
| $50,000 to $74,999 | 257 (13.3%) | 175 (12.4%) |
| $75,000 to $99,999 | 176 (9.1%) | 310 (21.9%) |
| $100,000 to $149,999 | 461 (23.9%) | 152 (10.7%) |
| $150,000 or more | 734 (38.0%) | 134 (9.5%) |
| Total | 1,930 (100.0%) | 1,415 (100.0%) |
Monthly Housing Cost Tiers in East Whittier
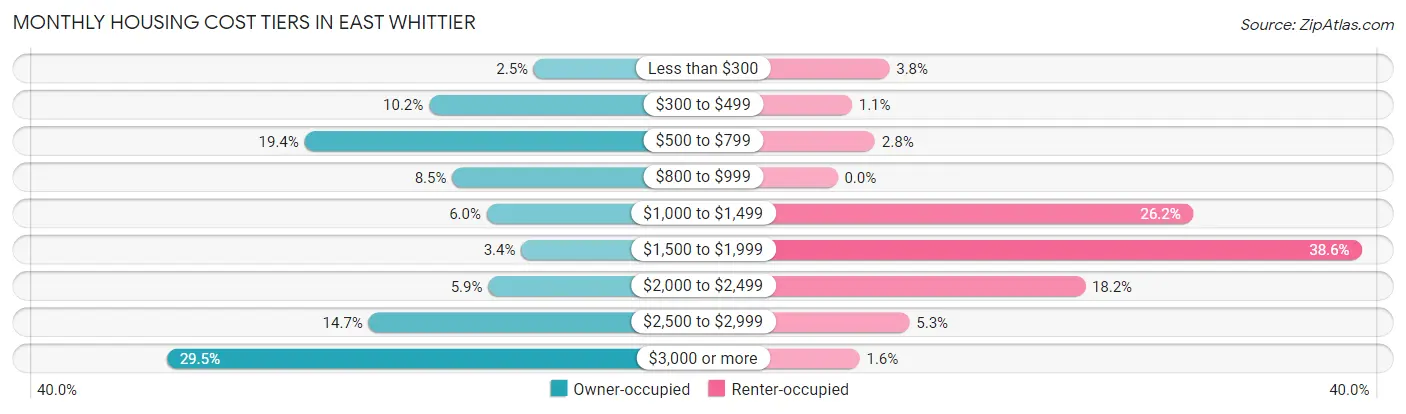
| Monthly Cost | Owner-occupied | Renter-occupied |
| Less than $300 | 48 (2.5%) | 54 (3.8%) |
| $300 to $499 | 197 (10.2%) | 15 (1.1%) |
| $500 to $799 | 374 (19.4%) | 39 (2.8%) |
| $800 to $999 | 164 (8.5%) | 0 (0.0%) |
| $1,000 to $1,499 | 115 (6.0%) | 370 (26.2%) |
| $1,500 to $1,999 | 66 (3.4%) | 546 (38.6%) |
| $2,000 to $2,499 | 113 (5.9%) | 258 (18.2%) |
| $2,500 to $2,999 | 283 (14.7%) | 75 (5.3%) |
| $3,000 or more | 570 (29.5%) | 23 (1.6%) |
| Total | 1,930 (100.0%) | 1,415 (100.0%) |
Physical Housing Characteristics in East Whittier
Housing Structures in East Whittier
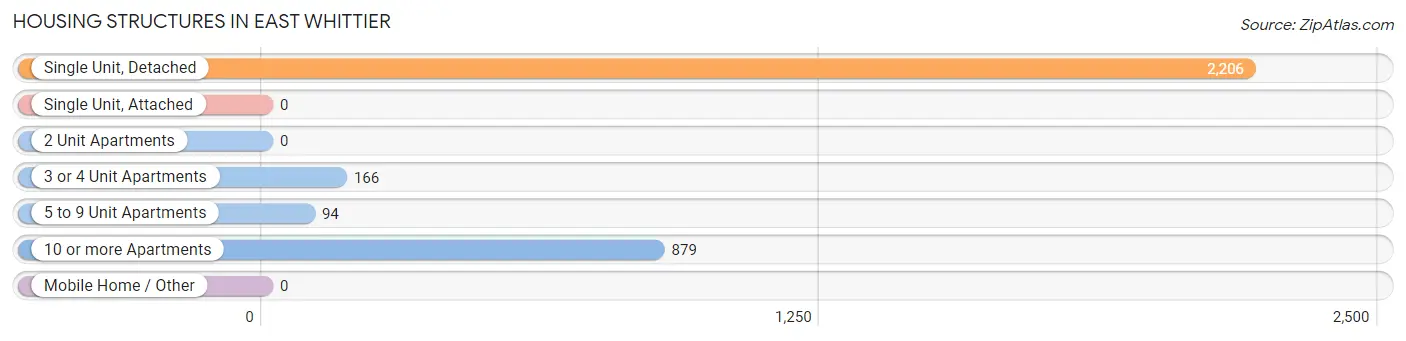
| Structure Type | # Housing Units | % Housing Units |
| Single Unit, Detached | 2,206 | 65.9% |
| Single Unit, Attached | 0 | 0.0% |
| 2 Unit Apartments | 0 | 0.0% |
| 3 or 4 Unit Apartments | 166 | 5.0% |
| 5 to 9 Unit Apartments | 94 | 2.8% |
| 10 or more Apartments | 879 | 26.3% |
| Mobile Home / Other | 0 | 0.0% |
| Total | 3,345 | 100.0% |
Housing Structures by Occupancy in East Whittier
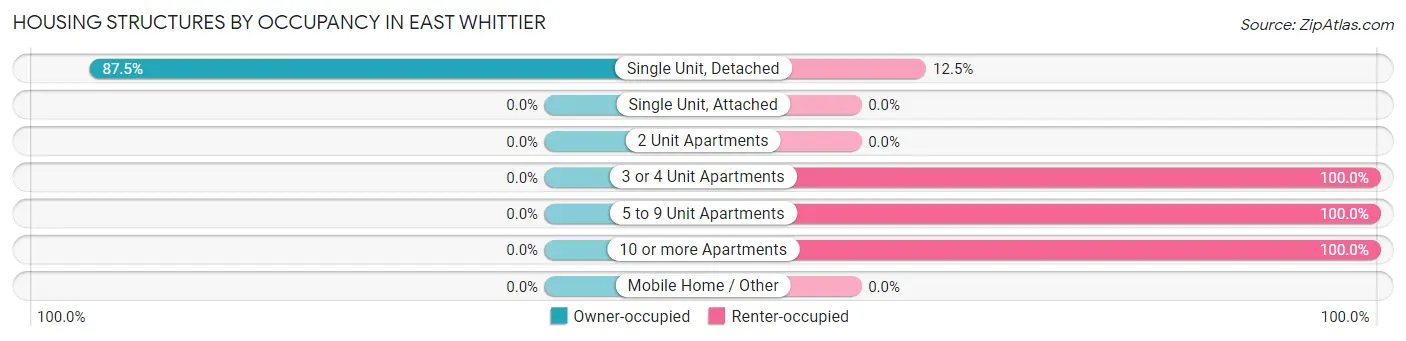
| Structure Type | Owner-occupied | Renter-occupied |
| Single Unit, Detached | 1,930 (87.5%) | 276 (12.5%) |
| Single Unit, Attached | 0 (0.0%) | 0 (0.0%) |
| 2 Unit Apartments | 0 (0.0%) | 0 (0.0%) |
| 3 or 4 Unit Apartments | 0 (0.0%) | 166 (100.0%) |
| 5 to 9 Unit Apartments | 0 (0.0%) | 94 (100.0%) |
| 10 or more Apartments | 0 (0.0%) | 879 (100.0%) |
| Mobile Home / Other | 0 (0.0%) | 0 (0.0%) |
| Total | 1,930 (57.7%) | 1,415 (42.3%) |
Housing Structures by Number of Rooms in East Whittier
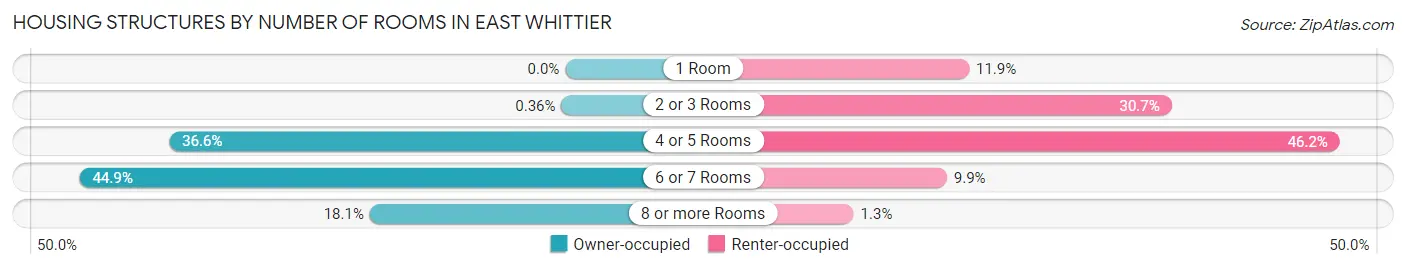
| Number of Rooms | Owner-occupied | Renter-occupied |
| 1 Room | 0 (0.0%) | 169 (11.9%) |
| 2 or 3 Rooms | 7 (0.4%) | 434 (30.7%) |
| 4 or 5 Rooms | 707 (36.6%) | 654 (46.2%) |
| 6 or 7 Rooms | 867 (44.9%) | 140 (9.9%) |
| 8 or more Rooms | 349 (18.1%) | 18 (1.3%) |
| Total | 1,930 (100.0%) | 1,415 (100.0%) |
Housing Structure by Heating Type in East Whittier
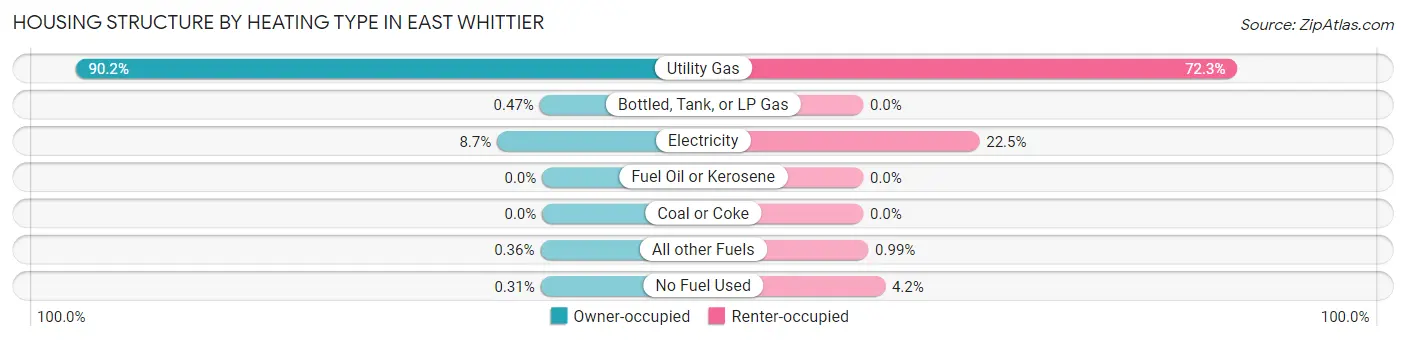
| Heating Type | Owner-occupied | Renter-occupied |
| Utility Gas | 1,740 (90.2%) | 1,023 (72.3%) |
| Bottled, Tank, or LP Gas | 9 (0.5%) | 0 (0.0%) |
| Electricity | 168 (8.7%) | 318 (22.5%) |
| Fuel Oil or Kerosene | 0 (0.0%) | 0 (0.0%) |
| Coal or Coke | 0 (0.0%) | 0 (0.0%) |
| All other Fuels | 7 (0.4%) | 14 (1.0%) |
| No Fuel Used | 6 (0.3%) | 60 (4.2%) |
| Total | 1,930 (100.0%) | 1,415 (100.0%) |
Household Vehicle Usage in East Whittier
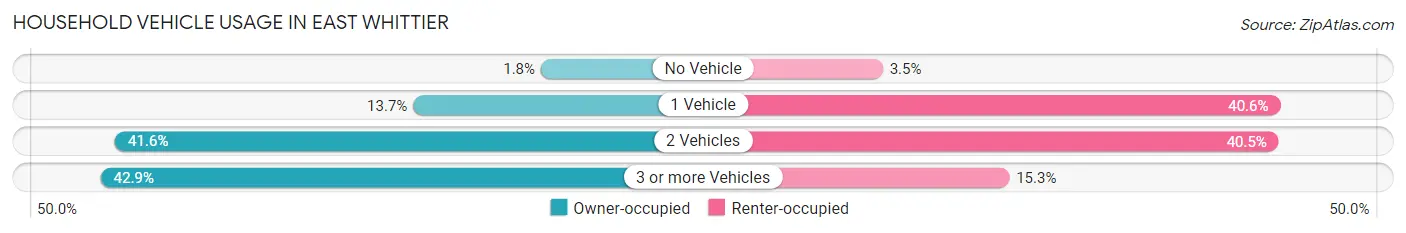
| Vehicles per Household | Owner-occupied | Renter-occupied |
| No Vehicle | 35 (1.8%) | 50 (3.5%) |
| 1 Vehicle | 265 (13.7%) | 575 (40.6%) |
| 2 Vehicles | 802 (41.5%) | 573 (40.5%) |
| 3 or more Vehicles | 828 (42.9%) | 217 (15.3%) |
| Total | 1,930 (100.0%) | 1,415 (100.0%) |
Real Estate & Mortgages in East Whittier
Real Estate and Mortgage Overview in East Whittier
| Characteristic | Without Mortgage | With Mortgage |
| Housing Units | 793 | 1,137 |
| Median Property Value | $679,800 | $674,100 |
| Median Household Income | $93,795 | $538 |
| Monthly Housing Costs | $649 | $570 |
| Real Estate Taxes | $3,591 | $0 |
Property Value by Mortgage Status in East Whittier
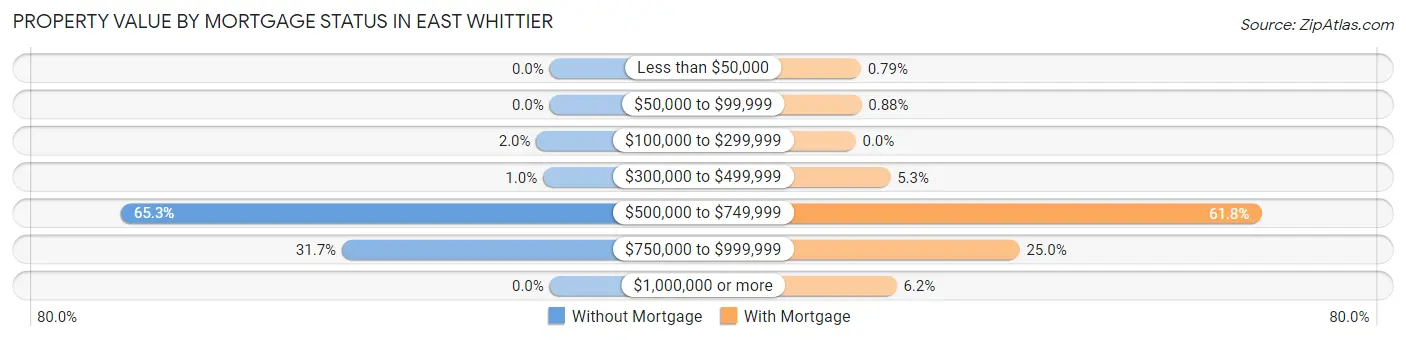
| Property Value | Without Mortgage | With Mortgage |
| Less than $50,000 | 0 (0.0%) | 9 (0.8%) |
| $50,000 to $99,999 | 0 (0.0%) | 10 (0.9%) |
| $100,000 to $299,999 | 16 (2.0%) | 0 (0.0%) |
| $300,000 to $499,999 | 8 (1.0%) | 60 (5.3%) |
| $500,000 to $749,999 | 518 (65.3%) | 703 (61.8%) |
| $750,000 to $999,999 | 251 (31.7%) | 284 (25.0%) |
| $1,000,000 or more | 0 (0.0%) | 71 (6.2%) |
| Total | 793 (100.0%) | 1,137 (100.0%) |
Household Income by Mortgage Status in East Whittier
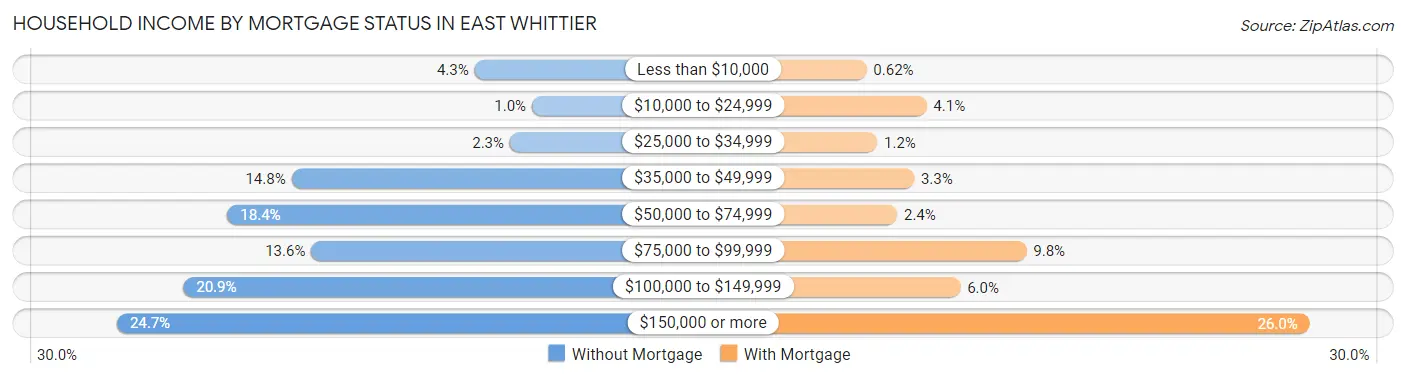
| Household Income | Without Mortgage | With Mortgage |
| Less than $10,000 | 34 (4.3%) | 7 (0.6%) |
| $10,000 to $24,999 | 8 (1.0%) | 46 (4.1%) |
| $25,000 to $34,999 | 18 (2.3%) | 14 (1.2%) |
| $35,000 to $49,999 | 117 (14.7%) | 38 (3.3%) |
| $50,000 to $74,999 | 146 (18.4%) | 27 (2.4%) |
| $75,000 to $99,999 | 108 (13.6%) | 111 (9.8%) |
| $100,000 to $149,999 | 166 (20.9%) | 68 (6.0%) |
| $150,000 or more | 196 (24.7%) | 295 (26.0%) |
| Total | 793 (100.0%) | 1,137 (100.0%) |
Property Value to Household Income Ratio in East Whittier
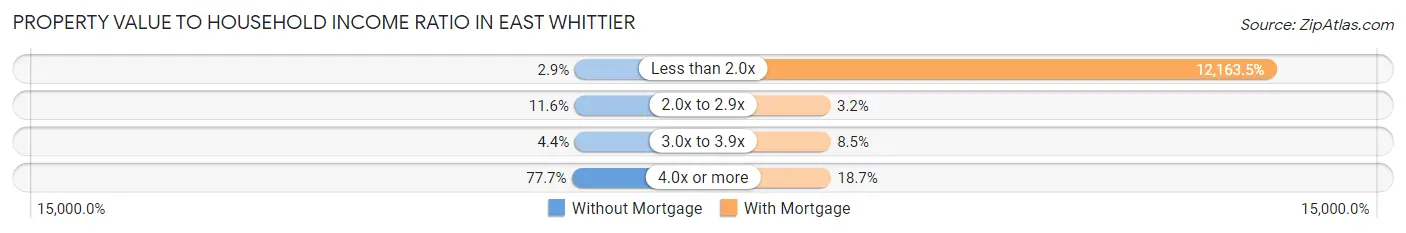
| Value-to-Income Ratio | Without Mortgage | With Mortgage |
| Less than 2.0x | 23 (2.9%) | 138,299 (12,163.5%) |
| 2.0x to 2.9x | 92 (11.6%) | 36 (3.2%) |
| 3.0x to 3.9x | 35 (4.4%) | 97 (8.5%) |
| 4.0x or more | 616 (77.7%) | 213 (18.7%) |
| Total | 793 (100.0%) | 1,137 (100.0%) |
Real Estate Taxes by Mortgage Status in East Whittier
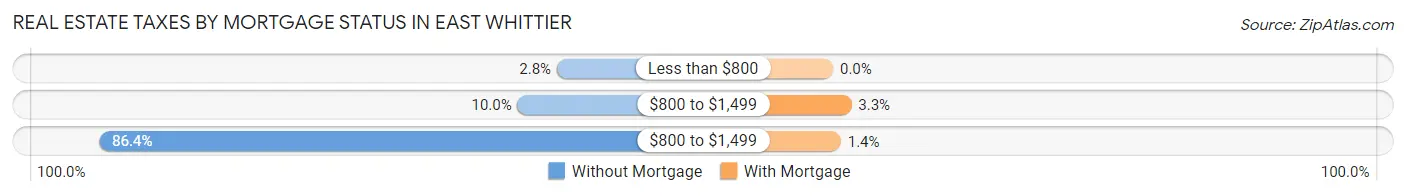
| Property Taxes | Without Mortgage | With Mortgage |
| Less than $800 | 22 (2.8%) | 0 (0.0%) |
| $800 to $1,499 | 79 (10.0%) | 38 (3.3%) |
| $800 to $1,499 | 685 (86.4%) | 16 (1.4%) |
| Total | 793 (100.0%) | 1,137 (100.0%) |
Health & Disability in East Whittier
Health Insurance Coverage by Age in East Whittier
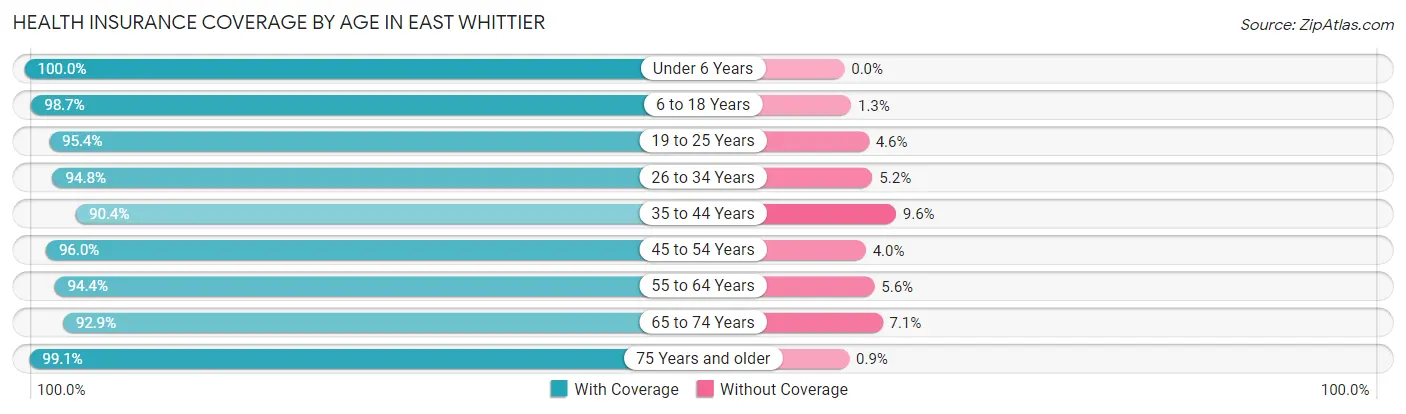
| Age Bracket | With Coverage | Without Coverage |
| Under 6 Years | 775 (100.0%) | 0 (0.0%) |
| 6 to 18 Years | 1,490 (98.7%) | 19 (1.3%) |
| 19 to 25 Years | 1,004 (95.4%) | 48 (4.6%) |
| 26 to 34 Years | 1,139 (94.8%) | 63 (5.2%) |
| 35 to 44 Years | 1,335 (90.4%) | 142 (9.6%) |
| 45 to 54 Years | 1,493 (96.0%) | 62 (4.0%) |
| 55 to 64 Years | 1,029 (94.4%) | 61 (5.6%) |
| 65 to 74 Years | 756 (92.9%) | 58 (7.1%) |
| 75 Years and older | 767 (99.1%) | 7 (0.9%) |
| Total | 9,788 (95.5%) | 460 (4.5%) |
Health Insurance Coverage by Citizenship Status in East Whittier
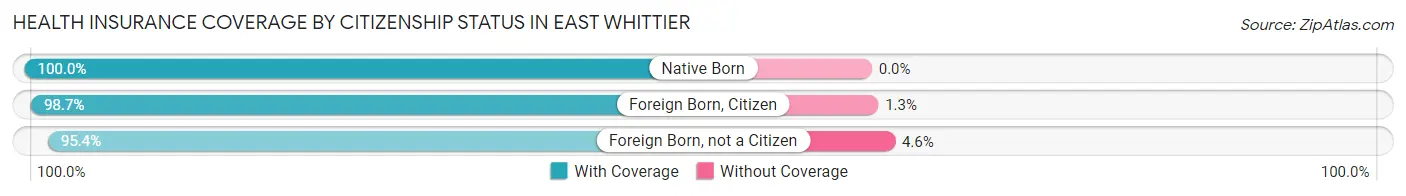
| Citizenship Status | With Coverage | Without Coverage |
| Native Born | 775 (100.0%) | 0 (0.0%) |
| Foreign Born, Citizen | 1,490 (98.7%) | 19 (1.3%) |
| Foreign Born, not a Citizen | 1,004 (95.4%) | 48 (4.6%) |
Health Insurance Coverage by Household Income in East Whittier
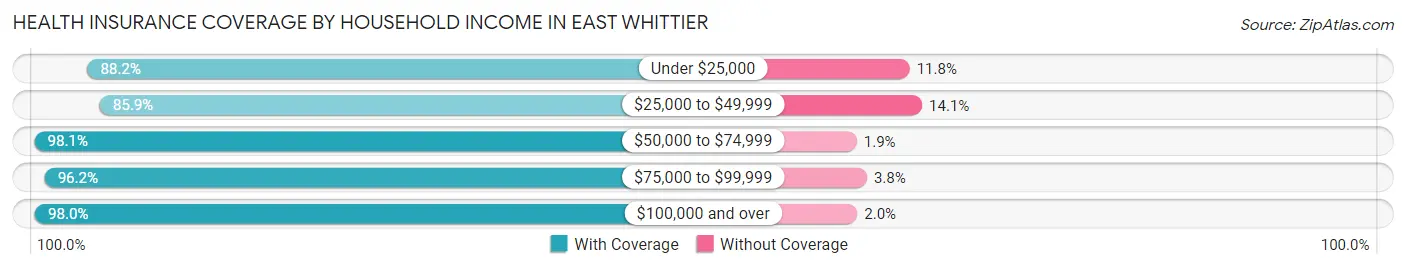
| Household Income | With Coverage | Without Coverage |
| Under $25,000 | 434 (88.2%) | 58 (11.8%) |
| $25,000 to $49,999 | 1,308 (85.9%) | 215 (14.1%) |
| $50,000 to $74,999 | 1,148 (98.1%) | 22 (1.9%) |
| $75,000 to $99,999 | 1,350 (96.2%) | 53 (3.8%) |
| $100,000 and over | 5,493 (98.0%) | 111 (2.0%) |
Public vs Private Health Insurance Coverage by Age in East Whittier
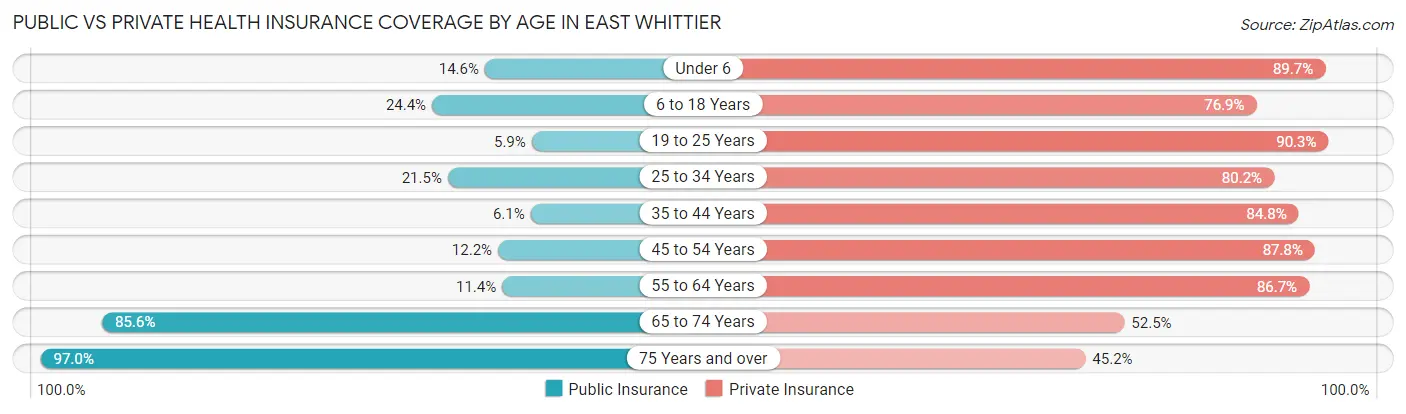
| Age Bracket | Public Insurance | Private Insurance |
| Under 6 | 113 (14.6%) | 695 (89.7%) |
| 6 to 18 Years | 368 (24.4%) | 1,161 (76.9%) |
| 19 to 25 Years | 62 (5.9%) | 950 (90.3%) |
| 25 to 34 Years | 258 (21.5%) | 964 (80.2%) |
| 35 to 44 Years | 90 (6.1%) | 1,252 (84.8%) |
| 45 to 54 Years | 189 (12.1%) | 1,365 (87.8%) |
| 55 to 64 Years | 124 (11.4%) | 945 (86.7%) |
| 65 to 74 Years | 697 (85.6%) | 427 (52.5%) |
| 75 Years and over | 751 (97.0%) | 350 (45.2%) |
| Total | 2,652 (25.9%) | 8,109 (79.1%) |
Disability Status by Sex by Age in East Whittier
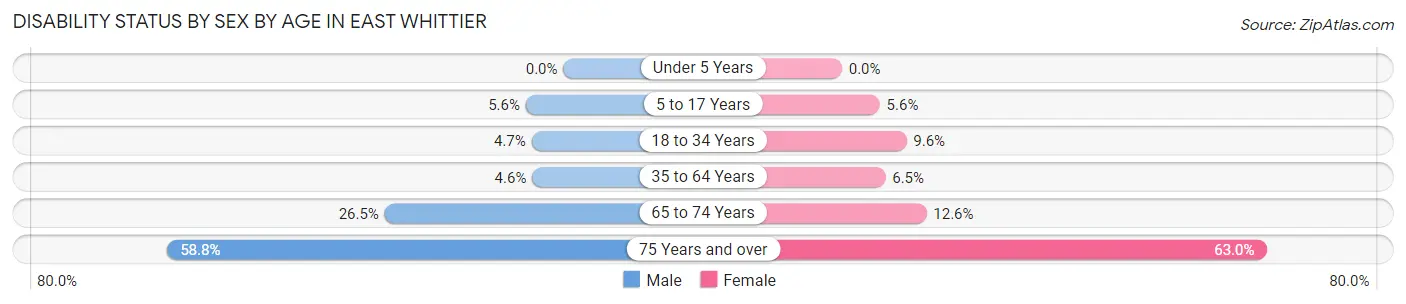
| Age Bracket | Male | Female |
| Under 5 Years | 0 (0.0%) | 0 (0.0%) |
| 5 to 17 Years | 44 (5.6%) | 47 (5.6%) |
| 18 to 34 Years | 58 (4.7%) | 109 (9.6%) |
| 35 to 64 Years | 96 (4.6%) | 132 (6.5%) |
| 65 to 74 Years | 104 (26.5%) | 53 (12.6%) |
| 75 Years and over | 180 (58.8%) | 295 (63.0%) |
Disability Class by Sex by Age in East Whittier
Disability Class: Hearing Difficulty
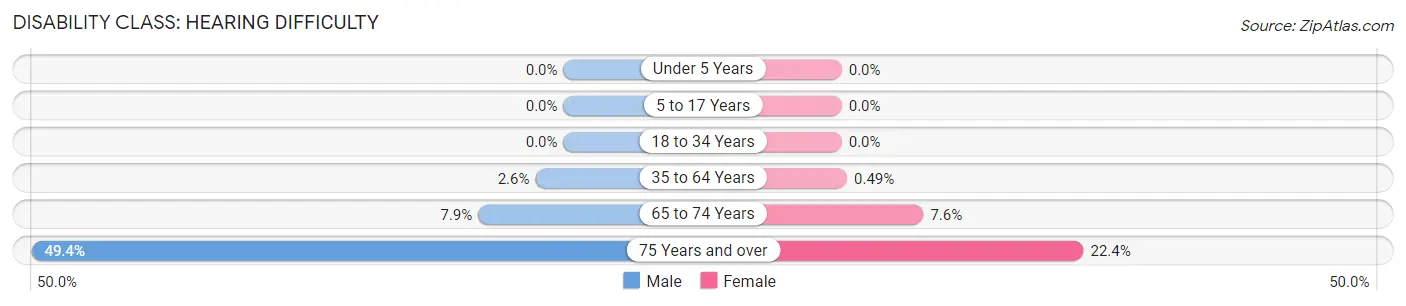
| Age Bracket | Male | Female |
| Under 5 Years | 0 (0.0%) | 0 (0.0%) |
| 5 to 17 Years | 0 (0.0%) | 0 (0.0%) |
| 18 to 34 Years | 0 (0.0%) | 0 (0.0%) |
| 35 to 64 Years | 54 (2.6%) | 10 (0.5%) |
| 65 to 74 Years | 31 (7.9%) | 32 (7.6%) |
| 75 Years and over | 151 (49.3%) | 105 (22.4%) |
Disability Class: Vision Difficulty
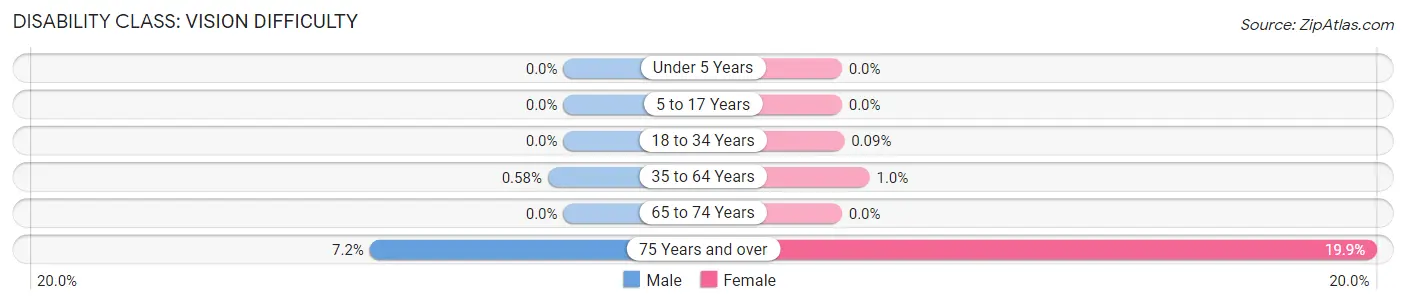
| Age Bracket | Male | Female |
| Under 5 Years | 0 (0.0%) | 0 (0.0%) |
| 5 to 17 Years | 0 (0.0%) | 0 (0.0%) |
| 18 to 34 Years | 0 (0.0%) | 1 (0.1%) |
| 35 to 64 Years | 12 (0.6%) | 21 (1.0%) |
| 65 to 74 Years | 0 (0.0%) | 0 (0.0%) |
| 75 Years and over | 22 (7.2%) | 93 (19.9%) |
Disability Class: Cognitive Difficulty
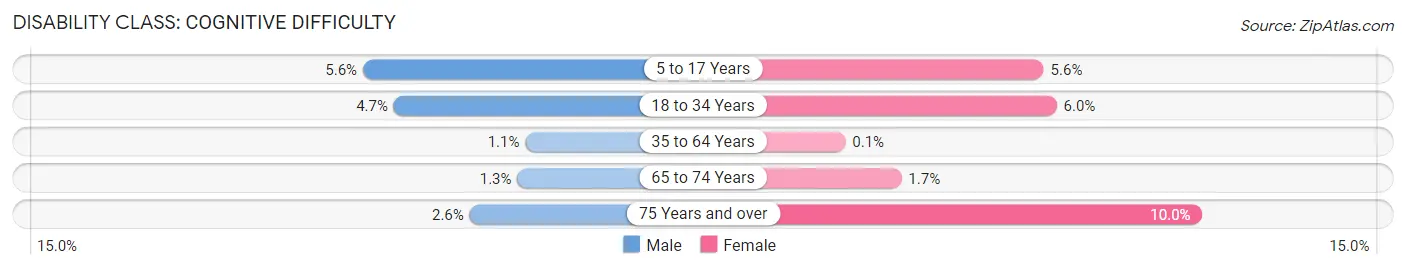
| Age Bracket | Male | Female |
| 5 to 17 Years | 44 (5.6%) | 47 (5.6%) |
| 18 to 34 Years | 58 (4.7%) | 68 (6.0%) |
| 35 to 64 Years | 22 (1.1%) | 2 (0.1%) |
| 65 to 74 Years | 5 (1.3%) | 7 (1.7%) |
| 75 Years and over | 8 (2.6%) | 47 (10.0%) |
Disability Class: Ambulatory Difficulty
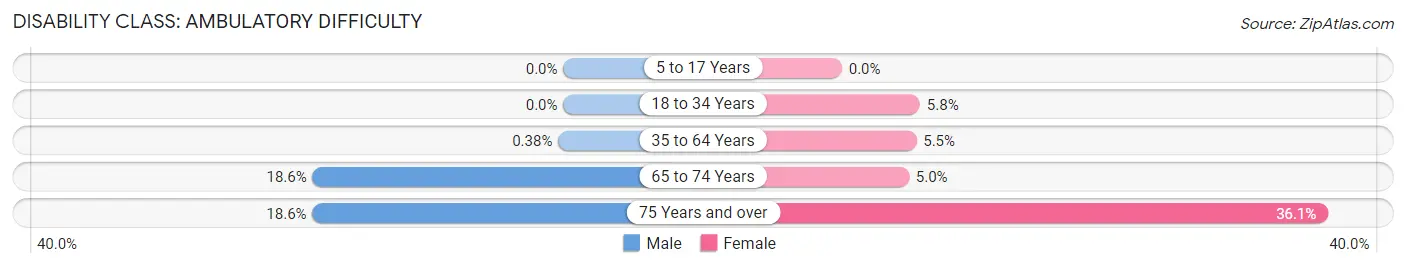
| Age Bracket | Male | Female |
| 5 to 17 Years | 0 (0.0%) | 0 (0.0%) |
| 18 to 34 Years | 0 (0.0%) | 66 (5.8%) |
| 35 to 64 Years | 8 (0.4%) | 113 (5.5%) |
| 65 to 74 Years | 73 (18.6%) | 21 (5.0%) |
| 75 Years and over | 57 (18.6%) | 169 (36.1%) |
Disability Class: Self-Care Difficulty
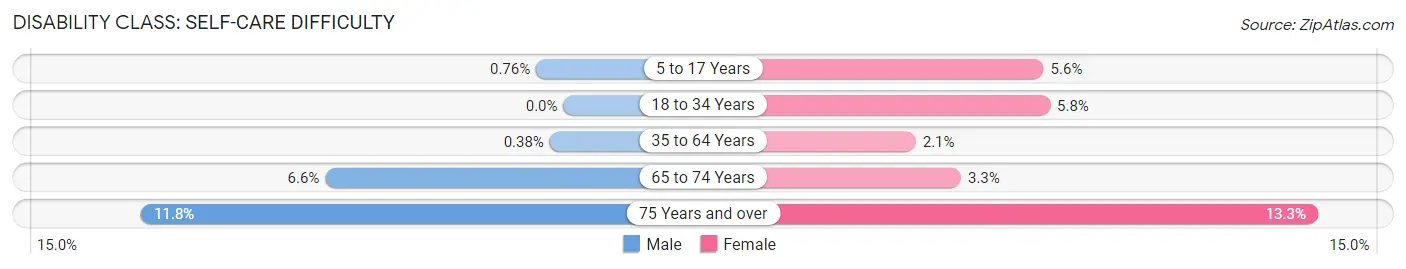
| Age Bracket | Male | Female |
| 5 to 17 Years | 6 (0.8%) | 47 (5.6%) |
| 18 to 34 Years | 0 (0.0%) | 66 (5.8%) |
| 35 to 64 Years | 8 (0.4%) | 42 (2.1%) |
| 65 to 74 Years | 26 (6.6%) | 14 (3.3%) |
| 75 Years and over | 36 (11.8%) | 62 (13.3%) |
Technology Access in East Whittier
Computing Device Access in East Whittier
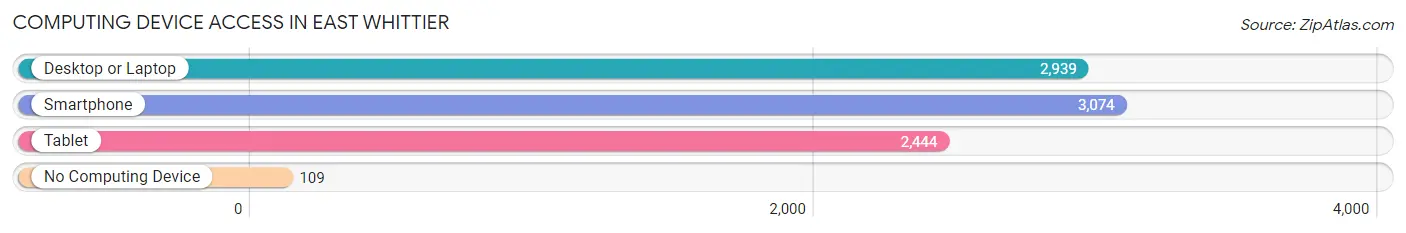
| Device Type | # Households | % Households |
| Desktop or Laptop | 2,939 | 87.9% |
| Smartphone | 3,074 | 91.9% |
| Tablet | 2,444 | 73.1% |
| No Computing Device | 109 | 3.3% |
| Total | 3,345 | 100.0% |
Internet Access in East Whittier
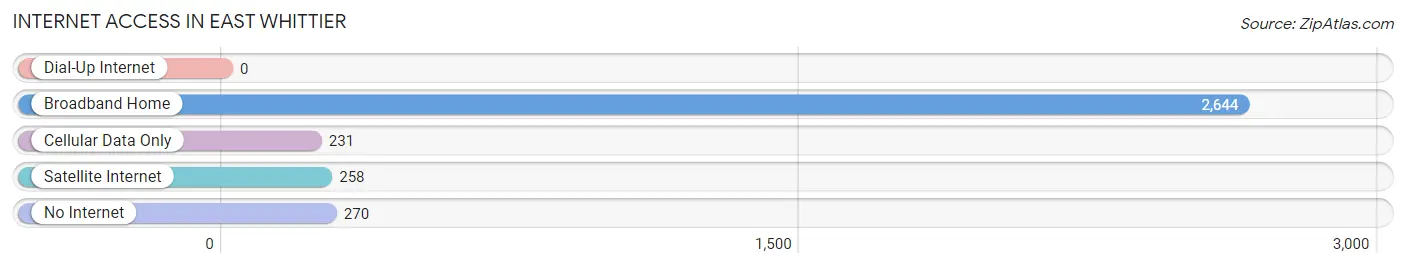
| Internet Type | # Households | % Households |
| Dial-Up Internet | 0 | 0.0% |
| Broadband Home | 2,644 | 79.0% |
| Cellular Data Only | 231 | 6.9% |
| Satellite Internet | 258 | 7.7% |
| No Internet | 270 | 8.1% |
| Total | 3,345 | 100.0% |
East Whittier Summary
East Whittier is a census-designated place (CDP) located in Los Angeles County, California. It is located in the eastern part of the city of Whittier, and is bordered by the cities of La Habra Heights to the north, La Mirada to the east, and Santa Fe Springs to the south. The population of East Whittier was 24,898 at the 2010 census.
History
The area now known as East Whittier was originally inhabited by the Tongva Native American tribe. The first Europeans to settle in the area were Spanish missionaries, who established the Mission San Gabriel Arcangel in 1771. The area was part of the Rancho La Habra, which was granted to Antonio Yorba in 1834. The area was later subdivided into smaller ranches, and in the late 19th century, the area was known as East La Habra.
In the early 20th century, the area was developed as a residential suburb of Los Angeles. The area was annexed by the city of Whittier in 1958, and the name was changed to East Whittier.
Geography
East Whittier is located at 33°57'25"N 118°2'25"W (33.956944, -118.040278). According to the United States Census Bureau, the CDP has a total area of 4.2 square miles (10.8 km2), all of it land.
Economy
East Whittier is primarily a residential community, and the economy is largely based on the service industry. The largest employers in the area are the Whittier Union High School District, the East Whittier City School District, and the East Whittier Medical Center.
Demographics
As of the 2010 census, there were 24,898 people, 8,072 households, and 6,072 families residing in East Whittier. The population density was 5,919.3 people per square mile (2,288.2/km2). The racial makeup of East Whittier was 57.2% White, 2.3% African American, 0.7% Native American, 17.2% Asian, 0.2% Pacific Islander, 17.3% from other races, and 5.3% from two or more races. Hispanic or Latino of any race were 44.2% of the population.
The median income for a household in East Whittier was $60,945, and the median income for a family was $68,945. Males had a median income of $45,945 versus $35,945 for females. The per capita income for the CDP was $25,945. About 6.2% of families and 8.2% of the population were below the poverty line, including 10.2% of those under age 18 and 6.2% of those age 65 or over.
Common Questions
What is Per Capita Income in East Whittier?
Per Capita income in East Whittier is $36,426.
What is the Median Family Income in East Whittier?
Median Family Income in East Whittier is $110,642.
What is the Median Household income in East Whittier?
Median Household Income in East Whittier is $92,650.
What is Income or Wage Gap in East Whittier?
Income or Wage Gap in East Whittier is 21.7%.
Women in East Whittier earn 78.3 cents for every dollar earned by a man.
What is Inequality or Gini Index in East Whittier?
Inequality or Gini Index in East Whittier is 0.39.
What is the Total Population of East Whittier?
Total Population of East Whittier is 10,248.
What is the Total Male Population of East Whittier?
Total Male Population of East Whittier is 4,989.
What is the Total Female Population of East Whittier?
Total Female Population of East Whittier is 5,259.
What is the Ratio of Males per 100 Females in East Whittier?
There are 94.87 Males per 100 Females in East Whittier.
What is the Ratio of Females per 100 Males in East Whittier?
There are 105.41 Females per 100 Males in East Whittier.
What is the Median Population Age in East Whittier?
Median Population Age in East Whittier is 39.3 Years.
What is the Average Family Size in East Whittier
Average Family Size in East Whittier is 3.5 People.
What is the Average Household Size in East Whittier
Average Household Size in East Whittier is 3.0 People.
How Large is the Labor Force in East Whittier?
There are 5,168 People in the Labor Forcein in East Whittier.
What is the Percentage of People in the Labor Force in East Whittier?
61.3% of People are in the Labor Force in East Whittier.
What is the Unemployment Rate in East Whittier?
Unemployment Rate in East Whittier is 3.4%.