Cities with the Lowest Poverty Level Among Families in New Mexico
RELATED REPORTS & OPTIONS
Lowest Family Poverty
New Mexico
Compare Cities
Map of Cities with the Lowest Poverty Level Among Families in New Mexico
15.0%
0.0%
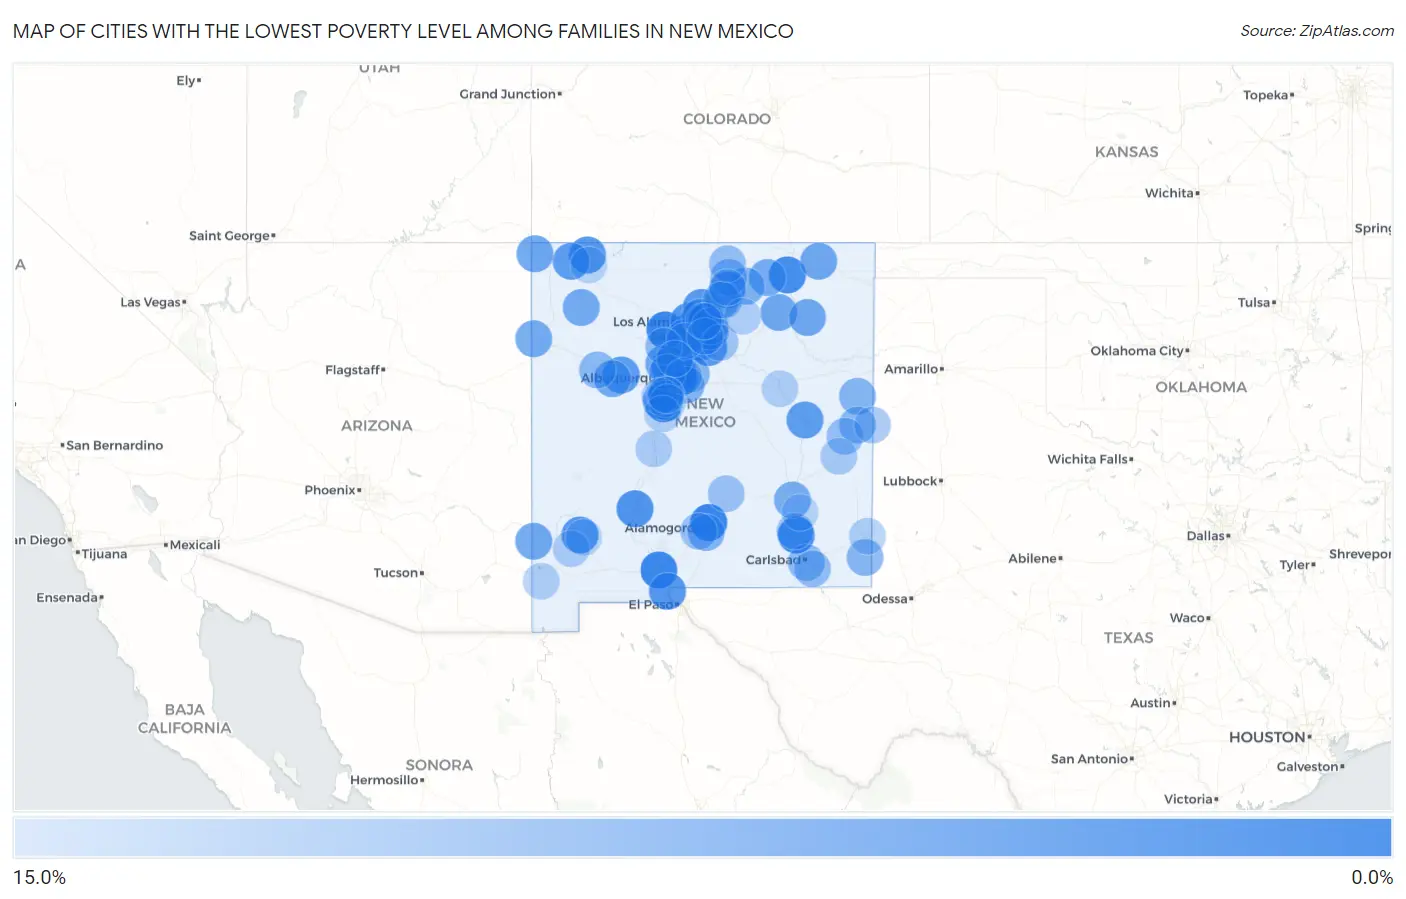
Cities with the Lowest Poverty Level Among Families in New Mexico
| City | Family Poverty | vs State | vs National | |
| 1. | Sandia Heights | 0.85% | 13.7%(-12.8)#1 | 8.8%(-7.93)#365 |
| 2. | La Luz | 1.0% | 13.7%(-12.7)#2 | 8.8%(-7.75)#555 |
| 3. | Jemez Springs | 1.0% | 13.7%(-12.7)#3 | 8.8%(-7.75)#562 |
| 4. | Adelino | 1.1% | 13.7%(-12.5)#4 | 8.8%(-7.64)#684 |
| 5. | Mesilla | 1.2% | 13.7%(-12.5)#5 | 8.8%(-7.60)#737 |
| 6. | Thunder Mountain | 1.4% | 13.7%(-12.3)#6 | 8.8%(-7.35)#1,051 |
| 7. | Atoka | 1.5% | 13.7%(-12.2)#7 | 8.8%(-7.26)#1,178 |
| 8. | Corrales | 1.7% | 13.7%(-12.0)#8 | 8.8%(-7.10)#1,405 |
| 9. | Maxwell | 1.9% | 13.7%(-11.8)#9 | 8.8%(-6.86)#1,784 |
| 10. | White Rock | 2.1% | 13.7%(-11.6)#10 | 8.8%(-6.72)#1,977 |
| 11. | Cuyamungue Grant | 2.2% | 13.7%(-11.4)#11 | 8.8%(-6.53)#2,261 |
| 12. | Jaconita | 2.5% | 13.7%(-11.2)#12 | 8.8%(-6.32)#2,614 |
| 13. | Little Walnut | 2.5% | 13.7%(-11.2)#13 | 8.8%(-6.32)#2,623 |
| 14. | Carnuel | 2.7% | 13.7%(-11.0)#14 | 8.8%(-6.09)#3,007 |
| 15. | La Cienega | 2.7% | 13.7%(-10.9)#15 | 8.8%(-6.03)#3,109 |
| 16. | Picacho Hills | 2.8% | 13.7%(-10.9)#16 | 8.8%(-6.01)#3,148 |
| 17. | Elephant Butte | 2.8% | 13.7%(-10.8)#17 | 8.8%(-5.94)#3,269 |
| 18. | Los Alamos | 3.4% | 13.7%(-10.3)#18 | 8.8%(-5.43)#4,147 |
| 19. | Arenas Valley | 3.4% | 13.7%(-10.3)#19 | 8.8%(-5.41)#4,178 |
| 20. | La Union | 3.4% | 13.7%(-10.3)#20 | 8.8%(-5.35)#4,271 |
| 21. | Spencerville | 3.5% | 13.7%(-10.1)#21 | 8.8%(-5.24)#4,426 |
| 22. | Edith Enclave | 3.6% | 13.7%(-10.1)#22 | 8.8%(-5.21)#4,497 |
| 23. | Alcalde | 3.7% | 13.7%(-9.98)#23 | 8.8%(-5.08)#4,723 |
| 24. | Eldorado At Santa Fe | 3.7% | 13.7%(-9.95)#24 | 8.8%(-5.05)#4,784 |
| 25. | Center Point | 3.8% | 13.7%(-9.92)#25 | 8.8%(-5.02)#4,825 |
| 26. | Encinal | 3.8% | 13.7%(-9.84)#26 | 8.8%(-4.94)#4,954 |
| 27. | Kirtland | 3.9% | 13.7%(-9.81)#27 | 8.8%(-4.91)#4,993 |
| 28. | Fort Sumner | 4.0% | 13.7%(-9.67)#28 | 8.8%(-4.77)#5,215 |
| 29. | Los Chaves | 4.6% | 13.7%(-9.07)#29 | 8.8%(-4.17)#6,148 |
| 30. | Tesuque | 4.9% | 13.7%(-8.79)#30 | 8.8%(-3.89)#6,571 |
| 31. | Talpa | 5.1% | 13.7%(-8.62)#31 | 8.8%(-3.72)#6,866 |
| 32. | Beclabito | 5.3% | 13.7%(-8.42)#32 | 8.8%(-3.52)#7,177 |
| 33. | Rio Rancho | 5.4% | 13.7%(-8.29)#33 | 8.8%(-3.39)#7,365 |
| 34. | Cochiti Lake | 5.4% | 13.7%(-8.28)#34 | 8.8%(-3.38)#7,391 |
| 35. | Wagon Mound | 5.5% | 13.7%(-8.17)#35 | 8.8%(-3.26)#7,566 |
| 36. | Roy | 5.6% | 13.7%(-8.13)#36 | 8.8%(-3.23)#7,625 |
| 37. | Virden | 5.6% | 13.7%(-8.13)#37 | 8.8%(-3.23)#7,633 |
| 38. | Capulin | 5.6% | 13.7%(-8.13)#38 | 8.8%(-3.23)#7,641 |
| 39. | La Mesilla | 5.8% | 13.7%(-7.89)#39 | 8.8%(-2.98)#7,993 |
| 40. | Tse Bonito | 5.9% | 13.7%(-7.80)#40 | 8.8%(-2.90)#8,140 |
| 41. | Lake Valley | 5.9% | 13.7%(-7.80)#41 | 8.8%(-2.90)#8,145 |
| 42. | Acomita Lake | 6.0% | 13.7%(-7.65)#42 | 8.8%(-2.75)#8,350 |
| 43. | Cimarron | 6.1% | 13.7%(-7.59)#43 | 8.8%(-2.69)#8,441 |
| 44. | Sunlit Hills | 6.4% | 13.7%(-7.26)#44 | 8.8%(-2.35)#8,964 |
| 45. | Midway | 6.5% | 13.7%(-7.23)#45 | 8.8%(-2.33)#8,985 |
| 46. | Nambe | 6.5% | 13.7%(-7.21)#46 | 8.8%(-2.31)#9,030 |
| 47. | Pena Blanca | 6.9% | 13.7%(-6.83)#47 | 8.8%(-1.92)#9,536 |
| 48. | Angel Fire | 6.9% | 13.7%(-6.81)#48 | 8.8%(-1.91)#9,551 |
| 49. | Boles Acres | 7.0% | 13.7%(-6.68)#49 | 8.8%(-1.78)#9,727 |
| 50. | Santa Fe Foothills | 7.2% | 13.7%(-6.48)#50 | 8.8%(-1.58)#9,996 |
| 51. | Barton | 7.3% | 13.7%(-6.40)#51 | 8.8%(-1.49)#10,107 |
| 52. | Edgewood | 7.4% | 13.7%(-6.31)#52 | 8.8%(-1.41)#10,236 |
| 53. | Ponderosa Pine | 7.4% | 13.7%(-6.31)#53 | 8.8%(-1.41)#10,241 |
| 54. | Cochiti | 7.5% | 13.7%(-6.14)#54 | 8.8%(-1.23)#10,473 |
| 55. | Grady | 7.6% | 13.7%(-6.11)#55 | 8.8%(-1.21)#10,500 |
| 56. | Vadito | 7.6% | 13.7%(-6.09)#56 | 8.8%(-1.19)#10,523 |
| 57. | Eunice | 7.7% | 13.7%(-6.01)#57 | 8.8%(-1.11)#10,606 |
| 58. | Valencia | 7.7% | 13.7%(-6.01)#58 | 8.8%(-1.11)#10,608 |
| 59. | Cannon Afb | 7.9% | 13.7%(-5.83)#59 | 8.8%(-0.923)#10,880 |
| 60. | Milan | 7.9% | 13.7%(-5.78)#60 | 8.8%(-0.878)#10,944 |
| 61. | Arroyo Seco | 8.1% | 13.7%(-5.59)#61 | 8.8%(-0.683)#11,176 |
| 62. | Bosque Farms | 8.1% | 13.7%(-5.58)#62 | 8.8%(-0.674)#11,186 |
| 63. | Carlsbad | 8.2% | 13.7%(-5.51)#63 | 8.8%(-0.612)#11,273 |
| 64. | Zia Pueblo | 8.2% | 13.7%(-5.50)#64 | 8.8%(-0.595)#11,298 |
| 65. | Chupadero | 8.3% | 13.7%(-5.43)#65 | 8.8%(-0.525)#11,390 |
| 66. | Rio Rancho Estates | 8.5% | 13.7%(-5.18)#66 | 8.8%(-0.277)#11,745 |
| 67. | Loving | 8.5% | 13.7%(-5.15)#67 | 8.8%(-0.252)#11,790 |
| 68. | Rio Lucio | 8.7% | 13.7%(-5.03)#68 | 8.8%(-0.128)#11,921 |
| 69. | Questa | 8.7% | 13.7%(-4.99)#69 | 8.8%(-0.086)#11,959 |
| 70. | Floyd | 8.7% | 13.7%(-4.99)#70 | 8.8%(-0.086)#11,981 |
| 71. | Las Campanas | 8.8% | 13.7%(-4.91)#71 | 8.8%(-0.007)#12,073 |
| 72. | Tano Road | 9.0% | 13.7%(-4.71)#72 | 8.8%(+0.190)#12,274 |
| 73. | Ruidoso | 9.0% | 13.7%(-4.63)#73 | 8.8%(+0.268)#12,357 |
| 74. | Holloman Afb | 9.1% | 13.7%(-4.54)#74 | 8.8%(+0.367)#12,493 |
| 75. | Los Ranchos De Albuquerque | 9.3% | 13.7%(-4.43)#75 | 8.8%(+0.473)#12,605 |
| 76. | Artesia | 9.7% | 13.7%(-3.97)#76 | 8.8%(+0.931)#13,113 |
| 77. | La Cueva | 9.7% | 13.7%(-3.95)#77 | 8.8%(+0.948)#13,140 |
| 78. | El Cerro | 9.8% | 13.7%(-3.88)#78 | 8.8%(+1.02)#13,222 |
| 79. | Texico | 9.9% | 13.7%(-3.77)#79 | 8.8%(+1.13)#13,360 |
| 80. | Cedar Crest | 10.0% | 13.7%(-3.72)#80 | 8.8%(+1.19)#13,398 |
| 81. | Santa Ana Pueblo | 10.1% | 13.7%(-3.63)#81 | 8.8%(+1.27)#13,527 |
| 82. | Los Lunas | 10.2% | 13.7%(-3.53)#82 | 8.8%(+1.37)#13,626 |
| 83. | Santa Fe | 10.3% | 13.7%(-3.40)#83 | 8.8%(+1.51)#13,759 |
| 84. | South River | 10.3% | 13.7%(-3.37)#84 | 8.8%(+1.53)#13,785 |
| 85. | Elida | 10.4% | 13.7%(-3.24)#85 | 8.8%(+1.67)#13,922 |
| 86. | Socorro | 10.5% | 13.7%(-3.20)#86 | 8.8%(+1.70)#13,971 |
| 87. | White Signal | 10.6% | 13.7%(-3.05)#87 | 8.8%(+1.86)#14,139 |
| 88. | North Hobbs | 10.7% | 13.7%(-3.00)#88 | 8.8%(+1.90)#14,182 |
| 89. | Las Maravillas | 10.8% | 13.7%(-2.84)#89 | 8.8%(+2.06)#14,329 |
| 90. | Isleta | 10.9% | 13.7%(-2.77)#90 | 8.8%(+2.13)#14,388 |
| 91. | Santa Rosa | 10.9% | 13.7%(-2.74)#91 | 8.8%(+2.16)#14,425 |
| 92. | Mora | 11.0% | 13.7%(-2.72)#92 | 8.8%(+2.18)#14,434 |
| 93. | Casa Colorada | 11.0% | 13.7%(-2.72)#93 | 8.8%(+2.18)#14,437 |
| 94. | Cotton City | 11.0% | 13.7%(-2.67)#94 | 8.8%(+2.23)#14,485 |
| 95. | Ranchos De Taos | 11.2% | 13.7%(-2.50)#95 | 8.8%(+2.40)#14,654 |
| 96. | Bayard | 11.4% | 13.7%(-2.26)#96 | 8.8%(+2.64)#14,873 |
| 97. | West Hammond | 11.4% | 13.7%(-2.25)#97 | 8.8%(+2.66)#14,897 |
| 98. | Hagerman | 11.4% | 13.7%(-2.24)#98 | 8.8%(+2.66)#14,906 |
| 99. | Pojoaque | 11.5% | 13.7%(-2.19)#99 | 8.8%(+2.71)#14,957 |
| 100. | Peralta | 11.6% | 13.7%(-2.03)#100 | 8.8%(+2.87)#15,107 |
Common Questions
What are the Top 10 Cities with the Lowest Poverty Level Among Families in New Mexico?
Top 10 Cities with the Lowest Poverty Level Among Families in New Mexico are:
#1
0.85%
#2
1.0%
#3
1.0%
#4
1.1%
#5
1.2%
#6
1.5%
#7
1.7%
#8
1.9%
#9
2.1%
#10
2.2%
What city has the Lowest Poverty Level Among Families in New Mexico?
Sandia Heights has the Lowest Poverty Level Among Families in New Mexico with 0.85%.
What is the Poverty Level Among Families in the State of New Mexico?
Poverty Level Among Families in New Mexico is 13.7%.
What is the Poverty Level Among Families in the United States?
Poverty Level Among Families in the United States is 8.8%.