Cities with the Lowest Poverty Level Among Families in New Jersey
RELATED REPORTS & OPTIONS
Lowest Family Poverty
New Jersey
Compare Cities
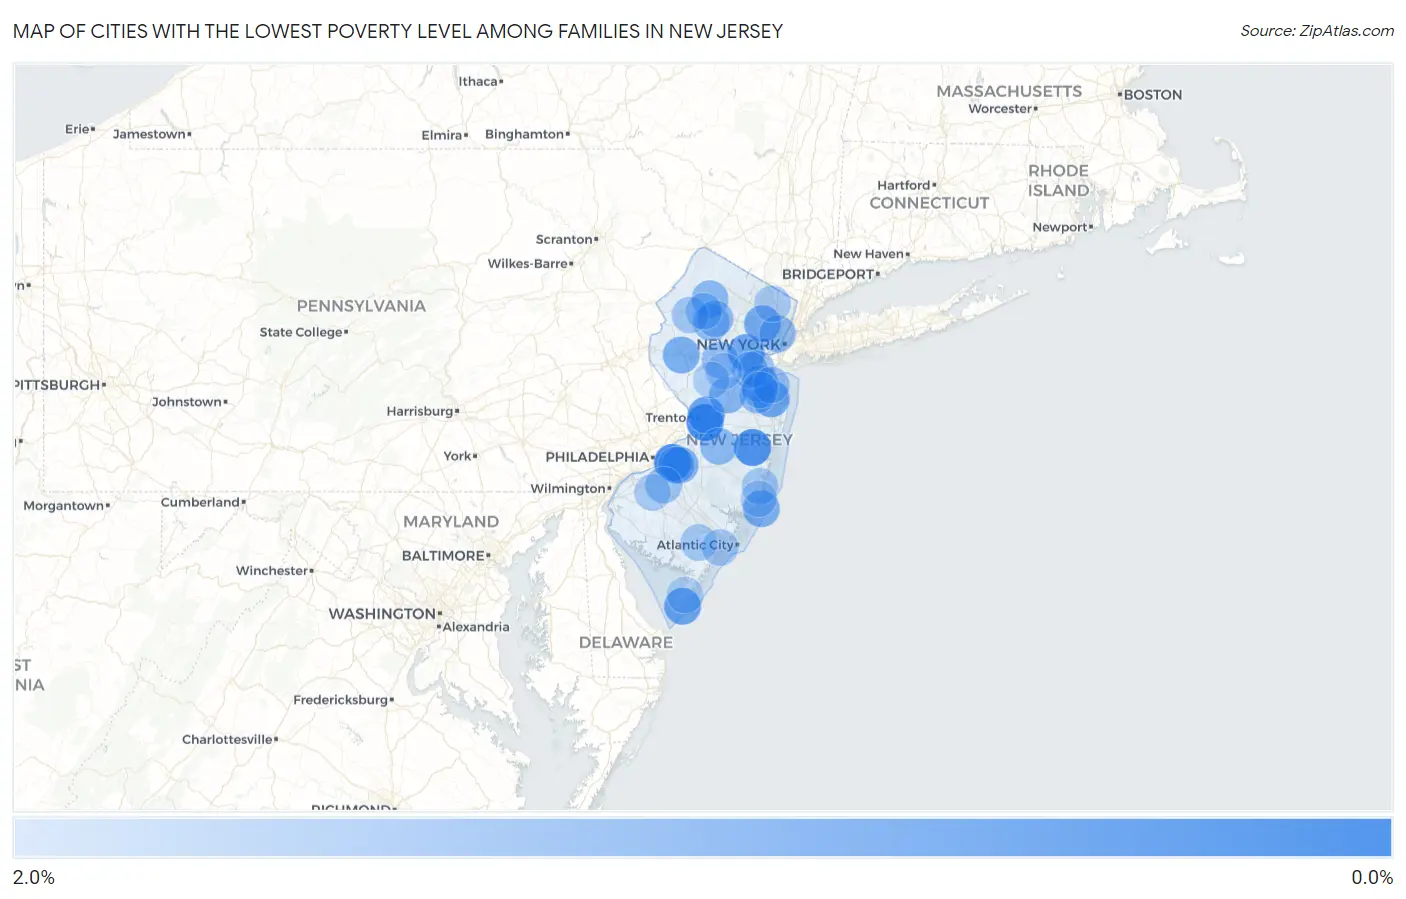
Map of Cities with the Lowest Poverty Level Among Families in New Jersey
2.0%
0.0%
Cities with the Lowest Poverty Level Among Families in New Jersey
| City | Family Poverty | vs State | vs National | |
| 1. | Packanack Lake | 0.22% | 6.9%(-6.72)#1 | 8.8%(-8.56)#9 |
| 2. | Farmingdale Borough | 0.31% | 6.9%(-6.63)#2 | 8.8%(-8.47)#25 |
| 3. | Sea Girt Borough | 0.31% | 6.9%(-6.63)#3 | 8.8%(-8.47)#27 |
| 4. | Essex Fells Borough | 0.32% | 6.9%(-6.62)#4 | 8.8%(-8.46)#29 |
| 5. | Spotswood Borough | 0.35% | 6.9%(-6.59)#5 | 8.8%(-8.43)#38 |
| 6. | Bridgewater Center | 0.42% | 6.9%(-6.52)#6 | 8.8%(-8.36)#54 |
| 7. | White Horse | 0.46% | 6.9%(-6.48)#7 | 8.8%(-8.32)#67 |
| 8. | Kingston Estates | 0.46% | 6.9%(-6.48)#8 | 8.8%(-8.32)#68 |
| 9. | Leisure Knoll | 0.48% | 6.9%(-6.46)#9 | 8.8%(-8.30)#76 |
| 10. | Stanhope Borough | 0.51% | 6.9%(-6.43)#10 | 8.8%(-8.27)#90 |
| 11. | Lincoln Park Borough | 0.51% | 6.9%(-6.43)#11 | 8.8%(-8.27)#96 |
| 12. | Cedar Knolls | 0.55% | 6.9%(-6.39)#12 | 8.8%(-8.23)#120 |
| 13. | Fanwood Borough | 0.57% | 6.9%(-6.37)#13 | 8.8%(-8.21)#136 |
| 14. | Little Silver Borough | 0.67% | 6.9%(-6.27)#14 | 8.8%(-8.12)#198 |
| 15. | Great Notch | 0.67% | 6.9%(-6.27)#15 | 8.8%(-8.11)#200 |
| 16. | Island Heights Borough | 0.67% | 6.9%(-6.27)#16 | 8.8%(-8.11)#201 |
| 17. | Demarest Borough | 0.67% | 6.9%(-6.27)#17 | 8.8%(-8.11)#206 |
| 18. | Rumson Borough | 0.68% | 6.9%(-6.26)#18 | 8.8%(-8.10)#215 |
| 19. | Glen Rock Borough | 0.71% | 6.9%(-6.23)#19 | 8.8%(-8.07)#241 |
| 20. | Ramsey Borough | 0.74% | 6.9%(-6.20)#20 | 8.8%(-8.05)#262 |
| 21. | Englewood Cliffs Borough | 0.76% | 6.9%(-6.18)#21 | 8.8%(-8.02)#278 |
| 22. | Milltown Borough | 0.78% | 6.9%(-6.16)#22 | 8.8%(-8.00)#305 |
| 23. | Cape May | 0.80% | 6.9%(-6.14)#23 | 8.8%(-7.98)#321 |
| 24. | Mercerville | 0.82% | 6.9%(-6.12)#24 | 8.8%(-7.96)#342 |
| 25. | Lincroft | 0.85% | 6.9%(-6.09)#25 | 8.8%(-7.93)#366 |
| 26. | Westfield | 0.91% | 6.9%(-6.03)#26 | 8.8%(-7.87)#440 |
| 27. | Somerville Borough | 0.96% | 6.9%(-5.98)#27 | 8.8%(-7.82)#490 |
| 28. | Upper Montclair | 0.97% | 6.9%(-5.97)#28 | 8.8%(-7.81)#494 |
| 29. | Norwood Borough | 0.97% | 6.9%(-5.97)#29 | 8.8%(-7.81)#498 |
| 30. | Mount Hope | 0.97% | 6.9%(-5.97)#30 | 8.8%(-7.81)#502 |
| 31. | Clinton | 1.0% | 6.9%(-5.91)#31 | 8.8%(-7.75)#559 |
| 32. | North Beach Haven | 1.0% | 6.9%(-5.90)#32 | 8.8%(-7.74)#573 |
| 33. | Glen Gardner Borough | 1.0% | 6.9%(-5.89)#33 | 8.8%(-7.73)#587 |
| 34. | Upper Greenwood Lake | 1.1% | 6.9%(-5.89)#34 | 8.8%(-7.73)#595 |
| 35. | Marlton | 1.1% | 6.9%(-5.88)#35 | 8.8%(-7.73)#597 |
| 36. | Cliffwood Beach | 1.1% | 6.9%(-5.88)#36 | 8.8%(-7.72)#612 |
| 37. | Wenonah Borough | 1.1% | 6.9%(-5.86)#37 | 8.8%(-7.70)#633 |
| 38. | Peapack And Gladstone Borough | 1.1% | 6.9%(-5.84)#38 | 8.8%(-7.68)#653 |
| 39. | Dayton | 1.2% | 6.9%(-5.78)#39 | 8.8%(-7.62)#703 |
| 40. | Fair Haven Borough | 1.2% | 6.9%(-5.78)#40 | 8.8%(-7.62)#707 |
| 41. | Haddonfield Borough | 1.2% | 6.9%(-5.76)#41 | 8.8%(-7.60)#735 |
| 42. | Monmouth Beach Borough | 1.2% | 6.9%(-5.74)#42 | 8.8%(-7.58)#762 |
| 43. | Mcguire Afb | 1.2% | 6.9%(-5.74)#43 | 8.8%(-7.58)#763 |
| 44. | Lake Mohawk | 1.2% | 6.9%(-5.73)#44 | 8.8%(-7.57)#770 |
| 45. | Whippany | 1.2% | 6.9%(-5.73)#45 | 8.8%(-7.57)#774 |
| 46. | Pines Lake | 1.2% | 6.9%(-5.72)#46 | 8.8%(-7.56)#779 |
| 47. | Audubon Borough | 1.2% | 6.9%(-5.72)#47 | 8.8%(-7.56)#782 |
| 48. | Morganville | 1.2% | 6.9%(-5.71)#48 | 8.8%(-7.55)#803 |
| 49. | Oakland Borough | 1.2% | 6.9%(-5.70)#49 | 8.8%(-7.54)#814 |
| 50. | Secaucus | 1.2% | 6.9%(-5.70)#50 | 8.8%(-7.54)#818 |
| 51. | Greentree | 1.2% | 6.9%(-5.70)#51 | 8.8%(-7.54)#823 |
| 52. | Garwood Borough | 1.3% | 6.9%(-5.68)#52 | 8.8%(-7.52)#841 |
| 53. | Succasunna | 1.3% | 6.9%(-5.67)#53 | 8.8%(-7.51)#853 |
| 54. | Sewaren | 1.3% | 6.9%(-5.66)#54 | 8.8%(-7.51)#859 |
| 55. | Pine Brook | 1.3% | 6.9%(-5.66)#55 | 8.8%(-7.51)#861 |
| 56. | Park Ridge Borough | 1.3% | 6.9%(-5.66)#56 | 8.8%(-7.50)#863 |
| 57. | Kenvil | 1.3% | 6.9%(-5.63)#57 | 8.8%(-7.48)#885 |
| 58. | Absecon Highlands | 1.3% | 6.9%(-5.60)#58 | 8.8%(-7.44)#937 |
| 59. | Martinsville | 1.3% | 6.9%(-5.59)#59 | 8.8%(-7.43)#942 |
| 60. | Lyons | 1.3% | 6.9%(-5.59)#60 | 8.8%(-7.43)#944 |
| 61. | Lavallette Borough | 1.4% | 6.9%(-5.59)#61 | 8.8%(-7.43)#957 |
| 62. | Ringwood Borough | 1.4% | 6.9%(-5.58)#62 | 8.8%(-7.42)#960 |
| 63. | Roseland Borough | 1.4% | 6.9%(-5.58)#63 | 8.8%(-7.42)#966 |
| 64. | Chatham Borough | 1.4% | 6.9%(-5.57)#64 | 8.8%(-7.41)#975 |
| 65. | Millstone Borough | 1.4% | 6.9%(-5.56)#65 | 8.8%(-7.40)#981 |
| 66. | Fords | 1.4% | 6.9%(-5.53)#66 | 8.8%(-7.37)#1,013 |
| 67. | Sewell | 1.4% | 6.9%(-5.53)#67 | 8.8%(-7.37)#1,024 |
| 68. | Turnersville | 1.4% | 6.9%(-5.53)#68 | 8.8%(-7.37)#1,025 |
| 69. | Elmer Borough | 1.4% | 6.9%(-5.52)#69 | 8.8%(-7.36)#1,037 |
| 70. | West Cape May Borough | 1.4% | 6.9%(-5.51)#70 | 8.8%(-7.35)#1,056 |
| 71. | North Middletown | 1.4% | 6.9%(-5.51)#71 | 8.8%(-7.35)#1,057 |
| 72. | River Edge Borough | 1.4% | 6.9%(-5.50)#72 | 8.8%(-7.34)#1,065 |
| 73. | Madison Borough | 1.5% | 6.9%(-5.48)#73 | 8.8%(-7.32)#1,087 |
| 74. | Magnolia Borough | 1.5% | 6.9%(-5.48)#74 | 8.8%(-7.32)#1,092 |
| 75. | Cresskill Borough | 1.5% | 6.9%(-5.48)#75 | 8.8%(-7.32)#1,096 |
| 76. | Rockleigh Borough | 1.5% | 6.9%(-5.47)#76 | 8.8%(-7.31)#1,105 |
| 77. | Panther Valley | 1.5% | 6.9%(-5.46)#77 | 8.8%(-7.30)#1,126 |
| 78. | Centre Grove | 1.5% | 6.9%(-5.45)#78 | 8.8%(-7.29)#1,132 |
| 79. | New Providence Borough | 1.5% | 6.9%(-5.44)#79 | 8.8%(-7.28)#1,141 |
| 80. | Byram Center | 1.5% | 6.9%(-5.44)#80 | 8.8%(-7.28)#1,152 |
| 81. | Gibbsboro Borough | 1.5% | 6.9%(-5.43)#81 | 8.8%(-7.27)#1,153 |
| 82. | Strathmore | 1.5% | 6.9%(-5.43)#82 | 8.8%(-7.27)#1,159 |
| 83. | Palermo | 1.5% | 6.9%(-5.43)#83 | 8.8%(-7.27)#1,163 |
| 84. | Estell Manor | 1.5% | 6.9%(-5.41)#84 | 8.8%(-7.25)#1,187 |
| 85. | Linwood | 1.5% | 6.9%(-5.41)#85 | 8.8%(-7.25)#1,194 |
| 86. | Surf City Borough | 1.5% | 6.9%(-5.41)#86 | 8.8%(-7.25)#1,199 |
| 87. | Barnegat | 1.5% | 6.9%(-5.40)#87 | 8.8%(-7.24)#1,200 |
| 88. | Ridgewood | 1.6% | 6.9%(-5.39)#88 | 8.8%(-7.23)#1,230 |
| 89. | Richwood | 1.6% | 6.9%(-5.37)#89 | 8.8%(-7.21)#1,254 |
| 90. | Seaville | 1.6% | 6.9%(-5.34)#90 | 8.8%(-7.19)#1,287 |
| 91. | Preakness | 1.6% | 6.9%(-5.33)#91 | 8.8%(-7.17)#1,304 |
| 92. | Franklin Center | 1.6% | 6.9%(-5.33)#92 | 8.8%(-7.17)#1,314 |
| 93. | Oceanport Borough | 1.6% | 6.9%(-5.32)#93 | 8.8%(-7.16)#1,326 |
| 94. | Belle Mead | 1.6% | 6.9%(-5.32)#94 | 8.8%(-7.16)#1,328 |
| 95. | Beach Haven West | 1.6% | 6.9%(-5.29)#95 | 8.8%(-7.13)#1,350 |
| 96. | Riverton Borough | 1.6% | 6.9%(-5.29)#96 | 8.8%(-7.13)#1,354 |
| 97. | Haddon Heights Borough | 1.7% | 6.9%(-5.29)#97 | 8.8%(-7.13)#1,360 |
| 98. | Bloomsbury Borough | 1.7% | 6.9%(-5.27)#98 | 8.8%(-7.12)#1,380 |
| 99. | Rio Grande | 1.7% | 6.9%(-5.26)#99 | 8.8%(-7.11)#1,397 |
| 100. | Florham Park Borough | 1.7% | 6.9%(-5.24)#100 | 8.8%(-7.08)#1,426 |
Common Questions
What are the Top 10 Cities with the Lowest Poverty Level Among Families in New Jersey?
Top 10 Cities with the Lowest Poverty Level Among Families in New Jersey are:
#1
0.46%
#2
0.46%
#3
0.48%
#4
0.80%
#5
0.82%
#6
0.85%
#7
0.91%
#8
0.97%
#9
1.0%
#10
1.0%
What city has the Lowest Poverty Level Among Families in New Jersey?
White Horse has the Lowest Poverty Level Among Families in New Jersey with 0.46%.
What is the Poverty Level Among Families in the State of New Jersey?
Poverty Level Among Families in New Jersey is 6.9%.
What is the Poverty Level Among Families in the United States?
Poverty Level Among Families in the United States is 8.8%.